Embed Size (px)
Citation preview

Page 1 of 82
Technical Guide Updated July 5, 2018
Page 2 of 82
PCMark 10 – An Industry Standard Benchmark for the Modern Office ................... 4
What's new in this version? ............................................................................................. 5
How does PCMark 10 compare with PCMark 8? .......................................................... 6
PCMark 10 Editions ........................................................................................................... 9
Better benchmarking guide ......................................................................................... 10
Using PCMark 10 to specify PC performance ............................................................. 10
Good testing guide ......................................................................................................... 12
Benchmark accuracy ...................................................................................................... 13
Latest version numbers ................................................................................................. 14
Minimum system requirements ................................................................................... 15
Options screen ................................................................................................................ 16
Benchmarks, test groups, and workloads ................................................................. 18
PCMark 10 benchmark ................................................................................................. 20
Scoring .............................................................................................................................. 21
PCMark 10 Express benchmark ................................................................................... 22
Scoring .............................................................................................................................. 23
PCMark 10 Extended benchmark ................................................................................ 24
Scoring .............................................................................................................................. 25
Custom runs .................................................................................................................. 27
Essentials test group .................................................................................................... 28
App Start-up .................................................................................................................... 29
Web Browsing ................................................................................................................. 31
Video Conferencing ........................................................................................................ 36
Productivity test group................................................................................................. 41
Writing .............................................................................................................................. 42
Spreadsheets ................................................................................................................... 45
Digital Content Creation test group ........................................................................... 49
Photo Editing ................................................................................................................... 50
Video Editing test ............................................................................................................ 56
Rendering and Visualization .......................................................................................... 60
Gaming test group ........................................................................................................ 61
Fire Strike ......................................................................................................................... 62
Benchmark Scores ........................................................................................................ 66
Result screen ................................................................................................................... 66
Compare results.............................................................................................................. 71
Page 3 of 82
How to report scores from PCMark 10 ........................................................................ 74
Release notes ................................................................................................................ 75
Third party software ..................................................................................................... 78
Reference systems ........................................................................................................ 80
Score-scaling reference systems .................................................................................. 80
Metric range reference systems ................................................................................... 81
About UL ........................................................................................................................ 82
Page 4 of 82
PCMARK 10 – AN INDUSTRY
STANDARD BENCHMARK FOR THE
MODERN OFFICE
PCMark 10 is the latest in our series of industry standard PC benchmarks.
Updated for Windows 10 with new and improved workloads, PCMark 10 is
also faster and easier to use.
PCMark benchmarks measure complete system performance using tests
based on real-world apps and activities. In PCMark 10, these tests reflect
common tasks performed in the modern workplace. This makes PCMark 10
the ideal, vendor-neutral benchmark for governments and enterprise
organizations that purchase PCs in high-volumes.
PCMark 10 is easy to install and run, with no complicated configuration
required. Run the main benchmark and you'll get a PCMark 10 score that
you can use to compare systems. There are Extended, Express, and Custom
run options for exploring other aspects of performance if needed.
Scores are not comparable across tests, nor are scores from PCMark 10
comparable with the results from other versions of PCMark.
Report your results using the full name of the test, for example:
"Notebook scores 5,800 in PCMark 10 benchmark."
"Notebook scores 5,800 in PCMark benchmark."
PCMark benchmarks are used by hundreds of hardware review sites and
many of the world's leading manufacturers. We hope PCMark 10 will prove
to be a valuable tool for you as well.
Page 5 of 82
WHAT'S NEW IN THIS VERSION?
PCMark 10 is the latest version in our series of industry standard PC benchmarking tools. Updated for Windows 10 with new and improved workloads, PCMark 10 is also faster and easier to use than PCMark 8.
Easy to use
PCMark 10 is easy to install and run, with no complicated configuration
required. Run the main benchmark and you'll get a PCMark 10 score that
you can use to compare systems. PCMark 10 measures overall system
performance for modern office work using tests based on real-world apps
and activities. There are Extended, Express, and Custom run options for
exploring other aspects of performance if needed.
New workloads
PCMark 10 workloads reflect the performance requirements of a range of
modern office applications and activities. PCMark 10 updates and improves
many of the workloads in PCMark 8 and adds new ones too.
Fast and efficient
With its new and improved workloads, the main PCMark 10 benchmark
takes less than half the time of the equivalent test in PCMark 8.
Just click run
In PCMark 10, you no longer have to choose between the Accelerated and
Conventional benchmarking modes used in PCMark 8.
Multi-level reporting
Each benchmark run produces a high-level benchmark score, mid-level test
group scores, and low-level workload scores. What's more, you can now
compare two results side by side in the app.
New yet familiar
PCMark 10 shares the same style of user interface as 3DMark and VRMark.
With its familiar layout, it is easy to start benchmarking with PCMark 10.
Page 6 of 82
HOW DOES PCMARK 10 COMPARE WITH PCMARK 8?
Benchmark comparison
The first release of PCMark 10 focuses on benchmarking system
performance with the PCMark 10, PCMark 10 Express and PCMark 10
Extended benchmarks.
Further benchmark tests are in development and will be released as
updates. These tests include a dedicated Storage benchmark that improves
on the PCMark 8 test, an updated and improved Applications benchmark,
and a new Battery Life test.
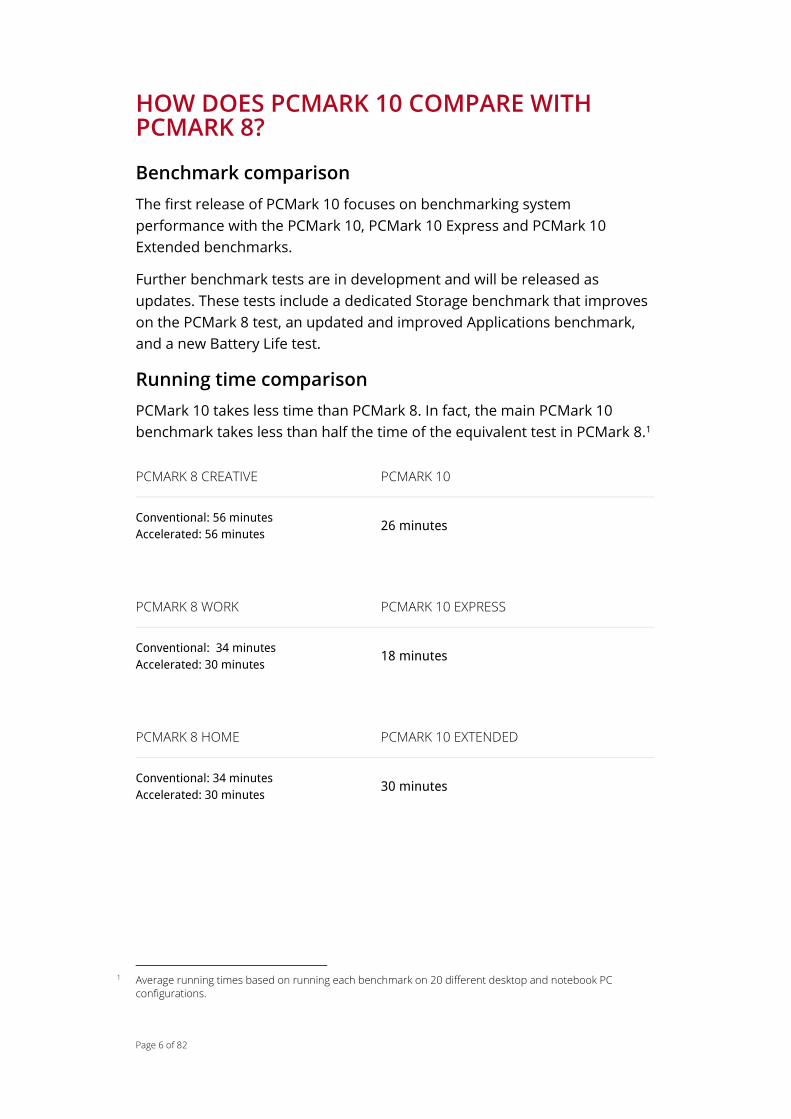
Running time comparison
PCMark 10 takes less time than PCMark 8. In fact, the main PCMark 10
benchmark takes less than half the time of the equivalent test in PCMark 8.1
PCMARK 8 CREATIVE PCMARK 10
Conventional: 56 minutes
Accelerated: 56 minutes 26 minutes
PCMARK 8 WORK PCMARK 10 EXPRESS
Conventional: 34 minutes
Accelerated: 30 minutes 18 minutes
PCMARK 8 HOME PCMARK 10 EXTENDED
Conventional: 34 minutes
Accelerated: 30 minutes 30 minutes
1 Average running times based on running each benchmark on 20 different desktop and notebook PC
configurations.
Page 7 of 82
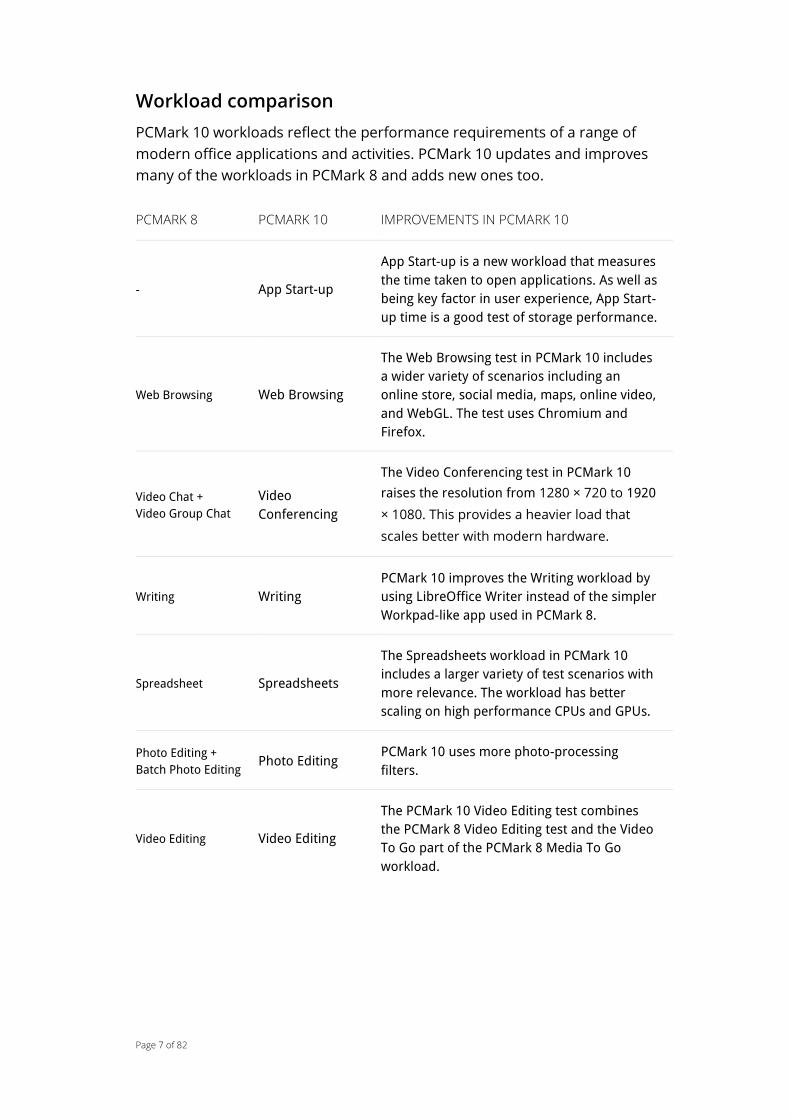
Workload comparison
PCMark 10 workloads reflect the performance requirements of a range of
modern office applications and activities. PCMark 10 updates and improves
many of the workloads in PCMark 8 and adds new ones too.
PCMARK 8 PCMARK 10 IMPROVEMENTS IN PCMARK 10
- App Start-up
App Start-up is a new workload that measures
the time taken to open applications. As well as
being key factor in user experience, App Start-
up time is a good test of storage performance.
Web Browsing Web Browsing
The Web Browsing test in PCMark 10 includes
a wider variety of scenarios including an
online store, social media, maps, online video,
and WebGL. The test uses Chromium and
Firefox.
Video Chat +
Video Group Chat
Video
Conferencing
The Video Conferencing test in PCMark 10
raises the resolution from 1280 × 720 to 1920
× 1080. This provides a heavier load that
scales better with modern hardware.
Writing Writing
PCMark 10 improves the Writing workload by
using LibreOffice Writer instead of the simpler
Workpad-like app used in PCMark 8.
Spreadsheet Spreadsheets
The Spreadsheets workload in PCMark 10
includes a larger variety of test scenarios with
more relevance. The workload has better
scaling on high performance CPUs and GPUs.
Photo Editing +
Batch Photo Editing Photo Editing
PCMark 10 uses more photo-processing
filters.
Video Editing Video Editing
The PCMark 10 Video Editing test combines
the PCMark 8 Video Editing test and the Video
To Go part of the PCMark 8 Media To Go
workload.
Page 8 of 82
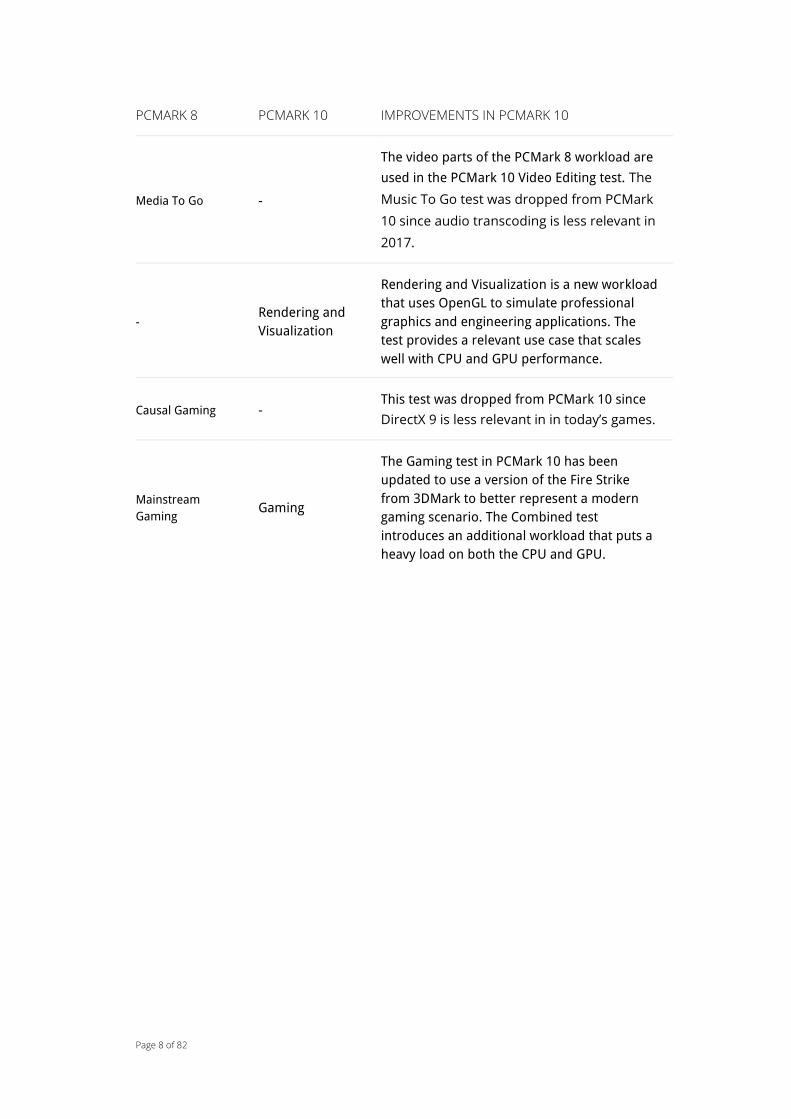
PCMARK 8 PCMARK 10 IMPROVEMENTS IN PCMARK 10
Media To Go -
The video parts of the PCMark 8 workload are
used in the PCMark 10 Video Editing test. The
Music To Go test was dropped from PCMark
10 since audio transcoding is less relevant in
2017.
- Rendering and
Visualization
Rendering and Visualization is a new workload
that uses OpenGL to simulate professional
graphics and engineering applications. The
test provides a relevant use case that scales
well with CPU and GPU performance.
Causal Gaming - This test was dropped from PCMark 10 since
DirectX 9 is less relevant in in today’s games.
Mainstream
Gaming Gaming
The Gaming test in PCMark 10 has been
updated to use a version of the Fire Strike
from 3DMark to better represent a modern
gaming scenario. The Combined test
introduces an additional workload that puts a
heavy load on both the CPU and GPU.
Page 9 of 82
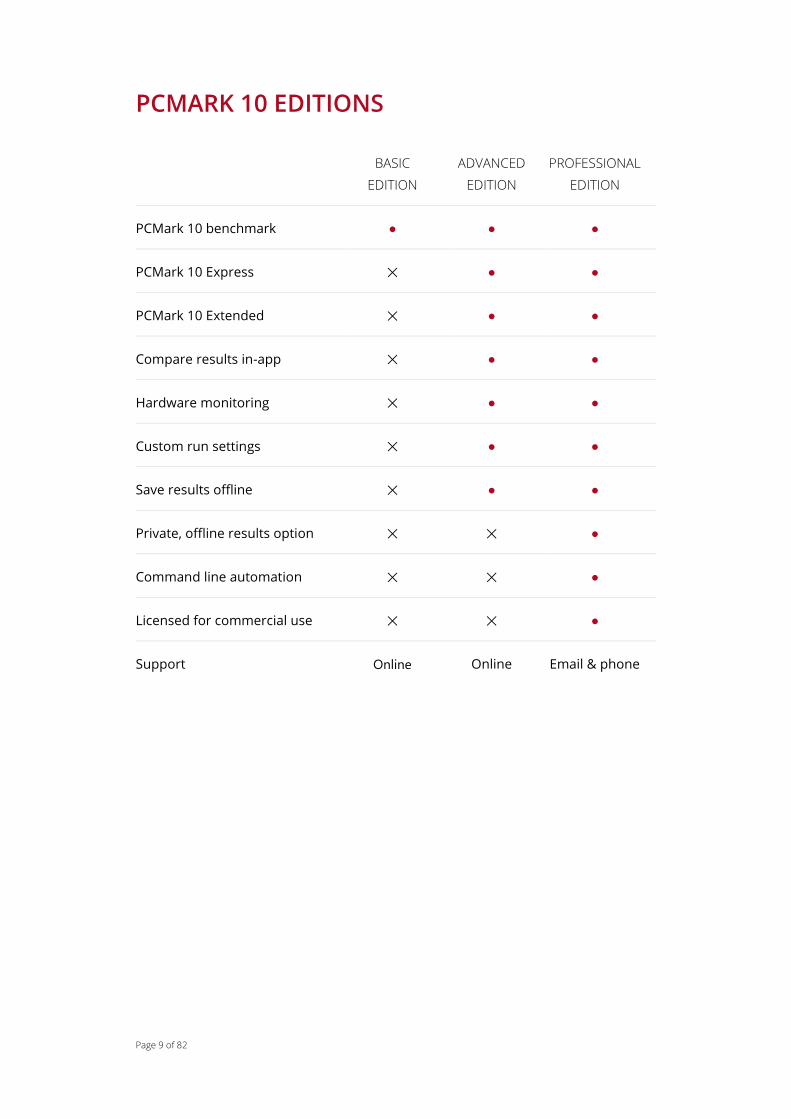
PCMARK 10 EDITIONS
BASIC
EDITION
ADVANCED
EDITION
PROFESSIONAL
EDITION
PCMark 10 benchmark ● ● ●
PCMark 10 Express ✕ ● ●
PCMark 10 Extended ✕ ● ●
Compare results in-app ✕ ● ●
Hardware monitoring ✕ ● ●
Custom run settings ✕ ● ●
Save results offline ✕ ● ●
Private, offline results option ✕ ✕ ●
Command line automation ✕ ✕ ●
Licensed for commercial use ✕ ✕ ●
Support Online Online Email & phone
Page 10 of 82
BETTER BENCHMARKING GUIDE
USING PCMARK 10 TO SPECIFY PC PERFORMANCE
IT managers and procurement specialists can make their IT budget go
further by using vendor-neutral benchmarks, like PCMark 10, to specify PC
performance in tenders and RFQs.
What is a benchmark?
Writing vendor-neutral tenders for IT systems is not easy. Precisely defining
the required system performance is a major challenge to purchasers.
The best approach for describing and comparing the performance of
computer systems uses programs called benchmarks. A benchmarking
program runs a series of well-defined tests on the system and generates a
score that represents the system's performance.
Benchmarks provide a specific, comparable and reproducible method of
objectively measuring the performance of a computer system. Evaluating
complete systems using performance-based benchmarks leads to more
informed decisions.
Using benchmarks for PC procurement
PCMark 10 is an ideal benchmark for governments and enterprise
organizations seeking a vendor-neutral solution. It provides accurate,
relevant, impartial, and practical benchmark tests for specifying and
comparing the performance of Windows PCs, notebooks, and tablets.
PCMark benchmarks are used by the governments of France, Germany,
Northern Ireland, and Brazil as well as the European Commission.
Vendor-neutral development process
UL creates benchmarks in cooperation with the world's leading technology
companies using an open and transparent process that guarantees fair and
neutral benchmark results.
UL is an independent, global company that offers a wide range of testing,
inspection, auditing, and certification services. With 10,000 people in 40

Page 11 of 82
countries, UL helps customers, purchasers, and policymakers navigate
market risk and complexity.
Choosing a suitable benchmark test
PCMark 10 offers several benchmark tests. Each one is designed around a
specific scenario. You should choose the test that best matches the
intended audience for the device being tested.
PCMARK 10 BENCHMARK
The complete benchmark for the modern office. It is
the ideal test for organizations that are evaluating PCs
for a workforce with a range of performance needs.
PCMARK 10 EXPRESS
A shorter benchmark test focused on basic work
tasks. It is a good choice when tendering for PCs for
general office use.
PCMARK 10 EXTENDED
A longer benchmark test covering a wider range of
activities. It provides organizations with a complete
assessment of system performance beyond typical
office work tasks.
Each benchmark produces a score that you can use to compare systems. A
higher scores indicates better performance. You'll also get detailed results
and monitoring charts that provide a deeper understanding of performance
during each workload.
When testing systems or components, be sure to use the most appropriate
benchmark for the hardware's capabilities and report your results using the
full name of the test.
Page 12 of 82
GOOD TESTING GUIDE
In general, you should benchmark every device you test under the same
conditions. For example, you should test every system in the same location,
at room temperature, and away from direct sunlight and other heat
sources.
Recommended process
Install all critical updates to ensure your operating system is up to date.
Install the latest approved drivers for your hardware.
Close other programs.
Run the benchmark.
Expert process
1. Install all critical updates to ensure your operating system is up to date.
2. Install the latest approved drivers for your hardware.
3. Restart the computer or device.
4. Wait 2 minutes for startup to complete.
5. Close other programs, including those that may be running in the
background.
6. Wait for 15 minutes.
7. Run the benchmark.
8. Repeat from step 3 at least three times to verify your results.
Page 13 of 82
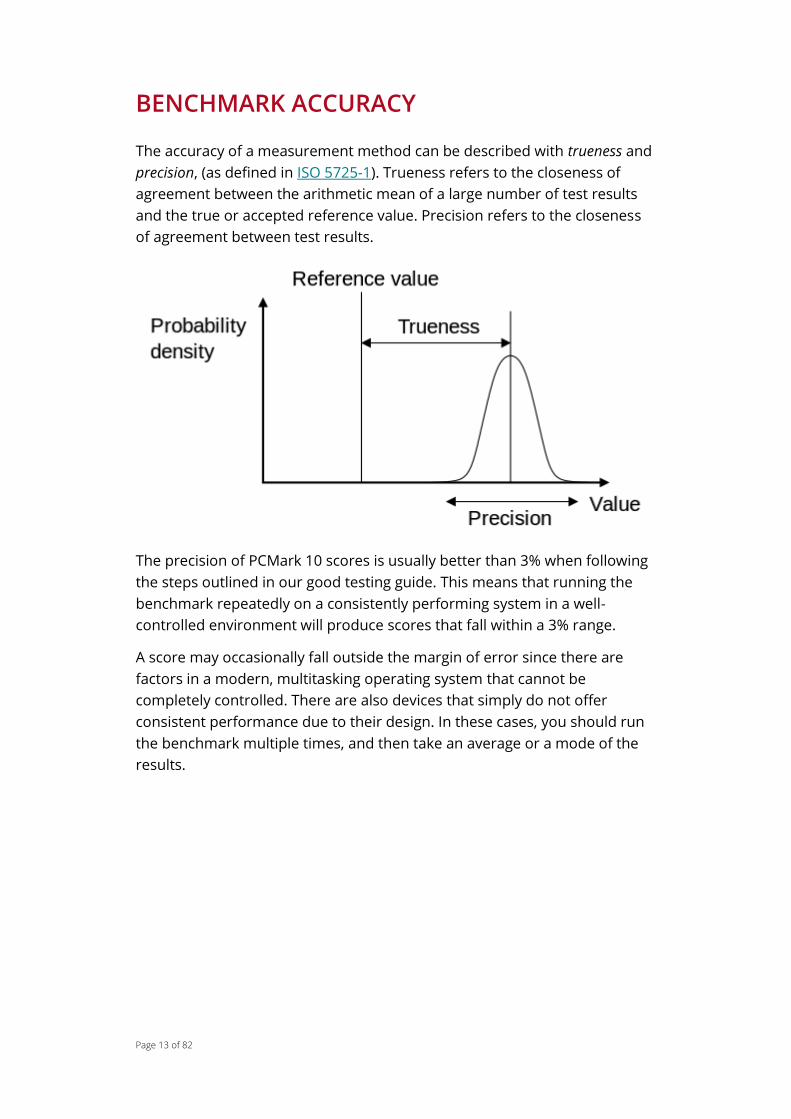
BENCHMARK ACCURACY
The accuracy of a measurement method can be described with trueness and
precision, (as defined in ISO 5725-1). Trueness refers to the closeness of
agreement between the arithmetic mean of a large number of test results
and the true or accepted reference value. Precision refers to the closeness
of agreement between test results.
The precision of PCMark 10 scores is usually better than 3% when following
the steps outlined in our good testing guide. This means that running the
benchmark repeatedly on a consistently performing system in a well-
controlled environment will produce scores that fall within a 3% range.
A score may occasionally fall outside the margin of error since there are
factors in a modern, multitasking operating system that cannot be
completely controlled. There are also devices that simply do not offer
consistent performance due to their design. In these cases, you should run
the benchmark multiple times, and then take an average or a mode of the
results.
Page 14 of 82
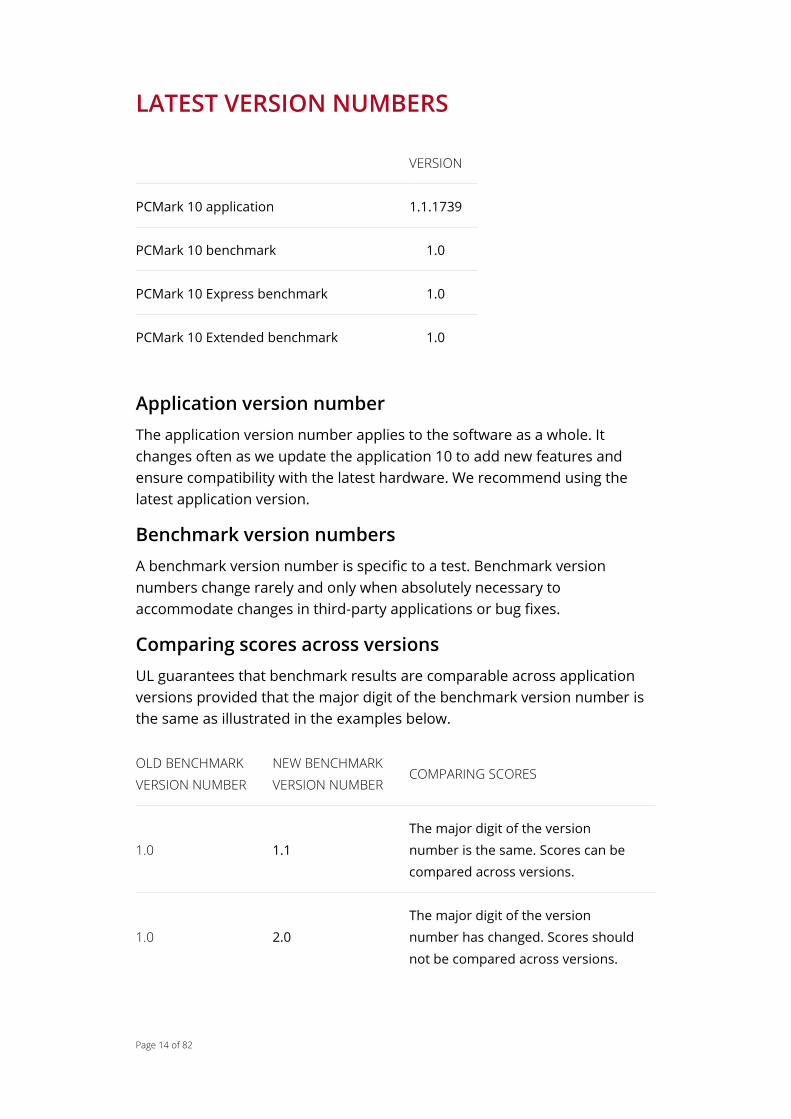
LATEST VERSION NUMBERS
VERSION
PCMark 10 application 1.1.1739
PCMark 10 benchmark 1.0
PCMark 10 Express benchmark 1.0
PCMark 10 Extended benchmark 1.0
Application version number
The application version number applies to the software as a whole. It
changes often as we update the application 10 to add new features and
ensure compatibility with the latest hardware. We recommend using the
latest application version.
Benchmark version numbers
A benchmark version number is specific to a test. Benchmark version
numbers change rarely and only when absolutely necessary to
accommodate changes in third-party applications or bug fixes.
Comparing scores across versions
UL guarantees that benchmark results are comparable across application
versions provided that the major digit of the benchmark version number is
the same as illustrated in the examples below.
OLD BENCHMARK
VERSION NUMBER
NEW BENCHMARK
VERSION NUMBER COMPARING SCORES
1.0 1.1
The major digit of the version
number is the same. Scores can be
compared across versions.
1.0 2.0
The major digit of the version
number has changed. Scores should
not be compared across versions.

Page 15 of 82
MINIMUM SYSTEM REQUIREMENTS
PCMARK 10 PCMARK 10
EXPRESS
PCMARK 10
EXTENDED
OS2 Windows 7 SP1 64-
bit
Windows 7 SP1 64-
bit3
Windows 7 SP1 64-
bit
PROCESSOR Dual core
processor
Dual core
processor
Dual core
processor
MEMORY 4 GB 2 GB 4 GB
GRAPHICS DirectX 11 GPU DirectX 11 GPU DirectX 11 GPU
with 1 GB memory
DISPLAY4 1920 × 1080 1280 × 720 1920 × 1080
RECOMMENDED
DISPLAY
SCALING
FACTOR5
100% 100% 100%
STORAGE 6 GB free space 6 GB free space 6 GB free space
2 Including all available Windows updates.
3 A 32-bit version is provided, but will not supported.
4 Minimum supported resolution.
5 Running the benchmark with a different DPI scaling than the recommended will affect score comparability
and may affect the stability of the results on some hardware configurations.
Page 16 of 82
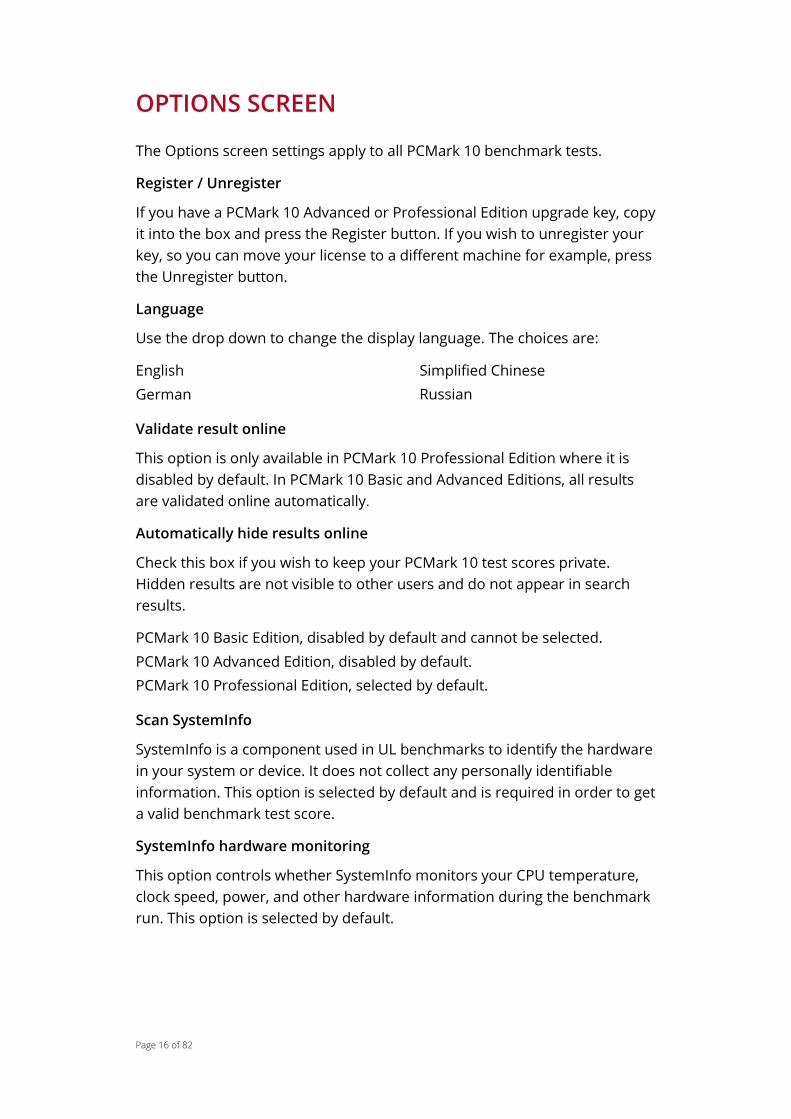
OPTIONS SCREEN
The Options screen settings apply to all PCMark 10 benchmark tests.
Register / Unregister
If you have a PCMark 10 Advanced or Professional Edition upgrade key, copy
it into the box and press the Register button. If you wish to unregister your
key, so you can move your license to a different machine for example, press
the Unregister button.
Language
Use the drop down to change the display language. The choices are:
English
German
Simplified Chinese
Russian
Validate result online
This option is only available in PCMark 10 Professional Edition where it is
disabled by default. In PCMark 10 Basic and Advanced Editions, all results
are validated online automatically.
Automatically hide results online
Check this box if you wish to keep your PCMark 10 test scores private.
Hidden results are not visible to other users and do not appear in search
results.
PCMark 10 Basic Edition, disabled by default and cannot be selected.
PCMark 10 Advanced Edition, disabled by default.
PCMark 10 Professional Edition, selected by default.
Scan SystemInfo
SystemInfo is a component used in UL benchmarks to identify the hardware
in your system or device. It does not collect any personally identifiable
information. This option is selected by default and is required in order to get
a valid benchmark test score.
SystemInfo hardware monitoring
This option controls whether SystemInfo monitors your CPU temperature,
clock speed, power, and other hardware information during the benchmark
run. This option is selected by default.

Page 17 of 82
Write detailed log
This option is disabled by default since it can affect performance. You
should only use this option when instructed as part of resolving a support
request.

Page 18 of 82
BENCHMARKS, TEST GROUPS,
AND WORKLOADS
PCMark 10 uses a modular approach to build relevant tests around
common end-user scenarios. There are three levels to this approach:
benchmarks, test groups, and workloads.
Benchmarks
Benchmarks are the top-level starting point in PCMark 10. A benchmark is a
test designed to reflect the performance requirements of a defined user
group.
There are three benchmarks in the current version of PCMark 10.
PCMark 10 benchmark – the complete benchmark for the modern office
PCMark 10 Express - a shorter test focused on basic work tasks
PCMark 10 Extended - a longer test covering a wider range of activities
Test groups
Each benchmark contains a number of test groups. A test group is a
collection of workloads that share a common theme or purpose. There are
four test groups in PCMark 10.
ESSENTIALS PRODUCTIVITY
DIGITAL
CONTENT
CREATION
GAMING
PCMARK 10 ● ● ● ✕
PCMARK 10
EXPRESS ● ● ✕ ✕
PCMARK 10
EXTENDED ● ● ● ●
Workloads
Workloads are the low-level unit in PCMark 10. A workload is a test designed
around a specific activity, task, or application. For example, the Web

Page 19 of 82
Browsing workload is designed to test performance while engaging in a
number of typical web browsing tasks.
Page 20 of 82
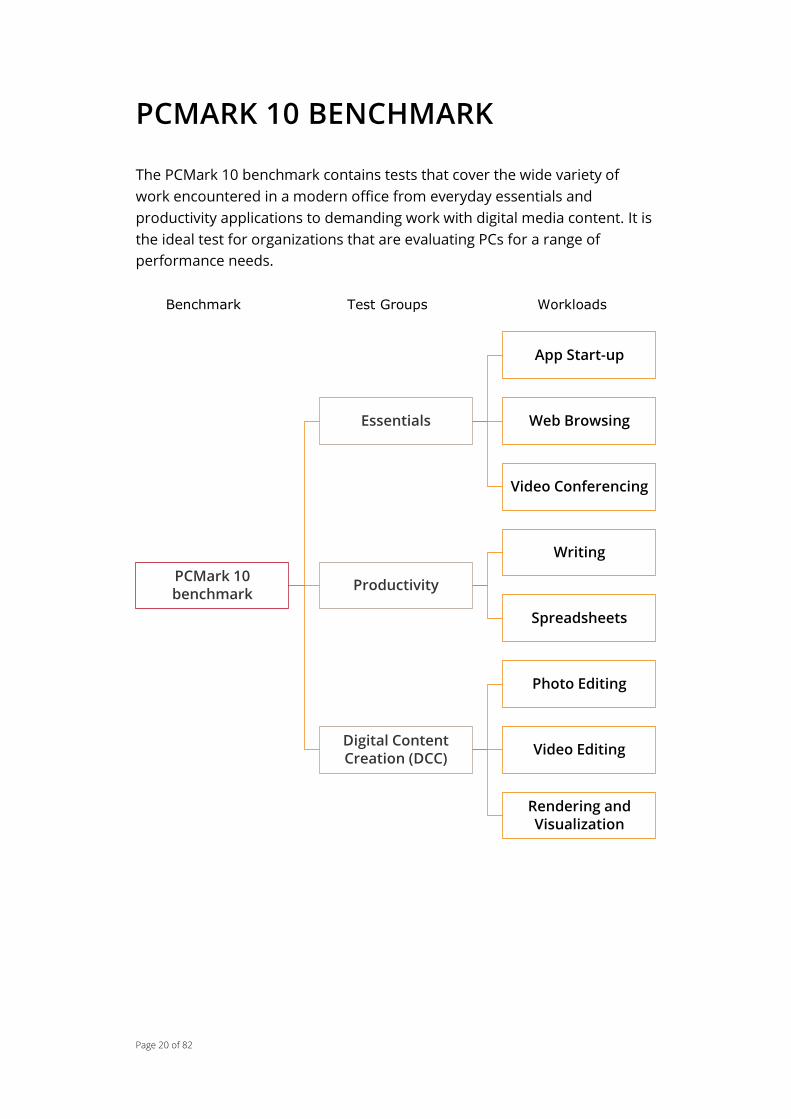
PCMARK 10 BENCHMARK
The PCMark 10 benchmark contains tests that cover the wide variety of
work encountered in a modern office from everyday essentials and
productivity applications to demanding work with digital media content. It is
the ideal test for organizations that are evaluating PCs for a range of
performance needs.
Benchmark Test Groups Workloads
PCMark 10 benchmark
Essentials
App Start-up
Web Browsing
Video Conferencing
Productivity
Writing
Spreadsheets
Digital Content Creation (DCC)
Photo Editing
Video Editing
Rendering and Visualization

Page 21 of 82
SCORING
Overall score
𝑃𝐶𝑀𝑎𝑟𝑘 10 𝑠𝑐𝑜𝑟𝑒 = 𝐾 ∗ 𝑔𝑒𝑜𝑚𝑒𝑎𝑛(𝑆𝑒 , 𝑆𝑝, 𝑆𝑑)
Where:
𝐾 = 0.717 (to 𝑠𝑐𝑎𝑙𝑒 𝑡ℎ𝑒 𝑠𝑐𝑜𝑟𝑒 𝑡𝑜 5,000 𝑜𝑛 𝑡ℎ𝑒 𝑟𝑒𝑓𝑒𝑟𝑒𝑛𝑐𝑒 𝑃𝐶)
𝑆𝑒 = 𝐸𝑠𝑠𝑒𝑛𝑡𝑖𝑎𝑙𝑠 𝑡𝑒𝑠𝑡 𝑔𝑟𝑜𝑢𝑝 𝑠𝑐𝑜𝑟𝑒
𝑆𝑝 = 𝑃𝑟𝑜𝑑𝑢𝑐𝑡𝑖𝑣𝑖𝑡𝑦 𝑡𝑒𝑠𝑡 𝑔𝑟𝑜𝑢𝑝 𝑠𝑐𝑜𝑟𝑒
𝑆𝑑 = 𝐷𝐶𝐶 𝑔𝑟𝑜𝑢𝑝 𝑠𝑐𝑜𝑟𝑒
Group scoring
𝐸𝑠𝑠𝑒𝑛𝑡𝑖𝑎𝑙𝑠 𝑡𝑒𝑠𝑡 𝑔𝑟𝑜𝑢𝑝 𝑠𝑐𝑜𝑟𝑒 = 𝑔𝑒𝑜𝑚𝑒𝑎𝑛(𝐸1, 𝐸2, 𝐸3)
Where:
𝐸1 = 𝐴𝑝𝑝 𝑆𝑡𝑎𝑟𝑡-𝑢𝑝 𝑠𝑐𝑜𝑟𝑒
𝐸2 = 𝑊𝑒𝑏 𝐵𝑟𝑜𝑤𝑠𝑖𝑛𝑔 𝑠𝑐𝑜𝑟𝑒
𝐸3 = 𝑉𝑖𝑑𝑒𝑜 𝐶𝑜𝑛𝑓𝑒𝑟𝑒𝑛𝑐𝑖𝑛𝑔 𝑠𝑐𝑜𝑟𝑒
𝑃𝑟𝑜𝑑𝑢𝑐𝑡𝑖𝑣𝑖𝑡𝑦 𝑡𝑒𝑠𝑡 𝑔𝑟𝑜𝑢𝑝 𝑠𝑐𝑜𝑟𝑒 = 𝑔𝑒𝑜𝑚𝑒𝑎𝑛(𝑃1, 𝑃2)
Where:
𝑃1 = 𝑊𝑟𝑖𝑡𝑖𝑛𝑔 𝑠𝑐𝑜𝑟𝑒
𝑃2 = 𝑆𝑝𝑟𝑒𝑎𝑑𝑠ℎ𝑒𝑒𝑡𝑠 𝑠𝑐𝑜𝑟𝑒
𝐷𝐶𝐶 𝑡𝑒𝑠𝑡 𝑔𝑟𝑜𝑢𝑝 𝑠𝑐𝑜𝑟𝑒 = 𝑔𝑒𝑜𝑚𝑒𝑎𝑛(𝐷1, 𝐷2, 𝐷3)
Where:
𝐷1 = 𝑃ℎ𝑜𝑡𝑜 𝐸𝑑𝑖𝑡𝑖𝑛𝑔 𝑠𝑐𝑜𝑟𝑒
𝐷2 = 𝑉𝑖𝑑𝑒𝑜 𝐸𝑑𝑖𝑡𝑖𝑛𝑔 𝑠𝑐𝑜𝑟𝑒
𝐷3 = 𝑅𝑒𝑛𝑑𝑒𝑟𝑖𝑛𝑔 𝑎𝑛𝑑 𝑉𝑖𝑠𝑢𝑎𝑙𝑖𝑧𝑎𝑡𝑖𝑜𝑛 𝑠𝑐𝑜𝑟𝑒

Page 22 of 82
PCMARK 10 EXPRESS BENCHMARK
The PCMark 10 Express benchmark measures the performance of the types
of application typically used by office workers in administration, sales, and
manager roles.
Benchmark Test Groups Workloads
PCMark 10 Express
Essentials
App Start-up
Web Browsing
Video Conferencing
Productivity
Writing
Spreadsheets
Page 23 of 82
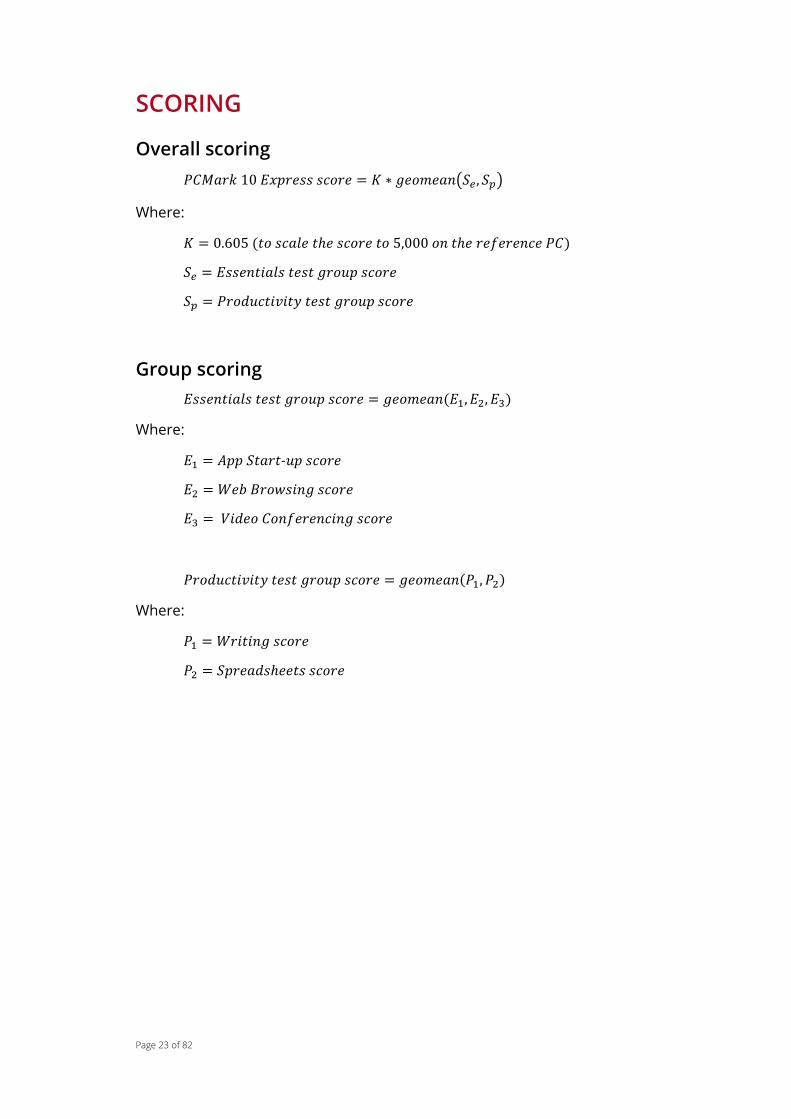
SCORING
Overall scoring
𝑃𝐶𝑀𝑎𝑟𝑘 10 𝐸𝑥𝑝𝑟𝑒𝑠𝑠 𝑠𝑐𝑜𝑟𝑒 = 𝐾 ∗ 𝑔𝑒𝑜𝑚𝑒𝑎𝑛(𝑆𝑒 , 𝑆𝑝)
Where:
𝐾 = 0.605 (𝑡𝑜 𝑠𝑐𝑎𝑙𝑒 𝑡ℎ𝑒 𝑠𝑐𝑜𝑟𝑒 𝑡𝑜 5,000 𝑜𝑛 𝑡ℎ𝑒 𝑟𝑒𝑓𝑒𝑟𝑒𝑛𝑐𝑒 𝑃𝐶)
𝑆𝑒 = 𝐸𝑠𝑠𝑒𝑛𝑡𝑖𝑎𝑙𝑠 𝑡𝑒𝑠𝑡 𝑔𝑟𝑜𝑢𝑝 𝑠𝑐𝑜𝑟𝑒
𝑆𝑝 = 𝑃𝑟𝑜𝑑𝑢𝑐𝑡𝑖𝑣𝑖𝑡𝑦 𝑡𝑒𝑠𝑡 𝑔𝑟𝑜𝑢𝑝 𝑠𝑐𝑜𝑟𝑒
Group scoring
𝐸𝑠𝑠𝑒𝑛𝑡𝑖𝑎𝑙𝑠 𝑡𝑒𝑠𝑡 𝑔𝑟𝑜𝑢𝑝 𝑠𝑐𝑜𝑟𝑒 = 𝑔𝑒𝑜𝑚𝑒𝑎𝑛(𝐸1, 𝐸2, 𝐸3)
Where:
𝐸1 = 𝐴𝑝𝑝 𝑆𝑡𝑎𝑟𝑡-𝑢𝑝 𝑠𝑐𝑜𝑟𝑒
𝐸2 = 𝑊𝑒𝑏 𝐵𝑟𝑜𝑤𝑠𝑖𝑛𝑔 𝑠𝑐𝑜𝑟𝑒
𝐸3 = 𝑉𝑖𝑑𝑒𝑜 𝐶𝑜𝑛𝑓𝑒𝑟𝑒𝑛𝑐𝑖𝑛𝑔 𝑠𝑐𝑜𝑟𝑒
𝑃𝑟𝑜𝑑𝑢𝑐𝑡𝑖𝑣𝑖𝑡𝑦 𝑡𝑒𝑠𝑡 𝑔𝑟𝑜𝑢𝑝 𝑠𝑐𝑜𝑟𝑒 = 𝑔𝑒𝑜𝑚𝑒𝑎𝑛(𝑃1, 𝑃2)
Where:
𝑃1 = 𝑊𝑟𝑖𝑡𝑖𝑛𝑔 𝑠𝑐𝑜𝑟𝑒
𝑃2 = 𝑆𝑝𝑟𝑒𝑎𝑑𝑠ℎ𝑒𝑒𝑡𝑠 𝑠𝑐𝑜𝑟𝑒
Page 24 of 82
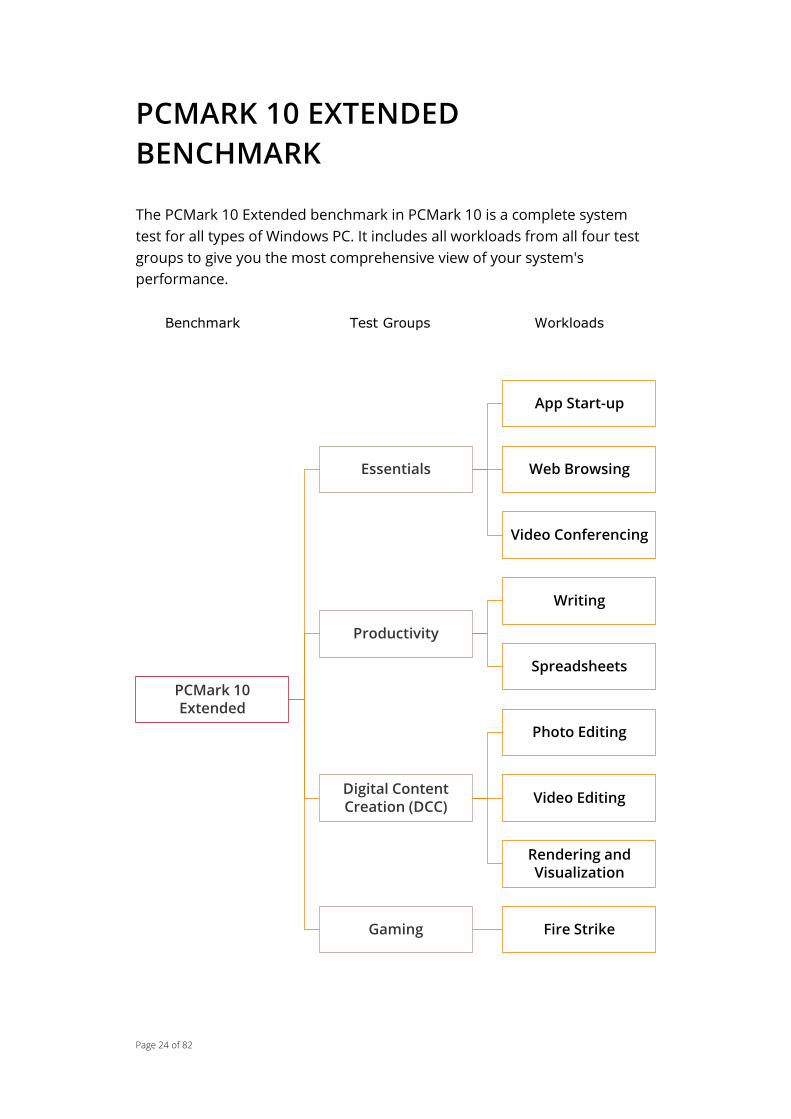
PCMARK 10 EXTENDED
BENCHMARK
The PCMark 10 Extended benchmark in PCMark 10 is a complete system
test for all types of Windows PC. It includes all workloads from all four test
groups to give you the most comprehensive view of your system's
performance.
Benchmark Test Groups Workloads
PCMark 10 Extended
Essentials
App Start-up
Web Browsing
Video Conferencing
Productivity
Writing
Spreadsheets
Digital Content Creation (DCC)
Photo Editing
Video Editing
Rendering and Visualization
Gaming Fire Strike

Page 25 of 82
SCORING
Overall scoring
𝑃𝐶𝑀𝑎𝑟𝑘 10 𝐸𝑥𝑡𝑒𝑛𝑑𝑒𝑑 𝑠𝑐𝑜𝑟𝑒 = 𝐾 ∗ 𝑔𝑒𝑜𝑚𝑒𝑎𝑛(𝑆𝑒 , 𝑆𝑝, 𝑆𝑑 , 𝑆𝑔)
Where:
𝐾 = 0.780 (𝑡𝑜 𝑠𝑐𝑎𝑙𝑒 𝑡ℎ𝑒 𝑠𝑐𝑜𝑟𝑒 𝑡𝑜 5,000 𝑜𝑛 𝑡ℎ𝑒 𝑟𝑒𝑓𝑒𝑟𝑒𝑛𝑐𝑒 𝑃𝐶)
𝑆𝑒 = 𝐸𝑠𝑠𝑒𝑛𝑡𝑖𝑎𝑙𝑠 𝑔𝑟𝑜𝑢𝑝 𝑠𝑐𝑜𝑟𝑒
𝑆𝑝 = 𝑃𝑟𝑜𝑑𝑢𝑐𝑡𝑖𝑣𝑖𝑡𝑦 𝑔𝑟𝑜𝑢𝑝 𝑠𝑐𝑜𝑟𝑒
𝑆𝑑 = 𝐷𝐶𝐶 𝑔𝑟𝑜𝑢𝑝 𝑠𝑐𝑜𝑟𝑒
𝑆𝑔 = 𝐺𝑎𝑚𝑖𝑛𝑔 𝑔𝑟𝑜𝑢𝑝 𝑠𝑐𝑜𝑟𝑒
Group scoring
𝐸𝑠𝑠𝑒𝑛𝑡𝑖𝑎𝑙𝑠 𝑡𝑒𝑠𝑡 𝑔𝑟𝑜𝑢𝑝 𝑠𝑐𝑜𝑟𝑒 = 𝑔𝑒𝑜𝑚𝑒𝑎𝑛(𝐸1, 𝐸2, 𝐸3)
Where:
𝐸1 = 𝐴𝑝𝑝 𝑆𝑡𝑎𝑟𝑡-𝑢𝑝 𝑠𝑐𝑜𝑟𝑒
𝐸2 = 𝑊𝑒𝑏 𝐵𝑟𝑜𝑤𝑠𝑖𝑛𝑔 𝑠𝑐𝑜𝑟𝑒
𝐸3 = 𝑉𝑖𝑑𝑒𝑜 𝐶𝑜𝑛𝑓𝑒𝑟𝑒𝑛𝑐𝑖𝑛𝑔 𝑠𝑐𝑜𝑟𝑒
𝑃𝑟𝑜𝑑𝑢𝑐𝑡𝑖𝑣𝑖𝑡𝑦 𝑡𝑒𝑠𝑡 𝑔𝑟𝑜𝑢𝑝 𝑠𝑐𝑜𝑟𝑒 = 𝑔𝑒𝑜𝑚𝑒𝑎𝑛(𝑃1, 𝑃2)
Where:
𝑃1 = 𝑊𝑟𝑖𝑡𝑖𝑛𝑔 𝑠𝑐𝑜𝑟𝑒
𝑃2 = 𝑆𝑝𝑟𝑒𝑎𝑑𝑠ℎ𝑒𝑒𝑡𝑠 𝑠𝑐𝑜𝑟𝑒
𝐷𝐶𝐶 𝑡𝑒𝑠𝑡 𝑔𝑟𝑜𝑢𝑝 𝑠𝑐𝑜𝑟𝑒 = 𝑔𝑒𝑜𝑚𝑒𝑎𝑛(𝐷1, 𝐷2, 𝐷3)
Where:
𝐷1 = 𝑃ℎ𝑜𝑡𝑜 𝐸𝑑𝑖𝑡𝑖𝑛𝑔 𝑠𝑐𝑜𝑟𝑒
𝐷2 = 𝑉𝑖𝑑𝑒𝑜 𝐸𝑑𝑖𝑡𝑖𝑛𝑔 𝑠𝑐𝑜𝑟𝑒
𝐷3 = 𝑅𝑒𝑛𝑑𝑒𝑟𝑖𝑛𝑔 𝑎𝑛𝑑 𝑉𝑖𝑠𝑢𝑎𝑙𝑖𝑧𝑎𝑡𝑖𝑜𝑛 𝑠𝑐𝑜𝑟𝑒
𝐺𝑎𝑚𝑖𝑛𝑔 𝑠𝑐𝑜𝑟𝑒 = 𝐹𝑖𝑟𝑒 𝑆𝑡𝑟𝑖𝑘𝑒 𝑠𝑐𝑜𝑟𝑒 = 𝐾 ∗ 𝑊𝑔𝑟𝑎𝑝ℎ𝑖𝑐𝑠+𝑊𝑝ℎ𝑦𝑠𝑖𝑐𝑠+𝑊𝑐𝑜𝑚𝑏𝑖𝑛𝑒𝑑
𝑊𝑔𝑟𝑎𝑝ℎ𝑖𝑐𝑠
𝑆𝑔𝑟𝑎𝑝ℎ𝑖𝑐𝑠+
𝑊𝑝ℎ𝑦𝑠𝑖𝑐𝑠
𝑆𝑝ℎ𝑦𝑠𝑖𝑐𝑠+
𝑊𝑐𝑜𝑚𝑏𝑖𝑛𝑒𝑑
𝑆𝑐𝑜𝑚𝑏𝑖𝑛𝑒𝑑
Where:

Page 26 of 82
𝐾 = 0.834 (to 𝑠𝑐𝑎𝑙𝑒 𝑡ℎ𝑒 𝑠𝑐𝑜𝑟𝑒 𝑡𝑜 5,000 𝑜𝑛 𝑡ℎ𝑒 𝑟𝑒𝑓𝑒𝑟𝑒𝑛𝑐𝑒 𝑃𝐶)
𝑊𝑔𝑟𝑎𝑝ℎ𝑖𝑐𝑠 = The Graphics score weight, set to 0.75
𝑊𝑝ℎ𝑦𝑠𝑖𝑐𝑠 = The Physics score weight, set to 0.15
𝑊𝑐𝑜𝑚𝑏𝑖𝑛𝑒𝑑 = The Combined score weight, set to 0.10
𝑆𝑔𝑟𝑎𝑝ℎ𝑖𝑐𝑠 = Graphics score
𝑆𝑝ℎ𝑦𝑠𝑖𝑐𝑠 = Physics score
𝑆𝑐𝑜𝑚𝑏𝑖𝑛𝑒𝑑 = Combined score
Please see the Workloads section for the score formula for each workload.

Page 27 of 82
CUSTOM RUNS
Expert users can set up and run custom benchmark tests using any
combination of workloads.
A custom benchmark run will return the results from each workload and
display hardware performance monitoring charts, but you will not get an
overall benchmark score.

Page 28 of 82
ESSENTIALS TEST GROUP
The Essentials test group contains workloads that are relevant to the majority of desktop and laptop Windows PC users. It includes the following workloads:
1. App Start-up 2. Web Browsing 3. Video Conferencing
Page 29 of 82
APP START-UP
It is frustrating when the applications you use every day are slow to start.
The App Start-up workload measures hardware performance when
launching a number of real applications chosen to represent the types of
app that people use day in, day out. The apps were chosen to cover a range
of categories – web browser, test editor, image editor - and a spectrum of
complexity – from small, lightweight apps to complex apps with lots of DLLs
to load.
Chromium web browser
Firefox web browser
LibreOffice Writer word processing program
GIMP image manipulation program
The applications are included in the PCMark 10 installation package.
Implementation
The test has three parts: initialization, warm start, and cold start.
For the initialization part, all the applications are started once then closed.
For each application in the warm start part of the test:
1. Start the application.
2. Measure the time taken until the application is responsive.
3. Close the application.
4. Repeat from step 1 five times.
5. The result is the geomean of the five runs.
For each application in the cold start part of the test:
1. Flush the system cache.
2. Start the application.
3. Measure the time taken until the application is responsive.
4. Close the application.
5. Repeat from step 1 five times.
6. The result is the geomean of the five runs.
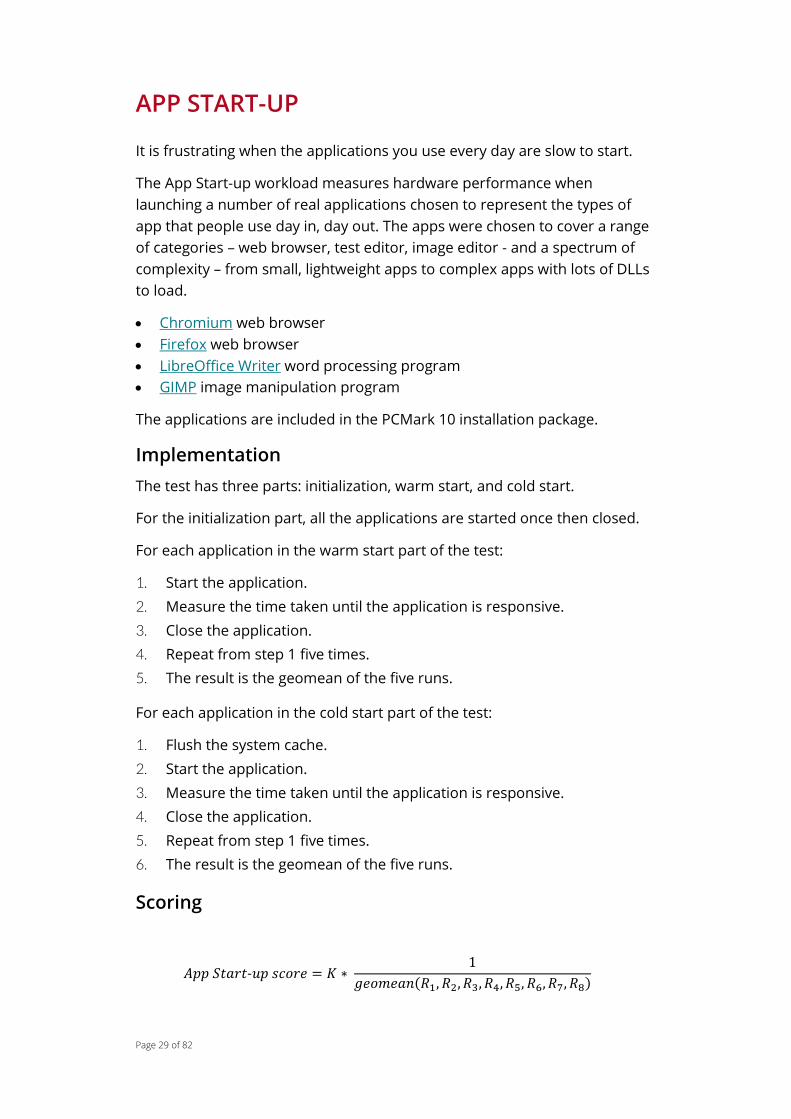
Scoring
𝐴𝑝𝑝 𝑆𝑡𝑎𝑟𝑡-𝑢𝑝 𝑠𝑐𝑜𝑟𝑒 = 𝐾 ∗ 1
𝑔𝑒𝑜𝑚𝑒𝑎𝑛(𝑅1, 𝑅2, 𝑅3, 𝑅4, 𝑅5, 𝑅6, 𝑅7, 𝑅8)
Page 30 of 82
Where:
𝐾 = 𝑠𝑐𝑜𝑟𝑖𝑛𝑔 𝑐𝑜𝑒𝑓𝑓𝑖𝑐𝑖𝑒𝑛𝑡 = 15823
RESULT DEFINITION UNIT TYPICAL RANGE
𝑅1 Writer warm start s 0.9-1.8
𝑅2 Writer cold start s 3.0-8.0
𝑅3 GIMP warm start s 1.8-3.2
𝑅4 GIMP cold start s 4.5-9.1
𝑅5 Chromium warm start s 0.17-0.35
𝑅6 Chromium cold start s 1.3-3.0
𝑅7 Firefox warm start s 0.86-1.8
𝑅8 Firefox cold start
s 2.0-5.4
Page 31 of 82
WEB BROWSING
This test simulates high-level use cases where the user browses common
websites with a web browser application. The test uses the following
website archetypes and use cases: social media, online shopping, map,
video, and static web page.
Implementation
The Web Browsing test utilizes two browsers: Firefox and Google
Chromium. Any other browsers possibly installed in the system will not
affect the benchmark.
The content is served with a local lightweight web server that is embedded
into the benchmark. The content is custom made for the benchmark and
represents common web sites.
The web pages are shown using both browsers, except the video page that
is only run on Chromium. All the pages are run 2 times in both browsers.
Workloads
Social media
The social media workload simulates usage of social media platforms and
includes the following tasks:
Navigates to and load a social media site.
The page updates the news feed with new content.
The page updates the feed again.
The workload measures the loading time of the page content and of the
feed update.
𝑆𝑜𝑐𝑖𝑎𝑙 𝑚𝑒𝑑𝑖𝑎 𝑝𝑎𝑔𝑒 𝑙𝑜𝑎𝑑 = 𝑔𝑒𝑜𝑚𝑒𝑎𝑛 (𝑀1
1000,
𝑀2
1000 )
Where:
𝑀1 = 𝑑𝑏𝑔_𝑝𝑐𝑚10_𝑤𝑒𝑏_𝑐ℎ𝑟𝑜𝑚𝑖𝑢𝑚_𝑠𝑜𝑚𝑒_𝑟𝑒𝑛𝑑𝑒𝑟𝑡𝑖𝑚𝑒
𝑀2 = 𝑑𝑏𝑔_𝑝𝑐𝑚10_𝑤𝑒𝑏_𝑓𝑖𝑟𝑒𝑓𝑜𝑥_𝑠𝑜𝑚𝑒_𝑟𝑒𝑛𝑑𝑒𝑟𝑡𝑖𝑚𝑒
𝑆𝑜𝑐𝑖𝑎𝑙 𝑚𝑒𝑑𝑖𝑎 𝑓𝑒𝑒𝑑 𝑢𝑝𝑑𝑎𝑡𝑒 = 𝑔𝑒𝑜𝑚𝑒𝑎𝑛 (𝑀3
1000,
𝑀4
1000 )
Where:
𝑀1 = 𝑑𝑏𝑔_𝑝𝑐𝑚10_𝑤𝑒𝑏_𝑐ℎ𝑟𝑜𝑚𝑖𝑢𝑚_𝑠𝑜𝑚𝑒_𝑢𝑝𝑑𝑎𝑡𝑒𝑡𝑖𝑚𝑒

Page 32 of 82
𝑀2 = 𝑑𝑏𝑔_𝑝𝑐𝑚10_𝑤𝑒𝑏_𝑓𝑖𝑟𝑒𝑓𝑜𝑥_𝑠𝑜𝑚𝑒_𝑢𝑝𝑑𝑎𝑡𝑒𝑡𝑖𝑚𝑒
Online shopping
The online shopping workload simulates an online store. The workload
performs the following tasks:
View and zoom in on high resolution images of shopping items.
View 3D models of items.
The workload measures the time to view an image, load a 3D object, and
animate a 3D object.
𝑆ℎ𝑜𝑝 𝑣𝑖𝑒𝑤 𝑖𝑚𝑎𝑔𝑒 = (𝑀𝑖𝑛(60, 𝑀5 ))
Where:
𝑀5 = 𝑑𝑏𝑔_𝑝𝑐𝑚10_𝑤𝑒𝑏_𝑐ℎ𝑟𝑜𝑚𝑖𝑢𝑚_𝑤𝑒𝑏𝑠ℎ𝑜𝑝_𝑧𝑜𝑜𝑚_𝑓𝑝𝑠
𝑆ℎ𝑜𝑝 𝑙𝑜𝑎𝑑 3𝐷 𝑜𝑏𝑗𝑒𝑐𝑡 = 𝑔𝑒𝑜𝑚𝑒𝑎𝑛 (𝑀6
1000,
𝑀7
1000 )
Where:
𝑀6 = 𝑑𝑏𝑔_𝑝𝑐𝑚10_𝑤𝑒𝑏_𝑐ℎ𝑟𝑜𝑚𝑖𝑢𝑚_𝑠ℎ𝑜𝑝_𝑚𝑜𝑑𝑒𝑙𝑝𝑎𝑟𝑠𝑒𝑡𝑖𝑚𝑒
𝑀7 = 𝑑𝑏𝑔_𝑝𝑐𝑚10_𝑤𝑒𝑏_𝑓𝑖𝑟𝑒𝑓𝑜𝑥_𝑠ℎ𝑜𝑝_𝑚𝑜𝑑𝑒𝑙𝑝𝑎𝑟𝑠𝑒𝑡𝑖𝑚𝑒
𝑆ℎ𝑜𝑝 𝑎𝑛𝑖𝑚𝑎𝑡𝑒 3𝐷 𝑜𝑏𝑗𝑒𝑐𝑡 = 𝑔𝑒𝑜𝑚𝑒𝑎𝑛(𝑀𝑖𝑛(300, 𝑀8), 𝑀𝑖𝑛(300, 𝑀9))
Where:
𝑀8 = 𝑑𝑏𝑔_𝑝𝑐𝑚10_𝑤𝑒𝑏_𝑐ℎ𝑟𝑜𝑚𝑖𝑢𝑚_𝑠ℎ𝑜𝑝_𝑓𝑝𝑠
𝑀9 = 𝑑𝑏𝑔_𝑝𝑐𝑚10_𝑤𝑒𝑏_𝑓𝑖𝑟𝑒𝑓𝑜𝑥_𝑠ℎ𝑜𝑝_𝑓𝑝𝑠
Map
The map workload simulates the visualization of information on a map. The
workload includes the following tasks:
Navigate to and load a map site.
The page adds useful graphics such as traffic information.
Zoom in on the map.
Page 33 of 82
The workload measures the time it takes to update the information on the
map and the time to zoom in.
𝑀𝑎𝑝 𝑖𝑛𝑓𝑜𝑔𝑟𝑎𝑝ℎ𝑖𝑐𝑠 𝑢𝑝𝑑𝑎𝑡𝑒 = 𝑔𝑒𝑜𝑚𝑒𝑎𝑛 (𝑀10
1000,
𝑀11
1000 ,
𝑀12
1000,
𝑀13
1000)
Where:
𝑀10 = 𝑑𝑏𝑔_𝑝𝑐𝑚10_𝑤𝑒𝑏_𝑐ℎ𝑟𝑜𝑚𝑖𝑢𝑚_𝑟𝑒𝑎𝑙𝑒𝑠𝑡𝑎𝑡𝑒_ℎ𝑒𝑎𝑡𝑚𝑎𝑝𝐿𝑜𝑎𝑑
𝑀11 = 𝑑𝑏𝑔_𝑝𝑐𝑚10_𝑤𝑒𝑏_𝑓𝑖𝑟𝑒𝑓𝑜𝑥_𝑟𝑒𝑎𝑙𝑒𝑠𝑡𝑎𝑡𝑒_ℎ𝑒𝑎𝑡𝑚𝑎𝑝𝐿𝑜𝑎𝑑
𝑀12 = 𝑑𝑏𝑔_𝑝𝑐𝑚10_𝑤𝑒𝑏_𝑐ℎ𝑟𝑜𝑚𝑖𝑢𝑚_𝑟𝑒𝑎𝑙𝑒𝑠𝑡𝑎𝑡𝑒_𝑚𝑎𝑟𝑘𝑒𝑟𝑠
𝑀13 = 𝑑𝑏𝑔_𝑝𝑐𝑚10_𝑤𝑒𝑏_𝑓𝑖𝑟𝑒𝑓𝑜𝑥_𝑟𝑒𝑎𝑙𝑒𝑠𝑡𝑎𝑡𝑒_𝑚𝑎𝑟𝑘𝑒𝑟𝑠
𝑀𝑎𝑝 𝑧𝑜𝑜𝑚𝑖𝑛𝑔 = 𝑔𝑒𝑜𝑚𝑒𝑎𝑛 (𝑀14
1000,
𝑀15
1000 ,
𝑀16
1000,
𝑀17
1000,
𝑀18
1000,
𝑀19
1000)
Where:
𝑀14 = 𝑑𝑏𝑔_𝑝𝑐𝑚10_𝑤𝑒𝑏_𝑐ℎ𝑟𝑜𝑚𝑖𝑢𝑚_𝑟𝑒𝑎𝑙𝑒𝑠𝑡𝑎𝑡𝑒_𝑡𝑖𝑙𝑒𝐿𝑜𝑎𝑑01
𝑀15 = 𝑑𝑏𝑔_𝑝𝑐𝑚10_𝑤𝑒𝑏_𝑐ℎ𝑟𝑜𝑚𝑖𝑢𝑚_𝑟𝑒𝑎𝑙𝑒𝑠𝑡𝑎𝑡𝑒_𝑡𝑖𝑙𝑒𝐿𝑜𝑎d02
𝑀16 = 𝑑𝑏𝑔_𝑝𝑐𝑚10_𝑤𝑒𝑏_𝑐ℎ𝑟𝑜𝑚𝑖𝑢𝑚_𝑟𝑒𝑎𝑙𝑒𝑠𝑡𝑎𝑡𝑒_𝑡𝑖𝑙𝑒𝐿𝑜𝑎𝑑03
𝑀17 = 𝑑𝑏𝑔_𝑝𝑐𝑚10_𝑤𝑒𝑏_𝑓𝑖𝑟𝑒𝑓𝑜𝑥_𝑟𝑒𝑎𝑙𝑒𝑠𝑡𝑎𝑡𝑒_𝑡𝑖𝑙𝑒𝐿𝑜𝑎𝑑01
𝑀18 = 𝑑𝑏𝑔_𝑝𝑐𝑚10_𝑤𝑒𝑏_𝑓𝑖𝑟𝑒𝑓𝑜𝑥_𝑟𝑒𝑎𝑙𝑒𝑠𝑡𝑎𝑡𝑒_𝑡𝑖𝑙𝑒𝐿𝑜𝑎𝑑02
𝑀19 = 𝑑𝑏𝑔_𝑝𝑐𝑚10_𝑤𝑒𝑏_𝑓𝑖𝑟𝑒𝑓𝑜𝑥_𝑟𝑒𝑎𝑙𝑒𝑠𝑡𝑎𝑡𝑒_𝑡𝑖𝑙𝑒𝐿𝑜𝑎𝑑03
Video
The video workload simulates online video playback. The workload views a
selection of HD and 4K UHD video clips using two codecs. The video
workload measures the frame rate of the video playback.
𝑉𝑖𝑑𝑒𝑜 𝐻. 264 1920 × 1080 = 𝑀20
Where:
𝑀20 = 𝑑𝑏𝑔_𝑝𝑐𝑚10_𝑤𝑒𝑏_𝑐ℎ𝑟𝑜𝑚𝑖𝑢𝑚_𝑣𝑖𝑑𝑒𝑜_𝑣𝑖𝑑𝑒𝑜_𝑓ℎ𝑑_𝑚𝑝4
𝑉𝑖𝑑𝑒𝑜 𝐻. 264 3840 × 2160 = 𝑀21
Where:
𝑀21 = 𝑑𝑏𝑔_𝑝𝑐𝑚10_𝑤𝑒𝑏_𝑐ℎ𝑟𝑜𝑚𝑖𝑢𝑚_𝑣𝑖𝑑𝑒𝑜_𝑣𝑖𝑑𝑒𝑜_𝑢ℎ𝑑_𝑚𝑝4
Page 34 of 82
𝑉𝑖𝑑𝑒𝑜 𝐻. 264 3840 × 2160 = 𝑀21
Where:
𝑀21 = 𝑑𝑏𝑔_𝑝𝑐𝑚10_𝑤𝑒𝑏_𝑐ℎ𝑟𝑜𝑚𝑖𝑢𝑚_𝑣𝑖𝑑𝑒𝑜_𝑣𝑖𝑑𝑒𝑜_𝑢ℎ𝑑_𝑚𝑝4
𝑉𝑖𝑑𝑒𝑜 𝑉𝑃9 1920 × 1080 = 𝑀22
Where:
𝑀22 = 𝑑𝑏𝑔_𝑝𝑐𝑚10_𝑤𝑒𝑏_𝑐ℎ𝑟𝑜𝑚𝑖𝑢𝑚_𝑣𝑖𝑑𝑒𝑜_𝑣𝑖𝑑𝑒𝑜_𝑓ℎ𝑑_𝑤𝑒𝑏𝑚
𝑉𝑖𝑑𝑒𝑜 𝑉𝑃9 3840 × 2160 = 𝑀23
Where:
𝑀23 = 𝑑𝑏𝑔_𝑝𝑐𝑚10_𝑤𝑒𝑏_𝑐ℎ𝑟𝑜𝑚𝑖𝑢𝑚_𝑣𝑖𝑑𝑒𝑜_𝑣𝑖𝑑𝑒𝑜_𝑢ℎ𝑑_𝑤𝑒𝑏𝑚
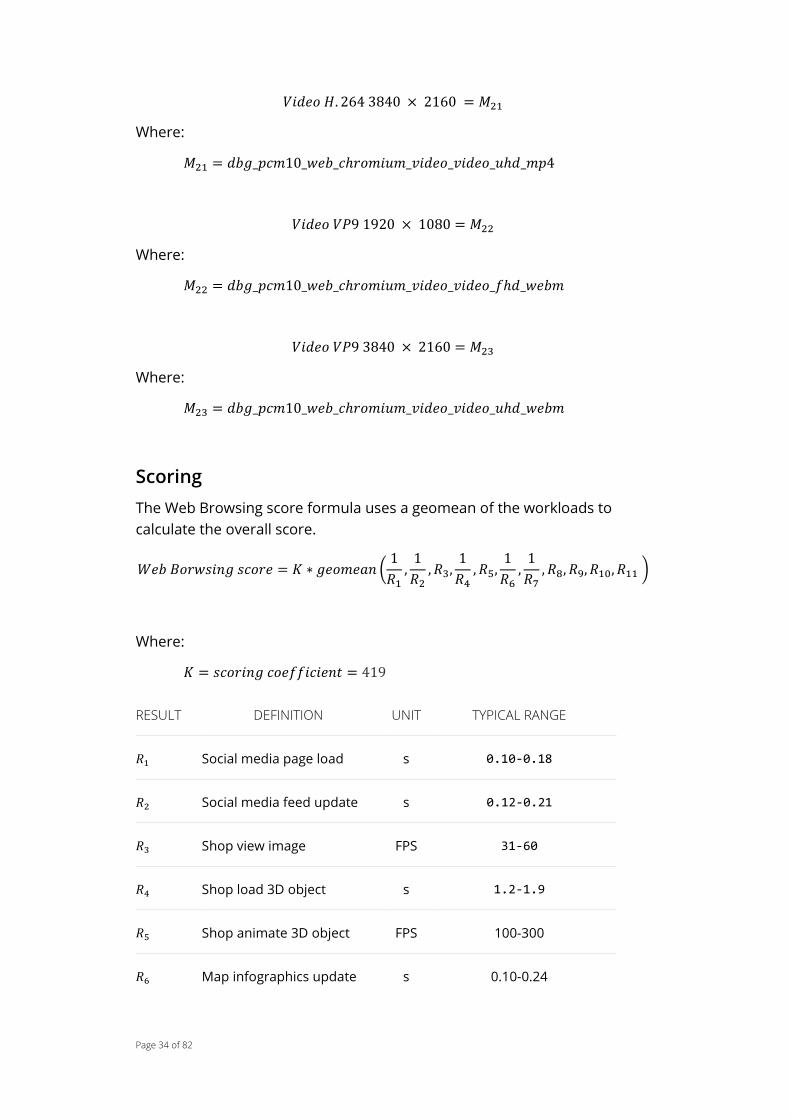
Scoring
The Web Browsing score formula uses a geomean of the workloads to
calculate the overall score.
𝑊𝑒𝑏 𝐵𝑜𝑟𝑤𝑠𝑖𝑛𝑔 𝑠𝑐𝑜𝑟𝑒 = 𝐾 ∗ 𝑔𝑒𝑜𝑚𝑒𝑎𝑛 (1
𝑅1,
1
𝑅2, 𝑅3,
1
𝑅4, 𝑅5,
1
𝑅6,
1
𝑅7, 𝑅8, 𝑅9, 𝑅10, 𝑅11 )
Where:
𝐾 = 𝑠𝑐𝑜𝑟𝑖𝑛𝑔 𝑐𝑜𝑒𝑓𝑓𝑖𝑐𝑖𝑒𝑛𝑡 = 419
RESULT DEFINITION UNIT TYPICAL RANGE
𝑅1 Social media page load s 0.10-0.18
𝑅2 Social media feed update s 0.12-0.21
𝑅3 Shop view image FPS 31-60
𝑅4 Shop load 3D object s 1.2-1.9
𝑅5 Shop animate 3D object FPS 100-300
𝑅6 Map infographics update s 0.10-0.24
Page 35 of 82
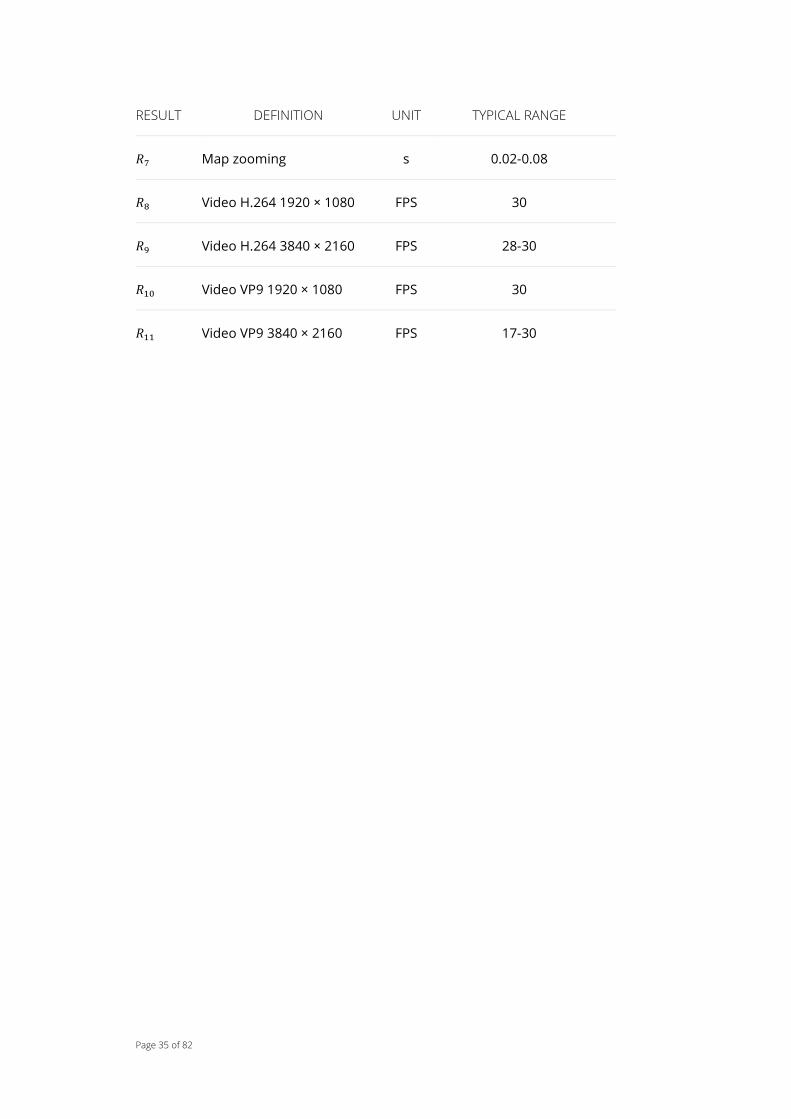
RESULT DEFINITION UNIT TYPICAL RANGE
𝑅7 Map zooming s 0.02-0.08
𝑅8 Video H.264 1920 × 1080 FPS 30
𝑅9 Video H.264 3840 × 2160 FPS 28-30
𝑅10 Video VP9 1920 × 1080 FPS 30
𝑅11 Video VP9 3840 × 2160 FPS 17-30
Page 36 of 82
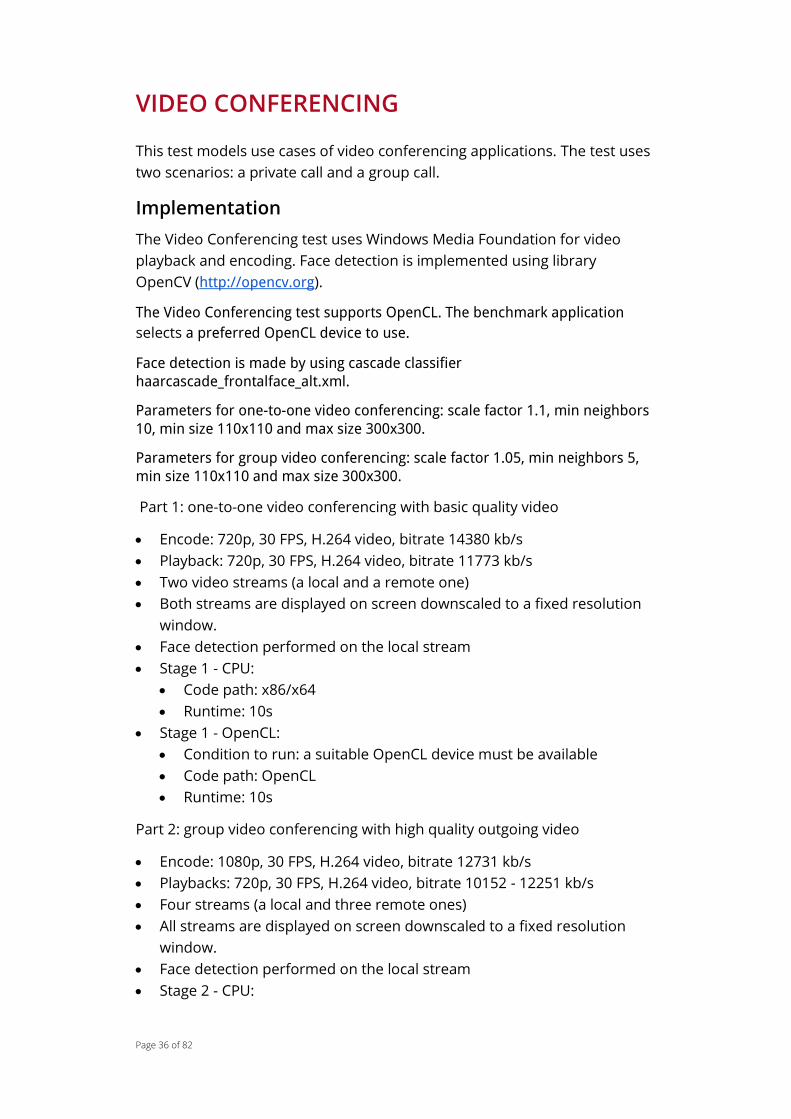
VIDEO CONFERENCING
This test models use cases of video conferencing applications. The test uses
two scenarios: a private call and a group call.
Implementation
The Video Conferencing test uses Windows Media Foundation for video
playback and encoding. Face detection is implemented using library
OpenCV (http://opencv.org).
The Video Conferencing test supports OpenCL. The benchmark application
selects a preferred OpenCL device to use.
Face detection is made by using cascade classifier haarcascade_frontalface_alt.xml.
Parameters for one-to-one video conferencing: scale factor 1.1, min neighbors 10, min size 110x110 and max size 300x300.
Parameters for group video conferencing: scale factor 1.05, min neighbors 5, min size 110x110 and max size 300x300.
Part 1: one-to-one video conferencing with basic quality video
Encode: 720p, 30 FPS, H.264 video, bitrate 14380 kb/s
Playback: 720p, 30 FPS, H.264 video, bitrate 11773 kb/s
Two video streams (a local and a remote one)
Both streams are displayed on screen downscaled to a fixed resolution
window.
Face detection performed on the local stream
Stage 1 - CPU:
Code path: x86/x64
Runtime: 10s
Stage 1 - OpenCL:
Condition to run: a suitable OpenCL device must be available
Code path: OpenCL
Runtime: 10s
Part 2: group video conferencing with high quality outgoing video
Encode: 1080p, 30 FPS, H.264 video, bitrate 12731 kb/s
Playbacks: 720p, 30 FPS, H.264 video, bitrate 10152 - 12251 kb/s
Four streams (a local and three remote ones)
All streams are displayed on screen downscaled to a fixed resolution
window.
Face detection performed on the local stream
Stage 2 - CPU:
Page 37 of 82
Code path: x86/x64
Runtime: 10s
Stage 2 - OpenCL:
Condition to run: a suitable OpenCL device must be available
Code path: OpenCL
Runtime: 10s
Workloads
In both the private and group call scenarios, the sent video stream is
processed in following manner:
Caller face location is detected in periodic intervals
The perceived quality of each frame is improved based on the face
location information by blurring the background.
Private call scenario
In the private call scenario, the test runs a 1-to-1 call at a resolution of 1280
× 720 at 30 FPS. The workload measures the frame rate of the video call.
𝑃𝑙𝑎𝑦𝑏𝑎𝑐𝑘 𝑝𝑟𝑖𝑣𝑎𝑡𝑒 𝐶𝑃𝑈 = 𝑀1
Where:
𝑀1 = 𝑑𝑏𝑔_𝑝𝑐𝑚10_𝑐ℎ𝑎𝑡_𝑝𝑙𝑎𝑦_𝑝𝑟𝑖𝑣𝑎𝑡𝑒_𝑎𝑣𝑒𝑟𝑎𝑔𝑒_𝑓𝑟𝑎𝑚𝑒_𝑟𝑎𝑡𝑒_𝑐𝑝𝑢
𝑃𝑙𝑎𝑦𝑏𝑎𝑐𝑘 𝑝𝑟𝑖𝑣𝑎𝑡𝑒 𝑂𝐶𝐿 = 𝑀2
Where:
𝑀2 = 𝑑𝑏𝑔_𝑝𝑐𝑚10_𝑐ℎ𝑎𝑡_𝑝𝑙𝑎𝑦_𝑝𝑟𝑖𝑣𝑎𝑡𝑒_𝑎𝑣𝑒𝑟𝑎𝑔𝑒_𝑓𝑟𝑎𝑚𝑒_𝑟𝑎𝑡𝑒_𝑜𝑐𝑙
𝐸𝑛𝑐𝑜𝑑𝑒 𝑝𝑟𝑖𝑣𝑎𝑡𝑒 𝑂𝐶𝐿 =𝑀3
𝑀4
Where:
𝑀3 = 𝑑𝑏𝑔_𝑝𝑐𝑚10_𝑐ℎ𝑎𝑡_𝑝𝑙𝑎𝑦_𝑝𝑟𝑖𝑣𝑎𝑡𝑒_𝑎𝑣𝑒𝑟𝑎𝑔𝑒_𝑓𝑟𝑎𝑚𝑒_𝑟𝑎𝑡𝑒_𝑜𝑐𝑙
𝑀4 = 𝑑𝑏𝑔_𝑝𝑐𝑚10_𝑐ℎ𝑎𝑡_𝑒𝑛𝑐𝑜𝑑𝑒_𝑝𝑟𝑖𝑣𝑎𝑡𝑒_𝑒𝑙𝑎𝑝𝑠𝑒𝑑_𝑜𝑐𝑙
𝐹𝑎𝑐𝑒 𝑑𝑒𝑡𝑒𝑐𝑡 𝑝𝑟𝑖𝑣𝑎𝑡𝑒 𝐶𝑃𝑈 =1000
𝑀5
Where:
Page 38 of 82
𝑀5
= 𝑑𝑏𝑔_𝑝𝑐𝑚10_𝑐ℎ𝑎𝑡_𝑒𝑛𝑐𝑜𝑑𝑒_𝑝𝑟𝑖𝑣𝑎𝑡𝑒_𝑓𝑎𝑐𝑒𝑑𝑒𝑡𝑒𝑐𝑡_𝑎𝑣𝑒𝑟𝑎𝑔𝑒_𝑡𝑖𝑚𝑒_𝑝𝑒𝑟_𝑓𝑟𝑎𝑚𝑒_𝑐𝑝𝑢
𝐹𝑎𝑐𝑒 𝑑𝑒𝑡𝑒𝑐𝑡 𝑝𝑟𝑖𝑣𝑎𝑡𝑒 𝑂𝐶𝐿 =1000
𝑀6
Where:
𝑀6
= 𝑑𝑏𝑔_𝑝𝑐𝑚10_𝑐ℎ𝑎𝑡_𝑒𝑛𝑐𝑜𝑑𝑒_𝑝𝑟𝑖𝑣𝑎𝑡𝑒_𝑓𝑎𝑐𝑒𝑑𝑒𝑡𝑒𝑐𝑡_𝑎𝑣𝑒𝑟𝑎𝑔𝑒_𝑡𝑖𝑚𝑒_𝑝𝑒𝑟_𝑓𝑟𝑎𝑚𝑒_𝑜𝑐𝑙
Group call scenario
In the group call scenario, the call has four participants and the video
resolution is 1920 × 1080 at 30 FPS. The workload measures the frame rate
of the video call.
𝑃𝑙𝑎𝑦𝑏𝑎𝑐𝑘 𝑔𝑟𝑜𝑢𝑝 𝐶𝑃𝑈 = 𝑔𝑒𝑜𝑚𝑒𝑎𝑛(𝑀7, 𝑀8 , 𝑀9)
Where:
𝑀7 = 𝑑𝑏𝑔_𝑝𝑐𝑚10_𝑐ℎ𝑎𝑡_𝑝𝑙𝑎𝑦_𝑝𝑟𝑖𝑣𝑎𝑡𝑒_𝑎𝑣𝑒𝑟𝑎𝑔𝑒_𝑓𝑟𝑎𝑚𝑒_𝑟𝑎𝑡𝑒_𝑐𝑝𝑢_𝑝1
𝑀8 = 𝑑𝑏𝑔_𝑝𝑐𝑚10_𝑐ℎ𝑎𝑡_𝑝𝑙𝑎𝑦_𝑝𝑟𝑖𝑣𝑎𝑡𝑒_𝑎𝑣𝑒𝑟𝑎𝑔𝑒_𝑓𝑟𝑎𝑚𝑒_𝑟𝑎𝑡𝑒_𝑐𝑝𝑢_𝑝2
𝑀9 = 𝑑𝑏𝑔_𝑝𝑐𝑚10_𝑐ℎ𝑎𝑡_𝑝𝑙𝑎𝑦_𝑝𝑟𝑖𝑣𝑎𝑡𝑒_𝑎𝑣𝑒𝑟𝑎𝑔𝑒_𝑓𝑟𝑎𝑚𝑒_𝑟𝑎𝑡𝑒_𝑐𝑝𝑢_𝑝3
𝑃𝑙𝑎𝑦𝑏𝑎𝑐𝑘 𝑔𝑟𝑜𝑢𝑝 𝑂𝐶𝐿 = 𝑔𝑒𝑜𝑚𝑒𝑎𝑛(𝑀10, 𝑀11 , 𝑀12)
Where:
𝑀10 = 𝑑𝑏𝑔_𝑝𝑐𝑚10_𝑐ℎ𝑎𝑡_𝑝𝑙𝑎𝑦_𝑔𝑟𝑜𝑢𝑝_𝑎𝑣𝑒𝑟𝑎𝑔𝑒_𝑓𝑟𝑎𝑚𝑒_𝑟𝑎𝑡𝑒_𝑐𝑝𝑢_𝑝1
𝑀11 = 𝑑𝑏𝑔_𝑝𝑐𝑚10_𝑐ℎ𝑎𝑡_𝑝𝑙𝑎𝑦_𝑔𝑟𝑜𝑢𝑝_𝑎𝑣𝑒𝑟𝑎𝑔𝑒_𝑓𝑟𝑎𝑚𝑒_𝑟𝑎𝑡𝑒_𝑐𝑝𝑢_𝑝2
𝑀12 = 𝑑𝑏𝑔_𝑝𝑐𝑚10_𝑐ℎ𝑎𝑡_𝑝𝑙𝑎𝑦_𝑔𝑟𝑜𝑢𝑝_𝑎𝑣𝑒𝑟𝑎𝑔𝑒_𝑓𝑟𝑎𝑚𝑒_𝑟𝑎𝑡𝑒_𝑐𝑝𝑢_𝑝3
𝐸𝑛𝑐𝑜𝑑𝑒 𝑔𝑟𝑜𝑢𝑝 𝑂𝐶𝐿 =𝑀13
𝑀14
Where:
𝑀13 = 𝑑𝑏𝑔_𝑝𝑐𝑚10_𝑐ℎ𝑎𝑡_𝑒𝑛𝑐𝑜𝑑𝑒_𝑔𝑟𝑜𝑢𝑝_𝑠𝑖𝑛𝑘_𝑓𝑟𝑎𝑚𝑒𝑠_𝑜𝑐𝑙
𝑀14 = 𝑑𝑏𝑔_𝑝𝑐𝑚10_𝑐ℎ𝑎𝑡_𝑒𝑛𝑐𝑜𝑑𝑒_𝑔𝑟𝑜𝑢𝑝_𝑒𝑙𝑎𝑝𝑠𝑒𝑑_𝑜𝑐𝑙
Page 39 of 82
𝐹𝑎𝑐𝑒 𝑑𝑒𝑡𝑒𝑐𝑡 𝑔𝑟𝑜𝑢𝑝 𝐶𝑃𝑈 =1000
𝑀15
Where:
𝑀15
= 𝑑𝑏𝑔_𝑝𝑐𝑚10_𝑐ℎ𝑎𝑡_𝑒𝑛𝑐𝑜𝑑𝑒_𝑔𝑟𝑜𝑢𝑝_𝑓𝑎𝑐𝑒𝑑𝑒𝑡𝑒𝑐𝑡_𝑎𝑣𝑒𝑟𝑎𝑔𝑒_𝑡𝑖𝑚𝑒_𝑝𝑒𝑟_𝑓𝑟𝑎𝑚𝑒_𝑐𝑝𝑢
𝐹𝑎𝑐𝑒 𝑑𝑒𝑡𝑒𝑐𝑡 𝑔𝑟𝑜𝑢𝑝 𝑂𝐶𝐿 =1000
𝑀16
Where:
𝑀16
= 𝑑𝑏𝑔_𝑝𝑐𝑚10_𝑐ℎ𝑎𝑡_𝑒𝑛𝑐𝑜𝑑𝑒_𝑔𝑟𝑜𝑢𝑝_𝑓𝑎𝑐𝑒𝑑𝑒𝑡𝑒𝑐𝑡_𝑎𝑣𝑒𝑟𝑎𝑔𝑒_𝑡𝑖𝑚𝑒_𝑝𝑒𝑟_𝑓𝑟𝑎𝑚𝑒_𝑜𝑐𝑙
Scoring
The Video Conferencing score formula uses a geomean of the workloads to
calculate the overall score.
𝑉𝑖𝑑𝑒𝑜 𝐶𝑜𝑛𝑓𝑒𝑟𝑒𝑛𝑐𝑖𝑛𝑔 𝑠𝑐𝑜𝑟𝑒 = 𝐾 ∗ 𝑔𝑒𝑜𝑚𝑒𝑎𝑛(𝑅1, 𝑅2∗, 𝑅3)
*The geometric mean weight of 𝑅2 is 2.
Where:
𝐾 = 𝑠𝑐𝑜𝑟𝑖𝑛𝑔 𝑐𝑜𝑒𝑓𝑓𝑖𝑐𝑖𝑒𝑛𝑡 = 275
𝑅1 = 𝑂𝑣𝑒𝑟𝑎𝑙𝑙 𝑝𝑙𝑎𝑦𝑏𝑎𝑐𝑘 𝑟𝑎𝑡𝑒 = 𝑔𝑒𝑜𝑚𝑒𝑎𝑛(𝐴1, 𝐴2, 𝐴3,𝐴4 )
𝑅2 = 𝑂𝑣𝑒𝑟𝑎𝑙𝑙 𝑒𝑛𝑐𝑜𝑑𝑒 𝑟𝑎𝑡𝑒 = 𝑔𝑒𝑜𝑚𝑒𝑎𝑛(𝐴5, 𝐴6 )
𝑅3 = 𝑂𝑣𝑒𝑟𝑎𝑙𝑙 𝑓𝑎𝑐𝑒 𝑑𝑒𝑡𝑒𝑐𝑡 𝑟𝑎𝑡𝑒 = 𝑔𝑒𝑜𝑚𝑒𝑎𝑛(𝐴7, 𝐴8 , 𝐴9, 𝐴10 )
Where:
RESULT DEFINITION UNIT TYPICAL RANGE
𝐴1 Playback private CPU FPS 30
𝐴2 Playback private OCL FPS 30
𝐴3 Playback group CPU FPS 30
𝐴4 Playback group OCL FPS 30
Page 40 of 82
RESULT DEFINITION UNIT TYPICAL RANGE
𝐴5 Encode private OCL FPS 22-30
𝐴6 Encode group OCL FPS 15-23
𝐴7 Face detect private
CPU FPS 30-71
𝐴8 Face detect private
OCL FPS 51-97
𝐴9 Face detect group CPU FPS 5.6-13
𝐴10 Face detect group OCL FPS 11-31

Page 41 of 82
PRODUCTIVITY TEST GROUP
Productivity test group tests office productivity application performance. It
includes the following tests:
1. Writing
2. Spreadsheets
Page 42 of 82
WRITING
The Writing test models common use cases with text processing
applications.
Implementation
The test uses LibreOffice Writer application and is implemented using
AutoIt3 scripts.
In the copy and cut tests, the operation is repeated ten times to reduce
random error. The secondary scores described in the Workload sub-
chapter are then based on the geometric mean of the ten repeats.
Workloads
The Writing test simulates the work with documents. The workloads
performs the following tasks:
1. Load Document 1, display in a window
2. Load Document 2, display in a window
3. Copy a large part of Document 1 and paste into Document 2
4. Save As with Document 2
5. Resize Document 2 window
6. Cut and paste parts of Document 2 around within the document
7. Save Document 2
8. Type some text in Document 2
9. Save Document 2
10. Insert some pictures from a local drive in Document 2
11. Save Document 2
The workloads measure the time it takes to load the documents, save the
file, add pictures, and edit the document.
𝐿𝑜𝑎𝑑 𝑑𝑜𝑐𝑢𝑚𝑒𝑛𝑡 = 𝑔𝑒𝑜𝑚𝑒𝑎𝑛(𝑀1, 𝑀2 )
Where:
𝑀1 = 𝑑𝑏𝑔_𝑝𝑐𝑚10_𝑤𝑟𝑖𝑡𝑖𝑛𝑔_𝑑𝑖𝑠𝑝𝑙𝑎𝑦_𝑑𝑜𝑐𝑢𝑚𝑒𝑛𝑡_𝑠𝑜𝑢𝑟𝑐𝑒
𝑀2 = 𝑑𝑏𝑔_𝑝𝑐𝑚10_𝑤𝑟𝑖𝑡𝑖𝑛𝑔_𝑑𝑖𝑠𝑝𝑙𝑎𝑦_𝑑𝑜𝑐𝑢𝑚𝑒𝑛𝑡_𝑑𝑒𝑠𝑡𝑖𝑛𝑎𝑡𝑖𝑜𝑛
𝑆𝑎𝑣𝑒 𝑑𝑜𝑐𝑢𝑚𝑒𝑛𝑡 = 𝑔𝑒𝑜𝑚𝑒𝑎𝑛(𝑀3, 𝑀4 , 𝑀5, 𝑀6)
Where:
Page 43 of 82
𝑀3 = 𝑑𝑏𝑔_𝑝𝑐𝑚10_𝑤𝑟𝑖𝑡𝑖𝑛𝑔_𝑠𝑎𝑣𝑒_𝑑𝑜𝑐𝑢𝑚𝑒𝑛𝑡_𝑎𝑠
𝑀4 = 𝑑𝑏𝑔_𝑝𝑐𝑚10_𝑤𝑟𝑖𝑡𝑖𝑛𝑔_𝑠𝑎𝑣𝑒_𝑑𝑜𝑐𝑢𝑚𝑒𝑛𝑡_1
𝑀5 = 𝑑𝑏𝑔_𝑝𝑐𝑚10_𝑤𝑟𝑖𝑡𝑖𝑛𝑔_𝑠𝑎𝑣𝑒_𝑑𝑜𝑐𝑢𝑚𝑒𝑛𝑡_2
𝑀6 = 𝑑𝑏𝑔_𝑝𝑐𝑚10_𝑤𝑟𝑖𝑡𝑖𝑛𝑔_𝑠𝑎𝑣𝑒_𝑑𝑜𝑐𝑢𝑚𝑒𝑛𝑡_3
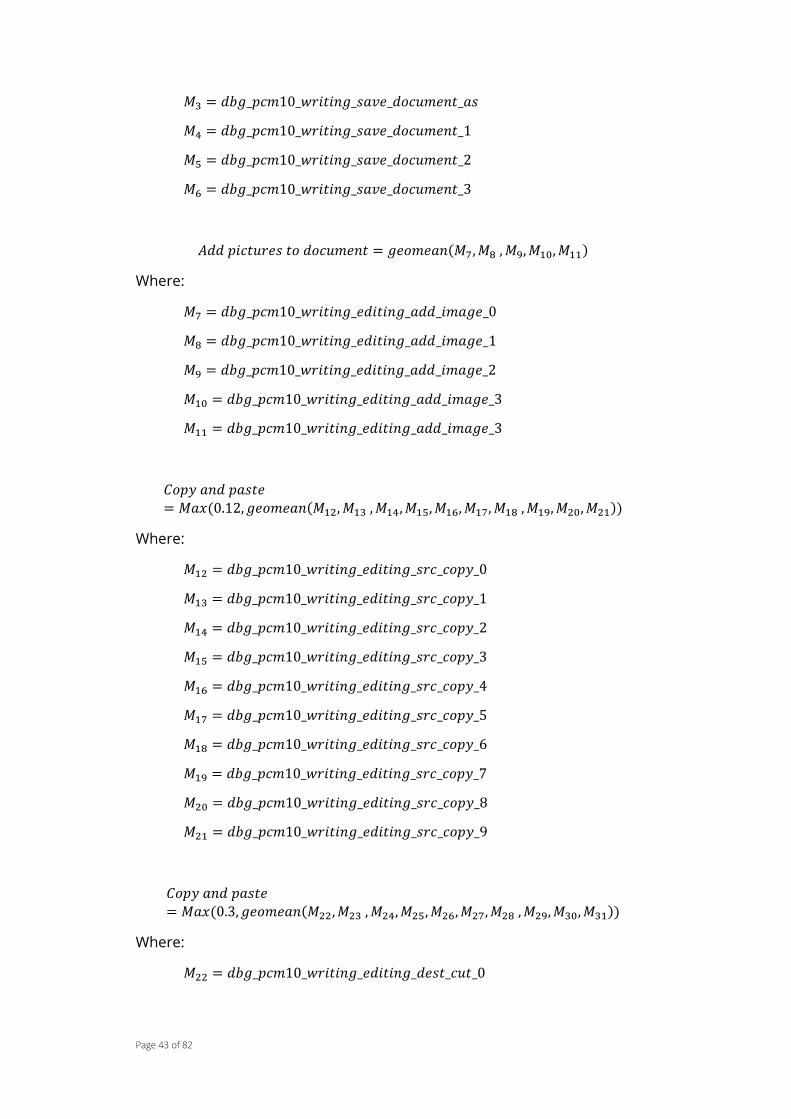
𝐴𝑑𝑑 𝑝𝑖𝑐𝑡𝑢𝑟𝑒𝑠 𝑡𝑜 𝑑𝑜𝑐𝑢𝑚𝑒𝑛𝑡 = 𝑔𝑒𝑜𝑚𝑒𝑎𝑛(𝑀7, 𝑀8 , 𝑀9, 𝑀10, 𝑀11)
Where:
𝑀7 = 𝑑𝑏𝑔_𝑝𝑐𝑚10_𝑤𝑟𝑖𝑡𝑖𝑛𝑔_𝑒𝑑𝑖𝑡𝑖𝑛𝑔_𝑎𝑑𝑑_𝑖𝑚𝑎𝑔𝑒_0
𝑀8 = 𝑑𝑏𝑔_𝑝𝑐𝑚10_𝑤𝑟𝑖𝑡𝑖𝑛𝑔_𝑒𝑑𝑖𝑡𝑖𝑛𝑔_𝑎𝑑𝑑_𝑖𝑚𝑎𝑔𝑒_1
𝑀9 = 𝑑𝑏𝑔_𝑝𝑐𝑚10_𝑤𝑟𝑖𝑡𝑖𝑛𝑔_𝑒𝑑𝑖𝑡𝑖𝑛𝑔_𝑎𝑑𝑑_𝑖𝑚𝑎𝑔𝑒_2
𝑀10 = 𝑑𝑏𝑔_𝑝𝑐𝑚10_𝑤𝑟𝑖𝑡𝑖𝑛𝑔_𝑒𝑑𝑖𝑡𝑖𝑛𝑔_𝑎𝑑𝑑_𝑖𝑚𝑎𝑔𝑒_3
𝑀11 = 𝑑𝑏𝑔_𝑝𝑐𝑚10_𝑤𝑟𝑖𝑡𝑖𝑛𝑔_𝑒𝑑𝑖𝑡𝑖𝑛𝑔_𝑎𝑑𝑑_𝑖𝑚𝑎𝑔𝑒_3
𝐶𝑜𝑝𝑦 𝑎𝑛𝑑 𝑝𝑎𝑠𝑡𝑒
= 𝑀𝑎𝑥(0.12, 𝑔𝑒𝑜𝑚𝑒𝑎𝑛(𝑀12, 𝑀13 , 𝑀14, 𝑀15, 𝑀16, 𝑀17, 𝑀18 , 𝑀19, 𝑀20, 𝑀21))
Where:
𝑀12 = 𝑑𝑏𝑔_𝑝𝑐𝑚10_𝑤𝑟𝑖𝑡𝑖𝑛𝑔_𝑒𝑑𝑖𝑡𝑖𝑛𝑔_𝑠𝑟𝑐_𝑐𝑜𝑝𝑦_0
𝑀13 = 𝑑𝑏𝑔_𝑝𝑐𝑚10_𝑤𝑟𝑖𝑡𝑖𝑛𝑔_𝑒𝑑𝑖𝑡𝑖𝑛𝑔_𝑠𝑟𝑐_𝑐𝑜𝑝𝑦_1
𝑀14 = 𝑑𝑏𝑔_𝑝𝑐𝑚10_𝑤𝑟𝑖𝑡𝑖𝑛𝑔_𝑒𝑑𝑖𝑡𝑖𝑛𝑔_𝑠𝑟𝑐_𝑐𝑜𝑝𝑦_2
𝑀15 = 𝑑𝑏𝑔_𝑝𝑐𝑚10_𝑤𝑟𝑖𝑡𝑖𝑛𝑔_𝑒𝑑𝑖𝑡𝑖𝑛𝑔_𝑠𝑟𝑐_𝑐𝑜𝑝𝑦_3
𝑀16 = 𝑑𝑏𝑔_𝑝𝑐𝑚10_𝑤𝑟𝑖𝑡𝑖𝑛𝑔_𝑒𝑑𝑖𝑡𝑖𝑛𝑔_𝑠𝑟𝑐_𝑐𝑜𝑝𝑦_4
𝑀17 = 𝑑𝑏𝑔_𝑝𝑐𝑚10_𝑤𝑟𝑖𝑡𝑖𝑛𝑔_𝑒𝑑𝑖𝑡𝑖𝑛𝑔_𝑠𝑟𝑐_𝑐𝑜𝑝𝑦_5
𝑀18 = 𝑑𝑏𝑔_𝑝𝑐𝑚10_𝑤𝑟𝑖𝑡𝑖𝑛𝑔_𝑒𝑑𝑖𝑡𝑖𝑛𝑔_𝑠𝑟𝑐_𝑐𝑜𝑝𝑦_6
𝑀19 = 𝑑𝑏𝑔_𝑝𝑐𝑚10_𝑤𝑟𝑖𝑡𝑖𝑛𝑔_𝑒𝑑𝑖𝑡𝑖𝑛𝑔_𝑠𝑟𝑐_𝑐𝑜𝑝𝑦_7
𝑀20 = 𝑑𝑏𝑔_𝑝𝑐𝑚10_𝑤𝑟𝑖𝑡𝑖𝑛𝑔_𝑒𝑑𝑖𝑡𝑖𝑛𝑔_𝑠𝑟𝑐_𝑐𝑜𝑝𝑦_8
𝑀21 = 𝑑𝑏𝑔_𝑝𝑐𝑚10_𝑤𝑟𝑖𝑡𝑖𝑛𝑔_𝑒𝑑𝑖𝑡𝑖𝑛𝑔_𝑠𝑟𝑐_𝑐𝑜𝑝𝑦_9
𝐶𝑜𝑝𝑦 𝑎𝑛𝑑 𝑝𝑎𝑠𝑡𝑒= 𝑀𝑎𝑥(0.3, 𝑔𝑒𝑜𝑚𝑒𝑎𝑛(𝑀22, 𝑀23 , 𝑀24, 𝑀25, 𝑀26, 𝑀27, 𝑀28 , 𝑀29, 𝑀30, 𝑀31))
Where:
𝑀22 = 𝑑𝑏𝑔_𝑝𝑐𝑚10_𝑤𝑟𝑖𝑡𝑖𝑛𝑔_𝑒𝑑𝑖𝑡𝑖𝑛𝑔_𝑑𝑒𝑠𝑡_𝑐𝑢𝑡_0

Page 44 of 82
𝑀23 = 𝑑𝑏𝑔_𝑝𝑐𝑚10_𝑤𝑟𝑖𝑡𝑖𝑛𝑔_𝑒𝑑𝑖𝑡𝑖𝑛𝑔_𝑑𝑒𝑠𝑡_𝑐𝑢𝑡_1
𝑀24 = 𝑑𝑏𝑔_𝑝𝑐𝑚10_𝑤𝑟𝑖𝑡𝑖𝑛𝑔_𝑒𝑑𝑖𝑡𝑖𝑛𝑔_𝑑𝑒𝑠𝑡_𝑐𝑢𝑡_2
𝑀25 = 𝑑𝑏𝑔_𝑝𝑐𝑚10_𝑤𝑟𝑖𝑡𝑖𝑛𝑔_𝑒𝑑𝑖𝑡𝑖𝑛𝑔_𝑑𝑒𝑠𝑡_𝑐𝑢𝑡_3
𝑀26 = 𝑑𝑏𝑔_𝑝𝑐𝑚10_𝑤𝑟𝑖𝑡𝑖𝑛𝑔_𝑒𝑑𝑖𝑡𝑖𝑛𝑔_𝑑𝑒𝑠𝑡_𝑐𝑢𝑡_4
𝑀27 = 𝑑𝑏𝑔_𝑝𝑐𝑚10_𝑤𝑟𝑖𝑡𝑖𝑛𝑔_𝑒𝑑𝑖𝑡𝑖𝑛𝑔_𝑑𝑒𝑠𝑡_𝑐𝑢𝑡_5
𝑀28 = 𝑑𝑏𝑔_𝑝𝑐𝑚10_𝑤𝑟𝑖𝑡𝑖𝑛𝑔_𝑒𝑑𝑖𝑡𝑖𝑛𝑔_𝑑𝑒𝑠𝑡_𝑐𝑢𝑡_6
𝑀29 = 𝑑𝑏𝑔_𝑝𝑐𝑚10_𝑤𝑟𝑖𝑡𝑖𝑛𝑔_𝑒𝑑𝑖𝑡𝑖𝑛𝑔_𝑑𝑒𝑠𝑡_𝑐𝑢𝑡_7
𝑀30 = 𝑑𝑏𝑔_𝑝𝑐𝑚10_𝑤𝑟𝑖𝑡𝑖𝑛𝑔_𝑒𝑑𝑖𝑡𝑖𝑛𝑔_𝑑𝑒𝑠𝑡_𝑐𝑢𝑡_8
𝑀31 = 𝑑𝑏𝑔_𝑝𝑐𝑚10_𝑤𝑟𝑖𝑡𝑖𝑛𝑔_𝑒𝑑𝑖𝑡𝑖𝑛𝑔_𝑑𝑒𝑠𝑡_𝑐𝑢𝑡_9
Scoring
The Writing test score formula uses a geomean of the workloads to
calculate the overall score.
𝑊𝑟𝑖𝑡𝑖𝑛𝑔 𝑠𝑐𝑜𝑟𝑒 = 𝐾 ∗ 1
𝑔𝑒𝑜𝑚𝑒𝑎𝑛(𝑅1, 𝑅2, 𝑅3, 𝑅4)
Where:
𝑅3 = 𝑂𝑣𝑒𝑟𝑎𝑙𝑙 𝑐𝑜𝑝𝑦 𝑎𝑛𝑑 𝑐𝑢𝑡 = 𝑔𝑒𝑜𝑚𝑒𝑎𝑛(𝑅5, 𝑅6)
Where:
𝐾 = 𝑠𝑐𝑜𝑟𝑖𝑛𝑔 𝑐𝑜𝑒𝑓𝑓𝑖𝑐𝑖𝑒𝑛𝑡 = 4093
RESULT DEFINITION UNIT TYPICAL RANGE
𝑅1 Load document s 0.9-1.6
𝑅2 Save document s 0.86-1.8
𝑅4 Add pictures to document s 0.52-0.74
𝑅5 Copy and paste s 0.12-0.28
𝑅6 Cut and paste s 0.30-0.85

Page 45 of 82
SPREADSHEETS
The Spreadsheets test models use cases for a spreadsheet application. The
use of spreadsheets is very varied, ranging from writing simple shopping
lists to processing massive data sheets. We model uses in two distinct
categories: common use and power use.
Implementation
The Spreadsheets test uses a build of LibreOffice Calc
(http://www.libreoffice.org) that ships with the benchmark. The application
is scripted to execute tasks like document loading, saving, editing data,
editing formulas and calculating.
The Spreadsheets test supports OpenCL. The benchmark application
selects a preferred OpenCL device to use.
The Spreadsheets test is implemented using AutoIt3 scripts.
Part 1: overall application usage
Stage 1:
Code path: x86/x64
Test sheet:
The test used is similar to the spreadsheet test in PCMark 8.
Compute load scaled down considerably to get consistent
runtimes also on low end systems.
Part 2: calculation
The test sheets used are available in the LibreOffice repository:
https://gerrit.libreoffice.org/gitweb?p=benchmark.git;a=tree
Stage 2 - CPU:
Code path: x86/x64
Test sheets:
Building Design
Stock History
Stage 2 - OpenCL
Code path: OpenCL
Test sheets:
Energy market in different countries
Monte Carlo Black Scholes option pricing
Page 46 of 82
PCMark 10 uses several test sheets that contain data for the following
scenarios:
Comparing different forms of energy based on consumption and
the impact of one form of energy on the rest of the forms.
Computation of Envelope Thermal Transfer Value for building
designs to assess the thermal performance and energy
conservation design factors.
Computing short-term fluctuations of stock values and
highlighting long-term trends to guide investors.
Calculation of theoretical call and put price using key
determinants of an option’s price: stock price, strike price,
volatility, time to expiration, and short-term interest rate.
Workloads
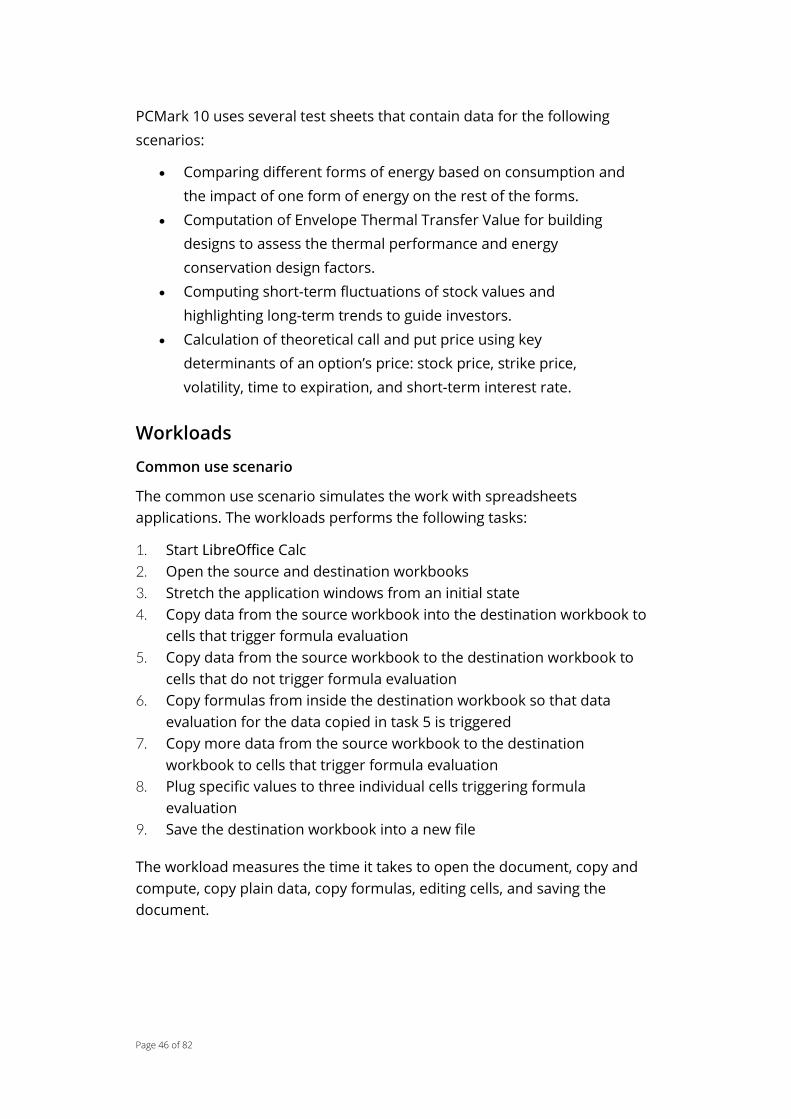
Common use scenario
The common use scenario simulates the work with spreadsheets
applications. The workloads performs the following tasks:
1. Start LibreOffice Calc
2. Open the source and destination workbooks
3. Stretch the application windows from an initial state
4. Copy data from the source workbook into the destination workbook to
cells that trigger formula evaluation
5. Copy data from the source workbook to the destination workbook to
cells that do not trigger formula evaluation
6. Copy formulas from inside the destination workbook so that data
evaluation for the data copied in task 5 is triggered
7. Copy more data from the source workbook to the destination
workbook to cells that trigger formula evaluation
8. Plug specific values to three individual cells triggering formula
evaluation
9. Save the destination workbook into a new file
The workload measures the time it takes to open the document, copy and
compute, copy plain data, copy formulas, editing cells, and saving the
document.

Page 47 of 82
Power use scenario
The power use scenario simulates the work with more complex
spreadsheets in a spreadsheet application. The workloads performs the
following tasks:
1. Load sheets with advanced formulas and big data sets
2. Recalculate data
The workload measures the time it takes to load the documents and
recalculate the data.
Scoring
The Spreadsheets test score formula uses a geomean of the workloads to
calculate the overall score.
𝑆𝑝𝑟𝑒𝑎𝑑𝑠ℎ𝑒𝑒𝑡 𝑠𝑐𝑜𝑟𝑒 = 𝐾 ∗ 1
𝑔𝑒𝑜𝑚𝑒𝑎𝑛(𝑅1, 𝑅2)
Where:
𝐾 = 𝑠𝑐𝑜𝑟𝑖𝑛𝑔 𝑐𝑜𝑒𝑓𝑓𝑖𝑐𝑖𝑒𝑛𝑡 = 11159
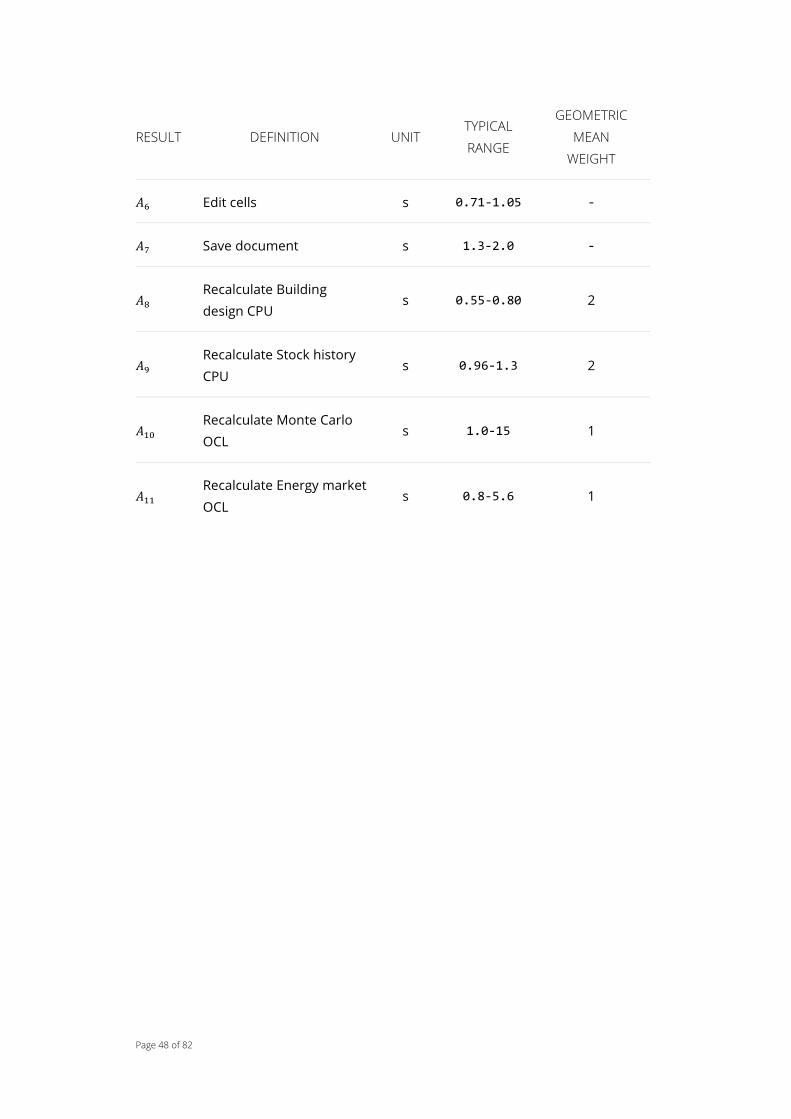
𝑅1 = 𝑂𝑣𝑒𝑟𝑎𝑙𝑙 𝑐𝑜𝑚𝑚𝑜𝑛 𝑢𝑠𝑒 = 𝑔𝑒𝑜𝑚𝑒𝑎𝑛(𝐴1, 𝐴2, 𝐴3,𝐴4 , 𝐴5, 𝐴6 , 𝐴7 )
𝑅2 = 𝑂𝑣𝑒𝑟𝑎𝑙𝑙 𝑝𝑜𝑤𝑒𝑟 𝑢𝑠𝑒 = 𝑤𝑒𝑖𝑔ℎ𝑡𝑒𝑑 𝑔𝑒𝑜𝑚𝑒𝑎𝑛(𝐴8∗ , 𝐴9
∗ , 𝐴10 , 𝐴11 )
*The geometric mean weight is specified in the table below.
RESULT DEFINITION UNIT TYPICAL
RANGE
GEOMETRIC
MEAN
WEIGHT
𝐴1 Open document s 1.2-1.7
𝐴2 Copy data and compute s 1.5-2.0 -
𝐴3 Copy plain data s 2.0-2.6 -
𝐴4 Copy formulas s 0.74-0.89 -
𝐴5 Copy data and compute 2 s 2.5-3.3 -
Page 48 of 82
RESULT DEFINITION UNIT TYPICAL
RANGE
GEOMETRIC
MEAN
WEIGHT
𝐴6 Edit cells s 0.71-1.05 -
𝐴7 Save document s 1.3-2.0 -
𝐴8 Recalculate Building
design CPU s 0.55-0.80 2
𝐴9 Recalculate Stock history
CPU s 0.96-1.3 2
𝐴10 Recalculate Monte Carlo
OCL s 1.0-15 1
𝐴11 Recalculate Energy market
OCL s 0.8-5.6 1

Page 49 of 82
DIGITAL CONTENT CREATION TEST
GROUP
Digital Content Creation test group tests performance in video, photo and
3D content creation. It includes the following tests:
1. Photo Editing
2. Video Editing
3. Rendering and Visualization
Page 50 of 82
PHOTO EDITING
The Photo Editing test models use cases with photo editing application.
Implementation
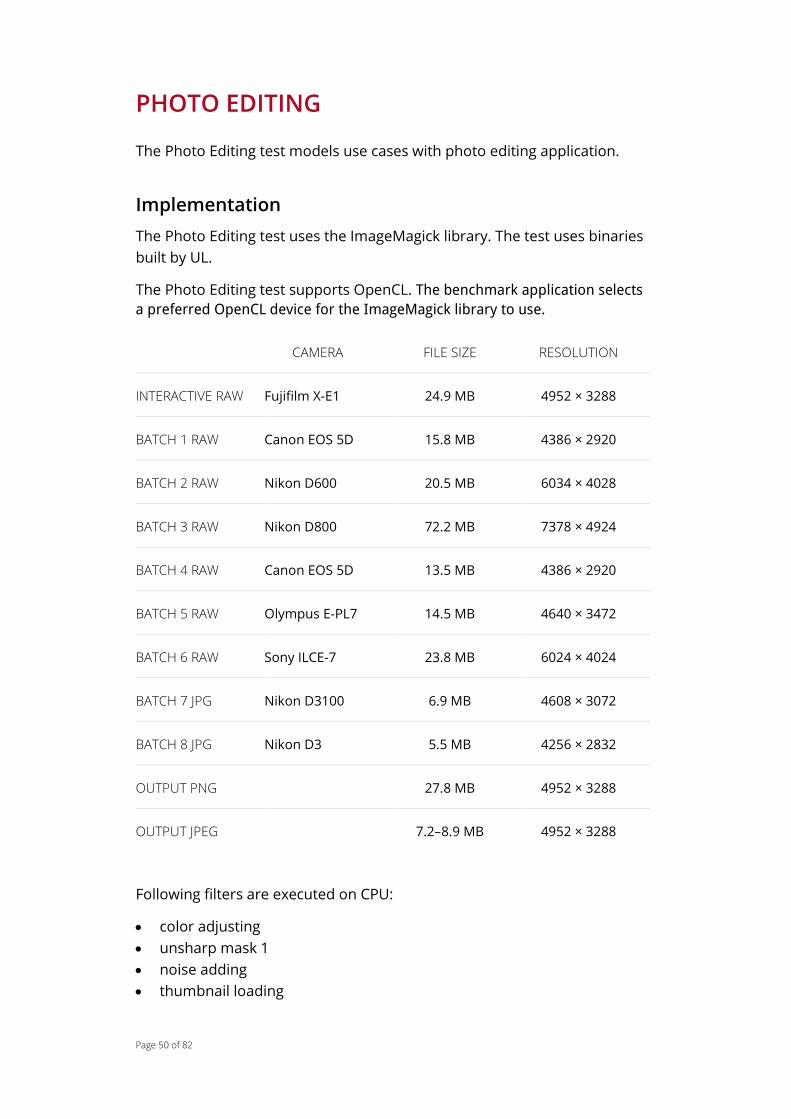
The Photo Editing test uses the ImageMagick library. The test uses binaries
built by UL.
The Photo Editing test supports OpenCL. The benchmark application selects
a preferred OpenCL device for the ImageMagick library to use.
CAMERA FILE SIZE RESOLUTION
INTERACTIVE RAW Fujifilm X-E1 24.9 MB 4952 × 3288
BATCH 1 RAW Canon EOS 5D 15.8 MB 4386 × 2920
BATCH 2 RAW Nikon D600 20.5 MB 6034 × 4028
BATCH 3 RAW Nikon D800 72.2 MB 7378 × 4924
BATCH 4 RAW Canon EOS 5D 13.5 MB 4386 × 2920
BATCH 5 RAW Olympus E-PL7 14.5 MB 4640 × 3472
BATCH 6 RAW Sony ILCE-7 23.8 MB 6024 × 4024
BATCH 7 JPG Nikon D3100 6.9 MB 4608 × 3072
BATCH 8 JPG Nikon D3 5.5 MB 4256 × 2832
OUTPUT PNG 27.8 MB 4952 × 3288
OUTPUT JPEG 7.2–8.9 MB 4952 × 3288
Following filters are executed on CPU:
color adjusting
unsharp mask 1
noise adding
thumbnail loading

Page 51 of 82
Following filters are executed on OCL:
gaussian blur
unsharp mask 2
local contrast
wavelet denoise
batch transformation
Workloads
Interactive scenario
The interactive use scenario simulates editing a photo in an image
manipulation program. The workloads performs the following tasks:
1. Load and display a source image into the adjustment view. 2. Apply brightness, contrast, saturation, unsharp mask, Gaussian noise,
Gaussian blur, a further unsharp mask, local contrast and wavelet denoise to the source image via sliders in the user interface and display the resulting image in the adjustment view. Each slider is moved 2-5 times, depending on the operation. After each filtering pass constituting a secondary result, each image is saved on disk in JPEG and PNG formats.
The workload measures the time it takes to load images, apply filters and
save the images in each format.
𝐶𝑜𝑙𝑜𝑟 𝑎𝑑𝑗𝑢𝑠𝑡𝑖𝑛𝑔 𝐶𝑃𝑈 = 𝑀3 + 𝑀4 + 𝑀5 + 𝑀6 + 𝑀7
Where:
𝑀3 = 𝐵𝑟𝑖𝑔ℎ𝑡𝑛𝑒𝑠𝑠𝐶𝑜𝑛𝑡𝑟𝑎𝑠𝑡𝐼𝑚𝑎𝑔𝑒(𝑏𝑟𝑖𝑔ℎ𝑡𝑛𝑒𝑠𝑠 1 − 9, 3 𝑠𝑡𝑒𝑝)
𝑀4 = 𝐵𝑟𝑖𝑔ℎ𝑡𝑛𝑒𝑠𝑠𝐶𝑜𝑛𝑡𝑟𝑎𝑠𝑡𝐼𝑚𝑎𝑔𝑒(𝑏𝑟𝑖𝑔ℎ𝑡𝑛𝑒𝑠𝑠 8 − 1.77, 3 𝑠𝑡𝑒𝑝)
𝑀5 = 𝐵𝑟𝑖𝑔ℎ𝑡𝑛𝑒𝑠𝑠𝐶𝑜𝑛𝑡𝑟𝑎𝑠𝑡𝐼𝑚𝑎𝑔𝑒(𝑐𝑜𝑛𝑡𝑟𝑎𝑠𝑡 1 − 27.34, 4 𝑠𝑡𝑒𝑝)
𝑀6 = 𝑀𝑜𝑑𝑢𝑙𝑎𝑡𝑒𝐼𝑚𝑎𝑔𝑒(𝑠𝑎𝑡𝑢𝑟𝑎𝑡𝑖𝑜𝑛 101 − 99, 2 𝑠𝑡𝑒𝑝)
𝑀7 = 𝑀𝑜𝑑𝑢𝑙𝑎𝑡𝑒𝐼𝑚𝑎𝑔𝑒(𝑠𝑎𝑡𝑢𝑟𝑎𝑡𝑖𝑜𝑛 101 − 112, 4 𝑠𝑡𝑒𝑝)
𝑁𝑜𝑖𝑠𝑒 𝑎𝑑𝑑𝑖𝑛𝑔 𝐶𝑃𝑈 = 𝑀8
Where:
𝑀8 = 𝐴𝑑𝑑𝑁𝑜𝑖𝑠𝑒𝐼𝑚𝑎𝑔𝑒(𝑛𝑜𝑖𝑠𝑡𝑦𝑝𝑒 𝐺𝑎𝑢𝑠𝑠𝑖𝑎𝑛𝑁𝑜𝑖𝑠𝑒)
𝐺𝑎𝑢𝑠𝑠𝑖𝑎𝑛 𝑏𝑙𝑢𝑟 𝑂𝐶𝐿 = 𝑀9 + 𝑀10

Page 52 of 82
Where:
𝑀9 = 𝐺𝑎𝑢𝑠𝑠𝑖𝑎𝑛𝐵𝑙𝑢𝑟𝐼𝑚𝑎𝑔𝑒(𝑟𝑎𝑑𝑖𝑢𝑠 2 − 0.3, 5 𝑠𝑡𝑒𝑝)
𝑀9 = 𝐺𝑎𝑢𝑠𝑠𝑖𝑎𝑛𝐵𝑙𝑢𝑟𝐼𝑚𝑎𝑔𝑒(𝑠𝑖𝑔𝑚𝑎 1 − 0.15, 5 𝑠𝑡𝑒𝑝)
𝐿𝑜𝑐𝑎𝑙 𝑐𝑜𝑛𝑡𝑟𝑎𝑠𝑡 𝑂𝐶𝐿 = 𝑀11 + 𝑀12
Where:
𝑀11 = 𝐿𝑜𝑐𝑎𝑙𝐶𝑜𝑛𝑡𝑟𝑎𝑠𝑡𝐼𝑚𝑎𝑔𝑒(𝑟𝑎𝑑𝑖𝑢𝑠 20 − 100, 5 𝑠𝑡𝑒𝑝)
𝑀12 = 𝐿𝑜𝑐𝑎𝑙𝐶𝑜𝑛𝑡𝑟𝑎𝑠𝑡𝐼𝑚𝑎𝑔𝑒(𝑎𝑚𝑜𝑢𝑛𝑡 25 − 75, 5 𝑠𝑡𝑒𝑝)
𝑊𝑎𝑣𝑒𝑙𝑒𝑡 𝑑𝑒𝑛𝑜𝑖𝑠𝑒 𝑂𝐶𝐿 = 𝑀13
Where:
𝑀13 = 𝑊𝑎𝑣𝑒𝑙𝑒𝑡𝐷𝑒𝑛𝑜𝑖𝑠𝑒𝐼𝑚𝑎𝑔𝑒(𝑡ℎ𝑟𝑒𝑠ℎ𝑜𝑙𝑑 1 − 10, 5 𝑠𝑡𝑒𝑝)
𝑈𝑛𝑠ℎ𝑎𝑟𝑝 𝑚𝑎𝑠𝑘 1 𝐶𝑃𝑈 = 𝑀14 + 𝑀15 + 𝑀16 + 𝑀17
Where:
𝑀14 = 𝑈𝑛𝑠ℎ𝑎𝑟𝑝𝑀𝑎𝑠𝑘𝐼𝑚𝑎𝑔𝑒(𝑟𝑎𝑑𝑖𝑢𝑠 1 − 8, 5 𝑠𝑡𝑒𝑝)
𝑀15 = 𝑈𝑛𝑠ℎ𝑎𝑟𝑝𝑀𝑎𝑠𝑘𝐼𝑚𝑎𝑔𝑒(𝑠𝑖𝑔𝑚𝑎 1 − 4, 5 𝑠𝑡𝑒𝑝)
𝑀16 = 𝑈𝑛𝑠ℎ𝑎𝑟𝑝𝑀𝑎𝑠𝑘𝐼𝑚𝑎𝑔𝑒(𝑎𝑚𝑜𝑢𝑛𝑡 99 − 32, 5 𝑠𝑡𝑒𝑝)
𝑀17 = 𝑈𝑛𝑠ℎ𝑎𝑟𝑝𝑀𝑎𝑠𝑘𝐼𝑚𝑎𝑔𝑒(𝑡ℎ𝑟𝑒𝑠ℎ𝑜𝑙𝑑 0.2 − 3, 5 𝑠𝑡𝑒𝑝)
𝑈𝑛𝑠ℎ𝑎𝑟𝑝 𝑚𝑎𝑠𝑘 2 𝑂𝐶𝐿 = 𝑀18 + 𝑀19 + 𝑀20 + 𝑀21
Where:
𝑀18 = 𝑈𝑛𝑠ℎ𝑎𝑟𝑝𝑀𝑎𝑠𝑘𝐼𝑚𝑎𝑔𝑒(𝑟𝑎𝑑𝑖𝑢𝑠 1 − 2.6, 5 𝑠𝑡𝑒𝑝)
𝑀19 = 𝑈𝑛𝑠ℎ𝑎𝑟𝑝𝑀𝑎𝑠𝑘𝐼𝑚𝑎𝑔𝑒(𝑠𝑖𝑔𝑚𝑎 1 − 1.3, 5 𝑠𝑡𝑒𝑝)
𝑀20 = 𝑈𝑛𝑠ℎ𝑎𝑟𝑝𝑀𝑎𝑠𝑘𝐼𝑚𝑎𝑔𝑒(𝑎𝑚𝑜𝑢𝑛𝑡 99 − 35, 5 𝑠𝑡𝑒𝑝)
𝑀21 = 𝑈𝑛𝑠ℎ𝑎𝑟𝑝𝑀𝑎𝑠𝑘𝐼𝑚𝑎𝑔𝑒(𝑡ℎ𝑟𝑒𝑠ℎ𝑜𝑙𝑑 1 − 2, 5 𝑠𝑡𝑒𝑝)
𝑆𝑎𝑣𝑒 𝑃𝑁𝐺 = 𝑀22
Where:
Page 53 of 82
𝑀22 = 𝑆𝑢𝑚 𝑜𝑓 𝑠𝑎𝑣𝑒 𝑡𝑖𝑚𝑒𝑠 𝑡𝑜 𝑝𝑛𝑔
𝑆𝑎𝑣𝑒 𝐽𝑃𝐸𝐺 = 𝑀23
Where:
𝑀23 = 𝑆𝑢𝑚 𝑜𝑓 𝑠𝑎𝑣𝑒 𝑡𝑖𝑚𝑒𝑠 𝑡𝑜 𝑗𝑝𝑒𝑔
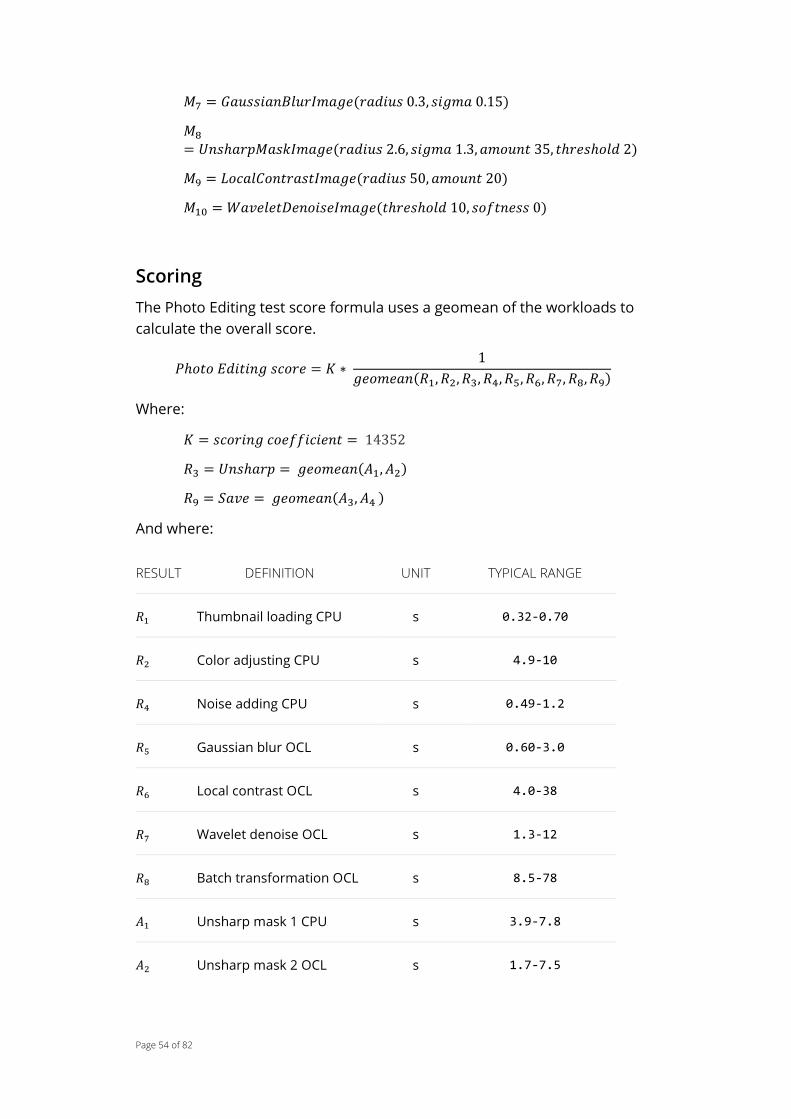
Batch processing scenario
The batch processing scenario simulates editing a group of photos in an
image manipulation program. The workloads performs the following tasks:
1. Load each thumbnails one at a time into a preview matrix 2. Apply brightness, contrast, saturation, unsharp mask, Gaussian noise,
Gaussian blur, a further unsharp mask, local contrast and wavelet denoise to all of the original images.
3. Continue to next image.
The workload measures the time it takes to load thumbnails, apply filters
and save the images in each format.
𝑇ℎ𝑢𝑚𝑏𝑛𝑎𝑖𝑙 𝑙𝑜𝑎𝑑𝑖𝑛𝑔 𝐶𝑃𝑈 = 𝑔𝑒𝑜𝑚𝑒𝑎𝑛(𝑀1, 𝑀2)
Where:
𝑀1 = 𝑔𝑒𝑜𝑚𝑒𝑎𝑛 𝑜𝑓 8 𝑖𝑚𝑎𝑔𝑒 𝑓𝑖𝑙𝑒 𝑙𝑜𝑎𝑑 𝑡𝑖𝑚𝑒𝑠
𝑀2 = 𝑔𝑒𝑜𝑚𝑒𝑎𝑛 𝑜𝑓 𝑡ℎ𝑒 𝑟𝑒𝑠𝑖𝑧𝑒 𝑡𝑖𝑚𝑒 𝑜𝑓 8 𝑖𝑚𝑎𝑔𝑒𝑠 𝑡𝑜 𝑎 𝑡ℎ𝑢𝑚𝑏𝑛𝑎𝑖𝑙
And where:
The load time of the files is the following measurement:
dbg_photo_load_cpu.
The resize time of the files is the following measurement:
dbg_photo_resize_cpu.
𝐵𝑎𝑡𝑐ℎ 𝑡𝑟𝑎𝑛𝑠𝑓𝑜𝑟𝑚𝑎𝑡𝑖𝑜𝑛 𝑂𝐶𝐿 = 𝑀3 + 𝑀4 + 𝑀5 + 𝑀6 + 𝑀7 + 𝑀8 + 𝑀9 + 𝑀10
Where:
𝑀3 = 𝐵𝑟𝑖𝑔ℎ𝑡𝑛𝑒𝑠𝑠𝐶𝑜𝑛𝑡𝑟𝑎𝑠𝑡𝐼𝑚𝑎𝑔𝑒(𝑏𝑟𝑖𝑔ℎ𝑡𝑛𝑒𝑠𝑠 1.77, 𝑐𝑜𝑛𝑡𝑟𝑎𝑠𝑡 27.34) )
𝑀4 = 𝑀𝑜𝑑𝑢𝑙𝑎𝑡𝑒𝐼𝑚𝑎𝑔𝑒(𝑠𝑎𝑡𝑢𝑟𝑎𝑡𝑖𝑜𝑛 112)
𝑀5 = 𝑈𝑛𝑠ℎ𝑎𝑟𝑝𝑀𝑎𝑠𝑘𝐼𝑚𝑎𝑔𝑒(𝑟𝑎𝑑𝑖𝑢𝑠 8, 𝑠𝑖𝑔𝑚𝑎 4, 𝑎𝑚𝑜𝑢𝑛𝑡 32, 𝑡ℎ𝑟𝑒𝑠ℎ𝑜𝑙𝑑 3)
𝑀6 = 𝐴𝑑𝑑𝑁𝑜𝑖𝑠𝑒𝐼𝑚𝑎𝑔𝑒(𝑛𝑜𝑖𝑠𝑡𝑦𝑝𝑒 𝐺𝑎𝑢𝑠𝑠𝑖𝑎𝑛𝑁𝑜𝑖𝑠𝑒)
Page 54 of 82
𝑀7 = 𝐺𝑎𝑢𝑠𝑠𝑖𝑎𝑛𝐵𝑙𝑢𝑟𝐼𝑚𝑎𝑔𝑒(𝑟𝑎𝑑𝑖𝑢𝑠 0.3, 𝑠𝑖𝑔𝑚𝑎 0.15)
𝑀8
= 𝑈𝑛𝑠ℎ𝑎𝑟𝑝𝑀𝑎𝑠𝑘𝐼𝑚𝑎𝑔𝑒(𝑟𝑎𝑑𝑖𝑢𝑠 2.6, 𝑠𝑖𝑔𝑚𝑎 1.3, 𝑎𝑚𝑜𝑢𝑛𝑡 35, 𝑡ℎ𝑟𝑒𝑠ℎ𝑜𝑙𝑑 2)
𝑀9 = 𝐿𝑜𝑐𝑎𝑙𝐶𝑜𝑛𝑡𝑟𝑎𝑠𝑡𝐼𝑚𝑎𝑔𝑒(𝑟𝑎𝑑𝑖𝑢𝑠 50, 𝑎𝑚𝑜𝑢𝑛𝑡 20)
𝑀10 = 𝑊𝑎𝑣𝑒𝑙𝑒𝑡𝐷𝑒𝑛𝑜𝑖𝑠𝑒𝐼𝑚𝑎𝑔𝑒(𝑡ℎ𝑟𝑒𝑠ℎ𝑜𝑙𝑑 10, 𝑠𝑜𝑓𝑡𝑛𝑒𝑠𝑠 0)
Scoring
The Photo Editing test score formula uses a geomean of the workloads to
calculate the overall score.
𝑃ℎ𝑜𝑡𝑜 𝐸𝑑𝑖𝑡𝑖𝑛𝑔 𝑠𝑐𝑜𝑟𝑒 = 𝐾 ∗ 1
𝑔𝑒𝑜𝑚𝑒𝑎𝑛(𝑅1, 𝑅2, 𝑅3, 𝑅4, 𝑅5, 𝑅6, 𝑅7, 𝑅8, 𝑅9)
Where:
𝐾 = 𝑠𝑐𝑜𝑟𝑖𝑛𝑔 𝑐𝑜𝑒𝑓𝑓𝑖𝑐𝑖𝑒𝑛𝑡 = 14352
𝑅3 = 𝑈𝑛𝑠ℎ𝑎𝑟𝑝 = 𝑔𝑒𝑜𝑚𝑒𝑎𝑛(𝐴1, 𝐴2)
𝑅9 = 𝑆𝑎𝑣𝑒 = 𝑔𝑒𝑜𝑚𝑒𝑎𝑛(𝐴3, 𝐴4 )
And where:
RESULT DEFINITION UNIT TYPICAL RANGE
𝑅1 Thumbnail loading CPU s 0.32-0.70
𝑅2 Color adjusting CPU s 4.9-10
𝑅4 Noise adding CPU s 0.49-1.2
𝑅5 Gaussian blur OCL s 0.60-3.0
𝑅6 Local contrast OCL s 4.0-38
𝑅7 Wavelet denoise OCL s 1.3-12
𝑅8 Batch transformation OCL s 8.5-78
𝐴1 Unsharp mask 1 CPU s 3.9-7.8
𝐴2 Unsharp mask 2 OCL s 1.7-7.5

Page 55 of 82
RESULT DEFINITION UNIT TYPICAL RANGE
𝐴3 Save PNG s 14-22
𝐴4 Save JPEG s 1.5-2.2

Page 56 of 82
VIDEO EDITING TEST
The Video Editing test use cases capture some common uses of video
editing applications.
Implementation
The Video Editing test uses parts from PCMark 8 Video Editing and Media To Go tests. Windows Media Foundation is used with its built-in codecs to transcode video. Hardware acceleration is allowed to be used if the system supports it and has the necessary Media Foundation setup done. The Video Editing test uses FFmpeg on the sharpening and deshaking parts. The test uses pre-built FFmpeg binaries. The Video editing test supports OpenCL. The benchmark application selects a preferred OpenCL device to use.
Part 1: on the go
Stage 1: Fast downscaling
Code path: x86/x64
Uses Media Foundation Fast transcode feature to transcode video files
to a format suitable for mobile use
Code path: x86/x64 and whatever is the implementation with Media
Foundation H.264 codecs installed on the system
Similar to Video to go test in PCMark 8
Part 2: Sharpening
Sharpens the 1080p H.264 video
Uses publicly available executable FFmpeg.exe
Command line: FFmpeg.exe -y -v 40 -i <input file> -vf
scale=w=1920:h=1080:flags=bicubic,unsharp=opencl=%OCL%:lx=7:ly=7:l
a=0.56:cx=7:cy=7:ca=0.28 -strict -2 <output file>
Stage 2 - CPU:
Run always
Code path: x86/x64
Stage 2 - OCL:
Condition: OpenCL device available
Code path: OpenCL
If the OpenCL of the Stage 2 test takes longer than the CPU version,
the CPU result is used instead
Part 3: Deshaking
Page 57 of 82
Uses publicly available executable FFmpeg.exe
Video deshaked
Command line: FFmpeg.exe -y -v 40 -i <input file> -vf
deshake=opencl=%OCL%:search=1:blocksize=16,crop=in_w-384:in_h-
216,scale=w=1920:h=1080 -strict -2 <output file>
Stage 3 - CPU:
Run always
Code path: x86/x64
Stage 3 - OpenCL:
Condition: OpenCL device available
Code path: OpenCL
If the OpenCL test takes longer than the CPU test, the CPU run time is used instead
Workloads
The Video Editing test simulates editing videos in an video editing program.
The workloads performs the following tasks:
1. Fast downscaling, common for example in use with mobile devices
2. Sharpening the video
3. Deshaking filtering
The workloads measure the frames produced per second in the video
editing program.
𝑂𝑛 𝑡ℎ𝑒 𝑔𝑜 =𝑀1
𝑀2
Where:
𝑀1 = 𝑑𝑏𝑔_𝑝𝑐𝑚10_𝑣𝑖𝑑𝑒𝑜_𝑔𝑜_𝑓𝑟𝑎𝑚𝑒𝑠
𝑀2 = 𝑑𝑏𝑔_𝑝𝑐𝑚10_𝑣𝑖𝑑𝑒𝑜_𝑔𝑜_𝑡𝑖𝑚𝑒
𝑆ℎ𝑎𝑟𝑝𝑒𝑛𝑖𝑛𝑔 𝐶𝑃𝑈 =𝑀3
𝑀4
Where:
𝑀3 = 𝑑𝑏𝑔_𝑝𝑐𝑚10_𝑣𝑖𝑑𝑒𝑜_𝑑𝑜𝑤𝑛𝑠𝑐𝑎𝑙𝑒_𝑓𝑟𝑎𝑚𝑒𝑠
𝑀4 = 𝑑𝑏𝑔_𝑝𝑐𝑚10_𝑣𝑖𝑑𝑒𝑜_𝑑𝑜𝑤𝑛𝑠𝑐𝑎𝑙𝑒_𝑡𝑖𝑚𝑒_𝑐𝑝𝑢
𝑆ℎ𝑎𝑟𝑝𝑒𝑛𝑖𝑛𝑔 𝑂𝐶𝐿 =𝑀5
𝑀𝑖𝑛(𝑀6, 𝑀7)
Where:
Page 58 of 82
𝑀5 = 𝑑𝑏𝑔_𝑝𝑐𝑚10_𝑣𝑖𝑑𝑒𝑜_𝑑𝑜𝑤𝑛𝑠𝑐𝑎𝑙𝑒_𝑓𝑟𝑎𝑚𝑒𝑠
𝑀6 = 𝑑𝑏𝑔_𝑝𝑐𝑚10_𝑣𝑖𝑑𝑒𝑜_𝑑𝑜𝑤𝑛𝑠𝑐𝑎𝑙𝑒_𝑡𝑖𝑚𝑒_𝑜𝑐𝑙
𝑀7 = 𝑑𝑏𝑔_𝑝𝑐𝑚10_𝑣𝑖𝑑𝑒𝑜_𝑑𝑜𝑤𝑛𝑠𝑐𝑎𝑙𝑒_𝑡𝑖𝑚𝑒_𝑐𝑝𝑢
𝐷𝑒𝑠ℎ𝑎𝑘𝑖𝑛𝑔 𝐶𝑃𝑈 =𝑀8
𝑀9
Where:
𝑀8 = 𝑑𝑏𝑔_𝑝𝑐𝑚10_𝑣𝑖𝑑𝑒𝑜_𝑑𝑒𝑠ℎ𝑎𝑘𝑒_𝑓𝑟𝑎𝑚𝑒𝑠
𝑀9 = 𝑑𝑏𝑔_𝑝𝑐𝑚10_𝑣𝑖𝑑𝑒𝑜_𝑑𝑒𝑠ℎ𝑎𝑘𝑒_𝑡𝑖𝑚𝑒_𝑐𝑝𝑢
𝐷𝑒𝑠ℎ𝑎𝑘𝑖𝑛𝑔 𝑂𝐶𝐿 =𝑀10
𝑀𝑖𝑛(𝑀11, 𝑀12)
Where:
𝑀10 = 𝑑𝑏𝑔_𝑝𝑐𝑚10_𝑣𝑖𝑑𝑒𝑜_𝑑𝑒𝑠ℎ𝑎𝑘𝑒_𝑓𝑟𝑎𝑚𝑒𝑠
𝑀11 = 𝑑𝑏𝑔_𝑝𝑐𝑚10_𝑣𝑖𝑑𝑒𝑜_𝑑𝑒𝑠ℎ𝑎𝑘𝑒_𝑡𝑖𝑚𝑒_𝑜𝑐𝑙
𝑀12 = 𝑑𝑏𝑔_𝑝𝑐𝑚10_𝑣𝑖𝑑𝑒𝑜_𝑑𝑒𝑠ℎ𝑎𝑘𝑒_𝑡𝑖𝑚𝑒_𝑐𝑝𝑢
Scoring
The Photo Editing test score formula uses a geomean of the workloads to
calculate the overall score.
𝑉𝑖𝑑𝑒𝑜 𝐸𝑑𝑖𝑡𝑖𝑛𝑔 𝑠𝑐𝑜𝑟𝑒 = 𝐾 ∗ 𝑔𝑒𝑜𝑚𝑒𝑎𝑛(𝑅1, 𝑅2, 𝑅3)
Where:
𝐾 = 𝑠𝑐𝑜𝑟𝑖𝑛𝑔 𝑐𝑜𝑒𝑓𝑓𝑖𝑐𝑖𝑒𝑛𝑡 = 93
𝑅2 = 𝑔𝑒𝑜𝑚𝑒𝑎𝑛(𝐴1, 𝐴2)
𝑅3 = 𝑔𝑒𝑜𝑚𝑒𝑎𝑛(𝐴3, 𝐴4 )
And where:
RESUL
T DEFINITION UNIT TYPICAL RANGE
𝑅1 On the go FPS 17-51

Page 59 of 82
RESUL
T DEFINITION UNIT TYPICAL RANGE
𝐴1 Sharpening CPU FPS 31-47
𝐴2 Sharpening OCL FPS 67-154
𝐴3 Deshaking CPU FPS 13-17
𝐴4 Deshaking OCL FPS 49-83
Page 60 of 82
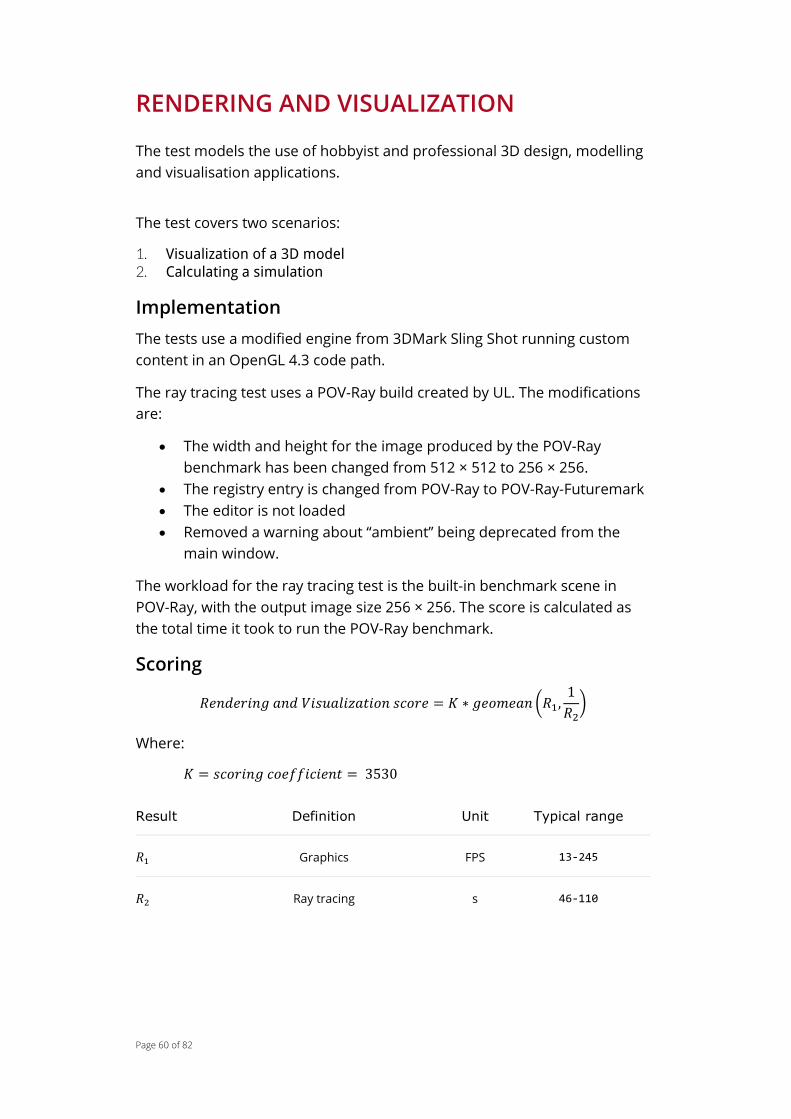
RENDERING AND VISUALIZATION
The test models the use of hobbyist and professional 3D design, modelling
and visualisation applications.
The test covers two scenarios:
1. Visualization of a 3D model 2. Calculating a simulation
Implementation
The tests use a modified engine from 3DMark Sling Shot running custom
content in an OpenGL 4.3 code path.
The ray tracing test uses a POV-Ray build created by UL. The modifications
are:
The width and height for the image produced by the POV-Ray
benchmark has been changed from 512 × 512 to 256 × 256.
The registry entry is changed from POV-Ray to POV-Ray-Futuremark
The editor is not loaded
Removed a warning about “ambient” being deprecated from the
main window.
The workload for the ray tracing test is the built-in benchmark scene in
POV-Ray, with the output image size 256 × 256. The score is calculated as
the total time it took to run the POV-Ray benchmark.
Scoring
𝑅𝑒𝑛𝑑𝑒𝑟𝑖𝑛𝑔 𝑎𝑛𝑑 𝑉𝑖𝑠𝑢𝑎𝑙𝑖𝑧𝑎𝑡𝑖𝑜𝑛 𝑠𝑐𝑜𝑟𝑒 = 𝐾 ∗ 𝑔𝑒𝑜𝑚𝑒𝑎𝑛 (𝑅1,1
𝑅2)
Where:
𝐾 = 𝑠𝑐𝑜𝑟𝑖𝑛𝑔 𝑐𝑜𝑒𝑓𝑓𝑖𝑐𝑖𝑒𝑛𝑡 = 3530
Result Definition Unit Typical range
𝑅1 Graphics FPS 13-245
𝑅2 Ray tracing s 46-110

Page 61 of 82
GAMING TEST GROUP
Gaming test group uses a modified version of the Fire Strike test in
3DMark:
1. Fire Strike Graphics test 1
2. Fire Strike Graphics test 2
3. Fire Strike Physics test
4. Fire Strike Combined test
⚠ The PCMark 10 gaming test runs in a window rather than full
screen, and it always runs on a single GPU even if multiple
GPUs are available in this system. For these reasons, you
should not compare Gaming test scores from PCMark 10 with
Fire Strike scores from 3DMark.
Page 62 of 82
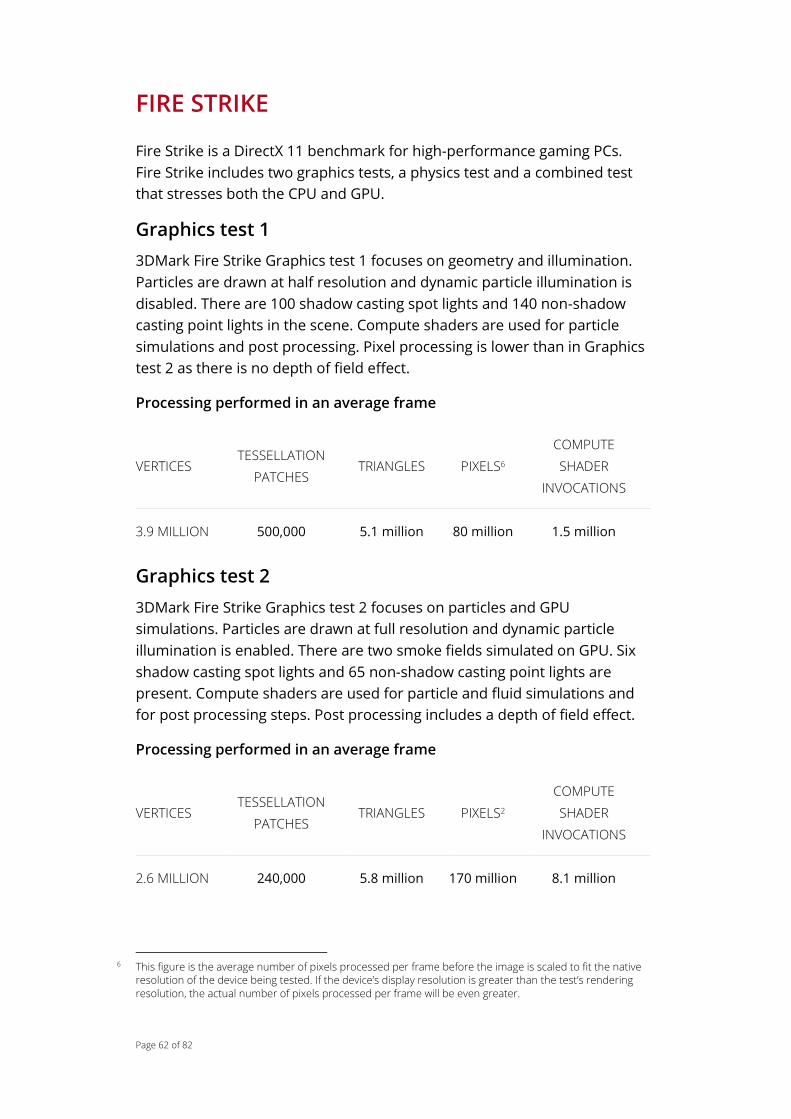
FIRE STRIKE
Fire Strike is a DirectX 11 benchmark for high-performance gaming PCs.
Fire Strike includes two graphics tests, a physics test and a combined test
that stresses both the CPU and GPU.
Graphics test 1
3DMark Fire Strike Graphics test 1 focuses on geometry and illumination.
Particles are drawn at half resolution and dynamic particle illumination is
disabled. There are 100 shadow casting spot lights and 140 non-shadow
casting point lights in the scene. Compute shaders are used for particle
simulations and post processing. Pixel processing is lower than in Graphics
test 2 as there is no depth of field effect.
Processing performed in an average frame
VERTICES TESSELLATION
PATCHES TRIANGLES PIXELS6
COMPUTE
SHADER
INVOCATIONS
3.9 MILLION 500,000 5.1 million 80 million 1.5 million
Graphics test 2
3DMark Fire Strike Graphics test 2 focuses on particles and GPU
simulations. Particles are drawn at full resolution and dynamic particle
illumination is enabled. There are two smoke fields simulated on GPU. Six
shadow casting spot lights and 65 non-shadow casting point lights are
present. Compute shaders are used for particle and fluid simulations and
for post processing steps. Post processing includes a depth of field effect.
Processing performed in an average frame
VERTICES TESSELLATION
PATCHES TRIANGLES PIXELS2
COMPUTE
SHADER
INVOCATIONS
2.6 MILLION 240,000 5.8 million 170 million 8.1 million
6 This figure is the average number of pixels processed per frame before the image is scaled to fit the native
resolution of the device being tested. If the device’s display resolution is greater than the test’s rendering resolution, the actual number of pixels processed per frame will be even greater.

Page 63 of 82
Physics test
3DMark Fire Strike Physics test benchmarks the hardware’s ability to run
gameplay physics simulations on the CPU. The GPU load is kept as low as
possible to ensure that only the CPU is stressed. The Bullet Open Source
Physics Library is used as the physics library for the test.
The test has 32 simulated worlds. One thread per available CPU core is
used to run simulations. All physics are computed on CPU with soft body
vertex data updated to GPU each frame.
Combined test
3DMark Fire Strike Combined test stresses both the GPU and CPU
simultaneously. The GPU load combines elements from Graphics test 1 and
2 using tessellation, volumetric illumination, fluid simulation, particle
simulation, FFT based bloom and depth of field.
The CPU load comes from the rigid body physics of the breaking statues in
the background. There are 32 simulation worlds running in separate
threads each containing one statue decomposing into 113 parts.
Additionally there are 16 invisible rigid bodies in each world except the one
closest to camera to push the decomposed elements apart. The
simulations run on one thread per available CPU core.
The 3DMark Fire Strike Combined test uses the Bullet Open Source Physics
Library.
Processing performed in an average frame
Vertices Tessellation
patches Triangles Pixels7
Compute
shader
invocations
7.5 million 530,000 7.9 million 150 million 110 million
Overall Fire Strike score
The 3DMark Fire Strike score formula uses a weighted harmonic mean to
calculate the overall score from the Graphics, Physics, and Combined
scores.
7 This figure is the average number of pixels processed per frame before the image is scaled to fit the native
resolution of the device being tested. If the device’s display resolution is greater than the test’s rendering resolution, the actual number of pixels processed per frame will be even greater.
Page 64 of 82
𝐹𝑖𝑟𝑒 𝑆𝑡𝑟𝑖𝑘𝑒 𝑠𝑐𝑜𝑟𝑒 = K ∗𝑊𝑔𝑟𝑎𝑝ℎ𝑖𝑐𝑠 + 𝑊𝑝ℎ𝑦𝑠𝑖𝑐𝑠 + 𝑊𝑐𝑜𝑚𝑏𝑖𝑛𝑒𝑑
𝑊𝑔𝑟𝑎𝑝ℎ𝑖𝑐𝑠𝑆𝑔𝑟𝑎𝑝ℎ𝑖𝑐𝑠
+𝑊𝑝ℎ𝑦𝑠𝑖𝑐𝑠𝑆𝑝ℎ𝑦𝑠𝑖𝑐𝑠
+𝑊𝑐𝑜𝑚𝑏𝑖𝑛𝑒𝑑𝑆𝑐𝑜𝑚𝑏𝑖𝑛𝑒𝑑
Where:
𝐾 = 0.834(𝑠𝑐𝑎𝑙𝑒𝑠 𝑡ℎ𝑒 𝑠𝑐𝑜𝑟𝑒𝑠 𝑡𝑜 5,000 𝑜𝑛 𝑡ℎ𝑒 ℎ𝑖𝑔ℎ − 𝑟𝑒𝑓𝑒𝑟𝑒𝑛𝑐𝑒 𝑃𝐶)
𝑊𝑔𝑟𝑎𝑝ℎ𝑖𝑐𝑠 = The Graphics score weight, equal to 0.75
𝑊𝑝ℎ𝑦𝑠𝑖𝑐𝑠 = The Physics score weight, equal to 0.15
𝑊𝑐𝑜𝑚𝑏𝑖𝑛𝑒𝑑 = The Combined score weight, equal to 0.10
𝑆𝑔𝑟𝑎𝑝ℎ𝑖𝑐𝑠 = Graphics score
𝑆𝑝ℎ𝑦𝑠𝑖𝑐𝑠 = Physics score
𝑆𝑐𝑜𝑚𝑏𝑖𝑛𝑒𝑑 = Combined score
For a balanced system, the weights reflect the ratio of the effects of GPU
and CPU performance on the overall score. Balanced in this sense means
the Graphics, Physics and Combined scores are roughly the same
magnitude.
For a system where either the Graphics or Physics score is substantially
higher than the other, the harmonic mean rewards boosting the lower
score. This reflects the reality of the user experience. For example,
doubling the CPU speed in a system with an entry-level graphics card
doesn't help much in games since the system is already limited by the GPU.
Likewise for a system with a high-end graphics card paired with an
underpowered CPU.
Graphics score
Each Graphics test produces a raw performance result in frames per
second (FPS). We take a harmonic mean of these raw results and multiply it
by a scaling constant to reach a Graphics score (𝑆𝑔𝑟𝑎𝑝ℎ𝑖𝑐𝑠) as follows:
𝑆𝑔𝑟𝑎𝑝ℎ𝑖𝑐𝑠 = 230 ×2
1𝐹𝑔𝑡1 +
1𝐹𝑔𝑡2
Where:
𝐹𝑔𝑡1 = The average FPS result from Graphics test 1
𝐹𝑔𝑡1 = The average FPS result from Graphics test 2
Page 65 of 82
The scaling constant is used to bring the score in line with traditional
3DMark score levels.
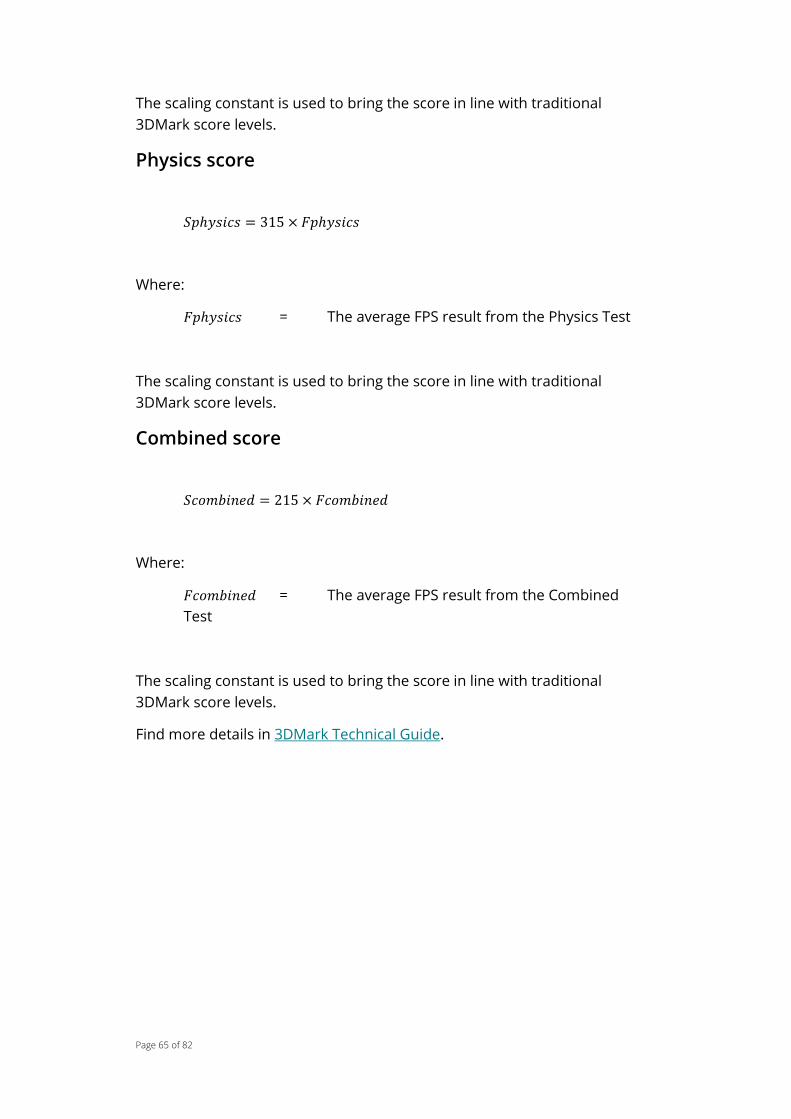
Physics score
𝑆𝑝ℎ𝑦𝑠𝑖𝑐𝑠 = 315 × 𝐹𝑝ℎ𝑦𝑠𝑖𝑐𝑠
Where:
𝐹𝑝ℎ𝑦𝑠𝑖𝑐𝑠 = The average FPS result from the Physics Test
The scaling constant is used to bring the score in line with traditional
3DMark score levels.
Combined score
𝑆𝑐𝑜𝑚𝑏𝑖𝑛𝑒𝑑 = 215 × 𝐹𝑐𝑜𝑚𝑏𝑖𝑛𝑒𝑑
Where:
𝐹𝑐𝑜𝑚𝑏𝑖𝑛𝑒𝑑 = The average FPS result from the Combined
Test
The scaling constant is used to bring the score in line with traditional
3DMark score levels.
Find more details in 3DMark Technical Guide.
Page 66 of 82
BENCHMARK SCORES
RESULT SCREEN
The Result screen is divided into sections.
1. Benchmark score
2. Result details
3. System information
4. Monitoring
Benchmark score
PCMark 10 benchmarks produce an overall score. You can use this score to
compare the performance of different systems. The higher the score, the
better the performance.
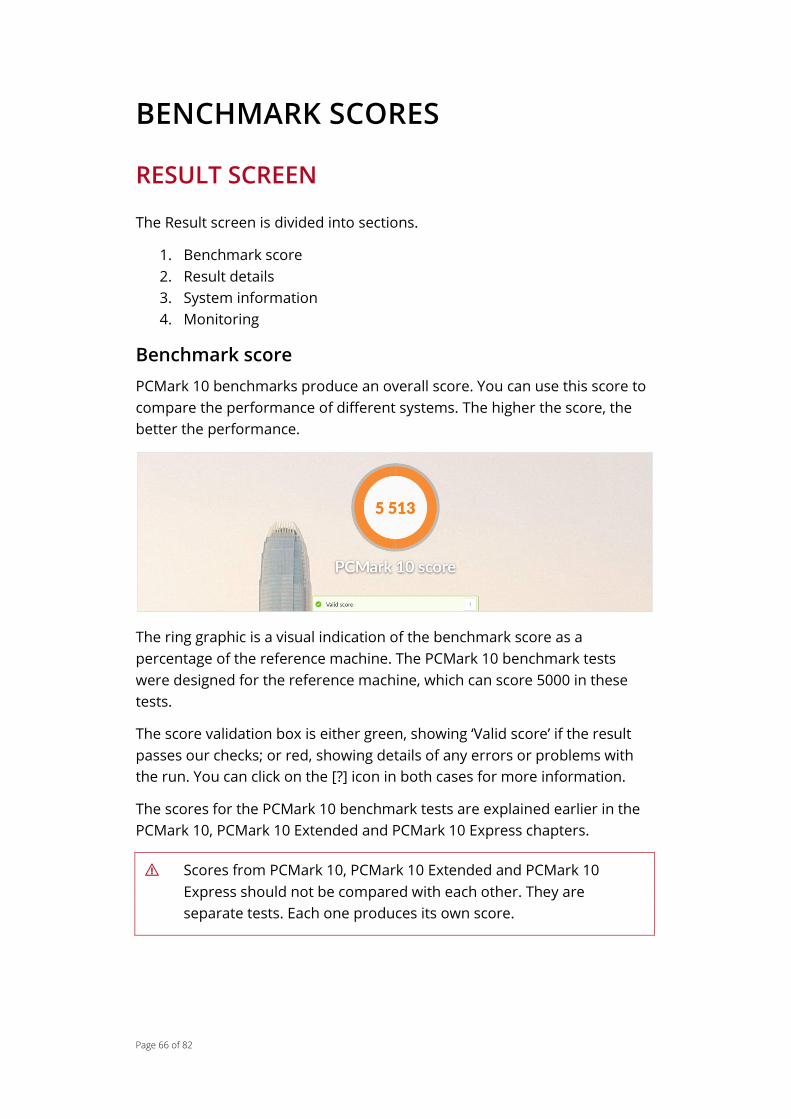
The ring graphic is a visual indication of the benchmark score as a
percentage of the reference machine. The PCMark 10 benchmark tests
were designed for the reference machine, which can score 5000 in these
tests.
The score validation box is either green, showing ‘Valid score’ if the result
passes our checks; or red, showing details of any errors or problems with
the run. You can click on the [?] icon in both cases for more information.
The scores for the PCMark 10 benchmark tests are explained earlier in the
PCMark 10, PCMark 10 Extended and PCMark 10 Express chapters.
⚠ Scores from PCMark 10, PCMark 10 Extended and PCMark 10
Express should not be compared with each other. They are
separate tests. Each one produces its own score.

Page 67 of 82
Result details
This section provides more details of your result. The overall score appears
in the top left with the name and version number of the benchmark.
In the table, you’ll find the scores for each test group. You can expand the
‘Detailed score’ to get the scores for the workloads and the performance
for each task.
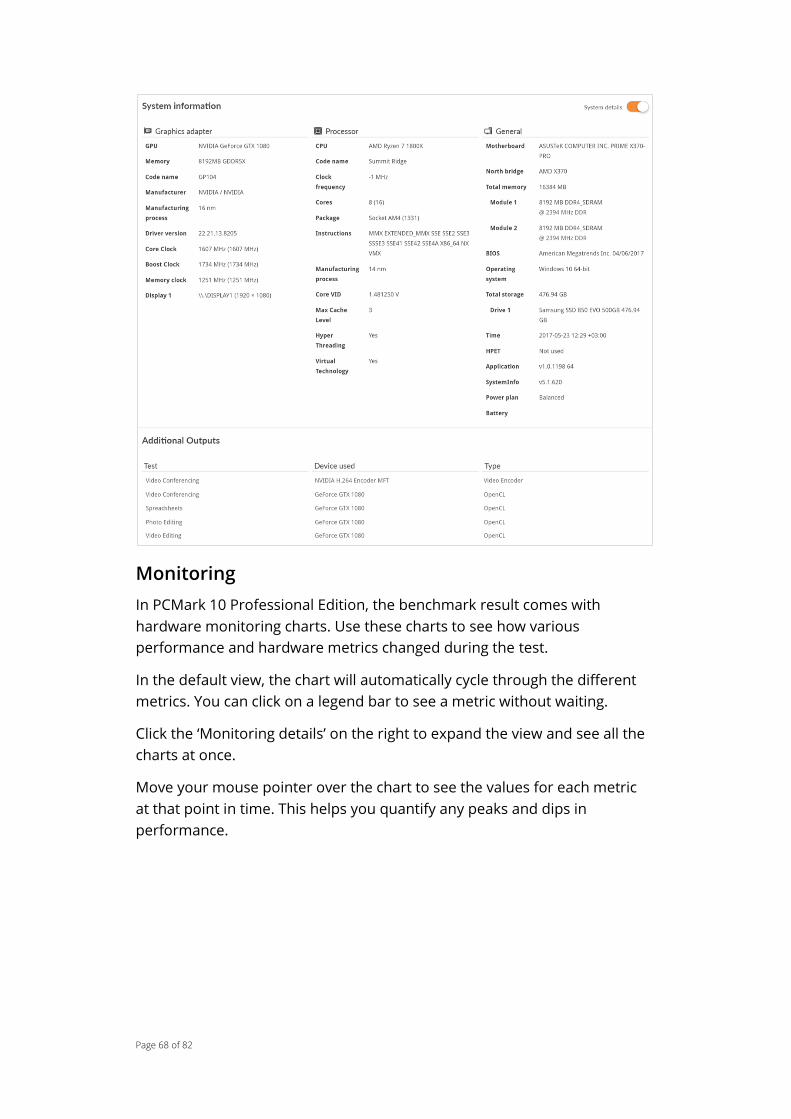
System information
This section of the result page shows information about the hardware
components in your system, a time stamp for the result, and the
SystemInfo and PCMark 10 application version numbers for the benchmark
run.
In the PCMark 10 Professional Edition, you can expand the ‘System details’
to see the additional hardware details. The “Additional Outputs’ lists the
devices that were used by the APIs for the benchmark run. These details
can be used in interpreting the results.
Page 68 of 82
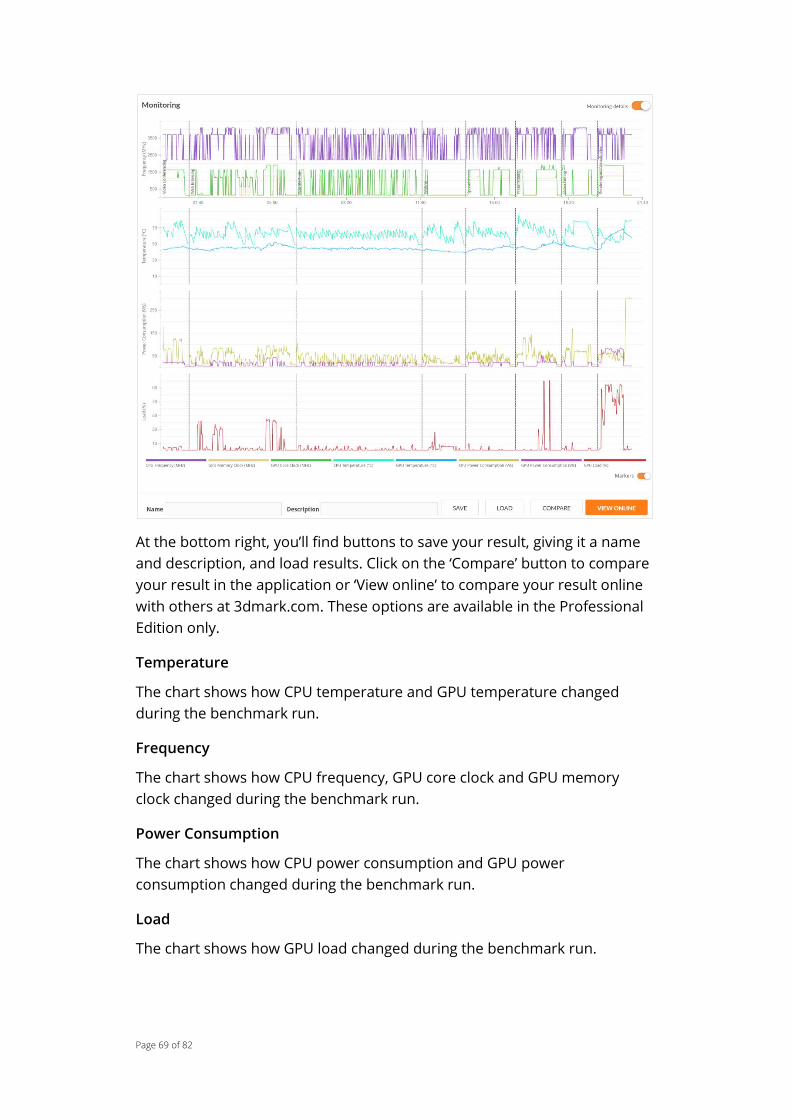
Monitoring
In PCMark 10 Professional Edition, the benchmark result comes with
hardware monitoring charts. Use these charts to see how various
performance and hardware metrics changed during the test.
In the default view, the chart will automatically cycle through the different
metrics. You can click on a legend bar to see a metric without waiting.
Click the ‘Monitoring details’ on the right to expand the view and see all the
charts at once.
Move your mouse pointer over the chart to see the values for each metric
at that point in time. This helps you quantify any peaks and dips in
performance.
Page 69 of 82
At the bottom right, you’ll find buttons to save your result, giving it a name
and description, and load results. Click on the ‘Compare’ button to compare
your result in the application or ‘View online’ to compare your result online
with others at 3dmark.com. These options are available in the Professional
Edition only.
Temperature
The chart shows how CPU temperature and GPU temperature changed
during the benchmark run.
Frequency
The chart shows how CPU frequency, GPU core clock and GPU memory
clock changed during the benchmark run.
Power Consumption
The chart shows how CPU power consumption and GPU power
consumption changed during the benchmark run.
Load
The chart shows how GPU load changed during the benchmark run.

Page 70 of 82
Result export
Exclusive to the PCMark 10 Professional Edition is the result exporting
feature. The results can be exported as PDF and XML.
The PDF result report includes the hardware monitoring graphs to provide
a full view of the benchmark run making it easier to store and share test
results.
The PDF result report can be customized with your own logo. Go to the
Options screen to select your logo file.
Page 71 of 82
COMPARE RESULTS
The Compare screen is divided into sections.
1. Score comparison
2. System information
3. Monitoring
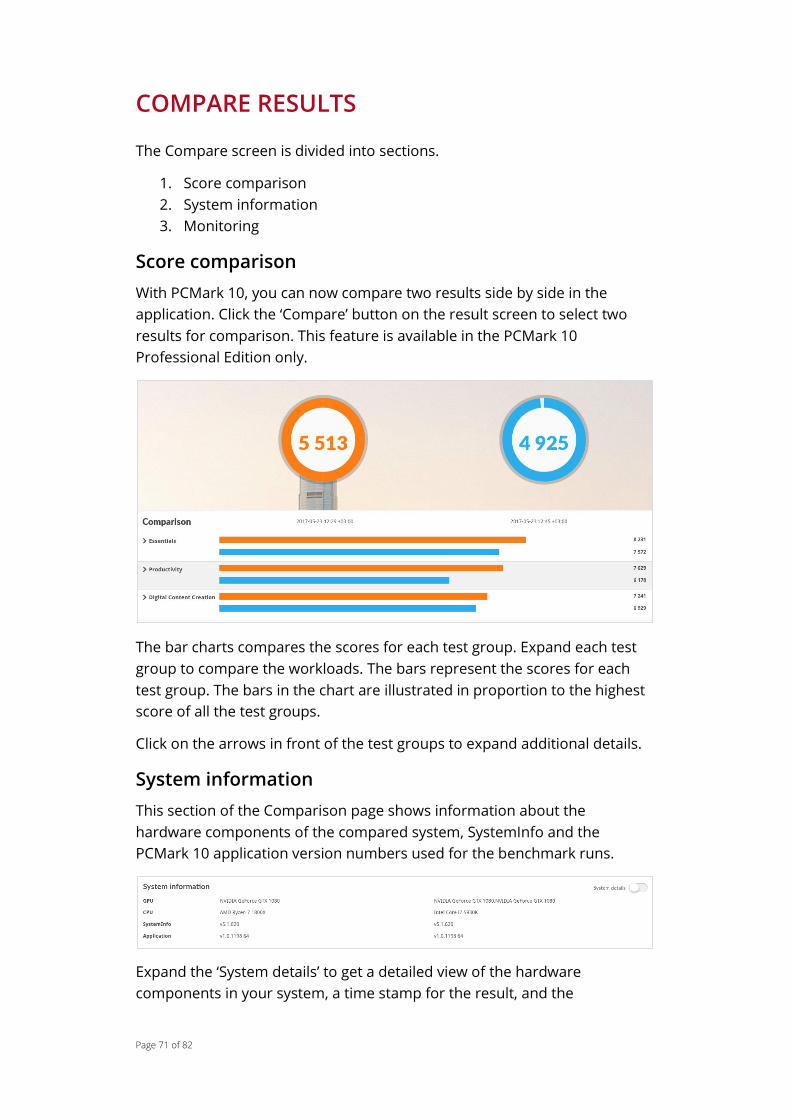
Score comparison
With PCMark 10, you can now compare two results side by side in the
application. Click the ‘Compare’ button on the result screen to select two
results for comparison. This feature is available in the PCMark 10
Professional Edition only.
The bar charts compares the scores for each test group. Expand each test
group to compare the workloads. The bars represent the scores for each
test group. The bars in the chart are illustrated in proportion to the highest
score of all the test groups.
Click on the arrows in front of the test groups to expand additional details.
System information
This section of the Comparison page shows information about the
hardware components of the compared system, SystemInfo and the
PCMark 10 application version numbers used for the benchmark runs.
Expand the ‘System details’ to get a detailed view of the hardware
components in your system, a time stamp for the result, and the

Page 72 of 82
SystemInfo and PCMark 10 application version numbers for the benchmark
run.
Monitoring
The Compare page comes with hardware monitoring charts that you can
use to compare the performance and hardware metrics of two benchmark
results in parallel.

Page 73 of 82
In the default view, the chart will automatically cycle through the different
metrics. You can click on a legend bar to see a metric without waiting.
Click the ‘Monitoring details’ on the right to expand the view and see all the
charts at once.
Move your mouse pointer over the chart to see the values for each metric
at that point in time. This helps you quantify any peaks and dips in
performance.
The ‘Close’ button returns the Result page.
Page 74 of 82
HOW TO REPORT SCORES FROM PCMARK 10
Please follow these guidelines when including PCMark 10 scores in reviews
or marketing materials to avoid confusing your customers and to ensure
you represent our software correctly.
Each test gives its own score, which you can use to compare similar devices
or systems. There is no overall score. Scores from different tests are not
comparable. Do not use PCMark as a unit of measurement.
"Tablet scores 2,000 in PCMark 10 Express benchmark."
"Tablet scores 2,000 PCMarks."
Always include details of the hardware setup you used to obtain the score.
Be sure to include the operating system, system hardware and version
numbers for relevant drivers.
Using PCMark 10 scores in marketing material
You must have a commercial license to use PCMark 10 scores in marketing
material. A commercial license is granted with the purchase of PCMark 10
Professional Edition or through our site licensing program.
On the first mention of PCMark 10 in marketing text, such as an
advertisement or product brochure, please write "PCMark 10 benchmark"
in order to protect our trademark. For example:
"We recommend the PCMark® 10 benchmark from UL®."
Please include our legal text in your small print.
PCMark® is a registered trademark of Futuremark Corporation.

Page 75 of 82
RELEASE NOTES
PCMark 10 v1.1.1739 – July 5, 2018
This is a minor update. Benchmark scores are not affected.
Fixed
Benchmarks no longer crash if SystemInfo should fail to run.
Fixed a bug in the application update service.
Users with v1.1.1722 should download and install this update manually.
PCMark 10 v1.1.1722 – June 20, 2018
This is a minor update. Benchmark scores are not affected.
Improved
SystemInfo module updated to 5.10 for improved compatibility with the
latest hardware.
Result details now include the Total Available Video Memory for the
system.
Improved update notification system.
Text, logos, links, and file paths updated to reflect new company
branding. See https://benchmarks.ul.com/welcome.
Fixed
Fixed an issue with logging that could cause a benchmark run to fail.
PCMark 10 v1.0.1493 – April 11, 2018
This is a minor update. Benchmark scores are not affected.
Improved
SystemInfo module updated to 5.6 for improved compatibility with the
latest hardware.
The system information shown on the result screen now includes DPI
scaling settings for each connected display.
Improved consistency in how system information is shown in the UI and
PDF reports.
PCMark 10 v1.0.1457 – January 31, 2018
This is a minor update. Benchmark scores are not affected.
Page 76 of 82
Fixed
Fixed a further issue that could cause Chromium to fail to start in the
App Start-up and Web Browsing tests.
PCMark 10 v1.0.1453 – January 30, 2018
This is a minor update. Benchmark scores are not affected.
Improved
SystemInfo module updated to 5.4 for improved compatibility with the
latest hardware.
Fixed
Fixed an issue with the Rendering and Visualization test being unable to
install POV-Ray.
Fixed an issue where Chromium could fail to start in the App Start-up
and the Web Browsing tests.
Compatibility
Updated the .NET installer to .NET 4.5.2.
PCMark 10 v1.0.1413 – December 18, 2017
This is a minor update. Benchmark scores are not affected.
Improved
Improved logging from ImageMagick in the Photo Editing test.
Fixed
Fixed an issue that could cause PCMark 10 to hang on the splash
screen.
Fixed an issue with the Rendering and Visualization test being unable to
install POV-Ray.
Fixed an issue with the Web Browsing test failing on some devices due
to the sound codecs not loading.
PCMark 10 v1.0.1403 – November 13, 2017
Improved
SystemInfo module updated to 5.3.629 for improved compatibility with
the latest hardware.
Fixed
Fixed an issue with the Web Browsing video workload not starting in
some cases.

Page 77 of 82
Fixed an issue with the Web Browsing workload not starting when
running on a proxy server.
Improved logging for the App Start-up, Spreadsheets, Writing, and Web
Browsing workloads.
Professional Edition only
You can now customize the PDF result report with your own logo.
Added hardware monitoring graphs to the PDF result report.
Subscores from PCMark 10 Extended benchmark runs are now included
in PDF and XML result reports.
Fixed the "--clean-temporary-files" command line option.
Added a new command line setting "tempdir" for overriding the default
location for the workloads' temporary files.
PCMark 10 v1.0.1275 – June 28, 2017
Fixed
Fixed localization: flipped the localization for “Valid Score” and “Invalid
Score” in Simplified Chinese.
Fixed the Verify button on the Options page in the standalone version
to validate installed files.
PCMark 10 v1.0.1271 – June 22, 2017
This is a major update that unlocks the features in the Basic Edition and
Advanced Edition. It is the first publicly available version of PCMark 10 that
includes all editions. Benchmark scores are not affected by this update.
PCMark 10 v1.0.1238 – June 5, 2017
Public release of PCMark 10 Professional Edition.
PCMark 10 v1.0.1198 – May 24, 2017
Pre-release preview version for press publications.

Page 78 of 82
THIRD PARTY SOFTWARE
This is a list of third party software and applications used in PCMark 10 benchmark tests.
LibreOffice v5.2.4.2
Built by Futuremark from the open-source code at:
http://libreoffice.com/
Modified only to use different GUIDs for COM interfaces.
ImageMagick v6.9.8.0
By ImageMagick Studio LLC
Built by Futuremark from the source code at
http://www.imagemagick.org/download/windows/
OpenCV v3.1.0
Built by Futuremark from the source code at
https://github.com/Itseez/opencv/
FFmpeg v3.0.1
Pre-built binary available at: https://ffmpeg.zeranoe.com/builds/
GIMP v2.8.14
Pre-built binary available at: https://www.gimp.org/downloads/
Specifically: https://download.gimp.org/mirror/pub/gimp/v2.8/
Custom install, no extra languages, 64-bit left out.
Firefox v53 Beta
Version v53.0b1
Portable version
http://portableapps.com/apps/internet/firefox_portable
Some parameters were changed to prevent automatic updates and
plugin installation.
Chromium v55
Version v55.0.2883.87
Built by Futuremark from the source code at
http://www.chromium.org/Home

Page 79 of 82
AutoIt3 v3.3.14.2
Used as is. Downloaded as a self-extracting zip from
https://www.autoitscript.com/site/autoit/downloads/
POV-Ray v.3.7.1 Beta 5
Commit ea3d549a0c27c0dfb5c51e9fcd980866cfaf654b
Built by Futuremark from the source code at https://github.com/POV-
Ray/povray/commit/ea3d549a0c27c0dfb5c51e9fcd980866cfaf654b.
The changes made by Futuremark will be available publicly as patch
files.
The default POV-Ray benchmark scene and settings are used. They can
be viewed in the installation folder scenes\advanced\benchmark or
found at http://www.povray.org/download/benchmark.php

Page 80 of 82
REFERENCE SYSTEMS
SCORE-SCALING REFERENCE SYSTEMS
These systems were used to set the score-scaling coefficients:
Essentials reference PC
This system scores 5000 in each test in the Essentials group
HP Pavilion 14-al092no
CPU: Intel(R) Pentium(R) 4405U @ 2.10 GHz
GPU: Intel(R) HD Graphics 510
4 GB DDR4 RAM 2133 MHz
128 GB M.2 SSD
Productivity reference PC
This system scores 5000 in each test in the Productivity group.
Lenovo IdeaPad 710s Signature Edition
CPU: Intel(R) Core(TM) i5-6200U CPU @ 2.40GHz
GPU: Intel(R) HD Graphics 520
8 GB DDR3 RAM 1866 MHz
SSD: 256 GB M.2 NVMe
Digital Content Creation reference PC
This system scores 5000 in each test in the Digital Content Creation test
group, in the Gaming test group, and Overall scores.
CPU: Intel(R) Core(TM) i5-7600K CPU @ 3.80GHz
GPU: NVIDIA GeForce GTX 1050 (2 GB)
SSD: Samsung SSD 850 EVO 500 GB
16 GB DDR4 RAM 2667 MHz

Page 81 of 82
METRIC RANGE REFERENCE SYSTEMS
These systems were used for evaluating the typical range of each test metric:
Desktop 1 (Digital Content Creation reference PC)
CPU: Intel(R) Core(TM) i5-7600K CPU @ 3.80GHz
GPU: NVIDIA GeForce GTX 1050 (2 GB)
SSD: Samsung SSD 850 EVO 500 GB
16 GB DDR4 RAM 2667 MHz
Dell OptiPlex 3040 (“lower mid-range desktop PC”)
CPU: Intel(R) Core(TM) i3-6100 CPU @ 3.70GHz
GPU: Intel(R) HD Graphics 530
HDD: TOSHIBA DT01ACA050
4 GB DDR3 RAM

Page 82 of 82
ABOUT UL
UL is an independent, global company that offers a wide range of testing,
inspection, auditing, and certification services. With 10,000 people in 40
countries, UL helps customers, purchasers, and policymakers navigate
market risk and complexity. UL builds trust in the safety, security, and
sustainability of products, organizations and supply chains – enabling
smarter choices and better lives. Visit https://www.ul.com/ to find out
more.
UL benchmarking software is developed by the Product Supply Chain
Intelligence division. We enable global product compliance, innovation and
promotion throughout the supply chain with our intelligent software and
services backed by world-class scientific and technical expertise. Please visit
https://psi.ul.com/ to find out more.
UL benchmarks help people measure, understand and manage computer
hardware performance. Our talented team creates the industry's most
trusted and widely used performance tests for desktop computers,
notebooks, tablets, smartphones, and VR systems.
We work in cooperation with leading technology companies to develop
industry-standard benchmarks that are relevant, accurate, and impartial.
As a result, our benchmarks are widely used by the press. UL maintains the
world's largest and most comprehensive hardware performance database,
using the results submitted by millions of users to drive innovative online
solutions designed to help people make informed purchasing decisions.
Our benchmarks are developed in Finland just outside the capital Helsinki.
We also have a performance lab and sales office in Silicon Valley and sales
representatives in Taiwan.
Press [email protected]
Sales [email protected]
Support [email protected]
© 2018 Futuremark® Corporation. PCMark® trademarks and logos, character names and distinctive likenesses, are the
exclusive property of Futuremark Corporation. UL and the UL logo are trademarks of UL LLC. Microsoft, Windows 10,
Windows 8, Windows 7, Internet Explorer, Outlook, Excel, DirectX, and Direct3D are either registered trademarks or
trademarks of Microsoft Corporation in the United States and/or other countries. The names of other companies and
products mentioned herein may be the trademarks of their respective owners.