Embed Size (px)
Citation preview
Page | 1
TECHNICAL EVALUATION AND LIFE
CYCLE COST ANALYSIS OF TRANSMISSION
AND DISTRIBUTION ASSETS
by
Ashwin Maharaj
Theses submitted in fulfilment of the requirements for the MScEng Degree in
Electrical Engineering in Power and Energy Systems (HVDC Strand) at the
University of KwaZulu-Natal
School of Engineering
October 2016
Supervisor: Prof I.E Davidson
Page | 2
DECLARATION
I, Ashwin Maharaj, declare that:
1. The research reported in this thesis, except where otherwise indicated; is my original work
2. This thesis has not been submitted for any degree or examination at any other University or
Institution
3. This thesis does not contain any other person’s writing, unless specifically acknowledged
as being sourced from other researchers. Where other written sources have been quoted,
then, their words have been re-written but the general information attributed to them has
been referenced.
4. This thesis does not contain any other person’s data, graphs, pictures, tables or other
information, unless specifically acknowledged in the form of in-text citations, as being
obtained from other sources.
5. This thesis does not contain text, graphics, tables, pictures or graphs copied and pasted
from the internet, unless specifically acknowledged in the form of in-test citations and in
the reference section of the theses.
Signed: ____ _______________________
Ashwin Maharaj
October, 2016
As the candidate’s supervisor, I approve the submission of this thesis.
Signed: ___________________________
Prof I.E Davidson
October 2016

Page | 3
ACKNOWLEDGEMENTS
Direction, guidance and support was provided to me by my academic supervisor Prof Inno
Davidson. I wish to express my sincere thanks to Prof Davidson.
Furthermore, I would like to thank my family; in particular my daughters Nikita and Arya for
the love and support demonstrated during the development of this thesis.

Page | 4
CONTENTS
CHAPTER 1 - INTRODUCTION ................................................................................................ 11
1.1 BACKGROUND ......................................................................................................................... 11
1.2 STRATEGIC CONTEXT AND DELIMITATIONS OF THE STUDY .......................................................... 12
1.3 OBJECTIVES ............................................................................................................................ 15
1.4 THESIS STRUCTURE ................................................................................................................. 16
CHAPTER 2: LITERATURE REVIEW - CURRENT INDUSTRY PRACTICES ......................... 17
2.1 DEVELOPMENT OF SPECIFICATIONS AND REQUIREMENTS ............................................................ 17
2.2 ASSESSMENT OF SUPPLIERS ...................................................................................................... 18
2.3 ASSET INFORMATION ............................................................................................................... 19
CHAPTER 3 – RESEARCH METHODOLOGY .......................................................................... 20
3.1 LIFE-CYCLE COST ANALYSIS .................................................................................................... 20
3.2 INVESTMENT DECISION-MAKING .............................................................................................. 21
3.3 PLANT AND EQUIPMENT SPECIFICATION DEVELOPMENT .............................................................. 22 3.3.1 Industry Technical Standards ................................................................................................... 22 3.3.2 Functional Requirements ......................................................................................................... 22 3.3.3 Technical and Performance Requirements ................................................................................ 24 3.3.4 Plant and Equipment Specifications .......................................................................................... 27
3.4 FACTORY ASSESSMENT AND PREQUALIFICATION ........................................................................ 30 3.4.1 Material Supply Chain, Storage and Handling .......................................................................... 31 3.4.2 Equipment Design Process ...................................................................................................... 31 3.4.3 Equipment Manufacture Process .............................................................................................. 31 3.4.4 Testing ................................................................................................................................... 32 3.4.5 Quality Systems ...................................................................................................................... 32 3.4.6 Warranty and after sales service .............................................................................................. 32 3.4.7 Factory Evaluation Checklist ................................................................................................... 33
3.5 PLANT AND EQUIPMENT SAFETY, RELIABILITY AND OPERABILITY ............................................... 35 3.5.1 Failure Mode and Effect Analysis (FMEA) ................................................................................ 36 3.5.2 Reliability Centred Maintenance (RCM) ................................................................................... 44 3.5.3 Hazard and Operability Study (HAZOP) ................................................................................... 47 3.5.4 Safety Critical Equipment (SCE) .............................................................................................. 51
3.6 DESIGN REVIEW ...................................................................................................................... 52
3.7 TESTING ................................................................................................................................. 54 3.7.1 Factory Acceptance Testing ..................................................................................................... 54 3.7.2 Site Acceptance Testing ........................................................................................................... 54 3.7.3 Inspection and Test Plan ......................................................................................................... 54
Page | 5
3.7.4 Test reports ............................................................................................................................ 56
CHAPTER 4 – AN EFFECTIVE ASSET MANAGEMENT STRATEGY ...................................... 57
4.1 STRATEGY, POLICY AND CAPABILITY ........................................................................................ 57 4.1.1 Prioritisation of Asset Classes for Asset Strategy Implementation ............................................... 58 4.1.2 Support from External Specialists ............................................................................................. 59 4.1.3 Organisation Maturity and Resilience....................................................................................... 60 4.1.4 Benefits of an Effective Asset Management Strategy ................................................................... 61
CHAPTER 5: CONCLUSION AND RECOMMENDATION ........................................................ 62
5.1 CONCLUSION .......................................................................................................................... 62
5.2 RECOMMENDATION ................................................................................................................. 64
REFERENCES ............................................................................................................................ 65

Page | 6
List of Figures
Figure 1: Productivity and efficiency improvements [12] ............................................................................. 13
Figure 2: Asset life-cycle ............................................................................................................................... 14
Figure 3: Total cost of ownership [14] ........................................................................................................... 15
Figure 4: Decisions affecting the life-cycle cost [14] .................................................................................... 16
Figure 5: The importance of asset information .............................................................................................. 19
Figure 6: Net Present Value (NPV) ................................................................................................................ 21
Figure 7: Plant and Equipment Specification [7] ........................................................................................... 27
Figure 8: Stage 1 Tender Assessment (Functional Assessment) .................................................................... 28
Figure 9: Stage 2 Tender Review ................................................................................................................... 29
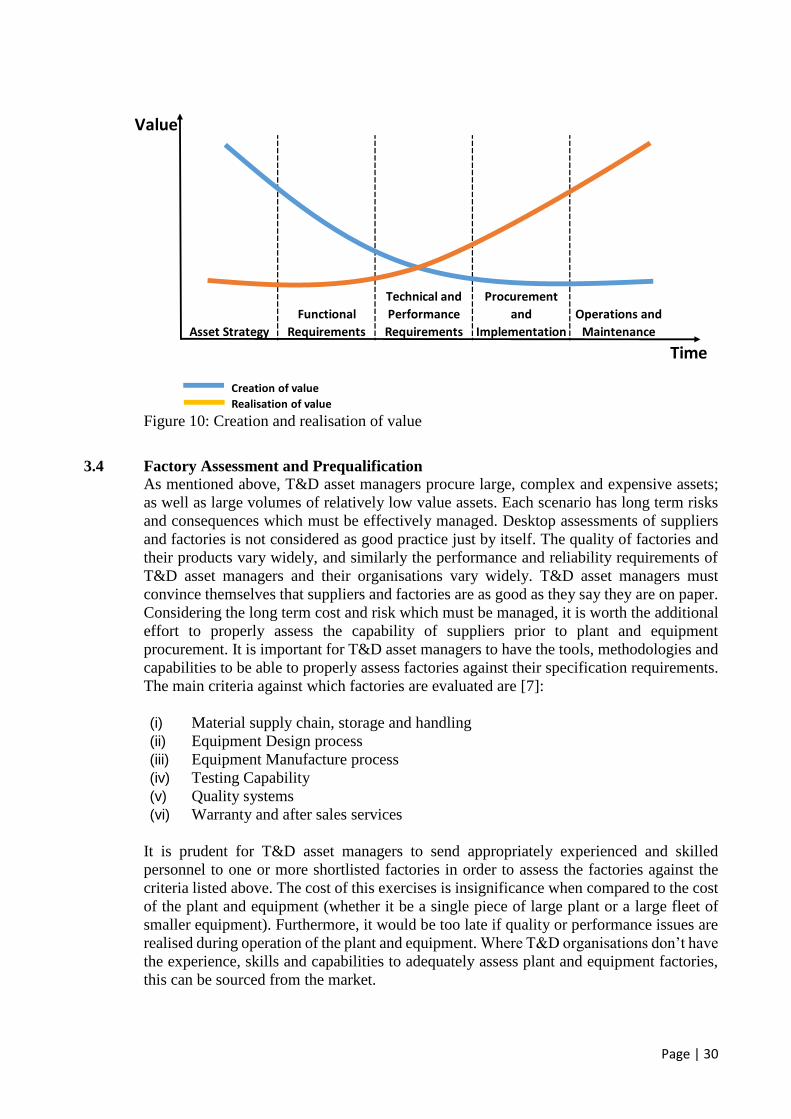
Figure 10: Creation and realisation of value .................................................................................................. 30
Figure 11: Disconnector functional component diagram [24] ....................................................................... 38
Figure 12: Power transformer functional component diagram [25] ............................................................... 39
Figure 13 Potential failure to Functional Failure interval [28]....................................................................... 46
Figure 14 Hierarchy of controls ..................................................................................................................... 49
Figure 15: Implementing Asset Strategy [32] ................................................................................................ 57
Figure 16: Strategy, policy and capability ..................................................................................................... 58
Figure 17: Lifecycle cost of major asset classes [18] ..................................................................................... 59
Figure 18 Organisational resilience ................................................................................................................ 60
Figure 19: Plant and equipment supply chain ................................................................................................ 63
Figure 20: Verification and validation of requirements [7]............................................................................ 64

Page | 7
List of Tables
Table 1: Power Transformer Lifecycle costs ................................................................................................. 20
Table 2: Industry Technical Standards ........................................................................................................... 22
Table 3: Functional Requirements ................................................................................................................. 23
Table 4: 300kV Disconnector Performance Requirements (Part 1) ............................................................... 25
Table 5: 300kV Disconnector Performance Requirements (Part 2) .............................................................. 26
Table 6: Factory Evaluation Checklist .......................................................................................................... 33
Table 7: FMEA, RCM, HAZOP summary..................................................................................................... 36
Table 8: Risk Priority Number (RPN) scoring ............................................................................................... 39
Table 9: Failure Mode and Effects Analysis example ................................................................................... 41
Table 10: Reliability Centred Maintenance (RCM) example......................................................................... 47
Table 11: Hazard and Operability Study (HAZOP) example ........................................................................ 50
Table 12: Safety Critical Equipment (SCE) list ............................................................................................. 51
Table 13: Design review record/minutes example ......................................................................................... 53
Table 14: Secondary System ITP example..................................................................................................... 55
Page | 8
Glossary of Terms
Term Description
AIS Air insulated substation
Asset Life cycle The creation, operation, maintenance and disposal of an asset
Asset Design life Nominal operating period expected by customer/business to satisfy
economics, network security or other criteria.
CB Circuit breaker
CT Current Transformer
CIGRE Founded in 1921, CIGRE, the Council on Large Electric Systems, is an
international non-profit Association for promoting collaboration with experts
from all around the world by sharing knowledge and joining forces to improve
electric power systems of today and tomorrow.
EPRI The Electric Power Research Institute, Inc. USA conducts research and
development relating to the generation, delivery and use of electricity for the
benefit of the public.
FAT Factory Acceptance Testing
FMEA Failure modes and effects analysis
Failure modes A single event, which causes a functional failure
Failure effects What happens when a failure mode occurs.
Failure
consequences
The way(s) in which the effects of a failure mode or a multiple failure matter
(evidence of failure, impact on safety, the environment, operational capability,
direct, and indirect repair costs).
GDP Gross domestic product
GIS Gas insulated substation
HAZOP Hazard and operability study
HV High voltage
IEEE Institute of Electrical and Electronic Engineers USA is a technical professional
organization dedicated to advancing technology for the benefit of humanity
through publications, conferences, standards, professional and educational
activities.
ISO9001 ISO 9001 is a widely recognized Quality Management System (QMS). It
belongs to the ISO 9000 family of quality management system standards
ISO55000 ISO 55000 is an international standard covering management of physical
assets. Initially a Publicly Available Specification (PAS 55) published by the
British Standards Institution in 2004, the ISO 55000 series of Asset
Management standards was launched in January 2014.
ITP Inspection and test plan
Page | 9
LCC Lifecycle Cost
Major plant Large, complex and expensive plant such as: power transformers, capacitor
banks, gas insulated substations.
Minor plant or
equipment
Lower cost, large volume plant and equipment such as: CB’s, CT’s, protection
relays.
MTTR Mean Time to Repair
NPV Net present value
OEM Original equipment manufacturer
PPE Personal Protective Equipment
PV Present value
Potential failure An identifiable condition which indicates that a functional failure is about to
occur or is in the process of occurring
PAS55 PAS 55 is the British Standards Institution's (BSI) Publicly Available
Specification for the optimized management of physical assets
QA Quality assurance
QC Quality control
ROI Return on investment
RCM Reliability-centred Maintenance – a process used to determine what must be
done to ensure that any physical asset continues to do what its users want it to
do in the present operating context.
Supportability A prediction or measure of the characteristics of an item which facilitates the
ability to support and sustain its mission capability within a predefined
environment and usage profile.
SCE Safety critical equipment
SF6 Sulphur hexafluoride gas
SAT Site Acceptance Testing
SME Subject Matter Expert
SPAR Single pole automatic reclosure
TPAR Three pole automatic reclosure
T&D Transmission and Distribution
USD United States Dollar
Page | 10
Abstract
Electric Power Transmission and Distribution (T&D) Asset Managers spend on average
30% of their capital expenditure on the procurement of primary and secondary plant and
equipment. Furthermore, T&D Asset Managers spend on average 50% of their operating
expenditure on the maintenance and operation of plant and equipment over their useful
lives which is generally 40 years for primary plant and 15 years for secondary equipment.
The privatisation of T&D in many countries and emerging markets means that shareholder
return is now a major performance indicator for these companies. Regulatory bodies are
becoming stricter in the pursuit of efficiency and productivity, constraining expenditure.
This has the effect of reducing shareholder return if not managed appropriately. In order to
meet shareholder expectations whilst maintaining consumer and regulatory requirements,
T&D Asset Managers must apply innovative techniques to lower their capital and operating
cost while meeting regulatory requirements. Therefore, T&D Asset Managers must take
optimum advantage of every opportunity for improvement. The major items for cost
reduction or productivity improvement are: procurement optimization, delivery efficiency
and organisational overheads. Procurement Optimization relates to the procurement of
equipment, materials and services. Plant and equipment costs are a major chunk of this
spend. Delivery efficiency refers to the design, construction and maintenance of T&D
network assets. Opportunities for improvement can exist in design and construction process
as well as smart contracting strategies. Lastly, organisational overheads relate to the
organisation’s cost for achieving the company’s outcomes. The major costs here are the
cost of internal labour and the cost of capital. This research investigation focusses on asset
management, asset strategy and equipment evaluation and specification. It involves a
technical evaluation of T&D assets and a life-cycle cost analysis of plant and equipment
with the goal of minimizing or reducing life cycle cost and hence, reducing risk exposure.
A deliberate focus on asset strategy, assessment, specification, and the supply chain will
ensure that T&D asset managers deploy fit for purpose assets at the lowest life-cycle cost.
Based on the results obtained from this investigation, Asset Managers must apply a
structured approach and have a long term view in order to achieve the lowest life-cycle
cost whilst meeting regulatory and consumer requirements, within an acceptable risk
exposure. This research study provides context and proposes tools and methodologies
which can be utilised for effective decision making across the full supply chain for primary
and secondary T&D equipment as applicable to the electricity supply industry.
Page | 11
Chapter 1 - Introduction
1.1 Background
The last century has demonstrated that every facet of human development is woven around
a sound and stable energy supply regime [1]. The electric power system serves to generate,
transport and distribute electrical energy to consumers in an efficient, economic and
reliable manner. It is made up of generating stations, transmission lines and distribution
networks. The transmission and distribution (T&D) of bulk electric power is considered to
be an essential service all over the world. In simple terms T&D consists of substations,
poles, towers, wires and associated components. The electricity industry of both developed
and developing economies are undergoing rapid and profound changes and restructuring.
It has been an industrial sector that has for so long being the preserve of government
monopoly institutions [2], [3]. T&D asset owners and operators have for a long time
benefitted from being part of a regulated monopoly which was generally not understood
by the end-users of electrical power.
In the last decade, environmental issues, regulatory and economic challenges, and changing
public perception have created a radically different world for electric utilities. Consumers
demand price transparency and reduction of cross-subsidies among different users. There
is also a need for higher energy efficiency in technical systems of utilities and significant
growth in energy demand. Governments are under pressure to raise funds for social
services, balance budgets and to carry out economic reform [4]. Consumers expect greater
levels of service delivery and value for money. This, compounded by privatisation is
placing considerable pressure on T&D to lower electricity prices, whilst at the same time
improving quality, reliability and availability of supply. Shareholders push to achieve good
returns on investment; regulators demand quality, availability and reliability of supply,
while consumers apply social and political pressure to lower electricity prices, making it
an extremely difficult operating environment.
T&D in developing nations, although not affected extensively by privatisation, they remain
highly accountable to energy regulators, governments and public. They too are required to
demonstrate sustainable outcomes to consumers with a direct link to improving the quality
of life for consumers. Failure to do so will make it extremely difficult to finance
infrastructure projects by multi-lateral lending institutions such as The World Bank and
Africa Development Bank. T&D owners and operators are required to deliver services
whilst having to deal with political, economic and social pressures.
Electrification projects are being implemented at a rapid pace and there is a push to inter-
connect different grids to allow bulk power to be transmitted between different provinces,
and between different countries; from generation to load centres. People wish to maintain
as much as possible the quality of life which they currently enjoy, and a reliable electricity
supply is a key enabler for this. A fundamental aspect of the T&D industry is that they are
asset-rich industries which derive an income from the provision of electricity through their
assets, spread over a vast geographic area. This presents a unique situation in which these
assets are required to perform their function, without the benefit of constant surveillance
and monitoring, as is common in factory and process environments.
For this reason these assets require a high level of reliability and availability, since
maintenance and repair crews are usually far away. T&D plant and equipment are expected
to last on average 40-50 years for primary equipment and 15-20 years for intelligent devices

Page | 12
such as protection relays [5]; and must continue to operate as required with meant times
between maintenance in the 5-10 year bracket. Furthermore T&D equipment, by the nature
of their function will generally cause significant disruption to end-users if a failure were to
occur; if sustained over long periods and with increased frequency will have a significant
impact on the standard of living [6].
1.2 Strategic Context and Delimitations of the Study
T&D network owners, spend on average 30% of their total capital expenditure on the
procurement of plant and equipment and on average 50% of their operating expenditure on
the maintenance of plant and equipment. In Australia alone, T&D asset managers will
spend on average USD1.3bn per annum on plant and equipment procurement. Globally,
T&D plant and equipment sales will tip the scales well over USD100bn per annum [7].
Moreover, the performance of the electricity transmission and distribution system has a
direct relationship to the economic performance of a country. The effects of a poor
performance of the electricity transmission and distribution system will be across all facets
of industry and lifestyle. In Africa, it is estimated that poor performing electricity systems
have a negative impact of 2% to the GDP [8]. Poor management of the electricity industry
will result in a severely damaged economy and a wastage of scarce human resources [9].
In order for T&D owners and operators to extract the required reliability and availability
over the design life of the plant and equipment, they must employ robust asset management
techniques to strengthen decision making during the creation of assets, from specification,
procurement, installation and operational life. To accurately predict performance and
reliability of these assets over a period of 40 years+ is difficult and requires the use of
robust asset management tools; using good information applied by working with skilled
workforce. Plant and equipment must perform their function for the duration of its designed
life, however premature failure will result in exorbitant breakdown costs, reliability and
availability non-compliance and loss of reputation.
Equipment infant mortality, mid-life failures, common mode failures and premature ageing
usually means that the asset owner has made an error in the front-end asset strategy and
asset creation process. The cost of these oversights are usually passed on to consumers in
the increased electricity prices. This means that insufficient upfront work and due diligence
has resulted in the implementation of a sub-standard product or solution. Conversely, if
plant and equipment are still in good condition at the end of the design life, this usually
means that the initial solution has been over-designed. Although not generally visible to
consumers and regulators, this means that assets will be decommissioned whilst still having
useful life but be of no use to the T&D owner or operator. Again this over-design would
indicate that too much upfront capital has been spent to create the assets, and this finances
would have come from end-users through their electricity bills. Therefore, it is very
important for asset owners to get it right the first time.
Beside the technical aspects of asset management, deregulation of the T&D industry will
force utilities to review their processes and systems so that they are aligned with new
business imperatives such as profitability and efficiency [10]. Moreover, rapid rates of
technology developments as well as technology integration [11] will continue to pose
challenges to T&D asset management in general.
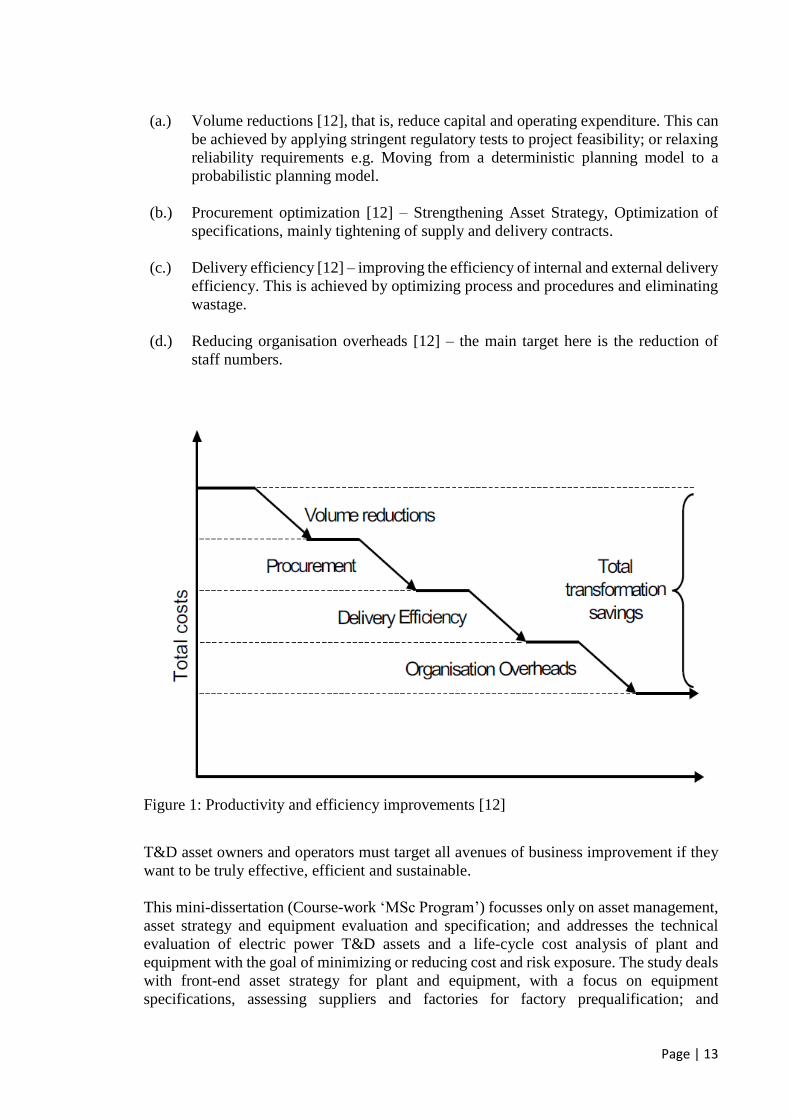
There are many ways to improve productivity and efficiency in T&D business. The main
targets are given in [12]:
Page | 13
(a.) Volume reductions [12], that is, reduce capital and operating expenditure. This can
be achieved by applying stringent regulatory tests to project feasibility; or relaxing
reliability requirements e.g. Moving from a deterministic planning model to a
probabilistic planning model.
(b.) Procurement optimization [12] – Strengthening Asset Strategy, Optimization of
specifications, mainly tightening of supply and delivery contracts.
(c.) Delivery efficiency [12] – improving the efficiency of internal and external delivery
efficiency. This is achieved by optimizing process and procedures and eliminating
wastage.
(d.) Reducing organisation overheads [12] – the main target here is the reduction of
staff numbers.
Figure 1: Productivity and efficiency improvements [12]
T&D asset owners and operators must target all avenues of business improvement if they
want to be truly effective, efficient and sustainable.
This mini-dissertation (Course-work ‘MSc Program’) focusses only on asset management,
asset strategy and equipment evaluation and specification; and addresses the technical
evaluation of electric power T&D assets and a life-cycle cost analysis of plant and
equipment with the goal of minimizing or reducing cost and risk exposure. The study deals
with front-end asset strategy for plant and equipment, with a focus on equipment
specifications, assessing suppliers and factories for factory prequalification; and

Page | 14
assessment of plant and equipment by performing life-cycle assessments on them, with an
emphasis on safety, functionality and reliability.
This requires that T&D owners and operators understand the following:
(i.) What they require in terms of functionality, reliability and availability; and develop
specifications which reflect this [7].
(ii.) Have criteria and methodologies to assess suppliers and factories to be able to
design and manufacture plant and equipment to meet required functionality,
reliability and availability [7].
(iii.) Use appropriate tools and techniques to assess plant and equipment against
functionality, reliability and availability [7].
(iv.) Have the right process, skills and capability to effectively apply the methodologies
and points mentioned above [7].
In contrast to the estimated percentage spend on capital and operational expenditures which
are usually planned in 5-10 year chunks and spent annually, the total cost of ownership or
lifecycle cost is determined over the life of the asset. The asset lifecycle is defined as Asset
Acquisition, Asset Maintenance and Operation, and Asset Disposal; this includes Asset
Mid-Life refurbishment which is a tactical asset renewal strategy [13] aimed at optimizing
asset management outcomes.
Asset condition information collected during the operate/maintain stage of the asset life-
cycle is used to feed into asset strategy and specification. This ensures that continuous
improvement occurs and lessons learned are transferred back into the intellectual property
which govern further asset introduction and creation. The asset lifecycle is as shown in
figure 2.
Figure 2: Asset life-cycle

Page | 15
The life-cycle cost across a range of different assets is split as shown in the chart in figure
2. A notable observation is that the bulk of the asset cost is part of the operate/maintain
portion of the asset life. This is the case, since this is by far the longest duration of the asset
lifecycle. As mentioned previously, for primary equipment around 40 years. Hence, this
portion of cost must be the target for optimization – without affecting the performance and
functionality.
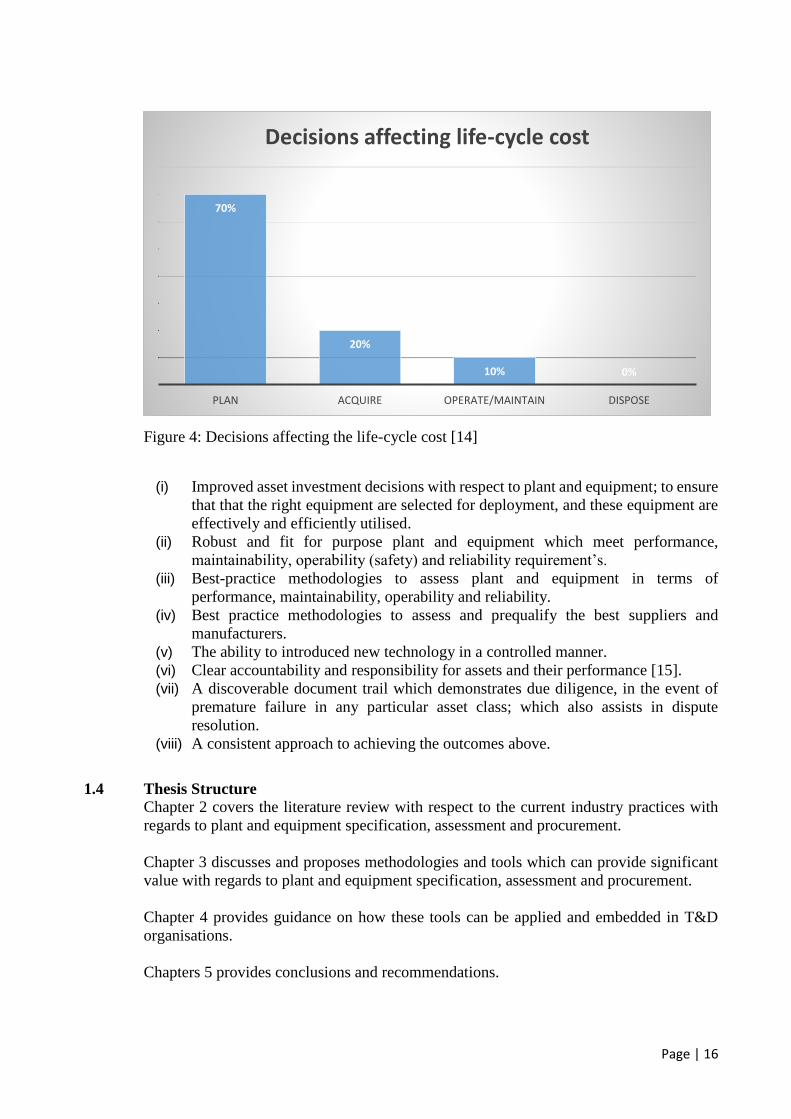
Although the largest portion of cost is spent during the operate and maintain stage (See
figure 3 [14]), Asset Managers have the greatest influence on life-cycle cost and risk at the
front end-of asset strategy – during the planning stage of the asset life-cycle. This occurs
long before the plant and equipment is procured, installed and operated on the network.
Figure 3: Total cost of ownership [14]
Once equipment is on the production line and being manufactured, it is very difficult to
make changes without having a very significant impact on the cost. This progressively and
exponentially diminishes as plant and equipment is installed and is put into service.
Therefore the decisions prior to acquisition and installation of the asset are the most
important ones, since these are the decisions which dictate the life-cycle of the assets and
therefore the cost of owning and operating these assets. This is shown in the graph of figure
4 [14].
1.3 Objectives
The aim of this research investigation is to develop a high level strategy tool for achieving
the lowest life-cycle cost for T&D plant and equipment and to establish some process, tools
and methodologies to achieve this. This will enable T&D asset Managers to manage risk
within tolerable levels at lowest life-cycle cost for their primary plant and equipment.
The anticipated outcomes of this study include the following:
2% 12%
85%
1%
PLAN ACQUIRE OPERATE/MAINTAIN DISPOSE
Actual Life Cycle cost
Page | 16
Figure 4: Decisions affecting the life-cycle cost [14]
(i) Improved asset investment decisions with respect to plant and equipment; to ensure
that that the right equipment are selected for deployment, and these equipment are
effectively and efficiently utilised.
(ii) Robust and fit for purpose plant and equipment which meet performance,
maintainability, operability (safety) and reliability requirement’s.
(iii) Best-practice methodologies to assess plant and equipment in terms of
performance, maintainability, operability and reliability.
(iv) Best practice methodologies to assess and prequalify the best suppliers and
manufacturers.
(v) The ability to introduced new technology in a controlled manner.
(vi) Clear accountability and responsibility for assets and their performance [15].
(vii) A discoverable document trail which demonstrates due diligence, in the event of
premature failure in any particular asset class; which also assists in dispute
resolution.
(viii) A consistent approach to achieving the outcomes above.
1.4 Thesis Structure
Chapter 2 covers the literature review with respect to the current industry practices with
regards to plant and equipment specification, assessment and procurement.
Chapter 3 discusses and proposes methodologies and tools which can provide significant
value with regards to plant and equipment specification, assessment and procurement.
Chapter 4 provides guidance on how these tools can be applied and embedded in T&D
organisations.
Chapters 5 provides conclusions and recommendations.
70%
20%
10% 0%
PLAN ACQUIRE OPERATE/MAINTAIN DISPOSE
Decisions affecting life-cycle cost
Page | 17
Chapter 2: Literature Review - Current Industry Practices
This chapter reviews what T&D organisations currently do to manage their electricity
Assets. The chapter assesses the development of plant and equipment specifications, how
plant and equipment suppliers are assessed, and how asset information is managed.
2.1 Development of Specifications and Requirements
In the context of T&D plant and equipment, requirements generally consist of the
performance criteria, functional specifications, user-specific specifications and testing
requirements, that is the procurement specification. This document is the principal
instrument on which suppliers and factories base their design, manufacture and essentially
their cost proposal. Done well, a good specification will ensure that fit for purpose plant
and equipment is procured and installed; and substandard products are easily eliminated
from the procurement process. Poorly written specifications can result in the exact
opposite, making it difficult for suppliers to interpret requirements which can result in
incorrectly specified equipment being offered and allowing substandard products to creep
into the procurement process.
Over-specifying requirements have the potential to confuse suppliers, making it difficult
for them to understand what the client wants. Similarly, this can cause suppliers to focus
on complying with requirements which are not essential to the fundamental function and
purpose of the equipment. This places too much emphasis on unimportant issues and
features, and not spending sufficient time on important requirements. Over specification
also has the tendency to stifle innovation and might prevent a supplier from offering a far
superior product, technology or solution. For example, a 50 page power transformer
specification which has 30 pages dedicated to the tank paint specification; and 20 pages
allocated to performance and functional requirements could prove detrimental. That said,
it is important that operating context is understood, say, if that same transformer was to be
installed in a highly corrosive environment, then a stringent paint specification might be
warranted.
T&D organisations fall into various categories of maturity when it comes to specification
quality. The level of maturity is usually depends on the combination of skilled and
experienced personnel supported by robust technical standards and processes. Evidence
suggests that only a small percentage of T&D business can be considered mature when it
comes to specification development. In general most plant and equipment specifications
assessed were heavily based on legacy requirements, which have been carried through the
various iterations of specification updates through the years. User-specific requirements
have organically grown, mostly in response to one-off problems or special preferences.
Secondary system equipment specifications have followed technology advancements
which have been driven by product manufacturers and developers, as is the case of today’s
IEC61850 based digital protection systems. Both scenarios have caused thinking and
therefore specifications to veer away from equipment functional requirements – the very
reason why the equipment is being procured, installed and operated.
Most T&D business today have lost key skills due to people moving-on or retiring, whilst
not keeping up with development and training programs which were common in days of
past. Some skilled people have moved into consulting organisations allowing them to

Page | 18
specialise in their area of interest. Where skills and knowledge are readily available in
consulting organisations, T&D organisations generally steer away from using ‘expensive’
consultants and will usually only call on them in the event of a major failure or emergency.
This is short-sighted to say the least. Poor specifications combined with a lack of skills
makes for a challenging situation for T&D businesses, and the results of this will only
materialise many years into the future. These organisations are operating in an area of
unknown risk and uncertainty. It is not clear to these organisations whether they are in fact
making the right decisions. The outcomes of their decisions will only be known many years
into the operation of the plant and equipment, and the cost of poor decisions is usually
passed onto the end-users in the form of increasing electricity prices. The intellectual
capital of an organisation is the key factor in the organisations profitability, sustainability
and resilience. In simple terms intellectual capital consists of the knowledge contained in
technical standards, systems and process as well as the tacit knowledge contained in the
minds of capable and competent people. In the context of technical specification
development, assessment and prequalification of supplies and factories, intellectual capital
will separate top performing asset management organisations from the rest.
2.2 Assessment of Suppliers
Although some T&D organisations do this really well, most organisations are not equipped
with the intellectual capital required to assess and prequalify suppliers and factories who
will best meet their needs. The choice of suppliers or factories are usually driven by
procurement teams which base their decisions on desktop assessments of tenders, and
ultimately on up-front capital cost. The main factors considered are financial, commercial
and technical compliance to specifications and usually equally weighted. For small orders
and low value plant and equipment this approach is adequate, however for large volume,
complex and high value plant and equipment, more due diligence is required. Even with
low cost items such as protection relays, the end-result of installing substandard items on
T&D networks will result in tenfold costs to resolve over the operating life of the
equipment if premature failure or mal-operations were to occur.
In order to ensure that the quality, reliability and life-cycle requirements are met, the
assessment must go further than a desktop assessment of the supplier, it must assess the
specific factory which will be manufacturing the plant and equipment. Factories must be
assessed against specific criteria ranging from quality systems to factory failure rates.
Factory assessment and prequalification were common in days gone by, but seldom occur
today. Company executives find it difficult to justify the cost of sending one or more people
to assess a factory which is usually at an overseas location. Furthermore, with the ever
dwindling capability in T&D organisations, plant and equipment engineers are not clear on
what to look for; and what denotes acceptable or unacceptable factory performance. What
makes things worse is that failures related to substandard equipment occur at or after mid-
life (not to be confused with infant mortality failures). This means that issues will only
materialise many years into the future. Considering the long operating lives of these assets,
it’s usually a new set of personnel that have to deal with these failures. Hence, lessons are
only learned when it may be too late.
T&D businesses must have a robust set of criteria to assess suppliers and factories against,
with pass/fail limits. This must be supported by adequately skilled personnel. When this
skill is non-existent, this must be sourced from the market, usually from the consulting
industry.
Page | 19
2.3 Asset Information
Asset information refers to the original specifications, drawings, test reports; and through-
life asset condition and performance information. Asset information is a key enabler to the
effective life-cycle management of plant and equipment. A common finding across most
T&D organisations is that asset information is not managed very well. Project teams which
procure and install plant and equipment are generally eager to get on to the next project,
seeing asset information handover as a nuisance. Asset managers on the other hand, with
the gift of hindsight are in constant angst with project teams to capture and receive asset
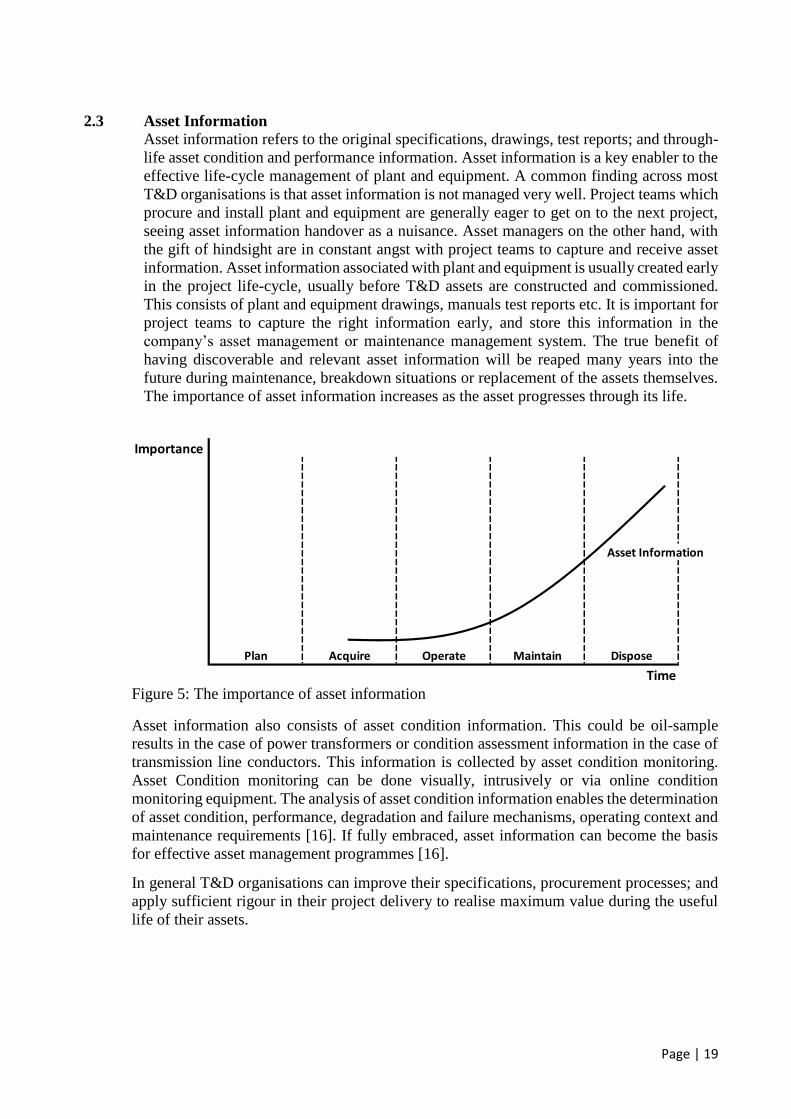
information. Asset information associated with plant and equipment is usually created early
in the project life-cycle, usually before T&D assets are constructed and commissioned.
This consists of plant and equipment drawings, manuals test reports etc. It is important for
project teams to capture the right information early, and store this information in the
company’s asset management or maintenance management system. The true benefit of
having discoverable and relevant asset information will be reaped many years into the
future during maintenance, breakdown situations or replacement of the assets themselves.
The importance of asset information increases as the asset progresses through its life.
Figure 5: The importance of asset information
Asset information also consists of asset condition information. This could be oil-sample
results in the case of power transformers or condition assessment information in the case of
transmission line conductors. This information is collected by asset condition monitoring.
Asset Condition monitoring can be done visually, intrusively or via online condition
monitoring equipment. The analysis of asset condition information enables the determination
of asset condition, performance, degradation and failure mechanisms, operating context and
maintenance requirements [16]. If fully embraced, asset information can become the basis
for effective asset management programmes [16].
In general T&D organisations can improve their specifications, procurement processes; and
apply sufficient rigour in their project delivery to realise maximum value during the useful
life of their assets.
Importance
Asset Information
Plan Acquire Operate Maintain Dispose
Time
Page | 20
Chapter 3 – Research Methodology
This chapter assesses key asset management practices in T&D and other industrial sectors;
namely life-cycle cost analysis, investment decision making, plant and equipment
specification development and factory prequalification. Although most T&D organisations
perform these functions in some way, this chapter provides effective ways of how this
could be implemented by using proven analysis tools and standards to significantly
improve asset management decision making.
3.1 Life-Cycle Cost Analysis
It is important for asset owners to have an economic view of the world. They must have a
sound understanding of the total cost of ownership for their assets; or life-cycle cost (LCC).
This could mean the difference between choosing a supplier over another or deciding
between technology options. For example, the choice between an AIS solution and a GIS
solution. Life cycle costing is the process of analysis to assess the total cost of acquisition,
ownership and disposal of a product [17]. LCC considers the total cost of the asset which
includes the asset acquisition capital cost, maintenance and operation cost and disposal
cost; including the cost of non-availability of the asset. In T&D the cost of unavailability
would typically be the cost of unserved energy due to unplanned outages (due to asset
failures or performance issues). Life Cycle Cost Analysis is a useful instrument to identify
the main cost drivers of a network which can be a key enabler to drive appropriate actions
to reduce the costs [18]. The Life Cycle Cost equation is given as [17]
𝐿𝐶𝐶 = 𝐶𝑜𝑠𝑡𝑎𝑐𝑞𝑢𝑖𝑠𝑡𝑖𝑜𝑛 + 𝐶𝑜𝑠𝑡𝑜𝑤𝑛𝑒𝑟𝑠ℎ𝑖𝑝 + 𝐶𝑜𝑠𝑡𝑑𝑖𝑠𝑝𝑜𝑠𝑎𝑙
(1)
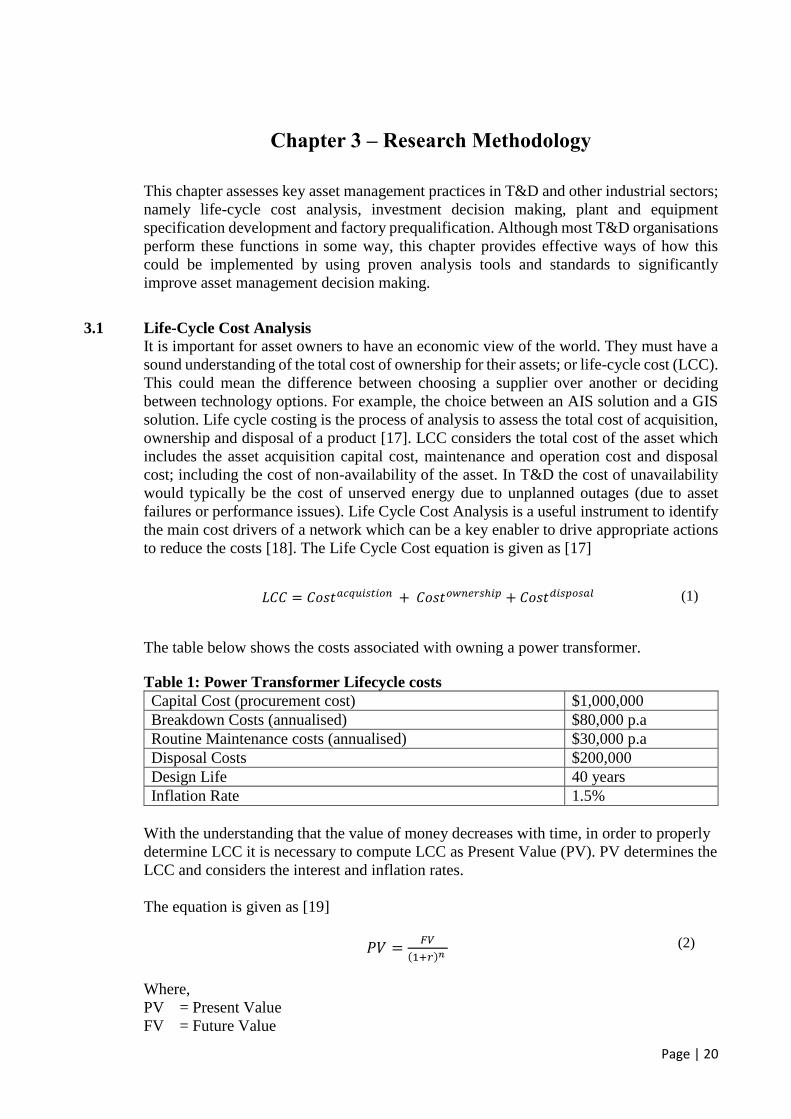
The table below shows the costs associated with owning a power transformer.
Table 1: Power Transformer Lifecycle costs
Capital Cost (procurement cost) $1,000,000
Breakdown Costs (annualised) $80,000 p.a
Routine Maintenance costs (annualised) $30,000 p.a
Disposal Costs $200,000
Design Life 40 years
Inflation Rate 1.5%
With the understanding that the value of money decreases with time, in order to properly
determine LCC it is necessary to compute LCC as Present Value (PV). PV determines the
LCC and considers the interest and inflation rates.
The equation is given as [19]
𝑃𝑉 =𝐹𝑉
(1+𝑟)𝑛
(2)
Where,
PV = Present Value
FV = Future Value
Page | 21
R = Rate of return
n = number of periods (design life)
FV = $1,000,000 + $200,000 + 40($80,000+$30,000)
= $5,600,000
Therefore, 𝑃𝑉 =$5,600,000
(1+1.5%)40 = $3,087,068.
Therefore the PV lifecycle cost of the power transformer is $3,087,078.
3.2 Investment Decision-Making
Asset Managers must apply financial thinking to the investment decisions. Investment
decisions must take into account Lifecycle cost and Return on Investment. Net Present
Value (NPV) is a valuable way in determining the viability of investments. Essentially
NPV is a comparison between PV cash inflows and PV cash outflows over the design life
of the asset.
NPV = PV Cash Inflows − PV Cash Outflows
(3)
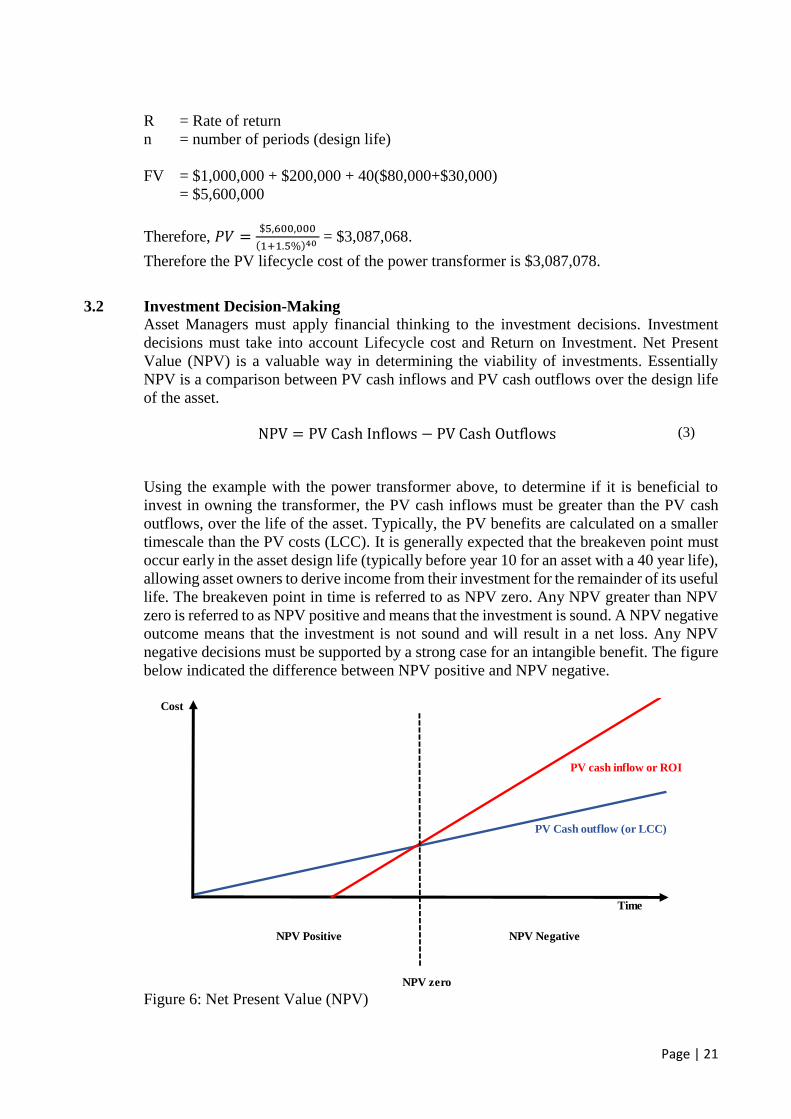
Using the example with the power transformer above, to determine if it is beneficial to
invest in owning the transformer, the PV cash inflows must be greater than the PV cash
outflows, over the life of the asset. Typically, the PV benefits are calculated on a smaller
timescale than the PV costs (LCC). It is generally expected that the breakeven point must
occur early in the asset design life (typically before year 10 for an asset with a 40 year life),
allowing asset owners to derive income from their investment for the remainder of its useful
life. The breakeven point in time is referred to as NPV zero. Any NPV greater than NPV
zero is referred to as NPV positive and means that the investment is sound. A NPV negative
outcome means that the investment is not sound and will result in a net loss. Any NPV
negative decisions must be supported by a strong case for an intangible benefit. The figure
below indicated the difference between NPV positive and NPV negative.
Figure 6: Net Present Value (NPV)
Cost
PV cash inflow or ROI
PV Cash outflow (or LCC)
Time
NPV zero
NPV Positive NPV Negative
Page | 22
3.3 Plant and Equipment Specification Development
Plant and equipment specification content will typically cover 3 main areas; these are:
(i.) Industry Technical Standards
(ii.) Functional Requirements
(iii.) Technical and Performance Requirements
3.3.1 Industry Technical Standards
Industry standards consist of established norms, criteria, regulatory rules and practices.
These standards are widely known and accepted in T&D, and form a crucial part of
compliance. It is important to stipulate what document takes precedence in the event of a
discrepancy or contradiction between the plant and equipment specification and a
referenced industry standard. Usually, it is clearly stated that the customer plant and
equipment specification takes precedence [20]. An example of some technical standards
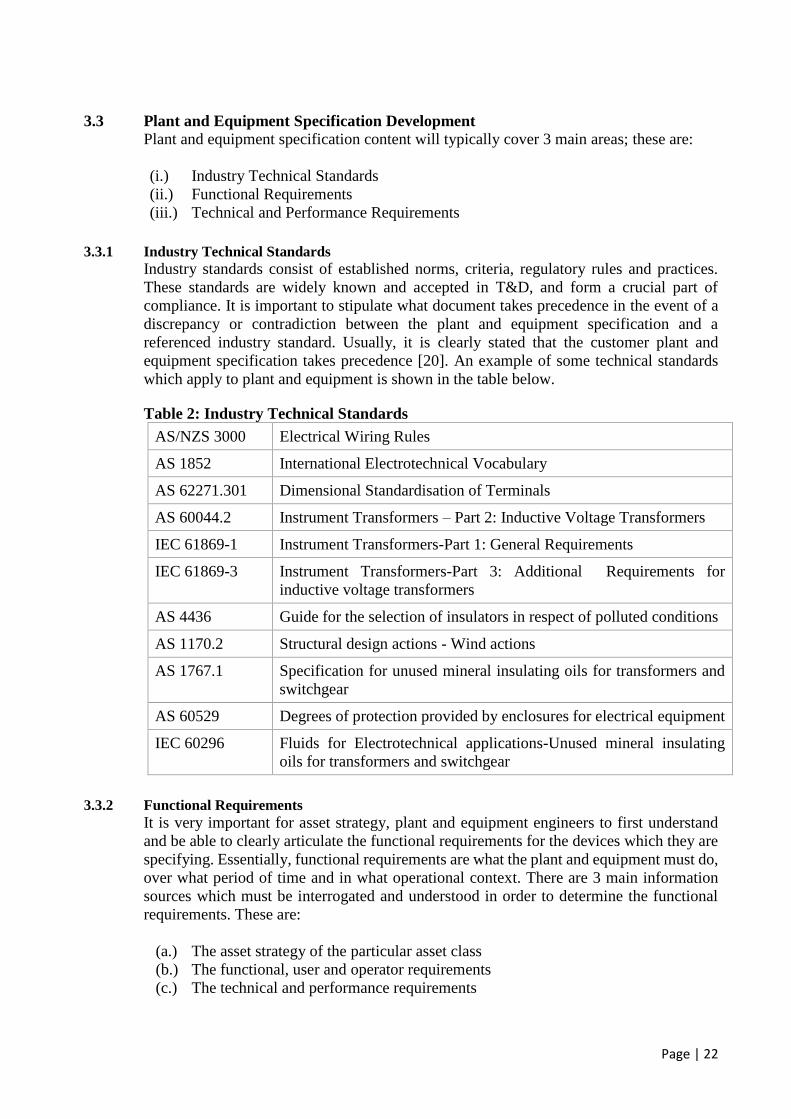
which apply to plant and equipment is shown in the table below.
Table 2: Industry Technical Standards
AS/NZS 3000 Electrical Wiring Rules
AS 1852 International Electrotechnical Vocabulary
AS 62271.301 Dimensional Standardisation of Terminals
AS 60044.2 Instrument Transformers – Part 2: Inductive Voltage Transformers
IEC 61869-1 Instrument Transformers-Part 1: General Requirements
IEC 61869-3 Instrument Transformers-Part 3: Additional Requirements for
inductive voltage transformers
AS 4436 Guide for the selection of insulators in respect of polluted conditions
AS 1170.2 Structural design actions - Wind actions
AS 1767.1 Specification for unused mineral insulating oils for transformers and
switchgear
AS 60529 Degrees of protection provided by enclosures for electrical equipment
IEC 60296 Fluids for Electrotechnical applications-Unused mineral insulating
oils for transformers and switchgear
3.3.2 Functional Requirements
It is very important for asset strategy, plant and equipment engineers to first understand
and be able to clearly articulate the functional requirements for the devices which they are
specifying. Essentially, functional requirements are what the plant and equipment must do,
over what period of time and in what operational context. There are 3 main information
sources which must be interrogated and understood in order to determine the functional
requirements. These are:
(a.) The asset strategy of the particular asset class
(b.) The functional, user and operator requirements
(c.) The technical and performance requirements

Page | 23
In line with PAS55 and ISO 55000 an asset class would generally cover a certain type of
equipment or group of equipment. Examples of asset classes are:
(a.) Digital protection systems
(b.) Power transformers
(c.) Circuit breakers
(d.) Disconnectors
(e.) Transmission Line Lattice Structures and Poles
The strategy for each asset class defines at a high level the life of the asset from creation
to disposal. As a minimum the asset strategy will define the following parameters which
will be essential for translation into functional requirements:
(i.) The operating context
(ii.) Design life in years
(iii.) Known failure modes
(iv.) Maintenance strategy
(v.) Mid-life and end of life strategies
(vi.) Emergency replacement strategies
(vii.) Population of manufacturers, types and ages
(viii.) Reliability expectations
(ix.) Availability expectations
(x.) Expected mean times to repair
(xi.) Spares requirements
These parameters will need to be translated into functional requirements. Some asset
strategy requirements will result in multiple functional requirements. The functional
requirements will translate the user, operating and performance requirements into
specification descriptions. These will generally cover:
(a.) Safety/Environment
(b.) Planning and design
(c.) Performance
(d.) Constructability
(e.) Maintainability
(f.) Operability
(g.) Availability/Reliability
(h.) Testing and validation requirements
(i.) Asset Interface requirements
An example for a Power Transformer is discussed. The Power Transformer has an
economic and design life of 40 years.
Table 3: Functional Requirements
Asset Strategy Functional Requirements
40 year design life The Transformer shall perform its intended function for 40 years
8 hour MTTR 1. The Transformer shall be designed to allow for a repair
and return to service 8 hours after a minor functional
failure
Page | 24
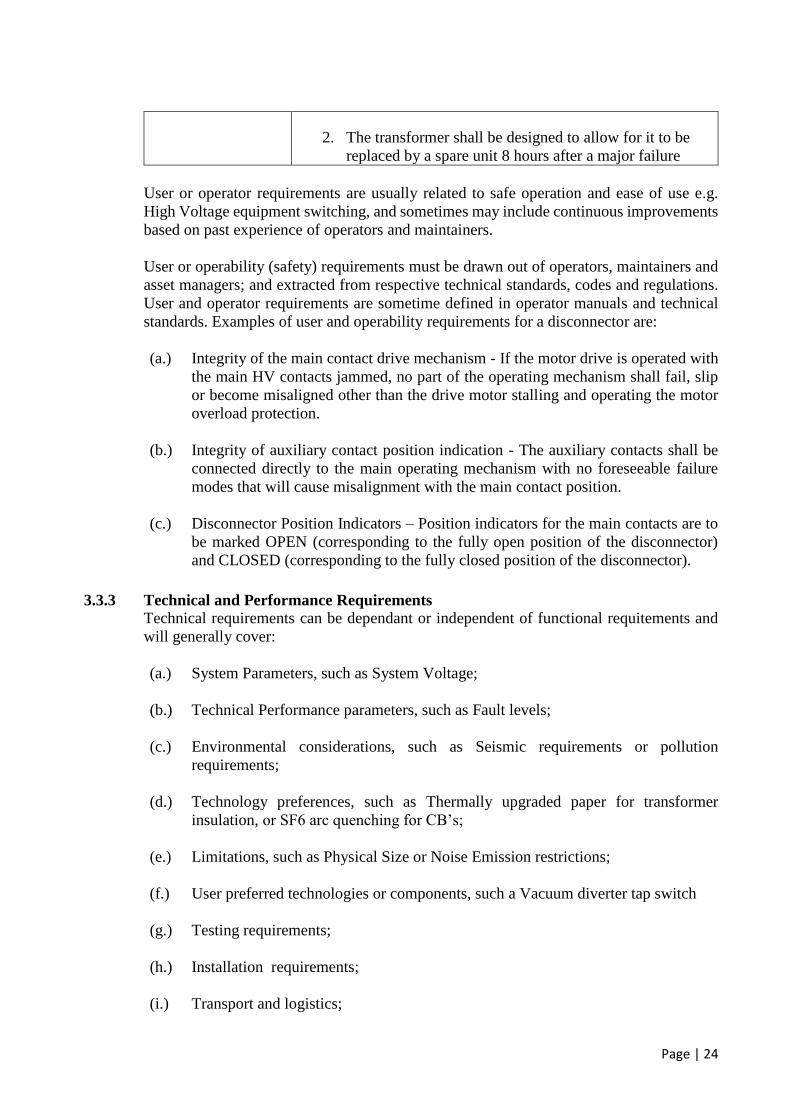
2. The transformer shall be designed to allow for it to be
replaced by a spare unit 8 hours after a major failure
User or operator requirements are usually related to safe operation and ease of use e.g.
High Voltage equipment switching, and sometimes may include continuous improvements
based on past experience of operators and maintainers.
User or operability (safety) requirements must be drawn out of operators, maintainers and
asset managers; and extracted from respective technical standards, codes and regulations.
User and operator requirements are sometime defined in operator manuals and technical
standards. Examples of user and operability requirements for a disconnector are:
(a.) Integrity of the main contact drive mechanism - If the motor drive is operated with
the main HV contacts jammed, no part of the operating mechanism shall fail, slip
or become misaligned other than the drive motor stalling and operating the motor
overload protection.
(b.) Integrity of auxiliary contact position indication - The auxiliary contacts shall be
connected directly to the main operating mechanism with no foreseeable failure
modes that will cause misalignment with the main contact position.
(c.) Disconnector Position Indicators – Position indicators for the main contacts are to
be marked OPEN (corresponding to the fully open position of the disconnector)
and CLOSED (corresponding to the fully closed position of the disconnector).
3.3.3 Technical and Performance Requirements
Technical requirements can be dependant or independent of functional requitements and
will generally cover:
(a.) System Parameters, such as System Voltage;
(b.) Technical Performance parameters, such as Fault levels;
(c.) Environmental considerations, such as Seismic requirements or pollution
requirements;
(d.) Technology preferences, such as Thermally upgraded paper for transformer
insulation, or SF6 arc quenching for CB’s;
(e.) Limitations, such as Physical Size or Noise Emission restrictions;
(f.) User preferred technologies or components, such a Vacuum diverter tap switch
(g.) Testing requirements;
(h.) Installation requirements;
(i.) Transport and logistics;

Page | 25
(j.) Documentation requirements, such as Outline drawings are to be supplied in 3D;
(k.) Installation standards which must be complied with.
Table 4 and Table 5 provide an example of technical and performance requirements for a
300kV AIS disconnector.
Table 4: 300kV Disconnector Performance Requirements (Part 1)
Description Unit
Technical &
Performance
Requirement
System Details
System Nominal Voltage kV 275
System Highest Voltage kV 300
Frequency Hz 50Hz
System Neutral Effectively earthed
Phase to earth clearance mm 2400
Terminal Palm Height- Low Level mm 5500
Section clearance mm 4990
Ground clearance mm 2440
Service Conditions
Ambient temperature range °C -5 to +55
24 hour average maximum ambient temperature °C 37
Highest altitude m <1000
Maximum wind speed m/s 46
Number of phases No. 3
Phase-phase clearance mm 4000
Rated Insulation Level
Switching Impulse Withstand - Phase to Earth kVp 850
Switching Impulse Withstand - Between Phases kVp 1275
Switching Impulse Withstand - Across Isolating
Distance kVp 700(+245)
Lightning Impulse Withstand - Phase to Earth &
Between Phases kVp 1050
Lightning Impulse Withstand - Across Isolating
Distance kVp 1050(+170)
Power Frequency Withstand - Phase to Earth &
Between Phases kV 395
Power Frequency Withstand - Across Isolating
Distance kV 435
Rated Frequency Hz 50
Disconnector Rated Normal Current A >2500
Disconnector Rated short-time withstand current kA >31.5
Disconnector Rated short-circuit making current kA 100
Page | 26
Earth Switch Rated short-time withstand current kA >31.5
Duration of the short-circuit sec >1
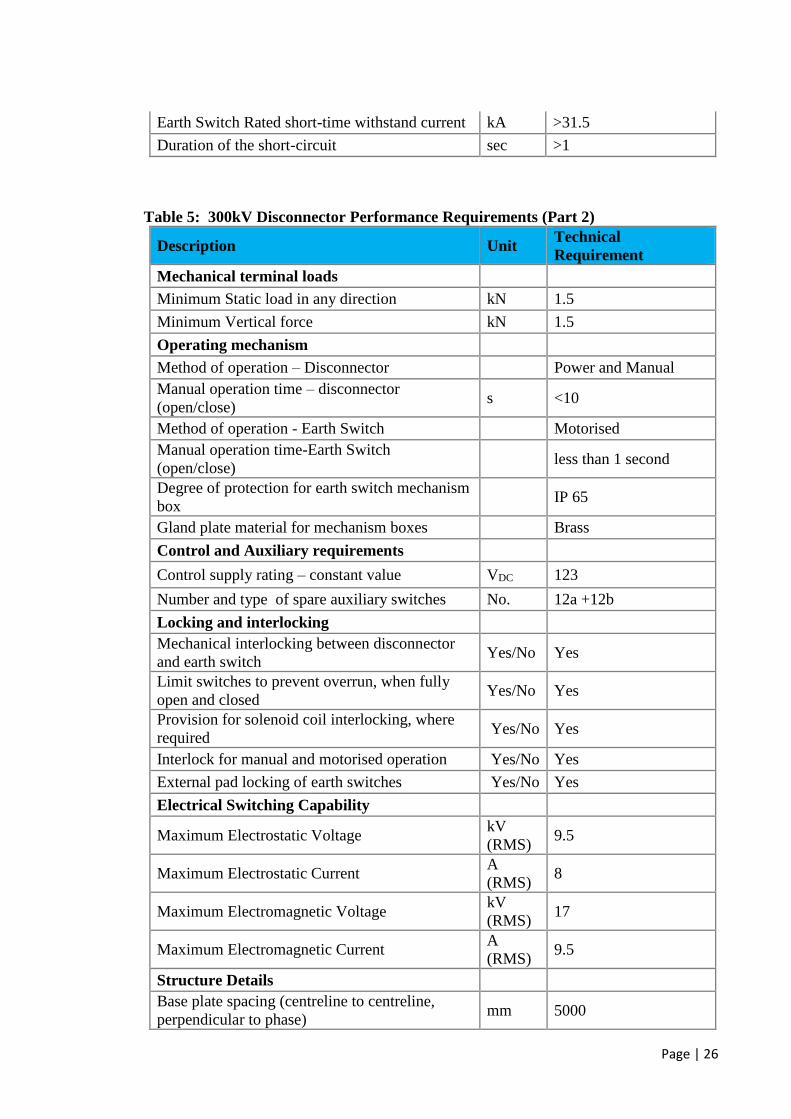
Table 5: 300kV Disconnector Performance Requirements (Part 2)
Description Unit Technical
Requirement
Mechanical terminal loads
Minimum Static load in any direction kN 1.5
Minimum Vertical force kN 1.5
Operating mechanism
Method of operation – Disconnector Power and Manual
Manual operation time – disconnector
(open/close) s <10
Method of operation - Earth Switch Motorised
Manual operation time-Earth Switch
(open/close) less than 1 second
Degree of protection for earth switch mechanism
box IP 65
Gland plate material for mechanism boxes Brass
Control and Auxiliary requirements
Control supply rating – constant value VDC 123
Number and type of spare auxiliary switches No. 12a +12b
Locking and interlocking
Mechanical interlocking between disconnector
and earth switch Yes/No Yes
Limit switches to prevent overrun, when fully
open and closed Yes/No Yes
Provision for solenoid coil interlocking, where
required Yes/No Yes
Interlock for manual and motorised operation Yes/No Yes
External pad locking of earth switches Yes/No Yes
Electrical Switching Capability
Maximum Electrostatic Voltage kV
(RMS) 9.5
Maximum Electrostatic Current A
(RMS) 8
Maximum Electromagnetic Voltage kV
(RMS) 17
Maximum Electromagnetic Current A
(RMS) 9.5
Structure Details
Base plate spacing (centreline to centreline,
perpendicular to phase) mm 5000
Page | 27
Base plate spacing (centreline to centreline,
parallel with phase) mm 3200
Hold down bolt spacing (square arrangement) mm 300
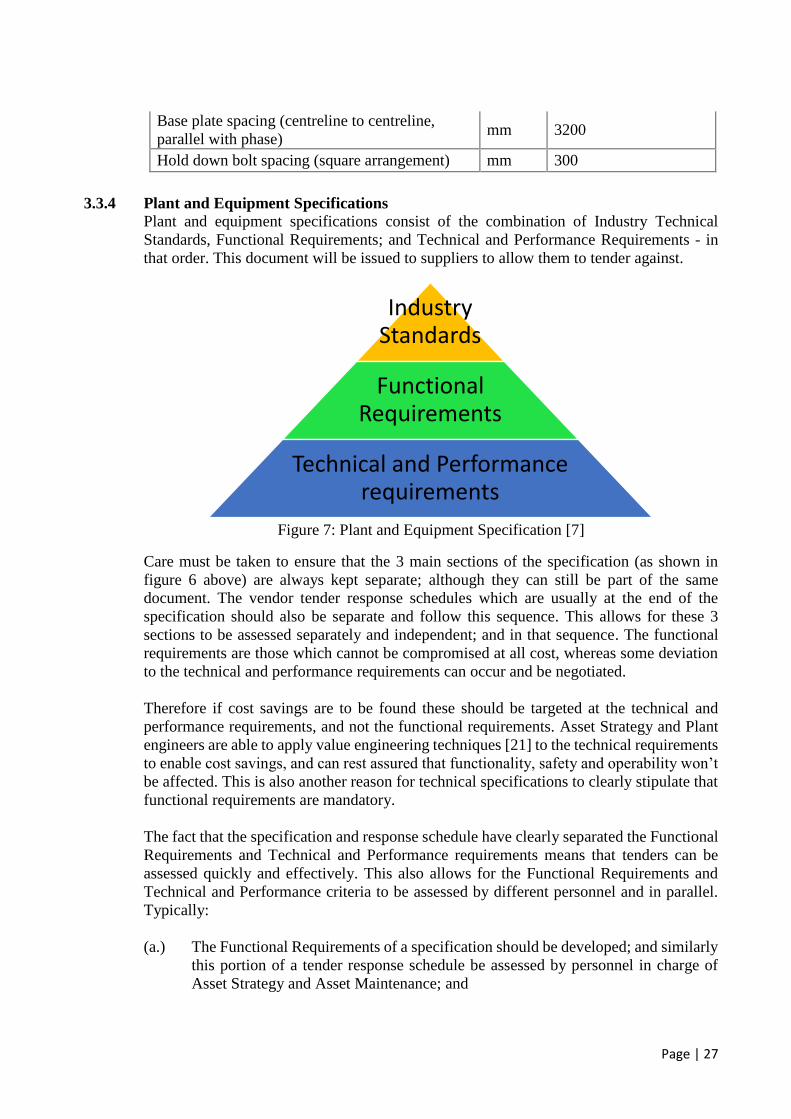
3.3.4 Plant and Equipment Specifications
Plant and equipment specifications consist of the combination of Industry Technical
Standards, Functional Requirements; and Technical and Performance Requirements - in
that order. This document will be issued to suppliers to allow them to tender against.
Figure 7: Plant and Equipment Specification [7]
Care must be taken to ensure that the 3 main sections of the specification (as shown in
figure 6 above) are always kept separate; although they can still be part of the same
document. The vendor tender response schedules which are usually at the end of the
specification should also be separate and follow this sequence. This allows for these 3
sections to be assessed separately and independent; and in that sequence. The functional
requirements are those which cannot be compromised at all cost, whereas some deviation
to the technical and performance requirements can occur and be negotiated.
Therefore if cost savings are to be found these should be targeted at the technical and
performance requirements, and not the functional requirements. Asset Strategy and Plant
engineers are able to apply value engineering techniques [21] to the technical requirements
to enable cost savings, and can rest assured that functionality, safety and operability won’t
be affected. This is also another reason for technical specifications to clearly stipulate that
functional requirements are mandatory.
The fact that the specification and response schedule have clearly separated the Functional
Requirements and Technical and Performance requirements means that tenders can be
assessed quickly and effectively. This also allows for the Functional Requirements and
Technical and Performance criteria to be assessed by different personnel and in parallel.
Typically:
(a.) The Functional Requirements of a specification should be developed; and similarly
this portion of a tender response schedule be assessed by personnel in charge of
Asset Strategy and Asset Maintenance; and
Industry Standards
Functional Requirements
Technical and Performance requirements
Page | 28
(b.) The Technical and Performance Requirements of a specification should be
developed; and similarly this portion of a tender response schedule be assessed by
personnel in charge of Plant and Equipment design, application and integration.
Suppliers and vendors will also find it easy to respond to a clear and well defined
specification with the benefit of knowing what the non-negotiables are, and allowing them
to focus more effort on achieving the mandatory outcomes. It is also useful to be able to
first compare different supplier responses against the Functional (mandatory) requirements
and eliminate those suppliers from competing early in the procurement phase. This
inherently allows more time to evaluate the compliant tenders on the remaining technical,
financial and commercial criteria. This is illustrated below in a 2-staged tender review
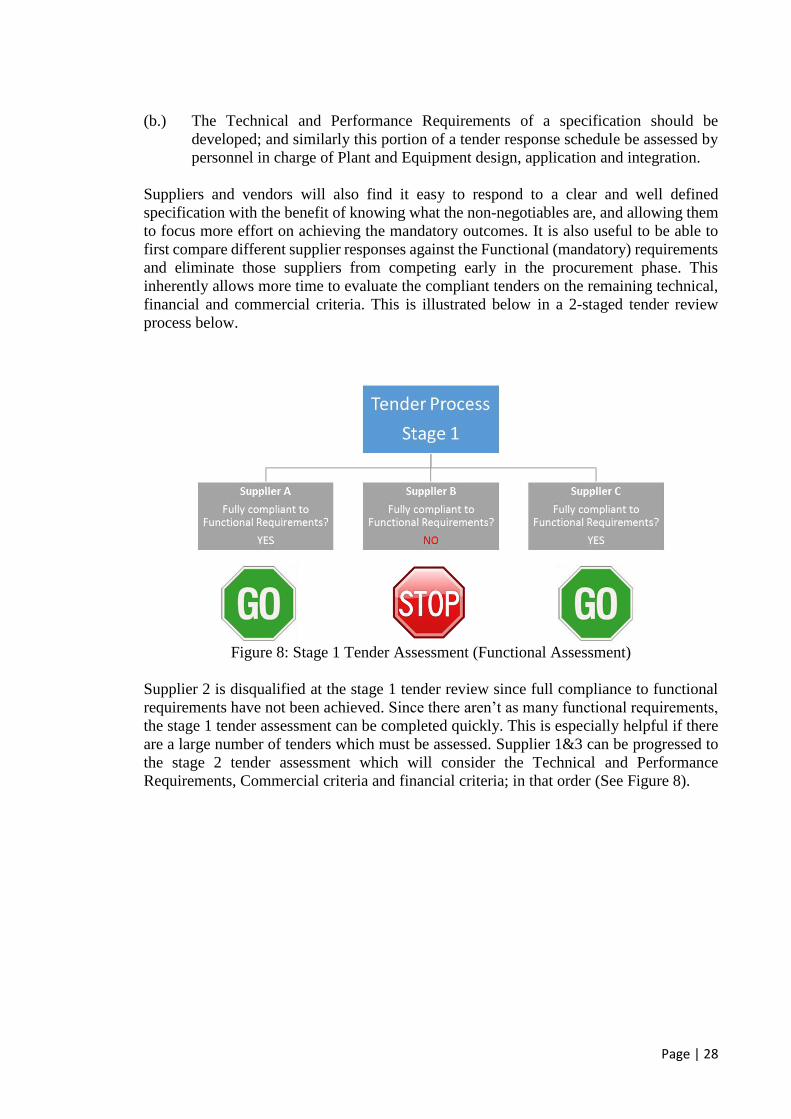
process below.
Figure 8: Stage 1 Tender Assessment (Functional Assessment)
Supplier 2 is disqualified at the stage 1 tender review since full compliance to functional
requirements have not been achieved. Since there aren’t as many functional requirements,
the stage 1 tender assessment can be completed quickly. This is especially helpful if there
are a large number of tenders which must be assessed. Supplier 1&3 can be progressed to
the stage 2 tender assessment which will consider the Technical and Performance
Requirements, Commercial criteria and financial criteria; in that order (See Figure 8).
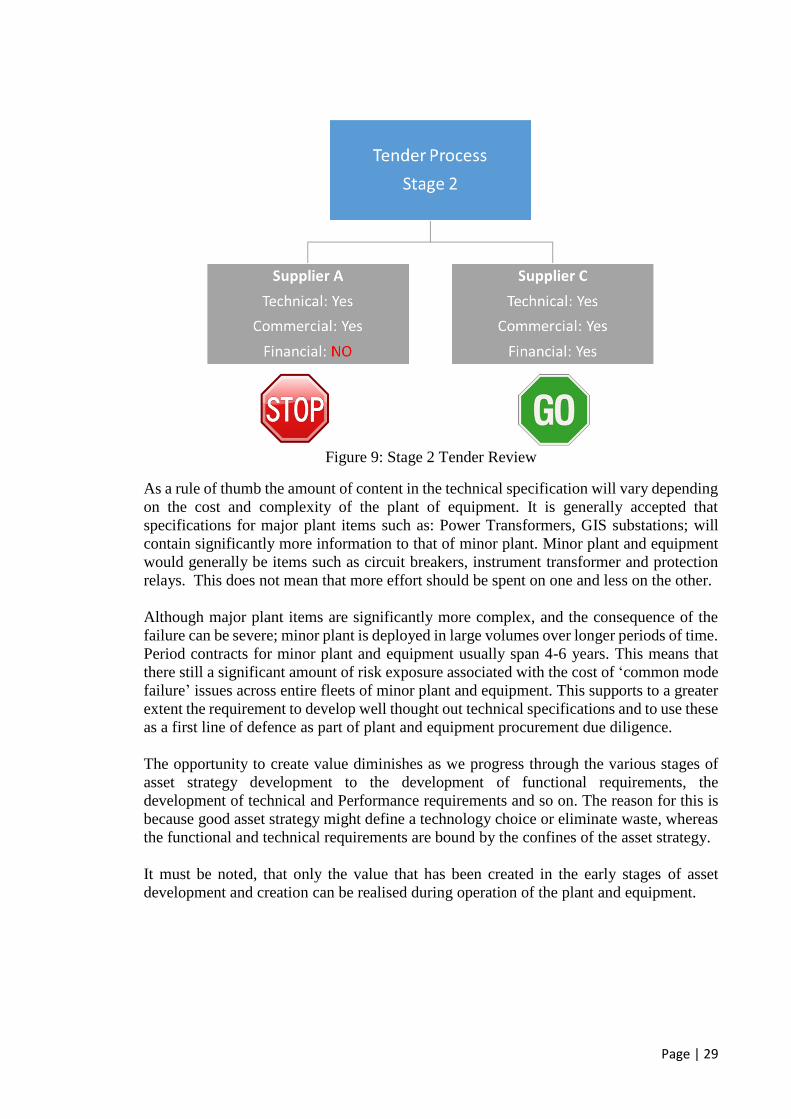
Page | 29
Figure 9: Stage 2 Tender Review
As a rule of thumb the amount of content in the technical specification will vary depending
on the cost and complexity of the plant of equipment. It is generally accepted that
specifications for major plant items such as: Power Transformers, GIS substations; will
contain significantly more information to that of minor plant. Minor plant and equipment
would generally be items such as circuit breakers, instrument transformer and protection
relays. This does not mean that more effort should be spent on one and less on the other.
Although major plant items are significantly more complex, and the consequence of the
failure can be severe; minor plant is deployed in large volumes over longer periods of time.
Period contracts for minor plant and equipment usually span 4-6 years. This means that
there still a significant amount of risk exposure associated with the cost of ‘common mode
failure’ issues across entire fleets of minor plant and equipment. This supports to a greater
extent the requirement to develop well thought out technical specifications and to use these
as a first line of defence as part of plant and equipment procurement due diligence.
The opportunity to create value diminishes as we progress through the various stages of
asset strategy development to the development of functional requirements, the
development of technical and Performance requirements and so on. The reason for this is
because good asset strategy might define a technology choice or eliminate waste, whereas
the functional and technical requirements are bound by the confines of the asset strategy.
It must be noted, that only the value that has been created in the early stages of asset
development and creation can be realised during operation of the plant and equipment.
Page | 30
Figure 10: Creation and realisation of value
3.4 Factory Assessment and Prequalification
As mentioned above, T&D asset managers procure large, complex and expensive assets;
as well as large volumes of relatively low value assets. Each scenario has long term risks
and consequences which must be effectively managed. Desktop assessments of suppliers
and factories is not considered as good practice just by itself. The quality of factories and
their products vary widely, and similarly the performance and reliability requirements of
T&D asset managers and their organisations vary widely. T&D asset managers must
convince themselves that suppliers and factories are as good as they say they are on paper.
Considering the long term cost and risk which must be managed, it is worth the additional
effort to properly assess the capability of suppliers prior to plant and equipment
procurement. It is important for T&D asset managers to have the tools, methodologies and
capabilities to be able to properly assess factories against their specification requirements.
The main criteria against which factories are evaluated are [7]:
(i) Material supply chain, storage and handling
(ii) Equipment Design process
(iii) Equipment Manufacture process
(iv) Testing Capability
(v) Quality systems
(vi) Warranty and after sales services
It is prudent for T&D asset managers to send appropriately experienced and skilled
personnel to one or more shortlisted factories in order to assess the factories against the
criteria listed above. The cost of this exercises is insignificance when compared to the cost
of the plant and equipment (whether it be a single piece of large plant or a large fleet of
smaller equipment). Furthermore, it would be too late if quality or performance issues are
realised during operation of the plant and equipment. Where T&D organisations don’t have
the experience, skills and capabilities to adequately assess plant and equipment factories,
this can be sourced from the market.
Value
Time
Creation of value
Realisation of value
Asset Strategy
Technical and
Performance
Requirements
Procurement
and
Implementation
Operations and
Maintenance
Functional
Requirements

Page | 31
3.4.1 Material Supply Chain, Storage and Handling
This applies to all materials and components which the factory buys in order to manufacture
their products. The way in which they manage their own internal supplier chains are very
important in assuring that their end product is able to meet quality and reliability
requirements. As a start it is important that all materials and components are appropriately
stored, systematically and methodically catalogued, tested and tagged where appropriate
with traceability to their Quality Management system (QMS). Considering that T&D
equipment will be subjected to high voltages in most cases, cleanliness of stored materials
and equipment is paramount. Dirt and dust, if not managed well, will almost always have
long term detrimental effects on the equipment being manufactured. The following points
should be verified:
(a.) Valid and up to date material specifications (The factories specifications for the
materials which they procure) [22]
(b.) The contracting mechanism between the factory and its suppliers [22]
(c.) The mechanism in which the factory manages quality issues with its suppliers
(d.) The basis of procurement decision making for material procurement e.g. If the factory
procures materials purely on the lowest price, this might be an avenue for substandard
quality to creep in [22].
(e.) The capability and commitment of the Quality Management staff, particularly the
Quality Manager.
3.4.2 Equipment Design Process
It is important to evaluate the plant and equipment design process. This will generally cover
the:
(a.) Design management and design review process, ensuring that there are sufficient
checks and balances
(b.) Design software for Plant and Equipment Electrical design, mechanical design,
CAD drawing software etc. Check that the most up to date design tools are being
utilised and drawing requirements and standards can be complied with.
(c.) The use of relevant international and internal factory-specific technical standards to
guide their design such as IEC or IEEE. [22]
(d.) Workforce capability. This is to ensure that the people producing the design are
appropriately skilled and qualified. This is usually a qualitative assessment since
T&D personnel typically don’t have the knowledge and skills required to assess
competencies of factory personnel.
(e.) Continuous improvement, taking into account lessons learned from manufacture,
and operations of the plant or equipment being manufactured, including industry-
wide innovations.
3.4.3 Equipment Manufacture Process
The manufacture process is required to be documented in detail, again in line with the
factory QMS. The following will need to be assessed or cited:
(a.) Manufacturing methods are in line with industry standards and practices [22].
(b.) Documented manufacturing procedures and work instructions [22].
(c.) Appropriate tools to do the work [22].
(d.) A clean and ergonomic workspace with good lighting [22].
(e.) Evidence of QA and QC must be obvious on the production line. Inspection and
verification is supported with the use of QC cards or other system.
Page | 32
(f.) Manufacturing machines are up to date, in good condition and working order and
are within calibration. Calibration is to be verified by citing the calibration sticker
on the machine and relevant calibration certificates.
(g.) Good communication between factory workers, factory inspectors and designers.
(h.) Evidence of a skilled workforce.
3.4.4 Testing
Testing generally refers to mechanical and electrical testing against the performance
requirements listed in the technical specification. It is important to verify that the factory
can comply with the testing requirements contained in the technical specification. This
applies to the testing equipment and the process for testing. It is important to check that
testing equipment are within calibration dates. There are known cases during factory testing
it was discovered that the factory testing equipment did not have the capability to perform
one or more tests. At this point it is too late, and T&D asset owners are forced to accept
plant and equipment at risk or pay for testing at a different testing laboratory.
Typically, the following can be verified:
(a.) The location of the test lab. In the factory or elsewhere [22].
(b.) The test lab capability to perform all required tests.
(c.) Site testing capability, that is, at the site installation.
(d.) Capability of the test engineers and technicians.
(e.) The standards to which the lab is capable of testing such as IEC.
(f.) Test reports and documentation management.
(g.) Failure investigation capability and process.
Note. If a factory does not have the capability to test a major plant item, then they generally
won’t have the capability to design and manufacture it.
3.4.5 Quality Systems
The quality system consists of a combination of QA and QC activities which span across
the entire supply chain and production process of the factory; including dispatch and on-
site installation. It is important to ensure that the factory has a robust and mature quality
management system which covers the end to end production process. This must be tested
by tracing components through the entire production life-cycle. Evidence of continuous
improvement and certification to ISO9002 or other accredited bodies provides an added
level of comfort.
It is also important to compare the factories in-factory and in-service failure rates of the
equipment being assessed against industry benchmarks. In-service equipment failure
information is usually accessible from international technical organisations such as
CIGRE, IEEE and EPRI to mention a few.
3.4.6 Warranty and after sales service
Most T&D organisations have warranty requirements. This applies to major and minor
plant and equipment. It is prudent for T&D asset managers to assess and negotiate the
warranty duration, terms and conditions prior to awarding procurement contracts.
Similarly it is important to understand how a warranty claim will be handled should any
issues occur. Access to local sales and technical support is always an advantage. Where
Page | 33
local support is not readily available, it must be understood how the factory intends to
manage defects and warranty claims.
3.4.7 Factory Evaluation Checklist
The outcome and decision from a factory evaluation is usually a factory prequalification
report which concludes in one of 3 outcomes:
(i) Unconditional prequalification: The factory meets all criteria
(ii) Conditional prequalification: The factory meets all mandatory criteria, however
needs to make some minor improvements to meet some lower level criteria
(iii) Disqualification: The factory does not meet one or more mandatory criteria
It must be noted that factory prequalification is only the first step largely focussing on the
factory’s quality, design and manufacturing processes. This does not mean that anything
can be procured at this stage. The next step is to assess the specific equipment class against
the functional and technical requirements. This is described in the next section.
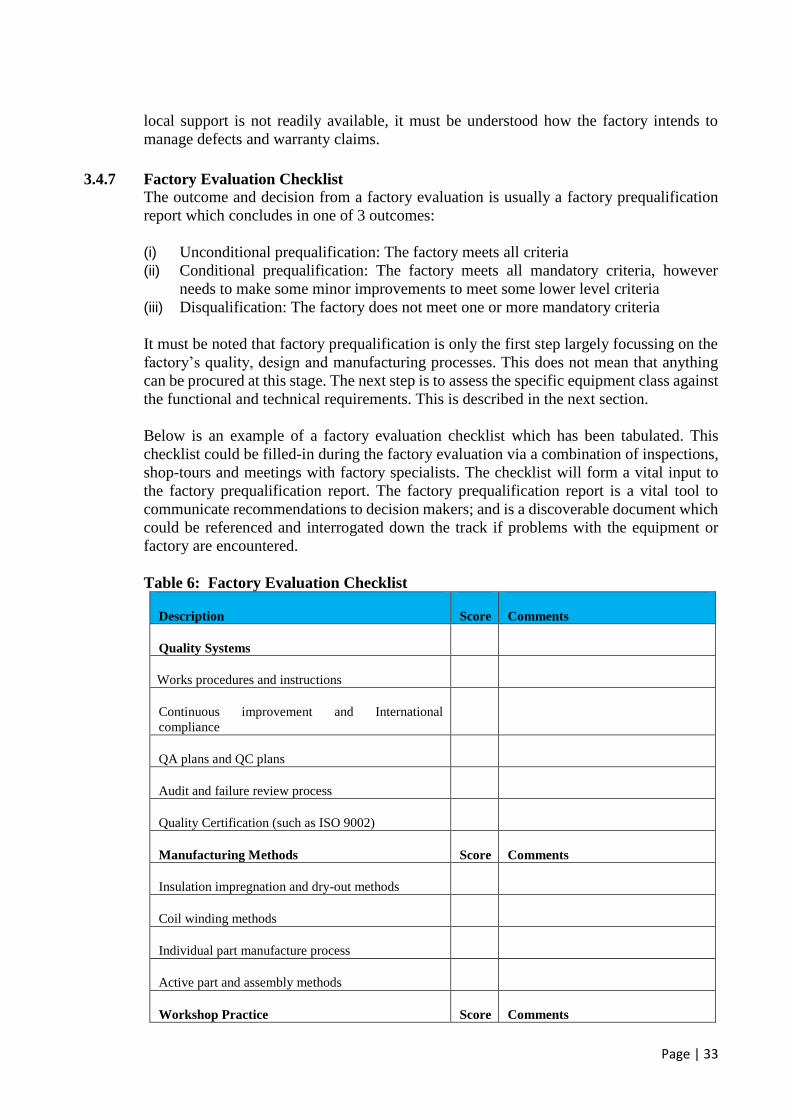
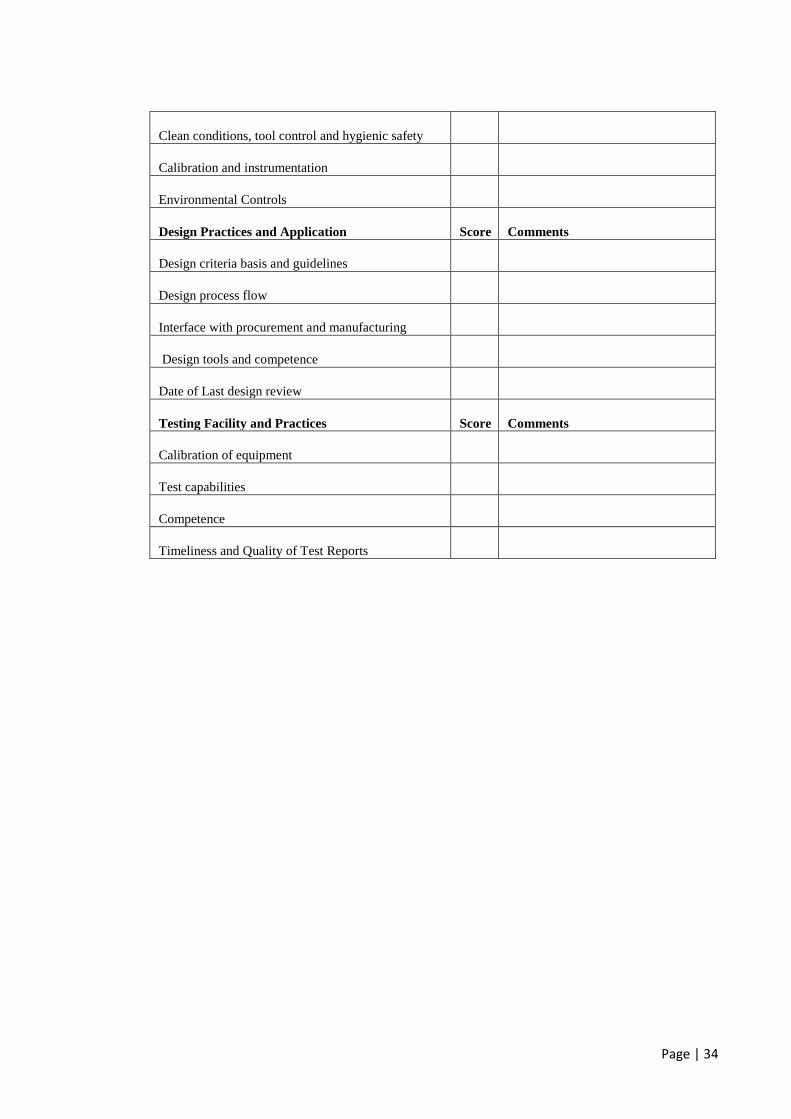
Below is an example of a factory evaluation checklist which has been tabulated. This
checklist could be filled-in during the factory evaluation via a combination of inspections,
shop-tours and meetings with factory specialists. The checklist will form a vital input to
the factory prequalification report. The factory prequalification report is a vital tool to
communicate recommendations to decision makers; and is a discoverable document which
could be referenced and interrogated down the track if problems with the equipment or
factory are encountered.
Table 6: Factory Evaluation Checklist
Description Score Comments
Quality Systems
Works procedures and instructions
Continuous improvement and International
compliance
QA plans and QC plans
Audit and failure review process
Quality Certification (such as ISO 9002)
Manufacturing Methods Score Comments
Insulation impregnation and dry-out methods
Coil winding methods
Individual part manufacture process
Active part and assembly methods
Workshop Practice Score Comments
Page | 34
Clean conditions, tool control and hygienic safety
Calibration and instrumentation
Environmental Controls
Design Practices and Application Score Comments
Design criteria basis and guidelines
Design process flow
Interface with procurement and manufacturing
Design tools and competence
Date of Last design review
Testing Facility and Practices Score Comments
Calibration of equipment
Test capabilities
Competence
Timeliness and Quality of Test Reports
Page | 35
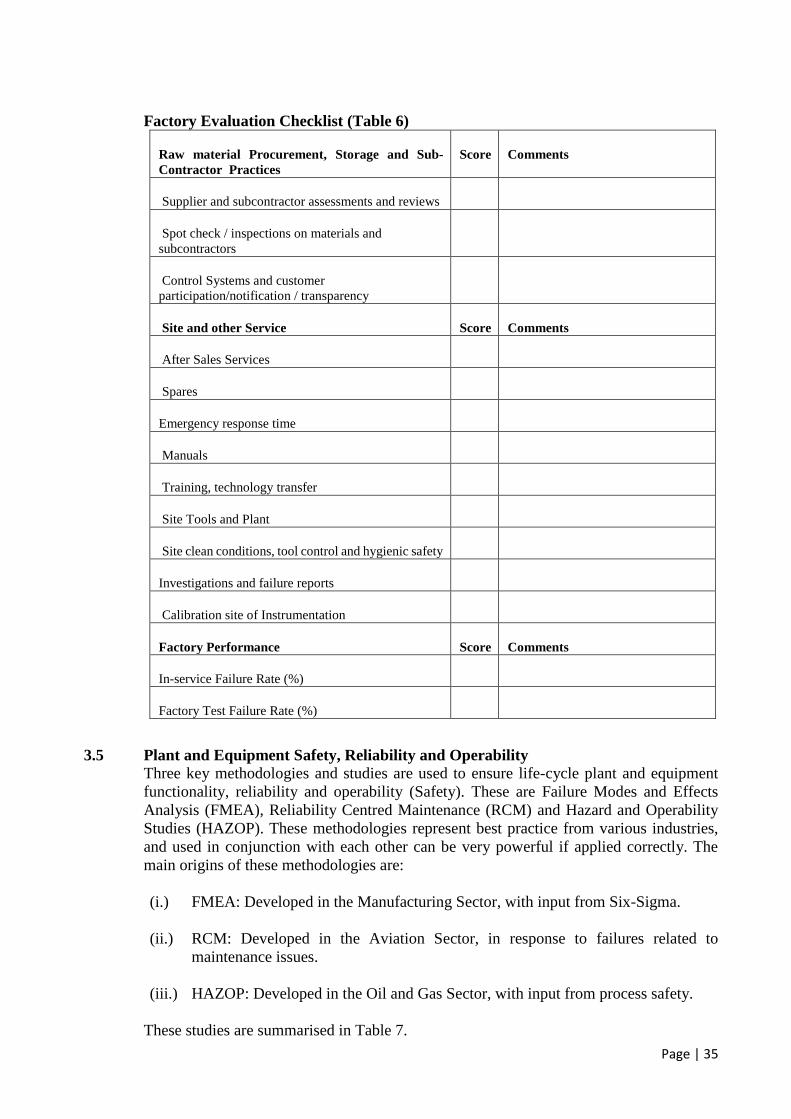
Factory Evaluation Checklist (Table 6)
Raw material Procurement, Storage and Sub-
Contractor Practices
Score Comments
Supplier and subcontractor assessments and reviews
Spot check / inspections on materials and
subcontractors
Control Systems and customer
participation/notification / transparency
Site and other Service Score Comments
After Sales Services
Spares
Emergency response time
Manuals
Training, technology transfer
Site Tools and Plant
Site clean conditions, tool control and hygienic safety
Investigations and failure reports
Calibration site of Instrumentation
Factory Performance Score Comments
In-service Failure Rate (%)
Factory Test Failure Rate (%)
3.5 Plant and Equipment Safety, Reliability and Operability
Three key methodologies and studies are used to ensure life-cycle plant and equipment
functionality, reliability and operability (Safety). These are Failure Modes and Effects
Analysis (FMEA), Reliability Centred Maintenance (RCM) and Hazard and Operability
Studies (HAZOP). These methodologies represent best practice from various industries,
and used in conjunction with each other can be very powerful if applied correctly. The
main origins of these methodologies are:
(i.) FMEA: Developed in the Manufacturing Sector, with input from Six-Sigma.
(ii.) RCM: Developed in the Aviation Sector, in response to failures related to
maintenance issues.
(iii.) HAZOP: Developed in the Oil and Gas Sector, with input from process safety.
These studies are summarised in Table 7.
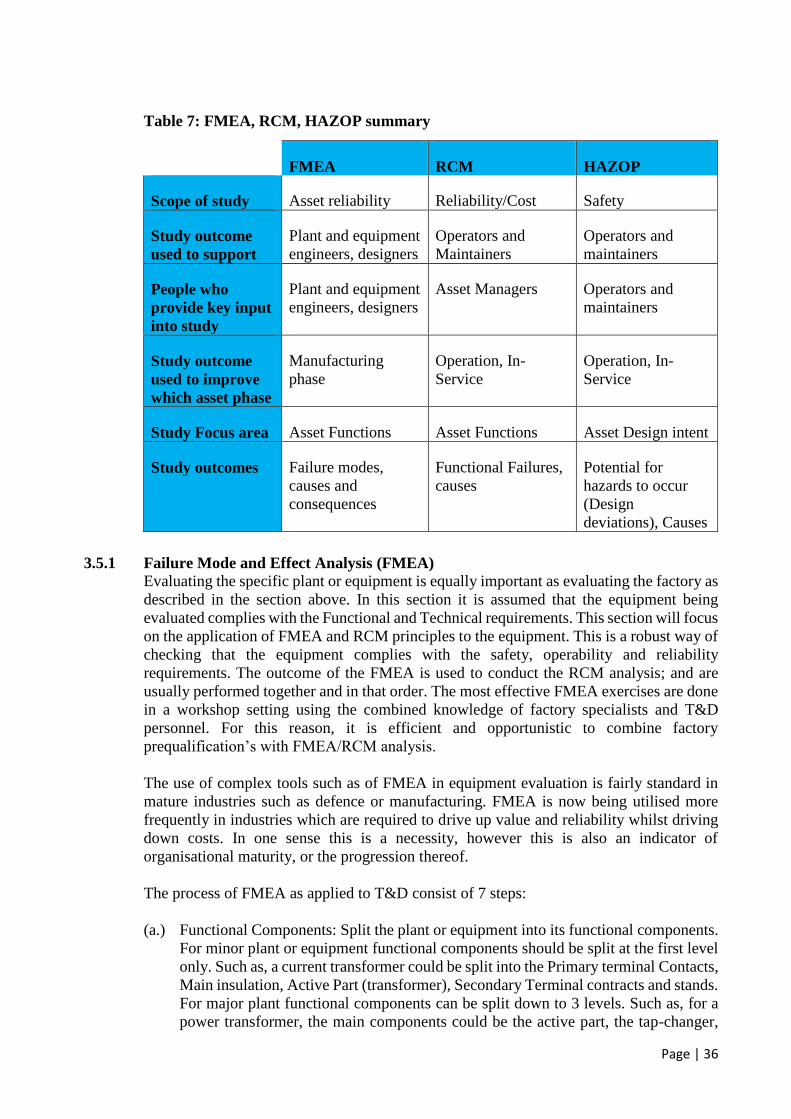
Page | 36
Table 7: FMEA, RCM, HAZOP summary
FMEA RCM HAZOP
Scope of study Asset reliability Reliability/Cost Safety
Study outcome
used to support
Plant and equipment
engineers, designers
Operators and
Maintainers
Operators and
maintainers
People who
provide key input
into study
Plant and equipment
engineers, designers
Asset Managers Operators and
maintainers
Study outcome
used to improve
which asset phase
Manufacturing
phase
Operation, In-
Service
Operation, In-
Service
Study Focus area Asset Functions Asset Functions Asset Design intent
Study outcomes Failure modes,
causes and
consequences
Functional Failures,
causes
Potential for
hazards to occur
(Design
deviations), Causes
3.5.1 Failure Mode and Effect Analysis (FMEA)
Evaluating the specific plant or equipment is equally important as evaluating the factory as
described in the section above. In this section it is assumed that the equipment being
evaluated complies with the Functional and Technical requirements. This section will focus
on the application of FMEA and RCM principles to the equipment. This is a robust way of
checking that the equipment complies with the safety, operability and reliability
requirements. The outcome of the FMEA is used to conduct the RCM analysis; and are
usually performed together and in that order. The most effective FMEA exercises are done
in a workshop setting using the combined knowledge of factory specialists and T&D
personnel. For this reason, it is efficient and opportunistic to combine factory
prequalification’s with FMEA/RCM analysis.
The use of complex tools such as of FMEA in equipment evaluation is fairly standard in
mature industries such as defence or manufacturing. FMEA is now being utilised more
frequently in industries which are required to drive up value and reliability whilst driving
down costs. In one sense this is a necessity, however this is also an indicator of
organisational maturity, or the progression thereof.
The process of FMEA as applied to T&D consist of 7 steps:
(a.) Functional Components: Split the plant or equipment into its functional components.
For minor plant or equipment functional components should be split at the first level
only. Such as, a current transformer could be split into the Primary terminal Contacts,
Main insulation, Active Part (transformer), Secondary Terminal contracts and stands.
For major plant functional components can be split down to 3 levels. Such as, for a
power transformer, the main components could be the active part, the tap-changer,

Page | 37
the insulation systems etc. Each of these components should be split into sub-
components. Such as, the active part could be split into the core, the main windings
and the compensation windings. This can be done one level further if required.
(b.) Failure modes: Determine the potential failure modes for the various functions are
derived in the step above. Usually there are many known failure modes based on past
experience, and some functions can have many failure modes [23].
(c.) Failure Effects: Determine the effect of the failure mode, that is, what will happen if
the failure mode were to occur. In some cases the failure mode will result in the plant
or equipment not being able to perform its primary function and need to be taken out
of service; this is a full functional failure. In some cases the plant or equipment would
still be able to perform its primary function; this is a partial functional failure. It is
important to have a good idea of which of these 2 effects the failure mode falls into.
(d.) Failure Occurrence (O): Determine how often this type of failure mode is expected
to occur within the life of the equipment based on historical manufacturing and
maintenance information. For simplification, less than 2% failure rate per annum will
be applied a score of 1 and greater than 2% per annum applied a score of 2.
(e.) Failure severity (S): The failure severity has a direct link to the failure effect. For a
partial functional failure a score of 1 is achieved, whereas a full functional failure
attracts a score of 2.
(f.) Failure detectability (D): This is an indicator of the failure mode is detectable or not.
A failure mode can be detected by condition monitoring (including online condition
monitoring). Some failure modes cannot readily be detected, such as CB contact
wear. Detectable failure modes achieve a score of 1 whereas undetectable failure
modes achieve a score of 2.
(g.) Risk Priority number (RPN): The RPN is calculated as RPN = O x S x D [23]. The
RPN allows the failure modes to be prioritised to allow for the higher risk items to be
assessed first.
The disconnector picture below (minor plant example) shows the main functional
components in different colours, and their sub-components shown by the numbers.

Page | 38
Figure 11: Disconnector functional component diagram [24]
A major plant item, being significantly more complex will have more functional
components, and hence will be subject to more failure modes. Similarly the consequence
of failure is generally much higher.
The diagram of the power transformer illustrates different functional components as shown
in figure 12.
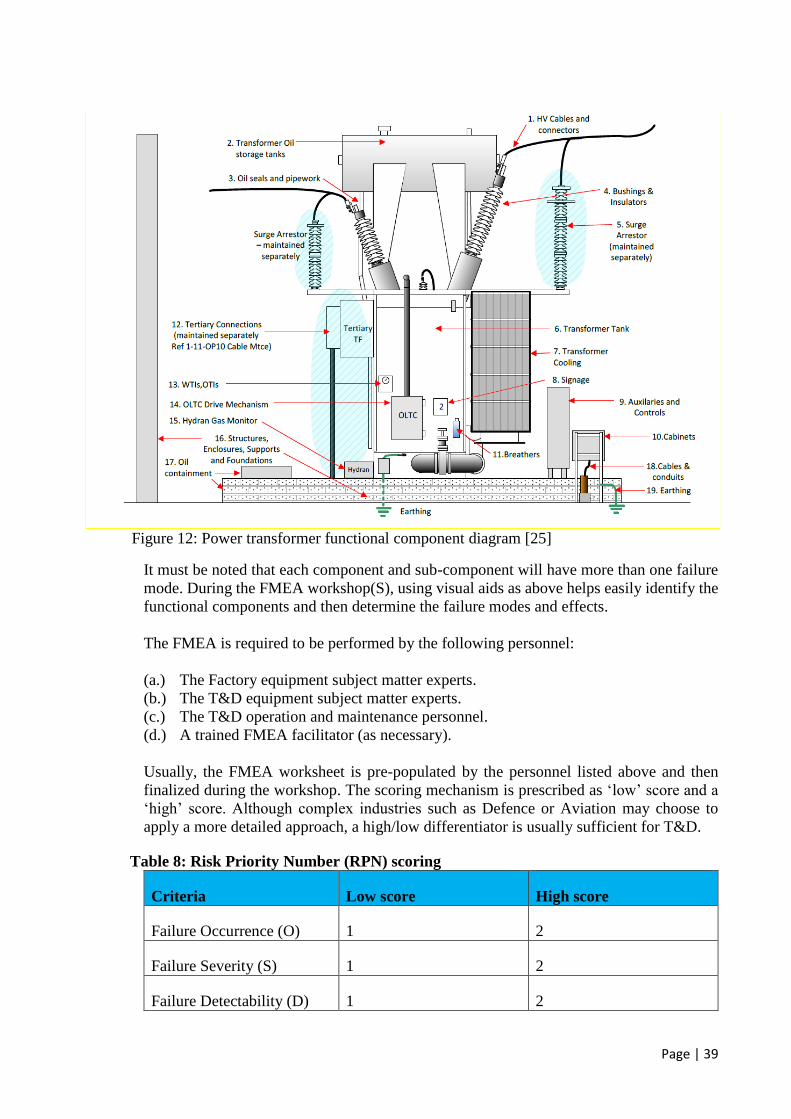
Page | 39
Figure 12: Power transformer functional component diagram [25]
It must be noted that each component and sub-component will have more than one failure
mode. During the FMEA workshop(S), using visual aids as above helps easily identify the
functional components and then determine the failure modes and effects.
The FMEA is required to be performed by the following personnel:
(a.) The Factory equipment subject matter experts.
(b.) The T&D equipment subject matter experts.
(c.) The T&D operation and maintenance personnel.
(d.) A trained FMEA facilitator (as necessary).
Usually, the FMEA worksheet is pre-populated by the personnel listed above and then
finalized during the workshop. The scoring mechanism is prescribed as ‘low’ score and a
‘high’ score. Although complex industries such as Defence or Aviation may choose to
apply a more detailed approach, a high/low differentiator is usually sufficient for T&D.
Table 8: Risk Priority Number (RPN) scoring
Criteria Low score High score
Failure Occurrence (O) 1 2
Failure Severity (S) 1 2
Failure Detectability (D) 1 2
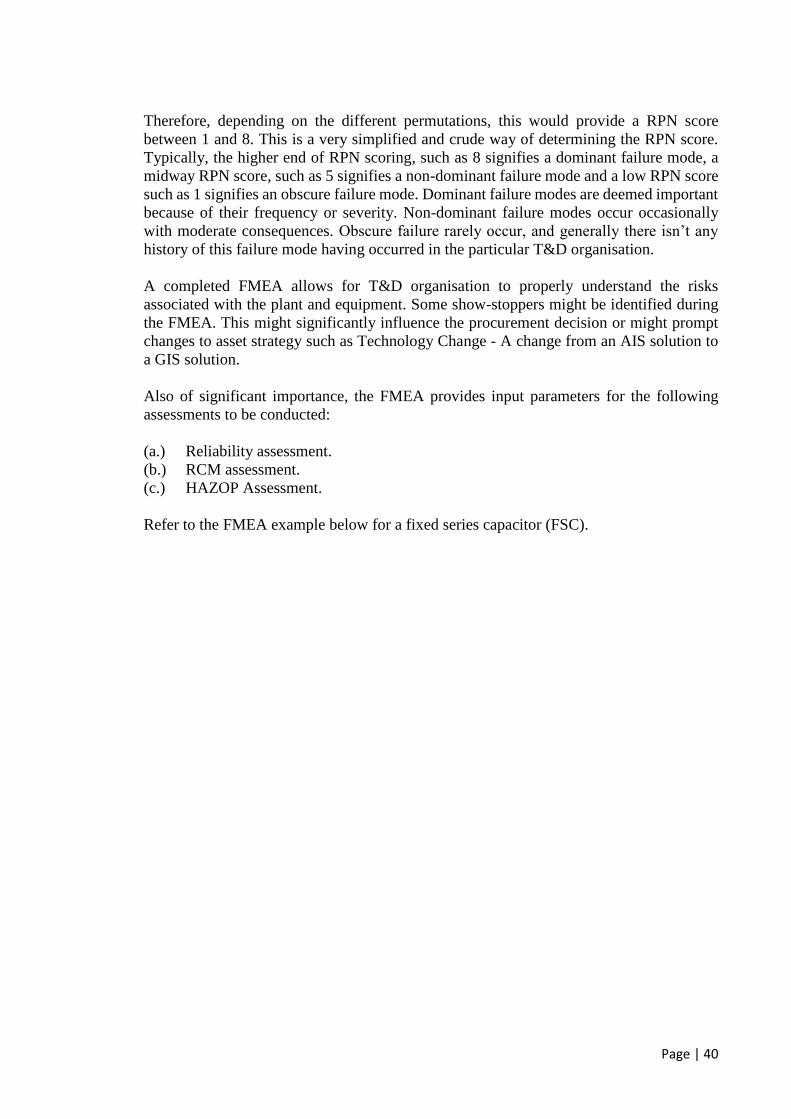
Page | 40
Therefore, depending on the different permutations, this would provide a RPN score
between 1 and 8. This is a very simplified and crude way of determining the RPN score.
Typically, the higher end of RPN scoring, such as 8 signifies a dominant failure mode, a
midway RPN score, such as 5 signifies a non-dominant failure mode and a low RPN score
such as 1 signifies an obscure failure mode. Dominant failure modes are deemed important
because of their frequency or severity. Non-dominant failure modes occur occasionally
with moderate consequences. Obscure failure rarely occur, and generally there isn’t any
history of this failure mode having occurred in the particular T&D organisation.
A completed FMEA allows for T&D organisation to properly understand the risks
associated with the plant and equipment. Some show-stoppers might be identified during
the FMEA. This might significantly influence the procurement decision or might prompt
changes to asset strategy such as Technology Change - A change from an AIS solution to
a GIS solution.
Also of significant importance, the FMEA provides input parameters for the following
assessments to be conducted:
(a.) Reliability assessment.
(b.) RCM assessment.
(c.) HAZOP Assessment.
Refer to the FMEA example below for a fixed series capacitor (FSC).

Page | 41
Table 9: Failure Mode and Effects Analysis example
FMEA
Component Function Failure mode Failure effect Failure Consequences Detection method or
symptom
Redundancy
provided S O D RPN
Capacitors
To produce
reactive
power
Element
failure
Faulted element (and
parallel group) is
short-circuited
Unit produces less
reactive power, higher
unbalance current
Higher unbalance
current, offline
capacitance
measurement
No 1 1 1
1
Leakage in
bushing or
welding seam
Element voltage
withstand capability
decreases
Element short-circuit,
environmental concerns
Higher unbalance
current, offline visual
inspection
No 2 2 1
4
Loose
connection in
inter-rack
wiring
Connection
resistance increases Hot spot
Higher unbalance
current, thermography No 2 2 2
8
MOV
To protect
capacitors
from
overvoltage
Moisture
inside housing
Leakage current
increases, finally
short-circuit
MOV failure protection
operates, bypassing of
FSC
Online varistor unit
leakage current
monitoring
No 1 1 1
1
Degradation
of varistor
elements
One varistor units
conducts before
others during failure
MOV failure, bypassing
of FSC
Offline varistor unit
voltage measurement No 2 1 2
4
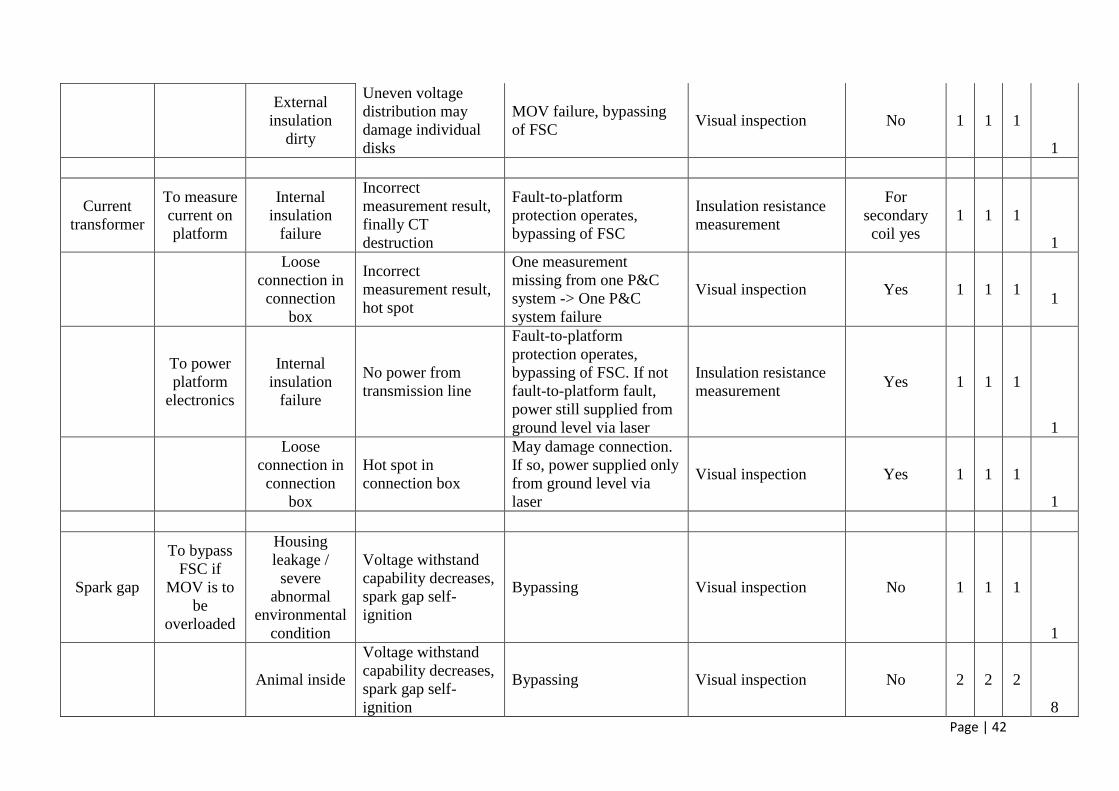
Page | 42
External
insulation
dirty
Uneven voltage
distribution may
damage individual
disks
MOV failure, bypassing
of FSC Visual inspection No 1 1 1
1
Current
transformer
To measure
current on
platform
Internal
insulation
failure
Incorrect
measurement result,
finally CT
destruction
Fault-to-platform
protection operates,
bypassing of FSC
Insulation resistance
measurement
For
secondary
coil yes
1 1 1
1
Loose
connection in
connection
box
Incorrect
measurement result,
hot spot
One measurement
missing from one P&C
system -> One P&C
system failure
Visual inspection Yes 1 1 1 1
To power
platform
electronics
Internal
insulation
failure
No power from
transmission line
Fault-to-platform
protection operates,
bypassing of FSC. If not
fault-to-platform fault,
power still supplied from
ground level via laser
Insulation resistance
measurement Yes 1 1 1
1
Loose
connection in
connection
box
Hot spot in
connection box
May damage connection.
If so, power supplied only
from ground level via
laser
Visual inspection Yes 1 1 1
1
Spark gap
To bypass
FSC if
MOV is to
be
overloaded
Housing
leakage /
severe
abnormal
environmental
condition
Voltage withstand
capability decreases,
spark gap self-
ignition
Bypassing Visual inspection No 1 1 1
1
Animal inside
Voltage withstand
capability decreases,
spark gap self-
ignition
Bypassing Visual inspection No 2 2 2
8

Page | 43
Graphite
electrodes
fault
Voltage withstand
changes, spark gap
self-ignition / forced
triggering fault
Bypassing / MOV
damage Visual inspection No 1 1 1
1
Damping
resistor
insulation
erosion
Resistance decreases
Higher discharge current
for the trigatron. The
Trigatron can withstand
this and operates normally
Visual inspection No 1 1 1
1

Page | 44
Once the FMEA is complete, several failure modes which may not have been known
before, or had not been deemed serious before are now at the fore-front of thinking. These
failure modes could be show-stoppers in terms of moving forward with this specific type
of equipment, or could result in modifications to the original specifications allowing the
manufacturer to eliminate these specific failure modes in their design.
3.5.2 Reliability Centred Maintenance (RCM)
Successful asset management relies heavily on the use of information and data to facilitate
the decision making process. Decision making is improved if the process uses information
from a variety of sources including from within the organisation, operating environment,
technical groups, manufacturers, maintainers and repairers [26]. Equipment reliability and
life-cycle cost is a key factor in effectively managing plant and equipment assets. It is
usually very difficult to assess the effectiveness of RCM at its inception, when data is
inadequate or when it is implemented on a large population of assets [27], however over
time it becomes evident that application of RCM delivers value over the life of the asset.
Failure of assets are undesirable from an economic standpoint but can also be hazardous
and catastrophic in some cases.
A RCM study is one that could radically assist in predicting and preventing asset functional
failures. The RCM study aims to create intelligence to fix a functional component before
it fails. RCM analysis will result in a cost effective maintenance program, improved
maintenance policies and effective asset management. Prior to understanding RCM, it is
required to understand maintenance in general. Preventive maintenance refers to
maintenance tasks which are performed periodically to prevent failures. This consists of
routine maintenance (such as Lubrication, alignment, calibration) and corrective
maintenance (such as Repairs). The basis and frequency of corrective maintenance tasks
are derived through the RCM process.
The crux of RCM is to:
(a.) Define specific maintenance inspection tasks which are specially looking for the
onset of known failure modes
(b.) Prescribe the frequency of these inspections so that they occur before the failure
mode eventuates
If known failure modes are detected these then trigger a corrective maintenance task. The
RCM will typically result in 4 different types of maintenance tasks, namely:
(i.) On-Condition Task [14]: A scheduled inspection or test to determine if a component
is in a satisfactory condition and will remain in this condition till the next scheduled
maintenance.
(ii.) Failure-finding task [14]: A scheduled inspection to find functional failures which
have already occurred but were not evident to operations staff.
(iii.) Re-work task [14]: Scheduled removal of an asset to perform maintenance to ensure
that the asset meets condition and performance standards
(iv.) Discard task [14]: Scheduled removal of an asset to perform maintenance to discard
one or more of its components which is deemed end-of life.
The FMEA outcome is a key input parameter which is used to perform a RCM analysis.
The actual analysis is conducted by applying decision trees (yes/no) to each of the FMEA
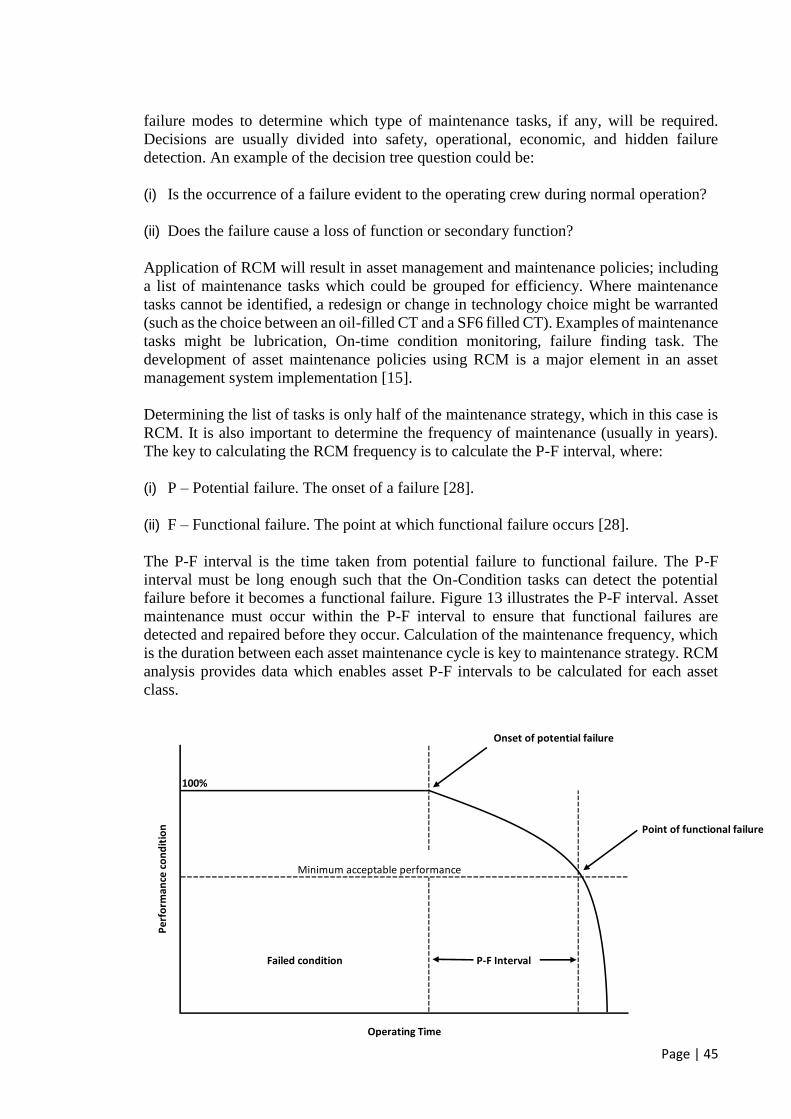
Page | 45
failure modes to determine which type of maintenance tasks, if any, will be required.
Decisions are usually divided into safety, operational, economic, and hidden failure
detection. An example of the decision tree question could be:
(i) Is the occurrence of a failure evident to the operating crew during normal operation?
(ii) Does the failure cause a loss of function or secondary function?
Application of RCM will result in asset management and maintenance policies; including
a list of maintenance tasks which could be grouped for efficiency. Where maintenance
tasks cannot be identified, a redesign or change in technology choice might be warranted
(such as the choice between an oil-filled CT and a SF6 filled CT). Examples of maintenance
tasks might be lubrication, On-time condition monitoring, failure finding task. The
development of asset maintenance policies using RCM is a major element in an asset
management system implementation [15].
Determining the list of tasks is only half of the maintenance strategy, which in this case is
RCM. It is also important to determine the frequency of maintenance (usually in years).
The key to calculating the RCM frequency is to calculate the P-F interval, where:
(i) P – Potential failure. The onset of a failure [28].
(ii) F – Functional failure. The point at which functional failure occurs [28].
The P-F interval is the time taken from potential failure to functional failure. The P-F
interval must be long enough such that the On-Condition tasks can detect the potential
failure before it becomes a functional failure. Figure 13 illustrates the P-F interval. Asset
maintenance must occur within the P-F interval to ensure that functional failures are
detected and repaired before they occur. Calculation of the maintenance frequency, which
is the duration between each asset maintenance cycle is key to maintenance strategy. RCM
analysis provides data which enables asset P-F intervals to be calculated for each asset
class.
100%
Onset of potential failure
Point of functional failure
Operating Time
Per
form
ance
co
nd
itio
n
Minimum acceptable performance
Failed condition P-F Interval
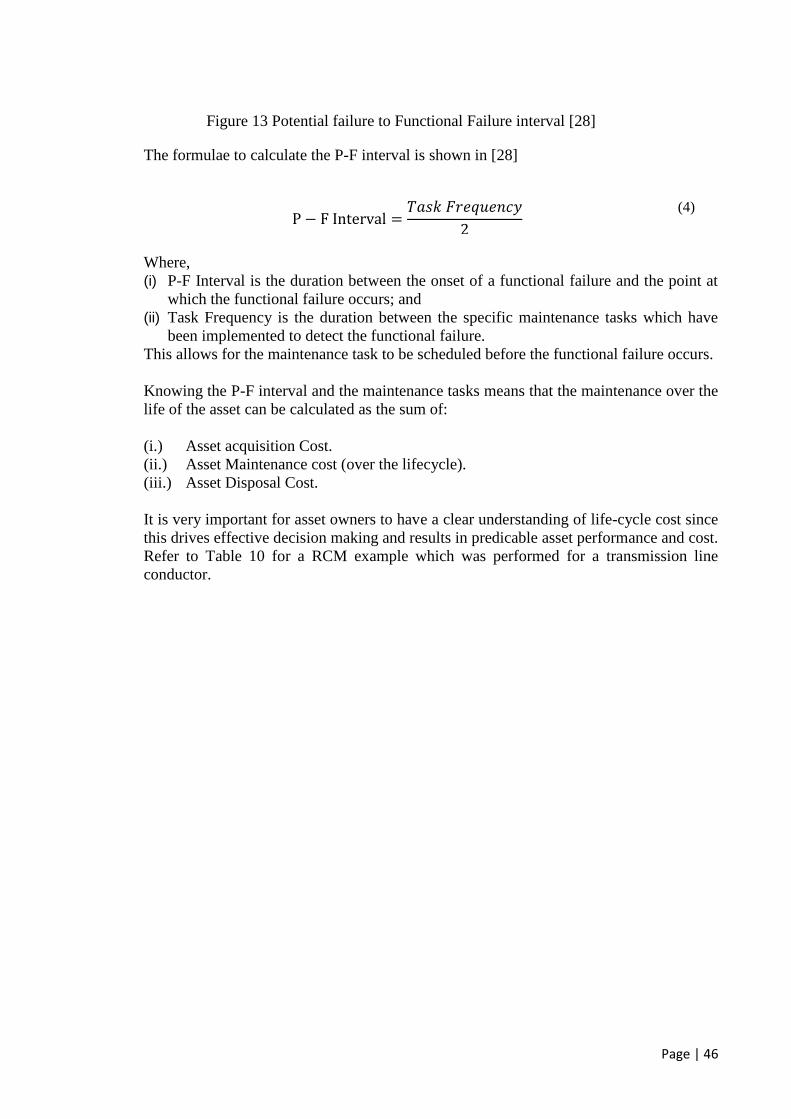
Page | 46
Figure 13 Potential failure to Functional Failure interval [28]
The formulae to calculate the P-F interval is shown in [28]
P − F Interval =𝑇𝑎𝑠𝑘 𝐹𝑟𝑒𝑞𝑢𝑒𝑛𝑐𝑦
2
(4)
Where,
(i) P-F Interval is the duration between the onset of a functional failure and the point at
which the functional failure occurs; and
(ii) Task Frequency is the duration between the specific maintenance tasks which have
been implemented to detect the functional failure.
This allows for the maintenance task to be scheduled before the functional failure occurs.
Knowing the P-F interval and the maintenance tasks means that the maintenance over the
life of the asset can be calculated as the sum of:
(i.) Asset acquisition Cost.
(ii.) Asset Maintenance cost (over the lifecycle).
(iii.) Asset Disposal Cost.
It is very important for asset owners to have a clear understanding of life-cycle cost since
this drives effective decision making and results in predicable asset performance and cost.
Refer to Table 10 for a RCM example which was performed for a transmission line
conductor.
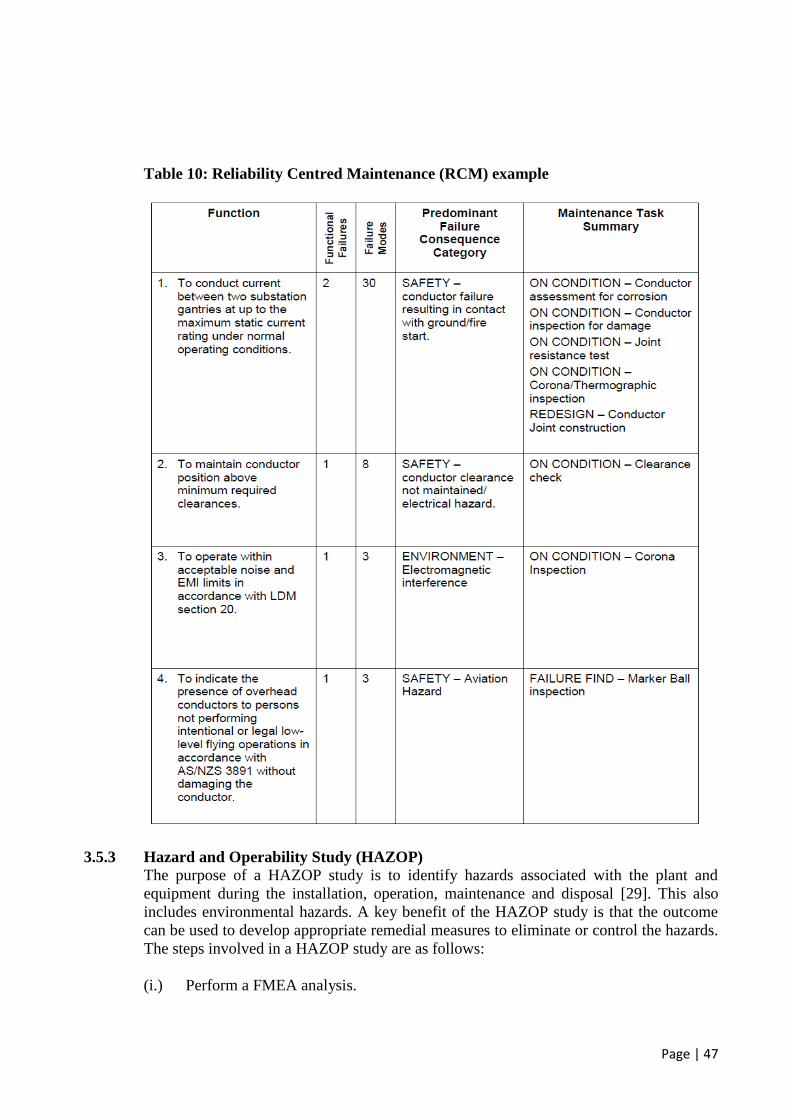
Page | 47
Table 10: Reliability Centred Maintenance (RCM) example
3.5.3 Hazard and Operability Study (HAZOP)
The purpose of a HAZOP study is to identify hazards associated with the plant and
equipment during the installation, operation, maintenance and disposal [29]. This also
includes environmental hazards. A key benefit of the HAZOP study is that the outcome
can be used to develop appropriate remedial measures to eliminate or control the hazards.
The steps involved in a HAZOP study are as follows:
(i.) Perform a FMEA analysis.
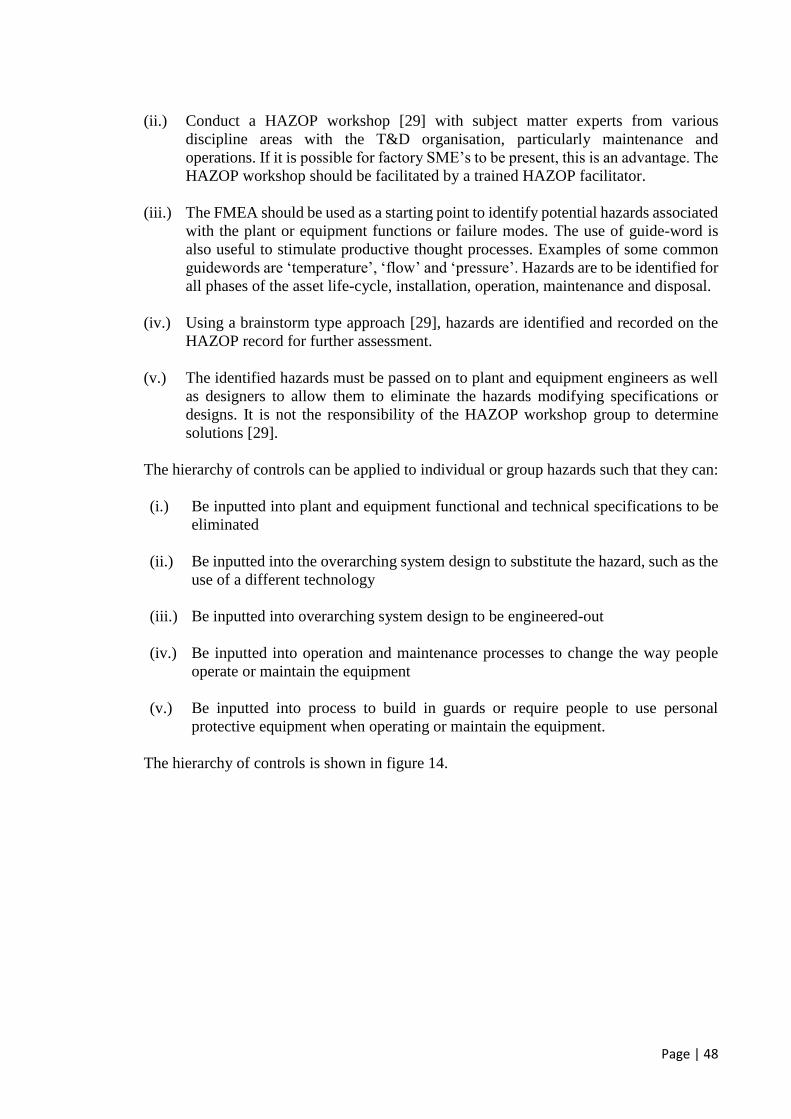
Page | 48
(ii.) Conduct a HAZOP workshop [29] with subject matter experts from various
discipline areas with the T&D organisation, particularly maintenance and
operations. If it is possible for factory SME’s to be present, this is an advantage. The
HAZOP workshop should be facilitated by a trained HAZOP facilitator.
(iii.) The FMEA should be used as a starting point to identify potential hazards associated
with the plant or equipment functions or failure modes. The use of guide-word is
also useful to stimulate productive thought processes. Examples of some common
guidewords are ‘temperature’, ‘flow’ and ‘pressure’. Hazards are to be identified for
all phases of the asset life-cycle, installation, operation, maintenance and disposal.
(iv.) Using a brainstorm type approach [29], hazards are identified and recorded on the
HAZOP record for further assessment.
(v.) The identified hazards must be passed on to plant and equipment engineers as well
as designers to allow them to eliminate the hazards modifying specifications or
designs. It is not the responsibility of the HAZOP workshop group to determine
solutions [29].
The hierarchy of controls can be applied to individual or group hazards such that they can:
(i.) Be inputted into plant and equipment functional and technical specifications to be
eliminated
(ii.) Be inputted into the overarching system design to substitute the hazard, such as the
use of a different technology
(iii.) Be inputted into overarching system design to be engineered-out
(iv.) Be inputted into operation and maintenance processes to change the way people
operate or maintain the equipment
(v.) Be inputted into process to build in guards or require people to use personal
protective equipment when operating or maintain the equipment.
The hierarchy of controls is shown in figure 14.
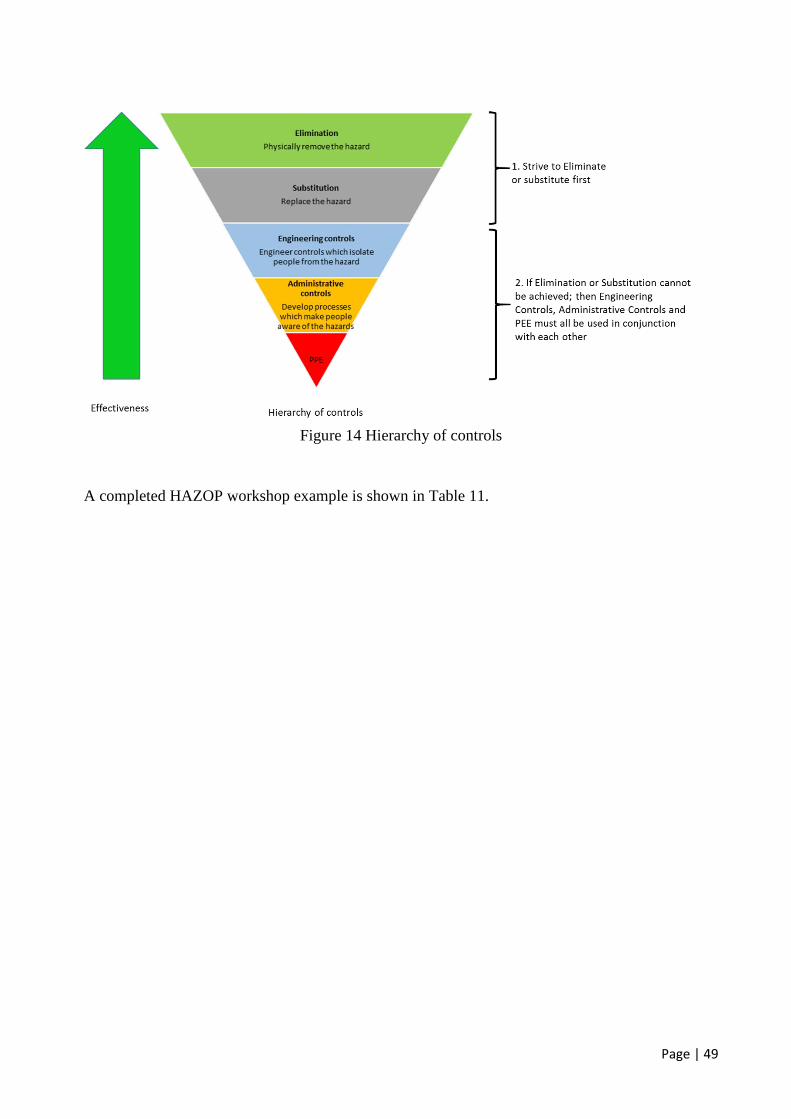
Page | 49
Figure 14 Hierarchy of controls
A completed HAZOP workshop example is shown in Table 11.

Page | 50
Table 11: Hazard and Operability Study (HAZOP) example
Item 4 indicates that a typical hazard on this earth switch is ‘binding of the main electrical contacts’; and that a typical cause is ‘application
of incorrect grease during maintenance’. The most appropriate safeguard to prevent this is the routine maintenance task associated with
maintenance of the main electrical contacts. The key action is to ensure that the maintenance provider has the ‘operation and maintenance
manual’, which will ensure that they know which grease to use.
Item Safeguards Action Responsible person
1 noneProvide operator access to reach lock
off mechanism
2 noneRelocate handle to the door as per
adjacent mechanism box
3 none Ensure correct indication
4 Routine maintenance taskEnsure O&M manuals are available
for the maintenance porvider
Guideword / Hazard Causes Consequences
Terminology of open close (O/I) Incorrect interpretation of position
Earth switchManual operating handle is stored in the mechanism
compartment
Possible to make electrical contact with control
wiring or risk of abrasion or cuts when accessing
Earth switch Mechanical lock off facilityPinch point when access mechanical lock off facility
located on top of the earth switch mechanism box
HAZOP WORKSHOP Record
Earth switch
Earth switch Main Contacts - greasing Contacts may bind if incorrect grease is applied
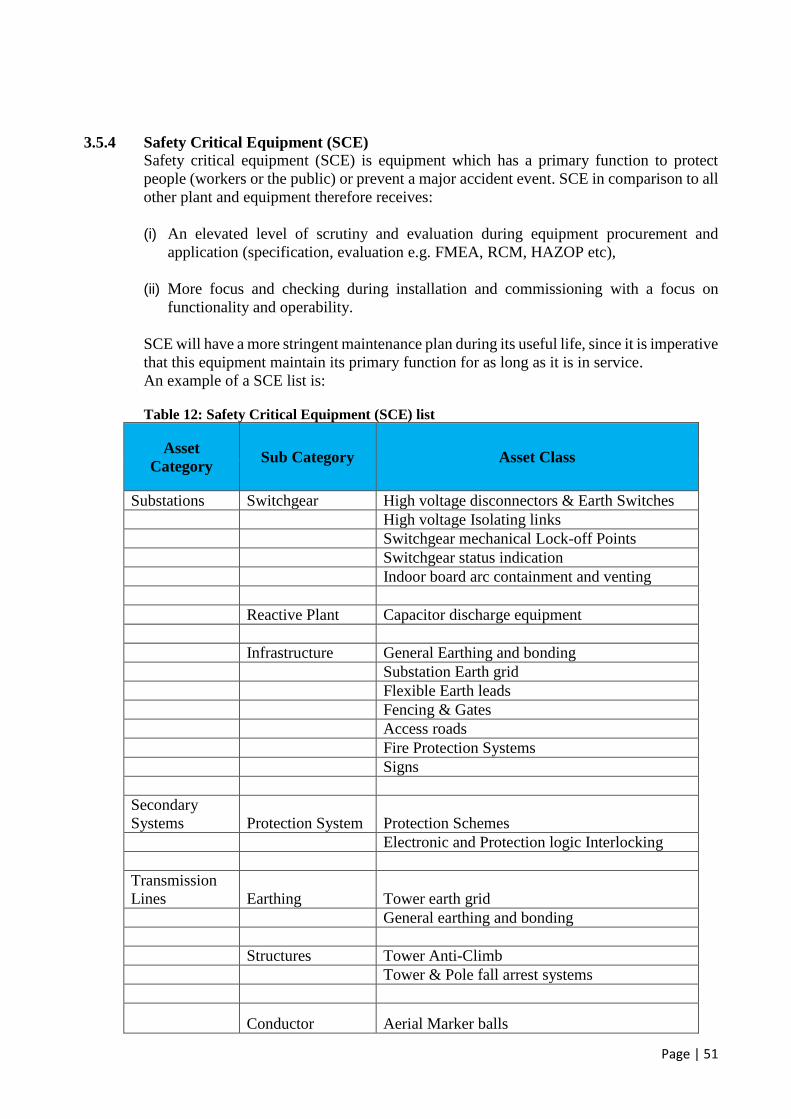
Page | 51
3.5.4 Safety Critical Equipment (SCE)
Safety critical equipment (SCE) is equipment which has a primary function to protect
people (workers or the public) or prevent a major accident event. SCE in comparison to all
other plant and equipment therefore receives:
(i) An elevated level of scrutiny and evaluation during equipment procurement and
application (specification, evaluation e.g. FMEA, RCM, HAZOP etc),
(ii) More focus and checking during installation and commissioning with a focus on
functionality and operability.
SCE will have a more stringent maintenance plan during its useful life, since it is imperative
that this equipment maintain its primary function for as long as it is in service.
An example of a SCE list is:
Table 12: Safety Critical Equipment (SCE) list
Asset
Category Sub Category Asset Class
Substations Switchgear High voltage disconnectors & Earth Switches
High voltage Isolating links
Switchgear mechanical Lock-off Points
Switchgear status indication
Indoor board arc containment and venting
Reactive Plant Capacitor discharge equipment
Infrastructure General Earthing and bonding
Substation Earth grid
Flexible Earth leads
Fencing & Gates
Access roads
Fire Protection Systems
Signs
Secondary
Systems Protection System Protection Schemes
Electronic and Protection logic Interlocking
Transmission
Lines Earthing Tower earth grid
General earthing and bonding
Structures Tower Anti-Climb
Tower & Pole fall arrest systems
Conductor Aerial Marker balls

Page | 52
3.6 Design Review
Once a decision has been made to procure a major plant item or a fleet of minor plant and
equipment, it is expected that the factory will start its design. This is a critical part of the
asset life-cycle since T&D asset managers will have the opportunity to confirm the design
against the specification which they would have issued to the supplier at an earlier stage.
The level of design review required for major plant will greatly differ when compared to
that of minor plant and equipment. Major plant design review is expected to be more
onerous simply because the plant is much more complex and expensive when compared to
minor plant and equipment. The consequence of something going wrong with major plant
is much more severe. Where minor plant design reviews may be conducted at the premises
of the T&D asset manager’s premises, major plant design reviews usually occur at the
manufacturer’s factory. The main purpose of the design review is to:
(i) Ensure clear and mutual understanding of the functional and technical specification
requirements between the T&D asset manager and the factory [30].
(ii) To verify that the factory’s design complies with the functional and technical
specification requirements [30].
(iii) To verify any special requirements such as project or delivery dates which must be
met [30].
This is also an opportune moment to make any last minute design changes without
adversely affecting cost; or bring in modifications which were not thought of before.
The requirement and schedule for design reviews must be driven by the T&D asset
manager. Contract placement must only occur after satisfactory completion of the design
review. In general, the following items must be verified in accordance with the
specification:
(i) The design has adequately covered the functional and technical requirements;
(ii) The design has adequately meets performance criteria;
(iii) The design has adequately covered the local conditions e.g. Seismic, pollution;
(iv) Wiring schematics are adequate;
(v) Special requirements are understood e.g. Painting and paint colour;
(vi) Transport, logistics, installation and erecting has been adequately catered for;
(vii) Special requirements have been catered for e.g. Specific labelling and indication;
(viii) Spares requirements have been allowed for.
The design review meeting is also a good time to discuss and agree on the inspection and
test plan in terms of schedule and steps. This is useful for the T&D asset manager,
particularly if factory testing is intended to be witnessed. It is typical for the T&D asset
manager’s subject matter expert to check the following:
(i) Drawings, reports and schematics;
(ii) Electrical, mechanical and structural calculations (this is usually done with
specialised software).
Any deviations to the specification must be clearly articulated and noted, if it is agreed that
this deviation will be accepted by the T&D asset manager. All points covered during the
design review meeting must be clearly minuted and signed off by both parties. It is
important that the design review meeting minutes are discoverable should any issues arise
in the future. A simple template for design review record or minutes is shown in Table 13.
Page | 53
Table 13: Design review record/minutes example
Factory/Supplier
Client
Equipment
Factory SME(s) Factory SME(s) signatures
Client SME(s) Client SME(s) signatures
Date
Item Examined Document reference Recommendations (if corrective action required) Description Of Corrective Action TakenCorrective Action
Taken BySigned off
Design Review record and minutes
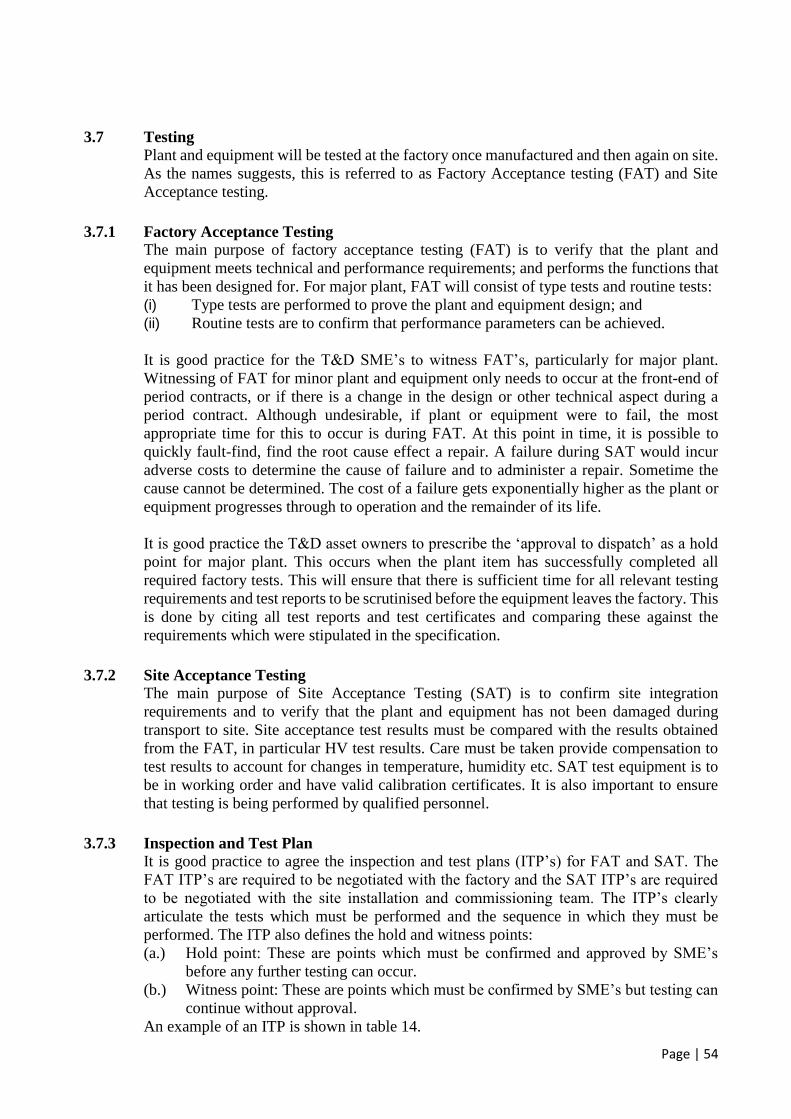
Page | 54
3.7 Testing
Plant and equipment will be tested at the factory once manufactured and then again on site.
As the names suggests, this is referred to as Factory Acceptance testing (FAT) and Site
Acceptance testing.
3.7.1 Factory Acceptance Testing
The main purpose of factory acceptance testing (FAT) is to verify that the plant and
equipment meets technical and performance requirements; and performs the functions that
it has been designed for. For major plant, FAT will consist of type tests and routine tests:
(i) Type tests are performed to prove the plant and equipment design; and
(ii) Routine tests are to confirm that performance parameters can be achieved.
It is good practice for the T&D SME’s to witness FAT’s, particularly for major plant.
Witnessing of FAT for minor plant and equipment only needs to occur at the front-end of
period contracts, or if there is a change in the design or other technical aspect during a
period contract. Although undesirable, if plant or equipment were to fail, the most
appropriate time for this to occur is during FAT. At this point in time, it is possible to
quickly fault-find, find the root cause effect a repair. A failure during SAT would incur
adverse costs to determine the cause of failure and to administer a repair. Sometime the
cause cannot be determined. The cost of a failure gets exponentially higher as the plant or
equipment progresses through to operation and the remainder of its life.
It is good practice the T&D asset owners to prescribe the ‘approval to dispatch’ as a hold
point for major plant. This occurs when the plant item has successfully completed all
required factory tests. This will ensure that there is sufficient time for all relevant testing
requirements and test reports to be scrutinised before the equipment leaves the factory. This
is done by citing all test reports and test certificates and comparing these against the
requirements which were stipulated in the specification.
3.7.2 Site Acceptance Testing
The main purpose of Site Acceptance Testing (SAT) is to confirm site integration
requirements and to verify that the plant and equipment has not been damaged during
transport to site. Site acceptance test results must be compared with the results obtained
from the FAT, in particular HV test results. Care must be taken provide compensation to
test results to account for changes in temperature, humidity etc. SAT test equipment is to
be in working order and have valid calibration certificates. It is also important to ensure
that testing is being performed by qualified personnel.
3.7.3 Inspection and Test Plan
It is good practice to agree the inspection and test plans (ITP’s) for FAT and SAT. The
FAT ITP’s are required to be negotiated with the factory and the SAT ITP’s are required
to be negotiated with the site installation and commissioning team. The ITP’s clearly
articulate the tests which must be performed and the sequence in which they must be
performed. The ITP also defines the hold and witness points:
(a.) Hold point: These are points which must be confirmed and approved by SME’s
before any further testing can occur.
(b.) Witness point: These are points which must be confirmed by SME’s but testing can
continue without approval.
An example of an ITP is shown in table 14.
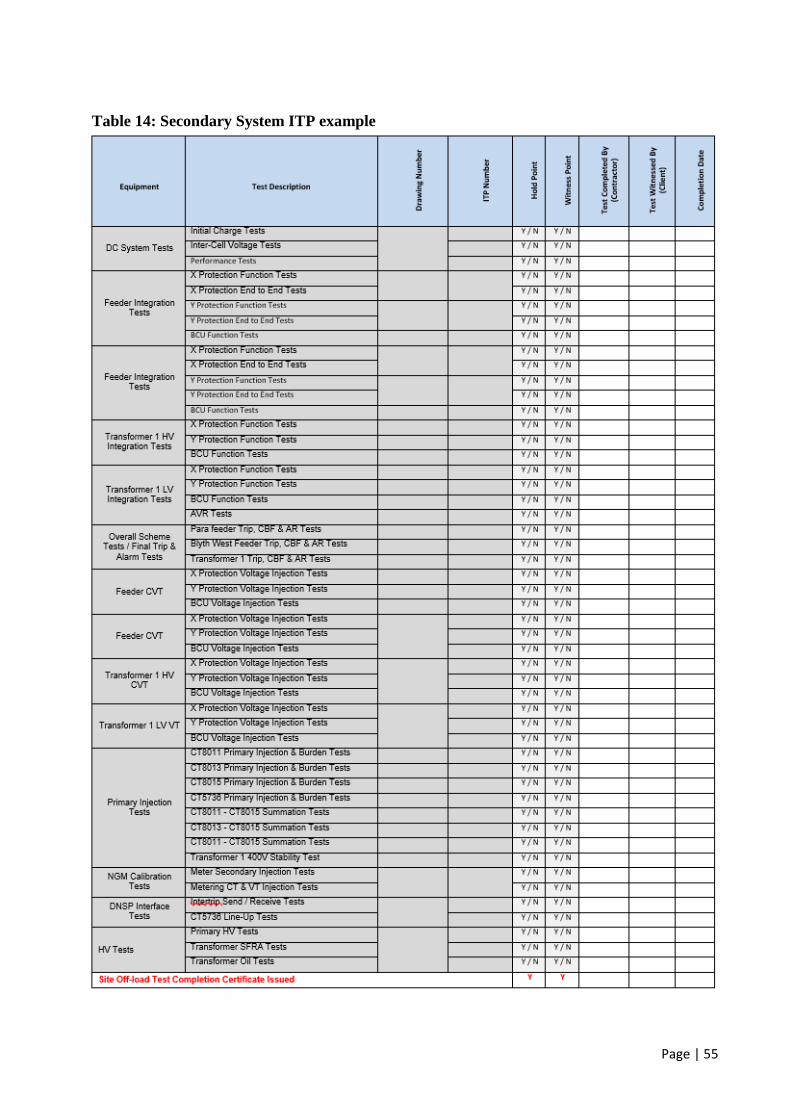
Page | 55
Table 14: Secondary System ITP example

Page | 56
3.7.4 Test reports
Test reports are required for all tests which have been performed- this includes FAT and
SAT. The tests should explicitly stipulate a pass or fail result. Any noncompliance and its
resolution must be recorded. Test reports are to be retained and stored with relevant asset
information for future reference (if any).
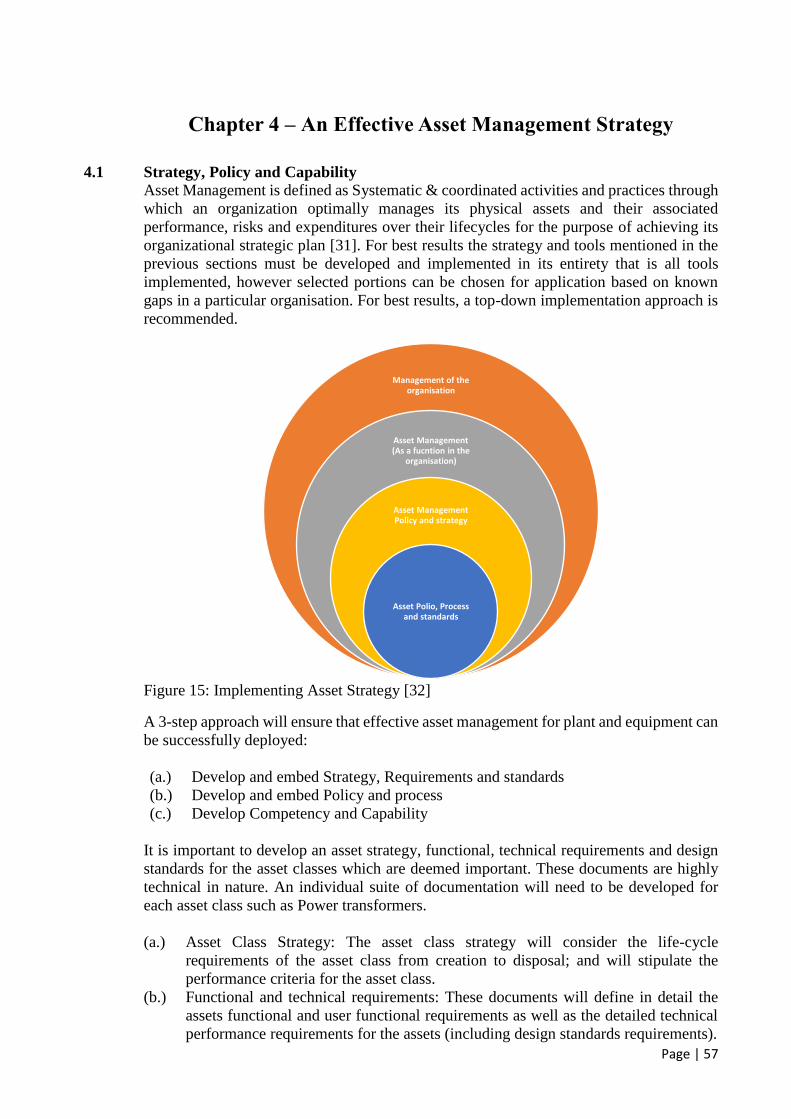
Page | 57
Chapter 4 – An Effective Asset Management Strategy
4.1 Strategy, Policy and Capability
Asset Management is defined as Systematic & coordinated activities and practices through
which an organization optimally manages its physical assets and their associated
performance, risks and expenditures over their lifecycles for the purpose of achieving its
organizational strategic plan [31]. For best results the strategy and tools mentioned in the
previous sections must be developed and implemented in its entirety that is all tools
implemented, however selected portions can be chosen for application based on known
gaps in a particular organisation. For best results, a top-down implementation approach is
recommended.
Figure 15: Implementing Asset Strategy [32]
A 3-step approach will ensure that effective asset management for plant and equipment can
be successfully deployed:
(a.) Develop and embed Strategy, Requirements and standards
(b.) Develop and embed Policy and process
(c.) Develop Competency and Capability
It is important to develop an asset strategy, functional, technical requirements and design
standards for the asset classes which are deemed important. These documents are highly
technical in nature. An individual suite of documentation will need to be developed for
each asset class such as Power transformers.
(a.) Asset Class Strategy: The asset class strategy will consider the life-cycle
requirements of the asset class from creation to disposal; and will stipulate the
performance criteria for the asset class.
(b.) Functional and technical requirements: These documents will define in detail the
assets functional and user functional requirements as well as the detailed technical
performance requirements for the assets (including design standards requirements).
Management of the organisation
Asset Management (As a fucntion in the
organisation)
Asset Management Policy and strategy
Asset Polio, Process and standards

Page | 58
(c.) Inspections and test plans (ITP’s): The ITP’s will define the inspections and test
plans required to verify and test the functional and technical requirements.
Effective policy, procedures and tools will support the application of asset strategy. This is
defines as:
(i.) Policy: Policy will define the high level requirement which would state why asset
strategy must be implemented, as well as direct personnel to comply. This will make
clear requirements such as Factory Prequalification’s, the need to perform
equipment assessment studies (such as FMEA).
(ii.) Process and procedure: Procedures, in line with policy will state what must be done,
at what point in time and by whom. This will ensue that there is consistency in
results. The assessment tools are also captured in procedure documents (such as
HAZOPs)
Having effective strategy, standards, policy and process is only as effective as the people
applying them. It is important that the people responsible for applying strategy, standards,
policy and process have the requisite level of experience and knowledge. It is good practice
for T&D organisations to know what competencies they require and to assess their people
against those competencies. Gaps identified can drive development plans; and the fact that
this is done will in general drive a culture of continuous individual development.
Figure 16: Strategy, policy and capability
4.1.1 Prioritisation of Asset Classes for Asset Strategy Implementation
It can be a daunting task for asset managers who are embarking on a journey towards
implementing effective asset strategy in deciding where to start. The main consideration is
to determine which asset classes to consider first; and the understanding that some asset
classes will not require a detailed level of focus; and some no focus at all. As a rule of
Page | 59
thumb, the key factor in determining the priority of asset classes to focus on must be based
on life-cycle cost; in particular highest to lowest. This will typically follow this sequence:
(i.) Transmission/Distribution Line towers and insulators
(ii.) Transmission /Distribution Lines overhead line conductors
(iii.) Power transformers
(iv.) Substation infrastructure
(v.) Circuit Breakers
(vi.) Disconnectors
(vii.) Protection and Automation equipment
(viii.) Instrument transformers
Figure 17 is an example of lifecycle cost for the major asset classes.
Figure 17: Lifecycle cost of major asset classes [18]
4.1.2 Support from External Specialists
Strategy development, Specification development, Factory Assessment, Plant and
Equipment Assessment, Design Review and the witnessing of factory acceptance testing
are functions which require a good degree of subject matter knowledge complimented by
the skillsets required to administer and facilitate the procedural aspects related to these
functions. It is imperative that the people responsible to execute these tasks are adequately
qualified and experienced.
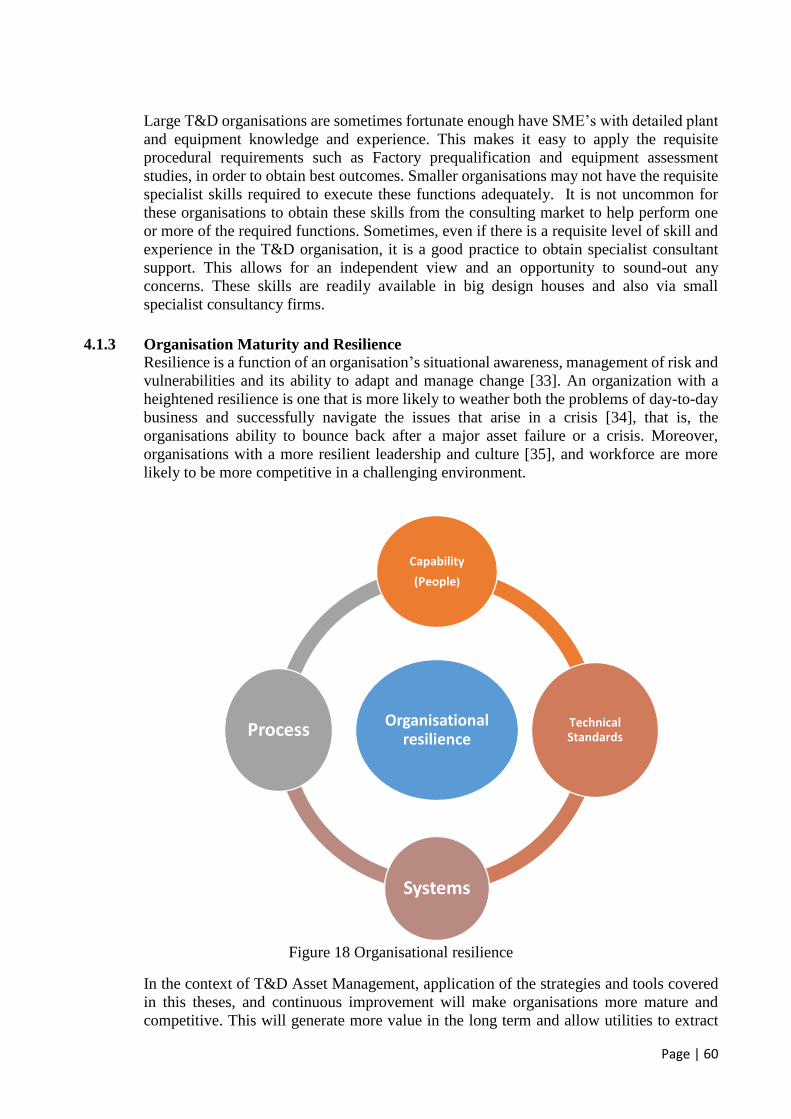
Page | 60
Large T&D organisations are sometimes fortunate enough have SME’s with detailed plant
and equipment knowledge and experience. This makes it easy to apply the requisite
procedural requirements such as Factory prequalification and equipment assessment
studies, in order to obtain best outcomes. Smaller organisations may not have the requisite
specialist skills required to execute these functions adequately. It is not uncommon for
these organisations to obtain these skills from the consulting market to help perform one
or more of the required functions. Sometimes, even if there is a requisite level of skill and
experience in the T&D organisation, it is a good practice to obtain specialist consultant
support. This allows for an independent view and an opportunity to sound-out any
concerns. These skills are readily available in big design houses and also via small
specialist consultancy firms.
4.1.3 Organisation Maturity and Resilience
Resilience is a function of an organisation’s situational awareness, management of risk and
vulnerabilities and its ability to adapt and manage change [33]. An organization with a
heightened resilience is one that is more likely to weather both the problems of day-to-day
business and successfully navigate the issues that arise in a crisis [34], that is, the
organisations ability to bounce back after a major asset failure or a crisis. Moreover,
organisations with a more resilient leadership and culture [35], and workforce are more
likely to be more competitive in a challenging environment.
Figure 18 Organisational resilience
In the context of T&D Asset Management, application of the strategies and tools covered
in this theses, and continuous improvement will make organisations more mature and
competitive. This will generate more value in the long term and allow utilities to extract
Organisational resilience
Capability
(People)
Technical Standards
Systems
Process
Page | 61
more out of their assets. The introduction and application of the strategies, principles and
tools will inherently start the organisation on a journey of continuous improvement and
development. This will create and develop intellectual capital in the form of up-to-date and
relevant technical standards, process and capability (people) and ultimately make for a
more resilient organisation.
4.1.4 Benefits of an Effective Asset Management Strategy
As detailed in previous sections, specific benefits of an effective asset management strategy
are:
i. Achieving lowest life cycle costs.
ii. Improved asset reliability, integrity and performance.
iii. Organisational maturity and resilience.
Page | 62
Chapter 5: Conclusion and Recommendation
5.1 Conclusion
Owning, operating and the utilization of T&D assets is the primary mechanism from which
T&D organisations derive revenue. Furthermore, the electric power transmission and
distribution system has a direct correlation to a country’s economy and Gross Domestic
Product (GDP). This by itself implies that the effectiveness of the asset management
strategy and its application is not only directly proportional to productivity of the T&D
organisation but also of the country. This thesis provides:
(i.) Insight into best practice T&D asset management techniques and strategy as related
to high voltage plant and equipment;
(ii.) Tools and methodologies for T&D asset owners to make effective judgments and
decisions related to the selection, specification and application of plant and
equipment, resulting in lowest lifecycle cost;
(iii.) The ability to perform a technical assessment T&D asset suppliers and factories, and
the criteria for this;
(iv.) A practical approach to application of the methodologies tools and equipment
covered in this thesis;
(v.) The ability to ensure predictable asset performance and reliability over its lifecycle;
(vi.) The means to replicate favourable outcomes in different T&D organisations
regardless of location or regulation.
A key finding of this thesis is that equipment infant mortality, mid-life failures, common
mode failures and premature ageing usually means that the asset owner has made an error
in the front-end asset strategy and asset creation process. The cost of these oversights are
usually passed on to consumers in the form of increased electricity prices. What this means
is that insufficient upfront work and due diligence has resulted in the implementation of a
sub-standard product or solution. Conversely, if plant and equipment is still in good
condition at the end of the design life, this usually means that the initial solution has been
over-designed. In order for Asset Managers to develop and apply an effective asset
management strategy, they must:
(a.) Understand what they require in terms of functionality, reliability and availability. It
is possible to develop this understanding with the use of the tools covered in this thesis,
that is FMEA, RCM, HAZOP. This information must be translated into equipment
procurement specifications and maintenance strategies.
(b.) Procurement specifications must contain relevant information in line with point a.
above. Over specification has a tendency to increase equipment cost (for functionality
which may not be necessary) and could also confuse factory sales personnel in terms
of understanding what is important for consideration during manufacture.
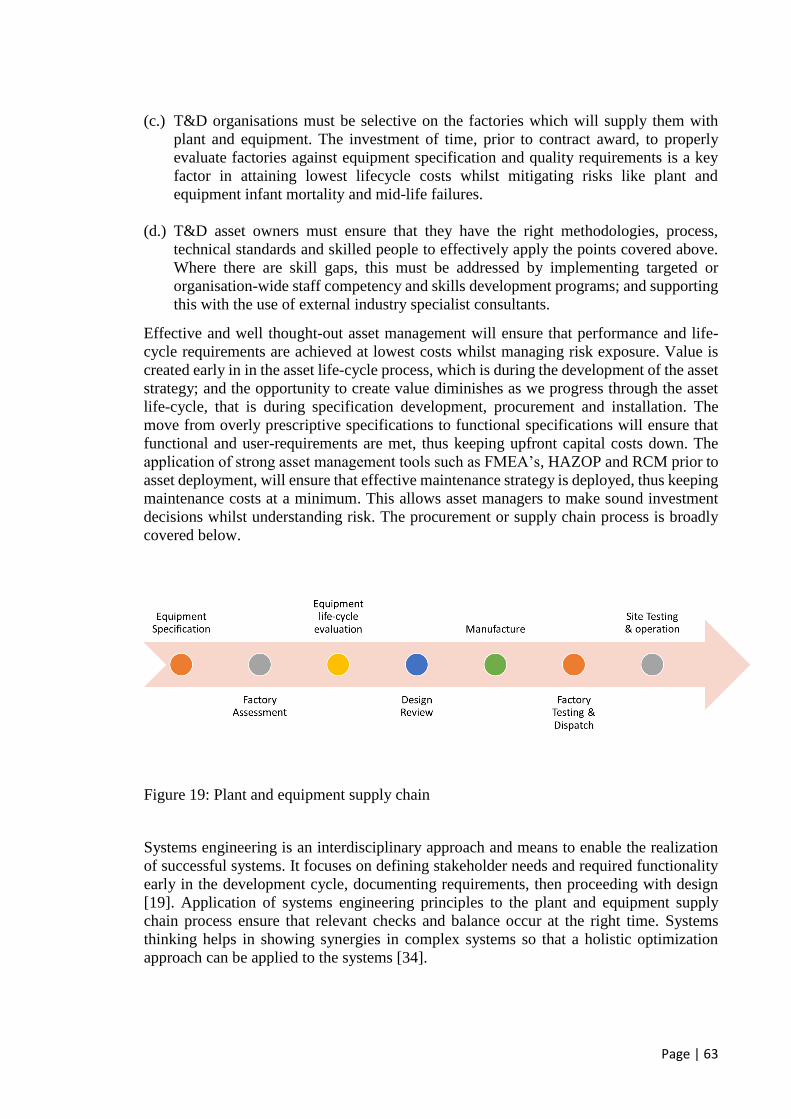
Page | 63
(c.) T&D organisations must be selective on the factories which will supply them with
plant and equipment. The investment of time, prior to contract award, to properly
evaluate factories against equipment specification and quality requirements is a key
factor in attaining lowest lifecycle costs whilst mitigating risks like plant and
equipment infant mortality and mid-life failures.
(d.) T&D asset owners must ensure that they have the right methodologies, process,
technical standards and skilled people to effectively apply the points covered above.
Where there are skill gaps, this must be addressed by implementing targeted or
organisation-wide staff competency and skills development programs; and supporting
this with the use of external industry specialist consultants.
Effective and well thought-out asset management will ensure that performance and life-
cycle requirements are achieved at lowest costs whilst managing risk exposure. Value is
created early in in the asset life-cycle process, which is during the development of the asset
strategy; and the opportunity to create value diminishes as we progress through the asset
life-cycle, that is during specification development, procurement and installation. The
move from overly prescriptive specifications to functional specifications will ensure that
functional and user-requirements are met, thus keeping upfront capital costs down. The
application of strong asset management tools such as FMEA’s, HAZOP and RCM prior to
asset deployment, will ensure that effective maintenance strategy is deployed, thus keeping
maintenance costs at a minimum. This allows asset managers to make sound investment
decisions whilst understanding risk. The procurement or supply chain process is broadly
covered below.
Figure 19: Plant and equipment supply chain
Systems engineering is an interdisciplinary approach and means to enable the realization
of successful systems. It focuses on defining stakeholder needs and required functionality
early in the development cycle, documenting requirements, then proceeding with design
[19]. Application of systems engineering principles to the plant and equipment supply
chain process ensure that relevant checks and balance occur at the right time. Systems
thinking helps in showing synergies in complex systems so that a holistic optimization
approach can be applied to the systems [34].
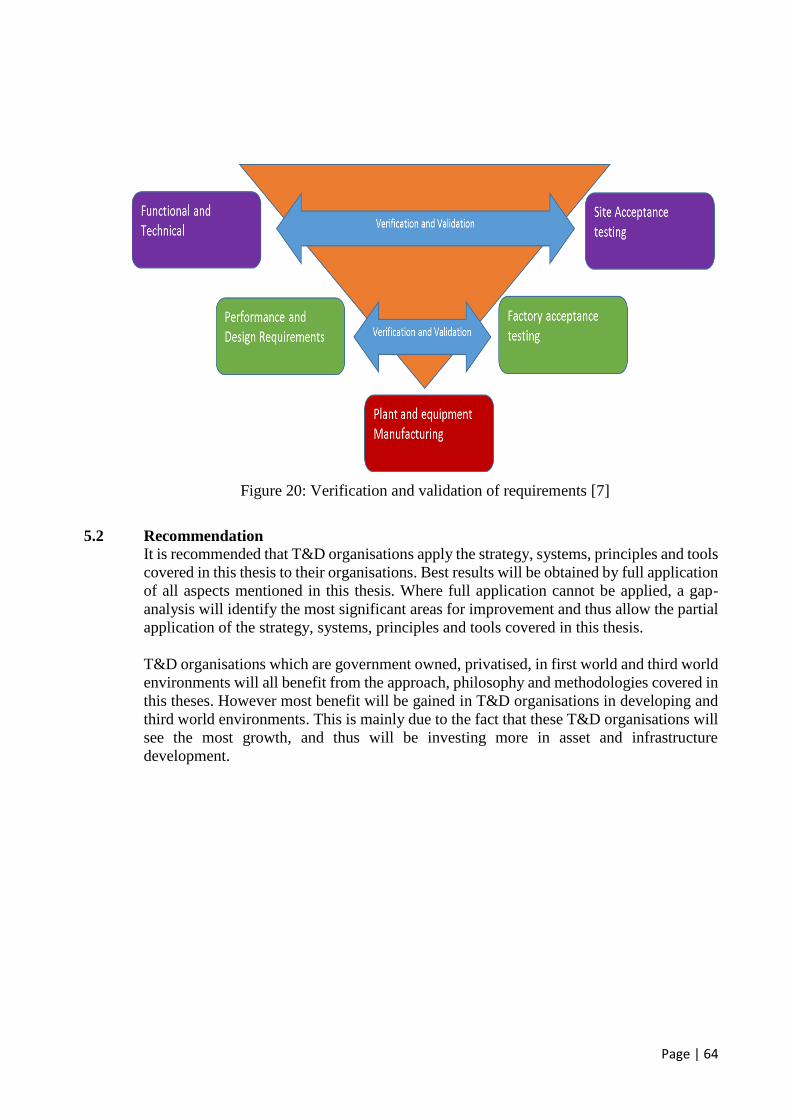
Page | 64
Figure 20: Verification and validation of requirements [7]
5.2 Recommendation
It is recommended that T&D organisations apply the strategy, systems, principles and tools
covered in this thesis to their organisations. Best results will be obtained by full application
of all aspects mentioned in this thesis. Where full application cannot be applied, a gap-
analysis will identify the most significant areas for improvement and thus allow the partial
application of the strategy, systems, principles and tools covered in this thesis.
T&D organisations which are government owned, privatised, in first world and third world
environments will all benefit from the approach, philosophy and methodologies covered in
this theses. However most benefit will be gained in T&D organisations in developing and
third world environments. This is mainly due to the fact that these T&D organisations will
see the most growth, and thus will be investing more in asset and infrastructure
development.
65
REFERENCES
[1] S. J. T. Mwale and I. E. Davidson, “Power deficits and outage planning in South
Africa”. In Proceedings of the 2nd International Symposium on Energy Challenges and
Mechanics, 19-21st August 2014, Scotland, United Kingdom.
[2] I. E. Davidson, F. N. Okafor, O. Ojo and A. A. Jimoh, “Power System Control
Automation in Developing Economies - The Nigerian Experience”. In Proceedings of
the IFAC Conference on Technology Transfer in Developing Countries: Automation in
Infrastructure Creation, IFAC DECOM – TT 2000, Pretoria, South Africa, July 5-7,
2000, pp. 114-118.
[3] I. E. Davidson and A O Odubiyi, “Power system automation and integration in
developing economies”. Proceedings of the CIGRE 1nternational Conference on
Power Systems (CIGRE ICPS2001), September 03-05, 2001, Wuhan, Hubei, China, pp.
627-631.
[4] A. O. Odubiyi and I. E. Davidson, “England and Wales Electricity Industry: Experience
in Deregulation 1990-2000”. In Proceedings of the 7th IASTED International Multi-
Conference on Power & Energy Systems, Palm Springs, California, USA, February 24-
26, 2003, pp. 24-28.
[5] S. J. T. Mwale and I. E. Davidson, "SADC Power Grid Reliability - A Steady-state
Contingency Analysis and Strategic HVDC Interconnections Using the N-1 Criterion”.
In Proceedings of the 2nd International Symposium on Energy Challenges and
Mechanics, 19-21st August, Scotland, United Kingdom.
[6] B. K. Blyden and I. E. Davidson, “Energizing Africa’s Emerging Economy”, IEEE
Power and Energy, Vol. 3, No 4, July/August 2005, pp. 24-31.
[7] A. Maharaj and I. E. Davidson, “Lifecycle Cost Optimization of Electric Utility T&D
Assets”. Paper prepared for presentation at the 25th South African Universities Power
Engineering Conference, 30 January – 01 February 2017, University of Stellenbosch,
Stellenbosch, South Africa.
[8] A. Scott, “Building Electricity Supplies in Africa for Growth and Universal Access”.
Working paper, The Global Commission on Economy and the Climate, 2015.
[9] A. O. Odubiyi and I. E. Davidson, “Managing the Deregulation and Privatisation of the
Nigerian Electricity Industry”. Journal for Science, Technology and Environment,
Volume 2 (1), pp. 81-92, (2002). ISSN: 1596-7492.
[10] M. G. B. Madonsela, M. O. Kachieng’a, I. E. Davidson and A. M. Mamanyuha,
“Managing Technological Assets in the Electrical Power Sector: Challenges and
Opportunities for Electrical Distribution Utilities”. In Proceedings of the International
Conference on Asset and Maintenance Management, University of Pretoria, Pretoria,
South Africa, October 1-2, 2003.
[11] I. E. Davidson, “Utility Asset Management in the Electrical Power Distribution Sector”.
In Proceedings of the Inaugural IEEE Power Engineering Society Conference in
Africa, Durban, South Africa, July 11-15, 2005, pp. 338-343.
[12] Asset Management Investment Decision Processes, CIGRE working group C1-1, 2004
[13] B. O. Mkandawire, N. M Ijumba and H. Whitehead, “Asset Management Optimization
Through Integrated Systems Thinking and N-1 Contingency Capability for
Refurbishment”, IEEE Systems Journal, Volume 5, Issue 3, Sept. 2011, pp. 321 – 331.
[14] J. V. Jones, “Integrated Logistics Support handbook”, 3rd Edition, Logistics
Management Associates, Irvine, California, June 2006
66
[15] P. R. Clark, “Implementing an Asset Management Strategy at Powercor Australia”.
PAL.017.001.0091.
[16] D. Hughes, G. Dennis, J. Walker and C. Williamson, “Condition based risk
management (CBRM) – Enabling asset condition information to be central to corporate
decision making”, In Proceedings of the 1st World Congress on Engineering Asset
Management (WCEAM), Gold Coast, Australia, 11-14th July 2006.
[17] Australian Standard AS IEC 60300.3.3-2005 Dependability Management – Part 3.3
Application Guide: Lifecycle costing.
[18] I. Jeromin, G. Balzer, J. Backes and R. Huber, “Life cycle cost analysis of transmission
and distribution systems. In Proceedings of the CIRED 20th international conference
on Electricity Distribution, Prague, 8-11th June, 2009.
[19] Australian Standard for Systems and Software Engineering – System Life cycle process
AS/NZS ISO/IEC/IEEE 15288:2015, 2015.
[20] CIGRE Guide for customer’s specifications for transformers 100MVA and 132kV and
above, CIGRE Working Group 12.15, April 2000.
[21] Australian Standard Value Management, Australian Standard AS 4183-2007.
[22] CIGRE Guide for conducting factory capability assessment for power transformers,
CIGRE Working Group A2.36, April 2013.
[23] Australian Standard Analysis Techniques for System reliability – Procedure for failure
mode and effects analysis (FMEA), Australian Standard AS IEC 60812-2008.
[24] J. Hore, “Procedure substation maintenance isolators and earth switches”, ElectraNet,
South Australia, November 2010.
[25] J. Hore, “Substation maintenance power transformers and oil-filled reactors”.
ElectraNet, South Australia, March 2016.
[26] CIGRE Guide for Generic guidelines for life time condition assessment of HV assets
and related knowledge rules - framework for reliability management of HV
infrastructure, CIGRE working group D1.17, June 2010.
[27] B. O. Mkandawire, N. M Ijumba and A. K Saha, “Transformer risk modelling by
stochastic augmentation of reliability centred maintenance”, Electric Power Systems
Research, Volume 119, pp. 471–477, November 2014.
[28] Australian Standard on Dependability Management. Part 3. 11: Application Guide -
Reliability Centred Maintenance, Australian Standard AS IEC 60300.3.11-20112011.
[29] Australian Standard on Hazard and operability studies (HAZOP Studies) – Application
Guide, Australian Standard AS IEC 61882-2003.
[30] CIGRE Guidelines for conducting design reviews for transformers 100MVA and 132kV
and above, CIGRE Working Group 12.22, August 2002
[31] J. Woodhouse, “Asset Management: Joining up the jigsaw puzzle – PAS55 standards
for the integrated management of assets”, ME plant and maintenance, Sep/Oct 2007.
[32] Asset Management-Overview and terminology, ISO Standard AS ISO 55000: 2014.
[33] S. McManus, E. Seville, D. Brunsdon and J. Vargo, “Resilient organizations research
report”, January, 2007. Available at: www.resorgs.org.nz.
[34] S. McManus, E. Seville, J. Vargo and D Brunsdon, “Facilitated Process for Improving
Organizational Resilience”, Natural Hazards Review, Volume 9, Issue 1, pp. 81-90,
2008.
[35] E. Seville, J. R. Stevenson, J. Vargo, C. Brown and S. Giovinazzi, “Resillience and
Recovery: Business Behaviour following the Canterbury Earthquakes”, NIST

67
Workshop on the Economics of Community Disaster Resilience, 29-30 April 2015,
Washington DC.
[36] B.O. Mkandawire, N.M. Ijumba and A.K. Saha, “Component Risk Trending Based on
Systems Thinking Incorporating Markov and Weibull Inferences,” IEEE Systems
Journal, Vol. 30, No. 2, pp 1185-1196, December 2015.