Embed Size (px)
Citation preview
1
NAF
International Working Paper Series Year 2015 paper n. 15/02
Technical Efficiency of Wheat Farms in River Nile State, Sudan
Dr. Adil Ahmed Ali Ibrah
Agricultural Research Corporation (ARC), Sudan [email protected]
Hanan Suliman Mohamed
Agricultural Economics and Policy Research Centre (AEPRC), Shambat, Sudan
The online version of this article can be found at: http://economia.unipv.it/naf/
2
Scientific Board
Maria Sassi (Editor) - University of Pavia
Johann Kirsten (Co-editor)- University of Pretoria
Gero Carletto - The World Bank
Piero Conforti - Food and Agriculture Organization of the United Nations
Marco Cavalcante - United Nations World Food Programme
Luc de Haese - Gent University
Stefano Farolfi - Cirad - Joint Research Unit G-Eau University of Pretoria
Ilaria Firmian -IFAD
Mohamed Babekir Elgali – University of Gezira
Luca Mantovan – Dire Dawa University
Firmino G. Mucavele - Universidade Eduardo Mondlane
Michele Nardella - International Cocoa Organization
Nick Vink - University of Stellenbosch
Alessandro Zanotta - Delegation of the European Commission to Zambia
Copyright @ Sassi Maria ed. Pavia -IT [email protected] ISBN 978-88-96189-28-3
3
Technical Efficiency of Wheat Farms in River Nile State, Sudan
Dr.Adil Ahmed Ali Ibrahim Agricultural Research Corporation (ARC) Sudan
Hanan Suliman Mohamed
Agricultural Economics and Policy Research Centre (AEPRC), Shambat, Sudan
Abstract
The main objective of this paper was to empirically estimate the technical
efficiency of wheat farms in River Nile State (R.N.S), Sudan, in view to the
government strategy to revitalize this crop in the state. Within the study 120 farmers
in two state localities were interviewed, using multi-stage stratified sampling
technique. A total of 60 respondents were chosen randomly from each of Abu-
Hammed and El-matamma localities in the northern and southern parts of the state,
respectively during the 2004/05 season. Stochastic frontier production function was
used to estimate the technical efficiency of the farms. The results showed that the
socioeconomic and production factors of farmers' age, credit, timely sowing, use of
improved varieties, tractor plowing and chemical application were found to
significantly increase the level of technical efficiency and show positive marginal
effects, while manual weeding and off-farm activities were found to reduce the level
of efficiency. However, the mean technical efficiencies of wheat farms were 0.67 and
0.64 in Abu-Hammed and El-matamma localities, respectively.
Key words: Wheat, Technical Efficiency, River Nile State, Sudan
4
INTRODUCTION
In Sudan, wheat is one of the main food security crops since it is the main food for the
majority of population. It is grown in Gezira, New Halfa, White Nile state, River Nile
and Northern states. The government had adopted the policy of rehabilitation of wheat
production through increasing of planted areas and transfer of modern agricultural
technologies particularly in the River Nile, Northern, West and South Darfur states.
During the period 1970-2000, self-sufficiency in wheat has been a target in most
government economic plans. The latest was the crash programme of 1989, which
emphasized area expansion and particularly yield improvements; arriving at self-
sufficiency in 1992 (Elamin, 2002). Yet, such self-sufficiency has not been
sustainable. The central government subsequently embarked on a new strategy,
namely the Second Agriculture Development Strategy (SADS) to be implemented
over a 25-year period, 2003 - 2027 (Osman, 2004). SADS specified sub-objectives for
specific sectors. For instance in the cereal production sector, ambitious objectives
were set for the irrigated sector for expansion of the cereal areas to reach 3.9 million
hectares up from 1.7 million hectares. This, in addition to, increasing and maximizing
productivity of crops in order to increase the efficiency and competitiveness of the
domestic agricultural products in foreign markets (SADS, 2003). In congruence with
government policies to raise farmers’ productivity and efficiency, this study acquires
importance in analyzing the present level of efficiency among wheat farms in R.N.S.
This is because the aforementioned agricultural strategy is expected to lead to increase
in the technical capability of the farmers in producing farm output from a given set of
inputs. The measurement of efficiency becomes more crucial, given the fact that it is
directly related to the overall productivity of the agricultural sector. The main
objective of this study is therefore to quantitatively determine the level of technical
efficiency of wheat farms and the associated influencing factors using stochastic
frontier production functions.
METHODS
The study depended mainly on primary data collected using structured questionnaire
to interview farmers in R.N.S who grew wheat during 2004/05. A multi-stage,
stratified random sample of 120 respondents was selected with two strata identified by
geographical difference and comprising Abu-Hammad in the north and El-matamma
in the south. A sample of 60 farmers was taken from each locality following random
5
selection of villages and eventually farmers from each. Data on physical quantities of
wheat inputs and output were collected. Inputs were collected on land area allotted to
wheat in feddans (one feddan=0.24 hectare), labour (family and hired) in man-days,
number of irrigations applied per season and quantities of seed and fertilizer in kg/
feddan. Data were also collected on relevant socio-economic variables of the farmers.
Such variables included dummies for off-farm activities, credit, timely sowing, use of
improved varieties, tractor plowing, chemical application for pests and weeds, manual
weeding and the active age of farmer as (1=x≤50, 0=x>50).
The stochastic frontier production function, which was proposed by Aigner, et al.,
(1977), Battese and Corra (1977) and Meeusen and Van den Broeck (1977); has been
given serious consideration in an effort to bridge the gap between theory and
empirical work. The translog Cobb-Douglas production function was chosen due to a
number of advantages such as its flexibility and its non-restrictiveness in the
returns-to-scale parameters. The model is specified as follows:
Ln yi=α0+∑=
5
1kακ ln Xki +
½∑=
5
1k
∑=
5
1k
ακj ln Xki
X ji + ει
(1)
Where;
Ln= Natural logarithm
y1= Output of wheat in Kg/ feddan.
X1= Land in feddans.
X2= Quantity of fertilizer in Kg/ feddan.
X3 = Quantity of wheat seed planted in Kg/ feddan.
days of labor used.-verage number of manA =4X
X5 = Average number of irrigations applied per feddan per season.
ει = V i-ui = Composite error term
Where;
V i =Random variable assumed to be independently and identically
distributed N (0; _ σ²v) and independent of ui.
6
ui =Random variable that accounts for technical inefficiency and assumed to be
independently distributed as truncation of the normal distribution with mean µ and
variance σ² =σ u2 (|N (µ, σ²u)|) 2.
The inefficiency model is estimated from the equation given below;
ui= δ0+∑=
n
im δm Zi (2)
Where:
Ui = the second part in composite error as defined in equation (1).
Z1 = farmers' active age (1=Farmer age≤50, 0= Farmer age >50).
Z2=Off-farm activity (1= had off-farm activity, 0=had not).
Z3 = Credit access (1= Accessed, 0=Not Accessed).
Z4 = Use of improved varieties (1= Used, 0 = Not used).
Z5 = Timely sowing (1=early sowing, 0=late).
Z6 = Use of tractor in land preparation (1= Used, 0 = Not used).
Z7 = Applying chemicals for pests and weeds control (1= Applied, 0 = Not Applied).
Z8 = Application of manual weeding (1= Applied, 0 = Not Applied).
The first section is the stochastic frontier production function while the second
part captures the inefficiency variables. The models generate variance parameters, i.e.
Lambda, λ = (συ² / σ²v); variance of the models (Sigma σ), variance of the stochastic
models (σ²v) and variance of the inefficiency models (συ²). The model was analyzed
by frontier 4.1 programme - model 2 under the Battese and Coelli (1995)
specifications. The following hypotheses requires testing with the generalized
likelihood ratio test, λ λ λ λLR = 2[L (H1)-L(H0)], where L(H1) and L(H0) are the
maximum values of the log likelihood functions under the alternative and null
hypothesis, respectively. The null hypothesis is rejected when λλλλLR >XXXXC2. The
following hypotheses will be tested:
1. H0=ßik=0, the null hypothesis that identifies the translog production function. It
specifies that the cross terms are equivalent to zero.
2. H0; u=0, the null hypothesis specifies that each farm is operating on the technically
efficient frontier and that the asymmetric and random technical efficiency in the
7
inefficiency effects are zero. This is rejected in favor of the presence of inefficiency
effects.
3. H0; λ λ λ λ =δδδδ0= δδδδ2=…δδδδP =0, the null hypothesis specifies that the technical inefficiency
effects are not present in the model at every level, the joint effect of these variables on
technical inefficiency is insignificant.
The estimated parameters on the inefficiency model only indicate the direction
of the effects that the variables have on inefficiency levels (where a negative
parameter estimate shows that the variable reduces technical inefficiency). In their
article, Battese and Coelli (1993) show that for the i-th firm in the t-th time period,
technical efficiency (TE) is predicted using the conditional expectation.
TE=E [exp (-ui)/Ei=ei]
=exp (-u*+½σ*²) {φ[( u*/σ*)−σ*]/ φ ( u*/σ*) } ( ( ( (3))))
Where,
u*= (1- γ) zitδ- γεit
σ*² = γ (1- γ) σ²s
γ= συ² , σ²s=συ² +σ²v
σ²s
ει= Vi-ui and φ represents the distribution of the standard normal random variable.
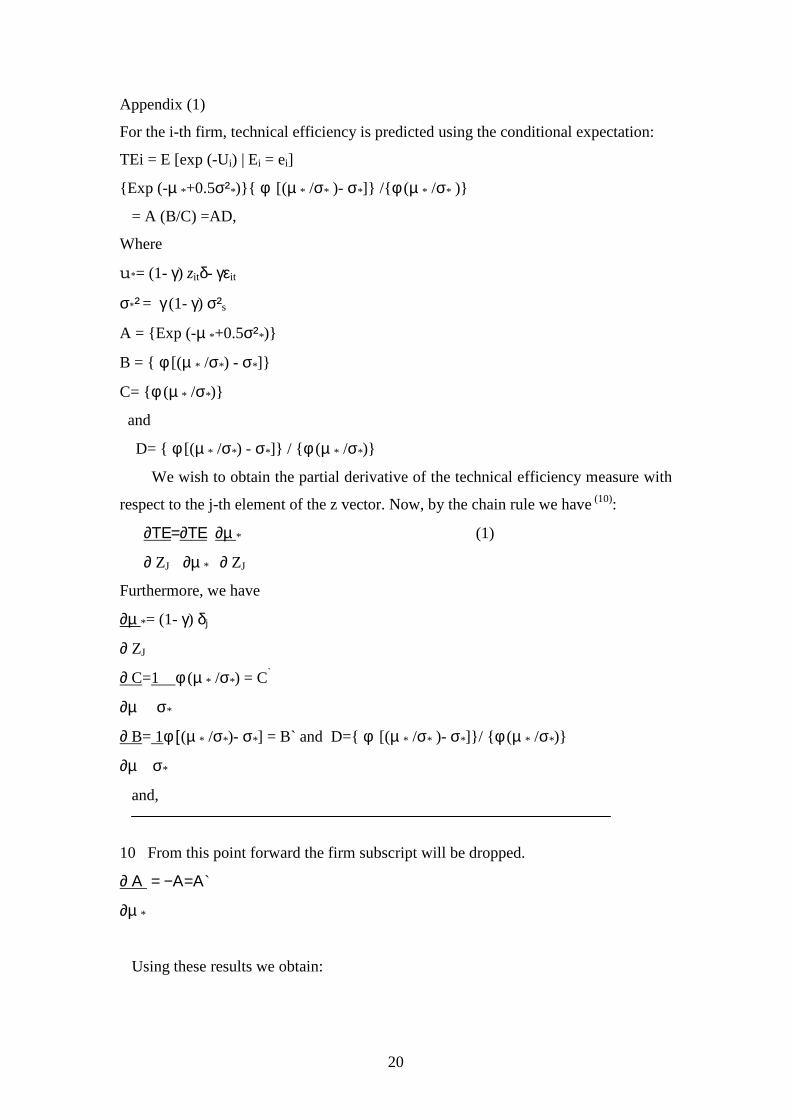
Quantification of the marginal effects of these variables on technical efficiency is
possible by partial differentiation of the technical efficiency predictor with respect to
each variable in the inefficiency function. Partial differentiation of equation (3) was
estimated with respect to each of the inefficiency variables, evaluated at their mean
values or with a value of one for dummy variables and where the residuals ei are
calculated at the mean values of the dependent and independent variables in the
stochastic frontier function (Wilson, et al.,2001). Details of the partial differentiation
are in the appendix (1).
Empirical Results and Discussions
Summary statistics of output and input variables
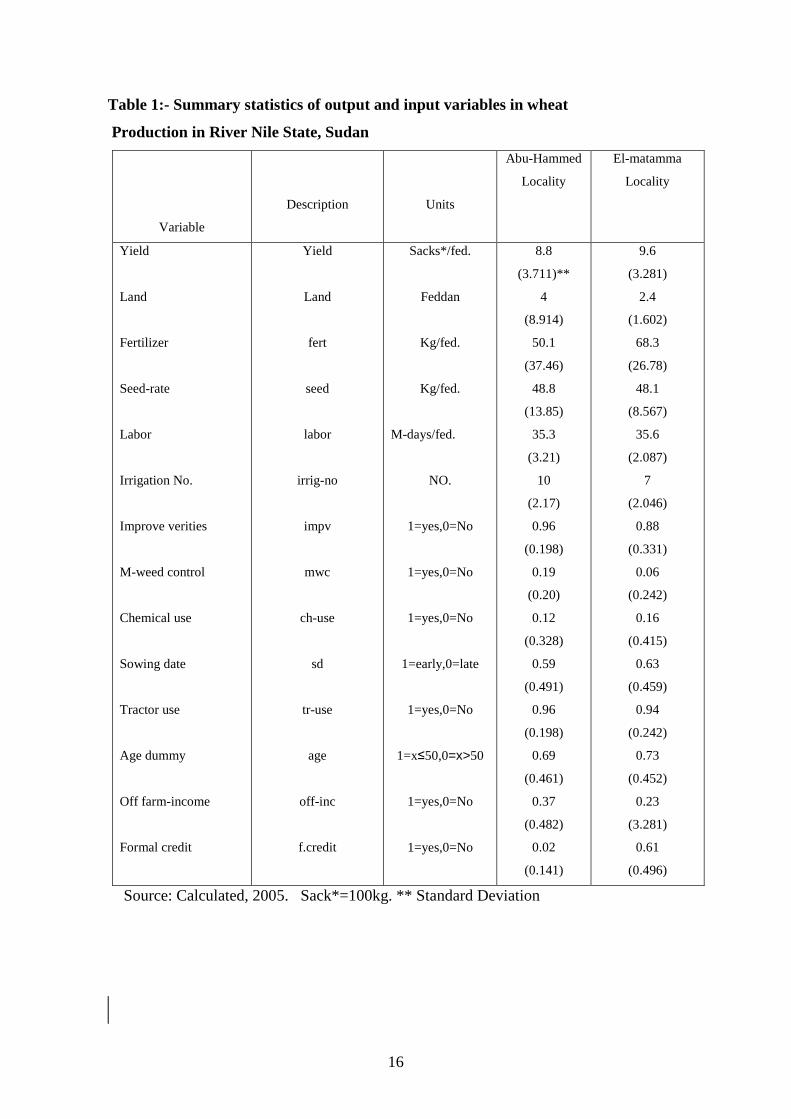
The summary of the production functions variables is presented in Table 1. The result
indicates that, the mean of wheat yield was 8.8 and 9.6 sacks/fed in Abu-Hammed and
8
El-matamma localities, respectively. The land cultivated by wheat in Abu-Hammed
locality was higher on average than in El-matamma locality. The average amount of
fertilizer applied in Abu-Hammed locality was slightly lower than in El-matamma
locality. Mager et al. (1969) pointed out that "the amount of fertilizer applied is
determined in general by soil fertility, soil type, cropping history, management of the
soil and requirement of the crop". Hudieba Research Station (H.R.S) recommends 80
kg urea for wheat. Elamin and Abdullah (2003) reported that usually farmers who
cultivate wheat in islands do not apply fertilizer. Variable amounts of urea were
applied in the range of 50 to 100 kg per feddan. This is due to the fact most of the
farmers depend mainly on their personal knowledge regarding fertilizer amounts.
Super phosphate at 40 kg/fed and 56-70 sack/fed of manure are recommended to add
in the high terrace soil with the objective of improving the soil physical conditions
and strengthening plant roots. The average amount of seed rate was around 49
kg/feddan in both localities of the state. According to H.R.S., the recommended seed
rate for wheat is 50-55 kg per feddan. Elfeil (1993) stated that the quality of seeds and
the amount of seed applied per unit area depends on the farmer's knowledge and
expertise, which are, of course, a function of farmer's education and age as well as a
function of extension services, which are lacking in the Northern Sudan. The average
time of labor engagement in growing wheat was around 35.6 man-days/fed in both
localities of the state. Farmers depend on family labor especially at the time of peak
agricultural operations demand such as harvest. Yet, family size is of great importance
as an indicator for family labour. Wheat has a recommended irrigation regime of eight
waterings at 10-12 days interval (Al-awad, 1994). As noticed from the table it was
less than that by one in El-matamma locality and more than that by two in Abu-
Hammed locality. According to the table, the majority of farmers adopt the
recommended varieties. Although, they cultivate high yielding verities and sell the
produce in the market, they depend heavily on sorghum for food rather than on wheat.
(Elamin and Abdalla, 2003). Moderate percentages of farmers did wheat sowing at the
appropriate time in the two localities. Farmers depended mainly on their personal
knowledge regarding the timing of wheat sowing. They stated many reasons behind
late sowing the most important of which are engagement in the cultivation of other
crops (faba beans, vegetables and spices) during November, high temperatures, risk
reduction of bird attack at the milky stage if they grow wheat early, shortage of
finance, late recession of the flood (delayed land preparation), and electricity and fuel
9
shortages. Farmers cited that the recession of the flood and removal of silt from the
pump site also have a tremendous effect on determining sowing time of all cultivated
crops in general (Elamin and Abdalla, 2003). The table illustrates few farmers (less
than 20% on the average) adopted manual weeding in the state. The research
recommends weeding for wheat once every 4 weeks (Al-awad, 1994). Non-adopters
of weed control, which is prominent in R.N.S, indicated that the unavailability and
high cost of hired labor were the main limiting factors. Others claim that weeds have
minor effect on the productivity and productivity gain does not outweigh the cost of
weeding. Chemical use, on average, was 0.12 and 0.16 in Abu-Hammed and El-
matamma localities, respectively. This is consistent with Elamin and Abdullah (2003)
who claimed that aphids and birds were the major wheat pests. Chemical control was
little practiced and farmers’ knowledge about pesticides application in wheat was
negligible. Chemical weed control is also practiced by very few farmers using 2/4/D,
topic, pursuit and stomp. High percentages of farmers use tractors in both localities,
due to its advantage of deep ploughing which enables the soil to absorb more water
and hence long irrigation interval. However, they resort to animal draught due to
financial problems, unavailability of tractors, fragmentation of land, easiness in
implementation when the soil is wet, availability when required, lower cost and less
demand for sowing seed.
Most farmers were in active age range in the two localities. Upton (1979) stated
that "the farmer age has an influence on management performance although the
overall direction of this influence is not clear. On the one hand as man ages, he gains
experience and would expect his decision-making ability to improve". As noticed
from the table, farmers at Abu-Hammed locality were slightly more dependent on off-
farm activities on and on financing their wheat production than their counterparts of
El-matamma locality that depend more on formal credit for the same purpose.
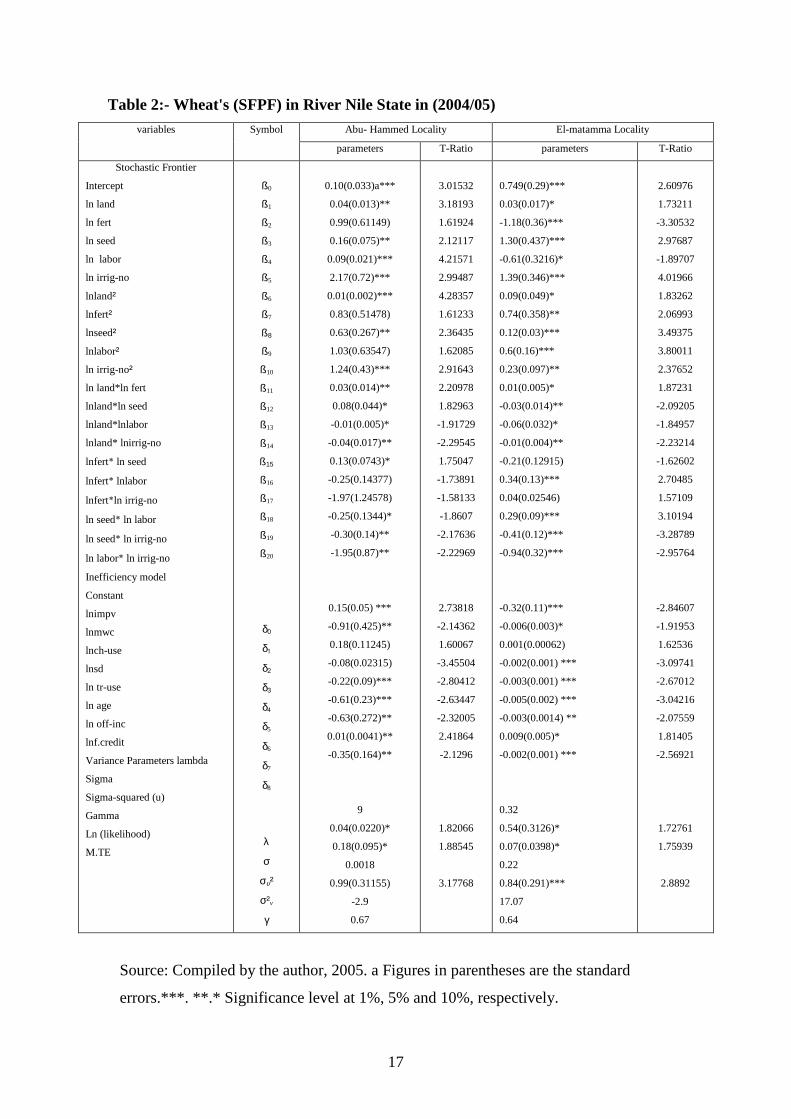
Maximum likelihood estimates of wheat stochastic frontier
Production functions (SFPF)
The SFPF estimates of the sampled wheat producers in the State are presented in
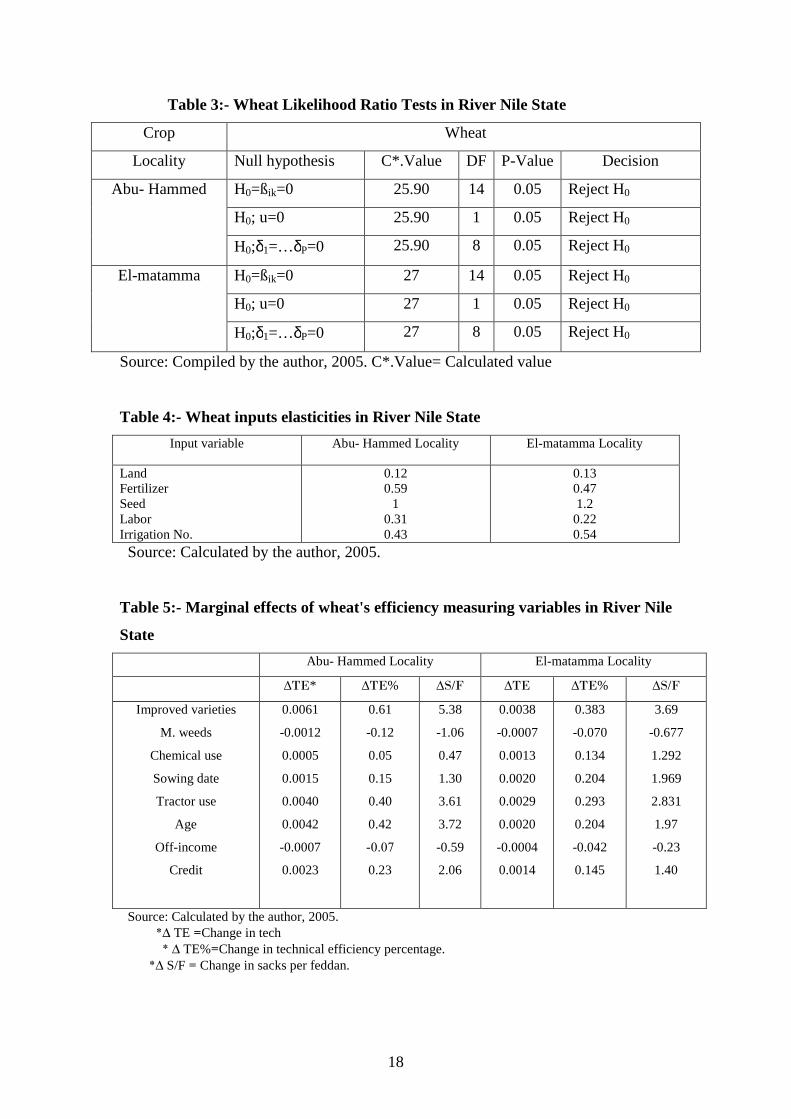
Table 2. The first null hypothesis (H0=ßik=0) is rejected in favor of translog
production function in the models. The second null hypothesis is also rejected in favor
of the presence of efficiency effects. The final null hypothesis is rejected confirming
10
that the joint effect of these variables on technical inefficiency is statistically
significant as depicted in table 3 of log likelihood ratio tests. Table 4 shows the
calculations of input elasticity's of wheat based on its translog SFPF. Thus, a one
percent increase in land will increase the wheat yield by 0.12% and 0.13% in Abu-
Hammed and El-matamma localities, respectively. This indicates that wheat is
inelastic with respect to land increase. Concerning fertilizer quantity per feddan a one
percent increase in the level of fertilizer will increase the wheat yield by 0.59% and
0.47% in the two localities, respectively. This indicates that wheat is moderately
inelastic with respect to fertilizer application. Mohammed (1995) realized the same
result, arguing that the actual amount of fertilizer applied is very little (50 kg/feddan)
relative to the recommended rate (100 kg/feddan). In case of seed rate, a one percent
increase in seed will increase wheat yield by 1% and 1.2 %. That indicates that wheat
yield is slightly elastic with respect to seed. A one percent increase in labour will
increase the wheat yield by 0.31% and 0.22 % in Abu-Hammed and El-matamma
localities, respectively. This reveals that labor is inelastic. On the other hand, a one
percent increase in the irrigation number will respectively increase the wheat yield by
0.43% and 0.54% in Abu-Hammed and El-matamma localities, respectively. Along
the same line, Mohammed (1995) concluded that high irrigation elasticity's are
enough to explain how the problems associated with irrigation inputs are constraining
the crop production of “Matarat”. These results indicate that the highest yield
responsiveness is due to seed rate followed by fertilizer, number of irrigations, labor
and land in Abu-Hammed locality. In El-matamma locality, wheat yield has highest
responsiveness to the seed rate followed by the number of irrigations, fertilizer, labor
and land. The sums of the elasticites of the variables are 2.45 and 2.55 in Abu-
Hammed and El-matamma localities, respectively. This reflects increasing returns-to-
scale in both localities.
Technical Efficiency
Technical efficiency is computed for each farm in each locality according to the early
stated equations. The results for the wheat mean technical efficiency and its variance
parameters at each locality are presented in Table 2. The mean technical efficiencies
of wheat were 0.67 and 0.64 in Abu-Hammed and El-matamma localities,
respectively. This means that, in the short run, there are ranges for increasing wheat
production by 0.33 and 0.36 in the two localities, respectively. That can be attained by
11
adopting technologies used by the best practice of wheat farmers. It suggests that, on
average; about 33% and 36% of yields in Abu-Hammed and El-matamma localities,
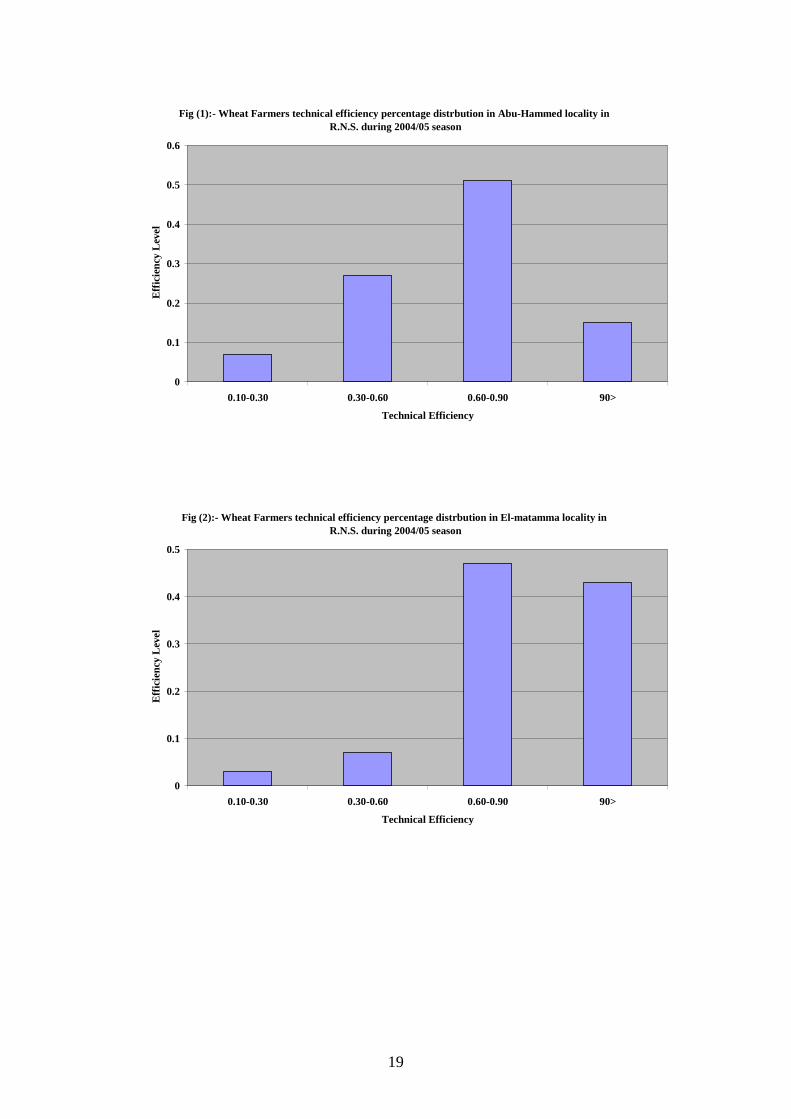
respectively, are foregone because of inefficiencies. However, farms in the two
localities have different estimated technical efficiencies and their distributions are
illustrated in figures 1 and 2. It is evident from the table that the estimates of λ and σ
are large in all localities and significantly different from zero, indicating a good fit
and correctness of the specified distribution assumption. λ is the ratio of variance of u
(συ) over variance of v (σv) and is an indication that the one-sided error term u
dominates the symmetric error v. Therefore, variation in actual wheat yield comes
from differences in farmer’s practice rather than random variability for the two
localities. Gamma (γ) =σ2υ / (σv
2+σ2υ), is also a measure of the level of the
inefficiency in the variance parameter; it ranges between 0 and 1. In the translog
stochastic models, γ is estimated at 0.99 and 0.84 for Abu-Hammed and El-matamma
localities, respectively. This can be interpreted as follows: 99% and 84 % of random
variation in wheat production in Abu-Hammed and El-matamma localities,
respectively, is explained by inefficiency.
Socio-economic characteristics
The effects of socio-economic characteristics were studied according to their
coefficients signs. Thus, a negative sign means a reduction in technical inefficiency,
which means increase in technical efficiency and a positive sign increase in technical
inefficiency or decrease in technical efficiency as displayed in table 2. Negative signs
on the dummy variables of using improved verities of wheat are statistically
significant at 5% and 10% in Abu-Hammed and El-matamma localities, respectively.
That indicates, using them will decrease technical inefficiency and increase technical
efficiency. The coefficients of dummy variable of manual weed control have positive
signs and insignificant, which indicates manual weed control insignificantly increase
technical inefficiency in these localities. Mohammed (1995) mentioned that in the
study area weeding is more practiced for faba bean, fennel and garlic. It is not
practiced for wheat and the reason reported is that the crop is not planted in ridges.
Another reason is that the crop is too dense to allow considerable weed growth. The
dummy variables of using chemical control have negative signs coefficients and they
are statistically significant at 1%, meaning that they increase efficiency in both
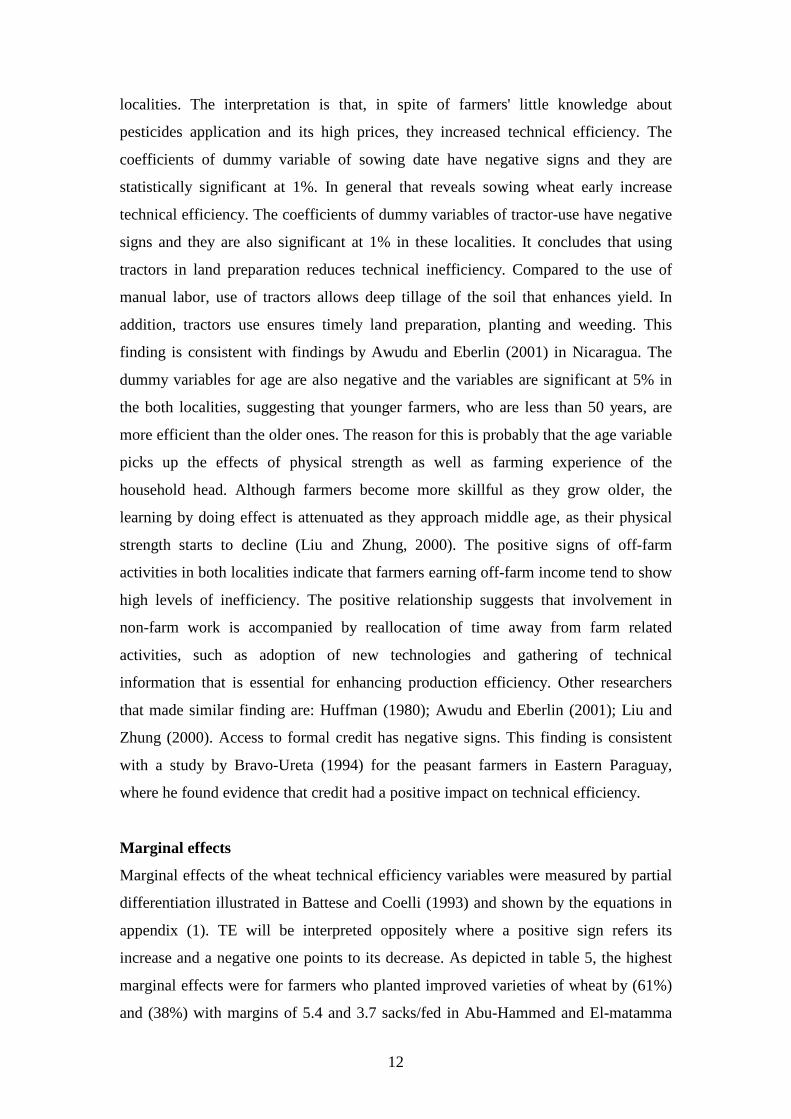
12
localities. The interpretation is that, in spite of farmers' little knowledge about
pesticides application and its high prices, they increased technical efficiency. The
coefficients of dummy variable of sowing date have negative signs and they are
statistically significant at 1%. In general that reveals sowing wheat early increase
technical efficiency. The coefficients of dummy variables of tractor-use have negative
signs and they are also significant at 1% in these localities. It concludes that using
tractors in land preparation reduces technical inefficiency. Compared to the use of
manual labor, use of tractors allows deep tillage of the soil that enhances yield. In
addition, tractors use ensures timely land preparation, planting and weeding. This
finding is consistent with findings by Awudu and Eberlin (2001) in Nicaragua. The
dummy variables for age are also negative and the variables are significant at 5% in
the both localities, suggesting that younger farmers, who are less than 50 years, are
more efficient than the older ones. The reason for this is probably that the age variable
picks up the effects of physical strength as well as farming experience of the
household head. Although farmers become more skillful as they grow older, the
learning by doing effect is attenuated as they approach middle age, as their physical
strength starts to decline (Liu and Zhung, 2000). The positive signs of off-farm
activities in both localities indicate that farmers earning off-farm income tend to show
high levels of inefficiency. The positive relationship suggests that involvement in
non-farm work is accompanied by reallocation of time away from farm related
activities, such as adoption of new technologies and gathering of technical
information that is essential for enhancing production efficiency. Other researchers
that made similar finding are: Huffman (1980); Awudu and Eberlin (2001); Liu and
Zhung (2000). Access to formal credit has negative signs. This finding is consistent
with a study by Bravo-Ureta (1994) for the peasant farmers in Eastern Paraguay,
where he found evidence that credit had a positive impact on technical efficiency.
Marginal effects
Marginal effects of the wheat technical efficiency variables were measured by partial
differentiation illustrated in Battese and Coelli (1993) and shown by the equations in
appendix (1). TE will be interpreted oppositely where a positive sign refers its
increase and a negative one points to its decrease. As depicted in table 5, the highest
marginal effects were for farmers who planted improved varieties of wheat by (61%)
and (38%) with margins of 5.4 and 3.7 sacks/fed in Abu-Hammed and El-matamma
13
localities, respectively. The lowest were for those who used chemicals (5%) and
(13%), equivalent to 0.47 and 1.3 sacks/fed, respectively.
Conclusions
Wheat farms in Abu-Hammed and El-matamma localities of the River Nile State have
respective mean technical efficiencies of 0.67 and 0.64. The farm-specific factors used
to explain inefficiencies indicate that those farmers who active in their age, timely
sowing, using wheat׳s improved varieties, using tractor in land preparation and other
operations, use chemicals in combating wheat׳s pests and diseases, have better accesses
to credit and those who do less off-farm work and manual weeding of wheat tend to be
more efficient. Calculations of marginal effects have shown that the highest increase in
technical efficiency will be for farmers who used improved varieties and the lowest for
those that used chemicals. The policy implications revealed that applying technical
packages and sowing improved varieties of wheat, have positive role in increase
efficiency of farmers who Sudan depending on to supply food security for the rapid
urban population.
References
Aigner, D.K., Lovell, C.K. and Schmidt, P. (1977). Formulation and
Estimation of Stochastic: Frontier Production Function Models. Journal of
Econometrics, 6:21-37.
Al-awad, A.A. (1994).Economics of Crop Production in the Northern State, A Case
Study of Rubatab Area .M.Sc.(Agric.)thesis, University of Khartoum, Sudan.
Awudu, A. and Richard, E. (2001). Technical Efficiency during Economic Reform in
Nicaragua: Evidence from Farm Household Survey Data. Economic Systems,
25: 113-125.
Bravo-Ureta, B.E. and Pinheiro, A.E.. (1997). Technical, Economic and Allocative
Efficiency in of Peasant Farming: Evidence from the Dominican Republic.
The Developing Economies.
Battese, G.E. and Corra, G.S. (1977).Estimation of a Production Frontier Model:
With Application to the Pastoral Zone of Eastern Australia., Australian
Journal of Agricultural Economics 21, 169-179.
14
Battese, G.E and Coelli, T.J. (1993). A Stochastic Frontier Production Incorporating a
Model for Technical Inefficiency Effects. Working Papers in Econometrics
and Applied Statistics, No.69, Department of Econometrics, University of
New England, Armidale, pp.22.
Battese, G.E and Coelli, T.J. (1995). A model for Technical Inefficiency Effects in a
Stochastic Frontier Production Function for Panel Data. Empirical Economics
20:325-332.
Elamin, M.A. (2002).Analysis of Policies Related to Wheat Production in Sudan,
Sudan Journal of Agric.Res.ARC.p 81-82.
Elamin, M.A and Ishatiag, A.F (2003). Monitoring and Evaluation of Farmer's
knowledge, Attitudes and Practices on the Production of Wheat in the
Northern Sudan, Gezira Research Station, Socioeconomic Research Program,
Anuual Report, ARC and MOST.
Elfeil, M.A. (1993). Economic Constrains of Agriculture Production in the Northern
Province of Sudan. An Econometric Approach. Ph.D. (Agric.).thesis.
University of Khartoum, Sudan.
Huffman, W.E. (1980). Farm and Off-Farm Decisions: The Role Human Capital.
Review of Economics and Statistics, 62: 14-23.
Liu, Z. and Zhuang, J. (2000). Determinants of Technical Efficiency in Post-
Collective Chinese Agriculture: Evidence from Farm- Level Data. Journal of
Comparative Economics, 28: 545- 564.
Mager, W.Y; Paai, K.D, Osman, A. (1969).Cotton Environment in Asymposim to
Mark The Fifth Anniversary of The Gezira Research Station, Wad Medani, Sudan.
Meeusen, W. and Van den Broeck, J. (1977). Efficiency Estimation from Cobb-
Douglas Production Functions with composed Error. International Economics
Rev., 18:435-444.
Ministry of Agriculture and Forests MOAF, (2003). The Second Agricultural
Development Strategy, SADS (2003-2007), Khartoum, Sudan.
Ministry of Finance and National Economy (MOFNE). (2000). Microeconomic
Performance Reform, Khartoum, Sudan.
Mohamed, A.S. (1995). Economics of Crop Production in Dongola Province.
M.Sc (Agric) thesis. University of Khartoum, Sudan.
Osman, A. H. (2004). The Sudanese Agricultural Development Strategy (SADS) 2003-
2007. A critical Review, M.Sc.thesis. University of Reading, U.K.

15
Upton, M (1979) Farm Management in Africa. The English Language Book.
Oxford University Press, Oxford, U.K.
Wilson, P.; David, H. and Carol, A. (2001). The Influence of Characteristics on the
Technical Efficiency of Wheat Farmers in Eastern England. Agricultural
Economics 24: 329- 338.
16
Table 1:- Summary statistics of output and input variables in wheat
Production in River Nile State, Sudan
Variable
Description
Units
Abu-Hammed
Locality
El-matamma
Locality
Yield
Land
Fertilizer
Seed-rate
Labor
Irrigation No.
Improve verities
M-weed control
Chemical use
Sowing date
Tractor use
Age dummy
Off farm-income
Formal credit
Yield
Land
fert
seed
labor
irrig-no
impv
mwc
ch-use
sd
tr-use
age
off-inc
f.credit
Sacks*/fed.
Feddan
Kg/fed.
Kg/fed.
M-days/fed.
NO.
1=yes,0=No
1=yes,0=No
1=yes,0=No
1=early,0=late
1=yes,0=No
1=x≤50,0=x>50
1=yes,0=No
1=yes,0=No
8.8
(3.711)**
4
(8.914)
50.1
(37.46)
48.8
(13.85)
35.3
(3.21)
10
(2.17)
0.96
(0.198)
0.19
(0.20)
0.12
(0.328)
0.59
(0.491)
0.96
(0.198)
0.69
(0.461)
0.37
(0.482)
0.02
(0.141)
9.6
(3.281)
2.4
(1.602)
68.3
(26.78)
48.1
(8.567)
35.6
(2.087)
7
(2.046)
0.88
(0.331)
0.06
(0.242)
0.16
(0.415)
0.63
(0.459)
0.94
(0.242)
0.73
(0.452)
0.23
(3.281)
0.61
(0.496)
Source: Calculated, 2005. Sack*=100kg. ** Standard Deviation
17
Table 2:- Wheat's (SFPF) in River Nile State in (2004/05) variables Symbol Abu- Hammed Locality El-matamma Locality
parameters T-Ratio parameters T-Ratio
Stochastic Frontier
Intercept
ln land
ln fert
ln seed
ln labor
ln irrig-no
lnland²
lnfert²
lnseed²
lnlabor²
ln irrig-no²
ln land*ln fert
lnland*ln seed
lnland*lnlabor
lnland* lnirrig-no
lnfert* ln seed
lnfert* lnlabor
lnfert*ln irrig-no
ln seed* ln labor
ln seed* ln irrig-no
ln labor* ln irrig-no
Inefficiency model
Constant
lnimpv
lnmwc
lnch-use
lnsd
ln tr-use
ln age
ln off-inc
lnf.credit
Variance Parameters lambda
Sigma
Sigma-squared (u)
Gamma
Ln (likelihood)
M.TE
ß0
ß1
ß2
ß3
ß4
ß5
ß6
ß7
ß8
ß9
ß10
ß11
ß12
ß13
ß14
ß15
ß16
ß17
ß18
ß19
ß20
δ0
δ1
δ2
δ3
δ4
δ5
δ6
δ7
δ8
λ
σ
συ²
σ²v
γ
0.10(0.033)a***
0.04(0.013)**
0.99(0.61149)
0.16(0.075)**
0.09(0.021)***
2.17(0.72)***
0.01(0.002)***
0.83(0.51478)
0.63(0.267)**
1.03(0.63547)
1.24(0.43)***
0.03(0.014)**
0.08(0.044)*
-0.01(0.005)*
-0.04(0.017)**
0.13(0.0743)*
-0.25(0.14377)
-1.97(1.24578)
-0.25(0.1344)*
-0.30(0.14)**
-1.95(0.87)**
0.15(0.05) ***
-0.91(0.425)**
0.18(0.11245)
-0.08(0.02315)
-0.22(0.09)***
-0.61(0.23)***
-0.63(0.272)**
0.01(0.0041)**
-0.35(0.164)**
9
0.04(0.0220)*
0.18(0.095)*
0.0018
0.99(0.31155)
-2.9
0.67
3.01532
3.18193
1.61924
2.12117
4.21571
2.99487
4.28357
1.61233
2.36435
1.62085
2.91643
2.20978
1.82963
-1.91729
-2.29545
1.75047
-1.73891
-1.58133
-1.8607
-2.17636
-2.22969
2.73818
-2.14362
1.60067
-3.45504
-2.80412
-2.63447
-2.32005
2.41864
-2.1296
1.82066
1.88545
3.17768
0.749(0.29)***
0.03(0.017)*
-1.18(0.36)***
1.30(0.437)***
-0.61(0.3216)*
1.39(0.346)***
0.09(0.049)*
0.74(0.358)**
0.12(0.03)***
0.6(0.16)***
0.23(0.097)**
0.01(0.005)*
-0.03(0.014)**
-0.06(0.032)*
-0.01(0.004)**
-0.21(0.12915)
0.34(0.13)***
0.04(0.02546)
0.29(0.09)***
-0.41(0.12)***
-0.94(0.32)***
-0.32(0.11)***
-0.006(0.003)*
0.001(0.00062)
-0.002(0.001) ***
-0.003(0.001) ***
-0.005(0.002) ***
-0.003(0.0014) **
0.009(0.005)*
-0.002(0.001) ***
0.32
0.54(0.3126)*
0.07(0.0398)*
0.22
0.84(0.291)***
17.07
0.64
2.60976
1.73211
-3.30532
2.97687
-1.89707
4.01966
1.83262
2.06993
3.49375
3.80011
2.37652
1.87231
-2.09205
-1.84957
-2.23214
-1.62602
2.70485
1.57109
3.10194
-3.28789
-2.95764
-2.84607
-1.91953
1.62536
-3.09741
-2.67012
-3.04216
-2.07559
1.81405
-2.56921
1.72761
1.75939
2.8892
Source: Compiled by the author, 2005. a Figures in parentheses are the standard
errors.***. **.* Significance level at 1%, 5% and 10%, respectively.
18
Table 3:- Wheat Likelihood Ratio Tests in River Nile State
Crop Wheat
Locality Null hypothesis C*.Value DF P-Value Decision
Abu- Hammed H0=ßik=0 25.90 14 0.05 Reject H0
H0; u=0 25.90 1 0.05 Reject H0
H0;δ1=…δP=0 25.90 8 0.05 Reject H0
El-matamma H0=ßik=0 27 14 0.05 Reject H0
H0; u=0 27 1 0.05 Reject H0
H0;δ1=…δP=0 27 8 0.05 Reject H0
Source: Compiled by the author, 2005. C*.Value= Calculated value
Table 4:- Wheat inputs elasticities in River Nile State
Input variable Abu- Hammed Locality El-matamma Locality
Land Fertilizer Seed Labor Irrigation No.
0.12 0.59
1 0.31 0.43
0.13 0.47 1.2 0.22 0.54
Source: Calculated by the author, 2005.
Table 5:- Marginal effects of wheat's efficiency measuring variables in River Nile
State
Abu- Hammed Locality El-matamma Locality
∆TE* ∆TE% ∆S/F ∆TE ∆TE% ∆S/F
Improved varieties
M. weeds
Chemical use
Sowing date
Tractor use
Age
Off-income
Credit
0.0061
-0.0012
0.0005
0.0015
0.0040
0.0042
0.0007-
0.0023
0.61
-0.12
0.05
0.15
0.40
0.42
0.07-
0.23
5.38
-1.06
0.47
1.30
3.61
3.72
-0.59
2.06
0.0038
-0.0007
0.0013
0.0020
0.0029
0.0020
0.0004-
0.0014
0.383
-0.070
0.134
0.204
0.293
0.204
0.042-
0.145
3.69
-0.677
1.292
1.969
2.831
1.97
-0.23
1.40
Source: Calculated by the author, 2005. *∆ TE =Change in tech * ∆ TE%=Change in technical efficiency percentage.
*∆ S/F = Change in sacks per feddan.
19
Fig (1):- Wheat Farmers technical efficiency percentage distrbution in Abu-Hammed locality in R.N.S. during 2004/05 season
0
0.1
0.2
0.3
0.4
0.5
0.6
0.10-0.30 0.30-0.60 0.60-0.90 90>
Technical Efficiency
Effi
cien
cy L
evel
Fig (2):- Wheat Farmers technical efficiency percentage distrbution in El-matamma locality in R.N.S. during 2004/05 season
0
0.1
0.2
0.3
0.4
0.5
0.10-0.30 0.30-0.60 0.60-0.90 90>
Technical Efficiency
Effi
cien
cy L
evel
20
Appendix (1)
For the i-th firm, technical efficiency is predicted using the conditional expectation:
TEi = E [exp (-Ui) | Ei = ei]
{Exp (-µ *+0.5σ²*)}{ φ [(µ * /σ* )- σ*]} /{ φ (µ * /σ* )}
= A (B/C) =AD,
Where
u*= (1- γ) zitδ- γεit
σ*² = γ (1- γ) σ²s
A = {Exp (-µ *+0.5σ²*)}
B = { φ [(µ * /σ*) - σ*]}
C= {φ (µ * /σ*)}
and
D= { φ [(µ * /σ*) - σ*]} / { φ (µ * /σ*)}
We wish to obtain the partial derivative of the technical efficiency measure with
respect to the j-th element of the z vector. Now, by the chain rule we have (10):
∂ΤΕ=∂ΤΕ ∂µ * (1)
∂ ZJ ∂µ * ∂ ZJ
Furthermore, we have
∂µ *= (1- γ) δj
∂ ZJ
∂ C=1 φ (µ * /σ*) = C`
∂µ σ*
∂ B= 1φ [(µ * /σ*)- σ*] = B` and D={ φ [(µ * /σ* )- σ*]}/ { φ (µ * /σ*)}
∂µ σ*
and,
10 From this point forward the firm subscript will be dropped.
∂ Α = −Α=Α`
∂µ *
Using these results we obtain:
21
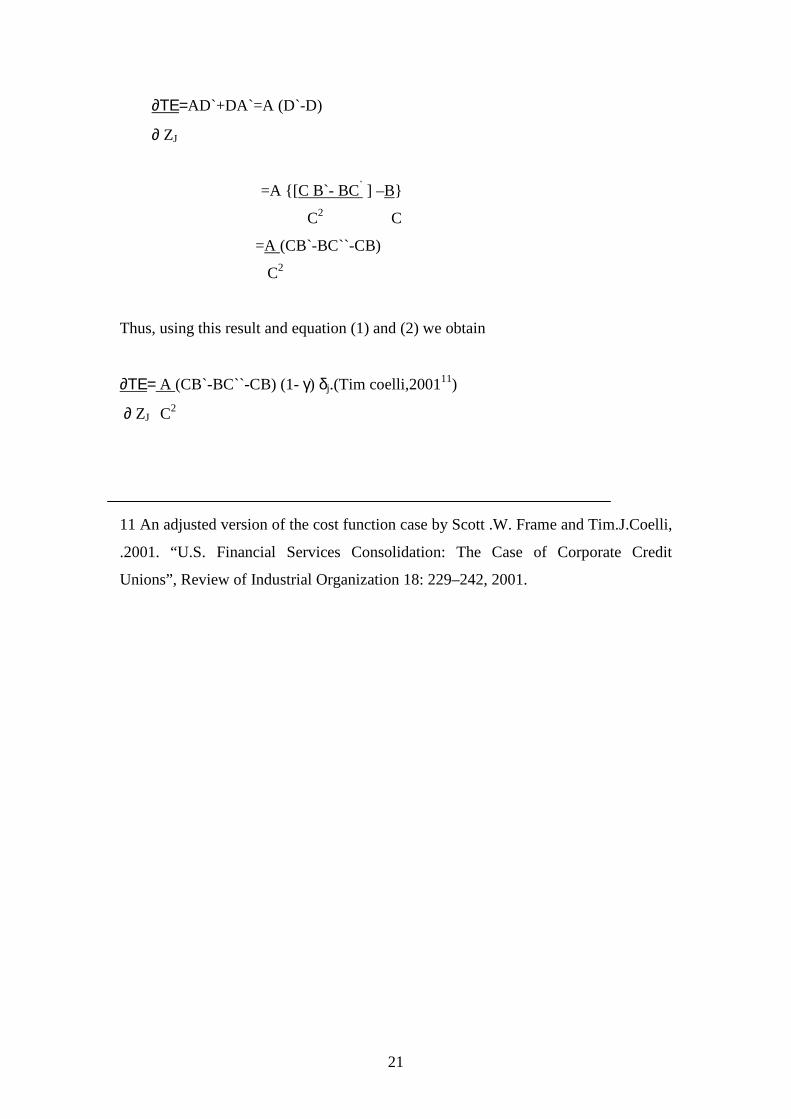
∂ΤΕ=AD`+DA`=A (D`-D)
∂ ZJ
=A {[C B`- BC` ] –B}
C2 C
=A (CB`-BC``-CB)
C2
Thus, using this result and equation (1) and (2) we obtain
∂ΤΕ= A (CB`-BC``-CB) (1- γ) δj.(Tim coelli,200111)
∂ ZJ C2
11 An adjusted version of the cost function case by Scott .W. Frame and Tim.J.Coelli,
.2001. “U.S. Financial Services Consolidation: The Case of Corporate Credit
Unions”, Review of Industrial Organization 18: 229–242, 2001.