Embed Size (px)
Citation preview
This article was downloaded by: [Stony Brook University]On: 19 October 2014, At: 23:38Publisher: RoutledgeInforma Ltd Registered in England and Wales Registered Number: 1072954 Registeredoffice: Mortimer House, 37-41 Mortimer Street, London W1T 3JH, UK
Europe-Asia StudiesPublication details, including instructions for authors andsubscription information:http://www.tandfonline.com/loi/ceas20
Technical Efficiency, AllocativeEfficiency and Profitability inHungarian Small and Medium-SizedEnterprises: A Model with FrontierFunctionsIván Major aa Institute of Economics, The Hungarian Academy of Sciences ,BudapestPublished online: 12 Sep 2008.
To cite this article: Iván Major (2008) Technical Efficiency, Allocative Efficiency and Profitabilityin Hungarian Small and Medium-Sized Enterprises: A Model with Frontier Functions, Europe-AsiaStudies, 60:8, 1371-1396, DOI: 10.1080/09668130802292200
To link to this article: http://dx.doi.org/10.1080/09668130802292200
PLEASE SCROLL DOWN FOR ARTICLE
Taylor & Francis makes every effort to ensure the accuracy of all the information (the“Content”) contained in the publications on our platform. However, Taylor & Francis,our agents, and our licensors make no representations or warranties whatsoever as tothe accuracy, completeness, or suitability for any purpose of the Content. Any opinionsand views expressed in this publication are the opinions and views of the authors,and are not the views of or endorsed by Taylor & Francis. The accuracy of the Contentshould not be relied upon and should be independently verified with primary sourcesof information. Taylor and Francis shall not be liable for any losses, actions, claims,proceedings, demands, costs, expenses, damages, and other liabilities whatsoever orhowsoever caused arising directly or indirectly in connection with, in relation to or arisingout of the use of the Content.
This article may be used for research, teaching, and private study purposes. Anysubstantial or systematic reproduction, redistribution, reselling, loan, sub-licensing,systematic supply, or distribution in any form to anyone is expressly forbidden. Terms &

Conditions of access and use can be found at http://www.tandfonline.com/page/terms-and-conditions
Dow
nloa
ded
by [
Ston
y B
rook
Uni
vers
ity]
at 2
3:38
19
Oct
ober
201
4
Technical Efficiency, Allocative Efficiency
and Profitability in Hungarian Small and
Medium-Sized Enterprises: A Model with
Frontier Functions
IVAN MAJOR
Abstract
By applying a simple model of frontier production functions, this article shows that Hungarian small
and medium-sized enterprises (SMEs) produce far below their feasible level, given their input
endowment. The SMEs’ under-production is rooted in the allocative inefficiency of small and medium-
sized firms: they use labour in excess while they lack a sufficient level of capital assets. As a consequence
of large inefficiencies, Hungarian SMEs improve profitability by scaling down production rather than
by expansion.
THE ECONOMIC TRANSFORMATION OF CENTRAL AND East European (CEE)
economies has been dominated by a large inflow of foreign capital in all countries
in the region.1 Foreign capital arrived in many different forms and sizes. Foreign
investors acquired formerly state-owned companies or they invested in the
privatisation funds that had been set up by national governments. In addition,
foreigners invested in ‘green field’ developments or they engaged in financial
investments. The presence and the economic activities of the international community
have become decisive in many of the CEE economies. Empirical analyses show that
I am grateful for valuable and helpful comments from two anonymous referees, to Janos Koll}o,
Mihaly Laki, James Rauch, Akos Rona-Tas, Attila K. Soos, the late Marton Tardos, and to
conference participants at the Institute of Economics, HAS and at the University of California San
Diego. Financial support from the Hungarian Science Foundation (OTKA grant no. T 048680) is
thankfully acknowledged.1The countries of Central and Eastern Europe are a very heterogeneous group, including countries
that are now members of the European Union, independent member states that were formerly
members of the Soviet Union, former member states of Yugoslavia, and Albania. While all these
countries share a number of common features from the socialist past, and encountered similar
difficulties during the transition, their paths of development also differ in many respects, including the
importance of foreign participation in their economies and the development of the SME sector.
EUROPE-ASIA STUDIES
Vol. 60, No. 8, October 2008, 1371–1396
ISSN 0966-8136 print; ISSN 1465-3427 online/08/081371-26 ª 2008 University of Glasgow
DOI: 10.1080/09668130802292200
Dow
nloa
ded
by [
Ston
y B
rook
Uni
vers
ity]
at 2
3:38
19
Oct
ober
201
4
the countries that have developed fastest were those that were able to attract the
largest amount of foreign direct investment during the past 18 years (Kornai 2007, pp.
79–111, 136–62; Major 1999b, pp. 59–390; Parker & Saal 2003, pp. 323–476; Pohl et al.
1997).
As well as increasing foreign involvement, the number of domestic companies also
exploded during the transition. Hundreds of thousands of small entrepreneurs started
their business after the dominance of state ownership was abandoned. Most of these
domestic firms remained really small: they operated as family businesses or as a form
of ‘forced entrepreneurship’ that resulted from rapidly growing unemployment. But a
few thousand domestic firms emerged as small and medium-sized enterprises (SMEs)
with similar structures and ambitions to their Western counterparts. A few of these
SMEs turned out to be successful—mostly in special trades, such as confectionery or
other handicraft industries, or in industries where the primary input has been some
special knowledge or talent—but most of them simply survived without experiencing
any significant growth. In general, there is a clear divide between large foreign
corporations on the one hand, and small domestic firms on the other. This article
offers a possible explanation for the moderate success—or failure—of domestic
companies in Hungary and in other transition countries.2 In particular, I shall argue
that most small domestic firms in Hungary and in other CEE countries are either not
flexible enough to adjust to the fairly volatile market conditions they face, or they were
established by their owners for some special purpose, such as, for instance, tax evasion
or simply to move money around.
It is important to note that there are substantial differences between the economic
conditions that Hungarian SMEs operate in and those in other transition countries
beside all the similarities of their heritage and current economic environment. While
SMEs throughout the region suffer from shortages in financial resources, from
bureaucratic red tape and from the weaknesses of the institutional system, especially
from uncertain property rights, Hungarian SMEs have been particularly affected by
the dominant role of foreign businesses, and the impact of the gradualist transition
that has been more prevalent in Hungary than in other CEE countries. I shall
show that the majority of Hungarian SMEs, with a few exceptions, are far away from
their feasible level of technical and economic (or cost-) efficiency.3 I also analyse the
connection between the technical efficiency and profitability of small and medium-
sized companies. I focus on the case of Hungarian SMEs but most of my discussion
also holds for SMEs in other transition economies.
I selected the group of SMEs for several reasons. First, this is the pool of companies
that has been targeted by specific policy measures within most European countries and
also on the level of the European Union. This then raises the question of whether
SMEs will become the foundation of economic development in transition economies.
While global companies have grown from strong domestic industries in the advanced
2There are, of course, exceptions, and we find countries in CEE where the ‘new private sector’ of
domestic SMEs has performed better than in Hungary or in some other CEE countries. Poland may be
one example since it had a more dynamic SME sector in the early and mid-1990s (Gomulka 1994).
Aidis and Mickiewicz (2006) also report impressive results for Lithuanian SMEs.3I use the terms technical and economic efficiency as these notions have been defined by Kumbhakar
and Lovell (2000, pp. 42 and 51, respectively).
1372 IVAN MAJOR
Dow
nloa
ded
by [
Ston
y B
rook
Uni
vers
ity]
at 2
3:38
19
Oct
ober
201
4
economies, in transition economies domestic firms have struggled to survive mainly in
niche markets that have been abandoned by the large multinational corporations.
Second, SMEs usually operate with constant or diminishing returns. This feature
renders the analysis fairly simple, for SMEs can be regarded as firms operating in a
perfectly competitive market. Then, we can apply simple production functions,
notably, Cobb–Douglas production4 functions to describe SMEs’ technology without
falling into the trap of an insoluble profit maximisation problem. (Test results on
Hungarian SMEs’ diminishing returns are presented in Table A1 in the Appendix.)
The structure of the article is as follows. First, I outline the analytical background
and give a concise literature review. Then I present the basic empirical evidence on the
moderate performance of Hungarian SMEs, before discussing a simple simultaneous
model of technical and allocative efficiency in the following section. This is followed by
a description of the database and the estimation methods and a discussion of the
estimation results.
Methodology and literature review
Economic analyses of corporate performance have favoured measures of productivity
more than profitability measures during the last decades. Nickell (1996), for instance,
referred back to Adam Smith (1776) to argue that ‘since it is productivity growth that
is the cause of the ‘‘wealth of nations’’ . . . emphasis on profitability is rather curious’
(Nickell 1996, p. 725). Nickell suggested that corporate success should be measured by
total factor productivity rather than by profitability. Nickell et al. (1997) used frontier
production functions (FPF) to search for the decisive factors supporting the
companies’ economic success. Frank Knight (1921) argued that corporate profit is
but a residual between revenues and costs that is exposed to numerous uncertain—or
risky—factors beyond the reach of the firms. In addition, companies may have
incentives not to report profits if the rules of taxation or the greed of stockholders
create unfavourable conditions for managers to achieve high profits. A third factor
relates to the age and a fourth relates to the size of the firm as Aidis and Mickiewicz
(2006, p. 862)—and several other studies—point out.
However, the evidence on the firms’ profit in relation to firm size and age is
inconclusive. While, for instance, Becchetti and Trovaro (2002) have found a negative
relationship between firm size and firm growth in advanced Western economies, and
Faggio and Konings (2003) arrived at similar conclusions for CEE countries, Halpern
and K}orosi (2001), and Fries et al. (2003) have shown a positive relationship between
firm size and corporate performance in different transition countries. Similarly, age of
the firm may have a negative or a positive effect on corporate performance, as Aidis
and Mickiewicz (2006) point out. Nevertheless, empirical evidence suggests that
corporate success is strongly related to the profitability of companies. We can expect
that a firm that is not capable of generating at least normal profits will soon go out of
4Cobb–Douglas production functions are built on the realistic assumption that capital and labour
are imperfect substitutes within the firms’ production technology. As data in Tables A1, A2 and A5
show, Cobb–Douglas production functions gave highly significant results for the relationship between
labour and capital inputs and production level of Hungarian SMEs.
EFFICIENCY OF HUNGARIAN SMEs 1373
Dow
nloa
ded
by [
Ston
y B
rook
Uni
vers
ity]
at 2
3:38
19
Oct
ober
201
4
business. Strangely enough however, just the opposite could be observed in the case of
the Hungarian SMEs: the survival rate of the profitable firms has been lower than in
the case of loss-making companies or for firms that just barely break even. This
observation also suggests that in most cases SMEs have been created by their owners
as ‘money movers’ rather than production entities.
It is not obvious how we can assess and measure the corporate performance of
SMEs. Aghion et al. (1994), Brada and Ma (1997), Johnson et al. (2000), Faggio and
Konings (2003), and Aidis and Mickiewicz (2006) consider the increase in sales and the
increase of employment as the most important success indicators of the SMEs’
performance. My results are in line with these findings, but I shall also stress the
difference between increasing employment and high labour intensity. While increasing
employment may indicate that the firm is capable of expanding, high labour intensity
itself may be a sign of allocative inefficiency.
What factors promote and what factors hinder the SMEs’ development in CEE? As
Lazear (2004) pointed out the entrepreneurs’ skills and accumulated knowledge is
critical to the SMEs’ success. Aidis and Mickiewicz (2006) surveyed Lithuanian SMEs
and found that the entrepreneurs’ human capital—their level of education and
previous work experience—had a significant and highly positive impact on the firms’
performance. Laki (1998, 2001) and Lengyel (2002) arrived at a similar conclusion but
they emphasised the entrepreneurs’ social capital—the network of social connections
they had created—beside education and experience in the case of Hungarian SMEs
and in some other CEE countries. Solid property rights, stable regulation and taxation
rules, the low level of bureaucracy and an easy access to business information are also
important facilitating factors of the SMEs’ success, as Earle et al. (1994) and
Commander et al. (1999) emphasise.
Pissarides et al. (2003) and EBRD (2002) emphasise the decisive role of financial
constraints that SMEs face in these countries. The authors point out that limited
access to bank loans, especially to long-term financing, and prohibitively high interest
rates are serious barriers to the growth of SMEs. Their findings are similar to Levine
(1997) who found that ‘thin’ financial markets and the lack of financing for smaller
businesses are major barriers to development in most developing countries. I have also
found that Hungarian SMEs work within tight financial constraints. Financial
institutions have not been keen on offering loans with reasonable terms to small
businesses. However, this situation started to change recently as competition has
become much stronger in the Hungarian financial market as in some other CEE
markets (Johnson et al. 2002).
Unstable property rights, excessive regulation, bureaucratic delays and corruption
have become the major constraining factors mentioned most frequently by
entrepreneurs in several CEE countries (Batra et al. 2003; Laki & Szalai 2006; Aidis
& Mickiewicz 2006). In addition, SMEs also complain about limited demand,
especially during periods of financial distress and an ensuing stabilisation in CEE
countries. Institutional factors may be critical to the development of the SME sector,
but I have no empirical evidence either to support or refute these claims. My intention
in this article is to show that Hungarian SMEs produce below the level their
endowment of input factors would permit. That is, SMEs produce with a low level of
technical efficiency. They also misallocate resources in that SMEs are usually short of
1374 IVAN MAJOR
Dow
nloa
ded
by [
Ston
y B
rook
Uni
vers
ity]
at 2
3:38
19
Oct
ober
201
4
capital, while they use more labour than would be efficient given output levels. This
conclusion calls for caution when it comes to policy advice. Abolishing the barriers to
increasing employment by SMEs may not result in a spectacular growth performance
of this sector. I shall apply the simple framework of profit maximisation and cost
minimisation in the following analysis. The basic model of the firms’ behaviour
assumes that profit maximisation is directly related to the minimisation of costs and to
the technical efficiency of the firms. Based on these duality assumptions, Kumbhakar
and Lovell (2000) show that ‘profit efficiency’ is a simultaneous relationship between
the companies’ production, revenues and costs in a competitive environment
(Kumbhakar & Lovell 2000, p. 162). I shall assume that the production and profit
decisions of a firm are interrelated: whenever firms settle for a certain level of technical
inefficiency they directly affect the profit level they will be capable of attaining.
I shall use the tools of frontier analysis in order to address the issues of production
efficiency and profitability. The econometric foundations of the frontier analysis were
initially defined by Amemiya (1973). The frontier production function (FPF) was first
outlined by Aigner et al. (1977). Brada et al. (1997) used FPFs to analyse the change in
efficiency of Czech companies, while Konings and Repkin (1998) conducted an FPF
analysis to measure the efficiency level of Bulgarian and Romanian firms after the
economic transition in the 1990s. Dynamic FPFs were applied by Halpern and K}orosi
(2001) in the analysis of the technical efficiency of the Hungarian corporate sector for
the period of 1994–1998. Kumbhakar and Lovell (2000) gave an extensive account of
the deterministic and the stochastic frontier analysis. I shall apply their results in the
estimation of the stochastic frontier production function of the Hungarian SMEs.
Several studies used simultaneous estimation methods to analyse the relationship
between efficiency and profitability (see, for instance, Reifschneider & Stevenson 1991;
Basu & Fernald 1997; Kumbhakar & Lovell 2000). I have chosen a similar approach.
That is, I will estimate the optimum production level and the level of inputs—labour
and capital—that minimise costs in a simultaneous model. Finally, I shall use the
results from the frontier estimates to analyse the strength of the relationship between
the companies’ profitability on the one hand and the technical and cost—or
allocative—efficiency level of the firms on the other.
Empirical evidence
According to corporate tax files collected by the Hungarian tax administration, 236,644
companies with double-entry book-keeping operated in the Hungarian economy in
2003.5 Of all firms, 844 companies belonged to the group of large corporations,6 while
the rest belonged to the group of medium-sized enterprises (3,560 firms) or to the group
of small companies (232,240 firms). However, only a few thousand of the small firms
5At the moment of writing this is the last year we have data from. All data on the corporate sector
are from The State of Small and Medium-Sized Enterprises. Annual Report, 2003–2004 (Budapest, The
Hungarian Ministry of the Economy and Transport).6Following one of the classification criteria of the European Union, I label a firm a ‘large company’
if it employs at least 250 people, a ‘medium-sized company’ if it employs between 50 and 249
individuals, and a small company if it has between 0 and 49 employees. (The EU takes into account the
firms’ turnover as well as their capital assets when it ranks different corporations.)
EFFICIENCY OF HUNGARIAN SMEs 1375
Dow
nloa
ded
by [
Ston
y B
rook
Uni
vers
ity]
at 2
3:38
19
Oct
ober
201
4
had any employees or produced positive outputs. When I use the term SME it covers
only those small and medium-sized enterprises that actually showed some sign of actual
existence. In addition to the corporate entities, another 717,000 individual entrepre-
neurs and 215,000 one-person companies (‘sole proprietorships’) were registered in the
Hungarian economy.7 The number of large companies accounted for less than 0.4% of
all corporations, but this company group produced 39.1% of the Hungarian economy’s
total output and 48.6% of its GDP in 2003. Large firms accounted for 64.4% of total
Hungarian exports. The large corporations employed 36.8% of all employees, and their
share from all shareholders’ equity amounted to 51.1%.
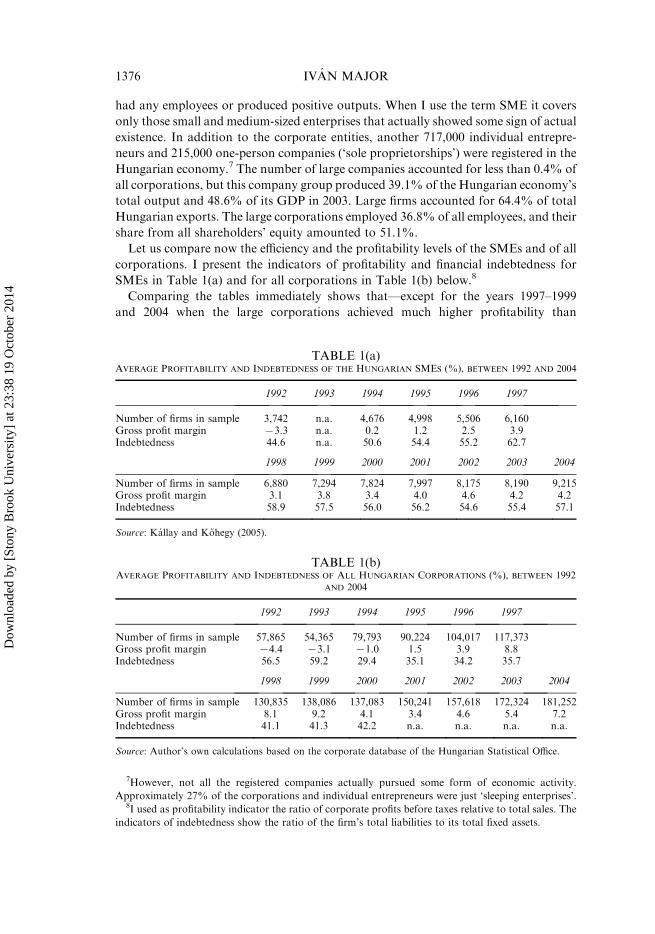
Let us compare now the efficiency and the profitability levels of the SMEs and of all
corporations. I present the indicators of profitability and financial indebtedness for
SMEs in Table 1(a) and for all corporations in Table 1(b) below.8
Comparing the tables immediately shows that—except for the years 1997–1999
and 2004 when the large corporations achieved much higher profitability than
TABLE 1(a)AVERAGE PROFITABILITY AND INDEBTEDNESS OF THE HUNGARIAN SMES (%), BETWEEN 1992 AND 2004
1992 1993 1994 1995 1996 1997
Number of firms in sample 3,742 n.a. 4,676 4,998 5,506 6,160Gross profit margin 73.3 n.a. 0.2 1.2 2.5 3.9Indebtedness 44.6 n.a. 50.6 54.4 55.2 62.7
1998 1999 2000 2001 2002 2003 2004
Number of firms in sample 6,880 7,294 7,824 7,997 8,175 8,190 9,215Gross profit margin 3.1 3.8 3.4 4.0 4.6 4.2 4.2Indebtedness 58.9 57.5 56.0 56.2 54.6 55.4 57.1
Source: Kallay and K}ohegy (2005).
TABLE 1(b)AVERAGE PROFITABILITY AND INDEBTEDNESS OF ALL HUNGARIAN CORPORATIONS (%), BETWEEN 1992
AND 2004
1992 1993 1994 1995 1996 1997
Number of firms in sample 57,865 54,365 79,793 90,224 104,017 117,373Gross profit margin 74.4 73.1 71.0 1.5 3.9 8.8Indebtedness 56.5 59.2 29.4 35.1 34.2 35.7
1998 1999 2000 2001 2002 2003 2004
Number of firms in sample 130,835 138,086 137,083 150,241 157,618 172,324 181,252Gross profit margin 8.1 9.2 4.1 3.4 4.6 5.4 7.2Indebtedness 41.1 41.3 42.2 n.a. n.a. n.a. n.a.
Source: Author’s own calculations based on the corporate database of the Hungarian Statistical Office.
7However, not all the registered companies actually pursued some form of economic activity.
Approximately 27% of the corporations and individual entrepreneurs were just ‘sleeping enterprises’.8I used as profitability indicator the ratio of corporate profits before taxes relative to total sales. The
indicators of indebtedness show the ratio of the firm’s total liabilities to its total fixed assets.
1376 IVAN MAJOR
Dow
nloa
ded
by [
Ston
y B
rook
Uni
vers
ity]
at 2
3:38
19
Oct
ober
201
4
SMEs—there has not been any considerable gap between the profitability levels of the
two company groups. The average profit margin of Hungarian SMEs was just slightly
below the profit margin of all the firms. There is, of course, a wide variety among the
firms’ profitability in both groups, but the overall picture is clear: large corporations
were more successful than SMEs during periods of fast growth, but they equally faced
a setback when the Hungarian economy was slowing down. SMEs have been more
indebted than all corporations but the difference between the two groups is not
extremely large. However, if we compare labour productivity of SMEs and that of
large corporations, we can see a substantial difference between the two groups. The
average labour productivity of large corporations was 67% higher than labour
productivity of small and medium-sized firms in 2003, and the gap between the two
groups has been widening during the last decade.
Theory and models
Remaining within the framework of the firm’s basic model, I assume that there are n
firms in the market and each company is a profit maximiser. For simplicity’s sake, let
the production function of each firm be of a Cobb–Douglas type, while the specific
amount of output and inputs (yi,xij) will be different for each company: yi ¼ A �Qmj¼1 x
ajij ;
Pmj¼1 aj � 1. I shall simplify the analysis by limiting the number of input
factors to two: labour—measured by the number of employees—and capital assets.
My main hypothesis is that there are two important sources of under-performance
for the Hungarian SMEs. First, the output of these companies is far away from the
technically efficient level, that is, companies carry out production with a considerable
excess of physical inputs. This fact is usually due to the firms’ limited access to relevant
market information and to other forms of market uncertainties. Secondly, SMEs use
inputs in excess of their cost-efficient level, given their output, technology and factor
prices. I shall call the first factor ‘technical inefficiency’ and the second factor
‘allocative inefficiency’.
The over-utilisation of labour is driven by two factors. Firstly, labour is less
expensive to SMEs than what wage costs would suggest, for a large number of firms
avoid paying the full wage, social benefits included, by forcing their employees to
establish a one person company and then buying the labour services from those one
person firms. As I shall discuss below, many SMEs belong to a network of small or
medium-sized companies. I shall label these firms ‘network companies’. The ‘network
company’ is a member of an organic web of companies, including a few smaller firms
that allocate tasks, resources and costs among the subordinated companies. All the
firms in the network are owned by the same owner or owners. The firm or firms in the
‘core’ group are registered as ‘low income, low cost’ companies and the members of
this group are taxed by the rules of preferential corporate taxation.9 Thus, a network
company has been typically established for the purpose of paying less taxes. In turn, I
shall call a company that does not belong to a group of firms with the same owners a
‘stand-alone firm’. Since official data of the Hungarian Ministry of the Economy and
9This preferential corporate tax is called ‘simplified corporate tax’. The simplified tax was a flat rate
of 15%—it was increased to 25% in 2006—relative to the firm’s total sales.
EFFICIENCY OF HUNGARIAN SMEs 1377
Dow
nloa
ded
by [
Ston
y B
rook
Uni
vers
ity]
at 2
3:38
19
Oct
ober
201
4
Transport for the period of 2001–2004 made it feasible to separate firms that belong to
a network from firms that do not, I shall present the results of the analysis separately
for the so-called ‘network companies’ and for the ‘stand-alone firms’. Secondly,
although most SMEs operate in labour-intensive industries their physical assets are
much more obsolete and less efficient than the physical assets of their larger
counterparts. Consequently, a large share of the excess labour these companies use is a
substitute for the lack of equipment and high-level technology machines.
Paradoxically, small firms hoard more capital than they actually need and use in the
production process. The accumulation of excess capital is due to the financial
constraints most SMEs face. These constraints are much harder for small firms than the
constraints large companies must deal with. SMEs have poorer access to bank loans or
to other forms of external financing than large corporations. Consequently, they can
start capital investments only from their own financial resources. SMEs can meet their
short-term cash flow needs also at a higher cost than large firms. These financial strains
directly result in a hoarding of capital inputs by the small and medium-sized firms.
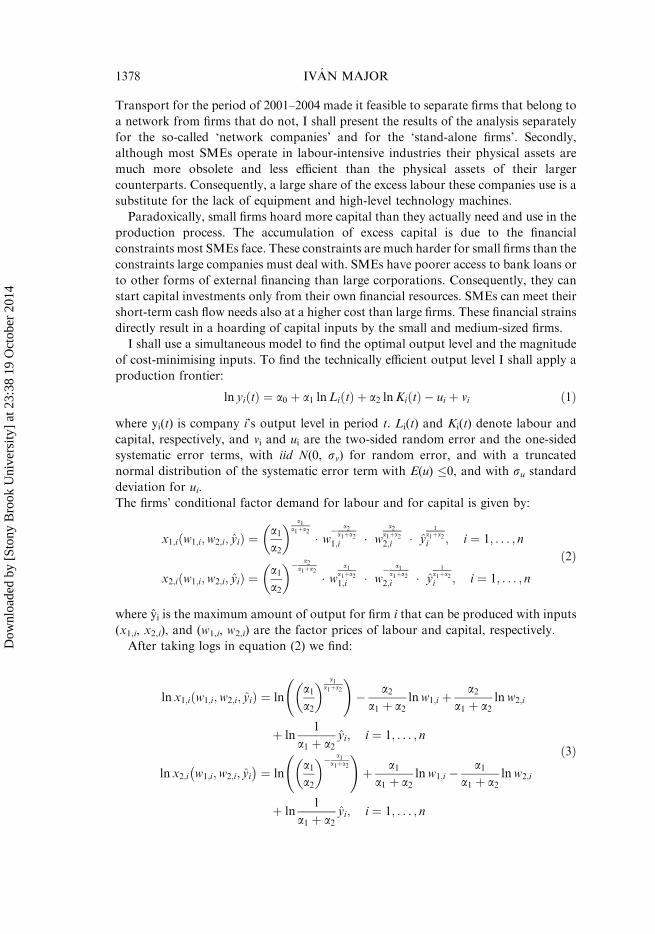
I shall use a simultaneous model to find the optimal output level and the magnitude
of cost-minimising inputs. To find the technically efficient output level I shall apply a
production frontier:
ln yiðtÞ ¼ a0 þ a1 lnLiðtÞ þ a2 lnKiðtÞ � ui þ vi ð1Þ
where yi(t) is company i’s output level in period t. Li(t) and Ki(t) denote labour and
capital, respectively, and vi and ui are the two-sided random error and the one-sided
systematic error terms, with iid N(0, sv) for random error, and with a truncated
normal distribution of the systematic error term with E(u) �0, and with su standarddeviation for ui.
The firms’ conditional factor demand for labour and for capital is given by:
x1;iðw1;i;w2;i; yiÞ ¼a1a2
� � a1a1þa2� w� a2
a1þa21;i � w
a2a1þa22;i � y
1a1þa2i ; i ¼ 1; . . . ; n
x2;iðw1;i;w2;i; yiÞ ¼a1a2
� �� a2a1þa2� w
a1a1þa21;i � w
� a1a1þa2
2;i � y1
a1þa2i ; i ¼ 1; . . . ; n
ð2Þ
where yi is the maximum amount of output for firm i that can be produced with inputs
(x1,i, x2,i), and (w1,i, w2,i) are the factor prices of labour and capital, respectively.
After taking logs in equation (2) we find:
ln x1;iðw1;i;w2;i; yiÞ ¼ lna1a2
� � a1a1þa2
!� a2a1 þ a2
lnw1;i þa2
a1 þ a2lnw2;i
þ ln1
a1 þ a2yi; i ¼ 1; . . . ; n
ln x2;i w1;i;w2;i; yi� �
¼ lna1a2
� �� a1a1þa2
!þ a1a1 þ a2
lnw1;i �a1
a1 þ a2lnw2;i
þ ln1
a1 þ a2yi; i ¼ 1; . . . ; n
ð3Þ
1378 IVAN MAJOR
Dow
nloa
ded
by [
Ston
y B
rook
Uni
vers
ity]
at 2
3:38
19
Oct
ober
201
4
Factor prices would be the same for each firm in a perfectly competitive factor
market. We allow firms to choose different combinations of heterogeneous factor
inputs (labour and capital). Consequently, factor prices become decision variables of
the firms by selecting a specific mix of the heterogeneous input. Then the estimators for
the conditional factor demand functions are given by:
ln x1;i ¼ b0 þ b1 ln w11;i þ b2 ln w
12;i þ b3 ln yi þ x1;i þ e1;i
ln x2;i ¼ g0 þ g1 ln w21;i þ g2 ln w
22;i þ g3 ln yi þ x2;i þ e2;i
ð4Þ
where x1;i ¼ x1;ia1a2
� �� a1a1þa2 , x2;i ¼ x2;i
a1a2
� � a1a1þa2 , w1
1;i ¼�w11;i
�� a1a1þa2 , w1
2;i ¼�w12;i
� a1a1þa2 ,
w21;i ¼
�w21;i
� a2a1þa2 , w2
2;i ¼�w12;i
�� a2a1þa2 , yi is the production frontier of company i, and ei
and xi are the two-sided random error and the one-sided systematic error terms,
respectively, with iid N(0, se) for ei and with a truncated normal distribution for xi.10
Since the ui values measure the companies’ lag behind their production frontier, their
sign will be non-positive, while xi values—that show whether a firm uses too much or
two little of a certain production input—can be either non-negative or non-positive.
The model estimation proceeds in two steps: the production frontier is found first,
then the cost minimising input levels of the production frontier are estimated in the
second phase. The likelihood functions to estimate the systematic error terms were as
follows:
lnLy xij; s2y; l� �
¼ n
2ln
2
p� n ln sy �
Pni¼1
e2i
2s2yþXmi¼1
ln 1� F � eilsy
� �� �� ð5Þ
and
lnLxjj yi; s2xj ; mj� �
¼ n
2ln
2
p� n ln sxj �
Pni¼1
eXj
i
� �22s2xj
þXni¼1
ln 1� Fj �eXj
i mjsxj
! !" #ð6Þ
where
l ¼ susv; ei ¼ ui e
Li ; e
Ki
� �þ vi; s2y ¼ s2u þ s2v ð7Þ
and F is the normal distribution function of ei, and
mj ¼sxjseij
; eXj
i ¼ xijðuiÞ þ eij; s2xj ¼ s2xjj þ s2eij ; j ¼ L;K ð8Þ
where Fj is the normal distribution function of eij.Finally, the firm-specific ui and the xij values can be computed from the frontier
function estimations. Then I use a simple formula to calculate the weighted average
10 Kumbhakar and Lovell (2000, pp. 188–90) outline a nested model approach to estimate technical
and allocative inefficiencies. Their focus is on the misallocation between inputs while I deal with the
over-use of inputs in the current article.
EFFICIENCY OF HUNGARIAN SMEs 1379
Dow
nloa
ded
by [
Ston
y B
rook
Uni
vers
ity]
at 2
3:38
19
Oct
ober
201
4
technical efficiency gap and the weighted average allocative efficiency gaps of the
SMEs, respectively. The average technical efficiency gap and the average allocative
efficiency gaps are as follows:
EðuiÞ ¼ 100 1�Xni¼1
yi � euiyi
!; and EðxijÞ ¼ 100
1�Pmi¼1
xij�exijxijPm
i¼1
xij�exijxij
0BB@
1CCA; j ¼ L;K ð9Þ
Halpern and K}orosi (2001) estimated the dynamic production frontier for all
Hungarian firms with double-entry book-keeping for the period of 1990–1997. They
found that the average technical efficiency gap varied between 12% and 17% in the
entire corporate sector. It was somewhat higher in the group of small and medium-
sized companies (between 13.1% and 18.8%) and somewhat lower in the case of large
corporations (between 11.8% and 17.9%). Technical inefficiencies showed a fairly
stable, somewhat declining trend in the 1990s (Halpern & K}orosi 2001, p. 592). I
obtained substantially larger efficiency gaps in the simultaneous model, as will be
shown below.
Data and estimation methods
I used the panel dataset of all Hungarian SMEs for the period of 1992–2000, and a
subset of network and stand-alone firms for the years 2001–2004. (Individual
proprietorships were not included in the dataset.) The panel dataset consisted of the
variables of the SMEs’ balance sheets and the entries of their corporate tax files.11
I applied the simple definition of SMEs of the European Union: corporations with
less than 250 employees were included in the sample.12 Data for 1993 were missing, as
the Hungarian statistical agencies were unable to compile records that are compatible
with the data in other years. The panel data for the years 1992–2000 comprise all SMEs
that actually operated for at least one year during the period of investigation. Thus, I
had 15,383 observations for each year between 1992 and 2004. However, almost 70% of
these observations had been ‘empty’ in 1992, because most companies did not exist yet.
The share of empty observations was close to 50% in 2000. The number of observations
ranges between 7,900 and 8,500 cases in the period of 2001–2004.
I selected only those SMEs whose total sales, total assets and the number of their
employees were larger than zero.13 When estimating the dynamic production frontier I
11The original dataset was provided by the Hungarian Development Institute of SMEs, an
organisation of the Hungarian Ministry of the Economy and Transport. The primary dataset was
compiled by Kalman K}ohegyi, senior fellow at the Hungarian Development Institute of SMEs. His
contribution is gratefully acknowledged.12I did not apply the refinements of the definition that take into account the firms’ total turnover and
total assets, as well.13Neglecting firms with zero employment or zero capital assets comes at a cost: some of these firms
may belong to so-called ‘network companies’ whose owners deliberately keep the firm on the
borderline between existence and non-existence. As I shall discuss later, networks usually consist of a
company that is used solely to pay the employees of the firm, but I was unable to separate these
network firms and companies in a state of ‘hibernation’ because of the lack of sufficient data. Therefore
I decided to omit all companies with unrealistic indicators from the sample.
1380 IVAN MAJOR
Dow
nloa
ded
by [
Ston
y B
rook
Uni
vers
ity]
at 2
3:38
19
Oct
ober
201
4
used the sub-panels of those companies that existed in two consecutive years.
Obviously, the estimation results do not add up to a full time series for the
composition of the sample may have changed period by period.
I estimated the technical efficiency and the allocative efficiency gaps for the entire
group of Hungarian SMEs, and also for three sub-sectors made up as follows:14
agriculture, food- and light industries (AFL), including footwear, clothing, leather ware,
paper and pulp industries, and printing; heavy industry, manufacturing, chemical and
construction industries; and services, including personal services, productive services,
such as telecommunications, transport, energy supply, financial services, and trade.15
The frontier production function I have worked with was as follows:
logValueAddedðtÞ ¼ a0 þ a1 logEmployeesðtÞ þ a2 logTotal assetsðtÞþ a3eLðtÞ þ a4eKðtÞ
ð10Þ
I estimated the following frontier factor demands:
logEmployeesðtÞ
a2ðtÞ
� �¼ b0 þ b1 logValueAddedðtÞ � eðtÞð Þ þ b2 logGrosswageðtÞ
logTotal assetsðtÞ
a3ðtÞ
� �¼ g0 þ g1 logValueAddedðtÞ � eðtÞð Þ þ g2 logDepreciationðtÞ
ð11Þ
As a final step, I used the results from equations (10) and (11) to explain the
profitability gap of the Hungarian SMEs from their maximum attainable profit level. I
defined a separate profit equation for this purpose. We could learn from past experience
and from other studies on Hungarian SMEs (see, for instance, Kallay 2002; K}ohegyi
2001; Laki 1998, 2001; Lengyel 2002; Rona-Tas 1997), that small and medium-sized
businesses are vulnerable to the specific conditions of the financial market, especially to
the availability of bank loans. Therefore, I included the most relevant financial
indicators of the companies’ balance sheets in the profit equation. I also included the
variable of export share (the firm’s annual export relative to its total annual sales), for I
expected that the more an SME is exposed to competition abroad the more efficiently it
will operate. As we shall see in the next section, this has not always been the case. In
addition, I incorporated dummy variables reflecting the ownership structure of
Hungarian SMEs. I included the following ownership dummies in the profit equation:
. OWN1¼ state-owned enterprise;
. OWN2¼domestic private firm;
14The sub-sectors were compiled from the original dataset by using the two-digit industry codes.15The grouping may seem somewhat arbitrary, but my intention was to create groups that are more
or less homogenous as regards their relative labour and capital intensities. An in-depth analysis would
have required separate estimations for each industry but then we would need to work with several
dozen tables that would render the analysis unmanageable. I shall present only the results for the entire
group of SMEs in this article. The main reason why I settled for this solution was that there was not a
tremendous difference among the efficiency gaps of the different groups, and I did not want to
overburden this article with lots of tables.
EFFICIENCY OF HUNGARIAN SMEs 1381
Dow
nloa
ded
by [
Ston
y B
rook
Uni
vers
ity]
at 2
3:38
19
Oct
ober
201
4
. OWN3¼domestic private corporation;
. OWN4¼ foreign-owned firm; and
. OWN5¼municipal company.
The impact of ownership on the firms’ corporate performance needs some
clarification. Several analysts nurtured high expectations about the short run positive
effects of privatisation on corporate performance in CEE. Some of them even argued
that East European privatisations have proven the unquestionable superiority of
private ownership (Pohl et al. 1997). We have overwhelming evidence to suggest that
privatisation reaped results only fairly slowly. In addition, in several cases it was not
private ownership, but foreign ownership that has contributed the most to the
profound changes in corporate performance within the CEE countries.16
The profit equation I used was as follows:
GPROFðtÞ ¼ d0 þ d1euðtÞ þ d2exLðtÞ þ d3exKðtÞ þ d4SHDEBTðtÞ þ d5LDEBTðtÞþ d6MONEYðtÞ þ d7EXPSHðtÞ þ d8OWNðtÞ þ Zt;
ð12Þ
where ‘GPROF’ labels profits before taxes, ‘SHDEBT’ stands for short-term
liabilities, ‘LDEBT’ for long-term liabilities, ‘MONEY’ for the firm’s liquid financial
assets, ‘EXPSH’ for export share, ‘OWN’ for the ownership dummies and Z is the
random error term, all of them in period t. d0– d8 are the estimated parameters of the
OLS model.
Estimation results
The estimation results of the frontier production functions are presented in the
Appendix. As is shown in the tables, I obtained robust results for the simultaneous
model of the production function and the factor demand functions.
The magnitude of the factors of production had a positive impact on the firms’ output
level but the relative importance of labour and capital changed period by period. Labour
had a somewhat larger impact on the output level than capital in the agro–food–light
(AFL) industry sector between 1992 and 1995. The opposite was true for the period
between 1996 and 1998 when a 1% increase in the firms’ capital stock had twice as large
an effect on output than a 1% increase in employment. Strangely enough, the trend was
reversed between 1999 and 2004 again when the contribution of labour to output was
between 10%and 20% larger than the impact of capital. It was more so in the case of so-
called ‘network firms’ and less so with stand-alone companies.
Capital rather than labour was the decisive factor in the industrial sector between
1994 and 1998. This trend was reversed in 1999, and again between 2000 and 2004.
While a 1% capital increase contributed to output growth between two and three
times more than labour in the first period between 1994 and 1998, the difference
16I have shown this in a previous article (see Major 2002). As is well-known, foreign ownership is not
necessarily private ownership for several Western state-owned companies acquired the assets of firms
in CEE (see also, Aghion et al. 1994; Brada et al. 1997; Commander et al. 1999; Estrin & Hare 1992;
Halpern & K}orosi 2001).
1382 IVAN MAJOR
Dow
nloa
ded
by [
Ston
y B
rook
Uni
vers
ity]
at 2
3:38
19
Oct
ober
201
4
between the factors’ impact was reduced to between 2% and 4% between 2001 and
2004. Interestingly enough—but in alignment with the technological progress in
services—capital endowment rather than labour has driven the level of output in the
service sector during the whole period between 1994 and 2004. But the importance of
capital relative to labour declined from the originally very high level—an exponent of
0.067 for capital and 0.004 for labour in 1994, then 0.19 for capital and 0.01 for labour
in 1995—to a small difference of between 3% and 5%. The network firms were the
exceptions from the rule: labour rather than capital had a larger impact on their
output between 2001 and 2004.
The fluctuation in the relative contribution of labour and capital to output seems to
follow the turns in Hungarian economic policy for the years under study. Successive
governments pursued a lax fiscal policy during the initial period of the transition then
between 2000 and 2004 that rendered labour cheap relative to capital. The opposite
was true for the period of fiscal stabilisation between 1995 and 1998 when labour
became relatively more expensive to firms. The results show that SMEs were much
more sensitive to policy changes than large firms and they had a remarkable flexibility
in adjusting to the frequently changing economic and business environment. Johnson
et al. (2000), and Aidis and Mickiewicz (2006) have arrived at a similar conclusion.
Labour has played a more decisive role in shaping the SMEs’ output performance
than historic and international data would suggest. An obvious explanation for this
fact can be that SMEs are usually engaged in production activities that are more
labour intensive and require special human skills. SMEs are frequently organised
around a family tradition in chinaware, personal services or confectionery, that is not
mechanised to the degree that large-scale mass production can be. The higher labour-
intensity of SMEs is also reflected by the fact that the number of SMEs in retail
trading, personal services and handicraft activities has been two or three times higher
than the number of small firms in agriculture, and in the food and light industries, not
to mention the number of small and medium-sized firms in manufacturing, heavy and
chemical industries or in mining. Also, Hungarian SMEs—and SMEs in other CEE
countries—served as buffers for large-scale industries, for a large number of employees
who had lost their jobs in large industries could find work in small businesses.17 A
higher average labour intensity in the SME sector than within the group of large
corporations does not contradict the conclusions of Johnson et al. (2000) and Aidis
and Mickiewicz (2006) that expanding employment may be the most important success
indicator of the small and medium-sized firms.
Higher output always required more employment, and as expected, an increase in
gross wages negatively affected employment with no exception in all three sectors. But
the strength of the effect of gross wage upon output varied by different patterns in the
three sectors. Gross wage had a fairly stable negative coefficient in the agro–food–light
industry (AFL) sector over the whole period of 1992 and 2004. The coefficient grew
substantially—in absolute values—in the industrial sector until 1999, then it slightly
fell back and stabilised at that level. Gross wage has a high and stable impact on
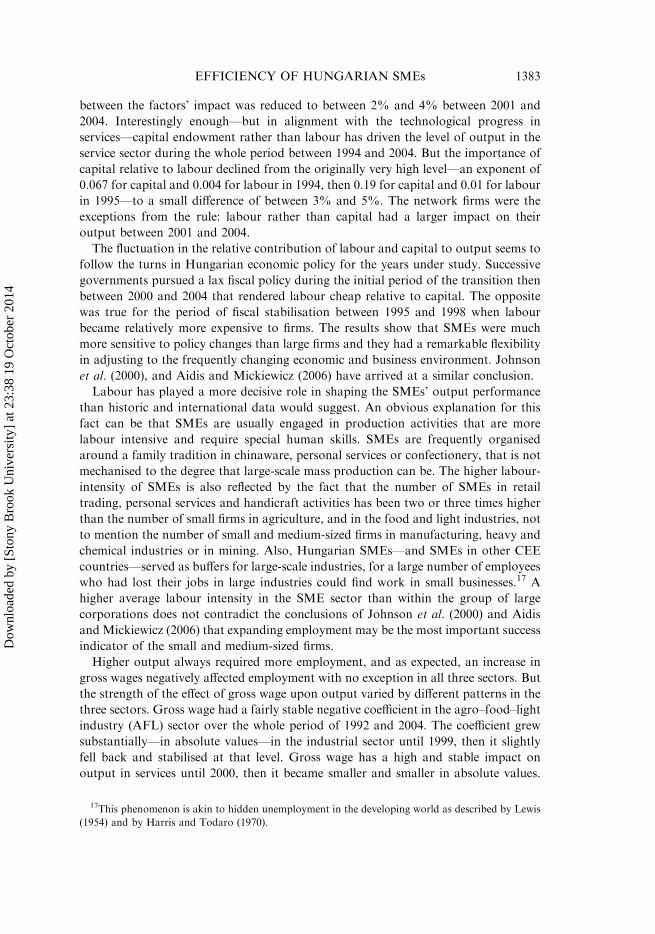
output in services until 2000, then it became smaller and smaller in absolute values.
17This phenomenon is akin to hidden unemployment in the developing world as described by Lewis
(1954) and by Harris and Todaro (1970).
EFFICIENCY OF HUNGARIAN SMEs 1383
Dow
nloa
ded
by [
Ston
y B
rook
Uni
vers
ity]
at 2
3:38
19
Oct
ober
201
4
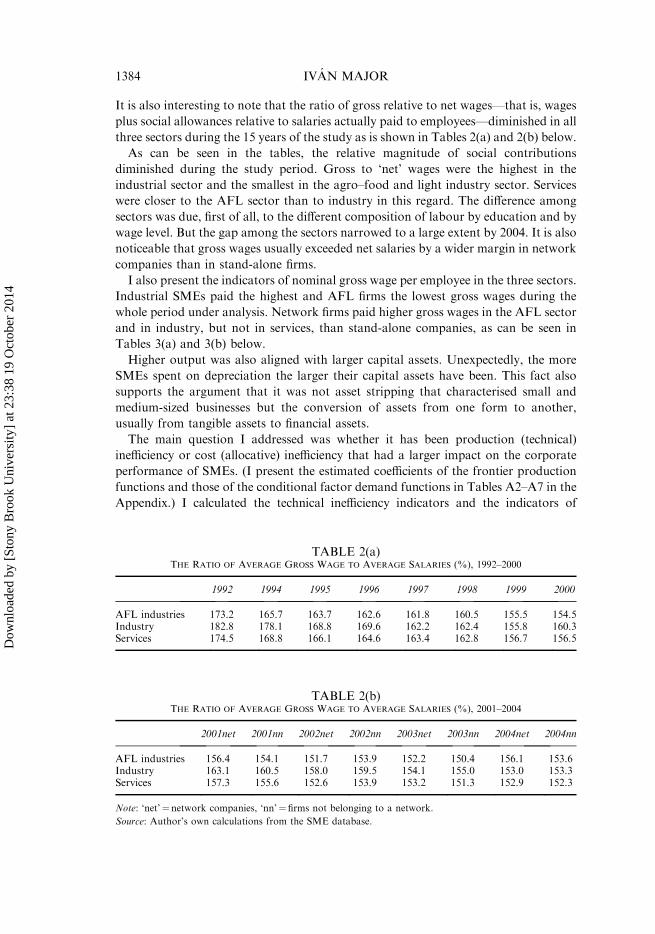
It is also interesting to note that the ratio of gross relative to net wages—that is, wages
plus social allowances relative to salaries actually paid to employees—diminished in all
three sectors during the 15 years of the study as is shown in Tables 2(a) and 2(b) below.
As can be seen in the tables, the relative magnitude of social contributions
diminished during the study period. Gross to ‘net’ wages were the highest in the
industrial sector and the smallest in the agro–food and light industry sector. Services
were closer to the AFL sector than to industry in this regard. The difference among
sectors was due, first of all, to the different composition of labour by education and by
wage level. But the gap among the sectors narrowed to a large extent by 2004. It is also
noticeable that gross wages usually exceeded net salaries by a wider margin in network
companies than in stand-alone firms.
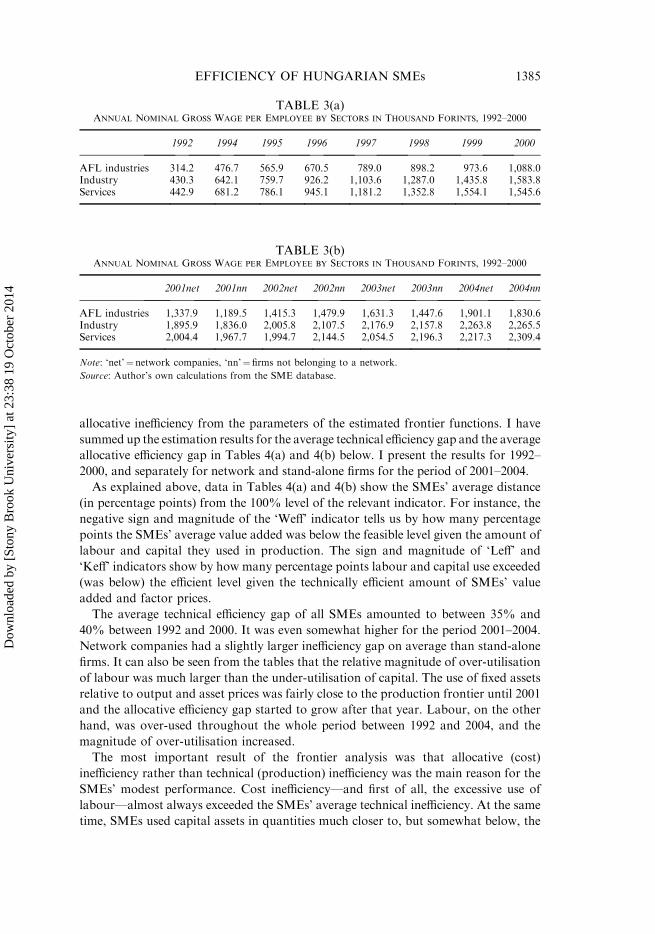
I also present the indicators of nominal gross wage per employee in the three sectors.
Industrial SMEs paid the highest and AFL firms the lowest gross wages during the
whole period under analysis. Network firms paid higher gross wages in the AFL sector
and in industry, but not in services, than stand-alone companies, as can be seen in
Tables 3(a) and 3(b) below.
Higher output was also aligned with larger capital assets. Unexpectedly, the more
SMEs spent on depreciation the larger their capital assets have been. This fact also
supports the argument that it was not asset stripping that characterised small and
medium-sized businesses but the conversion of assets from one form to another,
usually from tangible assets to financial assets.
The main question I addressed was whether it has been production (technical)
inefficiency or cost (allocative) inefficiency that had a larger impact on the corporate
performance of SMEs. (I present the estimated coefficients of the frontier production
functions and those of the conditional factor demand functions in Tables A2–A7 in the
Appendix.) I calculated the technical inefficiency indicators and the indicators of
TABLE 2(a)THE RATIO OF AVERAGE GROSS WAGE TO AVERAGE SALARIES (%), 1992–2000
1992 1994 1995 1996 1997 1998 1999 2000
AFL industries 173.2 165.7 163.7 162.6 161.8 160.5 155.5 154.5Industry 182.8 178.1 168.8 169.6 162.2 162.4 155.8 160.3Services 174.5 168.8 166.1 164.6 163.4 162.8 156.7 156.5
TABLE 2(b)THE RATIO OF AVERAGE GROSS WAGE TO AVERAGE SALARIES (%), 2001–2004
2001net 2001nn 2002net 2002nn 2003net 2003nn 2004net 2004nn
AFL industries 156.4 154.1 151.7 153.9 152.2 150.4 156.1 153.6Industry 163.1 160.5 158.0 159.5 154.1 155.0 153.0 153.3Services 157.3 155.6 152.6 153.9 153.2 151.3 152.9 152.3
Note: ‘net’¼ network companies, ‘nn’¼firms not belonging to a network.
Source: Author’s own calculations from the SME database.
1384 IVAN MAJOR
Dow
nloa
ded
by [
Ston
y B
rook
Uni
vers
ity]
at 2
3:38
19
Oct
ober
201
4
allocative inefficiency from the parameters of the estimated frontier functions. I have
summed up the estimation results for the average technical efficiency gap and the average
allocative efficiency gap in Tables 4(a) and 4(b) below. I present the results for 1992–
2000, and separately for network and stand-alone firms for the period of 2001–2004.
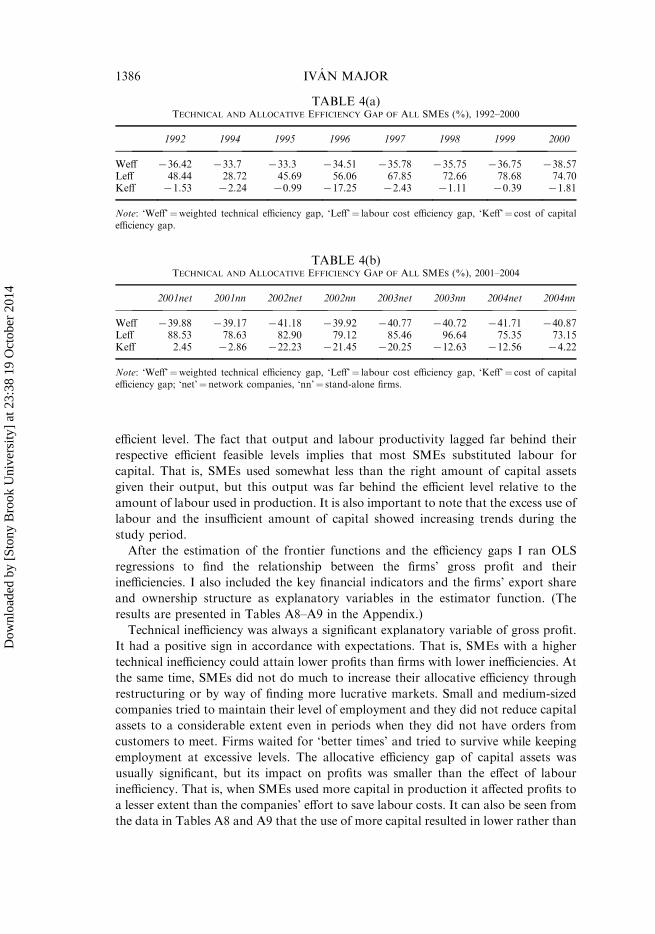
As explained above, data in Tables 4(a) and 4(b) show the SMEs’ average distance
(in percentage points) from the 100% level of the relevant indicator. For instance, the
negative sign and magnitude of the ‘Weff’ indicator tells us by how many percentage
points the SMEs’ average value added was below the feasible level given the amount of
labour and capital they used in production. The sign and magnitude of ‘Leff’ and
‘Keff’ indicators show by how many percentage points labour and capital use exceeded
(was below) the efficient level given the technically efficient amount of SMEs’ value
added and factor prices.
The average technical efficiency gap of all SMEs amounted to between 35% and
40% between 1992 and 2000. It was even somewhat higher for the period 2001–2004.
Network companies had a slightly larger inefficiency gap on average than stand-alone
firms. It can also be seen from the tables that the relative magnitude of over-utilisation
of labour was much larger than the under-utilisation of capital. The use of fixed assets
relative to output and asset prices was fairly close to the production frontier until 2001
and the allocative efficiency gap started to grow after that year. Labour, on the other
hand, was over-used throughout the whole period between 1992 and 2004, and the
magnitude of over-utilisation increased.
The most important result of the frontier analysis was that allocative (cost)
inefficiency rather than technical (production) inefficiency was the main reason for the
SMEs’ modest performance. Cost inefficiency—and first of all, the excessive use of
labour—almost always exceeded the SMEs’ average technical inefficiency. At the same
time, SMEs used capital assets in quantities much closer to, but somewhat below, the
TABLE 3(a)ANNUAL NOMINAL GROSS WAGE PER EMPLOYEE BY SECTORS IN THOUSAND FORINTS, 1992–2000
1992 1994 1995 1996 1997 1998 1999 2000
AFL industries 314.2 476.7 565.9 670.5 789.0 898.2 973.6 1,088.0Industry 430.3 642.1 759.7 926.2 1,103.6 1,287.0 1,435.8 1,583.8Services 442.9 681.2 786.1 945.1 1,181.2 1,352.8 1,554.1 1,545.6
TABLE 3(b)ANNUAL NOMINAL GROSS WAGE PER EMPLOYEE BY SECTORS IN THOUSAND FORINTS, 1992–2000
2001net 2001nn 2002net 2002nn 2003net 2003nn 2004net 2004nn
AFL industries 1,337.9 1,189.5 1,415.3 1,479.9 1,631.3 1,447.6 1,901.1 1,830.6Industry 1,895.9 1,836.0 2,005.8 2,107.5 2,176.9 2,157.8 2,263.8 2,265.5Services 2,004.4 1,967.7 1,994.7 2,144.5 2,054.5 2,196.3 2,217.3 2,309.4
Note: ‘net’¼ network companies, ‘nn’¼firms not belonging to a network.
Source: Author’s own calculations from the SME database.
EFFICIENCY OF HUNGARIAN SMEs 1385
Dow
nloa
ded
by [
Ston
y B
rook
Uni
vers
ity]
at 2
3:38
19
Oct
ober
201
4
efficient level. The fact that output and labour productivity lagged far behind their
respective efficient feasible levels implies that most SMEs substituted labour for
capital. That is, SMEs used somewhat less than the right amount of capital assets
given their output, but this output was far behind the efficient level relative to the
amount of labour used in production. It is also important to note that the excess use of
labour and the insufficient amount of capital showed increasing trends during the
study period.
After the estimation of the frontier functions and the efficiency gaps I ran OLS
regressions to find the relationship between the firms’ gross profit and their
inefficiencies. I also included the key financial indicators and the firms’ export share
and ownership structure as explanatory variables in the estimator function. (The
results are presented in Tables A8–A9 in the Appendix.)
Technical inefficiency was always a significant explanatory variable of gross profit.
It had a positive sign in accordance with expectations. That is, SMEs with a higher
technical inefficiency could attain lower profits than firms with lower inefficiencies. At
the same time, SMEs did not do much to increase their allocative efficiency through
restructuring or by way of finding more lucrative markets. Small and medium-sized
companies tried to maintain their level of employment and they did not reduce capital
assets to a considerable extent even in periods when they did not have orders from
customers to meet. Firms waited for ‘better times’ and tried to survive while keeping
employment at excessive levels. The allocative efficiency gap of capital assets was
usually significant, but its impact on profits was smaller than the effect of labour
inefficiency. That is, when SMEs used more capital in production it affected profits to
a lesser extent than the companies’ effort to save labour costs. It can also be seen from
the data in Tables A8 and A9 that the use of more capital resulted in lower rather than
TABLE 4(a)TECHNICAL AND ALLOCATIVE EFFICIENCY GAP OF ALL SMES (%), 1992–2000
1992 1994 1995 1996 1997 1998 1999 2000
Weff 736.42 733.7 733.3 734.51 735.78 735.75 736.75 738.57Leff 48.44 28.72 45.69 56.06 67.85 72.66 78.68 74.70Keff 71.53 72.24 70.99 717.25 72.43 71.11 70.39 71.81
Note: ‘Weff’¼weighted technical efficiency gap, ‘Leff’¼ labour cost efficiency gap, ‘Keff’¼ cost of capitalefficiency gap.
TABLE 4(b)TECHNICAL AND ALLOCATIVE EFFICIENCY GAP OF ALL SMES (%), 2001–2004
2001net 2001nn 2002net 2002nn 2003net 2003nn 2004net 2004nn
Weff 739.88 739.17 741.18 739.92 740.77 740.72 741.71 740.87Leff 88.53 78.63 82.90 79.12 85.46 96.64 75.35 73.15Keff 2.45 72.86 722.23 721.45 720.25 712.63 712.56 74.22
Note: ‘Weff’¼weighted technical efficiency gap, ‘Leff’¼ labour cost efficiency gap, ‘Keff’¼ cost of capitalefficiency gap; ‘net’¼network companies, ‘nn’¼ stand-alone firms.
1386 IVAN MAJOR
Dow
nloa
ded
by [
Ston
y B
rook
Uni
vers
ity]
at 2
3:38
19
Oct
ober
201
4
larger profits in some years. There may be several reasons behind this result. If start-up
companies or firms that decided to extensively expand production invested heavily,
lower profits would have been an obvious consequence of the large initial efforts by the
firms and the strategy may have been admissible. If, on the other hand, well-
established companies attained lower profits by expanding their capital base this may
have indicated a deteriorating allocative efficiency at the firms.
The excessive use of labour had a significant and negative impact on profits in most
years. The only exceptions were the years of 2003 and 2004 when drastic changes in the
government’s wage and taxation policies rather than the SMEs’ efforts to increase cost
efficiency led to higher profits in the Hungarian corporate sector. The effect of too
much labour was much stronger on profits than the impact of capital shortages in
most years, as can be seen in Tables A7 and A8 in the Appendix.
Had the problem only been one of technical (production) inefficiency, SMEs could
have improved on their profitability by expanding production. But the excess use of
labour and the insufficient amount of capital rendered efficient expansion unfeasible
for Hungarian SMEs (and for SMEs in the CEE region in general). Since average
allocative inefficiency of the SMEs was larger than technical inefficiency in relative
terms, firms could improve profitability by producing less than feasible, for this
‘rolling back policy’ lowered the magnitude of their losses. The lower than technically
feasible—or optimal—output level served the purpose of keeping the firms afloat by
way of reducing some of the production costs.18
It is worth noting that so-called ‘network firms’ usually had larger coefficients of
technical inefficiency than the stand-alone companies. That is, the same level of
technical inefficiency resulted in lower gross profits in network firms than in stand-
alone companies. But network SMEs have usually been less inefficient than single
firms as we saw before. The allocative inefficiency of capital use affected gross profit
more severely in network companies than in single firms in the AFL sector but the
opposite was true for the industrial sector and for services in the 2000s. That is,
network companies could reduce the adverse effects of capital inefficiencies to a larger
extent than stand-alone firms in the industrial sector and in services. We may conclude
from these results that being a member company of a network has not always been a
blessing, especially in the agricultural and food sector, but it helped firms in the
industrial and service sectors.
The profit of Hungarian SMEs has been very sensitive to short-term and to long-
term financial liabilities. Profits declined when the level of their short-term
indebtedness increased. This was a permanent phenomenon during the 15 years
analysed here, showing that Hungarian SMEs were not treated favourably by the
financial markets. Roman (1991), EBRD (2002) and Pissarides et al. (2003) have also
found that ‘thin’ financial markets and especially the lack of financing for domestic
SMEs were serious barriers to the development of this sector in several CEE countries.
One might argue that short and long-term indebtedness have been endogenous to
profitability, but this has not been the case. A large number of SMEs became indebted
not because they were unable to generate normal profits for their industry, but they
18Koll}o (2001) obtained similar results based on his case study analysis of Hungarian small and
medium-sized companies in the textile industry.
EFFICIENCY OF HUNGARIAN SMEs 1387
Dow
nloa
ded
by [
Ston
y B
rook
Uni
vers
ity]
at 2
3:38
19
Oct
ober
201
4
turned out to be loss-makers because the cost of the loan was exorbitant. Bank loans
have been extremely expensive to SMEs not because these investments turned out to
be more risky to banks, but because banks could comfortably earn much larger
margins on the small number of huge loans that they extended to large corporations.
Banks were also reluctant to offer long-term loans to SMEs. The lack of long-term
investment loans with reasonable conditions pushed these companies into the vicious
circle of short-term liquidity problems. Those SMEs that relied on external financing
could not produce enough net income to repay their dues in most of the cases. But the
effect of short-term and long-term liabilities was not equally strong across sectors and
between periods. Short-term debt had a more significant impact before than after the
year 2000, especially in the initial years of the 1990s. Long-term debt had also been
more significant during the 1990s than in the 2000s, but it was more important in the
second half of the 1990s than in the first years of the decade.
Indebtedness has been significant in most, but not in all, periods after the year 2000.
The main reason for this change was that the loans market had become very
competitive in the late 1990s and banks turned toward small and medium-sized
businesses after the turn of the century. Gross profit of AFL firms and service
companies was more sensitive to indebtedness than the profit of industrial firms. The
difference among sectors is related to the different average size of companies in the
three groups. Industrial SMEs belonged more to the group of medium-sized rather
than to the group of small companies, while SMEs in the AFL industries and in
services were usually small rather than medium-size.
While indebtedness negatively affected profitability, financial assets have always had
a significant and positive impact on the firms’ gross profits. This relationship indicated
that SMEs frequently operated as ‘teller machines’ rather than production units.
Groups of SMEs with the same owners frequently operated as a complex network of
moving money from one company to another.19 Consequently, it is hard to tell
whether an SME went bankrupt because of its poor performance, or because its assets
had been converted into financial assets which were then reallocated to another firm
that belonged to the same group of owners. Policy makers have often accused
Hungarian companies of asset stripping but my results are inconsistent with these
claims. Hungarian SMEs may have converted tangible assets into financial assets
because of poor investment prospects and unstable market expectations (K}ohegyi
2001; Kallay 2002). Nevertheless these companies reinvested their revenues from sales
into financial assets rather than using those assets for personal consumption.
The SMEs’ export share has been a significant explanatory variable of profitability
more often after than before 2000. This was equally true for network and for stand-
alone firms between 2001 and 2004. Obviously, export shares have not played a
significant role in most retail services while the export share of industrial firms and
AFL companies was significant in several years. But it was completely unexpected that
the export share of SMEs usually had a negative rather than a positive sign when it
19I have found evidence of the existence of such ‘money networks’ from interviews with Hungarian
company managers. The estimation results for 2001–2004 also support this assumption, for I have
found a large difference between the production and profitability of so-called ‘network firms’ and
‘stand-alone’ firms, as discussed above.
1388 IVAN MAJOR
Dow
nloa
ded
by [
Ston
y B
rook
Uni
vers
ity]
at 2
3:38
19
Oct
ober
201
4
was a significant variable of the profit equation. That is, small and medium-sized firms
that exported could achieve lower profits than SMEs that produced for the domestic
market. This fact clearly signals the difficulties SMEs face when they try to enter
international competition. These companies usually lack the necessary knowledge of
the markets and they do not possess the trading and transportation networks that are
so vital to success in foreign trade, as eloquently described by Lewis (1954) for
developing countries. However, this finding does not have general validity for all CEE
countries. Aidis and Mickiewicz (2006) have found a positive relationship between
exports and firm growth in Bulgaria and Russia, and Batra et al. (2003) produced
similar results for a larger set of countries.
Another interesting result of the profit estimations was that ownership did not usually
play a significant role in the profitability of Hungarian SMEs. When it did have a
significant impact, it mostly occurred in foreign-owned firms, and only rarely in
domestic companies. I had already found this relationship in an earlier study when I
estimated the technical efficiency gap separately for domestic and for foreign-owned
SMEs: I found substantial differences between the two types of companies. Foreign
firms had smaller average efficiency gaps relative to the best practice foreign companies
than their domestic counterparts between 1992 and 2000 (Major 2002). This result
shows that it was foreign rather than private ownership that improved the companies’
performance. Private ownership could not guarantee success alone. The critical issue
was whether formerly state-owned companies had been acquired by foreign or by
domestic investors. Ownership had a significant impact more frequently at industrial
than at AFL firms or at service companies. When ownership was a significant variable it
usually had a positive rather than a negative effect on the SMEs’ profitability.
Conclusions
Can small and medium-sized companies that are usually owned and managed by
domestic owners, become the engine of economic growth in Hungary or in other
transition economies? I addressed the former question by analysing corporate level
data of Hungarian SMEs during the period of 1992–2004. The answer, in short, is a
sad ‘no, they cannot’. I have shown that most SMEs produce far below the feasible
level of output. This inefficiency is mostly due to the excess use of labour in SMEs,
while their capital endowment is extremely low relative to production levels.
I also had the objective to find a sensible method of measuring the magnitude of
inefficiency in the SME sector. The definition and measurement of corporate success
has been a debated issue in microeconomic analysis. My purpose in this article was to
outline a theory and models that define the relationship among the Hungarian SMEs’
technical efficiency, allocative efficiency and profitability. The model that could be
derived from the theory of ‘profit maximisation via technical inefficiency’ helps us
explain the moderate success of small and medium-sized companies in a transition
economy, such as Hungary.
I used stochastic frontier analysis in the estimation of the firms’ technical and
allocative efficiencies, and I constructed a simultaneous model for the estimation of the
frontier production function and the frontier factor demand functions. The models
yielded robust estimation results. The production of Hungarian SMEs—measured by
EFFICIENCY OF HUNGARIAN SMEs 1389
Dow
nloa
ded
by [
Ston
y B
rook
Uni
vers
ity]
at 2
3:38
19
Oct
ober
201
4
the annual gross value added of the companies—increased along with an expanding
use of labour and capital and with larger export shares. The profits of Hungarian
SMEs were strongly and positively influenced by the amount of financial assets.
Financial liabilities were significant explanatory variables of the profit function, and
profits usually declined when liabilities increased. Consequently, Hungarian SMEs
were very sensitive to external financial conditions, although they tried to avoid
dependence on such financial resources.
The estimation results showed that ownership did not play a significant role in the
companies’ profitability. However, I found—as I had also shown in an earlier study
(Major 2002)—that there has been a considerable difference between domestic and
foreign-owned SMEs in technical efficiency and in profitability, with the foreign firms,
on average, being closer to their frontier than their domestic counterparts. Foreign-
owned companies usually adjusted better to the hectically changing market conditions
than domestic companies.
The most important result of the analysis was that the Hungarian SMEs’ technical
efficiency, allocative efficiency and profitability are intimately interrelated. I showed
that profit maximisation was compatible with a deliberate reduction of the firm’s
technical efficiency. Firms could achieve a higher level of profits by reducing the level
of output, for it dampened the impact of allocative inefficiency on gross profits. Larger
technical inefficiency was usually aligned with lower gross profits at ‘network’ SMEs
than at ‘stand-alone’ companies, indicating that inefficiency hit larger network
companies more than it affected single firms.
I have also shown that SMEs operated with diminishing returns and they have
chosen—or they were forced to choose—a ‘perverse’ way of adjustment to harsh
market conditions in order to remain afloat by curbing production. This defensive
behaviour can be reasonable under unfavourable market prospects or in periods when
firms lose their former markets and search for new market niches. At this stage a large
number, although not all, of Hungarian SMEs were in a delicate position as they lost
markets to large, mostly foreign-owned corporations. Consequently, mere survival
could have already been considered as an economic success, therefore expansion with
growing profits remained only most SMEs’ dream for the distant future.
Institute of Economics, The Hungarian Academy of Sciences, Budapest
References
Aghion, P., Blanchard, O.J. & Carlin, W. (1994) The Economics of Enterprise Restructuring in Centraland Eastern Europe, Discussion Paper No. 1058 (London, CEPR).
Aidis, R. & Mickiewicz, T. (2006) ‘Entrepreneurs, Expectations and Business Expansion: Lessons fromLithuania’, Europe-Asia Studies, 58, 6, September, pp. 855–80.
Aigner, D., Lovell, C.A.K. & Schmidt, P. (1977) ‘Formulation and Estimation of Stochastic FrontierProduction Function Models’, Journal of Econometrics, 6, 1, pp. 21–37.
Amemiya, T. (1973) ‘Regression Analysis When the Dependent Variable is Truncated Normal’,Econometrica, 41, 6, pp. 997–1016.
Basu, S. & Fernald, J.G. (1997) ‘Returns to Scale in US Production: Estimates and Implications’,Journal of Political Economy, 105, 2, pp. 249–83.
Batra, G., Kaufmann, D. & Stone, A. (2003) Investment Climate around the World: Voices of the Firmsfrom the World Business Environment Survey (Washington, DC, The World Bank).
1390 IVAN MAJOR
Dow
nloa
ded
by [
Ston
y B
rook
Uni
vers
ity]
at 2
3:38
19
Oct
ober
201
4
Becchetti, L. & Trovaro, G. (2002) ‘The Determinants of Growth for Small and Medium SizedFirms. The Role and Availability of External Finance’, Small Business Economics, 19, 4, pp. 291–306.
Brada, J., King, A. & Ma, C. (1997) ‘Industrial Economics of the Transition: Determinants ofEnterprise Efficiency in Czechoslovakia and Hungary’, Oxford Economic Papers, 49, 1, pp. 104–27.
Commander, S.J., Dutz, M. & Stern, N. (1999) Restructuring in Transition Economies: Ownership,Competition and Regulation, World Bank ABCDE Conference Paper (Washington, DC, TheWorld Bank).
Earle, J.S., Frydman, R., Rapaczynski, A. & Turkewitz, J. (1994) Small Privatization: TheTransformation of Retail Trade and Consumer Services in the Czech Republic, Hungary andPoland (Budapest, London & New York, Central European University Press).
Estrin, S. & Hare, P. (1992) Firms in Transition: Modelling Enterprise Adjustment, Centre for EconomicPerformance (CEP), LSE Discussion Paper No. 89 (London, CEP).
European Bank for Reconstruction and Development (EBRD) (2002) Transition Report (London,EBRD).
Faggio, G. & Konings, J. (2003) ‘Job Creation, Job Destruction and Employment Growth inTransition Countries in the 90s’, Economic Systems, 27, 2, pp. 129–54.
Fries, S., Lysenko, T. & Polanec, S. (2003) The 2002 Business Environment and Enterprise PerformanceSurvey: Results from a Survey of 6,100 Firms, EBRD Working Paper No. 84 (London, EuropeanBank for Reconstruction and Development).
Gomulka, S. (1994) ‘Obstacles to Recovery in Transition Economies’, in Aghion, P. & Stern, N. (eds)(1994) Obstacles to Enterprise Restructuring in Transition, Working Paper No. 16 (London,European Bank for Reconstruction and Development).
Halpern, L. & K}orosi, G. (2001) ‘Efficiency and Market Share in the Hungarian Corporate Sector’,The Economics of Transition, 9, 2, pp. 559–92.
Harris, J.R. & Todaro, M.P. (1970) ‘Migration, Unemployment and Development: A Two-SectorAnalysis’, The American Economic Review, 60, 1, March, pp. 126–42.
Johnson, S., McMillan, J. & Woodruff, C. (2000) ‘Entrepreneurs and the Ordering of InstitutionalReform: Poland, Slovakia, Romania, Russia and Ukraine Compared’, Economics of Transition, 8,1, pp. 1–36.
Johnson, S., McMillan, J. & Woodruff, C. (2002) ‘Property Rights and Finance’, American EconomicReview, 92, 5, pp. 1335–56.
Kallay, L. (2002) ‘Paradigmavaltas a kisvallalkozas-fejlesztesben’ [‘A New Paradigm of theDevelopment Policy of Hungarian SMEs’], Kozgazdasagi Szemle, XLIX, 7–8, pp. 557–73.
Kallay, L. & K}ohegyi, K. (eds) (2005) A kis-es kozepvallalkozasok helyzete. Eves jelentes, 2003–2004[The State of the Small- and Medium-Sized Enterprises. Annual Report, 2003–2004] (Budapest,Ministry of the Economy and Transport).
Knight, F.H. (1921) Risk, Uncertainty and Profit (Reference is to the 1985 edition, Chicago, Universityof Chicago Press).
K}ohegyi, K. (2001) ‘Novekv}o es zsugorodo vallalkozasok’ [‘Growing and Shrinking Companies inHungary’], Kozgazdasagi Szemle, XLVIII, 4, pp. 320–37.
Koll}o, J. (2001) Meddig tart a rendszervaltas? [How Long Would the Economic Transformation Last?],Budapest Working Papers No. 11 (Budapest, Institute of Economics of the Hungarian Academyof Sciences).
Konings, J. & Repkin, A. (1998) How Efficient Are Firms in Transition Countries? Firm-Level Evidencefrom Bulgaria and Romania, CEPR Discussion Paper No. 1839 (London, CEPR).
Kornai, J. (1993) ‘Transzformacios visszaeses’ [‘Transformation Recession’], Kozgazdasagi Szemle,XL, 7–8, pp. 569–99. [In English: Kornai, J. (1995) ‘Transformational Recession: The Example ofHungary’, in Saunders, C. (ed.) (1995) Eastern Europe in Crisis and the Way Out (Houndmills,Macmillan)].
Kornai, J. (2007) Szocializmus, kapitalizmus, demokracia es rendszervaltas [Socialism, Capitalism,Democracy and System Change] (Budapest, Akademiai Kiado).
Kumbhakar, S. & Lovell, K. (2000) Stochastic Frontier Analysis (Cambridge, Cambridge UniversityPress).
Laki, M. (1998) Kisvallalkozas a szocializmus utan [Small Ventures After Socialism] (Budapest,Kozgazdasagi Szemle Foundation).
Laki, M. (2001) ‘Az ujonnan alapıtott maganvallalatok teljesıtmenye’ [‘Economic Performance of theNewly-Established Private Firms’], Kozgazdasagi Szemle, XLVIII, 11, pp. 965–79.
Laki, M. & Szalai, J. (2006) ‘The Puzzle of Success: Hungarian Entrepreneurs at the Turn of theMillennium’, Europe-Asia Studies, 58, 3, pp. 317–45.
EFFICIENCY OF HUNGARIAN SMEs 1391
Dow
nloa
ded
by [
Ston
y B
rook
Uni
vers
ity]
at 2
3:38
19
Oct
ober
201
4
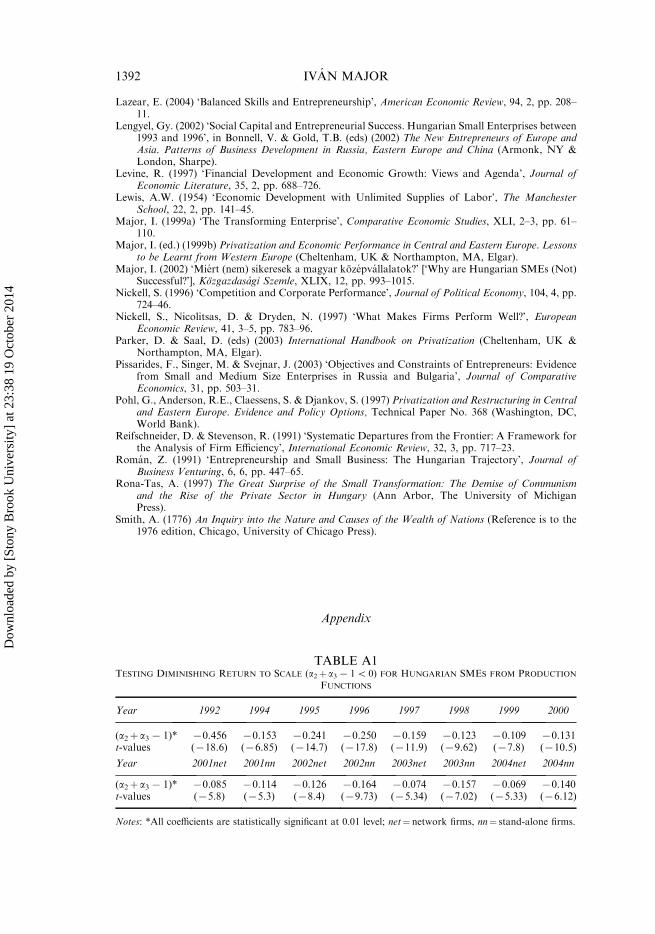
Lazear, E. (2004) ‘Balanced Skills and Entrepreneurship’, American Economic Review, 94, 2, pp. 208–11.
Lengyel, Gy. (2002) ‘Social Capital and Entrepreneurial Success. Hungarian Small Enterprises between1993 and 1996’, in Bonnell, V. & Gold, T.B. (eds) (2002) The New Entrepreneurs of Europe andAsia. Patterns of Business Development in Russia, Eastern Europe and China (Armonk, NY &London, Sharpe).
Levine, R. (1997) ‘Financial Development and Economic Growth: Views and Agenda’, Journal ofEconomic Literature, 35, 2, pp. 688–726.
Lewis, A.W. (1954) ‘Economic Development with Unlimited Supplies of Labor’, The ManchesterSchool, 22, 2, pp. 141–45.
Major, I. (1999a) ‘The Transforming Enterprise’, Comparative Economic Studies, XLI, 2–3, pp. 61–110.
Major, I. (ed.) (1999b) Privatization and Economic Performance in Central and Eastern Europe. Lessonsto be Learnt from Western Europe (Cheltenham, UK & Northampton, MA, Elgar).
Major, I. (2002) ‘Miert (nem) sikeresek a magyar kozepvallalatok?’ [‘Why are Hungarian SMEs (Not)Successful?’], Kozgazdasagi Szemle, XLIX, 12, pp. 993–1015.
Nickell, S. (1996) ‘Competition and Corporate Performance’, Journal of Political Economy, 104, 4, pp.724–46.
Nickell, S., Nicolitsas, D. & Dryden, N. (1997) ‘What Makes Firms Perform Well?’, EuropeanEconomic Review, 41, 3–5, pp. 783–96.
Parker, D. & Saal, D. (eds) (2003) International Handbook on Privatization (Cheltenham, UK &Northampton, MA, Elgar).
Pissarides, F., Singer, M. & Svejnar, J. (2003) ‘Objectives and Constraints of Entrepreneurs: Evidencefrom Small and Medium Size Enterprises in Russia and Bulgaria’, Journal of ComparativeEconomics, 31, pp. 503–31.
Pohl, G., Anderson, R.E., Claessens, S. & Djankov, S. (1997) Privatization and Restructuring in Centraland Eastern Europe. Evidence and Policy Options, Technical Paper No. 368 (Washington, DC,World Bank).
Reifschneider, D. & Stevenson, R. (1991) ‘Systematic Departures from the Frontier: A Framework forthe Analysis of Firm Efficiency’, International Economic Review, 32, 3, pp. 717–23.
Roman, Z. (1991) ‘Entrepreneurship and Small Business: The Hungarian Trajectory’, Journal ofBusiness Venturing, 6, 6, pp. 447–65.
Rona-Tas, A. (1997) The Great Surprise of the Small Transformation: The Demise of Communismand the Rise of the Private Sector in Hungary (Ann Arbor, The University of MichiganPress).
Smith, A. (1776) An Inquiry into the Nature and Causes of the Wealth of Nations (Reference is to the1976 edition, Chicago, University of Chicago Press).
Appendix
TABLE A1TESTING DIMINISHING RETURN TO SCALE (a2þ a37 15 0) FOR HUNGARIAN SMES FROM PRODUCTION
FUNCTIONS
Year 1992 1994 1995 1996 1997 1998 1999 2000
(a2þ a37 1)* 70.456 70.153 70.241 70.250 70.159 70.123 70.109 70.131t-values (718.6) (76.85) (714.7) (717.8) (711.9) (79.62) (77.8) (710.5)
Year 2001net 2001nn 2002net 2002nn 2003net 2003nn 2004net 2004nn
(a2þ a37 1)* 70.085 70.114 70.126 70.164 70.074 70.157 70.069 70.140t-values (75.8) (75.3) (78.4) (79.73) (75.34) (77.02) (75.33) (76.12)
Notes: *All coefficients are statistically significant at 0.01 level; net¼ network firms, nn¼ stand-alone firms.
1392 IVAN MAJOR
Dow
nloa
ded
by [
Ston
y B
rook
Uni
vers
ity]
at 2
3:38
19
Oct
ober
201
4
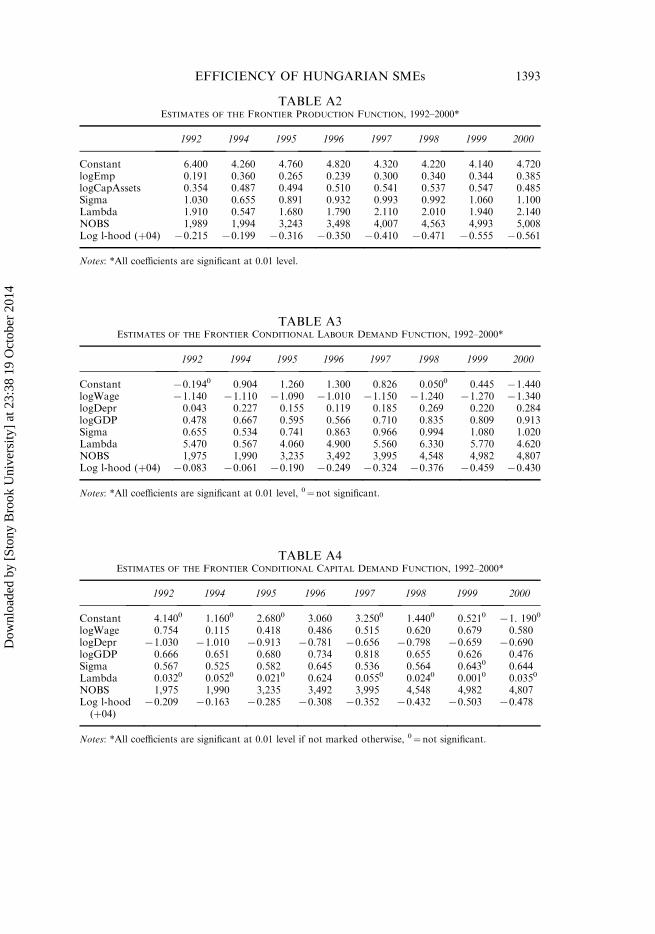
TABLE A2ESTIMATES OF THE FRONTIER PRODUCTION FUNCTION, 1992–2000*
1992 1994 1995 1996 1997 1998 1999 2000
Constant 6.400 4.260 4.760 4.820 4.320 4.220 4.140 4.720logEmp 0.191 0.360 0.265 0.239 0.300 0.340 0.344 0.385logCapAssets 0.354 0.487 0.494 0.510 0.541 0.537 0.547 0.485Sigma 1.030 0.655 0.891 0.932 0.993 0.992 1.060 1.100Lambda 1.910 0.547 1.680 1.790 2.110 2.010 1.940 2.140NOBS 1,989 1,994 3,243 3,498 4,007 4,563 4,993 5,008Log l-hood (þ04) 70.215 70.199 70.316 70.350 70.410 70.471 70.555 70.561
Notes: *All coefficients are significant at 0.01 level.
TABLE A3ESTIMATES OF THE FRONTIER CONDITIONAL LABOUR DEMAND FUNCTION, 1992–2000*
1992 1994 1995 1996 1997 1998 1999 2000
Constant 70.1940 0.904 1.260 1.300 0.826 0.0500 0.445 71.440logWage 71.140 71.110 71.090 71.010 71.150 71.240 71.270 71.340logDepr 0.043 0.227 0.155 0.119 0.185 0.269 0.220 0.284logGDP 0.478 0.667 0.595 0.566 0.710 0.835 0.809 0.913Sigma 0.655 0.534 0.741 0.863 0.966 0.994 1.080 1.020Lambda 5.470 0.567 4.060 4.900 5.560 6.330 5.770 4.620NOBS 1,975 1,990 3,235 3,492 3,995 4,548 4,982 4,807Log l-hood (þ04) 70.083 70.061 70.190 70.249 70.324 70.376 70.459 70.430
Notes: *All coefficients are significant at 0.01 level, 0¼ not significant.
TABLE A4ESTIMATES OF THE FRONTIER CONDITIONAL CAPITAL DEMAND FUNCTION, 1992–2000*
1992 1994 1995 1996 1997 1998 1999 2000
Constant 4.1400 1.1600 2.6800 3.060 3.2500 1.4400 0.5210 71. 1900
logWage 0.754 0.115 0.418 0.486 0.515 0.620 0.679 0.580logDepr 71.030 71.010 70.913 70.781 70.656 70.798 70.659 70.690logGDP 0.666 0.651 0.680 0.734 0.818 0.655 0.626 0.476Sigma 0.567 0.525 0.582 0.645 0.536 0.564 0.6430 0.644Lambda 0.0320 0.0520 0.0210 0.624 0.0550 0.0240 0.0010 0.0350
NOBS 1,975 1,990 3,235 3,492 3,995 4,548 4,982 4,807Log l-hood
(þ04)70.209 70.163 70.285 70.308 70.352 70.432 70.503 70.478
Notes: *All coefficients are significant at 0.01 level if not marked otherwise, 0¼ not significant.
EFFICIENCY OF HUNGARIAN SMEs 1393
Dow
nloa
ded
by [
Ston
y B
rook
Uni
vers
ity]
at 2
3:38
19
Oct
ober
201
4
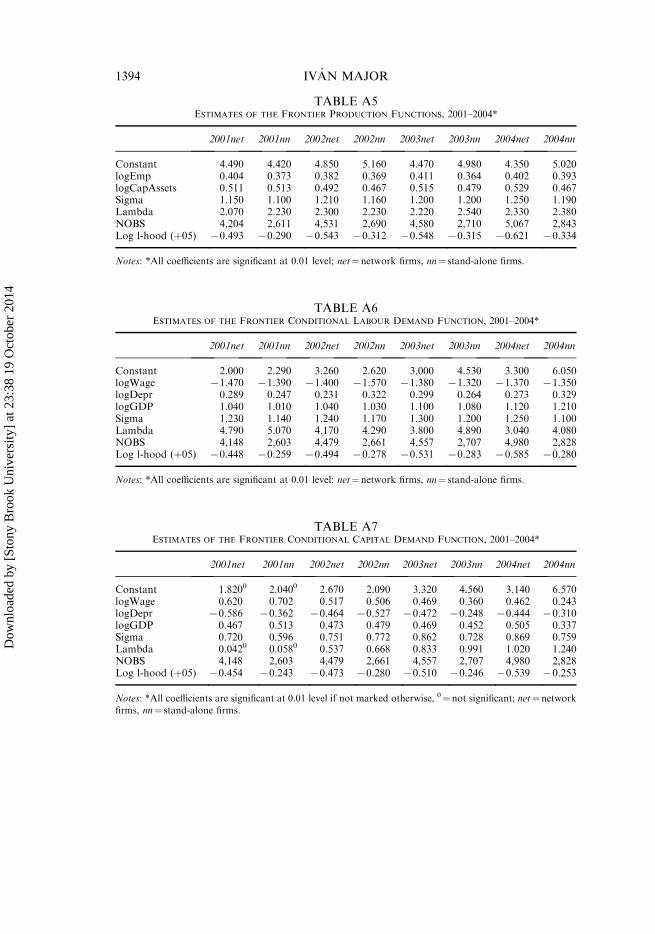
TABLE A5ESTIMATES OF THE FRONTIER PRODUCTION FUNCTIONS, 2001–2004*
2001net 2001nn 2002net 2002nn 2003net 2003nn 2004net 2004nn
Constant 4.490 4.420 4.850 5.160 4.470 4.980 4.350 5.020logEmp 0.404 0.373 0.382 0.369 0.411 0.364 0.402 0.393logCapAssets 0.511 0.513 0.492 0.467 0.515 0.479 0.529 0.467Sigma 1.150 1.100 1.210 1.160 1.200 1.200 1.250 1.190Lambda 2.070 2.230 2.300 2.230 2.220 2.540 2.330 2.380NOBS 4,204 2,611 4,531 2,690 4,580 2,710 5,067 2,843Log l-hood (þ05) 70.493 70.290 70.543 70.312 70.548 70.315 70.621 70.334
Notes: *All coefficients are significant at 0.01 level; net¼ network firms, nn¼ stand-alone firms.
TABLE A6ESTIMATES OF THE FRONTIER CONDITIONAL LABOUR DEMAND FUNCTION, 2001–2004*
2001net 2001nn 2002net 2002nn 2003net 2003nn 2004net 2004nn
Constant 2.000 2.290 3.260 2.620 3.000 4.530 3.300 6.050logWage 71.470 71.390 71.400 71.570 71.380 71.320 71.370 71.350logDepr 0.289 0.247 0.231 0.322 0.299 0.264 0.273 0.329logGDP 1.040 1.010 1.040 1.030 1.100 1.080 1.120 1.210Sigma 1.230 1.140 1.240 1.170 1.300 1.200 1.250 1.100Lambda 4.790 5.070 4.170 4.290 3.800 4.890 3.040 4.080NOBS 4,148 2,603 4,479 2,661 4,557 2,707 4,980 2,828Log l-hood (þ05) 70.448 70.259 70.494 70.278 70.531 70.283 70.585 70.280
Notes: *All coefficients are significant at 0.01 level; net¼ network firms, nn¼ stand-alone firms.
TABLE A7ESTIMATES OF THE FRONTIER CONDITIONAL CAPITAL DEMAND FUNCTION, 2001–2004*
2001net 2001nn 2002net 2002nn 2003net 2003nn 2004net 2004nn
Constant 1.8200 2.0400 2.670 2.090 3.320 4.560 3.140 6.570logWage 0.620 0.702 0.517 0.506 0.469 0.360 0.462 0.243logDepr 70.586 70.362 70.464 70.527 70.472 70.248 70.444 70.310logGDP 0.467 0.513 0.473 0.479 0.469 0.452 0.505 0.337Sigma 0.720 0.596 0.751 0.772 0.862 0.728 0.869 0.759Lambda 0.0420 0.0580 0.537 0.668 0.833 0.991 1.020 1.240NOBS 4,148 2,603 4,479 2,661 4,557 2,707 4,980 2,828Log l-hood (þ05) 70.454 70.243 70.473 70.280 70.510 70.246 70.539 70.253
Notes: *All coefficients are significant at 0.01 level if not marked otherwise, 0¼not significant; net¼ networkfirms, nn¼ stand-alone firms.
1394 IVAN MAJOR
Dow
nloa
ded
by [
Ston
y B
rook
Uni
vers
ity]
at 2
3:38
19
Oct
ober
201
4
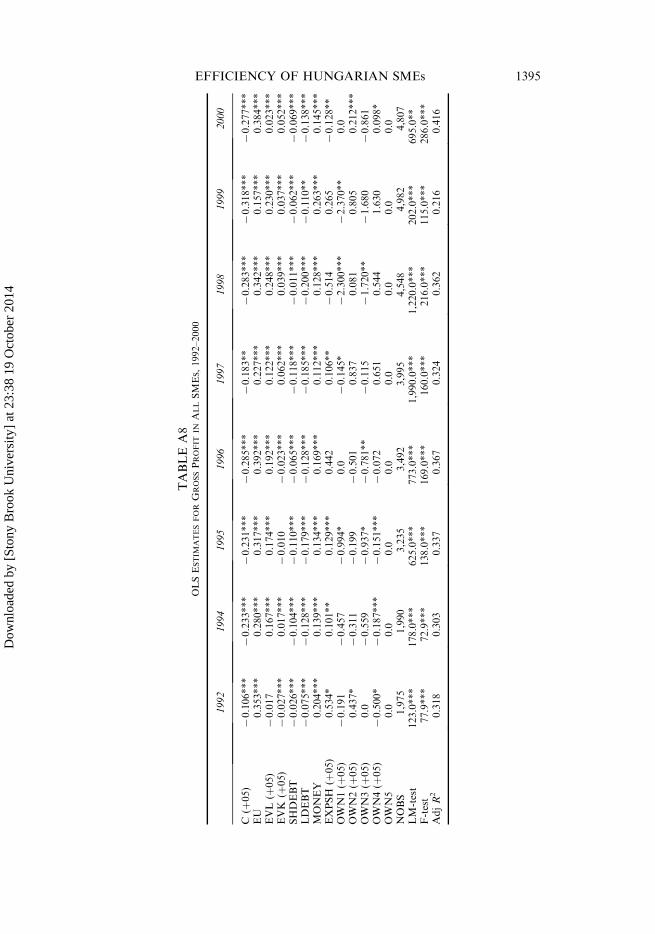
TABLE
A8
OLSESTIM
ATESFORG
ROSSPROFIT
INALLSMES,1992–2000
1992
1994
1995
1996
1997
1998
1999
2000
C(þ
05)
70.106***
70.233***
70.231***
70.285***
70.183**
70.283***
70.318***
70.277***
EU
0.353***
0.280***
0.317***
0.392***
0.227***
0.342***
0.157***
0.384***
EVL(þ
05)
70.017
0.167***
0.174***
0.192***
0.122***
0.248***
0.230***
0.023***
EVK
(þ05)
70.027***
0.017***
70.010
70.023***
0.062***
0.039***
0.037***
0.052***
SHDEBT
70.026***
70.104***
70.110***
70.065***
70.118***
70.011***
70.062***
70.069***
LDEBT
70.075***
70.128***
70.179***
70.128***
70.185***
70.200***
70.110**
70.138***
MONEY
0.204***
0.139***
0.134***
0.169***
0.112***
0.128***
0.263***
0.145***
EXPSH
(þ05)
0.534*
0.101**
0.129***
0.442
0.106**
70.514
0.265
70.128**
OWN1(þ
05)
70.191
70.457
70.994*
0.0
70.145*
72.300***
72.370**
0.0
OWN2(þ
05)
0.437*
70.311
70.199
70.501
0.837
0.081
0.805
0.212***
OWN3(þ
05)
0.0
70.559
70.937*
70.781**
70.115
71.720**
71.680
70.861
OWN4(þ
05)
70.500*
70.187***
70.151***
70.072
0.651
0.544
1.630
0.098*
OWN5
0.0
0.0
0.0
0.0
0.0
0.0
0.0
0.0
NOBS
1,975
1,990
3,235
3,492
3,995
4,548
4,982
4,807
LM-test
123.0***
178.0***
625.0***
773.0***
1,990.0***
1,220.0***
202.0***
695.0**
F-test
77.9***
72.9***
138.0***
169.0***
160.0***
216.0***
115.0***
286.0***
AdjR2
0.318
0.303
0.337
0.367
0.324
0.362
0.216
0.416
EFFICIENCY OF HUNGARIAN SMEs 1395
Dow
nloa
ded
by [
Ston
y B
rook
Uni
vers
ity]
at 2
3:38
19
Oct
ober
201
4
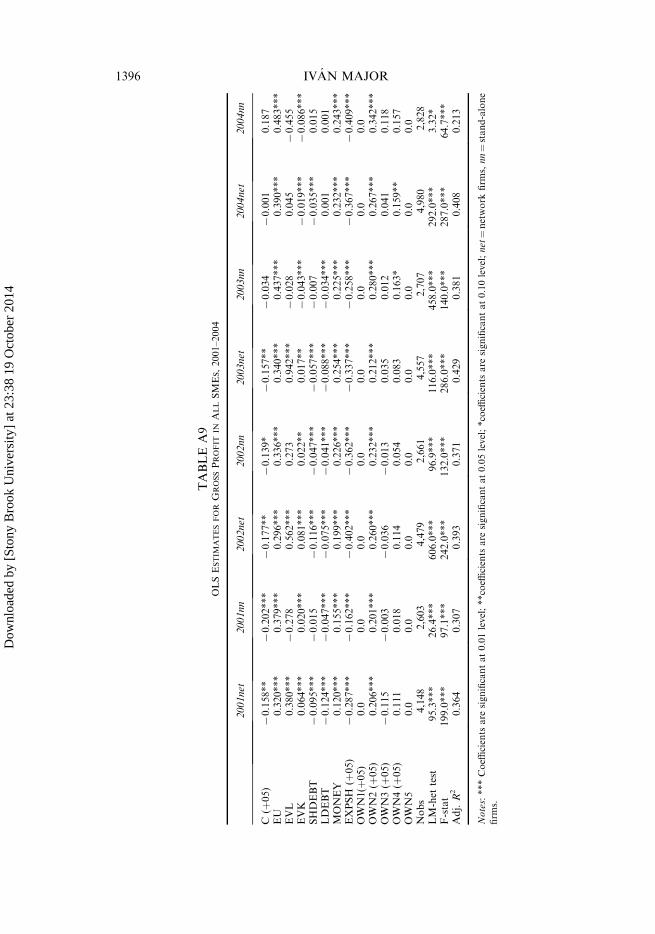
TABLE
A9
OLSESTIM
ATESFORG
ROSSPROFIT
INALLSMES,2001–2004
2001net
2001nn
2002net
2002nn
2003net
2003nn
2004net
2004nn
C(þ
05)
70.158**
70.202***
70.177**
70.139*
70.157**
70.034
70.001
0.187
EU
0.320***
0.379***
0.296***
0.336***
0.340***
0.437***
0.390***
0.483***
EVL
0.380***
70.278
0.562***
0.273
0.942***
70.028
0.045
70.455
EVK
0.064***
0.020***
0.081***
0.022**
0.017**
70.043***
70.019***
70.086***
SHDEBT
70.095***
70.015
70.116***
70.047***
70.057***
70.007
70.035***
0.015
LDEBT
70.124***
70.047***
70.075***
70.041***
70.088***
70.034***
0.001
0.001
MONEY
0.120***
0.155***
0.199***
0.226***
0.254***
0.225***
0.232***
0.243***
EXPSH
(þ05)
70.287***
70.162***
70.402***
70.362***
70.337***
70.258***
70.367***
70.409***
OWN1(þ
05)
0.0
0.0
0.0
0.0
0.0
0.0
0.0
0.0
OWN2(þ
05)
0.206***
0.201***
0.260***
0.232***
0.212***
0.280***
0.267***
0.342***
OWN3(þ
05)
70.115
70.003
70.036
70.013
0.035
0.012
0.041
0.118
OWN4(þ
05)
0.111
0.018
0.114
0.054
0.083
0.163*
0.159**
0.157
OWN5
0.0
0.0
0.0
0.0
0.0
0.0
0.0
0.0
Nobs
4,148
2,603
4,479
2,661
4,557
2,707
4,980
2,828
LM-het
test
95.3***
26.4***
606.0***
96.9***
116.0***
458.0***
292.0***
3.32*
F-stat
199.0***
97.1***
242.0***
132.0***
286.0***
140.0***
287.0***
64.7***
Adj.R2
0.364
0.307
0.393
0.371
0.429
0.381
0.408
0.213
Notes:***Coeffi
cients
are
significantat0.01level;**coeffi
cients
are
significantat0.05level;*coeffi
cients
are
significantat0.10level;net¼network
firm
s,nn¼stand-alone
firm
s.
1396 IVAN MAJOR
Dow
nloa
ded
by [
Ston
y B
rook
Uni
vers
ity]
at 2
3:38
19
Oct
ober
201
4