Embed Size (px)
Citation preview
City of Raleigh Climate/Energy Action Plan
November 2012
Technical Documentation – Volume OneProject Report
I
City of Raleigh’s Climate / Energy Action Plan
Technical Documentation – Volume One: Project Report
Prepared for
City of Raleigh Office of Sustainability
Raleigh, North Carolina
October 2012
Raleigh, NC
I
Contents
Abbreviations and Terms .............................................................................................................ii
SECTION 1: Introduction ............................................................................................................ 1
SECTION 2: Climate/Energy Action Plan Project Process ...................................................... 3 2.1 Project Chartering ............................................................................................................ 3 2.2 Climate/Energy Action Plan Objective .......................................................................... 5 2.3 Interdepartmental Team Framework ............................................................................. 6 2.4 Decision Framework for Strategies Prioritization ......................................................... 8 2.5 Financial Analysis ............................................................................................................ 8 2.6 Mid-Project Update for City Manager ............................................................................ 8
SECTION 3: Existing Programs and Strategies ....................................................................... 11 3.1 Introduction .................................................................................................................... 11 3.2 First Strategy Team Workshops .................................................................................... 11 3.3 Existing Programs and Strategies ................................................................................. 13 3.4 Summary of Existing Strategies .................................................................................... 17 3.5 Carbon Emissions Reductions by City Operations between 2007 and 2010 .............. 17
SECTION 4: Future Strategies, Best Management Practices and Policies ........................... 19 4.1 Second Strategy Team Workshops ............................................................................... 19 4.2 Summary of Future Strategies, Best Management Practices & Policies ..................... 21 4.3 Potential Carbon Emissions Reductions from Implementation of Future Strategies,
Best Management Practices and Policies ...................................................................... 21
SECTION 5: Future Strategies Prioritization ........................................................................... 23 5.1 Strategy Prioritization Approach .................................................................................. 23 5.2 Identification & Weighting of Prioritization Decision Criteria................................... 24 5.3 Strategies Screening ....................................................................................................... 26 5.4 Results of the Strategies Prioritization through the Decision Analysis Framework . 29
SECTION 6 Financial Analysis ................................................................................................. 33 6.1 First Finance Team Workshop ...................................................................................... 34 6.2 Second Finance Team Workshop .................................................................................. 35 6.3 Financial Evaluation Process Revised .......................................................................... 37 6.4 Business Case Evaluations............................................................................................. 37 6.5 Raleigh Public Utilities Department Real Time Energy Management & Operations
Optimization (RTEMOO) Project .................................................................................. 38 6.6 Comprehensive Fleet Transformation Strategy ........................................................... 38
APPENDIX 1: Project Team Members 1
APPENDIX 2: Team Charter & Chartering Workshop Summary 1
APPENDIX 3: Project Process Overview 1
APPENDIX 4: Strategies – Existing, Future, & Best Practices 1
APPENDIX 5: Renewable Energy Project Inventory 1
II
Abbreviations and Terms
ARS Audience Response System
AWWARF American Water Works Association Research Foundation
BCE Business Case Evaluation
CEAP Climate / Energy Action Plan
CIP Capital Improvement Projects
CR Carbon Reduction Strategies
ESCO Energy Services Company
EE Energy Efficient Buildings Strategies
FLT Fleet Strategies
FY Fiscal Year
GPS Global Positioning System
ICLEI International Council for Local Environmental Initiatives
LED Light Emitting Diode
LEED Leadership in Energy and Environmental Design
MCA Multi-Criteria Analysis
O&M Operations and Maintenance
PUD Public Utilities Department
PV Photovoltaic
REC Renewable Energy Certificate
RTEMOO Real Time Energy Management & Operations Optimization
SWS Solid Waste Services
TCR The Climate Registry
US OMB United States Office of Management and Budget
WWTP Wastewater Treatment Plant
W, kW, MW, kWh, MWh Watt, Kilowatt, Megawatt, Kilowatt-hour, Megawatt-hour
CO2 Carbon Dioxide
CH4 Methane
NO2 Nitrous Oxide
1
SECTION 1: Introduction
The following Project Report presents the information and results from the various steps taken in the process of developing the City’s Climate/Energy Action Plan (CEAP) during 2011 and 2012.
The following Sections are included as part of this document:
Section 2 – Climate/Energy Action Plan Project Process describes the project process including chartering the Project Team and the Interdepartmental Teams, developing the project objectives, and defining the project mission statement, critical success factors and expected outcomes.
Section 3 – Existing Programs and Strategies for Operating Efficiency and Carbon Reduction presents information generated by the Interdepartmental Teams about practices implemented since 2007 to increase operating efficiency and reduce carbon emissions as well as the documented carbon emissions reduction between 2007 and 2010.
Section 4 – Future Strategies, Best Management Practices & Policies for Operating Efficiency and Carbon Reduction presents the strategies and practices developed by the Interdepartmental Teams and the consulting team that can be put in place in the future to continue to improve operating efficiency and reduce carbon emissions, as well as the reductions that can be expected from implementing the strategies.
Section 5 – Future Strategies Prioritization describes the decision framework developed and utilized by the Prioritization Team for the review and prioritization of strategies as well as the prioritization process and results.
Section 6 – Financial Analysis presents the development of the financial analysis framework. Specific business case evaluations were conducted for two of the highest scoring strategies. The complete Business Case Evaluations are included in Volume 2 of the CEAP Technical Documentation.
3
SECTION 2:
Climate/Energy Action Plan Project Process
This Section describes the project process utilized to develop the City of Raleigh Operations Climate/Energy Action Plan: A Roadmap to Raleigh’s Energy Future:
Project Chartering Engaging the Interdepartmental Teams Decision framework that was utilized for potential future strategies prioritization
Financial analysis of potential future strategies Obtaining City Manager’s input
2.1 Project Chartering Chartering is a process that is essential for projects with multiple outcomes and multiple stakeholder groups. It is a formal activity that essentially defines the “contract” by which all of the individual members of the project team agree to the specific values, outcomes, timeline, and change management techniques by which the project will be implemented. Goals, processes, measures of success, and personal/team accountabilities are established. Chartering requires each team member to become a fully committed participant by helping define the way the work will be done and by signing-on individually to the desired outcomes of the team.
2.1.1 Chartering Goals
The work of the CEAP Project Team began in a workshop setting on June 29, 2011 with a 4-hour Chartering Meeting of the Project Team Members. Twenty City of Raleigh Project Team Members were present and the meeting was facilitated by the consulting team. The goal of the Chartering Meeting was to:
Build a shared awareness and clear understanding of what the City Team Members would accomplish during the project
Provide the context to begin building an effective team with the City Team Members – some of whom did not know each other – beginning to work together to define their roles, values, and operating guidelines
Define responsibilities and expectations for the active engagement of each Team Member
Provide the context for measuring the success of the project
Have all parties “sign on” to the direction of the project and the processes to be followed
2.1.2 Building the Project Team and Defining Roles and Responsibilities
A team is comprised of a group of individuals who have agreed to work together to achieve a common set of goals, to place the common goals above their functional or individual goals, and to work interdependently to achieve the common goals. To work interdependently, the Project Team Members recognized that they need each other to
CITY OF RALEIGH’S CL IMATE / ENERGY ACTION PLAN
TECHNICAL DOCUMENTATION – VOLUME ONE: PROJECT REPORT
4
perform their own role successfully and that the results of each members’ individual work is needed for the team to achieve its common goals.
One of the most important elements of developing the Plan was bringing together the subject matter experts, or “thought leaders”, within the City staff who would frame, endorse and then implement the Plan. The Project Team Members were identified by the City of Raleigh and represented diverse City staff from the following Offices, Departments and Divisions:
Budget and Management Services
City Attorney’s Office
City Manager’s Office
Division of Facilities and Operations
Finance
Fire
Information Technology
Office of Sustainability
Parks and Recreation
Police
Public Utilities
Public Works – Fleet Management Operations, Transportation Operations, Construction
Raleigh Convention Center
Solid Waste Services
A list of all Project Team Members is included in Appendix 1. The diversity of the Team members ensured that the Plan would be applicable cross-departmentally and that key City enterprise-wide goals were identified and included in the discussions. In addition, each Project Team Member was also part of a smaller Interdepartmental Team as described later in this Section.
The Project Team Members discussed and agreed upon the values that were most important to them in order to work together successfully as a team:
Active participation in the process to develop a Plan “from the bottom up”
Open and honest communication
Showing respect for others
Personal responsibility and accountability with willingness to take the initiative
Being positive, and open to and accepting of new ideas
Listening and being heard
Make efficient use of their time together
Commitment to the team and the project process to “own” the work and to implement the strategies
SECTION 2:
CLIMATE/ENERGY ACTION PLAN PROJECT PROCESS
5
Team roles were defined as follows for each Interdepartmental Team:
Team Leader – serves as Project Manager for the Team; responsible for Team outcomes/deliverables and quality; reports regularly to their Department Directors and solicits input and feedback
Team Facilitator – arranges meetings; assures invitees, facility, equipment and materials are accounted for; distributes meeting agendas and supporting materials
Team Scribe – maintains records of key decisions and recommendations; prepares and distributes accurate meeting minutes in coordination with Team Leader
Team Member - serves as decision-maker and/or decision facilitator; participates actively and attends all meetings; develops or collects required data and documents outside of meetings
In addition, all Project Team Members were to serve as ambassadors to their departments and were responsible for soliciting input and feedback from others in their departments.
The Project Team Members noted that there are different levels of decisions: decisions the team can make; decisions that need only limited involvement of Departments; and those decisions that must be made at the Department level.
2.1.3 Developing the Project Charter
The consulting team led the group through the review of a draft Project Charter with the following components:
Mission of the Interdepartmental Team Executive Sponsors
Project Team Members Deliverables and Schedule Critical Success Factors
Expected Benefits
The draft charter was discussed by the Project Team Members and, with some minor revisions, was approved by all of the Interdepartmental Team Leaders during a meeting on July 6, 2011. By signing the Charter, the Project Team Members indicated that they agreed with the following statement:
“We the following have read, understand, and fully endorse the City of Raleigh Climate/Energy Action Plan Project Team Charter dated July 6, 2011. I know my role and agree to personally contribute and add value to improve the quality of the effort.”
The final Project Charter was signed by each Project Team Member. The final executed Project Charter and the Project Chartering Meeting Summary are included in Appendix 2.
2.2 Climate/Energy Action Plan Objective The Project Charter Mission clearly states the objective of the CEAP:
To serve as an internal guide for the City of Raleigh Operations in the financially responsible, legal and practical implementation of strategies so as to minimize carbon-related emissions, maximize the energy and operational efficiency of existing and new City-owned fleet, facilities and equipment with consideration for life-cycle costs, and provide renewable energy opportunities.
CITY OF RALEIGH’S CL IMATE / ENERGY ACTION PLAN
TECHNICAL DOCUMENTATION – VOLUME ONE: PROJECT REPORT
6
During the Chartering Workshop, the Project Team Members identified the following as key factors that would define the project as a success:
Use of a transparent process that is verifiable, defendable and repeatable to develop, review and prioritize the strategies
Development of realistic and achievable strategies with outcomes that are measurable
Setting realistic timeframes for implementing the strategies and measuring the results
City staff agreement to implement the strategies
Also from the Chartering Workshop discussions, a common objective was evident – that the CEAP process was to be intensely inclusive and the Plan was to be developed, “owned” and endorsed by the Project Team Members. In other words, the Plan was not simply to be developed by the consulting team and/or City management and presented to the Project Team for approval. As part of this discussion, it was recognized and agreed to by the Project Team Members that they were in the best position to provide the Raleigh-specific information that would be needed throughout the CEAP development; information specific to the City was needed to form the basis for the most verifiable, defendable and repeatable analyses as well as the most realistic estimates of costs and impacts to City operations.
In order to meet these objectives and address the critical success factors, the project process utilized by the Project Team Members is shown in Appendix 3.
2.3 Interdepartmental Team Framework The City had previously defined six primary areas of focus for the CEAP. In order to efficiently address the focus areas, a smaller Interdepartmental Team was assigned to each:
Fleet Team Buildings Team Carbon Team
Renewables Team Finance Team Legal Team
Each Interdepartmental Team included members from various City departments to ensure that the diverse interests and concerns of the departments were voiced and recognized throughout the project. In addition, some Project Team Members were members of more than one of the Interdepartmental Teams which reflected and helped capture the interconnectedness of the focus areas.
2.3.1 Interdepartmental Teams Chartering
The Interdepartmental Teams met separately throughout the project to work on their specific focus area. At the first meeting of each Interdepartmental Team, the Team was chartered in a manner similar to the Project Team Chartering. An individual Team Charter was created which utilizes the Project Charter as an umbrella but includes more specific critical success factors related to the specific work of each Interdepartmental Team. The Team Member roles and responsibilities were reviewed and affirmed, and members volunteered for each role in their Team.
SECTION 2:
CLIMATE/ENERGY ACTION PLAN PROJECT PROCESS
7
2.3.2 Strategy Teams
The Interdepartmental Teams assigned to the first four focus areas (Fleet, Buildings, Carbon, and Renewables) are called the Strategy Teams. Their primary goals were to work with the consulting team to:
Define the existing programs and strategies being implemented within the City to achieve operating efficiencies, energy efficiency and carbon emission reductions; this work allowed the consulting team to determine carbon emissions reductions achieved by City Operations between 2007 and 2010
Identify future strategies, best management practices and policies needed to continue to achieve operating efficiencies, energy efficiency and carbon emission reductions
Provide detailed information needed for analysis – the key information needed by the consulting team to preliminarily assess both the existing and future strategies included carbon emissions metrics, costs and operational impacts
Prepare an inventory of the City’s existing renewable energy projects and develop a strategy for reviewing potential new opportunities
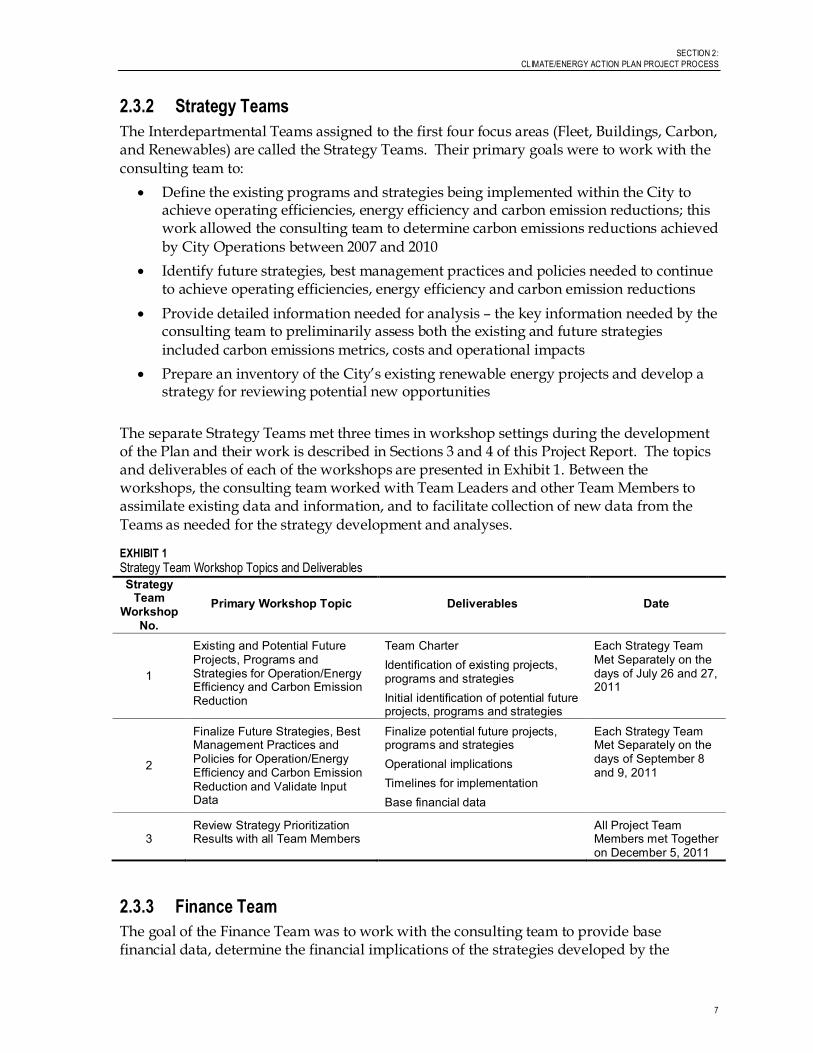
The separate Strategy Teams met three times in workshop settings during the development of the Plan and their work is described in Sections 3 and 4 of this Project Report. The topics and deliverables of each of the workshops are presented in Exhibit 1. Between the workshops, the consulting team worked with Team Leaders and other Team Members to assimilate existing data and information, and to facilitate collection of new data from the Teams as needed for the strategy development and analyses.
EXHIBIT 1
Strategy Team Workshop Topics and Deliverables
Strategy Team
Workshop No.
Primary Workshop Topic Deliverables Date
1
Existing and Potential Future Projects, Programs and Strategies for Operation/Energy Efficiency and Carbon Emission Reduction
Team Charter Identification of existing projects, programs and strategies Initial identification of potential future projects, programs and strategies
Each Strategy Team Met Separately on the days of July 26 and 27, 2011
2
Finalize Future Strategies, Best Management Practices and Policies for Operation/Energy Efficiency and Carbon Emission Reduction and Validate Input Data
Finalize potential future projects, programs and strategies Operational implications Timelines for implementation Base financial data
Each Strategy Team Met Separately on the days of September 8 and 9, 2011
3 Review Strategy Prioritization Results with all Team Members
All Project Team Members met Together on December 5, 2011
2.3.3 Finance Team
The goal of the Finance Team was to work with the consulting team to provide base financial data, determine the financial implications of the strategies developed by the
CITY OF RALEIGH’S CL IMATE / ENERGY ACTION PLAN
TECHNICAL DOCUMENTATION – VOLUME ONE: PROJECT REPORT
8
Strategies Teams at a planning level, and to identify potentially viable financing techniques. The work of the Finance Team is detailed in Section 6 of this Project Report.
2.3.4 Legal Team
The goal of the Legal Team was to identify and evaluate potential legal barriers to the strategies and programs identified by the other Interdepartmental Teams, and to recommend legislative or regulatory actions that could be taken to address the barriers. The potential CEAP strategies and programs that were developed throughout the project process were screened for potential legal and regulatory impacts as part of the strategies prioritization process described in Section 5 of this Project Report. The outcome of the prioritization process revealed that none of the potential strategies or programs would be prohibited by current Federal and/or North Carolina laws and regulations.
2.4 Decision Framework for Strategies Prioritization The Project Team Members had agreed during chartering that the CEAP must be developed using a transparent process that is verifiable, defendable and repeatable, and Members recognized that decisions that involve multiple stakeholders with different interests would be made. The Project Team elected to use a decision analysis approach which is a structured framework in which decision criteria are developed, weighted and then applied to prioritize potential future strategies to meet the City’s stated goals. The decision framework process and the Prioritization Team’s activities are described in Section 5 of this Project Report.
2.5 Financial Analysis The CEAP process included a financial analysis of potential future strategies in order to evaluate the financial implications, at a planning level, of the strategies developed by the Strategies Teams. The financial analysis is described in Section 6 of this Project Report.
2.6 Mid-Project Update for City Manager As the Strategy Teams and the consulting team were refining the potential strategies for further evaluation, it was appropriate to update and obtain input from the City Manager, Assistant City Managers, and other key Directors about the initial findings. The goal of the meeting was to facilitate their understanding of initial findings, gather their input on overall project direction, and discuss issues or concerns. The following City staff participated in the meeting held on September 26, 2011:
Russell Allen, City Manager
Julian Prosser, Assistant City Manager
Dan Howe, Assistant City Manager Perry James, Chief Financial Officer Joyce Munro, Budget and Management Services Director
Gale Roper, Chief Information and Community Relations Officer Paula Thomas, Manager, Office of Sustainability Cindy Homes, CEAP Project Manager, Office of Sustainability
The following information was presented by the consulting team:
SECTION 2:
CLIMATE/ENERGY ACTION PLAN PROJECT PROCESS
9
Carbon reductions achieved between 2007 and 2010 – this represents the significant work done by the City staff to reduce carbon emissions with relatively low capital cost investments; as a result, much of the “low hanging fruit” has been realized
Expected carbon emissions without implementation of additional reduction strategies – with growth at 2.5% per year per the City Planning Department, the gains made will be eroded and will return to 2007 levels and then exceed those levels without additional reductions
Future carbon emissions projections with implementation of additional reduction strategies developed by the Interdepartmental Teams
Potential future strategies based on carbon reduction potential and estimated capital costs to implement
At the conclusion of the meeting, the consensus of the Managers and Directors was that the project direction was appropriate and would result in the CEAP as envisioned by the City.
11
SECTION 3: Existing Programs and Strategies
3.1 Introduction The City of Raleigh has a solid foundation for its sustainability program and has already implemented a number of important projects that have increased operation and energy efficiency, and have reduced carbon emissions. One goal of the CEAP is to capture the projects, activities and strategies that have been put in place since 2007, the date of the baseline inventory. This section describes the work of the four Strategy Teams to identify the existing projects, programs and strategies, defined as those that had been implemented between 2007 and 2010. The Strategy Teams are:
Fleet Team
Buildings Team Carbon Team Renewables Team
The primary vehicle to obtain and consolidate this information was a combination of collaborative workshops and extensive work in between the workshops by both the Interdepartmental Team Members and the consulting team to confirm information and gather new information to fill data gaps. Each Strategy Team met separately in workshop setting two times throughout the course of the project, and once as the full Project Team to review the project results, as shown in Exhibit 1.
3.2 First Strategy Team Workshops 3.2.1 Goals
While conducted separately, the goals of the first workshop held with each Strategy Team were the same:
Chartering and project process:
o Become familiar with one another
o Review the project goals established during the Project Chartering Workshop
o Review the project process
o Review the Project Team Charter
o Validate Team Members, define roles and responsibilities, charter the Team Members, and sign the Team Charter
o Agree on critical success factors
o Agree on expectations of the Team, outcomes and deliverables to be produced
o Agree on project schedule
Document projects, activities and strategies implemented after 2007
CITY OF RALEIGH’S CL IMATE / ENERGY ACTION PLAN
TECHNICAL DOCUMENTATION – VOLUME ONE: PROJECT REPORT
12
Capture Team’s ideas about future projects, activities and strategies that could help further increase operation and energy efficiency, and reduce carbon emissions
Although most of the Strategy Team Members had attended the Chartering Workshop and were familiar with the chartering process and the final Project Team Charter, the chartering process was reviewed to ensure all Team Members understood the significance and were willing to sign the individual Team Charter.
One of key the CEAP objectives was that the Plan was to be developed, “owned” and endorsed by the Team Members, comprised of the City’s subject matter experts. To make certain that this objective was met the Team Workshops were designed to encourage the free-flowing exchange of ideas among the Team Members and to capture all thoughts and ideas without any constraints. Facilitated exercises were used to ensure that these were highly productive discussions and that all voices were heard. Each Team Workshop was facilitated by the consulting team’s local team leader, project manager, and a senior technical expert who provided insight about experiences and best practices associated with other programs.
3.2.2 Facilitated Exercises
Following the Team chartering, the Team Members participated in the following facilitated exercises:
Exercise 1: Document projects, programs and strategies that had been implemented between 2007 and 2010 – during this exercise the consulting team captured information on large easel pads and asked clarifying questions
Exercise 2: Identify projects, programs and strategies that should be considered – during this exercise the consulting team captured information on large easel pads, asked clarifying questions, and provided input on strategies employed by other programs.
3.2.3 Data Needs and Action Items Assigned Data needs were then discussed and action items assigned to the Team, to complete prior to the second Workshop. Detailed information was needed by the consulting team for analysis of both the existing and potential new strategies in order to assess carbon emissions metrics, costs and operational impacts.
As part of the Project Team Chartering process, it was recognized by and agreed to by the Project Team Members were in the best position to provide Raleigh-specific key information listed above. The use of Raleigh-specific information would provide the basis for the most verifiable, defendable and repeatable analysis of strategies as well as the most realistic estimates of costs and impacts to City operations.
As the Team gathered the data needed, the consulting team members were involved with the Team Leads by telephone and email to clarify what was needed and to answer questions.
SECTION 3:
EXISTING PROGRAMS AND STRATEGIES
13
3.3 Existing Programs and Strategies “Existing” projects, programs and strategies were defined as those that had been implemented between 2007 and 2010. The year 2007 was selected in order to capture those activities that were implemented after the 2007 baseline inventory was conducted. The year 2010 was selected because it would represent the most recent full calendar year of available data and would provide several years of operating data for analysis.
3.3.1 Fleet Team
The Fleet Team met on July 26, 2011. The scope of this Team’s work included:
Public Works Department Fleet Management Operations – all vehicles under the management of the Department including a motor pool fleet that is used by various departments
Public Works Department Transportation Operations – comprised of the City’s bus system services
Solid Waste Services Operations – vehicles used for collection of solid waste and recyclable materials
Parks and Recreation Department Operations – maintenance of the outdoor areas of City parks and ballfields including mowing and collection of solid waste
Police Department and Fire Department vehicles
The scope did not include Public Utilities Department (PUD) fleet operations as PUD has a separate service area footprint (the City of Raleigh and the Towns of Garner, Rolesville, Wake Forest, Knightdale, Wendell, and Zebulon) and PUD fleet operations were being assessed under a separate organizational study for PUD.
The Fleet Team identified a total of 55 existing and future strategies as well as future best management practices and policies. The following action items were assigned at the end of the Workshop:
The consulting team prepared a Strategy Matrix capturing the strategies; the matrix was transmitted electronically to the Team Leads
The Team Leads were responsible for populating the blank cells in the matrix with the following information for each strategy, and returning the matrix to the consulting team:
o Emission Metrics such as gallons of each type of fuel utilized by the City related to transportation, and miles traveled
o Operational Impacts including staff behavioral changes that would be necessary and department budget impacts
o Base Financial Information including capital costs, operation and maintenance costs, useful life, and revenue or savings generated
o Timeframe for Implementation
o Interdependencies with Other Projects
o Responsible Department
CITY OF RALEIGH’S CL IMATE / ENERGY ACTION PLAN
TECHNICAL DOCUMENTATION – VOLUME ONE: PROJECT REPORT
14
3.3.2 Buildings Team
The Buildings Team met on July 26, 2011. The scope of this Team’s work included:
Buildings under the management of the Buildings Superintendent
Raleigh Convention Center
Raleigh Memorial Auditorium (Progress Energy Center for the Performing Arts)
Public Utilities Department Operations – PUD operations buildings/facilities in seven communities
Solid Waste Services (SWS) Operations – SWS operations building/facilities
Outdoor City lighting including traffic lights, street lights, parking structure lights, and lights at parks and ballfields
The Buildings Team identified a total of 62 existing and future strategies as well as future best management practices and policies. The following action items were assigned at the end of the Workshop:
The consulting team prepared a Strategy Matrix capturing the strategies, divided into existing and future; the matrix was transmitted electronically to the Team Leads
The Team Leads were responsible for populating the blank cells in the matrix with the following information for each strategy, and returning the matrix to the consulting team:
o Emission Metrics such as kilowatt hours of power consumed, cubic feet of natural gas consumed
o Operational Impacts including staff behavioral changes that would be necessary and department budget impacts
o Base Financial Information including capital costs, operation and maintenance costs, useful life, and revenue or savings generated
o Timeframe for Implementation
o Interdependencies with Other Projects
o Responsible Department
3.3.3 Carbon Team
The Carbon Team met on July 27, 2011. The scope of this Team’s work included:
The Public Utilities Department Operations – water and wastewater treatment plants and pumping systems, reclaimed water system, water efficiency
Solid Waste Services Operations – Wilder’s Grove Landfill, yard waste composting
Parks and Recreation Department Operations – tree planting, ornamental vegetation, and urban forest
SECTION 2
Report Findings
SECTION 3:
EXISTING PROGRAMS AND STRATEGIES
15
The Carbon Team identified a total of 51 existing and future strategies as well as future best management practices and policies. The following action items were assigned at the end of the Workshop:
The consulting team prepared a Strategy Matrix capturing the strategies, divided into existing and future; the matrix was transmitted electronically to the Team Leads
The Team Leads were responsible for populating the blank cells in the matrix with the following information for each strategy, and returning the matrix to the consulting team:
o Emission Metrics such as standard cubic feet of landfill gas recovered, tons of yard waste collected, average nitrogen discharged from the wastewater treatment plant, number of trees planted
o Operational Impacts including staff behavioral changes that would be necessary and department budget impacts
o Base Financial Information including capital costs, operation and maintenance costs, useful life, and revenue or savings generated
o Timeframe for Implementation
o Interdependencies with Other Projects
o Responsible Department
3.3.4 Renewables Team
The Renewables Team met on July 26, 2011, and again on August 17, 2011; two meetings were needed early in the process given the complex nature of the scope of this Team’s work. The scope included:
Prepare inventory of all City renewable energy projects to date
Develop strategy and potential criteria that could be applied by the City when evaluating new renewable projects and opportunities
Evaluate and develop tracking metrics needed
Gain an understanding of the renewable energy market in NC and business models being applied
Discuss Raleigh’s vision for renewable energy
Review potential forms of renewable energy and those most applicable to Raleigh (solar PV, solar thermal, hydro, geothermal, wind, biofuels)
Discuss potential business models for project financing
Review potential strategies
The focus of Workshops 1 and 2 are shown in Exhibit 2.
CITY OF RALEIGH’S CL IMATE / ENERGY ACTION PLAN
TECHNICAL DOCUMENTATION – VOLUME ONE: PROJECT REPORT
16
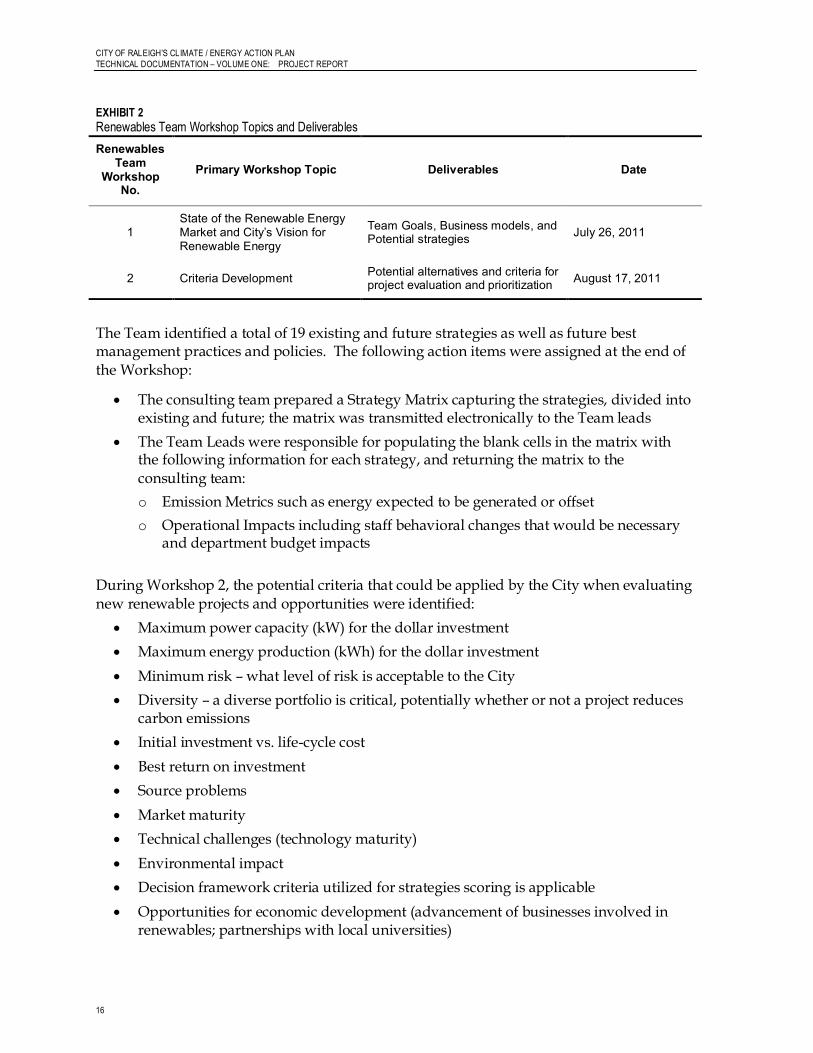
EXHIBIT 2
Renewables Team Workshop Topics and Deliverables
Renewables Team
Workshop No.
Primary Workshop Topic Deliverables Date
1 State of the Renewable Energy Market and City’s Vision for Renewable Energy
Team Goals, Business models, and Potential strategies July 26, 2011
2 Criteria Development Potential alternatives and criteria for project evaluation and prioritization August 17, 2011
The Team identified a total of 19 existing and future strategies as well as future best management practices and policies. The following action items were assigned at the end of the Workshop:
The consulting team prepared a Strategy Matrix capturing the strategies, divided into existing and future; the matrix was transmitted electronically to the Team leads
The Team Leads were responsible for populating the blank cells in the matrix with the following information for each strategy, and returning the matrix to the consulting team:
o Emission Metrics such as energy expected to be generated or offset
o Operational Impacts including staff behavioral changes that would be necessary and department budget impacts
During Workshop 2, the potential criteria that could be applied by the City when evaluating new renewable projects and opportunities were identified:
Maximum power capacity (kW) for the dollar investment
Maximum energy production (kWh) for the dollar investment
Minimum risk – what level of risk is acceptable to the City
Diversity – a diverse portfolio is critical, potentially whether or not a project reduces carbon emissions
Initial investment vs. life-cycle cost
Best return on investment
Source problems
Market maturity
Technical challenges (technology maturity)
Environmental impact
Decision framework criteria utilized for strategies scoring is applicable
Opportunities for economic development (advancement of businesses involved in renewables; partnerships with local universities)
SECTION 3:
EXISTING PROGRAMS AND STRATEGIES
17
3.4 Summary of Existing Strategies The existing strategies, by Team, are presented in Appendix 4.
3.5 Carbon Emissions Reductions by City Operations between 2007 and 2010
The information provided by the Strategy Teams for each of the existing programs and strategies was utilized by the consulting team to provide an estimate of the reduction in carbon emissions that had been achieved by City Operations as a result of implementing the programs and strategies. By comparing the amount of City Operations emissions that occurred in 2007 and in 2010, the City could demonstrate the carbon reductions that had been achieved within a few years. It is important to note that these reductions were all achieved from relatively low capital expenditures and have had few impacts on City or Department operations and budgets.
Per the July 12, 2010 City of Raleigh Greenhouse Gas Inventory: Municipal Operations report, total emissions from City Operations for FY 2007 were estimated to be 151,000 metric tons of CO2 equivalent.
3.5.1 Development of City Operations Emissions for Year 2010
The consulting team utilized the information provided by the Strategy Teams to estimate the amount of carbon emissions from City Operations that had been reduced between the years 2007 and 2010. Calculations were performed according to The Climate Registry (TCR) and the International Council for Local Environmental Initiatives (ICLEI) Local Government Operations Protocol Version 1.1, May 2010. The TCR/ICLEI Local Government Operations Protocol was developed as a collaborative effort between the two organizations to give local governments a comprehensive guidance document for preparing greenhouse gas inventories outside of the traditional manufacturing/ industrial sector. The TCR/ICLEI Local Government Operations Protocol utilizes U.S.-based emission factors.
The 2010 emissions include those from Scope 1 and Scope 2 sources as identified below:
Scope 1 – Direct Emissions
Direct emissions result from sources, processes, or facilities owned and/or controlled by the City. The City Operations include these source categories for direct emissions:
Stationary Combustion Emissions – Emissions that are the result of combusting fossil-based fuels using equipment in a fixed location. Such pieces of equipment include boilers, heaters, and generators.
Mobile Combustion Emissions – Emissions resulting from the combustion of fossil-based fuels in transportation sources both on- and off-road. These sources include the City’s vehicles and heavy equipment.
Process-Related – Process emissions result from physical or chemical processes, other than those resulting from fuel combustion. For the City, this includes emissions from the three wastewater treatment plants (Neuse River, Little Creek and Smith Creek), the Wilder’s Grove Landfill and from yard waste composting
CITY OF RALEIGH’S CL IMATE / ENERGY ACTION PLAN
TECHNICAL DOCUMENTATION – VOLUME ONE: PROJECT REPORT
18
Fugitive – Fugitives emissions result from unintentional leaks or releases of refrigerants from processes, storage devices, and/or cooling systems.
Scope 2 – Indirect Emissions
Indirect emissions result from activities owned and/or controlled by another entity, but are being completed on the City’s behalf. For this category only emissions resulting from the use of purchased electricity, natural gas, steam, and/or hot/chilled water are included.
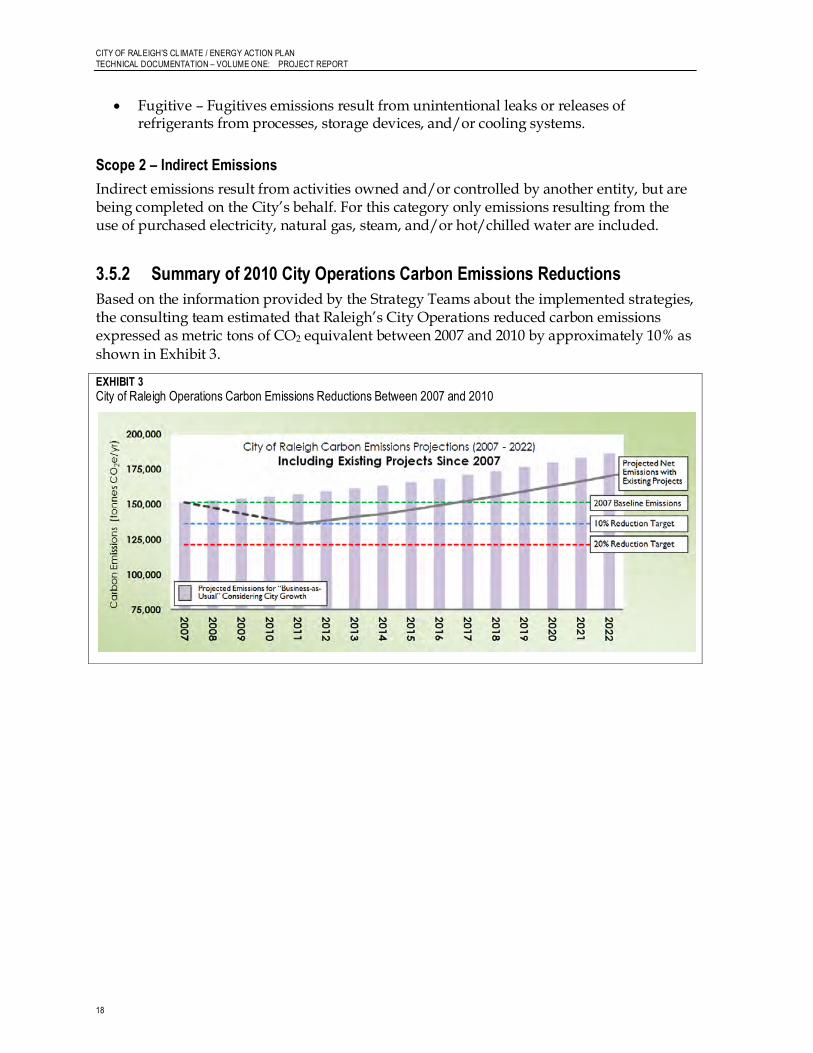
3.5.2 Summary of 2010 City Operations Carbon Emissions Reductions
Based on the information provided by the Strategy Teams about the implemented strategies, the consulting team estimated that Raleigh’s City Operations reduced carbon emissions expressed as metric tons of CO2 equivalent between 2007 and 2010 by approximately 10% as shown in Exhibit 3.
EXHIBIT 3
City of Raleigh Operations Carbon Emissions Reductions Between 2007 and 2010
19
SECTION 4:
Future Strategies, Best Management Practices and Policies
Section 4 describes the work of the Strategy Teams to identify the future strategies, best management practices and policies that could be implemented to achieve additional operation and energy efficiencies and further reduce carbon emissions from City Operations.
The process followed was similar to that described in Section 3 of this Report, using the combination of collaborative workshops and extensive work in between the workshops by both the Interdepartmental Team Members and the consulting team to confirm information and gather new information to fill data gaps.
4.1 Second Strategy Team Workshops 4.1.1 Process and Goals
Between Workshops 1 and 2, the Strategy Team Leads and the consulting team worked to add information to the strategy spreadsheets; each modified version, whether by the City or the consulting team, was carefully managed to ensure no loss or duplication of information. Prior to the second workshop, each Strategy Team was provided with a near-final spreadsheet summarizing all of the information that had been provided by the Team Members and generated by the consulting team.
While conducted separately, the goals of the second workshop held with each Strategy Team were the same:
Verify information that had been provided by the Team regarding the existing projects, activities and strategies to be included in the Plan
Finalize identification of future strategies, best management practices and policies to be included in the Plan
Complete the provision of key information about the future strategies needed to evaluate the strategies, including costs
Identify key remaining data gaps and how the gaps will be filled
Agree on assumptions to apply in the absence of data
Agree on the future strategies that appear to have the highest carbon reduction potential and path forward to collect critical financial data for these particular strategies
Review how outcomes would be used for strategies prioritization and inclusion in the Plan
4.1.2 Information Review
The near-final spreadsheet provided by the consulting team prior to the workshop summarized all of the information that had been provided by the Team and generated by
CITY OF RALEIGH’S CL IMATE / ENERGY ACTION PLAN
TECHNICAL DOCUMENTATION – VOLUME ONE: PROJECT REPORT
20
the consulting team for both the existing strategies and the potential future strategies, best management practices and policies. The spreadsheet included columns for:
Emissions metrics
Implementation Year
Operational Impacts
Responsible Department
Interdependencies
Cost including capital, O&M and any other cost information that could be provided such as potential revenue or savings
Useful Life
Prior to the workshop, the consulting team requested that the Strategy Teams endeavor to provide all information that was still missing from the spreadsheets. The spreadsheets were then updated by the consulting team to incorporate any additional information. At the same time, in order to develop as complete information as possible, the consulting team provided industry standard values where they were applicable along with the assumptions that had been made in utilizing such standard values.
The key vehicle for verifying and finalizing the information was a line-by-line review of the spreadsheets to determine whether the assumptions made by the consulting team were valid and whether the information that was needed from the Teams could be provided within about two weeks. Information was needed by the consulting team well in advance of the Prioritization Team Workshop that was held on October 7, 2011 in order to provide the most information available to the Team that prioritized the potential future strategies.
4.1.3 Data Gathering Process
During and following Workshop 2, the Project Team and the consulting team realized that the information needed to evaluate all of the strategies was not available or could not be generated by the Teams within the timeframe needed to complete the project. The number and variety of information needed was considerable even with the addition of industry standard information provided by the consulting team.
At this point in the project, the Project Team and the consulting team agreed that the analyses would move forward with the focus shifting to completing the most critical data needed for the evaluation of those strategies that would likely demonstrate the highest carbon emission reductions.
The data gaps were fully recognized and there was considerable discussion regarding the need for the City to develop and implement a standardized way to gather the types of information needed for future analyses. This is addressed in Volume 4 of the CEAP Technical Documentation – “Data Collection Framework for City of Raleigh Operations”.
The Strategy Teams provided last inputs to the consulting team at the end of September 2011.
SECTION 4:
FUTURE STRATEGIES, BEST MANAGEMENT PRACTICES AND POLICIES
21
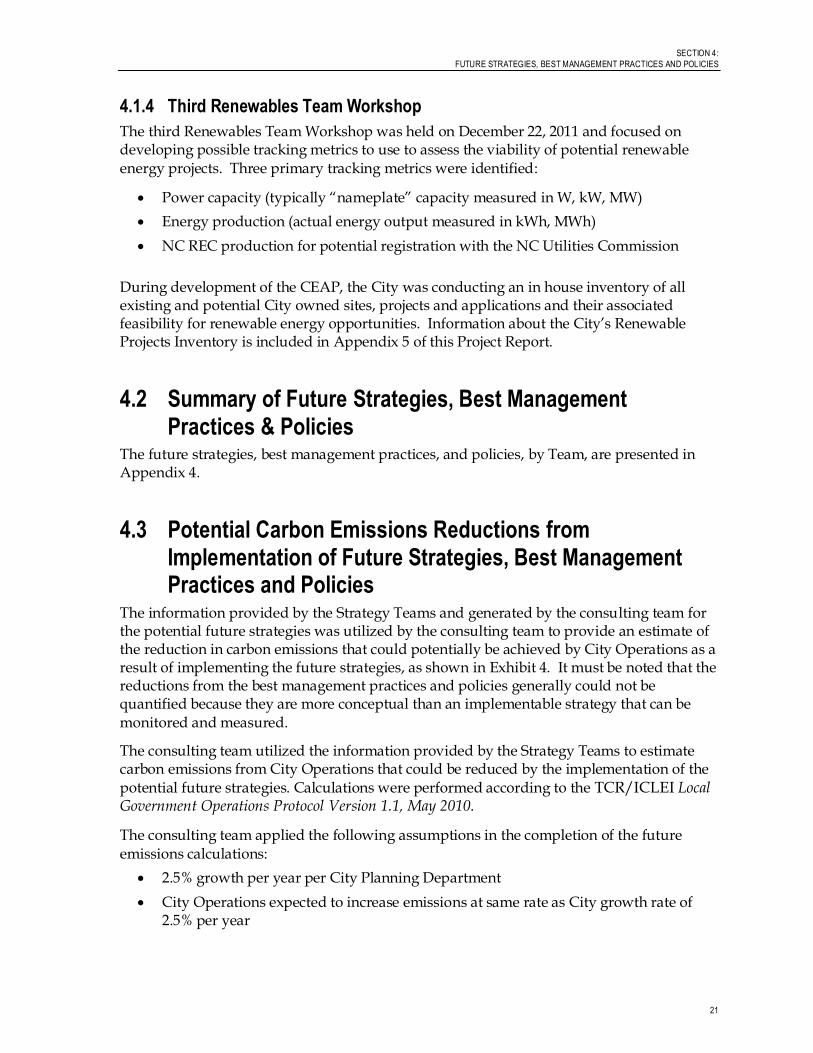
4.1.4 Third Renewables Team Workshop
The third Renewables Team Workshop was held on December 22, 2011 and focused on developing possible tracking metrics to use to assess the viability of potential renewable energy projects. Three primary tracking metrics were identified:
Power capacity (typically “nameplate” capacity measured in W, kW, MW)
Energy production (actual energy output measured in kWh, MWh)
NC REC production for potential registration with the NC Utilities Commission
During development of the CEAP, the City was conducting an in house inventory of all existing and potential City owned sites, projects and applications and their associated feasibility for renewable energy opportunities. Information about the City’s Renewable Projects Inventory is included in Appendix 5 of this Project Report.
4.2 Summary of Future Strategies, Best Management Practices & Policies
The future strategies, best management practices, and policies, by Team, are presented in Appendix 4.
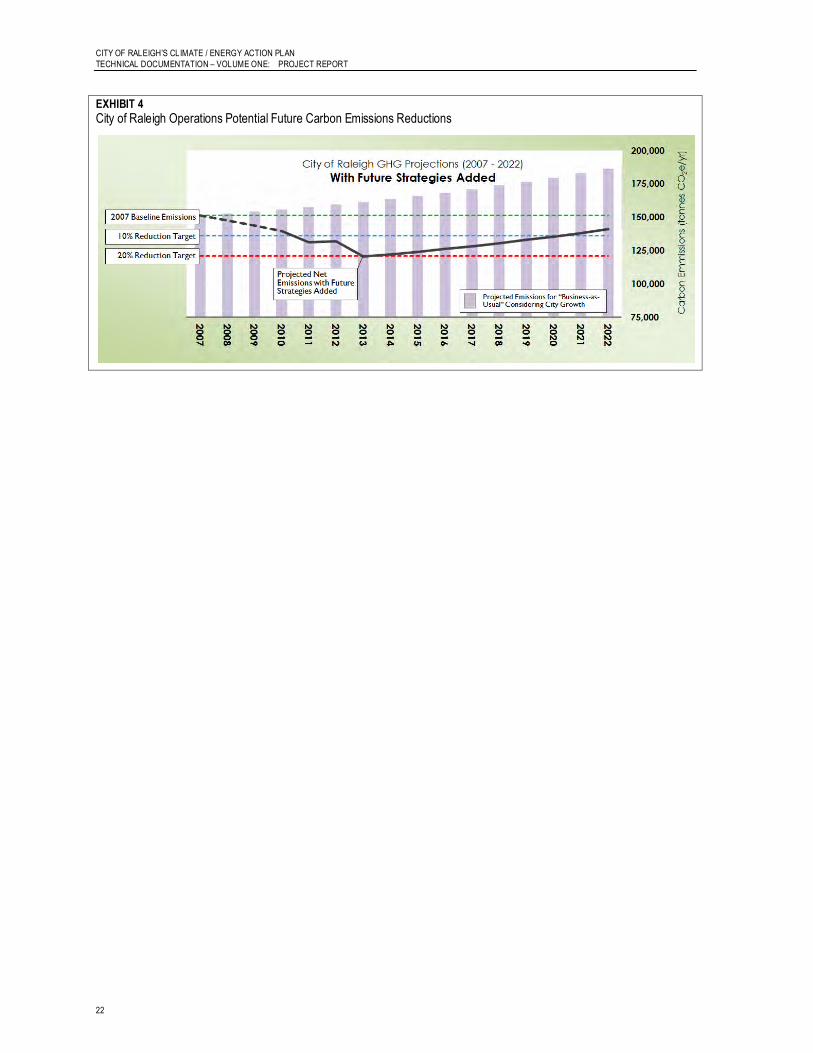
4.3 Potential Carbon Emissions Reductions from Implementation of Future Strategies, Best Management Practices and Policies
The information provided by the Strategy Teams and generated by the consulting team for the potential future strategies was utilized by the consulting team to provide an estimate of the reduction in carbon emissions that could potentially be achieved by City Operations as a result of implementing the future strategies, as shown in Exhibit 4. It must be noted that the reductions from the best management practices and policies generally could not be quantified because they are more conceptual than an implementable strategy that can be monitored and measured.
The consulting team utilized the information provided by the Strategy Teams to estimate carbon emissions from City Operations that could be reduced by the implementation of the potential future strategies. Calculations were performed according to the TCR/ICLEI Local Government Operations Protocol Version 1.1, May 2010.
The consulting team applied the following assumptions in the completion of the future emissions calculations:
2.5% growth per year per City Planning Department
City Operations expected to increase emissions at same rate as City growth rate of 2.5% per year
CITY OF RALEIGH’S CL IMATE / ENERGY ACTION PLAN
TECHNICAL DOCUMENTATION – VOLUME ONE: PROJECT REPORT
22
EXHIBIT 4
City of Raleigh Operations Potential Future Carbon Emissions Reductions
23
SECTION 5: Future Strategies Prioritization
Like many cities throughout the country, Raleigh is faced with tight financial constraints, increased environmental regulatory compliance requirements, the need to devote increased resources to renewing and replacing aging existing infrastructure, and the desire to reduce carbon emissions from city operations. These drivers, along with increased stakeholder interest in making certain that funding resources are applied to projects that add the most value, supported the development of a strategies prioritization process that is explicit about the value that is contributed by a future strategy and documents the relative efficiency of potential strategies toward meeting the City’s and CEAP’s goals and objectives.
While the CEAP is not a capital planning document, the principles of prioritization, as detailed in the Capital Planning Strategy Manual (a capital planning guidance document developed for water and wastewater utilities that was released by the American Water Works Association Research Foundation (AWWARF, 2001)), are applicable. There are three primary levels of prioritization for capital projects:
Level 1 - Voting. Voting often seems to be a form of consensus; however, voting, without good education and supporting information, often reflects the bias of the voters and may not reflect the highest benefit to the organization and its stakeholders.
Level 2 - Matrix. This is appropriate for systems where there is a relatively short list of projects, and very few objectives that are fairly straightforward.
Level 3 - Decision Analysis. For decisions that involve multiple stakeholders with different interests, a transparent process is required. A multi-criteria analysis (MCA) approach, where criteria are weighted, provides the foundation for comparing the relative contribution of a project toward meeting the stated goals.
The City elected to use the decision analysis approach to prioritization, in order to provide greater precision for weighting CEAP goals through weighted decision criteria and scoring the contribution of potential strategies to meeting the City’s goals. This approach has been found preferable to traditional voting and matrix methods for prioritizing projects by an increasing number of local governments as it provides an explicit statement of the prioritization criteria and their relative importance. This approach is based upon the methods and tools developed for the Capital Planning Strategy Manual (AAWARF, 2001).
5.1 Strategy Prioritization Approach The prioritization approach uses a ‘decision analysis’ method for scoring and prioritizing potential projects. As part of this method, a prioritization framework was developed that is specific to the CEAP and this framework served as the basis for which future strategies were screened. Key steps in the prioritization approach included:
Developing a CEAP-specific prioritization framework
Identification of decision criteria and their importance or weighting
Selecting strategies for prioritization
Scoring of selected strategies
CITY OF RALEIGH’S CL IMATE / ENERGY ACTION PLAN
TECHNICAL DOCUMENTATION – VOLUME ONE: PROJECT REPORT
24
Use of a multi-criteria analysis prioritization model to support the development of the prioritized strategy list
Review of prioritization results for verification of the prioritization framework.
In developing the prioritization framework, a series of interactive workshops were held to complete the above steps, as well as develop and verify the prioritization framework and decision-support prioritization model. Exhibit 5 shows the order of the workshops and the primary topics covered.
EXHIBIT 5
Prioritization Workshop Topics
Prioritization Workshop No. Primary Workshop Topic Date
1 Identify Prioritization Decision Criteria/ Weighting of Decision Criteria July 22, 2011
2 Strategies Screening and Scoring October 7, 2011
3 Review Results with City Interdepartmental Teams December 5, 2011
5.1.1 Prioritization Team
In order to develop the scoring criteria for potential future strategies, a Prioritization Team was created. The Team was primarily comprised of the Co-Leaders of the Strategy Teams and the complete Finance Team.
The diversity of the Team members ensured that the decision criteria that were developed could be used for a broad range of projects, and that key City enterprise-wide goals were identified and included in the prioritization.
5.2 Identification & Weighting of Prioritization Decision Criteria
The Prioritization Team selected and developed five decision criteria for use in scoring potential strategies, during a facilitated discussion as part of Prioritization Workshop No. 1.
5.2.1 Criteria Definition
The decision criteria were selected based on the primary goals of the City and the CEAP, and the characteristics appropriate for measuring the effectiveness of each potential strategy toward meeting those goals. The selected criteria reflected the following attributes to ensure that the evaluation process yielded sound results:
Separate from cost. The objective of the criteria is to evaluate the projects against the City’s values and the CEAP goals. Utilizing cost in the initial evaluation matrix and combining it with other criteria does not allow for the analysis or comparison of project efficiencies.
Comprehensive. Criteria selected cover all key goals.
SECTION 5:
FUTURE STRATEGIES PRIORITIZATION
25
Linked to values. Criteria identified can be linked to the City’s values and articulate what is important for the CEAP to accomplish.
Non-redundant. Criteria identified do not address overlapping aspects of the projects. Redundant criteria would result in “double-counting” for that particular aspect in the scoring process.
Independent. Accomplishment of one criterion would not be dictated by any other criterion.
Decision criteria used by other entities in similar prioritization efforts and knowledge of the City’s and CEAP’s goals and objectives provided a guide for the Prioritization Team to select and develop the following five decision criteria for use in scoring the projects:
Carbon Reduction Potential
Financially Responsible Operational Impacts Realistic / Implementable
Coordinates with Other Projects
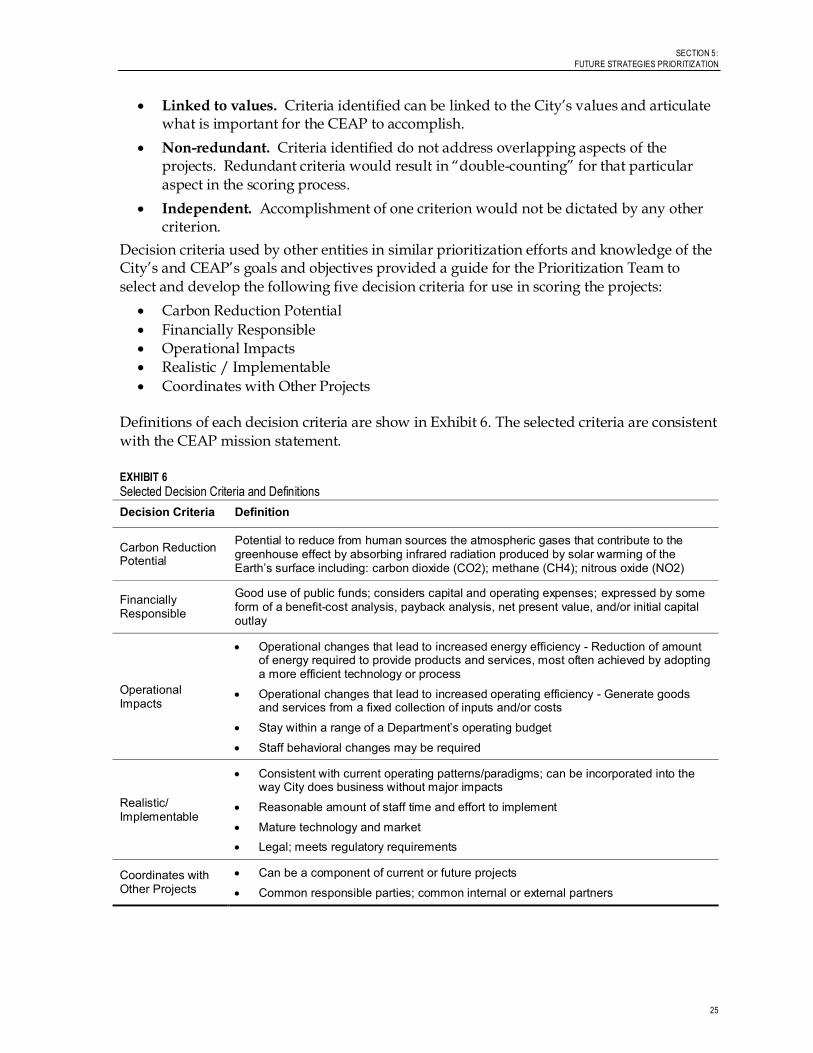
Definitions of each decision criteria are show in Exhibit 6. The selected criteria are consistent with the CEAP mission statement.
EXHIBIT 6
Selected Decision Criteria and Definitions
Decision Criteria Definition
Carbon Reduction Potential
Potential to reduce from human sources the atmospheric gases that contribute to the greenhouse effect by absorbing infrared radiation produced by solar warming of the Earth’s surface including: carbon dioxide (CO2); methane (CH4); nitrous oxide (NO2)
Financially Responsible
Good use of public funds; considers capital and operating expenses; expressed by some form of a benefit-cost analysis, payback analysis, net present value, and/or initial capital outlay
Operational Impacts
Operational changes that lead to increased energy efficiency - Reduction of amount of energy required to provide products and services, most often achieved by adopting a more efficient technology or process
Operational changes that lead to increased operating efficiency - Generate goods and services from a fixed collection of inputs and/or costs
Stay within a range of a Department’s operating budget
Staff behavioral changes may be required
Realistic/ Implementable
Consistent with current operating patterns/paradigms; can be incorporated into the way City does business without major impacts
Reasonable amount of staff time and effort to implement
Mature technology and market Legal; meets regulatory requirements
Coordinates with Other Projects
Can be a component of current or future projects
Common responsible parties; common internal or external partners
CITY OF RALEIGH’S CL IMATE / ENERGY ACTION PLAN
TECHNICAL DOCUMENTATION – VOLUME ONE: PROJECT REPORT
26
5.2.2 Criteria Weighting
Once the decision criteria were selected, the decision analysis process required an explicit, numerical weighting of each of the individual evaluation criterion, in order to allow the estimate of benefits to reflect the importance of the identified goals.
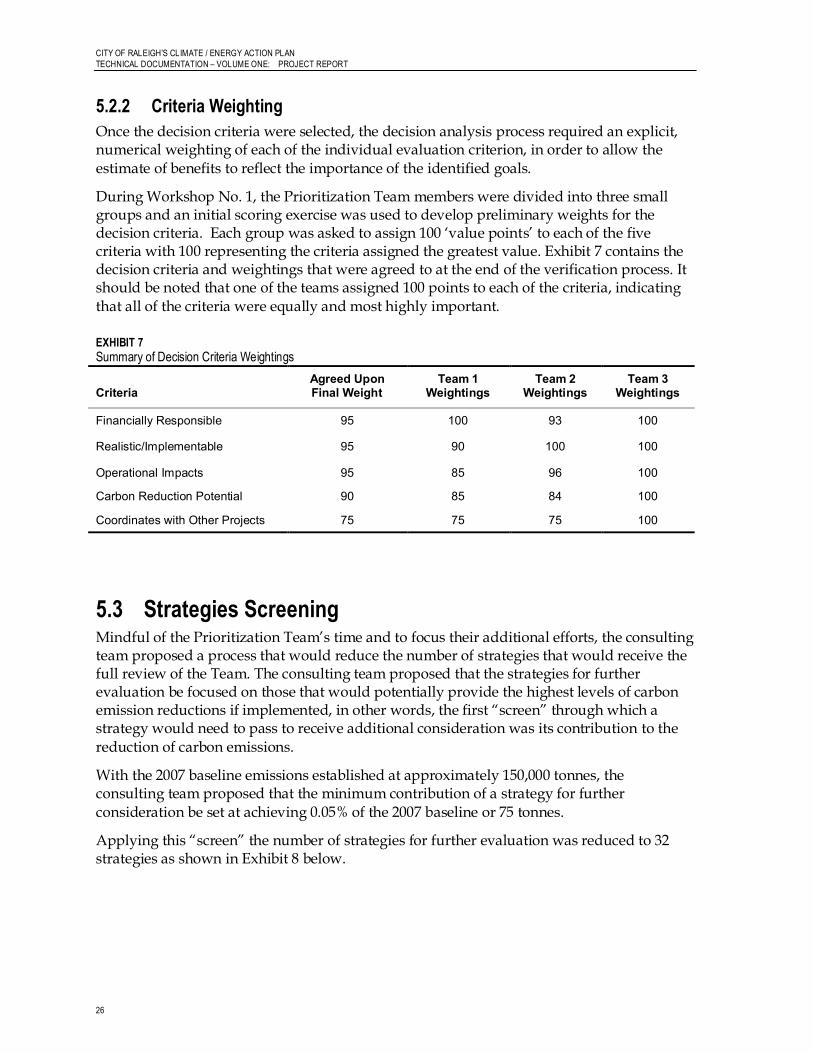
During Workshop No. 1, the Prioritization Team members were divided into three small groups and an initial scoring exercise was used to develop preliminary weights for the decision criteria. Each group was asked to assign 100 ‘value points’ to each of the five criteria with 100 representing the criteria assigned the greatest value. Exhibit 7 contains the decision criteria and weightings that were agreed to at the end of the verification process. It should be noted that one of the teams assigned 100 points to each of the criteria, indicating that all of the criteria were equally and most highly important.
EXHIBIT 7
Summary of Decision Criteria Weightings
Criteria Agreed Upon Final Weight
Team 1 Weightings
Team 2 Weightings
Team 3 Weightings
Financially Responsible 95 100 93 100
Realistic/Implementable 95 90 100 100
Operational Impacts 95 85 96 100
Carbon Reduction Potential 90 85 84 100
Coordinates with Other Projects 75 75 75 100
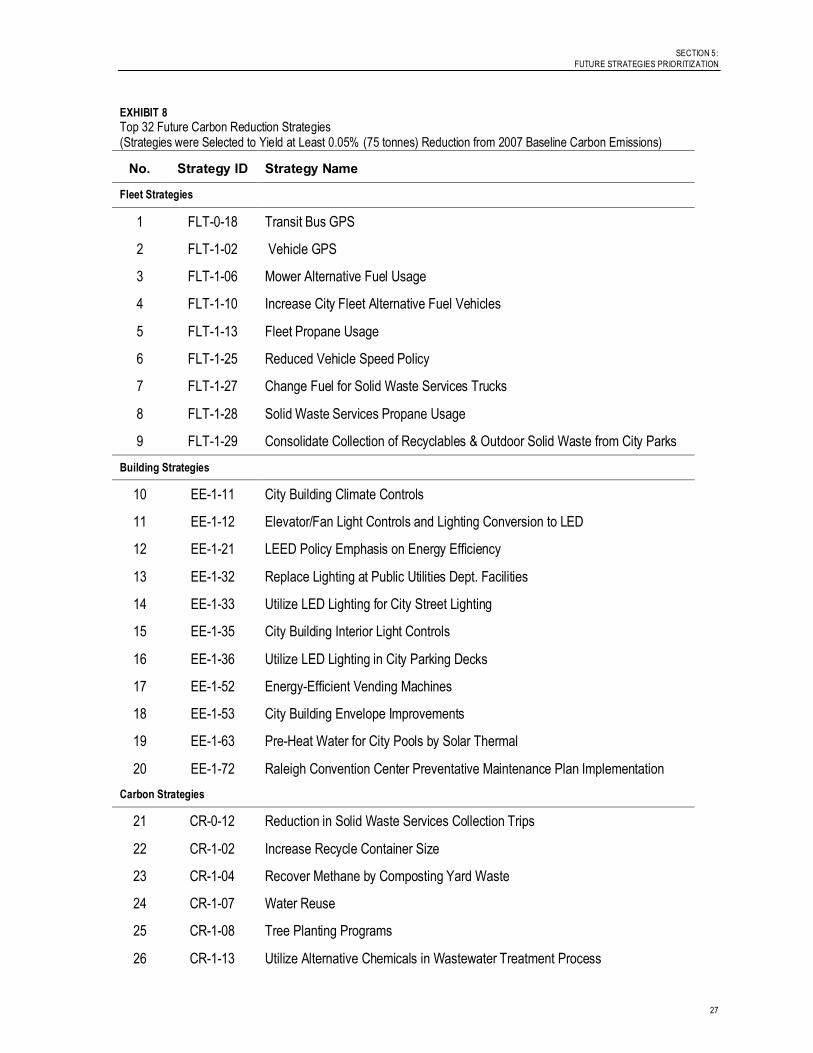
5.3 Strategies Screening Mindful of the Prioritization Team’s time and to focus their additional efforts, the consulting team proposed a process that would reduce the number of strategies that would receive the full review of the Team. The consulting team proposed that the strategies for further evaluation be focused on those that would potentially provide the highest levels of carbon emission reductions if implemented, in other words, the first “screen” through which a strategy would need to pass to receive additional consideration was its contribution to the reduction of carbon emissions.
With the 2007 baseline emissions established at approximately 150,000 tonnes, the consulting team proposed that the minimum contribution of a strategy for further consideration be set at achieving 0.05% of the 2007 baseline or 75 tonnes.
Applying this “screen” the number of strategies for further evaluation was reduced to 32 strategies as shown in Exhibit 8 below.
SECTION 5:
FUTURE STRATEGIES PRIORITIZATION
27
EXHIBIT 8
Top 32 Future Carbon Reduction Strategies (Strategies were Selected to Yield at Least 0.05% (75 tonnes) Reduction from 2007 Baseline Carbon Emissions)
No. Strategy ID Strategy Name
Fleet Strategies
1 FLT-0-18 Transit Bus GPS
2 FLT-1-02 Vehicle GPS
3 FLT-1-06 Mower Alternative Fuel Usage
4 FLT-1-10 Increase City Fleet Alternative Fuel Vehicles
5 FLT-1-13 Fleet Propane Usage
6 FLT-1-25 Reduced Vehicle Speed Policy
7 FLT-1-27 Change Fuel for Solid Waste Services Trucks
8 FLT-1-28 Solid Waste Services Propane Usage
9 FLT-1-29 Consolidate Collection of Recyclables & Outdoor Solid Waste from City Parks
Building Strategies
10 EE-1-11 City Building Climate Controls
11 EE-1-12 Elevator/Fan Light Controls and Lighting Conversion to LED
12 EE-1-21 LEED Policy Emphasis on Energy Efficiency
13 EE-1-32 Replace Lighting at Public Utilities Dept. Facilities
14 EE-1-33 Utilize LED Lighting for City Street Lighting
15 EE-1-35 City Building Interior Light Controls
16 EE-1-36 Utilize LED Lighting in City Parking Decks
17 EE-1-52 Energy-Efficient Vending Machines
18 EE-1-53 City Building Envelope Improvements
19 EE-1-63 Pre-Heat Water for City Pools by Solar Thermal
20 EE-1-72 Raleigh Convention Center Preventative Maintenance Plan Implementation
Carbon Strategies
21 CR-0-12 Reduction in Solid Waste Services Collection Trips
22 CR-1-02 Increase Recycle Container Size
23 CR-1-04 Recover Methane by Composting Yard Waste
24 CR-1-07 Water Reuse
25 CR-1-08 Tree Planting Programs
26 CR-1-13 Utilize Alternative Chemicals in Wastewater Treatment Process
CITY OF RALEIGH’S CL IMATE / ENERGY ACTION PLAN
TECHNICAL DOCUMENTATION – VOLUME ONE: PROJECT REPORT
28
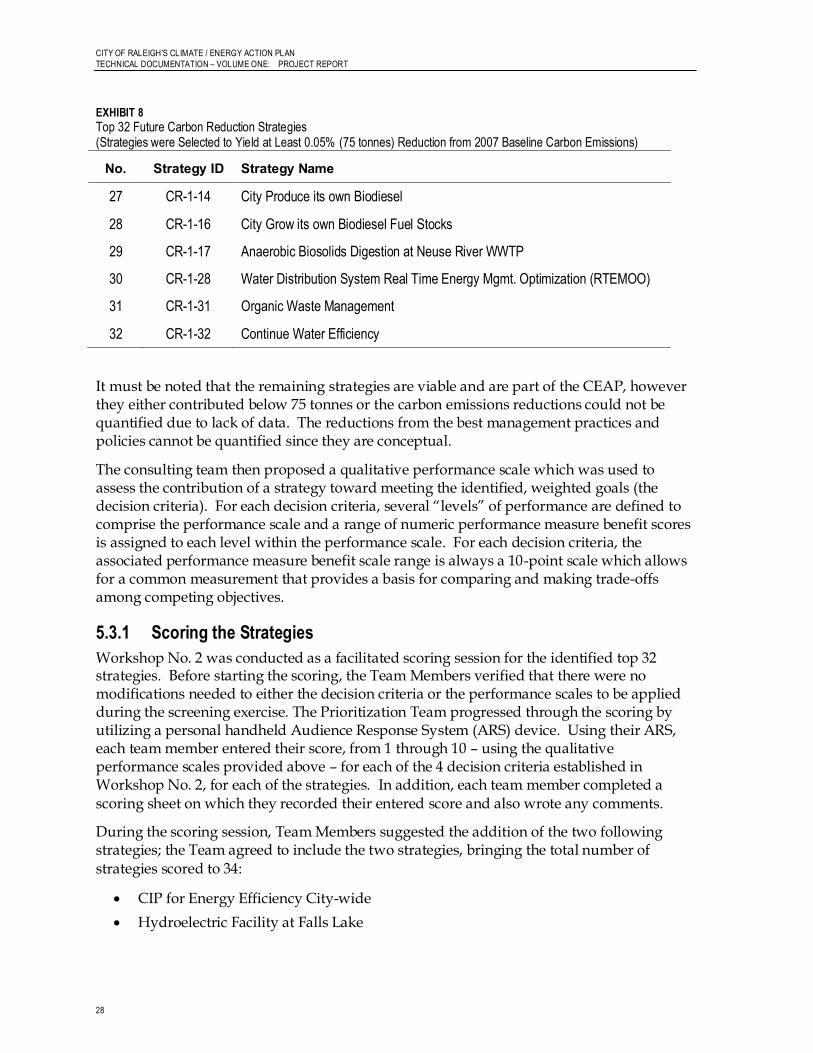
EXHIBIT 8
Top 32 Future Carbon Reduction Strategies (Strategies were Selected to Yield at Least 0.05% (75 tonnes) Reduction from 2007 Baseline Carbon Emissions)
No. Strategy ID Strategy Name
27 CR-1-14 City Produce its own Biodiesel
28 CR-1-16 City Grow its own Biodiesel Fuel Stocks
29 CR-1-17 Anaerobic Biosolids Digestion at Neuse River WWTP
30 CR-1-28 Water Distribution System Real Time Energy Mgmt. Optimization (RTEMOO)
31 CR-1-31 Organic Waste Management
32 CR-1-32 Continue Water Efficiency
It must be noted that the remaining strategies are viable and are part of the CEAP, however they either contributed below 75 tonnes or the carbon emissions reductions could not be quantified due to lack of data. The reductions from the best management practices and policies cannot be quantified since they are conceptual.
The consulting team then proposed a qualitative performance scale which was used to assess the contribution of a strategy toward meeting the identified, weighted goals (the decision criteria). For each decision criteria, several “levels” of performance are defined to comprise the performance scale and a range of numeric performance measure benefit scores is assigned to each level within the performance scale. For each decision criteria, the associated performance measure benefit scale range is always a 10-point scale which allows for a common measurement that provides a basis for comparing and making trade-offs among competing objectives.
5.3.1 Scoring the Strategies
Workshop No. 2 was conducted as a facilitated scoring session for the identified top 32 strategies. Before starting the scoring, the Team Members verified that there were no modifications needed to either the decision criteria or the performance scales to be applied during the screening exercise. The Prioritization Team progressed through the scoring by utilizing a personal handheld Audience Response System (ARS) device. Using their ARS, each team member entered their score, from 1 through 10 – using the qualitative performance scales provided above – for each of the 4 decision criteria established in Workshop No. 2, for each of the strategies. In addition, each team member completed a scoring sheet on which they recorded their entered score and also wrote any comments.
During the scoring session, Team Members suggested the addition of the two following strategies; the Team agreed to include the two strategies, bringing the total number of strategies scored to 34:
CIP for Energy Efficiency City-wide
Hydroelectric Facility at Falls Lake
SECTION 5:
FUTURE STRATEGIES PRIORITIZATION
29
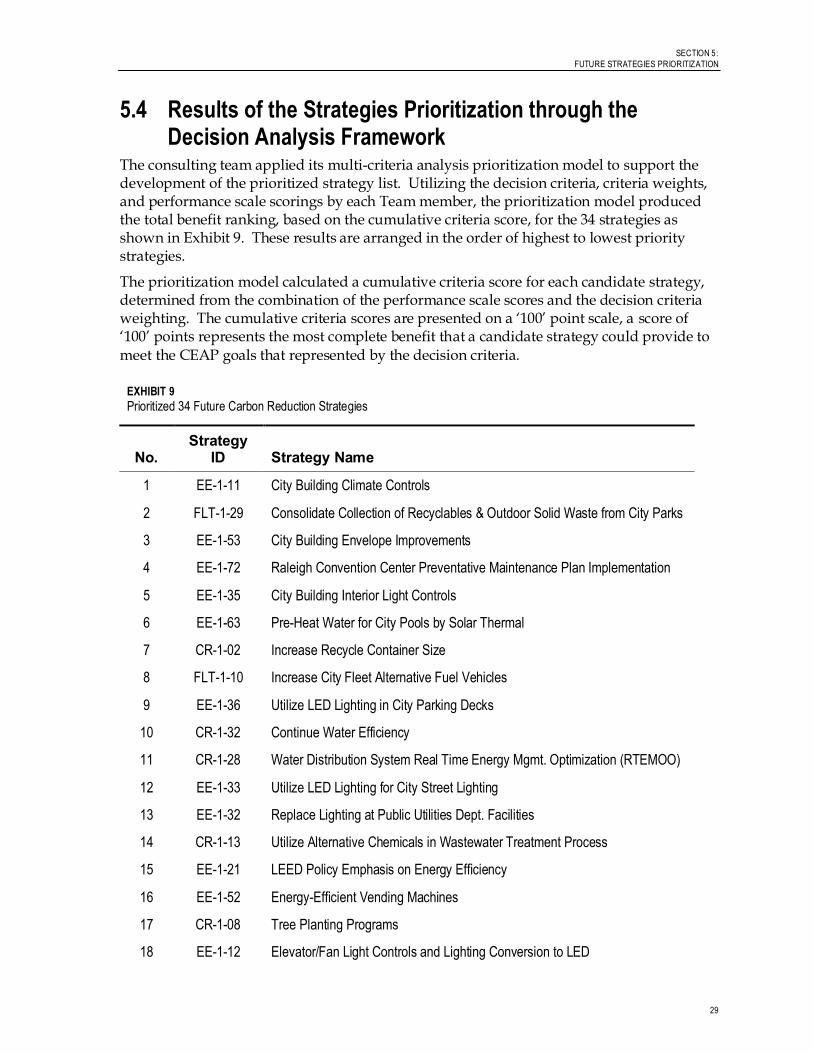
5.4 Results of the Strategies Prioritization through the Decision Analysis Framework
The consulting team applied its multi-criteria analysis prioritization model to support the development of the prioritized strategy list. Utilizing the decision criteria, criteria weights, and performance scale scorings by each Team member, the prioritization model produced the total benefit ranking, based on the cumulative criteria score, for the 34 strategies as shown in Exhibit 9. These results are arranged in the order of highest to lowest priority strategies.
The prioritization model calculated a cumulative criteria score for each candidate strategy, determined from the combination of the performance scale scores and the decision criteria weighting. The cumulative criteria scores are presented on a ‘100’ point scale, a score of ‘100’ points represents the most complete benefit that a candidate strategy could provide to meet the CEAP goals that represented by the decision criteria.
EXHIBIT 9
Prioritized 34 Future Carbon Reduction Strategies
No. Strategy
ID Strategy Name
1 EE-1-11 City Building Climate Controls
2 FLT-1-29 Consolidate Collection of Recyclables & Outdoor Solid Waste from City Parks
3 EE-1-53 City Building Envelope Improvements
4 EE-1-72 Raleigh Convention Center Preventative Maintenance Plan Implementation
5 EE-1-35 City Building Interior Light Controls
6 EE-1-63 Pre-Heat Water for City Pools by Solar Thermal
7 CR-1-02 Increase Recycle Container Size
8 FLT-1-10 Increase City Fleet Alternative Fuel Vehicles
9 EE-1-36 Utilize LED Lighting in City Parking Decks
10 CR-1-32 Continue Water Efficiency
11 CR-1-28 Water Distribution System Real Time Energy Mgmt. Optimization (RTEMOO)
12 EE-1-33 Utilize LED Lighting for City Street Lighting
13 EE-1-32 Replace Lighting at Public Utilities Dept. Facilities
14 CR-1-13 Utilize Alternative Chemicals in Wastewater Treatment Process
15 EE-1-21 LEED Policy Emphasis on Energy Efficiency
16 EE-1-52 Energy-Efficient Vending Machines
17 CR-1-08 Tree Planting Programs
18 EE-1-12 Elevator/Fan Light Controls and Lighting Conversion to LED
CITY OF RALEIGH’S CL IMATE / ENERGY ACTION PLAN
TECHNICAL DOCUMENTATION – VOLUME ONE: PROJECT REPORT
30
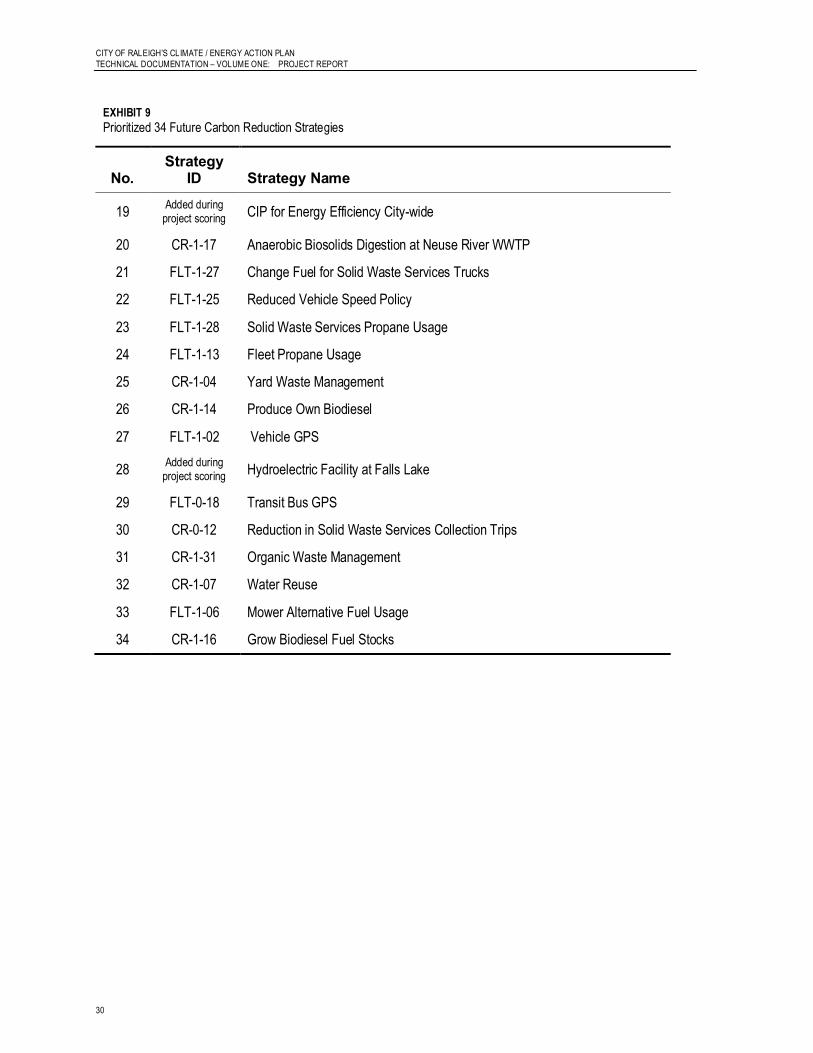
EXHIBIT 9
Prioritized 34 Future Carbon Reduction Strategies
No. Strategy
ID Strategy Name
19 Added during
project scoring CIP for Energy Efficiency City-wide
20 CR-1-17 Anaerobic Biosolids Digestion at Neuse River WWTP
21 FLT-1-27 Change Fuel for Solid Waste Services Trucks
22 FLT-1-25 Reduced Vehicle Speed Policy
23 FLT-1-28 Solid Waste Services Propane Usage
24 FLT-1-13 Fleet Propane Usage
25 CR-1-04 Yard Waste Management
26 CR-1-14 Produce Own Biodiesel
27 FLT-1-02 Vehicle GPS
28 Added during
project scoring Hydroelectric Facility at Falls Lake
29 FLT-0-18 Transit Bus GPS
30 CR-0-12 Reduction in Solid Waste Services Collection Trips
31 CR-1-31 Organic Waste Management
32 CR-1-07 Water Reuse
33 FLT-1-06 Mower Alternative Fuel Usage
34 CR-1-16 Grow Biodiesel Fuel Stocks
SECTION 5:
FUTURE STRATEGIES PRIORITIZATION
31
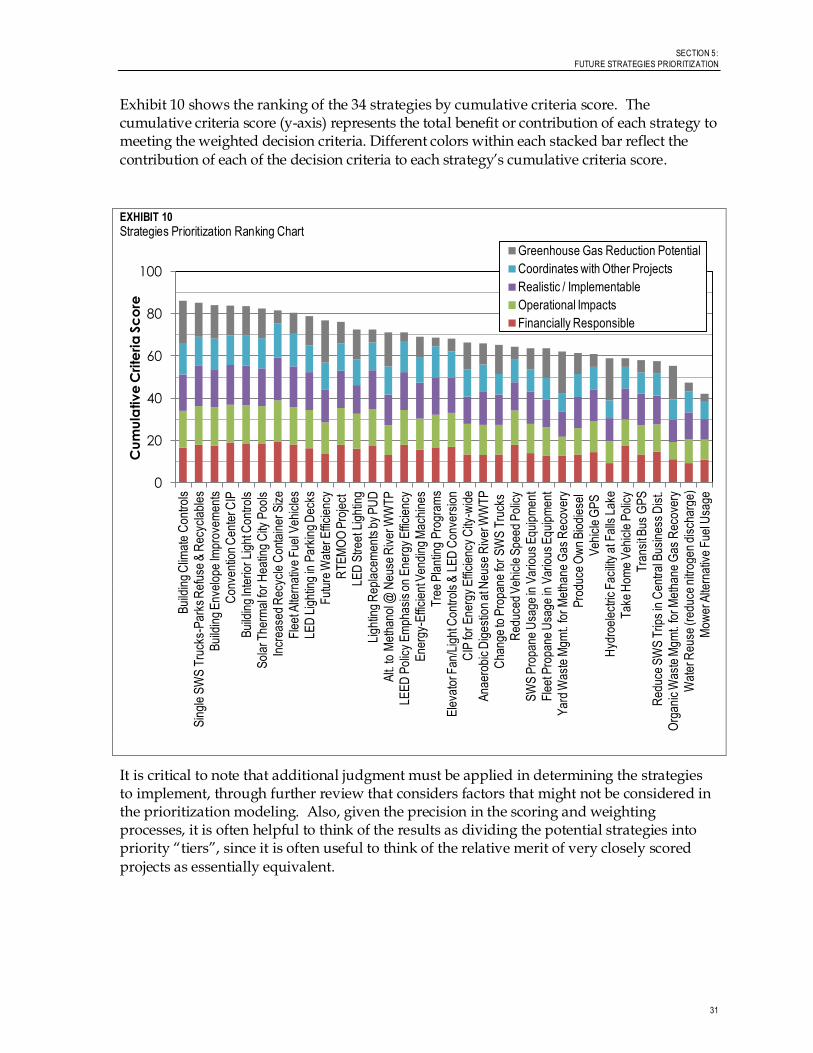
Exhibit 10 shows the ranking of the 34 strategies by cumulative criteria score. The cumulative criteria score (y-axis) represents the total benefit or contribution of each strategy to meeting the weighted decision criteria. Different colors within each stacked bar reflect the contribution of each of the decision criteria to each strategy’s cumulative criteria score.
EXHIBIT 10
Strategies Prioritization Ranking Chart
It is critical to note that additional judgment must be applied in determining the strategies to implement, through further review that considers factors that might not be considered in the prioritization modeling. Also, given the precision in the scoring and weighting processes, it is often helpful to think of the results as dividing the potential strategies into priority “tiers”, since it is often useful to think of the relative merit of very closely scored projects as essentially equivalent.
0
20
40
60
80
100
Bui
ldin
g C
limat
e C
ontr
ols
Sin
gle
SW
S T
ruck
s-P
arks
Ref
use
& R
ecyc
labl
es
Bui
ldin
g E
nvel
ope
Impr
ovem
ents
Con
vent
ion
Cen
ter C
IP
Bui
ldin
g In
terio
r Li
ght C
ontr
ols
Sol
ar T
herm
al fo
r H
eatin
g C
ity P
ools
Incr
ease
d R
ecyc
le C
onta
iner
Siz
e
Fle
et A
ltern
ativ
e F
uel V
ehic
les
LED
Lig
htin
g in
Par
king
Dec
ks
Fut
ure
Wat
er E
ffici
ency
RT
EM
OO
Pro
ject
LED
Str
eet L
ight
ing
Ligh
ting
Rep
lace
men
ts b
y P
UD
Alt.
to M
etha
nol @
Neu
se R
iver
WW
TP
LEE
D P
olic
y E
mph
asis
on
Ene
rgy
Effi
cien
cy
Ene
rgy-
Effi
cien
t Ven
ding
Mac
hine
s
Tre
e P
lant
ing
Pro
gram
s
Ele
vato
r Fan
/Lig
ht C
ontr
ols
& L
ED
Con
vers
ion
CIP
for
Ene
rgy
Effi
cien
cy C
ity-w
ide
Ana
erob
ic D
iges
tion
at N
euse
Riv
er W
WT
P
Cha
nge
to P
ropa
ne fo
r S
WS
Tru
cks
Red
uced
Veh
icle
Spe
ed P
olic
y
SW
S P
ropa
ne U
sage
in V
ario
us E
quip
men
t
Fle
et P
ropa
ne U
sage
in V
ario
us E
quip
men
t
Yar
d W
aste
Mgm
t. fo
r M
etha
ne G
as R
ecov
ery
Pro
duce
Ow
n B
iodi
esel
Veh
icle
GP
S
Hyd
roel
ectri
c F
acili
ty a
t Fal
ls L
ake
Tak
e H
ome
Veh
icle
Pol
icy
Tra
nsit
Bus
GP
S
Red
uce
SW
S T
rips
in C
entr
al B
usin
ess
Dis
t.
Org
anic
Was
te M
gmt.
for M
etha
ne G
as R
ecov
ery
Wat
er R
euse
(red
uce
nitr
ogen
dis
char
ge)
Mow
er A
ltern
ativ
e F
uel U
sage
Cu
mu
lativ
e C
rite
ria
Sc
ore
Greenhouse Gas Reduction Potential
Coordinates with Other Projects
Realistic / Implementable
Operational Impacts
Financially Responsible
33
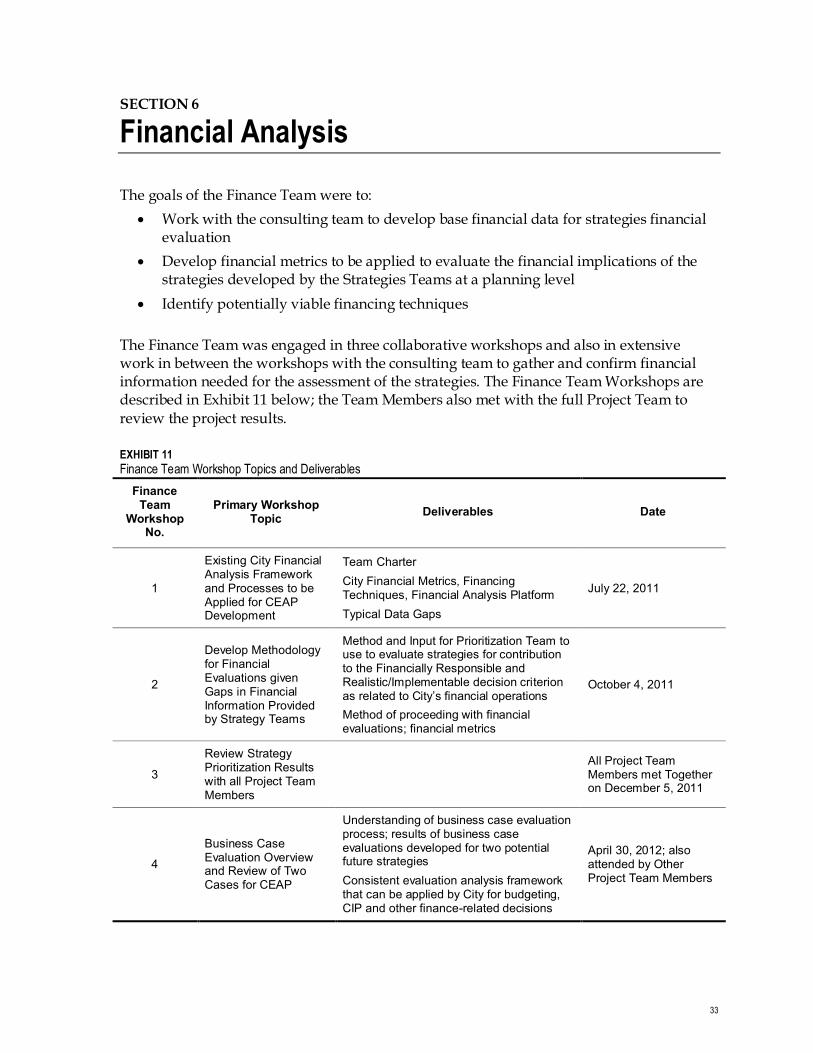
SECTION 6 Financial Analysis
The goals of the Finance Team were to:
Work with the consulting team to develop base financial data for strategies financial evaluation
Develop financial metrics to be applied to evaluate the financial implications of the strategies developed by the Strategies Teams at a planning level
Identify potentially viable financing techniques
The Finance Team was engaged in three collaborative workshops and also in extensive work in between the workshops with the consulting team to gather and confirm financial information needed for the assessment of the strategies. The Finance Team Workshops are described in Exhibit 11 below; the Team Members also met with the full Project Team to review the project results.
EXHIBIT 11
Finance Team Workshop Topics and Deliverables
Finance Team
Workshop No.
Primary Workshop Topic Deliverables Date
1
Existing City Financial Analysis Framework and Processes to be Applied for CEAP Development
Team Charter City Financial Metrics, Financing Techniques, Financial Analysis Platform Typical Data Gaps
July 22, 2011
2
Develop Methodology for Financial Evaluations given Gaps in Financial Information Provided by Strategy Teams
Method and Input for Prioritization Team to use to evaluate strategies for contribution to the Financially Responsible and Realistic/Implementable decision criterion as related to City’s financial operations Method of proceeding with financial evaluations; financial metrics
October 4, 2011
3
Review Strategy Prioritization Results with all Project Team Members
All Project Team Members met Together on December 5, 2011
4
Business Case Evaluation Overview and Review of Two Cases for CEAP
Understanding of business case evaluation process; results of business case evaluations developed for two potential future strategies Consistent evaluation analysis framework that can be applied by City for budgeting, CIP and other finance-related decisions
April 30, 2012; also attended by Other Project Team Members
CITY OF RALEIGH’S CL IMATE / ENERGY ACTION PLAN
TECHNICAL DOCUMENTATION – VOLUME ONE: PROJECT REPORT
34
6.1 First Finance Team Workshop The goals of the first Finance Team Workshop were:
Chartering and project process:
o Become familiar with one another
o Review the project goals established during the Project Chartering Workshop
o Review the project process
o Review the Project Team Charter
o Validate Team Members, define roles and responsibilities, charter the Team Members, and sign the Team Charter
o Agree on critical success factors
o Agree on expectations of the Team, outcomes and deliverables to be produced
o Agree on project schedule
Discuss financial evaluation metrics and analysis methods that would be applied to development of the CEAP
Discuss potential business models for project financing
Capture Team’s ideas about future projects, activities and strategies that could help further increase operation and energy efficiency, and reduce carbon emissions
Although most of the Finance Team Members had attended the Chartering Workshop and were familiar with the chartering process and the final Project Team Charter, the chartering process was reviewed to ensure all Team Members understood the significance and were willing to sign the individual Team Charter.
6.1.1 Facilitated Exercise
Following the Team chartering, the Team Members actively participated in a facilitated exercise designed to encourage the free-flowing exchange of ideas among the Team Members and to capture all thoughts and ideas without any constraints. The goal of the exercise was to capture the:
Kind of data need to be provided by the other Interdepartmental Teams – especially by the Strategy Teams – for the Finance Team to do its work
Level of data detail is expected to be provided by the other Teams or developed by this Team in order to make planning level decisions
Assumptions that are typically seen that can lead to errors in financial analyses
Past and current perspectives on investment returns and the view for the future
6.1.2 Other Information
Discussions at the workshop also highlighted these important findings:
The City does not use common metrics and Departments evaluate costs differently from each other
SECTION 6
FINANCIAL ANALYSIS
35
As such, the Financial Strategy Team would need to agree on the financial metrics that would be applied for CEAP development
The use of Raleigh-specific information would provide the basis for the most verifiable, defendable and repeatable analysis of strategies as well as the most realistic estimates of costs and impacts to City operations
6.2 Second Finance Team Workshop The goals of the second Finance Team Workshop were to:
Develop a method for the Prioritization Team to use to evaluate strategies for contribution to the Financially Responsible decision criterion
Provide input for Prioritization Team to use to evaluate strategies for contribution to the Realistic/Implementable decision criterion as related to City’s financial operations
Develop a process that could be used to fill the gaps in the financial information that was provided by the Strategy Teams, in order to conduct the financial evaluations
6.2.1 Information for Prioritization Team
One of the five decision criteria for use in scoring potential strategies was “Financially Responsible”, defined as the “good use of public funds; considers capital and operating expenses; expressed by some form of a benefit-cost analysis, payback analysis, net present value, and/or initial capital outlay.”
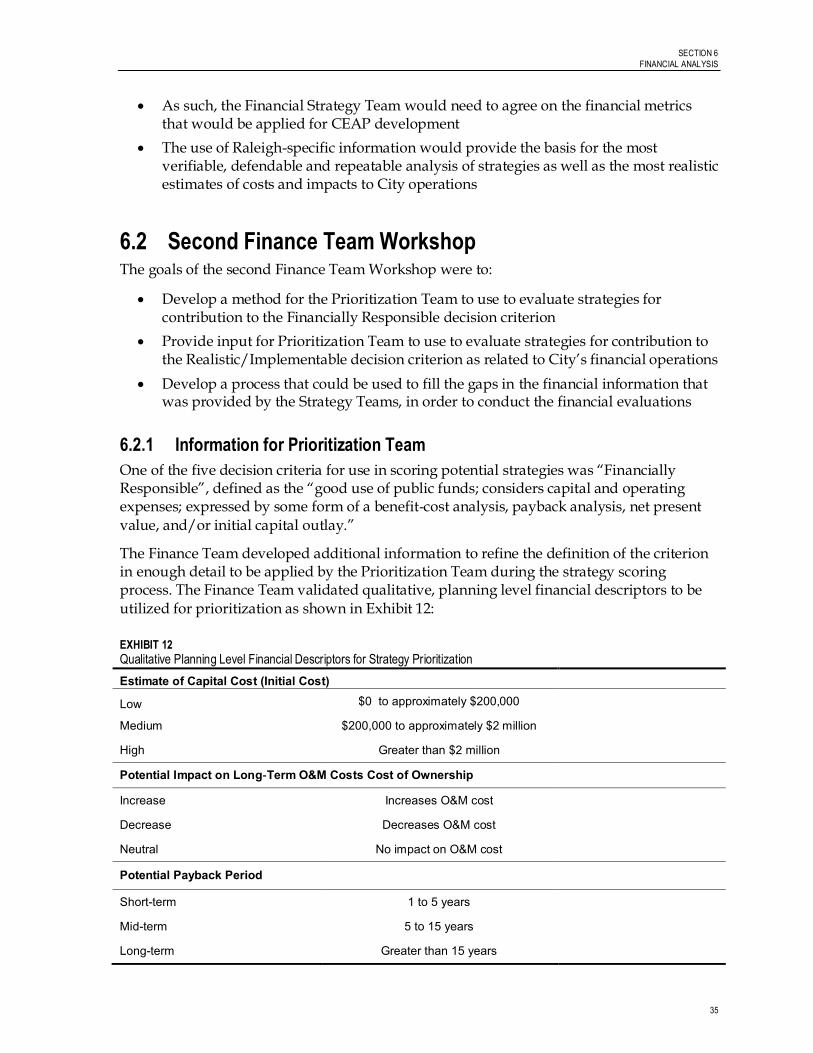
The Finance Team developed additional information to refine the definition of the criterion in enough detail to be applied by the Prioritization Team during the strategy scoring process. The Finance Team validated qualitative, planning level financial descriptors to be utilized for prioritization as shown in Exhibit 12:
EXHIBIT 12
Qualitative Planning Level Financial Descriptors for Strategy Prioritization
Estimate of Capital Cost (Initial Cost)
Low $0 to approximately $200,000
Medium $200,000 to approximately $2 million
High Greater than $2 million
Potential Impact on Long‐Term O&M Costs Cost of Ownership
Increase Increases O&M cost
Decrease Decreases O&M cost
Neutral No impact on O&M cost
Potential Payback Period
Short-term 1 to 5 years
Mid-term 5 to 15 years
Long-term Greater than 15 years
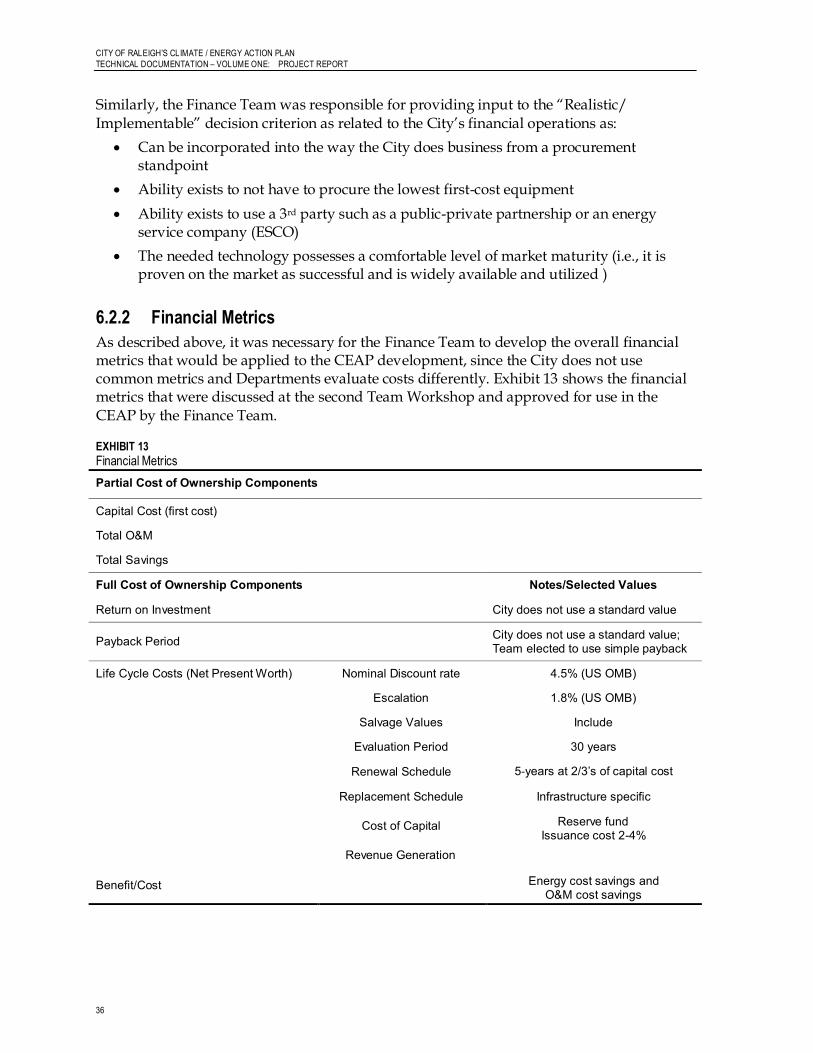
CITY OF RALEIGH’S CL IMATE / ENERGY ACTION PLAN
TECHNICAL DOCUMENTATION – VOLUME ONE: PROJECT REPORT
36
Similarly, the Finance Team was responsible for providing input to the “Realistic/ Implementable” decision criterion as related to the City’s financial operations as:
Can be incorporated into the way the City does business from a procurement standpoint
Ability exists to not have to procure the lowest first-cost equipment
Ability exists to use a 3rd party such as a public-private partnership or an energy service company (ESCO)
The needed technology possesses a comfortable level of market maturity (i.e., it is proven on the market as successful and is widely available and utilized )
6.2.2 Financial Metrics
As described above, it was necessary for the Finance Team to develop the overall financial metrics that would be applied to the CEAP development, since the City does not use common metrics and Departments evaluate costs differently. Exhibit 13 shows the financial metrics that were discussed at the second Team Workshop and approved for use in the CEAP by the Finance Team.
EXHIBIT 13
Financial Metrics
Partial Cost of Ownership Components
Capital Cost (first cost)
Total O&M
Total Savings
Full Cost of Ownership Components Notes/Selected Values
Return on Investment City does not use a standard value
Payback Period City does not use a standard value; Team elected to use simple payback
Life Cycle Costs (Net Present Worth) Nominal Discount rate 4.5% (US OMB)
Escalation 1.8% (US OMB)
Salvage Values Include
Evaluation Period 30 years
Renewal Schedule 5‐years at 2/3’s of capital cost
Replacement Schedule Infrastructure specific
Cost of Capital Reserve fund Issuance cost 2-4%
Revenue Generation
Benefit/Cost Energy cost savings and O&M cost savings
SECTION 6
FINANCIAL ANALYSIS
37
6.3 Financial Evaluation Process Revised Following the second Strategy Teams Workshops, the Project Team and the consulting team recognized that “filling the gaps” in the financial information necessary to evaluate the full costs of ownership for the top potential strategies was not realistic within the timeframe to complete the project. The number and variety of information gaps were so large that, while the consulting team was able to provide industry standard values where needed, it was agreed that an analysis based almost entirely on industry standards would weaken one of the key CEAP objectives – a Plan developed by the Team Members.
At this point in the project, an alternative method to evaluate project financials was needed. The discussions that followed captured several important things:
One CEAP objective was to provide a process for the City to begin to think holistically carbon emission reductions, energy and related financials; this objective was being met through exposure of the Project Team Members to these concepts throughout their work to develop the CEAP
Reaffirmed that the use of information that was primarily Raleigh-specific would provide the basis for the most verifiable, defendable and repeatable analysis of strategies as well as the most realistic estimates of costs and impacts to City operations
Additional attempts to obtain information from the Project Teams were not warranted and a revised method to complete the financial portion of the CEAP was needed
There is a great need for the City to develop and implement a standardized way to gather the types of information needed for future financial analyses. This is addressed in Volume 4 of the CEAP Technical Documentation – “Data Collection Framework for
City of Raleigh Operations”.
After several strategy sessions, the following process was agreed upon by the City and the consulting team:
Evaluate key characteristics of total cost of ownership
Conduct business case evaluations (BCE) on two strategies to demonstrate an evaluation methodology that could be applied by the City when detailed cost information becomes available
The key characteristics of total cost of ownership were evaluated for the top strategies resulting from the Prioritization Team’s work and are shown above in Exhibit 12.
6.4 Business Case Evaluations As described above, the Team supported the application of the BCE concept to the CEAP financial evaluation process as an alternative approach. The BCE approach provides a transparent framework for making financially justifiable decisions that can be correlated to both energy and carbon reduction, and also provides tools to evaluate the tradeoffs between capital replacement projects versus longer life-cycle replacement projects.
Two of the highest scoring strategies were selected as examples to demonstrate the BCE process. The process follows a standard format that can be applied by the City staff to
CITY OF RALEIGH’S CL IMATE / ENERGY ACTION PLAN
TECHNICAL DOCUMENTATION – VOLUME ONE: PROJECT REPORT
38
evaluate any of the CEAP actions. The process can also be applied for capital improvement projects (CIP) prioritization. The potential strategies evaluated were:
Utilize the Solid Waste Services Department trucks and personnel to collect recyclables in addition to outdoor solid waste from the City’s parks
Strategy for Conversion to LED Lighting in City Parking Decks
The complete Business Case Evaluations are included in Appendix 2 of the CEAP.
6.5 Raleigh Public Utilities Department Real Time Energy Management & Operations Optimization (RTEMOO) Project
Under a separate contract between the consulting team and the City of Raleigh PUD, a feasibility study was conducted to investigate the suitability for the City to use a water distribution and optimization software solution that could potentially reduce operating costs by:
Shifting electrical load to maximize use of the lowest cost kWh tariff periods
Preparing proactively for load shedding to minimize peak kW demand charges
Selecting efficient operations of pumps and pump combinations to yield optimal energy improvements
Selecting the lowest cost source of water
Selecting the lowest cost transport path for water distribution based on system demands
The feasibility study focused on understanding the complexities, operational requirements and inherent constraints within the distribution systems operations and determining the likely benefits that energy management and operations optimization could deliver. Findings included:
The electric tariff rates in use by the City provide an incentive to shift load from expensive (e.g., peak) to cheaper (e.g., off-peak) priced electricity periods
The software demonstrated that by effective dynamic operation of the water storage capacity within the distribution system, cost reduction opportunities were available
The software demonstrated that by selecting the most appropriate pump combinations to run at any time, possible energy efficiency improvements in the range of 6 to 8 percent might be achieved without asset changes
A nominal 6 percent reduction in energy use would realize a reduction of 2,550 MWh or 1,290 tonnes of CO2 per year
The 2010 annual electricity cost for the studied sites was $3.1 million; a cost reduction in the range of 10 percent per year might be realized through load shifting
6.6 Comprehensive Fleet Transformation Strategy One of the top CEAP strategies is Strategy FLT-1-10: Increase City Fleet Alternative Fuel Vehicles. Under this strategy, the City’s fleet would continue to be replaced with alternative fuels and/or hybrid vehicles when it is deemed that the optimal life cycle of the existing
SECTION 6
FINANCIAL ANALYSIS
39
vehicle has been reached. To begin to implement this strategy, a first step must be taken to gather additional information needed up front.
Working to lower emissions and operating costs, a comprehensive fleet management program will examine the full lifecycle of vehicles to determine when it is best to retire, repair, or replace vehicles in favor of cleaner, more efficient options. This strategy will provide a decision support system to measure the existing performance and operating cost of individual vehicles to determine at which point in time, either now or in the future, it would be best to replace the vehicle, maintaining the optimal lifecycle of the existing asset while minimizing overall emissions. The strategy involves understanding many things including the average life, emission factors, cost of a vehicle over its lifecycle, and time replacement relative to the maintenance and repair cost versus that of new technology. Using both statistical modeling and decision analysis, individual vehicles in a fleet can be evaluated as part of the entire fleet, in order to minimize the actuarial present value of all future costs associated with the fleet, and thus the long-term consumption of scarce resources.
Details are provided in Volume 3 of the CEAP Technical Documentation – “Comprehensive Fleet Transformation Strategy – Initial Step”.

APPENDIX 1: Project Team Members
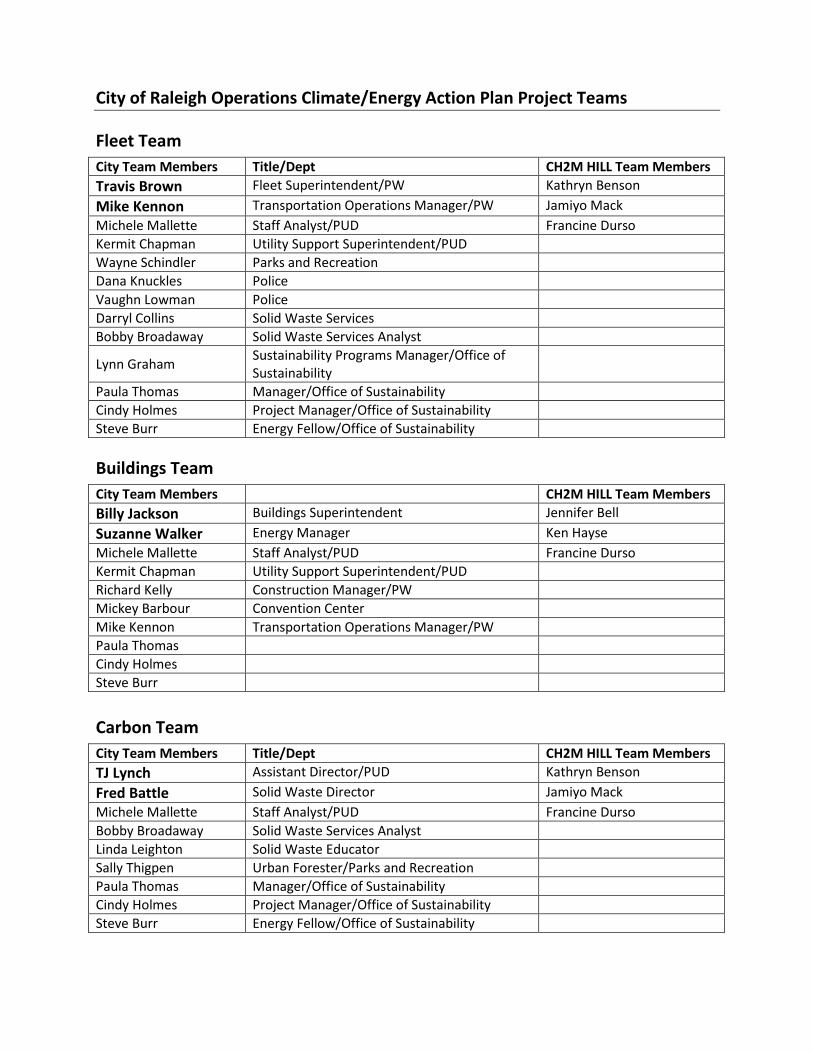
City of Raleigh Operations Climate/Energy Action Plan Project Teams
Fleet Team
City Team Members Title/Dept CH2M HILL Team Members
Travis Brown Fleet Superintendent/PW Kathryn Benson
Mike Kennon Transportation Operations Manager/PW Jamiyo Mack
Michele Mallette Staff Analyst/PUD Francine Durso
Kermit Chapman Utility Support Superintendent/PUD
Wayne Schindler Parks and Recreation
Dana Knuckles Police
Vaughn Lowman Police
Darryl Collins Solid Waste Services
Bobby Broadaway Solid Waste Services Analyst
Lynn Graham Sustainability Programs Manager/Office of Sustainability
Paula Thomas Manager/Office of Sustainability
Cindy Holmes Project Manager/Office of Sustainability
Steve Burr Energy Fellow/Office of Sustainability
Buildings Team
City Team Members CH2M HILL Team Members
Billy Jackson Buildings Superintendent Jennifer Bell
Suzanne Walker Energy Manager Ken Hayse
Michele Mallette Staff Analyst/PUD Francine Durso
Kermit Chapman Utility Support Superintendent/PUD
Richard Kelly Construction Manager/PW
Mickey Barbour Convention Center
Mike Kennon Transportation Operations Manager/PW
Paula Thomas
Cindy Holmes
Steve Burr
Carbon Team
City Team Members Title/Dept CH2M HILL Team Members
TJ Lynch Assistant Director/PUD Kathryn Benson
Fred Battle Solid Waste Director Jamiyo Mack
Michele Mallette Staff Analyst/PUD Francine Durso
Bobby Broadaway Solid Waste Services Analyst
Linda Leighton Solid Waste Educator
Sally Thigpen Urban Forester/Parks and Recreation
Paula Thomas Manager/Office of Sustainability
Cindy Holmes Project Manager/Office of Sustainability
Steve Burr Energy Fellow/Office of Sustainability
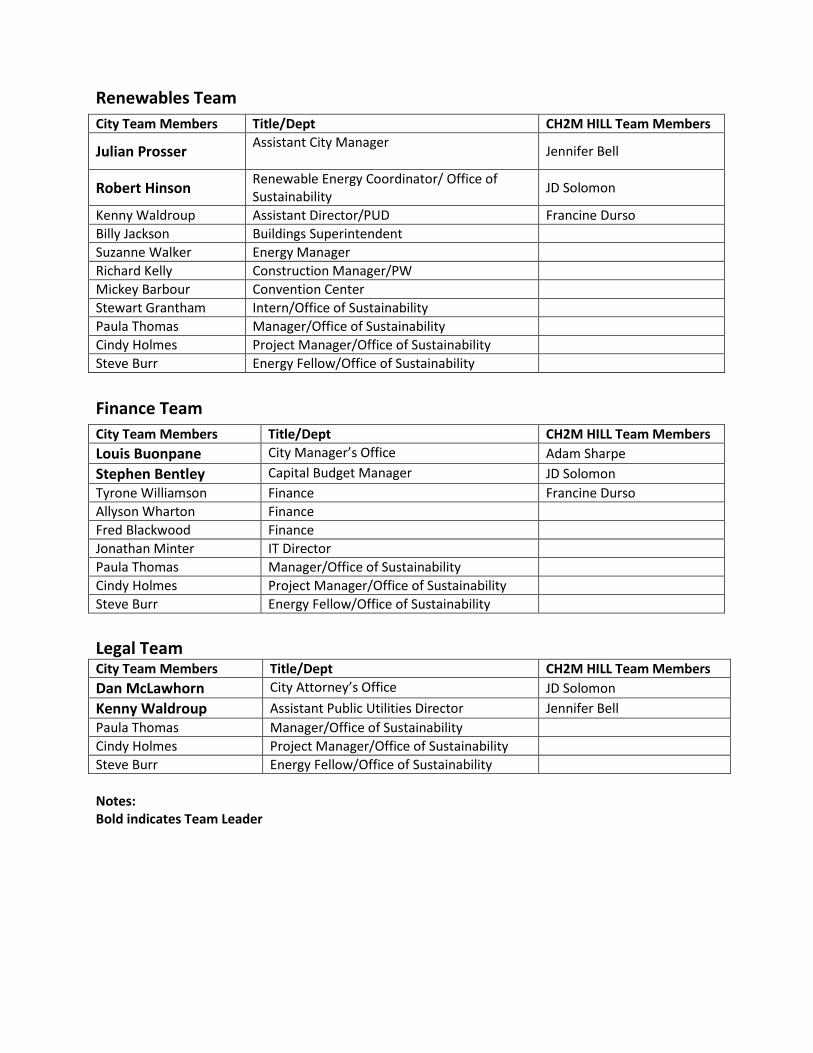
Renewables Team
City Team Members Title/Dept CH2M HILL Team Members
Julian Prosser Assistant City Manager
Jennifer Bell
Robert Hinson Renewable Energy Coordinator/ Office of Sustainability
JD Solomon
Kenny Waldroup Assistant Director/PUD Francine Durso
Billy Jackson Buildings Superintendent
Suzanne Walker Energy Manager
Richard Kelly Construction Manager/PW
Mickey Barbour Convention Center
Stewart Grantham Intern/Office of Sustainability
Paula Thomas Manager/Office of Sustainability
Cindy Holmes Project Manager/Office of Sustainability
Steve Burr Energy Fellow/Office of Sustainability
Finance Team
City Team Members Title/Dept CH2M HILL Team Members
Louis Buonpane City Manager’s Office Adam Sharpe
Stephen Bentley Capital Budget Manager JD Solomon
Tyrone Williamson Finance Francine Durso
Allyson Wharton Finance
Fred Blackwood Finance
Jonathan Minter IT Director
Paula Thomas Manager/Office of Sustainability
Cindy Holmes Project Manager/Office of Sustainability
Steve Burr Energy Fellow/Office of Sustainability
Legal Team City Team Members Title/Dept CH2M HILL Team Members
Dan McLawhorn City Attorney’s Office JD Solomon
Kenny Waldroup Assistant Public Utilities Director Jennifer Bell
Paula Thomas Manager/Office of Sustainability
Cindy Holmes Project Manager/Office of Sustainability
Steve Burr Energy Fellow/Office of Sustainability
Notes: Bold indicates Team Leader

APPENDIX 2: Team Charter & Chartering Workshop Summary
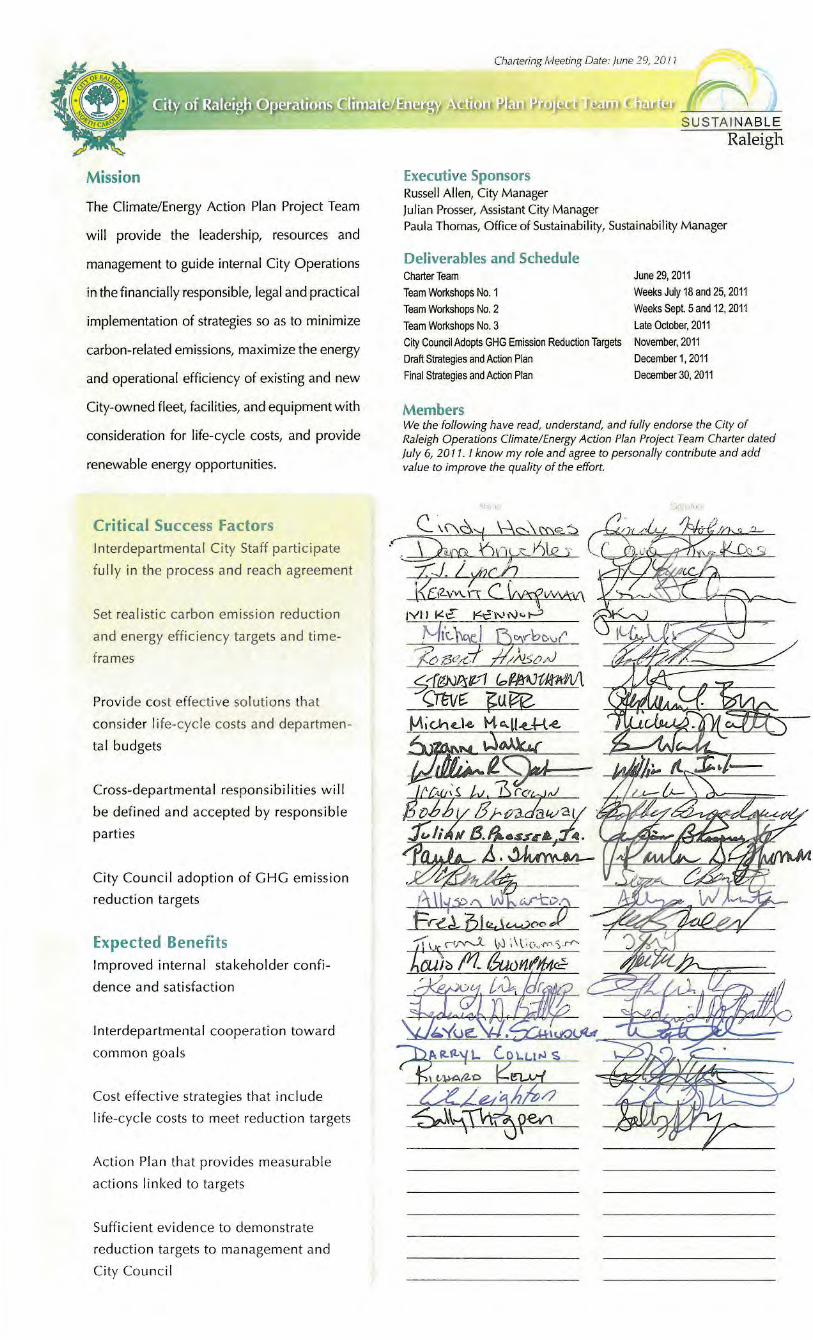
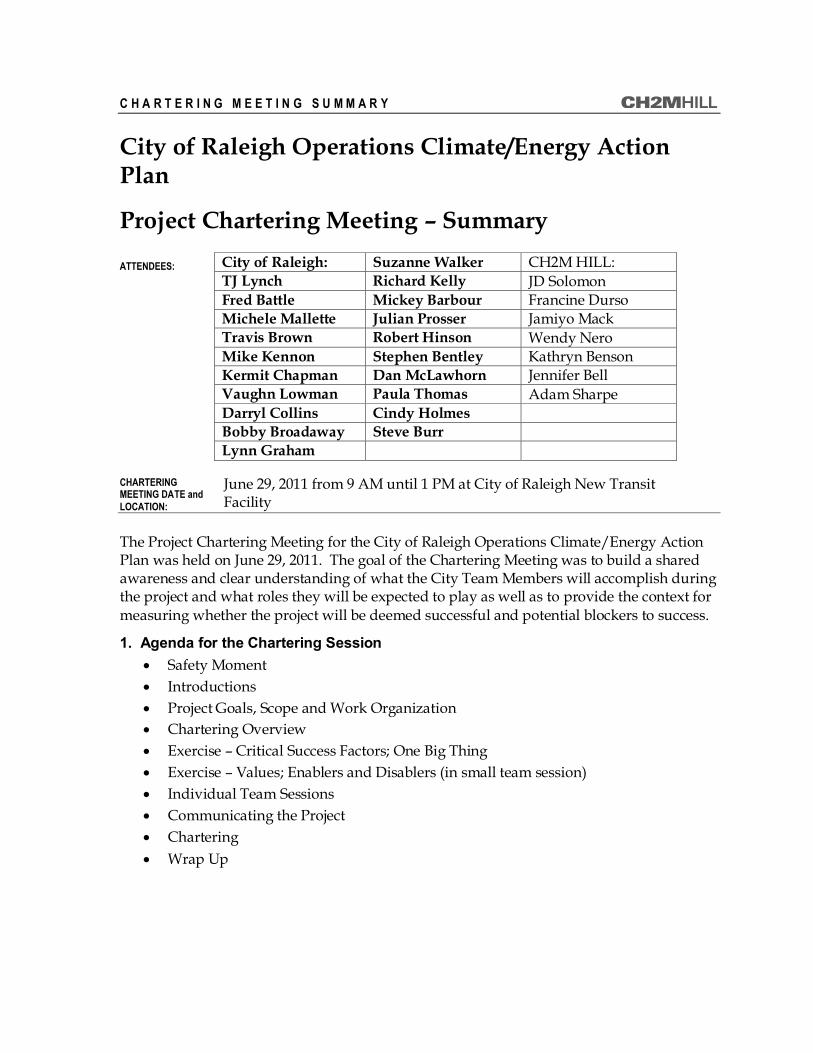
C H A R T E R I N G M E E T I N G S U M M A R Y
City of Raleigh Operations Climate/Energy Action Plan
Project Chartering Meeting – Summary
City of Raleigh: Suzanne Walker CH2M HILL: TJ Lynch Richard Kelly JD Solomon Fred Battle Mickey Barbour Francine Durso Michele Mallette Julian Prosser Jamiyo Mack Travis Brown Robert Hinson Wendy Nero Mike Kennon Stephen Bentley Kathryn Benson Kermit Chapman Dan McLawhorn Jennifer Bell Vaughn Lowman Paula Thomas Adam Sharpe Darryl Collins Cindy Holmes Bobby Broadaway Steve Burr Lynn Graham
CHARTERING MEETING DATE and
LOCATION:
June 29, 2011 from 9 AM until 1 PM at City of Raleigh New Transit Facility
The Project Chartering Meeting for the City of Raleigh Operations Climate/Energy Action Plan was held on June 29, 2011. The goal of the Chartering Meeting was to build a shared awareness and clear understanding of what the City Team Members will accomplish during the project and what roles they will be expected to play as well as to provide the context for measuring whether the project will be deemed successful and potential blockers to success.
1. Agenda for the Chartering Session Safety Moment
Introductions
Project Goals, Scope and Work Organization
Chartering Overview
Exercise – Critical Success Factors; One Big Thing
Exercise – Values; Enablers and Disablers (in small team session)
Individual Team Sessions
Communicating the Project
Chartering
Wrap Up
ATTENDEES:
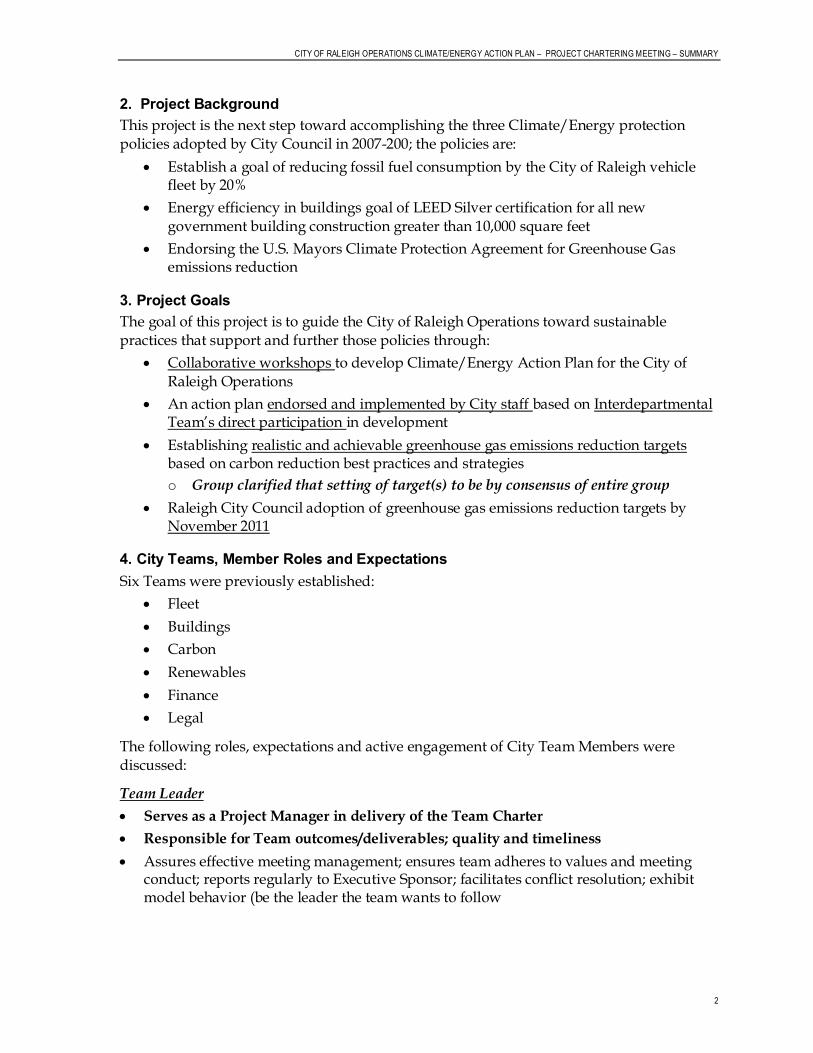
CITY OF RALEIGH OPERATIONS CLIMATE/ENERGY ACTION PLAN – PROJECT CHARTERING MEETING – SUMMARY
2
2. Project Background This project is the next step toward accomplishing the three Climate/Energy protection policies adopted by City Council in 2007-200; the policies are:
Establish a goal of reducing fossil fuel consumption by the City of Raleigh vehicle fleet by 20%
Energy efficiency in buildings goal of LEED Silver certification for all new government building construction greater than 10,000 square feet
Endorsing the U.S. Mayors Climate Protection Agreement for Greenhouse Gas emissions reduction
3. Project Goals The goal of this project is to guide the City of Raleigh Operations toward sustainable practices that support and further those policies through:
Collaborative workshops to develop Climate/Energy Action Plan for the City of Raleigh Operations
An action plan endorsed and implemented by City staff based on Interdepartmental Team’s direct participation in development
Establishing realistic and achievable greenhouse gas emissions reduction targets based on carbon reduction best practices and strategies
o Group clarified that setting of target(s) to be by consensus of entire group
Raleigh City Council adoption of greenhouse gas emissions reduction targets by November 2011
4. City Teams, Member Roles and Expectations Six Teams were previously established:
Fleet
Buildings
Carbon
Renewables
Finance
Legal
The following roles, expectations and active engagement of City Team Members were discussed:
Team Leader
Serves as a Project Manager in delivery of the Team Charter
Responsible for Team outcomes/deliverables; quality and timeliness
Assures effective meeting management; ensures team adheres to values and meeting conduct; reports regularly to Executive Sponsor; facilitates conflict resolution; exhibit model behavior (be the leader the team wants to follow
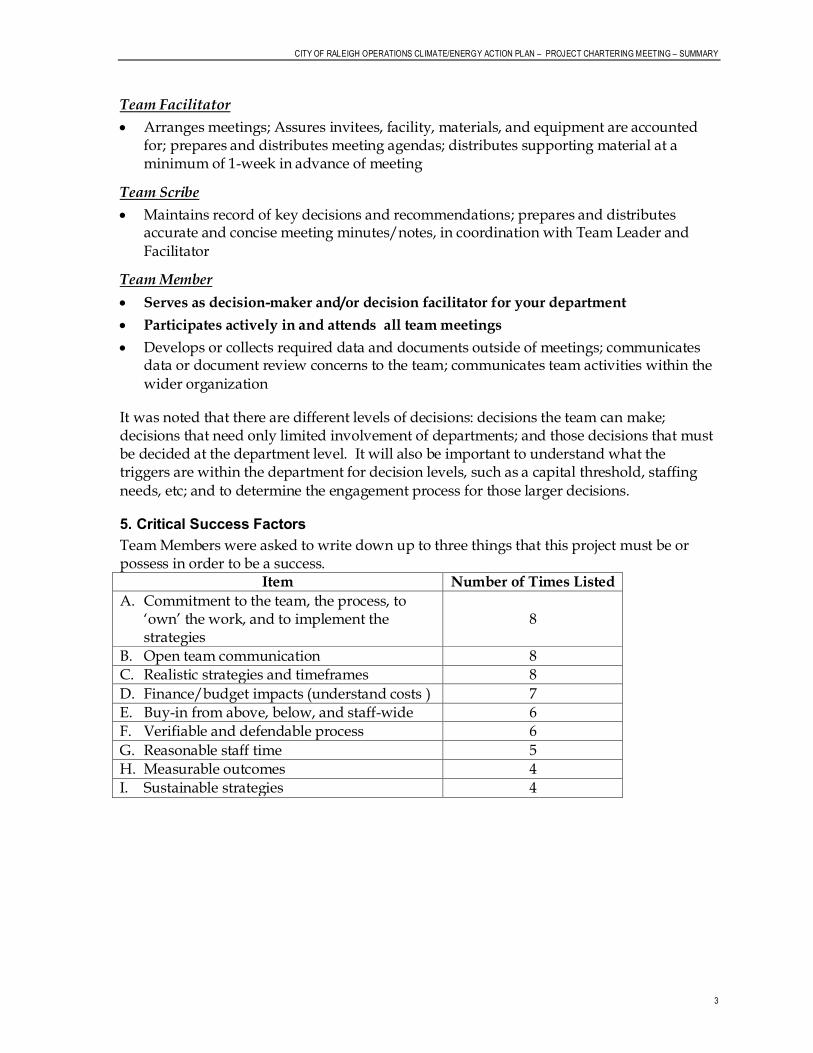
CITY OF RALEIGH OPERATIONS CLIMATE/ENERGY ACTION PLAN – PROJECT CHARTERING MEETING – SUMMARY
3
Team Facilitator
Arranges meetings; Assures invitees, facility, materials, and equipment are accounted for; prepares and distributes meeting agendas; distributes supporting material at a minimum of 1-week in advance of meeting
Team Scribe
Maintains record of key decisions and recommendations; prepares and distributes accurate and concise meeting minutes/notes, in coordination with Team Leader and Facilitator
Team Member
Serves as decision-maker and/or decision facilitator for your department
Participates actively in and attends all team meetings
Develops or collects required data and documents outside of meetings; communicates data or document review concerns to the team; communicates team activities within the wider organization
It was noted that there are different levels of decisions: decisions the team can make; decisions that need only limited involvement of departments; and those decisions that must be decided at the department level. It will also be important to understand what the triggers are within the department for decision levels, such as a capital threshold, staffing needs, etc; and to determine the engagement process for those larger decisions.
5. Critical Success Factors Team Members were asked to write down up to three things that this project must be or possess in order to be a success.
Item Number of Times Listed
A. Commitment to the team, the process, to ‘own’ the work, and to implement the strategies
8
B. Open team communication 8 C. Realistic strategies and timeframes 8
D. Finance/budget impacts (understand costs ) 7 E. Buy-in from above, below, and staff-wide 6 F. Verifiable and defendable process 6
G. Reasonable staff time 5 H. Measurable outcomes 4 I. Sustainable strategies 4
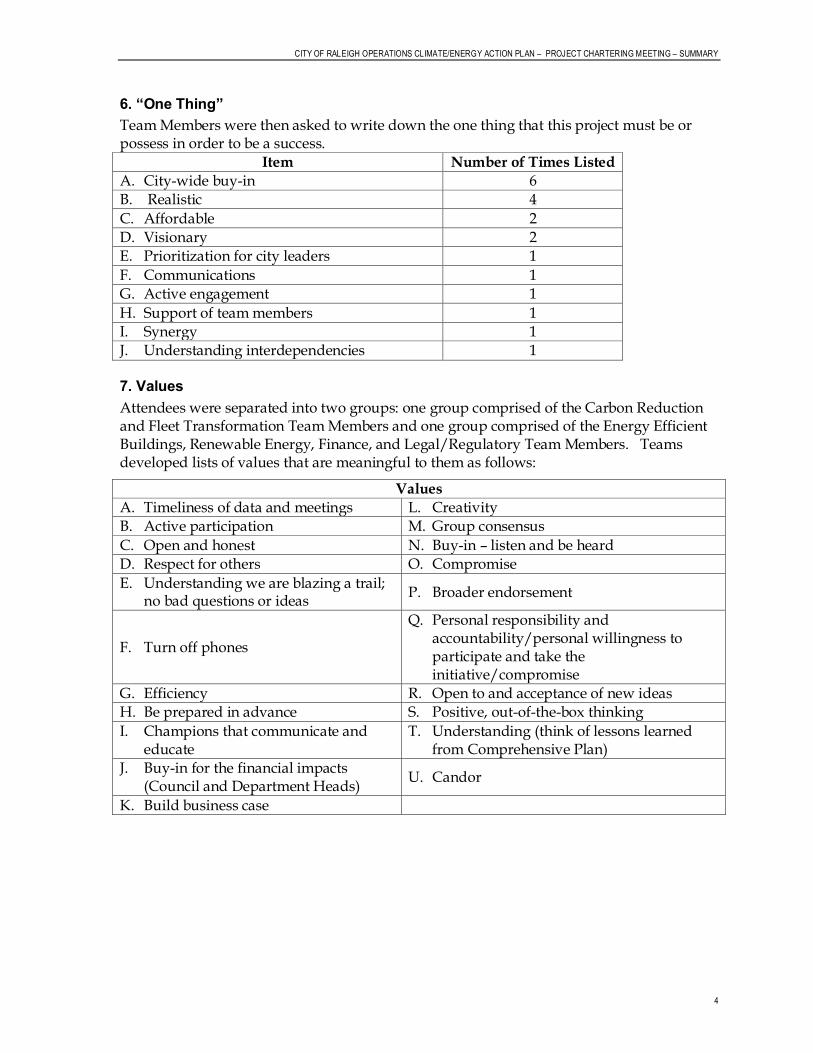
CITY OF RALEIGH OPERATIONS CLIMATE/ENERGY ACTION PLAN – PROJECT CHARTERING MEETING – SUMMARY
4
6. “One Thing” Team Members were then asked to write down the one thing that this project must be or possess in order to be a success.
Item Number of Times Listed
A. City-wide buy-in 6 B. Realistic 4
C. Affordable 2 D. Visionary 2 E. Prioritization for city leaders 1
F. Communications 1 G. Active engagement 1
H. Support of team members 1 I. Synergy 1 J. Understanding interdependencies 1 7. Values Attendees were separated into two groups: one group comprised of the Carbon Reduction and Fleet Transformation Team Members and one group comprised of the Energy Efficient Buildings, Renewable Energy, Finance, and Legal/Regulatory Team Members. Teams developed lists of values that are meaningful to them as follows:
Values
A. Timeliness of data and meetings L. Creativity B. Active participation M. Group consensus
C. Open and honest N. Buy-in – listen and be heard D. Respect for others O. Compromise
E. Understanding we are blazing a trail; no bad questions or ideas
P. Broader endorsement
F. Turn off phones
Q. Personal responsibility and accountability/personal willingness to participate and take the initiative/compromise
G. Efficiency R. Open to and acceptance of new ideas H. Be prepared in advance S. Positive, out-of-the-box thinking
I. Champions that communicate and educate
T. Understanding (think of lessons learned from Comprehensive Plan)
J. Buy-in for the financial impacts (Council and Department Heads)
U. Candor
K. Build business case
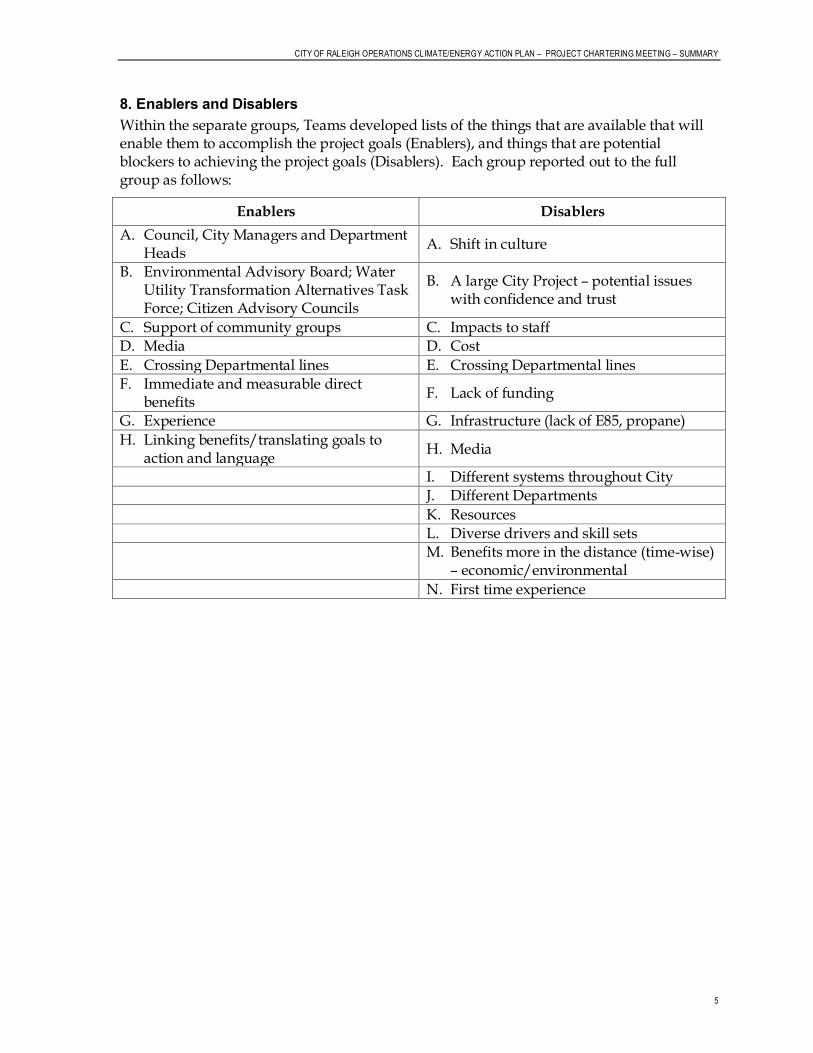
CITY OF RALEIGH OPERATIONS CLIMATE/ENERGY ACTION PLAN – PROJECT CHARTERING MEETING – SUMMARY
5
8. Enablers and Disablers Within the separate groups, Teams developed lists of the things that are available that will enable them to accomplish the project goals (Enablers), and things that are potential blockers to achieving the project goals (Disablers). Each group reported out to the full group as follows:
Enablers Disablers
A. Council, City Managers and Department Heads
A. Shift in culture
B. Environmental Advisory Board; Water Utility Transformation Alternatives Task Force; Citizen Advisory Councils
B. A large City Project – potential issues with confidence and trust
C. Support of community groups C. Impacts to staff D. Media D. Cost
E. Crossing Departmental lines E. Crossing Departmental lines F. Immediate and measurable direct
benefits F. Lack of funding
G. Experience G. Infrastructure (lack of E85, propane)
H. Linking benefits/translating goals to action and language
H. Media
I. Different systems throughout City J. Different Departments
K. Resources L. Diverse drivers and skill sets
M. Benefits more in the distance (time-wise)
– economic/environmental
N. First time experience
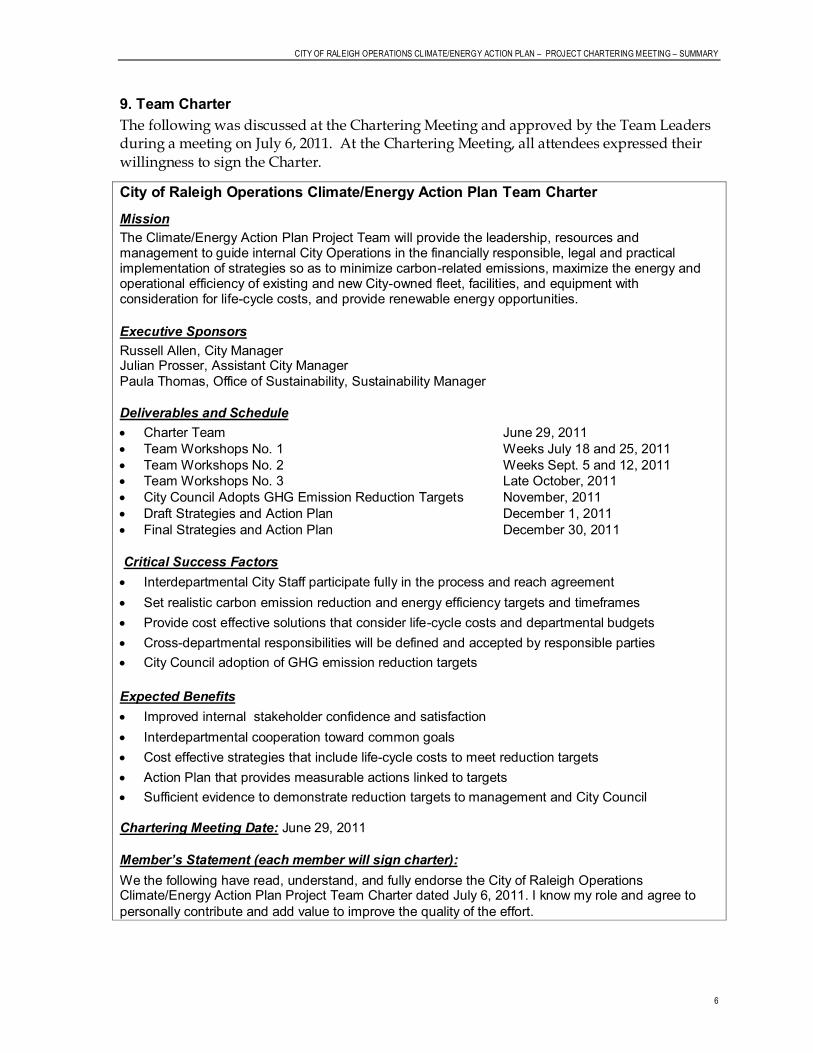
CITY OF RALEIGH OPERATIONS CLIMATE/ENERGY ACTION PLAN – PROJECT CHARTERING MEETING – SUMMARY
6
9. Team Charter The following was discussed at the Chartering Meeting and approved by the Team Leaders during a meeting on July 6, 2011. At the Chartering Meeting, all attendees expressed their willingness to sign the Charter.
City of Raleigh Operations Climate/Energy Action Plan Team Charter
Mission The Climate/Energy Action Plan Project Team will provide the leadership, resources and management to guide internal City Operations in the financially responsible, legal and practical implementation of strategies so as to minimize carbon-related emissions, maximize the energy and operational efficiency of existing and new City-owned fleet, facilities, and equipment with consideration for life-cycle costs, and provide renewable energy opportunities. Executive Sponsors Russell Allen, City Manager Julian Prosser, Assistant City Manager Paula Thomas, Office of Sustainability, Sustainability Manager
Deliverables and Schedule Charter Team June 29, 2011 Team Workshops No. 1 Weeks July 18 and 25, 2011 Team Workshops No. 2 Weeks Sept. 5 and 12, 2011 Team Workshops No. 3 Late October, 2011 City Council Adopts GHG Emission Reduction Targets November, 2011 Draft Strategies and Action Plan December 1, 2011 Final Strategies and Action Plan December 30, 2011 Critical Success Factors Interdepartmental City Staff participate fully in the process and reach agreement Set realistic carbon emission reduction and energy efficiency targets and timeframes Provide cost effective solutions that consider life-cycle costs and departmental budgets Cross-departmental responsibilities will be defined and accepted by responsible parties City Council adoption of GHG emission reduction targets Expected Benefits Improved internal stakeholder confidence and satisfaction Interdepartmental cooperation toward common goals Cost effective strategies that include life-cycle costs to meet reduction targets Action Plan that provides measurable actions linked to targets Sufficient evidence to demonstrate reduction targets to management and City Council Chartering Meeting Date: June 29, 2011 Member’s Statement (each member will sign charter): We the following have read, understand, and fully endorse the City of Raleigh Operations Climate/Energy Action Plan Project Team Charter dated July 6, 2011. I know my role and agree to personally contribute and add value to improve the quality of the effort.
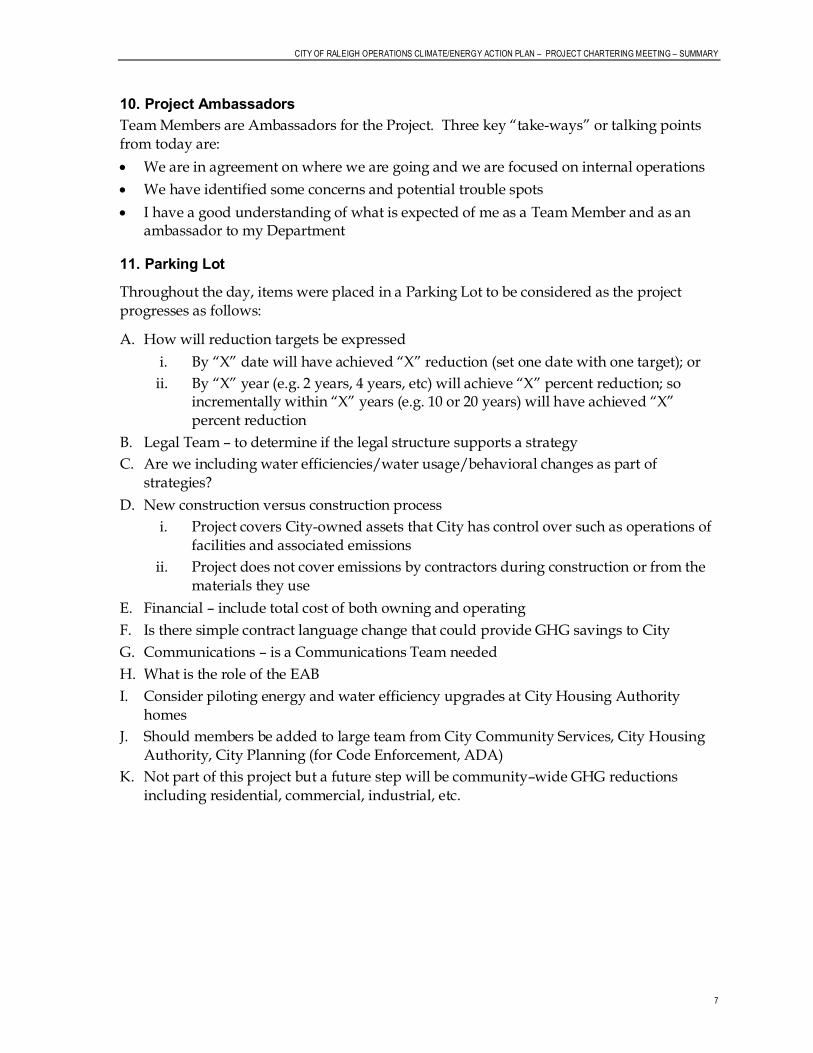
CITY OF RALEIGH OPERATIONS CLIMATE/ENERGY ACTION PLAN – PROJECT CHARTERING MEETING – SUMMARY
7
10. Project Ambassadors Team Members are Ambassadors for the Project. Three key “take-ways” or talking points from today are:
We are in agreement on where we are going and we are focused on internal operations
We have identified some concerns and potential trouble spots
I have a good understanding of what is expected of me as a Team Member and as an ambassador to my Department
11. Parking Lot
Throughout the day, items were placed in a Parking Lot to be considered as the project progresses as follows:
A. How will reduction targets be expressed
i. By “X” date will have achieved “X” reduction (set one date with one target); or
ii. By “X” year (e.g. 2 years, 4 years, etc) will achieve “X” percent reduction; so incrementally within “X” years (e.g. 10 or 20 years) will have achieved “X” percent reduction
B. Legal Team – to determine if the legal structure supports a strategy
C. Are we including water efficiencies/water usage/behavioral changes as part of strategies?
D. New construction versus construction process
i. Project covers City-owned assets that City has control over such as operations of facilities and associated emissions
ii. Project does not cover emissions by contractors during construction or from the materials they use
E. Financial – include total cost of both owning and operating
F. Is there simple contract language change that could provide GHG savings to City
G. Communications – is a Communications Team needed
H. What is the role of the EAB
I. Consider piloting energy and water efficiency upgrades at City Housing Authority homes
J. Should members be added to large team from City Community Services, City Housing Authority, City Planning (for Code Enforcement, ADA)
K. Not part of this project but a future step will be community–wide GHG reductions including residential, commercial, industrial, etc.
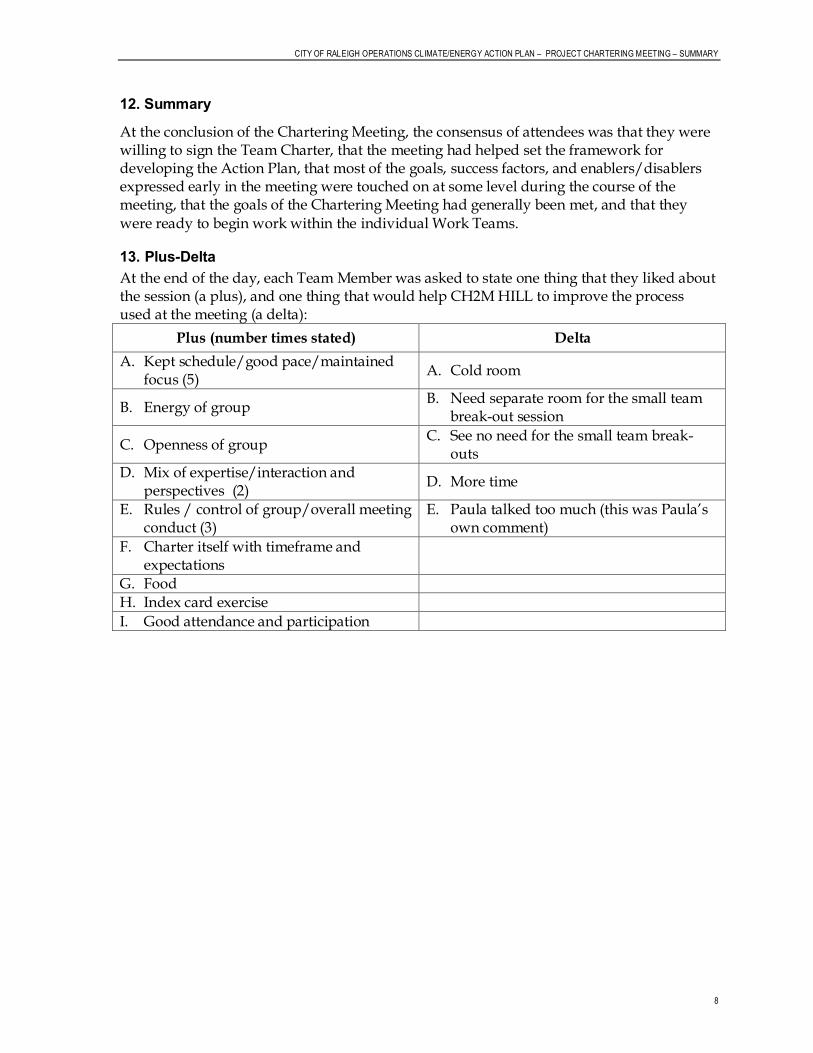
CITY OF RALEIGH OPERATIONS CLIMATE/ENERGY ACTION PLAN – PROJECT CHARTERING MEETING – SUMMARY
8
12. Summary
At the conclusion of the Chartering Meeting, the consensus of attendees was that they were willing to sign the Team Charter, that the meeting had helped set the framework for developing the Action Plan, that most of the goals, success factors, and enablers/disablers expressed early in the meeting were touched on at some level during the course of the meeting, that the goals of the Chartering Meeting had generally been met, and that they were ready to begin work within the individual Work Teams.
13. Plus-Delta At the end of the day, each Team Member was asked to state one thing that they liked about the session (a plus), and one thing that would help CH2M HILL to improve the process used at the meeting (a delta):
Plus (number times stated) Delta
A. Kept schedule/good pace/maintained focus (5)
A. Cold room
B. Energy of group B. Need separate room for the small team
break-out session
C. Openness of group C. See no need for the small team break-
outs D. Mix of expertise/interaction and
perspectives (2) D. More time
E. Rules / control of group/overall meeting conduct (3)
E. Paula talked too much (this was Paula’s own comment)
F. Charter itself with timeframe and expectations
G. Food H. Index card exercise
I. Good attendance and participation

APPENDIX 3: Project Process Overview
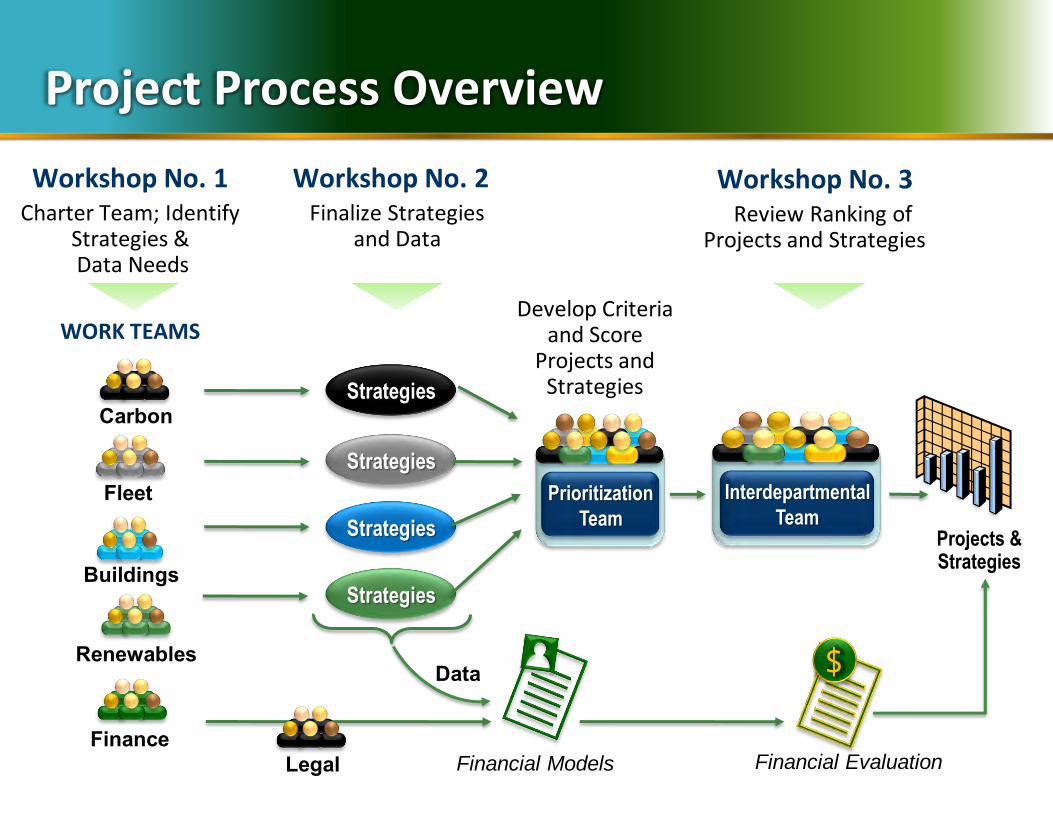
Project Process Overview
Workshop No. 1 Charter Team; Identify
Strategies & Data Needs
Workshop No. 2 Finalize Strategies
and Data
Workshop No. 3 Review Ranking of
Projects and Strategies
WORK TEAMS
Prioritization
Team
Strategies
Strategies
Strategies
Strategies
Finance Financial Models
Renewables
Buildings
Fleet
Carbon
Financial Evaluation
Projects & Strategies
$
Legal
Data
Interdepartmental
Team
Develop Criteria and Score
Projects and Strategies

APPENDIX 4: Strategies – Existing, Future, & Best Practices
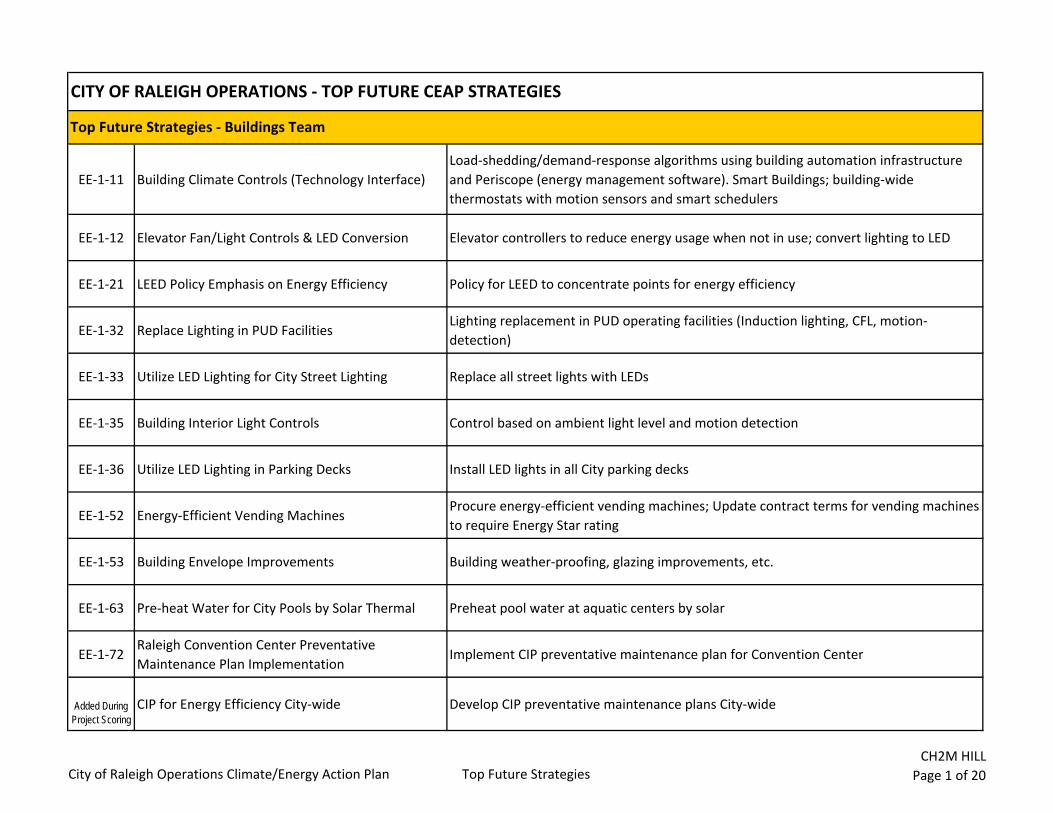
EE‐1‐11 Building Climate Controls (Technology Interface)Load‐shedding/demand‐response algorithms using building automation infrastructure and Periscope (energy management software). Smart Buildings; building‐wide thermostats with motion sensors and smart schedulers
EE‐1‐12 Elevator Fan/Light Controls & LED Conversion Elevator controllers to reduce energy usage when not in use; convert lighting to LED
EE‐1‐21 LEED Policy Emphasis on Energy Efficiency Policy for LEED to concentrate points for energy efficiency
EE‐1‐32 Replace Lighting in PUD FacilitiesLighting replacement in PUD operating facilities (Induction lighting, CFL, motion‐detection)
EE‐1‐33 Utilize LED Lighting for City Street Lighting Replace all street lights with LEDs
EE‐1‐35 Building Interior Light Controls Control based on ambient light level and motion detection
EE‐1‐36 Utilize LED Lighting in Parking Decks Install LED lights in all City parking decks
EE‐1‐52 Energy‐Efficient Vending MachinesProcure energy‐efficient vending machines; Update contract terms for vending machines to require Energy Star rating
EE‐1‐53 Building Envelope Improvements Building weather‐proofing, glazing improvements, etc.
EE‐1‐63 Pre‐heat Water for City Pools by Solar Thermal Preheat pool water at aquatic centers by solar
EE‐1‐72Raleigh Convention Center Preventative Maintenance Plan Implementation
Implement CIP preventative maintenance plan for Convention Center
Added During Project Scoring
CIP for Energy Efficiency City‐wide Develop CIP preventative maintenance plans City‐wide
Top Future Strategies ‐ Buildings Team
CITY OF RALEIGH OPERATIONS ‐ TOP FUTURE CEAP STRATEGIES
City of Raleigh Operations Climate/Energy Action Plan Top Future StrategiesCH2M HILL
Page 1 of 20
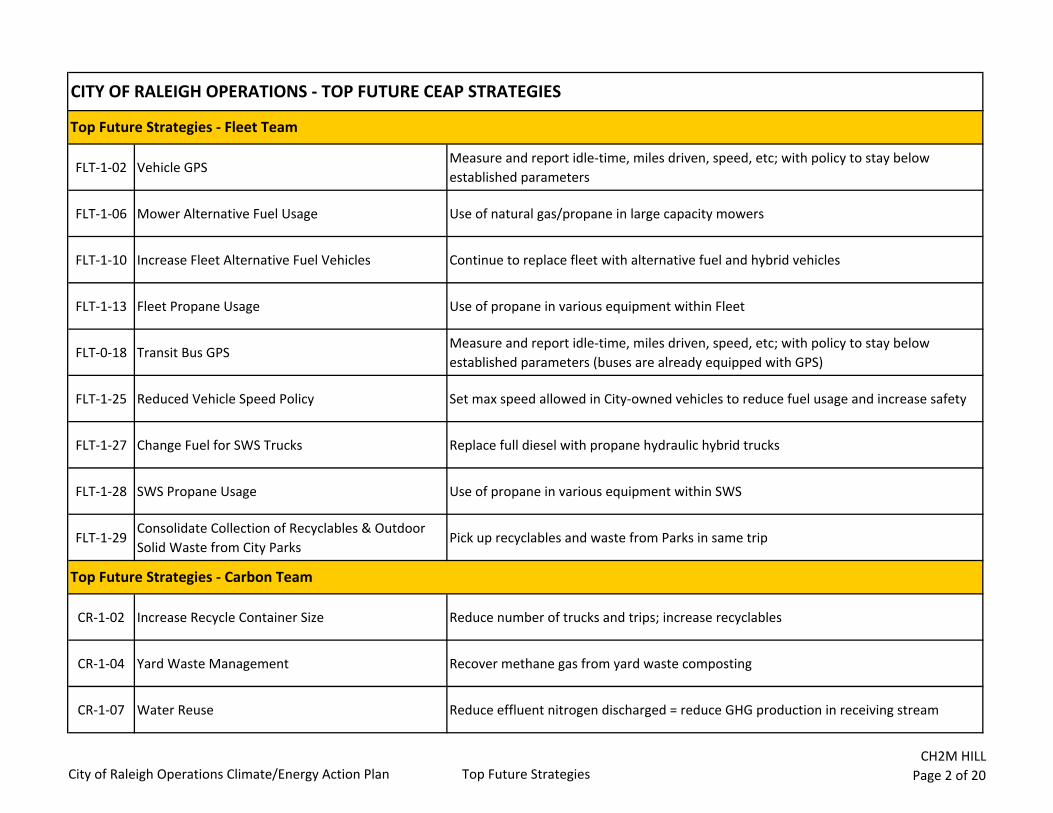
CITY OF RALEIGH OPERATIONS ‐ TOP FUTURE CEAP STRATEGIES
FLT‐1‐02 Vehicle GPS Measure and report idle‐time, miles driven, speed, etc; with policy to stay below established parameters
FLT‐1‐06 Mower Alternative Fuel Usage Use of natural gas/propane in large capacity mowers
FLT‐1‐10 Increase Fleet Alternative Fuel Vehicles Continue to replace fleet with alternative fuel and hybrid vehicles
FLT‐1‐13 Fleet Propane Usage Use of propane in various equipment within Fleet
FLT‐0‐18 Transit Bus GPSMeasure and report idle‐time, miles driven, speed, etc; with policy to stay below established parameters (buses are already equipped with GPS)
FLT‐1‐25 Reduced Vehicle Speed Policy Set max speed allowed in City‐owned vehicles to reduce fuel usage and increase safety
FLT‐1‐27 Change Fuel for SWS Trucks Replace full diesel with propane hydraulic hybrid trucks
FLT‐1‐28 SWS Propane Usage Use of propane in various equipment within SWS
FLT‐1‐29Consolidate Collection of Recyclables & Outdoor Solid Waste from City Parks
Pick up recyclables and waste from Parks in same trip
CR‐1‐02 Increase Recycle Container Size Reduce number of trucks and trips; increase recyclables
CR‐1‐04 Yard Waste Management Recover methane gas from yard waste composting
CR‐1‐07 Water Reuse Reduce effluent nitrogen discharged = reduce GHG production in receiving stream
Top Future Strategies ‐ Carbon Team
Top Future Strategies ‐ Fleet Team
City of Raleigh Operations Climate/Energy Action Plan Top Future StrategiesCH2M HILL
Page 2 of 20
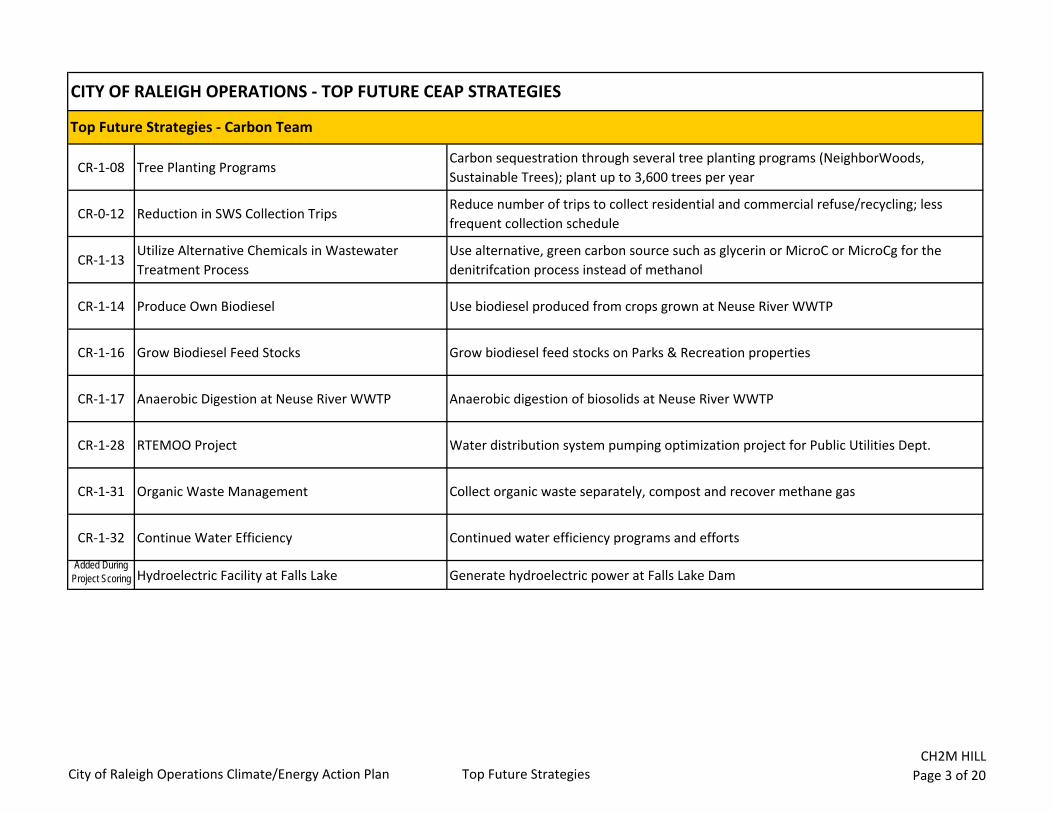
CITY OF RALEIGH OPERATIONS ‐ TOP FUTURE CEAP STRATEGIES
CR‐1‐08 Tree Planting ProgramsCarbon sequestration through several tree planting programs (NeighborWoods, Sustainable Trees); plant up to 3,600 trees per year
CR‐0‐12 Reduction in SWS Collection Trips Reduce number of trips to collect residential and commercial refuse/recycling; less frequent collection schedule
CR‐1‐13Utilize Alternative Chemicals in Wastewater Treatment Process
Use alternative, green carbon source such as glycerin or MicroC or MicroCg for the denitrifcation process instead of methanol
CR‐1‐14 Produce Own Biodiesel Use biodiesel produced from crops grown at Neuse River WWTP
CR‐1‐16 Grow Biodiesel Feed Stocks Grow biodiesel feed stocks on Parks & Recreation properties
CR‐1‐17 Anaerobic Digestion at Neuse River WWTP Anaerobic digestion of biosolids at Neuse River WWTP
CR‐1‐28 RTEMOO Project Water distribution system pumping optimization project for Public Utilities Dept.
CR‐1‐31 Organic Waste Management Collect organic waste separately, compost and recover methane gas
CR‐1‐32 Continue Water Efficiency Continued water efficiency programs and efforts
Added During Project Scoring Hydroelectric Facility at Falls Lake Generate hydroelectric power at Falls Lake Dam
Top Future Strategies ‐ Carbon Team
City of Raleigh Operations Climate/Energy Action Plan Top Future StrategiesCH2M HILL
Page 3 of 20
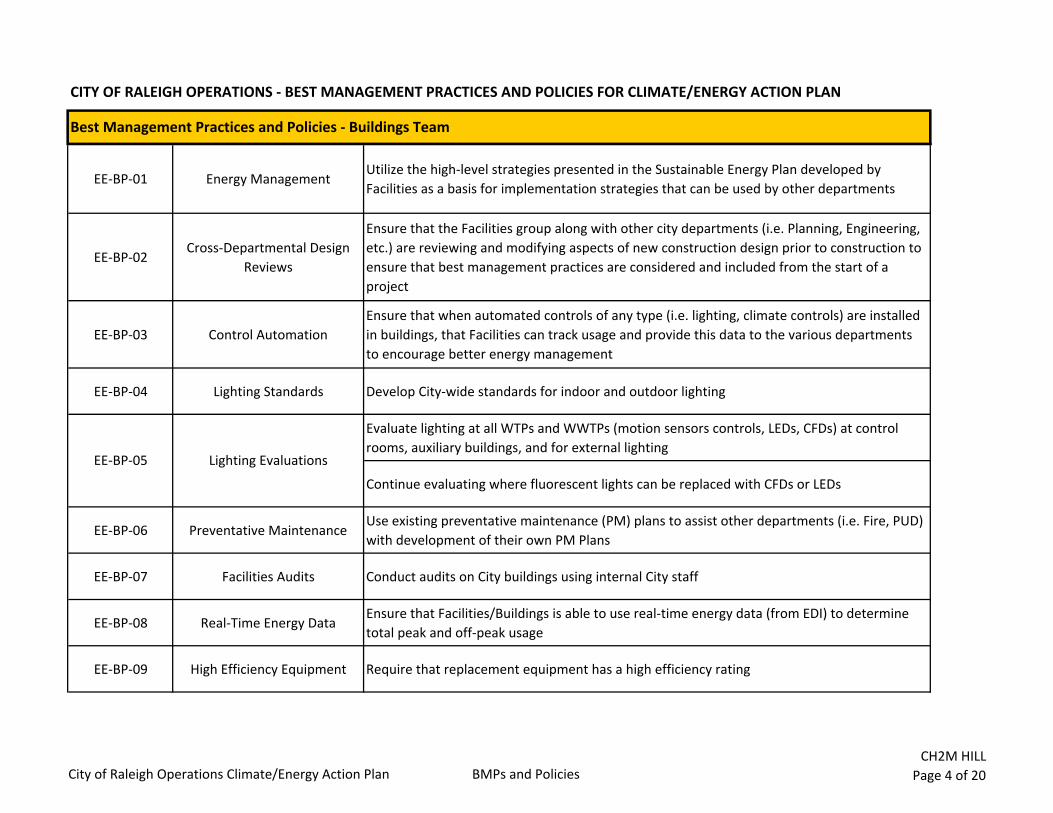
CITY OF RALEIGH OPERATIONS ‐ BEST MANAGEMENT PRACTICES AND POLICIES FOR CLIMATE/ENERGY ACTION PLAN
EE‐BP‐01 Energy ManagementUtilize the high‐level strategies presented in the Sustainable Energy Plan developed by Facilities as a basis for implementation strategies that can be used by other departments
EE‐BP‐02Cross‐Departmental Design
Reviews
Ensure that the Facilities group along with other city departments (i.e. Planning, Engineering, etc.) are reviewing and modifying aspects of new construction design prior to construction to ensure that best management practices are considered and included from the start of a project
EE‐BP‐03 Control AutomationEnsure that when automated controls of any type (i.e. lighting, climate controls) are installed in buildings, that Facilities can track usage and provide this data to the various departments to encourage better energy management
EE‐BP‐04 Lighting Standards Develop City‐wide standards for indoor and outdoor lighting
Evaluate lighting at all WTPs and WWTPs (motion sensors controls, LEDs, CFDs) at control rooms, auxiliary buildings, and for external lighting
Continue evaluating where fluorescent lights can be replaced with CFDs or LEDs
EE‐BP‐06 Preventative MaintenanceUse existing preventative maintenance (PM) plans to assist other departments (i.e. Fire, PUD) with development of their own PM Plans
EE‐BP‐07 Facilities Audits Conduct audits on City buildings using internal City staff
EE‐BP‐08 Real‐Time Energy DataEnsure that Facilities/Buildings is able to use real‐time energy data (from EDI) to determine total peak and off‐peak usage
EE‐BP‐09 High Efficiency Equipment Require that replacement equipment has a high efficiency rating
Best Management Practices and Policies ‐ Buildings Team
EE‐BP‐05 Lighting Evaluations
City of Raleigh Operations Climate/Energy Action Plan BMPs and PoliciesCH2M HILL
Page 4 of 20
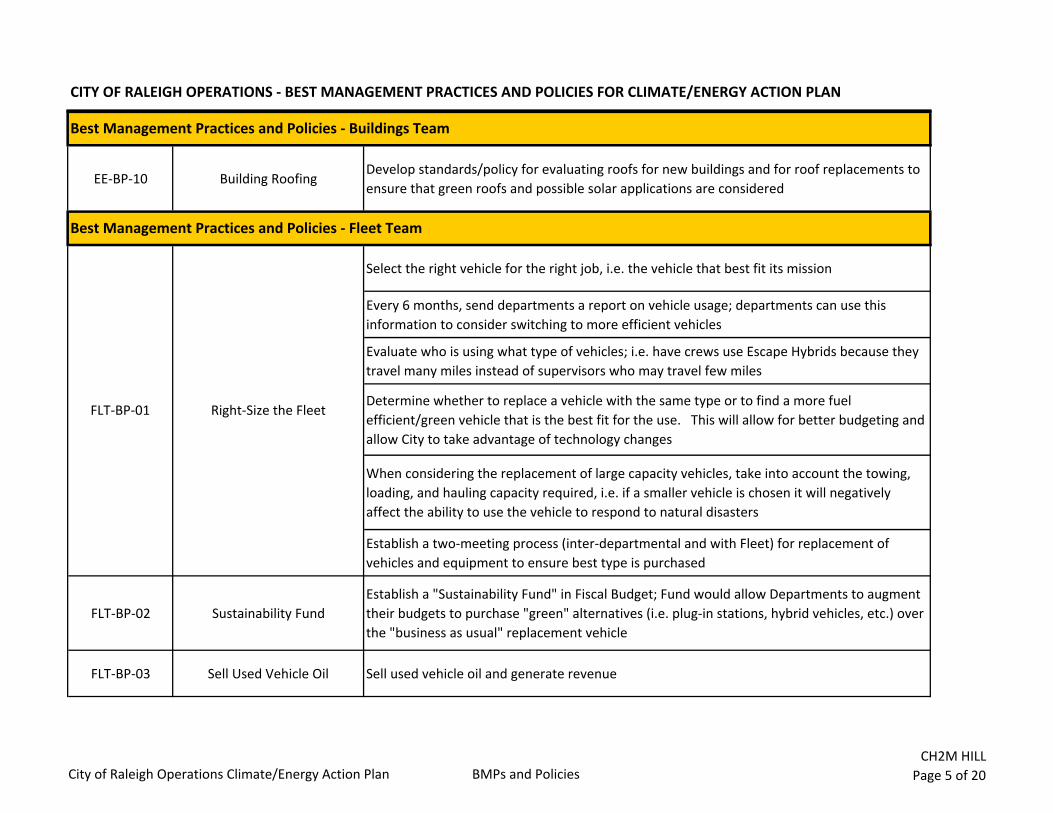
CITY OF RALEIGH OPERATIONS ‐ BEST MANAGEMENT PRACTICES AND POLICIES FOR CLIMATE/ENERGY ACTION PLAN
EE‐BP‐10 Building RoofingDevelop standards/policy for evaluating roofs for new buildings and for roof replacements to ensure that green roofs and possible solar applications are considered
Select the right vehicle for the right job, i.e. the vehicle that best fit its mission
Every 6 months, send departments a report on vehicle usage; departments can use this information to consider switching to more efficient vehicles
Evaluate who is using what type of vehicles; i.e. have crews use Escape Hybrids because they travel many miles instead of supervisors who may travel few miles
Determine whether to replace a vehicle with the same type or to find a more fuel efficient/green vehicle that is the best fit for the use. This will allow for better budgeting and allow City to take advantage of technology changes
When considering the replacement of large capacity vehicles, take into account the towing, loading, and hauling capacity required, i.e. if a smaller vehicle is chosen it will negatively affect the ability to use the vehicle to respond to natural disasters
Establish a two‐meeting process (inter‐departmental and with Fleet) for replacement of vehicles and equipment to ensure best type is purchased
FLT‐BP‐02 Sustainability FundEstablish a "Sustainability Fund" in Fiscal Budget; Fund would allow Departments to augment their budgets to purchase "green" alternatives (i.e. plug‐in stations, hybrid vehicles, etc.) over the "business as usual" replacement vehicle
FLT‐BP‐03 Sell Used Vehicle Oil Sell used vehicle oil and generate revenue
Best Management Practices and Policies ‐ Buildings Team
FLT‐BP‐01 Right‐Size the Fleet
Best Management Practices and Policies ‐ Fleet Team
City of Raleigh Operations Climate/Energy Action Plan BMPs and PoliciesCH2M HILL
Page 5 of 20
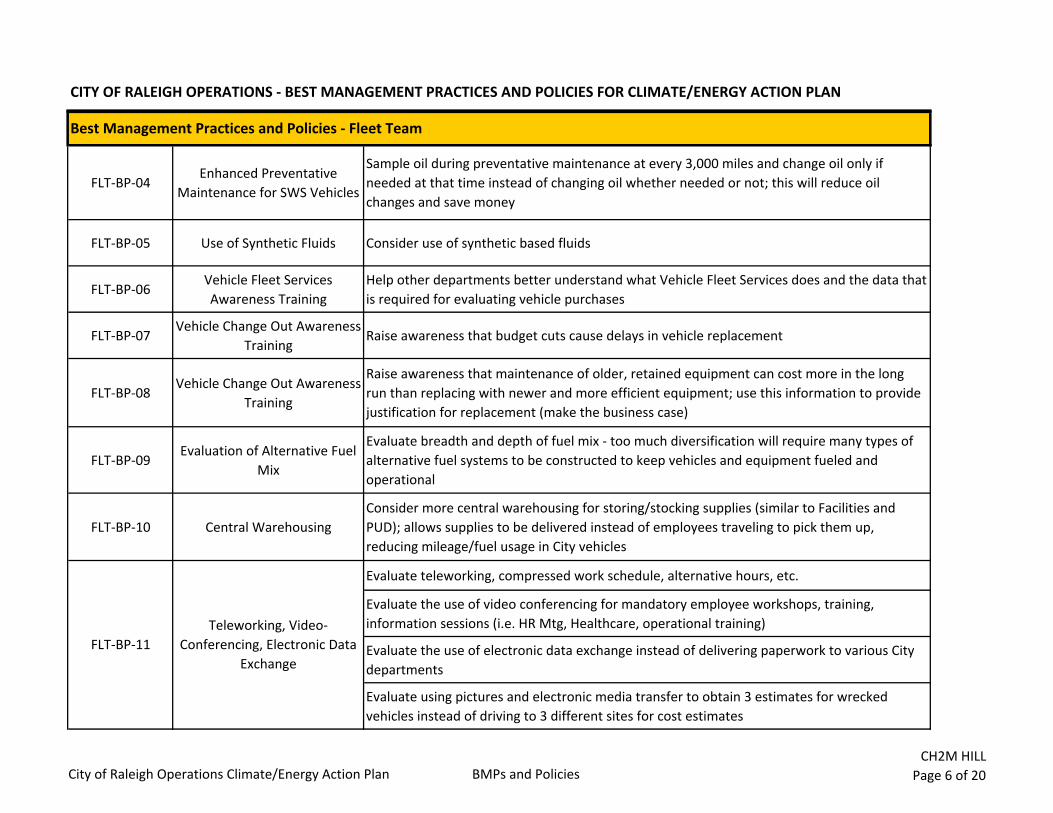
CITY OF RALEIGH OPERATIONS ‐ BEST MANAGEMENT PRACTICES AND POLICIES FOR CLIMATE/ENERGY ACTION PLAN
FLT‐BP‐04Enhanced Preventative
Maintenance for SWS Vehicles
Sample oil during preventative maintenance at every 3,000 miles and change oil only if needed at that time instead of changing oil whether needed or not; this will reduce oil changes and save money
FLT‐BP‐05 Use of Synthetic Fluids Consider use of synthetic based fluids
FLT‐BP‐06Vehicle Fleet Services Awareness Training
Help other departments better understand what Vehicle Fleet Services does and the data that is required for evaluating vehicle purchases
FLT‐BP‐07Vehicle Change Out Awareness
TrainingRaise awareness that budget cuts cause delays in vehicle replacement
FLT‐BP‐08Vehicle Change Out Awareness
Training
Raise awareness that maintenance of older, retained equipment can cost more in the long run than replacing with newer and more efficient equipment; use this information to provide justification for replacement (make the business case)
FLT‐BP‐09Evaluation of Alternative Fuel
Mix
Evaluate breadth and depth of fuel mix ‐ too much diversification will require many types of alternative fuel systems to be constructed to keep vehicles and equipment fueled and operational
FLT‐BP‐10 Central WarehousingConsider more central warehousing for storing/stocking supplies (similar to Facilities and PUD); allows supplies to be delivered instead of employees traveling to pick them up, reducing mileage/fuel usage in City vehicles
Evaluate teleworking, compressed work schedule, alternative hours, etc.
Evaluate the use of video conferencing for mandatory employee workshops, training, information sessions (i.e. HR Mtg, Healthcare, operational training)
Evaluate the use of electronic data exchange instead of delivering paperwork to various City departments
Evaluate using pictures and electronic media transfer to obtain 3 estimates for wrecked vehicles instead of driving to 3 different sites for cost estimates
Best Management Practices and Policies ‐ Fleet Team
Teleworking, Video‐Conferencing, Electronic Data
ExchangeFLT‐BP‐11
City of Raleigh Operations Climate/Energy Action Plan BMPs and PoliciesCH2M HILL
Page 6 of 20
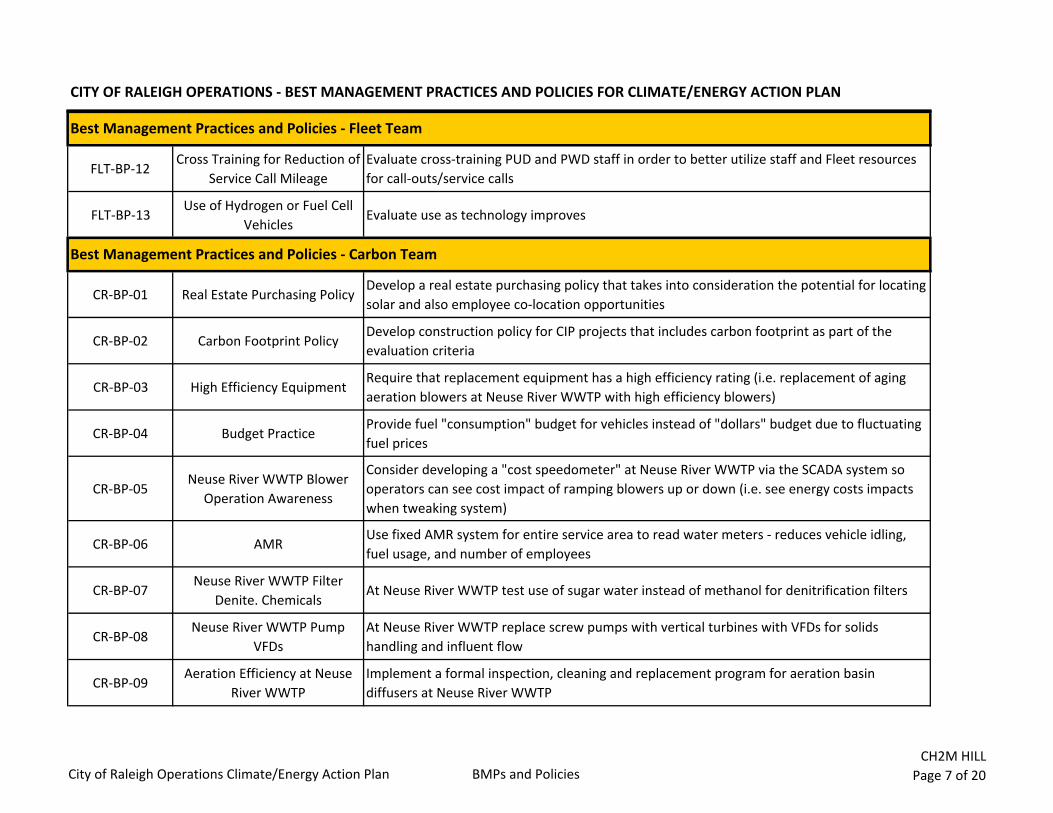
CITY OF RALEIGH OPERATIONS ‐ BEST MANAGEMENT PRACTICES AND POLICIES FOR CLIMATE/ENERGY ACTION PLAN
FLT‐BP‐12Cross Training for Reduction of
Service Call MileageEvaluate cross‐training PUD and PWD staff in order to better utilize staff and Fleet resources for call‐outs/service calls
FLT‐BP‐13Use of Hydrogen or Fuel Cell
VehiclesEvaluate use as technology improves
CR‐BP‐01 Real Estate Purchasing PolicyDevelop a real estate purchasing policy that takes into consideration the potential for locating solar and also employee co‐location opportunities
CR‐BP‐02 Carbon Footprint PolicyDevelop construction policy for CIP projects that includes carbon footprint as part of the evaluation criteria
CR‐BP‐03 High Efficiency EquipmentRequire that replacement equipment has a high efficiency rating (i.e. replacement of aging aeration blowers at Neuse River WWTP with high efficiency blowers)
CR‐BP‐04 Budget PracticeProvide fuel "consumption" budget for vehicles instead of "dollars" budget due to fluctuating fuel prices
CR‐BP‐05Neuse River WWTP Blower
Operation Awareness
Consider developing a "cost speedometer" at Neuse River WWTP via the SCADA system so operators can see cost impact of ramping blowers up or down (i.e. see energy costs impacts when tweaking system)
CR‐BP‐06 AMRUse fixed AMR system for entire service area to read water meters ‐ reduces vehicle idling, fuel usage, and number of employees
CR‐BP‐07Neuse River WWTP Filter
Denite. ChemicalsAt Neuse River WWTP test use of sugar water instead of methanol for denitrification filters
CR‐BP‐08Neuse River WWTP Pump
VFDsAt Neuse River WWTP replace screw pumps with vertical turbines with VFDs for solids handling and influent flow
CR‐BP‐09Aeration Efficiency at Neuse
River WWTPImplement a formal inspection, cleaning and replacement program for aeration basin diffusers at Neuse River WWTP
Best Management Practices and Policies ‐ Fleet Team
Best Management Practices and Policies ‐ Carbon Team
City of Raleigh Operations Climate/Energy Action Plan BMPs and PoliciesCH2M HILL
Page 7 of 20
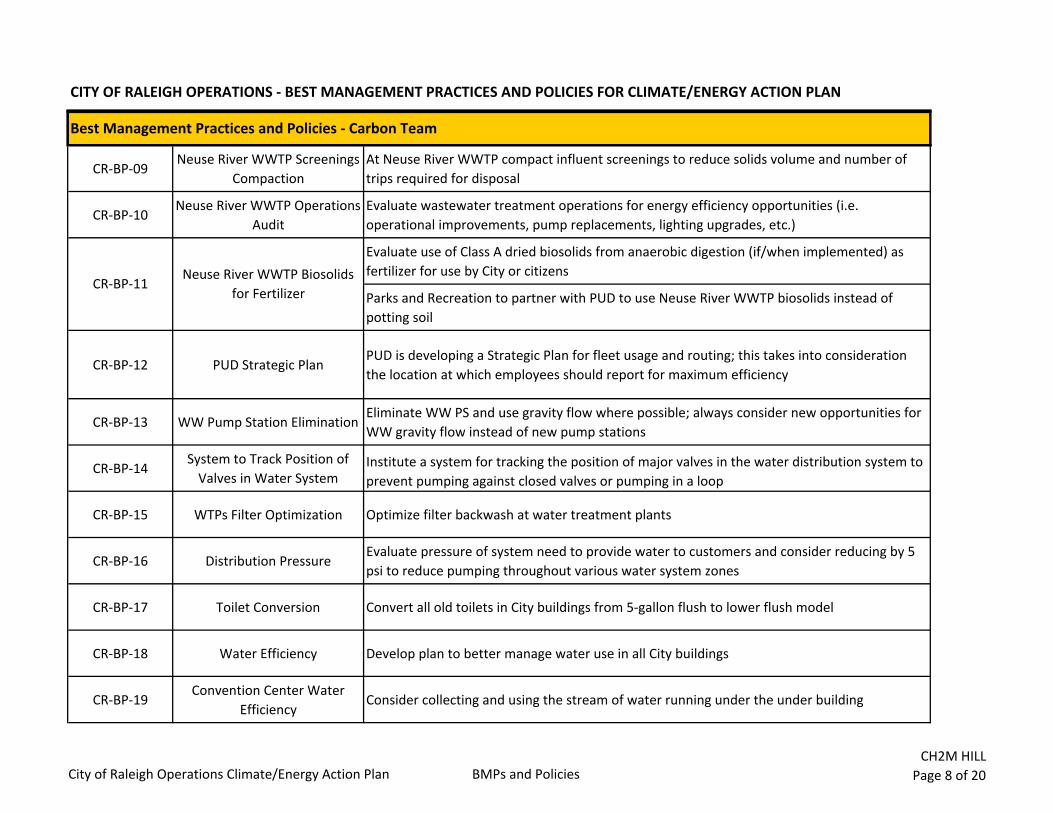
CITY OF RALEIGH OPERATIONS ‐ BEST MANAGEMENT PRACTICES AND POLICIES FOR CLIMATE/ENERGY ACTION PLAN
CR‐BP‐09Neuse River WWTP Screenings
Compaction At Neuse River WWTP compact influent screenings to reduce solids volume and number of trips required for disposal
CR‐BP‐10Neuse River WWTP Operations
AuditEvaluate wastewater treatment operations for energy efficiency opportunities (i.e. operational improvements, pump replacements, lighting upgrades, etc.)
Evaluate use of Class A dried biosolids from anaerobic digestion (if/when implemented) as fertilizer for use by City or citizens
Parks and Recreation to partner with PUD to use Neuse River WWTP biosolids instead of potting soil
CR‐BP‐12 PUD Strategic PlanPUD is developing a Strategic Plan for fleet usage and routing; this takes into consideration the location at which employees should report for maximum efficiency
CR‐BP‐13 WW Pump Station EliminationEliminate WW PS and use gravity flow where possible; always consider new opportunities for WW gravity flow instead of new pump stations
CR‐BP‐14System to Track Position of Valves in Water System
Institute a system for tracking the position of major valves in the water distribution system to prevent pumping against closed valves or pumping in a loop
CR‐BP‐15 WTPs Filter Optimization Optimize filter backwash at water treatment plants
CR‐BP‐16 Distribution PressureEvaluate pressure of system need to provide water to customers and consider reducing by 5 psi to reduce pumping throughout various water system zones
CR‐BP‐17 Toilet Conversion Convert all old toilets in City buildings from 5‐gallon flush to lower flush model
CR‐BP‐18 Water Efficiency Develop plan to better manage water use in all City buildings
CR‐BP‐19Convention Center Water
EfficiencyConsider collecting and using the stream of water running under the under building
CR‐BP‐11Neuse River WWTP Biosolids
for Fertilizer
Best Management Practices and Policies ‐ Carbon Team
City of Raleigh Operations Climate/Energy Action Plan BMPs and PoliciesCH2M HILL
Page 8 of 20
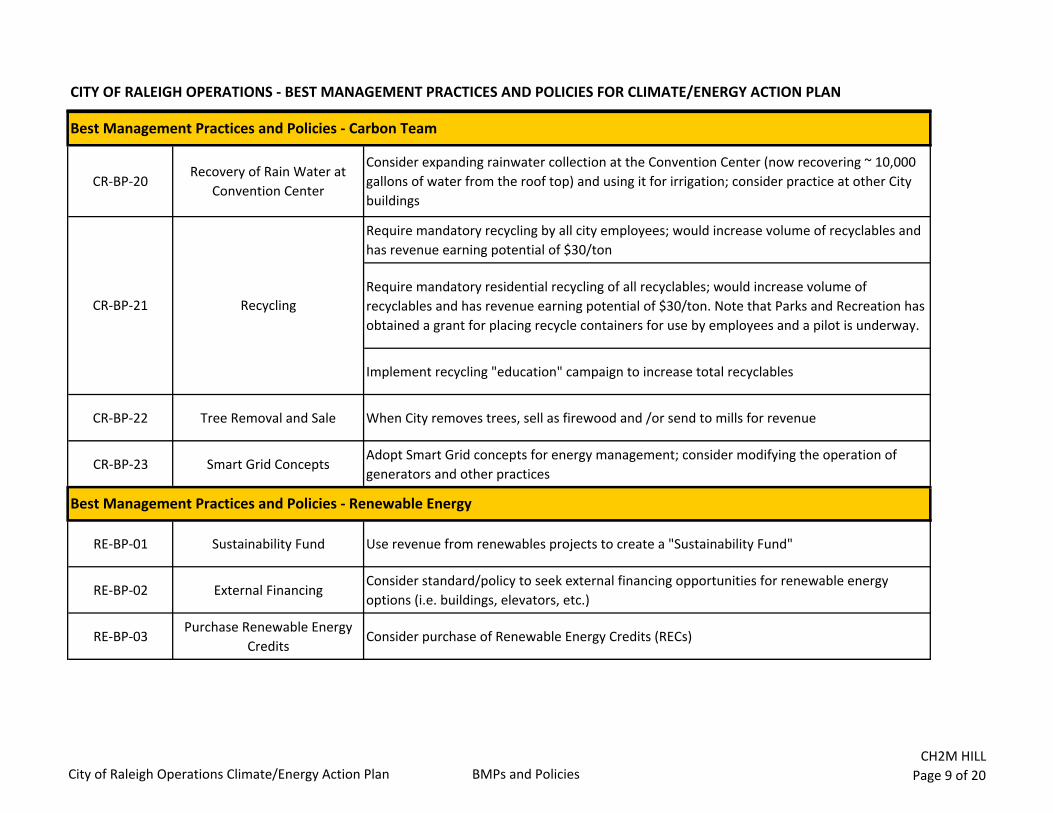
CITY OF RALEIGH OPERATIONS ‐ BEST MANAGEMENT PRACTICES AND POLICIES FOR CLIMATE/ENERGY ACTION PLAN
CR‐BP‐20Recovery of Rain Water at
Convention Center
Consider expanding rainwater collection at the Convention Center (now recovering ~ 10,000 gallons of water from the roof top) and using it for irrigation; consider practice at other City buildings
Require mandatory recycling by all city employees; would increase volume of recyclables and has revenue earning potential of $30/ton
Require mandatory residential recycling of all recyclables; would increase volume of recyclables and has revenue earning potential of $30/ton. Note that Parks and Recreation has obtained a grant for placing recycle containers for use by employees and a pilot is underway.
Implement recycling "education" campaign to increase total recyclables
CR‐BP‐22 Tree Removal and Sale When City removes trees, sell as firewood and /or send to mills for revenue
CR‐BP‐23 Smart Grid ConceptsAdopt Smart Grid concepts for energy management; consider modifying the operation of generators and other practices
RE‐BP‐01 Sustainability Fund Use revenue from renewables projects to create a "Sustainability Fund"
RE‐BP‐02 External FinancingConsider standard/policy to seek external financing opportunities for renewable energy options (i.e. buildings, elevators, etc.)
RE‐BP‐03Purchase Renewable Energy
CreditsConsider purchase of Renewable Energy Credits (RECs)
CR‐BP‐21 Recycling
Best Management Practices and Policies ‐ Carbon Team
Best Management Practices and Policies ‐ Renewable Energy
City of Raleigh Operations Climate/Energy Action Plan BMPs and PoliciesCH2M HILL
Page 9 of 20
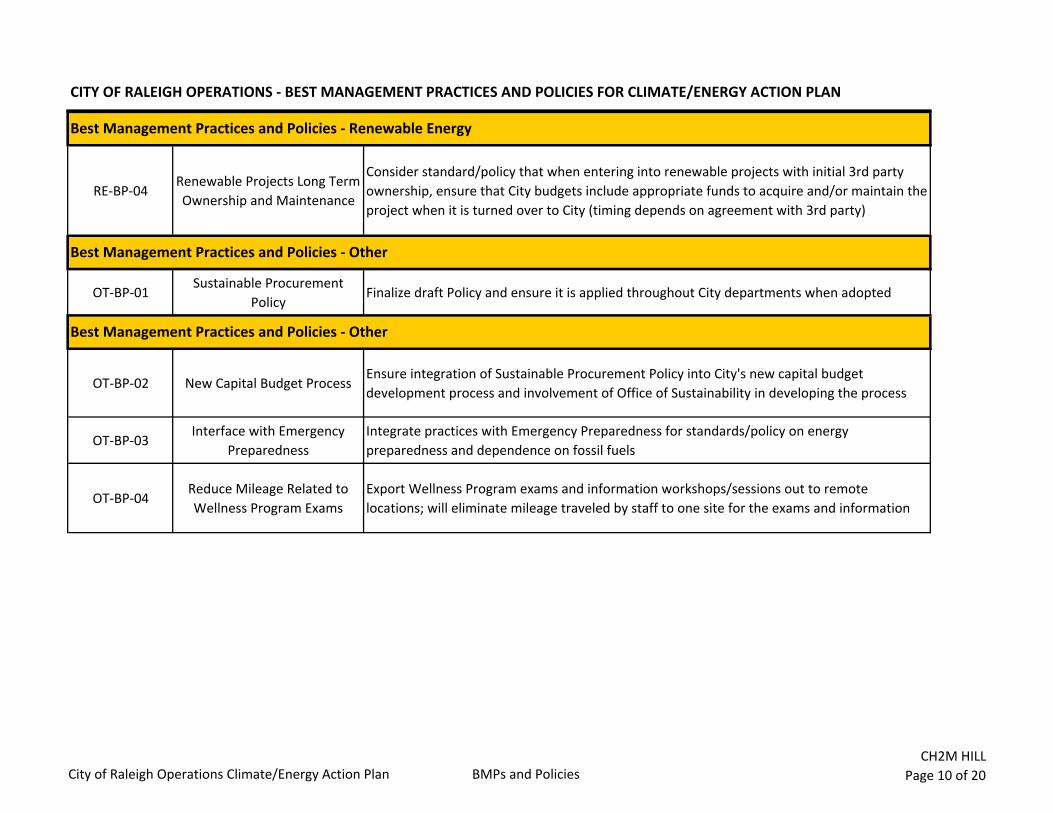
CITY OF RALEIGH OPERATIONS ‐ BEST MANAGEMENT PRACTICES AND POLICIES FOR CLIMATE/ENERGY ACTION PLAN
RE‐BP‐04Renewable Projects Long Term Ownership and Maintenance
Consider standard/policy that when entering into renewable projects with initial 3rd party ownership, ensure that City budgets include appropriate funds to acquire and/or maintain the project when it is turned over to City (timing depends on agreement with 3rd party)
OT‐BP‐01Sustainable Procurement
PolicyFinalize draft Policy and ensure it is applied throughout City departments when adopted
OT‐BP‐02 New Capital Budget ProcessEnsure integration of Sustainable Procurement Policy into City's new capital budget development process and involvement of Office of Sustainability in developing the process
OT‐BP‐03Interface with Emergency
PreparednessIntegrate practices with Emergency Preparedness for standards/policy on energy preparedness and dependence on fossil fuels
OT‐BP‐04Reduce Mileage Related to Wellness Program Exams
Export Wellness Program exams and information workshops/sessions out to remote locations; will eliminate mileage traveled by staff to one site for the exams and information
Best Management Practices and Policies ‐ Other
Best Management Practices and Policies ‐ Renewable Energy
Best Management Practices and Policies ‐ Other
City of Raleigh Operations Climate/Energy Action Plan BMPs and PoliciesCH2M HILL
Page 10 of 20
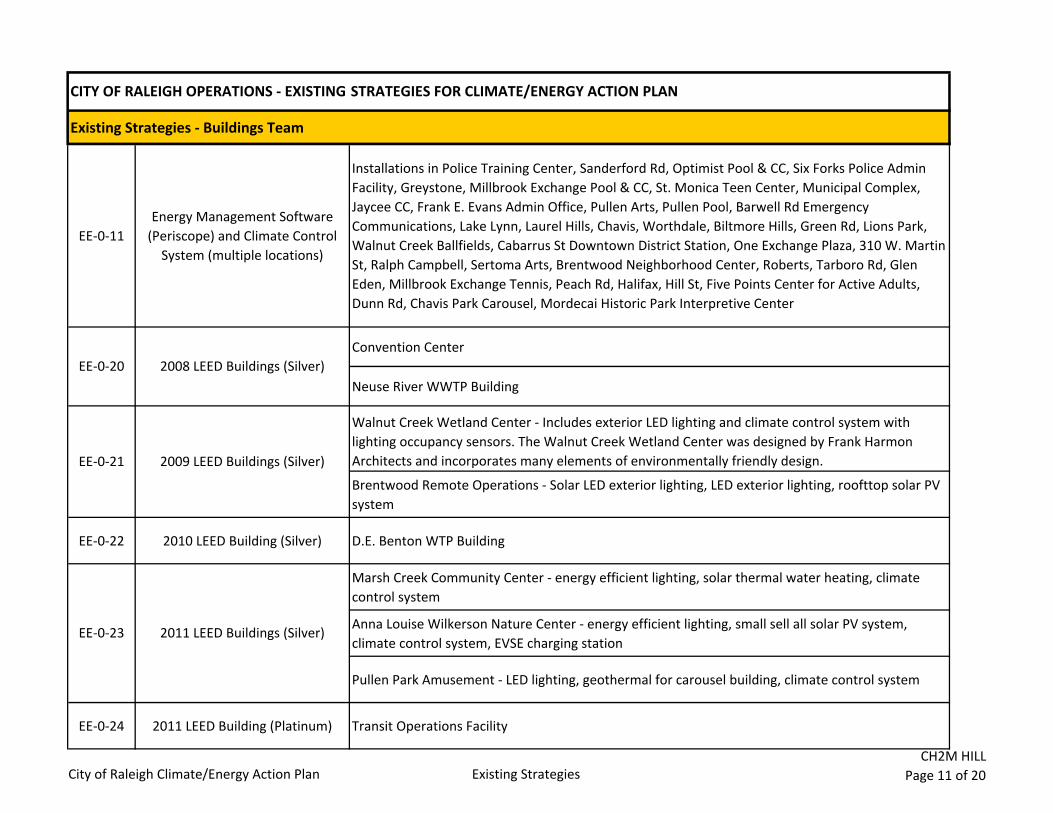
Existing Strategies ‐ Buildings Team
EE‐0‐11Energy Management Software (Periscope) and Climate Control System (multiple locations)
Installations in Police Training Center, Sanderford Rd, Optimist Pool & CC, Six Forks Police Admin Facility, Greystone, Millbrook Exchange Pool & CC, St. Monica Teen Center, Municipal Complex, Jaycee CC, Frank E. Evans Admin Office, Pullen Arts, Pullen Pool, Barwell Rd Emergency Communications, Lake Lynn, Laurel Hills, Chavis, Worthdale, Biltmore Hills, Green Rd, Lions Park, Walnut Creek Ballfields, Cabarrus St Downtown District Station, One Exchange Plaza, 310 W. Martin St, Ralph Campbell, Sertoma Arts, Brentwood Neighborhood Center, Roberts, Tarboro Rd, Glen Eden, Millbrook Exchange Tennis, Peach Rd, Halifax, Hill St, Five Points Center for Active Adults, Dunn Rd, Chavis Park Carousel, Mordecai Historic Park Interpretive Center
Convention Center
Neuse River WWTP Building
Walnut Creek Wetland Center ‐ Includes exterior LED lighting and climate control system with lighting occupancy sensors. The Walnut Creek Wetland Center was designed by Frank Harmon Architects and incorporates many elements of environmentally friendly design.
Brentwood Remote Operations ‐ Solar LED exterior lighting, LED exterior lighting, roofttop solar PV system
EE‐0‐22 2010 LEED Building (Silver) D.E. Benton WTP Building
Marsh Creek Community Center ‐ energy efficient lighting, solar thermal water heating, climate control system
Anna Louise Wilkerson Nature Center ‐ energy efficient lighting, small sell all solar PV system, climate control system, EVSE charging station
Pullen Park Amusement ‐ LED lighting, geothermal for carousel building, climate control system
EE‐0‐24 2011 LEED Building (Platinum) Transit Operations Facility
CITY OF RALEIGH OPERATIONS ‐ EXISTING STRATEGIES FOR CLIMATE/ENERGY ACTION PLAN
EE‐0‐20 2008 LEED Buildings (Silver)
EE‐0‐21 2009 LEED Buildings (Silver)
EE‐0‐23 2011 LEED Buildings (Silver)
City of Raleigh Climate/Energy Action Plan Existing StrategiesCH2M HILL
Page 11 of 20
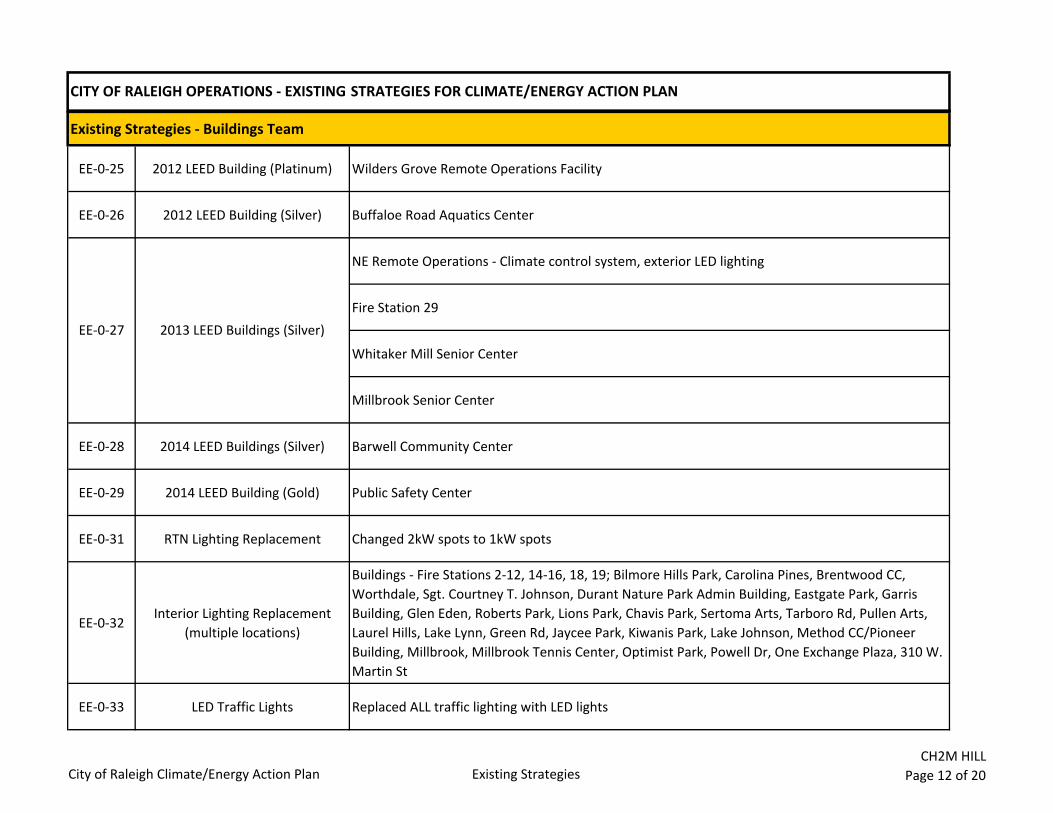
CITY OF RALEIGH OPERATIONS ‐ EXISTING STRATEGIES FOR CLIMATE/ENERGY ACTION PLAN
Existing Strategies ‐ Buildings Team
EE‐0‐25 2012 LEED Building (Platinum) Wilders Grove Remote Operations Facility
EE‐0‐26 2012 LEED Building (Silver) Buffaloe Road Aquatics Center
NE Remote Operations ‐ Climate control system, exterior LED lighting
Fire Station 29
Whitaker Mill Senior Center
Millbrook Senior Center
EE‐0‐28 2014 LEED Buildings (Silver) Barwell Community Center
EE‐0‐29 2014 LEED Building (Gold) Public Safety Center
EE‐0‐31 RTN Lighting Replacement Changed 2kW spots to 1kW spots
EE‐0‐32Interior Lighting Replacement
(multiple locations)
Buildings ‐ Fire Stations 2‐12, 14‐16, 18, 19; Bilmore Hills Park, Carolina Pines, Brentwood CC, Worthdale, Sgt. Courtney T. Johnson, Durant Nature Park Admin Building, Eastgate Park, Garris Building, Glen Eden, Roberts Park, Lions Park, Chavis Park, Sertoma Arts, Tarboro Rd, Pullen Arts, Laurel Hills, Lake Lynn, Green Rd, Jaycee Park, Kiwanis Park, Lake Johnson, Method CC/Pioneer Building, Millbrook, Millbrook Tennis Center, Optimist Park, Powell Dr, One Exchange Plaza, 310 W. Martin St
EE‐0‐33 LED Traffic Lights Replaced ALL traffic lighting with LED lights
EE‐0‐27 2013 LEED Buildings (Silver)
City of Raleigh Climate/Energy Action Plan Existing StrategiesCH2M HILL
Page 12 of 20
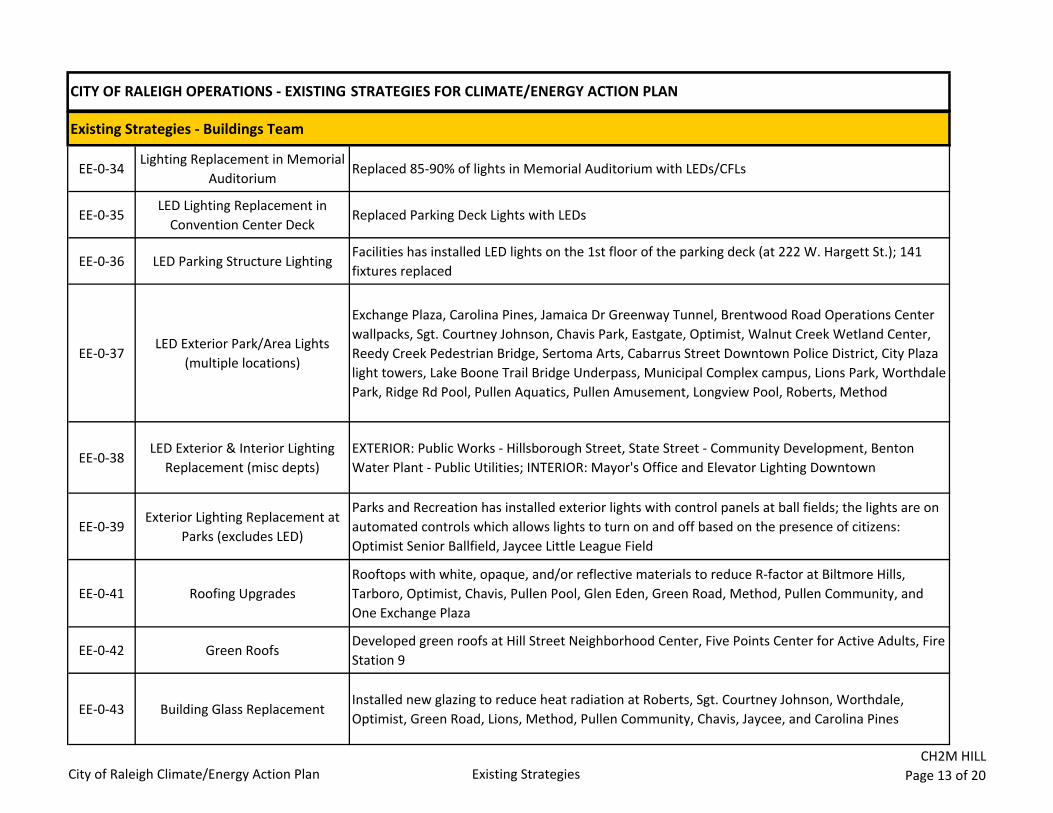
CITY OF RALEIGH OPERATIONS ‐ EXISTING STRATEGIES FOR CLIMATE/ENERGY ACTION PLAN
Existing Strategies ‐ Buildings Team
EE‐0‐34Lighting Replacement in Memorial
AuditoriumReplaced 85‐90% of lights in Memorial Auditorium with LEDs/CFLs
EE‐0‐35LED Lighting Replacement in Convention Center Deck
Replaced Parking Deck Lights with LEDs
EE‐0‐36 LED Parking Structure LightingFacilities has installed LED lights on the 1st floor of the parking deck (at 222 W. Hargett St.); 141 fixtures replaced
EE‐0‐37LED Exterior Park/Area Lights
(multiple locations)
Exchange Plaza, Carolina Pines, Jamaica Dr Greenway Tunnel, Brentwood Road Operations Center wallpacks, Sgt. Courtney Johnson, Chavis Park, Eastgate, Optimist, Walnut Creek Wetland Center, Reedy Creek Pedestrian Bridge, Sertoma Arts, Cabarrus Street Downtown Police District, City Plaza light towers, Lake Boone Trail Bridge Underpass, Municipal Complex campus, Lions Park, Worthdale Park, Ridge Rd Pool, Pullen Aquatics, Pullen Amusement, Longview Pool, Roberts, Method
EE‐0‐38LED Exterior & Interior Lighting
Replacement (misc depts)EXTERIOR: Public Works ‐ Hillsborough Street, State Street ‐ Community Development, Benton Water Plant ‐ Public Utilities; INTERIOR: Mayor's Office and Elevator Lighting Downtown
EE‐0‐39Exterior Lighting Replacement at
Parks (excludes LED)
Parks and Recreation has installed exterior lights with control panels at ball fields; the lights are on automated controls which allows lights to turn on and off based on the presence of citizens: Optimist Senior Ballfield, Jaycee Little League Field
EE‐0‐41 Roofing UpgradesRooftops with white, opaque, and/or reflective materials to reduce R‐factor at Biltmore Hills, Tarboro, Optimist, Chavis, Pullen Pool, Glen Eden, Green Road, Method, Pullen Community, and One Exchange Plaza
EE‐0‐42 Green RoofsDeveloped green roofs at Hill Street Neighborhood Center, Five Points Center for Active Adults, Fire Station 9
EE‐0‐43 Building Glass ReplacementInstalled new glazing to reduce heat radiation at Roberts, Sgt. Courtney Johnson, Worthdale, Optimist, Green Road, Lions, Method, Pullen Community, Chavis, Jaycee, and Carolina Pines
City of Raleigh Climate/Energy Action Plan Existing StrategiesCH2M HILL
Page 13 of 20
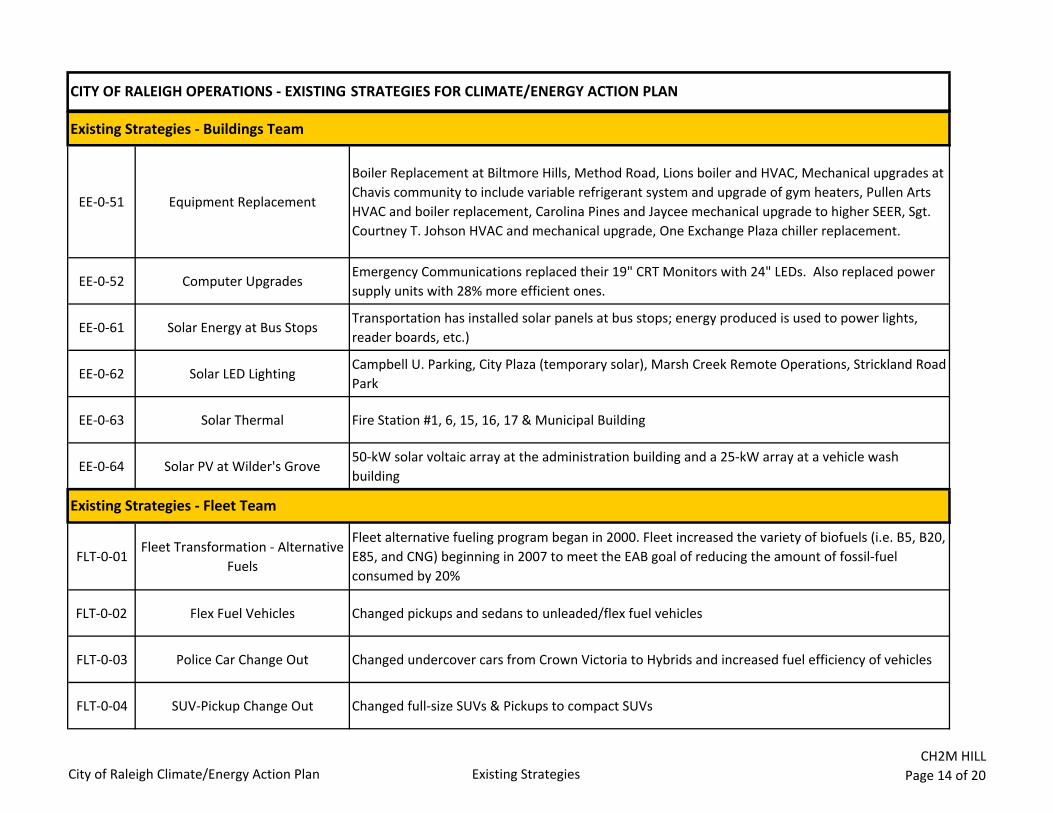
CITY OF RALEIGH OPERATIONS ‐ EXISTING STRATEGIES FOR CLIMATE/ENERGY ACTION PLAN
Existing Strategies ‐ Buildings Team
EE‐0‐51 Equipment Replacement
Boiler Replacement at Biltmore Hills, Method Road, Lions boiler and HVAC, Mechanical upgrades at Chavis community to include variable refrigerant system and upgrade of gym heaters, Pullen Arts HVAC and boiler replacement, Carolina Pines and Jaycee mechanical upgrade to higher SEER, Sgt. Courtney T. Johson HVAC and mechanical upgrade, One Exchange Plaza chiller replacement.
EE‐0‐52 Computer UpgradesEmergency Communications replaced their 19" CRT Monitors with 24" LEDs. Also replaced power supply units with 28% more efficient ones.
EE‐0‐61 Solar Energy at Bus StopsTransportation has installed solar panels at bus stops; energy produced is used to power lights, reader boards, etc.)
EE‐0‐62 Solar LED LightingCampbell U. Parking, City Plaza (temporary solar), Marsh Creek Remote Operations, Strickland Road Park
EE‐0‐63 Solar Thermal Fire Station #1, 6, 15, 16, 17 & Municipal Building
EE‐0‐64 Solar PV at Wilder's Grove50‐kW solar voltaic array at the administration building and a 25‐kW array at a vehicle wash building
FLT‐0‐01Fleet Transformation ‐ Alternative
Fuels
Fleet alternative fueling program began in 2000. Fleet increased the variety of biofuels (i.e. B5, B20, E85, and CNG) beginning in 2007 to meet the EAB goal of reducing the amount of fossil‐fuel consumed by 20%
FLT‐0‐02 Flex Fuel Vehicles Changed pickups and sedans to unleaded/flex fuel vehicles
FLT‐0‐03 Police Car Change Out Changed undercover cars from Crown Victoria to Hybrids and increased fuel efficiency of vehicles
FLT‐0‐04 SUV‐Pickup Change Out Changed full‐size SUVs & Pickups to compact SUVs
Existing Strategies ‐ Fleet Team
City of Raleigh Climate/Energy Action Plan Existing StrategiesCH2M HILL
Page 14 of 20
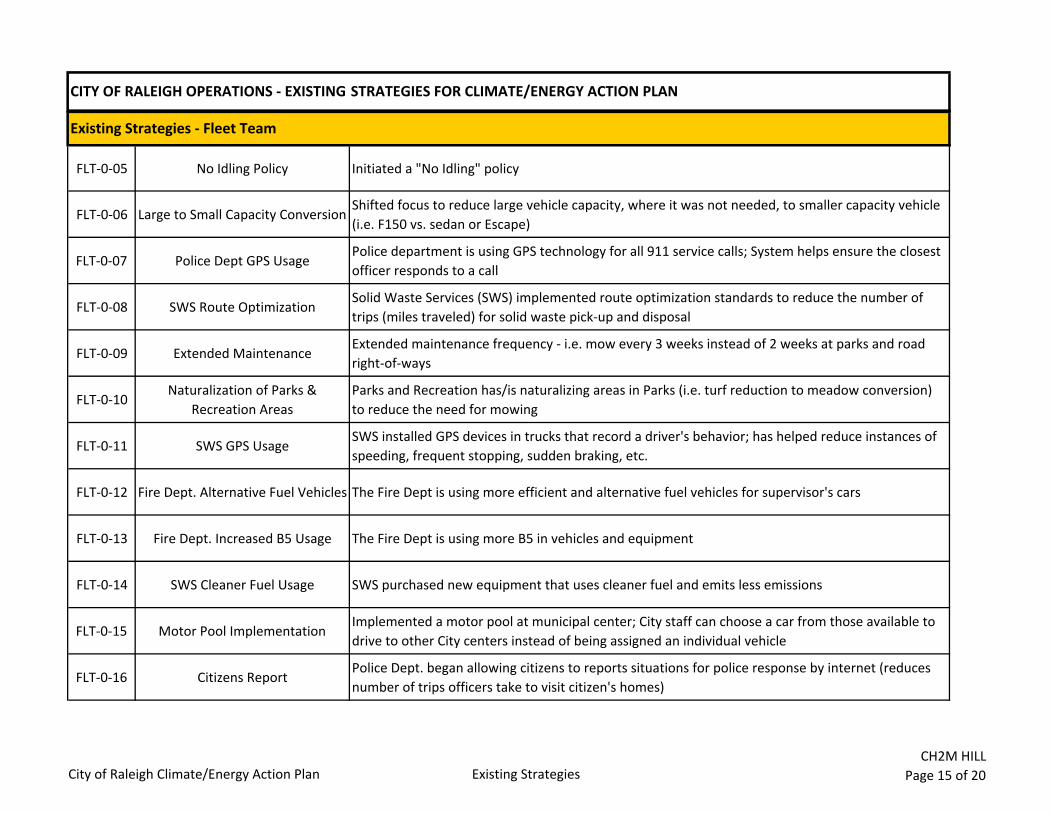
CITY OF RALEIGH OPERATIONS ‐ EXISTING STRATEGIES FOR CLIMATE/ENERGY ACTION PLAN
FLT‐0‐05 No Idling Policy Initiated a "No Idling" policy
FLT‐0‐06 Large to Small Capacity ConversionShifted focus to reduce large vehicle capacity, where it was not needed, to smaller capacity vehicle (i.e. F150 vs. sedan or Escape)
FLT‐0‐07 Police Dept GPS UsagePolice department is using GPS technology for all 911 service calls; System helps ensure the closest officer responds to a call
FLT‐0‐08 SWS Route OptimizationSolid Waste Services (SWS) implemented route optimization standards to reduce the number of trips (miles traveled) for solid waste pick‐up and disposal
FLT‐0‐09 Extended MaintenanceExtended maintenance frequency ‐ i.e. mow every 3 weeks instead of 2 weeks at parks and road right‐of‐ways
FLT‐0‐10Naturalization of Parks &
Recreation AreasParks and Recreation has/is naturalizing areas in Parks (i.e. turf reduction to meadow conversion) to reduce the need for mowing
FLT‐0‐11 SWS GPS UsageSWS installed GPS devices in trucks that record a driver's behavior; has helped reduce instances of speeding, frequent stopping, sudden braking, etc.
FLT‐0‐12 Fire Dept. Alternative Fuel Vehicles The Fire Dept is using more efficient and alternative fuel vehicles for supervisor's cars
FLT‐0‐13 Fire Dept. Increased B5 Usage The Fire Dept is using more B5 in vehicles and equipment
FLT‐0‐14 SWS Cleaner Fuel Usage SWS purchased new equipment that uses cleaner fuel and emits less emissions
FLT‐0‐15 Motor Pool ImplementationImplemented a motor pool at municipal center; City staff can choose a car from those available to drive to other City centers instead of being assigned an individual vehicle
FLT‐0‐16 Citizens ReportPolice Dept. began allowing citizens to reports situations for police response by internet (reduces number of trips officers take to visit citizen's homes)
Existing Strategies ‐ Fleet Team
City of Raleigh Climate/Energy Action Plan Existing StrategiesCH2M HILL
Page 15 of 20
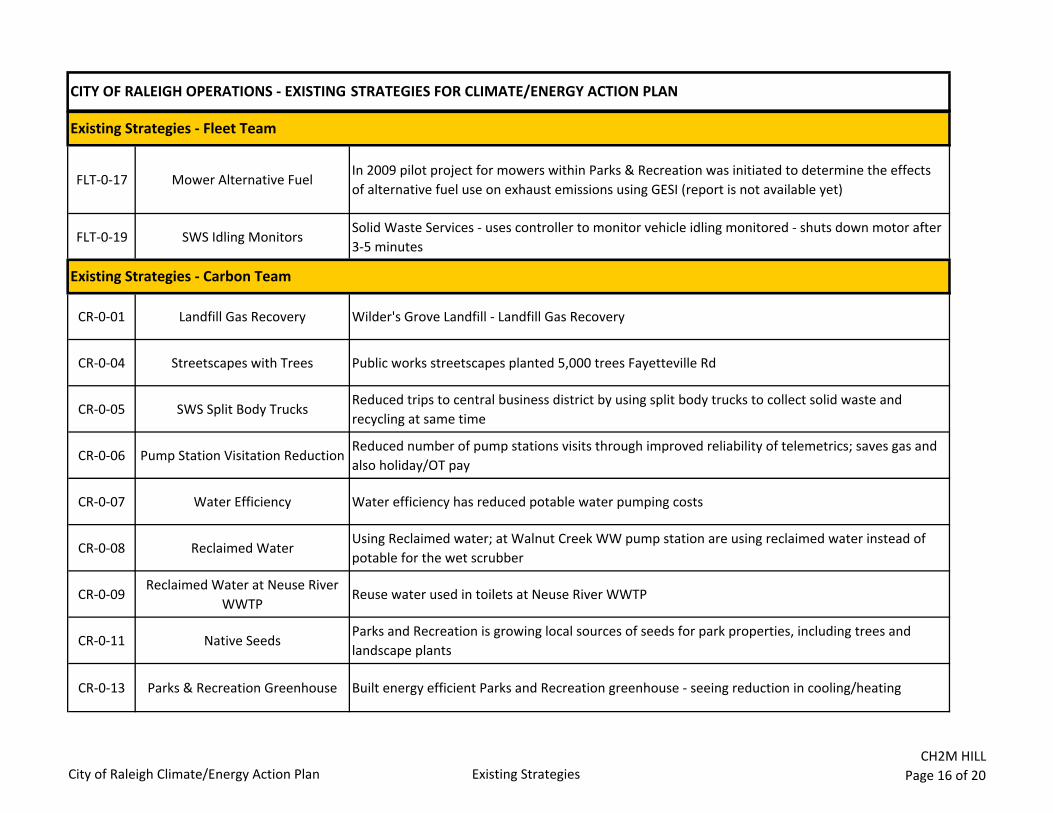
CITY OF RALEIGH OPERATIONS ‐ EXISTING STRATEGIES FOR CLIMATE/ENERGY ACTION PLAN
FLT‐0‐17 Mower Alternative FuelIn 2009 pilot project for mowers within Parks & Recreation was initiated to determine the effects of alternative fuel use on exhaust emissions using GESI (report is not available yet)
FLT‐0‐19 SWS Idling MonitorsSolid Waste Services ‐ uses controller to monitor vehicle idling monitored ‐ shuts down motor after 3‐5 minutes
CR‐0‐01 Landfill Gas Recovery Wilder's Grove Landfill ‐ Landfill Gas Recovery
CR‐0‐04 Streetscapes with Trees Public works streetscapes planted 5,000 trees Fayetteville Rd
CR‐0‐05 SWS Split Body TrucksReduced trips to central business district by using split body trucks to collect solid waste and recycling at same time
CR‐0‐06 Pump Station Visitation ReductionReduced number of pump stations visits through improved reliability of telemetrics; saves gas and also holiday/OT pay
CR‐0‐07 Water Efficiency Water efficiency has reduced potable water pumping costs
CR‐0‐08 Reclaimed WaterUsing Reclaimed water; at Walnut Creek WW pump station are using reclaimed water instead of potable for the wet scrubber
CR‐0‐09Reclaimed Water at Neuse River
WWTPReuse water used in toilets at Neuse River WWTP
CR‐0‐11 Native SeedsParks and Recreation is growing local sources of seeds for park properties, including trees and landscape plants
CR‐0‐13 Parks & Recreation Greenhouse Built energy efficient Parks and Recreation greenhouse ‐ seeing reduction in cooling/heating
Existing Strategies ‐ Carbon Team
Existing Strategies ‐ Fleet Team
City of Raleigh Climate/Energy Action Plan Existing StrategiesCH2M HILL
Page 16 of 20
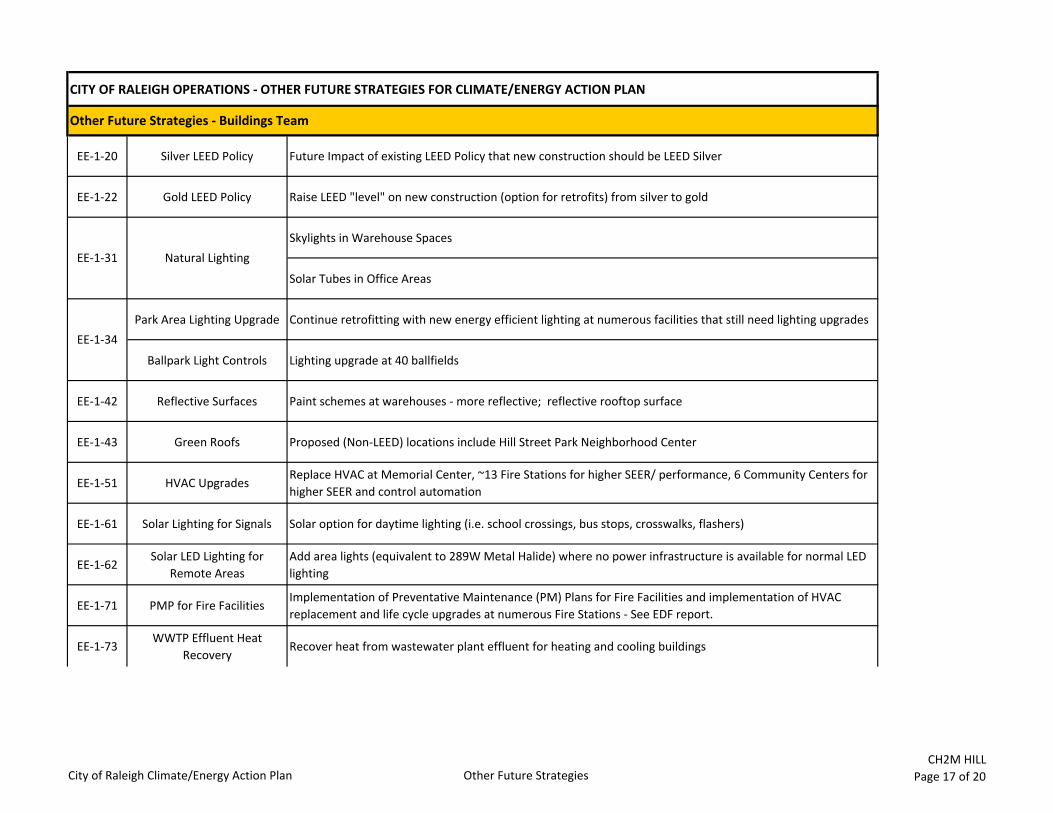
CITY OF RALEIGH OPERATIONS ‐ OTHER FUTURE STRATEGIES FOR CLIMATE/ENERGY ACTION PLAN
EE‐1‐20 Silver LEED Policy Future Impact of existing LEED Policy that new construction should be LEED Silver
EE‐1‐22 Gold LEED Policy Raise LEED "level" on new construction (option for retrofits) from silver to gold
Skylights in Warehouse Spaces
Solar Tubes in Office Areas
Park Area Lighting Upgrade Continue retrofitting with new energy efficient lighting at numerous facilities that still need lighting upgrades
Ballpark Light Controls Lighting upgrade at 40 ballfields
EE‐1‐42 Reflective Surfaces Paint schemes at warehouses ‐ more reflective; reflective rooftop surface
EE‐1‐43 Green Roofs Proposed (Non‐LEED) locations include Hill Street Park Neighborhood Center
EE‐1‐51 HVAC UpgradesReplace HVAC at Memorial Center, ~13 Fire Stations for higher SEER/ performance, 6 Community Centers for higher SEER and control automation
EE‐1‐61 Solar Lighting for Signals Solar option for daytime lighting (i.e. school crossings, bus stops, crosswalks, flashers)
EE‐1‐62Solar LED Lighting for
Remote AreasAdd area lights (equivalent to 289W Metal Halide) where no power infrastructure is available for normal LED lighting
EE‐1‐71 PMP for Fire FacilitiesImplementation of Preventative Maintenance (PM) Plans for Fire Facilities and implementation of HVAC replacement and life cycle upgrades at numerous Fire Stations ‐ See EDF report.
EE‐1‐73WWTP Effluent Heat
RecoveryRecover heat from wastewater plant effluent for heating and cooling buildings
Other Future Strategies ‐ Buildings Team
EE‐1‐31
EE‐1‐34
Natural Lighting
City of Raleigh Climate/Energy Action Plan Other Future StrategiesCH2M HILL
Page 17 of 20
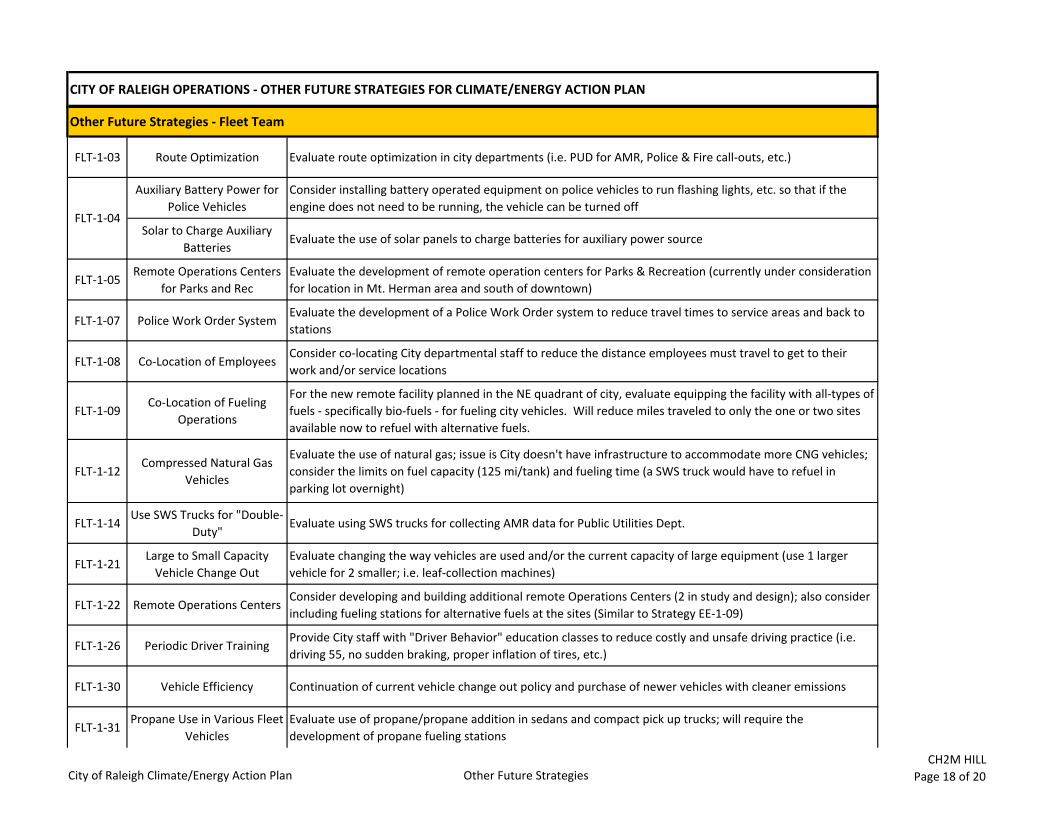
CITY OF RALEIGH OPERATIONS ‐ OTHER FUTURE STRATEGIES FOR CLIMATE/ENERGY ACTION PLAN
FLT‐1‐03 Route Optimization Evaluate route optimization in city departments (i.e. PUD for AMR, Police & Fire call‐outs, etc.)
Auxiliary Battery Power for Police Vehicles
Consider installing battery operated equipment on police vehicles to run flashing lights, etc. so that if the engine does not need to be running, the vehicle can be turned off
Solar to Charge Auxiliary Batteries
Evaluate the use of solar panels to charge batteries for auxiliary power source
FLT‐1‐05Remote Operations Centers
for Parks and RecEvaluate the development of remote operation centers for Parks & Recreation (currently under consideration for location in Mt. Herman area and south of downtown)
FLT‐1‐07 Police Work Order SystemEvaluate the development of a Police Work Order system to reduce travel times to service areas and back to stations
FLT‐1‐08 Co‐Location of EmployeesConsider co‐locating City departmental staff to reduce the distance employees must travel to get to their work and/or service locations
FLT‐1‐09Co‐Location of Fueling
Operations
For the new remote facility planned in the NE quadrant of city, evaluate equipping the facility with all‐types of fuels ‐ specifically bio‐fuels ‐ for fueling city vehicles. Will reduce miles traveled to only the one or two sites available now to refuel with alternative fuels.
FLT‐1‐12Compressed Natural Gas
Vehicles
Evaluate the use of natural gas; issue is City doesn't have infrastructure to accommodate more CNG vehicles; consider the limits on fuel capacity (125 mi/tank) and fueling time (a SWS truck would have to refuel in parking lot overnight)
FLT‐1‐14Use SWS Trucks for "Double‐
Duty"Evaluate using SWS trucks for collecting AMR data for Public Utilities Dept.
FLT‐1‐21Large to Small Capacity Vehicle Change Out
Evaluate changing the way vehicles are used and/or the current capacity of large equipment (use 1 larger vehicle for 2 smaller; i.e. leaf‐collection machines)
FLT‐1‐22 Remote Operations CentersConsider developing and building additional remote Operations Centers (2 in study and design); also consider including fueling stations for alternative fuels at the sites (Similar to Strategy EE‐1‐09)
FLT‐1‐26 Periodic Driver TrainingProvide City staff with "Driver Behavior" education classes to reduce costly and unsafe driving practice (i.e. driving 55, no sudden braking, proper inflation of tires, etc.)
FLT‐1‐30 Vehicle Efficiency Continuation of current vehicle change out policy and purchase of newer vehicles with cleaner emissions
FLT‐1‐31Propane Use in Various Fleet
VehiclesEvaluate use of propane/propane addition in sedans and compact pick up trucks; will require the development of propane fueling stations
FLT‐1‐04
Other Future Strategies ‐ Fleet Team
City of Raleigh Climate/Energy Action Plan Other Future StrategiesCH2M HILL
Page 18 of 20
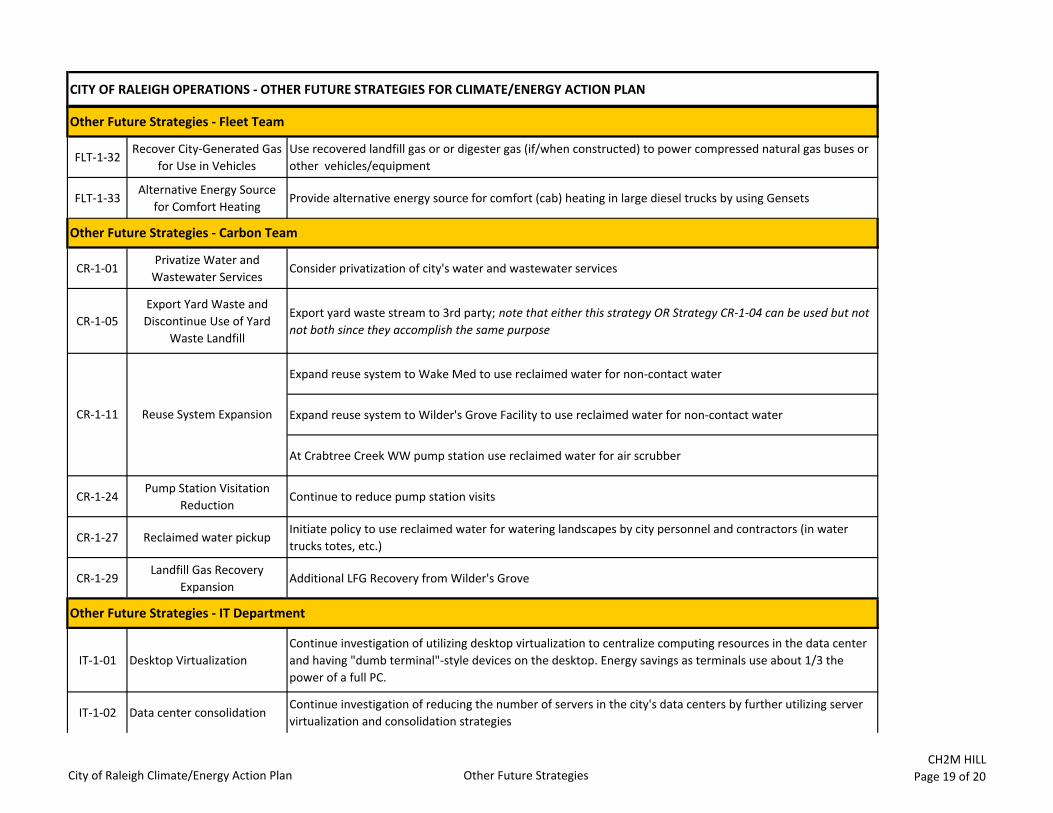
CITY OF RALEIGH OPERATIONS ‐ OTHER FUTURE STRATEGIES FOR CLIMATE/ENERGY ACTION PLAN
FLT‐1‐32Recover City‐Generated Gas
for Use in VehiclesUse recovered landfill gas or or digester gas (if/when constructed) to power compressed natural gas buses or other vehicles/equipment
FLT‐1‐33Alternative Energy Source
for Comfort HeatingProvide alternative energy source for comfort (cab) heating in large diesel trucks by using Gensets
CR‐1‐01Privatize Water and Wastewater Services
Consider privatization of city's water and wastewater services
CR‐1‐05Export Yard Waste and Discontinue Use of Yard
Waste Landfill
Export yard waste stream to 3rd party; note that either this strategy OR Strategy CR‐1‐04 can be used but not not both since they accomplish the same purpose
Expand reuse system to Wake Med to use reclaimed water for non‐contact water
Expand reuse system to Wilder's Grove Facility to use reclaimed water for non‐contact water
At Crabtree Creek WW pump station use reclaimed water for air scrubber
CR‐1‐24Pump Station Visitation
ReductionContinue to reduce pump station visits
CR‐1‐27 Reclaimed water pickupInitiate policy to use reclaimed water for watering landscapes by city personnel and contractors (in water trucks totes, etc.)
CR‐1‐29Landfill Gas Recovery
ExpansionAdditional LFG Recovery from Wilder's Grove
IT‐1‐01 Desktop VirtualizationContinue investigation of utilizing desktop virtualization to centralize computing resources in the data center and having "dumb terminal"‐style devices on the desktop. Energy savings as terminals use about 1/3 the power of a full PC.
IT‐1‐02 Data center consolidationContinue investigation of reducing the number of servers in the city's data centers by further utilizing server virtualization and consolidation strategies
CR‐1‐11 Reuse System Expansion
Other Future Strategies ‐ IT Department
Other Future Strategies ‐ Carbon Team
Other Future Strategies ‐ Fleet Team
City of Raleigh Climate/Energy Action Plan Other Future StrategiesCH2M HILL
Page 19 of 20
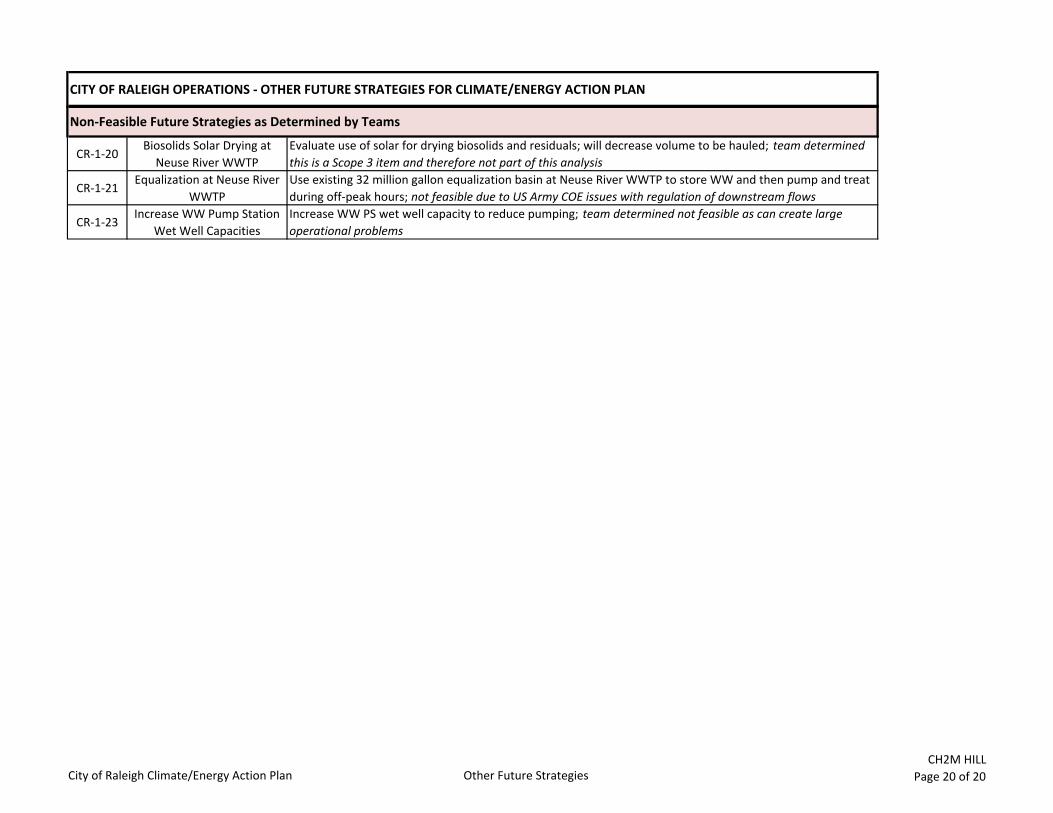
CITY OF RALEIGH OPERATIONS ‐ OTHER FUTURE STRATEGIES FOR CLIMATE/ENERGY ACTION PLAN
CR‐1‐20Biosolids Solar Drying at Neuse River WWTP
Evaluate use of solar for drying biosolids and residuals; will decrease volume to be hauled; team determined this is a Scope 3 item and therefore not part of this analysis
CR‐1‐21Equalization at Neuse River
WWTPUse existing 32 million gallon equalization basin at Neuse River WWTP to store WW and then pump and treat during off‐peak hours; not feasible due to US Army COE issues with regulation of downstream flows
CR‐1‐23Increase WW Pump Station
Wet Well CapacitiesIncrease WW PS wet well capacity to reduce pumping; team determined not feasible as can create large operational problems
Non‐Feasible Future Strategies as Determined by Teams
City of Raleigh Climate/Energy Action Plan Other Future StrategiesCH2M HILL
Page 20 of 20

APPENDIX 5: Renewable Energy Project Inventory
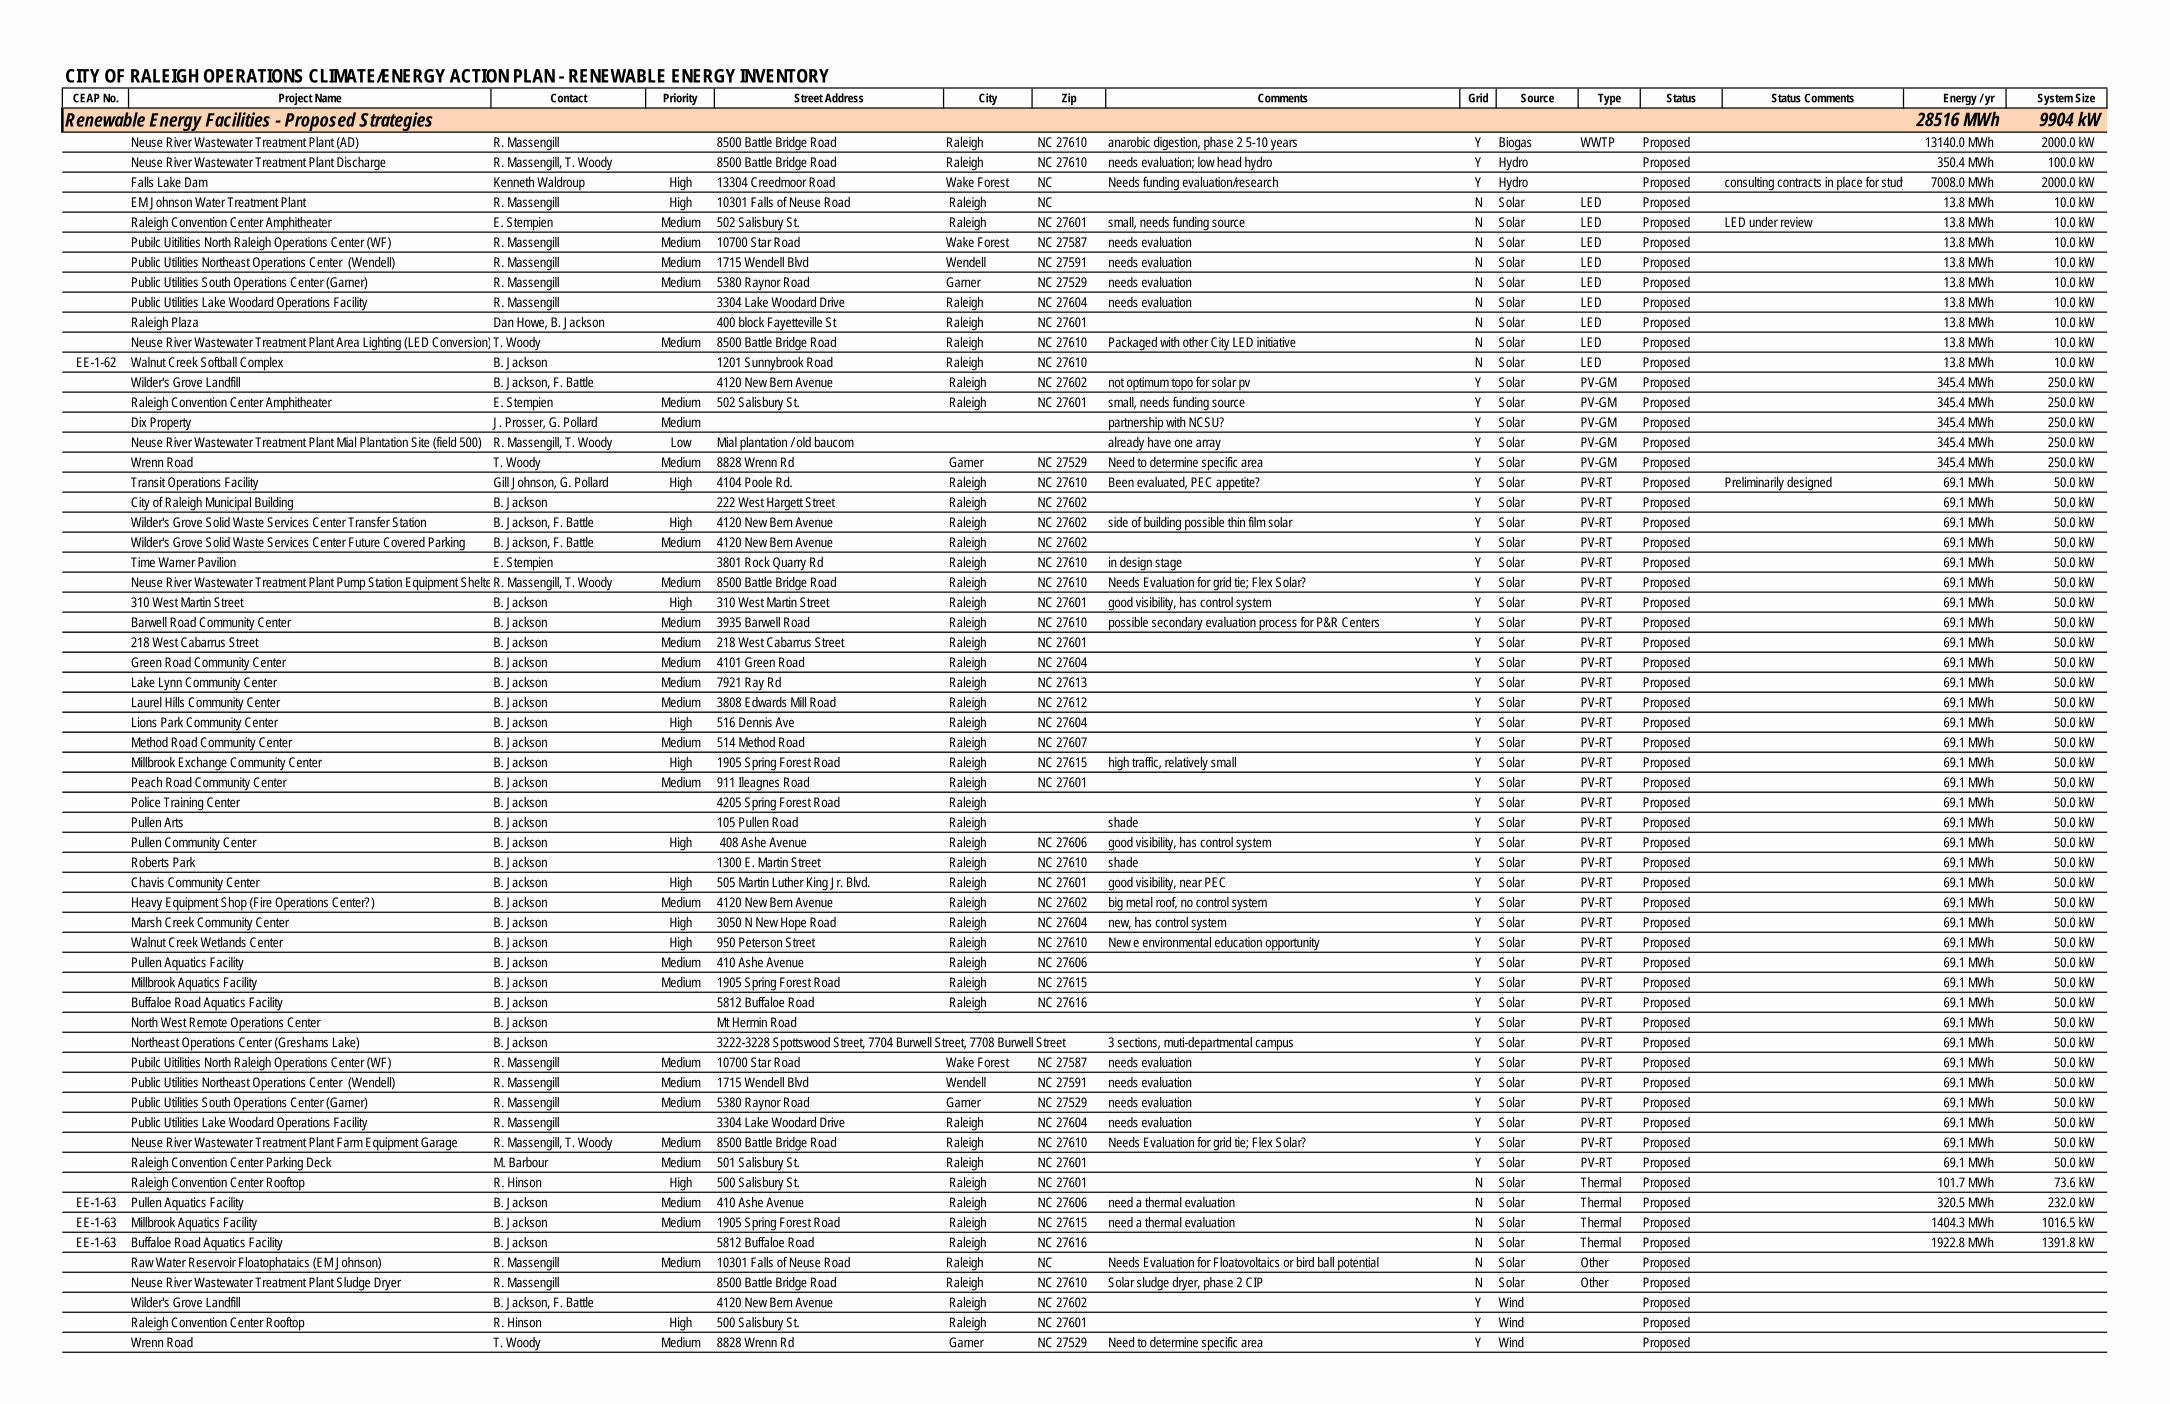
CITY OF RALEIGH OPERATIONS CLIMATE/ENERGY ACTION PLAN - RENEWABLE ENERGY INVENTORYCEAP No. Project Name Contact Priority Street Address City Zip Comments Grid Source Type Status Status Comments Energy / yr System Size
Renewable Energy Facilities - Proposed Strategies 28516 MWh 9904 kWNeuse River Wastewater Treatment Plant (AD) R. Massengill 8500 Battle Bridge Road Raleigh NC 27610 anarobic digestion, phase 2 5-10 years Y Biogas WWTP Proposed 13140.0 MWh 2000.0 kWNeuse River Wastewater Treatment Plant Discharge R. Massengill, T. Woody 8500 Battle Bridge Road Raleigh NC 27610 needs evaluation; low head hydro Y Hydro Proposed 350.4 MWh 100.0 kWFalls Lake Dam Kenneth Waldroup High 13304 Creedmoor Road Wake Forest NC Needs funding evaluation/research Y Hydro Proposed consulting contracts in place for study 7008.0 MWh 2000.0 kWEM Johnson Water Treatment Plant R. Massengill High 10301 Falls of Neuse Road Raleigh NC N Solar LED Proposed 13.8 MWh 10.0 kWRaleigh Convention Center Amphitheater E. Stempien Medium 502 Salisbury St. Raleigh NC 27601 small, needs funding source N Solar LED Proposed LED under review 13.8 MWh 10.0 kWPubilc Uitilities North Raleigh Operations Center (WF) R. Massengill Medium 10700 Star Road Wake Forest NC 27587 needs evaluation N Solar LED Proposed 13.8 MWh 10.0 kWPublic Utilities Northeast Operations Center (Wendell) R. Massengill Medium 1715 Wendell Blvd Wendell NC 27591 needs evaluation N Solar LED Proposed 13.8 MWh 10.0 kWPublic Utilities South Operations Center (Garner) R. Massengill Medium 5380 Raynor Road Garner NC 27529 needs evaluation N Solar LED Proposed 13.8 MWh 10.0 kWPublic Utilities Lake Woodard Operations Facility R. Massengill 3304 Lake Woodard Drive Raleigh NC 27604 needs evaluation N Solar LED Proposed 13.8 MWh 10.0 kWRaleigh Plaza Dan Howe, B. Jackson 400 block Fayetteville St Raleigh NC 27601 N Solar LED Proposed 13.8 MWh 10.0 kWNeuse River Wastewater Treatment Plant Area Lighting (LED Conversion) T. Woody Medium 8500 Battle Bridge Road Raleigh NC 27610 Packaged with other City LED initiative N Solar LED Proposed 13.8 MWh 10.0 kW
EE-1-62 Walnut Creek Softball Complex B. Jackson 1201 Sunnybrook Road Raleigh NC 27610 N Solar LED Proposed 13.8 MWh 10.0 kWWilder's Grove Landfill B. Jackson, F. Battle 4120 New Bern Avenue Raleigh NC 27602 not optimum topo for solar pv Y Solar PV-GM Proposed 345.4 MWh 250.0 kWRaleigh Convention Center Amphitheater E. Stempien Medium 502 Salisbury St. Raleigh NC 27601 small, needs funding source Y Solar PV-GM Proposed 345.4 MWh 250.0 kWDix Property J. Prosser, G. Pollard Medium partnership with NCSU? Y Solar PV-GM Proposed 345.4 MWh 250.0 kWNeuse River Wastewater Treatment Plant Mial Plantation Site (field 500) R. Massengill, T. Woody Low Mial plantation / old baucom already have one array Y Solar PV-GM Proposed 345.4 MWh 250.0 kWWrenn Road T. Woody Medium 8828 Wrenn Rd Garner NC 27529 Need to determine specific area Y Solar PV-GM Proposed 345.4 MWh 250.0 kWTransit Operations Facility Gill Johnson, G. Pollard High 4104 Poole Rd. Raleigh NC 27610 Been evaluated, PEC appetite? Y Solar PV-RT Proposed Preliminarily designed 69.1 MWh 50.0 kWCity of Raleigh Municipal Building B. Jackson 222 West Hargett Street Raleigh NC 27602 Y Solar PV-RT Proposed 69.1 MWh 50.0 kWWilder's Grove Solid Waste Services Center Transfer Station B. Jackson, F. Battle High 4120 New Bern Avenue Raleigh NC 27602 side of building possible thin film solar Y Solar PV-RT Proposed 69.1 MWh 50.0 kWWilder's Grove Solid Waste Services Center Future Covered Parking B. Jackson, F. Battle Medium 4120 New Bern Avenue Raleigh NC 27602 Y Solar PV-RT Proposed 69.1 MWh 50.0 kWTime Warner Pavilion E. Stempien 3801 Rock Quarry Rd Raleigh NC 27610 in design stage Y Solar PV-RT Proposed 69.1 MWh 50.0 kWNeuse River Wastewater Treatment Plant Pump Station Equipment Shelte R. Massengill, T. Woody Medium 8500 Battle Bridge Road Raleigh NC 27610 Needs Evaluation for grid tie; Flex Solar? Y Solar PV-RT Proposed 69.1 MWh 50.0 kW310 West Martin Street B. Jackson High 310 West Martin Street Raleigh NC 27601 good visibility, has control system Y Solar PV-RT Proposed 69.1 MWh 50.0 kWBarwell Road Community Center B. Jackson Medium 3935 Barwell Road Raleigh NC 27610 possible secondary evaluation process for P&R Centers Y Solar PV-RT Proposed 69.1 MWh 50.0 kW218 West Cabarrus Street B. Jackson Medium 218 West Cabarrus Street Raleigh NC 27601 Y Solar PV-RT Proposed 69.1 MWh 50.0 kWGreen Road Community Center B. Jackson Medium 4101 Green Road Raleigh NC 27604 Y Solar PV-RT Proposed 69.1 MWh 50.0 kWLake Lynn Community Center B. Jackson Medium 7921 Ray Rd Raleigh NC 27613 Y Solar PV-RT Proposed 69.1 MWh 50.0 kWLaurel Hills Community Center B. Jackson Medium 3808 Edwards Mill Road Raleigh NC 27612 Y Solar PV-RT Proposed 69.1 MWh 50.0 kWLions Park Community Center B. Jackson High 516 Dennis Ave Raleigh NC 27604 Y Solar PV-RT Proposed 69.1 MWh 50.0 kWMethod Road Community Center B. Jackson Medium 514 Method Road Raleigh NC 27607 Y Solar PV-RT Proposed 69.1 MWh 50.0 kWMillbrook Exchange Community Center B. Jackson High 1905 Spring Forest Road Raleigh NC 27615 high traffic, relatively small Y Solar PV-RT Proposed 69.1 MWh 50.0 kWPeach Road Community Center B. Jackson Medium 911 Ileagnes Road Raleigh NC 27601 Y Solar PV-RT Proposed 69.1 MWh 50.0 kWPolice Training Center B. Jackson 4205 Spring Forest Road Raleigh Y Solar PV-RT Proposed 69.1 MWh 50.0 kWPullen Arts B. Jackson 105 Pullen Road Raleigh shade Y Solar PV-RT Proposed 69.1 MWh 50.0 kWPullen Community Center B. Jackson High 408 Ashe Avenue Raleigh NC 27606 good visibility, has control system Y Solar PV-RT Proposed 69.1 MWh 50.0 kWRoberts Park B. Jackson 1300 E. Martin Street Raleigh NC 27610 shade Y Solar PV-RT Proposed 69.1 MWh 50.0 kWChavis Community Center B. Jackson High 505 Martin Luther King Jr. Blvd. Raleigh NC 27601 good visibility, near PEC Y Solar PV-RT Proposed 69.1 MWh 50.0 kWHeavy Equipment Shop (Fire Operations Center?) B. Jackson Medium 4120 New Bern Avenue Raleigh NC 27602 big metal roof, no control system Y Solar PV-RT Proposed 69.1 MWh 50.0 kWMarsh Creek Community Center B. Jackson High 3050 N New Hope Road Raleigh NC 27604 new, has control system Y Solar PV-RT Proposed 69.1 MWh 50.0 kWWalnut Creek Wetlands Center B. Jackson High 950 Peterson Street Raleigh NC 27610 New e environmental education opportunity Y Solar PV-RT Proposed 69.1 MWh 50.0 kWPullen Aquatics Facility B. Jackson Medium 410 Ashe Avenue Raleigh NC 27606 Y Solar PV-RT Proposed 69.1 MWh 50.0 kWMillbrook Aquatics Facility B. Jackson Medium 1905 Spring Forest Road Raleigh NC 27615 Y Solar PV-RT Proposed 69.1 MWh 50.0 kWBuffaloe Road Aquatics Facility B. Jackson 5812 Buffaloe Road Raleigh NC 27616 Y Solar PV-RT Proposed 69.1 MWh 50.0 kWNorth West Remote Operations Center B. Jackson Mt Hermin Road Y Solar PV-RT Proposed 69.1 MWh 50.0 kWNortheast Operations Center (Greshams Lake) B. Jackson 3222-3228 Spottswood Street, 7704 Burwell Street, 7708 Burwell Street 3 sections, muti-departmental campus Y Solar PV-RT Proposed 69.1 MWh 50.0 kWPubilc Uitilities North Raleigh Operations Center (WF) R. Massengill Medium 10700 Star Road Wake Forest NC 27587 needs evaluation Y Solar PV-RT Proposed 69.1 MWh 50.0 kWPublic Utilities Northeast Operations Center (Wendell) R. Massengill Medium 1715 Wendell Blvd Wendell NC 27591 needs evaluation Y Solar PV-RT Proposed 69.1 MWh 50.0 kWPublic Utilities South Operations Center (Garner) R. Massengill Medium 5380 Raynor Road Garner NC 27529 needs evaluation Y Solar PV-RT Proposed 69.1 MWh 50.0 kWPublic Utilities Lake Woodard Operations Facility R. Massengill 3304 Lake Woodard Drive Raleigh NC 27604 needs evaluation Y Solar PV-RT Proposed 69.1 MWh 50.0 kWNeuse River Wastewater Treatment Plant Farm Equipment Garage R. Massengill, T. Woody Medium 8500 Battle Bridge Road Raleigh NC 27610 Needs Evaluation for grid tie; Flex Solar? Y Solar PV-RT Proposed 69.1 MWh 50.0 kWRaleigh Convention Center Parking Deck M. Barbour Medium 501 Salisbury St. Raleigh NC 27601 Y Solar PV-RT Proposed 69.1 MWh 50.0 kWRaleigh Convention Center Rooftop R. Hinson High 500 Salisbury St. Raleigh NC 27601 N Solar Thermal Proposed 101.7 MWh 73.6 kW
EE-1-63 Pullen Aquatics Facility B. Jackson Medium 410 Ashe Avenue Raleigh NC 27606 need a thermal evaluation N Solar Thermal Proposed 320.5 MWh 232.0 kWEE-1-63 Millbrook Aquatics Facility B. Jackson Medium 1905 Spring Forest Road Raleigh NC 27615 need a thermal evaluation N Solar Thermal Proposed 1404.3 MWh 1016.5 kWEE-1-63 Buffaloe Road Aquatics Facility B. Jackson 5812 Buffaloe Road Raleigh NC 27616 N Solar Thermal Proposed 1922.8 MWh 1391.8 kW
Raw Water Reservoir Floatophataics (EM Johnson) R. Massengill Medium 10301 Falls of Neuse Road Raleigh NC Needs Evaluation for Floatovoltaics or bird ball potential N Solar Other ProposedNeuse River Wastewater Treatment Plant Sludge Dryer R. Massengill 8500 Battle Bridge Road Raleigh NC 27610 Solar sludge dryer, phase 2 CIP N Solar Other ProposedWilder's Grove Landfill B. Jackson, F. Battle 4120 New Bern Avenue Raleigh NC 27602 Y Wind ProposedRaleigh Convention Center Rooftop R. Hinson High 500 Salisbury St. Raleigh NC 27601 Y Wind ProposedWrenn Road T. Woody Medium 8828 Wrenn Rd Garner NC 27529 Need to determine specific area Y Wind Proposed
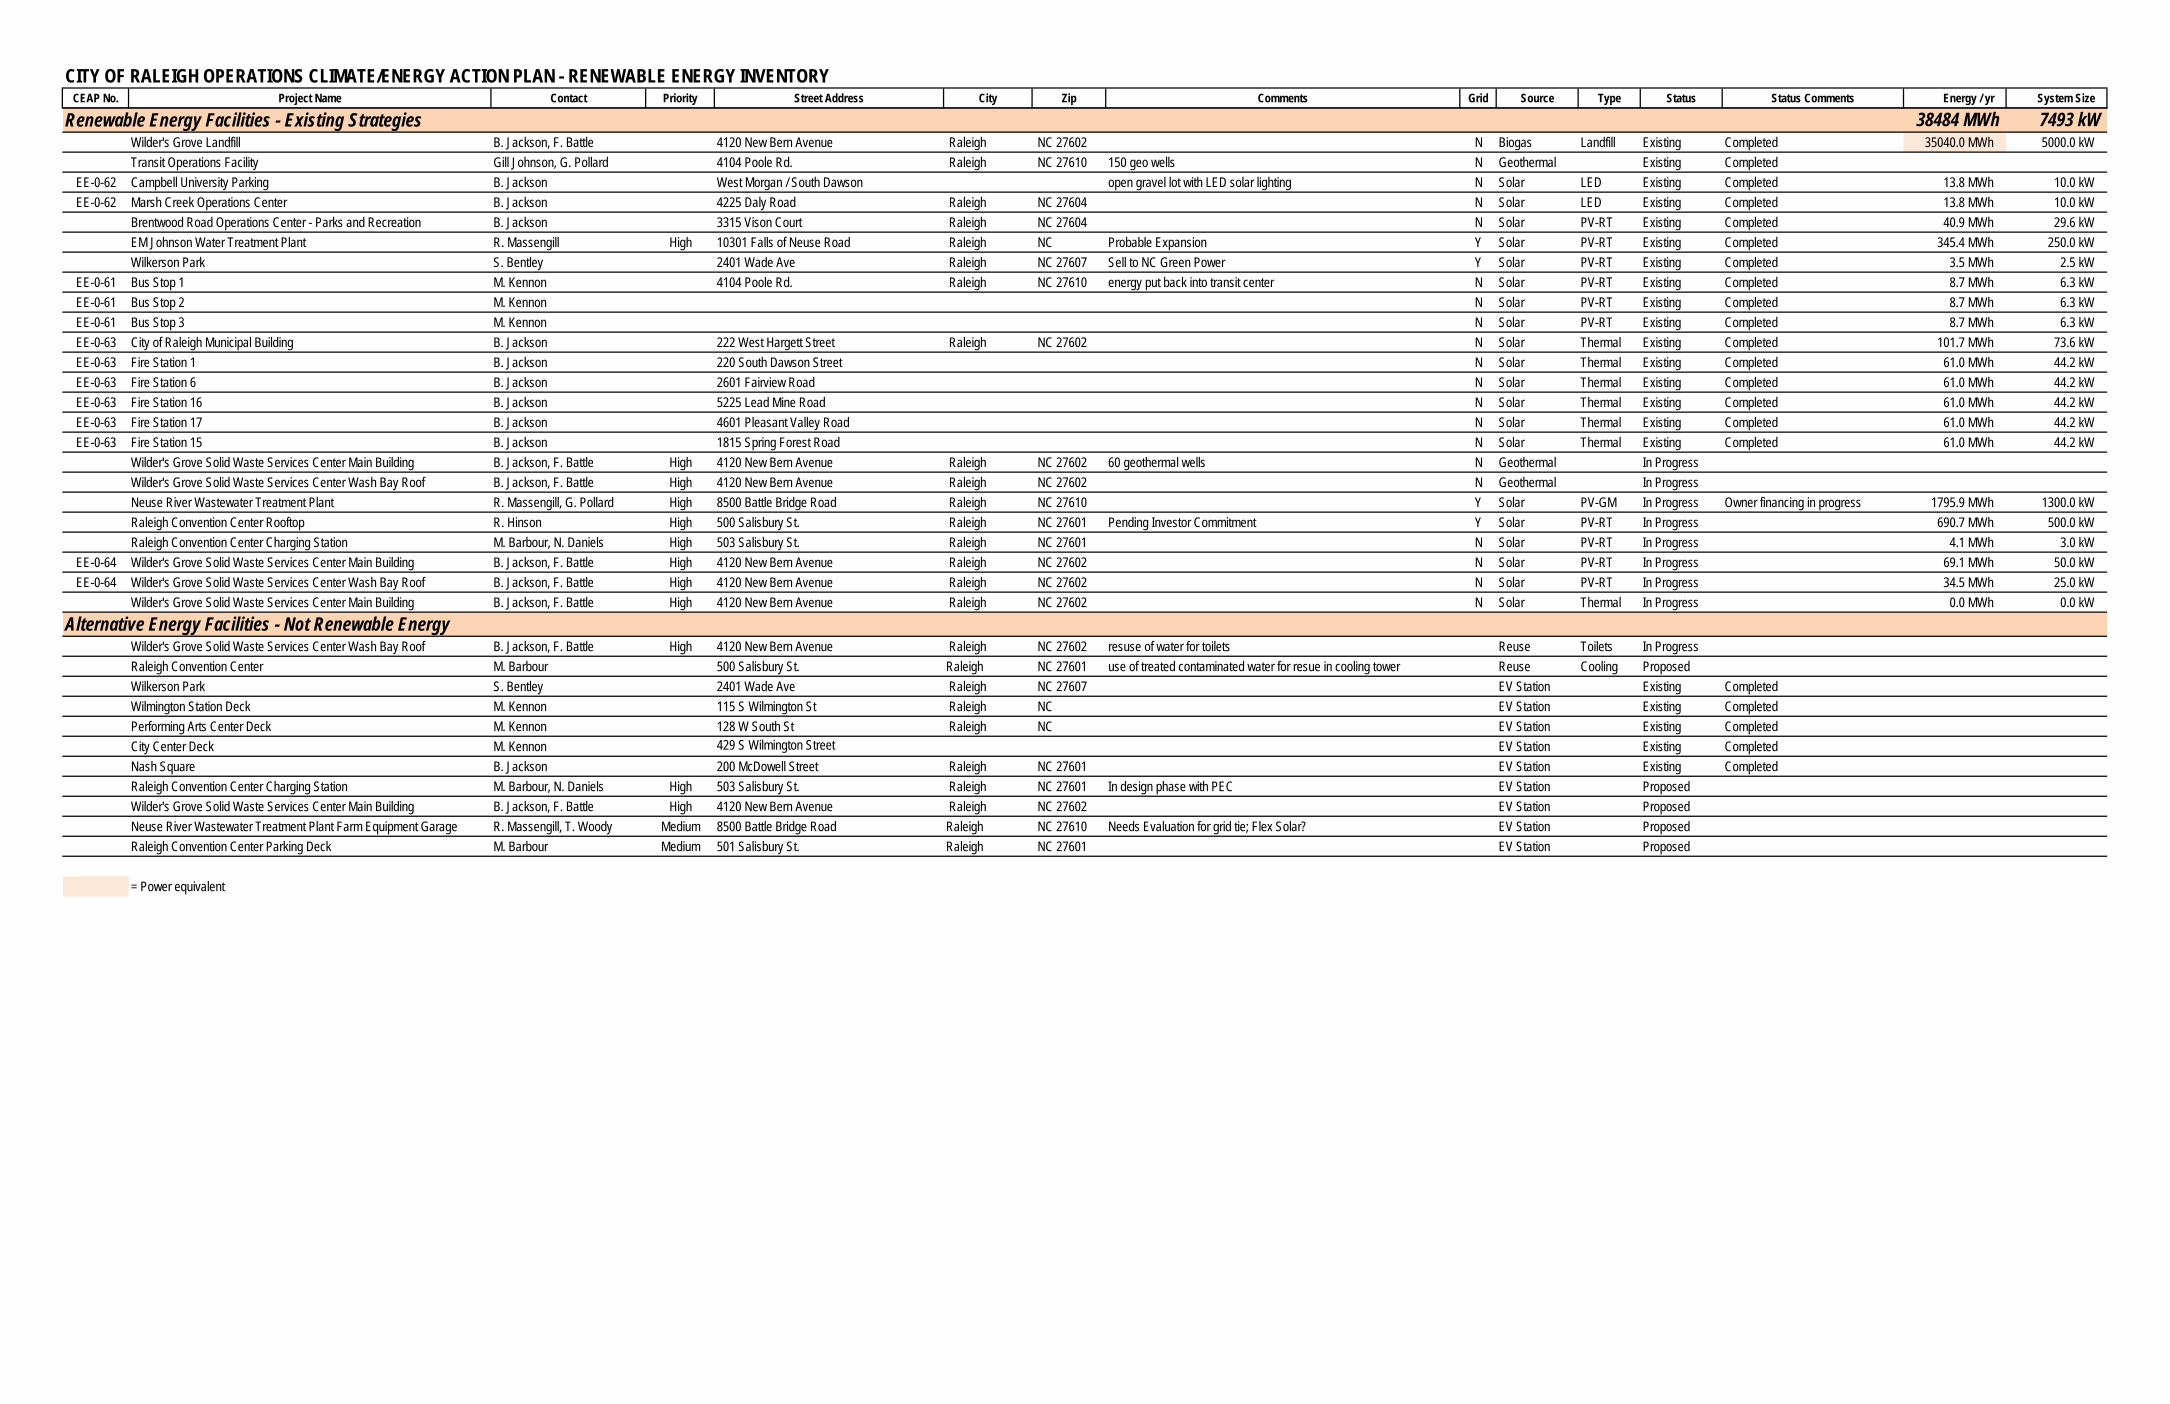
CITY OF RALEIGH OPERATIONS CLIMATE/ENERGY ACTION PLAN - RENEWABLE ENERGY INVENTORYCEAP No. Project Name Contact Priority Street Address City Zip Comments Grid Source Type Status Status Comments Energy / yr System Size
Renewable Energy Facilities - Existing Strategies 38484 MWh 7493 kWWilder's Grove Landfill B. Jackson, F. Battle 4120 New Bern Avenue Raleigh NC 27602 N Biogas Landfill Existing Completed 35040.0 MWh 5000.0 kWTransit Operations Facility Gill Johnson, G. Pollard 4104 Poole Rd. Raleigh NC 27610 150 geo wells N Geothermal Existing Completed
EE-0-62 Campbell University Parking B. Jackson West Morgan / South Dawson open gravel lot with LED solar lighting N Solar LED Existing Completed 13.8 MWh 10.0 kWEE-0-62 Marsh Creek Operations Center B. Jackson 4225 Daly Road Raleigh NC 27604 N Solar LED Existing Completed 13.8 MWh 10.0 kW
Brentwood Road Operations Center - Parks and Recreation B. Jackson 3315 Vison Court Raleigh NC 27604 N Solar PV-RT Existing Completed 40.9 MWh 29.6 kWEM Johnson Water Treatment Plant R. Massengill High 10301 Falls of Neuse Road Raleigh NC Probable Expansion Y Solar PV-RT Existing Completed 345.4 MWh 250.0 kWWilkerson Park S. Bentley 2401 Wade Ave Raleigh NC 27607 Sell to NC Green Power Y Solar PV-RT Existing Completed 3.5 MWh 2.5 kW
EE-0-61 Bus Stop 1 M. Kennon 4104 Poole Rd. Raleigh NC 27610 energy put back into transit center N Solar PV-RT Existing Completed 8.7 MWh 6.3 kWEE-0-61 Bus Stop 2 M. Kennon N Solar PV-RT Existing Completed 8.7 MWh 6.3 kWEE-0-61 Bus Stop 3 M. Kennon N Solar PV-RT Existing Completed 8.7 MWh 6.3 kWEE-0-63 City of Raleigh Municipal Building B. Jackson 222 West Hargett Street Raleigh NC 27602 N Solar Thermal Existing Completed 101.7 MWh 73.6 kWEE-0-63 Fire Station 1 B. Jackson 220 South Dawson Street N Solar Thermal Existing Completed 61.0 MWh 44.2 kWEE-0-63 Fire Station 6 B. Jackson 2601 Fairview Road N Solar Thermal Existing Completed 61.0 MWh 44.2 kWEE-0-63 Fire Station 16 B. Jackson 5225 Lead Mine Road N Solar Thermal Existing Completed 61.0 MWh 44.2 kWEE-0-63 Fire Station 17 B. Jackson 4601 Pleasant Valley Road N Solar Thermal Existing Completed 61.0 MWh 44.2 kWEE-0-63 Fire Station 15 B. Jackson 1815 Spring Forest Road N Solar Thermal Existing Completed 61.0 MWh 44.2 kW
Wilder's Grove Solid Waste Services Center Main Building B. Jackson, F. Battle High 4120 New Bern Avenue Raleigh NC 27602 60 geothermal wells N Geothermal In ProgressWilder's Grove Solid Waste Services Center Wash Bay Roof B. Jackson, F. Battle High 4120 New Bern Avenue Raleigh NC 27602 N Geothermal In ProgressNeuse River Wastewater Treatment Plant R. Massengill, G. Pollard High 8500 Battle Bridge Road Raleigh NC 27610 Y Solar PV-GM In Progress Owner financing in progress 1795.9 MWh 1300.0 kWRaleigh Convention Center Rooftop R. Hinson High 500 Salisbury St. Raleigh NC 27601 Pending Investor Commitment Y Solar PV-RT In Progress 690.7 MWh 500.0 kWRaleigh Convention Center Charging Station M. Barbour, N. Daniels High 503 Salisbury St. Raleigh NC 27601 N Solar PV-RT In Progress 4.1 MWh 3.0 kW
EE-0-64 Wilder's Grove Solid Waste Services Center Main Building B. Jackson, F. Battle High 4120 New Bern Avenue Raleigh NC 27602 N Solar PV-RT In Progress 69.1 MWh 50.0 kWEE-0-64 Wilder's Grove Solid Waste Services Center Wash Bay Roof B. Jackson, F. Battle High 4120 New Bern Avenue Raleigh NC 27602 N Solar PV-RT In Progress 34.5 MWh 25.0 kW
Wilder's Grove Solid Waste Services Center Main Building B. Jackson, F. Battle High 4120 New Bern Avenue Raleigh NC 27602 N Solar Thermal In Progress 0.0 MWh 0.0 kW
Alternative Energy Facilities - Not Renewable EnergyWilder's Grove Solid Waste Services Center Wash Bay Roof B. Jackson, F. Battle High 4120 New Bern Avenue Raleigh NC 27602 resuse of water for toilets Reuse Toilets In ProgressRaleigh Convention Center M. Barbour 500 Salisbury St. Raleigh NC 27601 use of treated contaminated water for resue in cooling tower Reuse Cooling ProposedWilkerson Park S. Bentley 2401 Wade Ave Raleigh NC 27607 EV Station Existing CompletedWilmington Station Deck M. Kennon 115 S Wilmington St Raleigh NC EV Station Existing CompletedPerforming Arts Center Deck M. Kennon 128 W South St Raleigh NC EV Station Existing CompletedCity Center Deck M. Kennon 429 S Wilmington Street EV Station Existing CompletedNash Square B. Jackson 200 McDowell Street Raleigh NC 27601 EV Station Existing CompletedRaleigh Convention Center Charging Station M. Barbour, N. Daniels High 503 Salisbury St. Raleigh NC 27601 In design phase with PEC EV Station ProposedWilder's Grove Solid Waste Services Center Main Building B. Jackson, F. Battle High 4120 New Bern Avenue Raleigh NC 27602 EV Station ProposedNeuse River Wastewater Treatment Plant Farm Equipment Garage R. Massengill, T. Woody Medium 8500 Battle Bridge Road Raleigh NC 27610 Needs Evaluation for grid tie; Flex Solar? EV Station ProposedRaleigh Convention Center Parking Deck M. Barbour Medium 501 Salisbury St. Raleigh NC 27601 EV Station Proposed
= Power equivalent
Printed on 100% Post-Consumer Recycled Paper