Embed Size (px)
Citation preview

1 | P a g e
FEDERAL ENERGY REGULATORY COMMISSION
TECHNICAL CONFERENCE ON ENVIRONMENTAL REGULATIONS
AND ELECTRIC RELIABILITY, WHOLESALE ELECTRICITY
MARKETS, AND ENERGY INFRASTRUCTURE
Docket No. AD15-4-000
STATEMENT OF ROB GRAMLICH
SENIOR VICE PRESIDENT, GOVERNMENT & PUBLIC AFFAIRS
AMERICAN WIND ENERGY ASSOCIATION
February 19, 2015
Thank you for the invitation to speak at the February 19, 2015, technical conference and to
submit this written statement. Our assessment suggests that the Clean Power Plan can be met
while maintaining electric reliability. Existing markets and other institutions are well-equipped
to reliably handle the proposed changes, and while infrastructure, planning, and grid operations
improvements will be needed for most cost-effective compliance with the Clean Power Plan,
they are needed with or without the rule.
My testimony will focus on these main points:
The Clean Power Plan is achievable, and reliability can be maintained with existing
processes.
Renewable energy will play a key role in cost-effective compliance with the Clean Power
Plan.
Renewable energy will continue to contribute to a more diverse and reliable energy
portfolio.
FERC leadership will be essential.
I. The Clean Power Plan is achievable, and reliability can be maintained with existing
processes.
EPA’s Clean Power Plan includes tremendous flexibility for compliance options. While EPA
tailored the emissions requirement for each state based on a “Best System of Emission
Reduction,” states are in no way obligated to use that particular system and are free to achieve
the emissions reductions any way they would like, with virtually all electric sector emissions
reduction opportunities on the table. EPA has strongly indicated it plans to allow trading and

2 | P a g e
other interstate compliance options, which will allow further flexibility for the rule to be met at
least cost.
EPA’s proposed rule also contains considerable flexibility for the timing of compliance options,
flexibility that was expanded under proposals in EPA’s October 2014 Notice of Data
Availability. Under the proposed rule, states are only required to meet a 2020-2029 average
emissions rate, giving them the flexibility to emit more than the limit in the early years if they
emit less than the limit in later years, or vice versa. EPA has also proposed allowing states to
bank credits from actions taken to reduce emissions prior to 2020, and even proposed a “glide
path” approach that would phase the emissions target in more gradually during the early years of
the 2020-2029 period.
Reliability can be maintained because our country’s electricity markets and regulatory structures
work. Transmission providers have many tools to ensure local and system-wide reliability as the
generation mix changes. Industry participants have proven they can build capacity to meet
generation reserve requirements, whether through market price signals or traditional utility
planning. There is sufficient oversight by regional reliability authorities to ensure generation
adequacy.
II. Renewable energy will play a key role in cost-effective compliance with the Clean
Power Plan.
Wind energy is already greatly reducing emissions, and the EPA correctly envisions a greatly
expanded role for wind energy under the Clean Power Plan. In fact, renewable energy is on track
to greatly exceed its Clean Power Plan target, reducing the obligation on other sectors and
mitigating any cost or reliability concerns about those sectors’ abilities to meet their targets.
U.S. wind energy facilities produced more than 181 million MWh over the last 12 months,1
reducing carbon dioxide emissions by around 135 million short tons, or the equivalent of taking
26 million cars off the road.2 Wind energy’s growth has accounted for nearly 1/3 of U.S. power
sector CO2 emissions reductions since 2005, and almost 1/6 of economy-wide CO2e emissions
reductions since 2005.3
1 Available at http://www.eia.gov/electricity/monthly/epm_table_grapher.cfm?t=epmt_1_01_a.
2 181.1 million MWh of wind generation from December 2013-November 2014, multiplied by EPA AVERT model
average displacement of .75 short tons of CO2 per MWh of wind generated in 2013, using methodology outlined
here http://awea.files.cms-plus.com/FileDownloads/pdfs/AWEA_Clean_Air_Benefits_WhitePaper%20Final.pdf. 3 181.1 million MWh in December 2013-November 2014 minus 17.8 million MWh in 2005 times 0.68 metric
tons/MWh = 111 million metric tons of incremental CO2 emissions reductions from wind, or 32.2% of the 345
million metric tons of power sector emissions reductions for 2005 through October 2013-September 2014, from
http://www.eia.gov/beta/MER/index.cfm?tbl=T12.06#/?f=M&start=201310&end=201409&charted=0-1-6, and
15.3% of the economy-wide emissions reductions of 728 million metric tons over 2005-2012, from
3 | P a g e
Wind energy’s rapid growth has been driven by cost reductions achieved through economies of
scale, technological advances, as well as the creation of a domestic wind manufacturing base.
The average price for utility wind energy purchases has decreased by 62% since 2009.4 Data
compiled by Wall Street investment advisory firm Lazard confirm that the levelized cost of
energy for wind power has fallen 58% since 2009, and 15% in the last year alone.5 Lazard also
calculated that wind energy is the most cost-effective electricity generation option for carbon
abatement by a wide margin. Thanks to continuing cost reductions, wind energy is ready to
provide even larger consumer and environmental benefits.
Even EPA appears to have underestimated wind energy’s recent growth and cost reductions in
developing its trajectory for renewable deployment under Building Block 3 of its Best System of
Emissions Reduction. As shown below, the U.S. has essentially already reached EPA’s 2020
Building Block 3 (BB3) target for renewable deployment, with 277.4 million MWh of non-hydro
renewable energy produced during the last twelve months relative to EPA’s target of 281.3
million MWh for 2020.6 Even under the conservative assumption that non-hydro renewable
energy continues to expand at the linear growth rate it has experienced over the last 10 years,
renewable generation will exceed EPA’s BB3 target by 1.1 billion MWh cumulatively over the
2020-2029 compliance timeframe. Because growth compounds as the economics of renewables
continue to improve, and because the growth trajectory for 2005-2014 predates much of the cost
reduction-driven growth in wind and solar generation, this linear growth projection is likely to be
very conservative.
http://www.epa.gov/climatechange/ghgemissions/inventoryexplorer/#allsectors/allgas/econsect/all. 4 Available at http://emp.lbl.gov/publications/2013-wind-technologies-market-report, Figure 46.
5 Lazard Levelized Cost of Energy Report, Version 8.0, September 2014, available at:
http://www.lazard.com/PDF/Levelized%20Cost%20of%20Energy%20-%20Version%208.0.pdf 6 Available at http://www.eia.gov/electricity/monthly/epm_table_grapher.cfm?t=epmt_1_01_a.
4 | P a g e
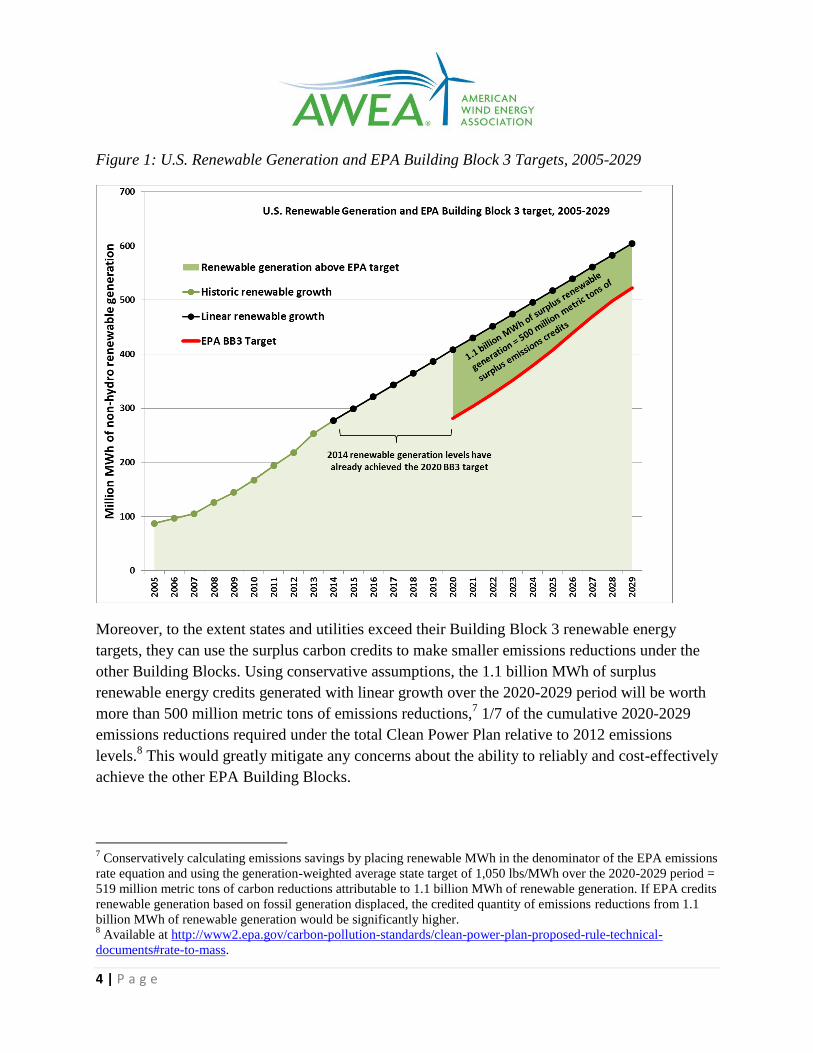
Figure 1: U.S. Renewable Generation and EPA Building Block 3 Targets, 2005-2029
Moreover, to the extent states and utilities exceed their Building Block 3 renewable energy
targets, they can use the surplus carbon credits to make smaller emissions reductions under the
other Building Blocks. Using conservative assumptions, the 1.1 billion MWh of surplus
renewable energy credits generated with linear growth over the 2020-2029 period will be worth
more than 500 million metric tons of emissions reductions,7 1/7 of the cumulative 2020-2029
emissions reductions required under the total Clean Power Plan relative to 2012 emissions
levels.8 This would greatly mitigate any concerns about the ability to reliably and cost-effectively
achieve the other EPA Building Blocks.
7 Conservatively calculating emissions savings by placing renewable MWh in the denominator of the EPA emissions
rate equation and using the generation-weighted average state target of 1,050 lbs/MWh over the 2020-2029 period =
519 million metric tons of carbon reductions attributable to 1.1 billion MWh of renewable generation. If EPA credits
renewable generation based on fossil generation displaced, the credited quantity of emissions reductions from 1.1
billion MWh of renewable generation would be significantly higher. 8 Available at http://www2.epa.gov/carbon-pollution-standards/clean-power-plan-proposed-rule-technical-
documents#rate-to-mass.

5 | P a g e
III. Renewable energy will continue to contribute to a more diverse and reliable energy
portfolio.
Wind energy and other forms of renewable energy are already making important contributions to
grid reliability. Analyses and grid operating experience from ISOs and utilities show that levels
of wind deployment at least several times higher than those targeted by EPA’s Clean Power Plan
can be reliably and cost-effectively integrated. Modern wind turbines can provide the same
reliability services as conventional generators, and by diversifying our electricity mix wind
energy reduces risks to reliability.
A. Large amounts of wind energy are already being reliably integrated.
Wind energy now reliably provides more than 25 percent of the electricity in Iowa and South
Dakota, and 12 percent or more of the generation in a total of nine states.9 Wind energy
provided 10.6% of the electricity last year on the main power system in Texas,10
ERCOT, and
that figure is expected to reach 15-20% by 2017.11
At times, wind energy has provided nearly
40% of generation in ERCOT, 33% in the Southwest Power Pool, and more than 60% on Xcel
Energy’s Colorado power system, all without any reliability problems. For a more detailed
discussion of how wind energy is reliably integrated onto the power system, see AWEA’s
forthcoming report “Wind energy helps build a more reliable and balanced electricity
portfolio.”
9 Available at http://www.awea.org/MediaCenter/pressrelease.aspx?ItemNumber=6184.
10 Available at http://ercot.com/news/press_releases/show/51654.
11Available at
http://www.ercot.com/content/committees/board/keydocs/2014/ERCOT_Monthly_Operational_Overview_201412.p
df, page 18.

6 | P a g e
Figure 2: U.S. Wind Energy Share of Electricity Generation during 2013, by State
European nations have demonstrated that wind energy can reliably provide an even larger share
of generation, with Ireland, Spain, and Portugal obtaining around 20% of their electricity from
wind on an annual basis, with Denmark at nearly 35%.12
Including solar and other renewable
energy sources, Germany, Spain, and Portugal obtain over 25% of their electricity from non-
hydro renewables. Carbon emissions have drastically decreased as these countries have ramped
up their use of renewable energy over the last decade.13
These power systems are among the
most reliable in the world, and their reliability has increased as they have increased their use of
renewable energy.14
For comparison, 17% is the highest target for non-hydro renewable generation set for any region
under EPA’s Building Block 3 targets, with the nation as a whole targeted to reach an average of
12% by 2030.15
European nations and some U.S. power systems have already demonstrated that
much higher levels of renewable energy use can be reliably accommodated.
12
Available at http://emp.lbl.gov/sites/all/files/2013_Wind_Technologies_Market_Report_Final3.pdf, page 8. 13
See IEA data on page 18 at http://awea.files.cms-
plus.com/FileDownloads/pdfs/AWEA_Clean_Air_Benefits_WhitePaper%20Final.pdf. 14
Available at http://spectrum.ieee.org/energywise/energy/the-smarter-grid/germanys-superstable-solarsoaked-grid. 15
Available at http://www.ucsusa.org/sites/default/files/attach/2014/10/Strengthening-the-EPA-Clean-Power-
Plan.pdf .

7 | P a g e
More than a dozen wind integration studies by U.S. grid operators and others have found that
wind energy can reliably supply at least 20-30% of our electricity,16
with some studies analyzing
wind providing 40% of total electricity on an annual basis. For example, NREL’s Renewable
Energy Futures study found no reliability problems for a case in which wind and solar provide
nearly 50% of total electricity.17
A wind integration study by Nebraska utilities found minimal
integration costs and no reliability concerns associated with wind providing 40% of electricity in
the Southwest Power Pool.18
The Minnesota Department of Commerce just released a
comprehensive study that found no challenges to integrating 40% wind and solar energy in
Minnesota, including a detailed examination of power system dynamics and other reliability
services. The study also found no challenges for accommodating the variability associated with
wind and solar providing 50% of electricity in the state, though due to time constraints the study
did not include a full analysis of power system dynamics in that case.19
NREL’s analyses of
30+% renewable energy penetrations in the Eastern and Western U.S. also found no reliability
problems or economic barriers.20
ERCOT21
and MISO22
have the largest amount of wind generation in the U.S., and each has
analyzed its actual grid operating experience and found that wind contributes minimally to its
need for regulating reserves. AWEA analysis of the ERCOT data demonstrates that the impact of
wind energy on ERCOT’s total cost of operating reserves is less than 1/17th
of the cost for the
contingency reserves used to manage abrupt outages of large conventional power plants.23
Because the variability added by wind energy is gradual and can be forecast, it is much less
costly to accommodate than the instantaneous and unpredictable outages at large conventional
power plants that require grid operators to hold expensive fast-acting reserves 24/7/365.
16
Available at http://variablegen.org/resources/#!/3700/u-s-regional-and-state-studies. 17
Available at http://www.nrel.gov/analysis/re_futures/. 18
Available at http://www.nepower.org/Wind_Study/final_report.pdf. 19
Available at
https://www.edockets.state.mn.us/EFiling/edockets/searchDocuments.do?method=showPoup&documentId=%7bD6
07FB96-F80C-49EE-A719-39C411D5D7C3%7d&documentTitle=201411-104466-01. 20
Available at http://www.nrel.gov/docs/fy11osti/47078.pdf,
http://www.nrel.gov/electricity/transmission/western_wind.html. 21
Available at http://variablegen.org/wp-content/uploads/2012/12/Maggio Reserve_Calculation_Methodology_Discussion.pdf. 22
Available at http://variablegen.org/wp-content/uploads/2012/12/Navid-Reserve_Calculation.pdf 23
Available at http://aweablog.org/blog/post/fact-check-winds-integration-costs-are-lower-than-those-for-other-
energy-sources.

8 | P a g e
Because grid operators only care about total power system variability and not the variability of
any one source of supply or demand, variability is most efficiently addressed on a system-wide
basis. Increases in output at one wind turbine are often offset by decreases in output at another
wind turbine or solar plant, and most of the fleet-wide changes in renewable output are offset by
other changes in supply or demand.24
Because most sources of variability cancel each other out,
attempting to counteract the variability of any one resource can actually make total power system
variability worse. For this reason, energy storage and other sources of flexibility are most cost-
effectively used as system resources, not coupled to individual sources of variability.
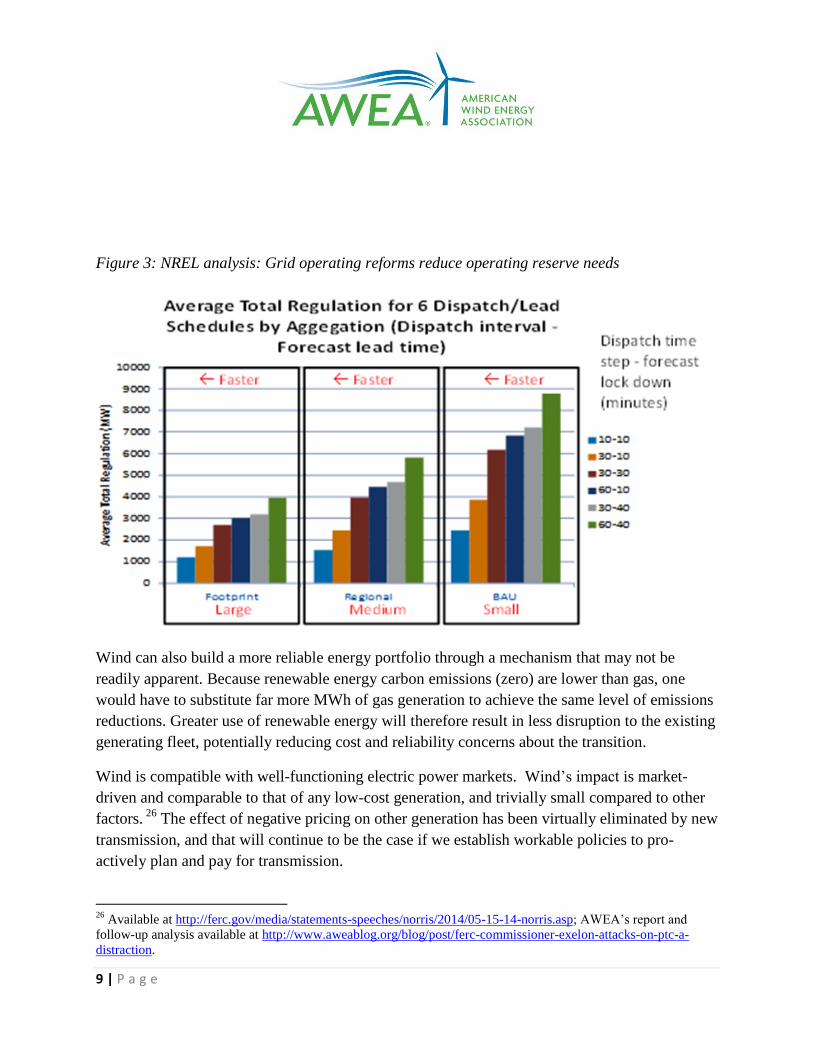
Moreover, the most cost-effective sources of flexibility are grid operating reforms and
transmission upgrades that allow greater use of the flexibility that is already built into the power
system, rather than adding new flexible resources. For example, grid operating reforms to create
more coordinated and efficient generator dispatch across the Western U.S. provide more than
enough flexibility to accommodate very high penetrations of renewable energy at a negative cost
by drastically reducing operating reserve needs, as shown below.25
Given the demonstrated
ability of many ISOs and other areas with efficient operating practices to integrate large
quantities of renewable energy, any obstacles to increased renewable integration are entirely due
to inefficient grid operating practices that need to be updated anyway.
24
For dozens of wind integration studies that have documented this effect, see http://variablegen.org/resources/;
also, http://www2.vtt.fi/inf/pdf/tiedotteet/2009/T2493.pdf, pages 19-26. 25
Available at http://www.nrel.gov/docs/fy13osti/60451.pdf.
Factor
Total annual
reserve cost
(million $)
% of total reserve cost Cost per MWh of
total/wind generation
Conventional power
plant failures $239.690 67% $0.65/MWh
Conventional and
demand deviations $103.359 29% $0.28/MWh
Wind $13.740 4% $0.37/MWh
9 | P a g e
Figure 3: NREL analysis: Grid operating reforms reduce operating reserve needs
Wind can also build a more reliable energy portfolio through a mechanism that may not be
readily apparent. Because renewable energy carbon emissions (zero) are lower than gas, one
would have to substitute far more MWh of gas generation to achieve the same level of emissions
reductions. Greater use of renewable energy will therefore result in less disruption to the existing
generating fleet, potentially reducing cost and reliability concerns about the transition.
Wind is compatible with well-functioning electric power markets. Wind’s impact is market-
driven and comparable to that of any low-cost generation, and trivially small compared to other
factors. 26
The effect of negative pricing on other generation has been virtually eliminated by new
transmission, and that will continue to be the case if we establish workable policies to pro-
actively plan and pay for transmission.
26
Available at http://ferc.gov/media/statements-speeches/norris/2014/05-15-14-norris.asp; AWEA’s report and
follow-up analysis available at http://www.aweablog.org/blog/post/ferc-commissioner-exelon-attacks-on-ptc-a-
distraction.

10 | P a g e
B. Wind energy diversifies our generation portfolios, which increases reliability.
The portfolio diversity benefits of wind energy were particularly pronounced last winter as
generator outages and fuel price spikes caused electricity prices to soar as many regions faced
record winter demand. Wind energy continued to produce at or above expectations with no
exposure to fuel price increases. The consumer savings from stably-priced wind generation
totaled at least $1 billion over two days in PJM alone.27
During another cold snap in early
January 2015, wind energy similarly provided record amounts of power to grid operators in the
Central and Eastern U.S. as they faced high demand due to extreme cold.28
These events
illustrate how wind plays a critical role in protecting consumers and reliability by diversifying
our energy mix:
Early on January 6, 2014, the Nebraska Public Power District met record winter
electricity demand with wind providing about 13% of its electricity. The utility explained
that “Nebraskans benefit from NPPD’s diverse portfolio of generating resources. Using a
combination of fuels means we deliver electricity using the lowest cost resources while
maintaining high reliability for our customers.” The utility also noted that “NPPD did not
operate its natural gas generation because the fuel costs were up more than 300 percent
over typical prices.”29
On January 7, 2014, wind output was very high when the New York grid operator faced
record winter demand.30
On January 22 and 23, 2014, PJM electricity and natural gas prices skyrocketed to 10-50
times normal due to extreme cold. Wind output was above 3,000 MW, saving consumers
millions.31
As “a shortage of natural gas triggered by extreme cold weather” affected California on
February 6, 2014, wind energy provided the state with around 2,000 MW at the time of
peak demand, with wind output above 2,500 MW for most of the rest of the evening.32
27
Available at http://awea.files.cms-plus.com/AWEA%20Cold%20Snap%20Report%20Final%20-
%20January%202015.pdf. 28
Available at http://www.utilitydive.com/news/wind-generation-hits-records-mitigates-price-spikes-during-cold-
snap/351057/. 29
Available at http://www.nppd.com/2014/nebraska-customers-set-time-winter-peak-nppd/. 30
Available at http://www.nyiso.com/public/webdocs/media_room/press_releases/2014/NYISO%20-
%20Frigid%20Temperatures%20from%20Polar%20Vortex%20Drive%20Record%20Winter%20Demand%20-
%2001_09_14%20-%20FINAL.pdf. 31
Available at http://www.pjm.com/markets-and-operations/ops-analysis.aspx. 32
Available at http://www.caiso.com/Documents/ISOissuesStatewideFlexAlert.pdf.

11 | P a g e
The state grid operator noted that this wind output allowed it to avoid calling an energy
emergency alert.33
These events also highlight that resource adequacy is a system issue, and that no energy source is
100% available. A diverse portfolio is one of the best ways to protect against the type of
common mode failure that can affect any type of generation, often in unforeseen ways. Grid
operators already know how to use statistical tools to account for the capacity value provided by
each resource, including wind energy.34
No new capacity is needed to integrate wind, as wind’s
capacity value contribution is always positive.35
Most U.S. power systems currently have a
surplus of capacity, and for those that do not it can be obtained at relatively low cost through
demand response and energy efficiency, the 45+ GWs of new gas generation that is already
being built,36
or even retaining some existing generating capacity (which only incurs a plant’s
ongoing fixed costs and will not significantly impair Clean Power Plan compliance as retaining a
plant for capacity purposes has a negligible impact on emissions).
C. Modern wind turbine generators provide the same reliability services as
conventional generation.
As wind energy has grown to provide a larger share of our electricity mix, wind turbine
technology has matured so that modern wind plants are able to provide the same grid reliability
services as conventional generators, due in part to FERC’s leadership under Order 661A. As
NERC has stated, “[t]his issue does not exist for utility-scale wind energy, which offers ride-
through capabilities and other essential reliability services,”37
and “[m]odern wind turbine
generators can meet equivalent technical performance requirements provided by conventional
generation technologies with proper control strategies, system design, and implementation.”38
Detailed analyses show that essential reliability services will be maintained at high renewable
levels in both the Eastern and Western Interconnections.39
Wind plants can provide frequency
response, inertial response, active power control, voltage and frequency ride-through, voltage
and reactive power control, and other grid reliability needs:
33
SNL Energy article, Christine Cordner, “CAISO: Wind, demand response helped avoid February emergency
alert,” March 21, 2014. 34
Available at http://www.nrel.gov/docs/fy08osti/43433.pdf. 35
See page 2 at http://www.nrel.gov/docs/fy11osti/51860.pdf. 36
Available at www.nerc.com/pa/RAPA/ra/Reliability Assessments DL/2014LTRA_ERATTA.pdf, page 18. 37
Available at http://www.nerc.com/pa/RAPA/ra/Reliability%20Assessments%20DL/2014LTRA_ERATTA.pdf at
15. 38
Available at http://www.nerc.com/files/ivgtf_report_041609.pdf, page 22. 39
Available at http://www.nrel.gov/docs/fy15osti/62906.pdf, http://www.nrel.gov/docs/fy13osti/58077.pdf.

12 | P a g e
Reliability
service
Wind Conventional generation
Ride-
through
- Excellent voltage and frequency ride-
through per FERC Order 661A
requirements
- Power electronics electrically separate
wind turbine generators from grid
disturbances, providing them with much
greater ability to remain online through
disturbances
- Many cannot match wind’s capabilities
or meet Order 661A ride-through
requirements
Reactive
and
voltage
control
- Wind turbine power electronics
provide reactive and voltage control
equivalent to that of conventional
generators40
- Power electronics can provide reactive
power and voltage control even when
the wind plant is not producing power41
- Because reactive needs are location-
specific on grid, 661A approach of
providing reactive in locations where it
is needed is more efficient than blanket
requirement
- Provides
Active
power
control
- Can provide extremely fast response in
seconds, far faster than conventional
generation42
- Like other generators, wind will
provide this response when it is
economic to do so
- Xcel Energy sometimes uses its wind
plants to provide some or all of its
frequency-responsive automatic
generation control43
- Like wind, many baseload generators
do not provide active power control for
economic reasons, though they
technically can
40
Available at http://www.nerc.com/files/ivgtf_report_041609.pdf, page 22, “As variable resources, such as wind
power facilities, constitute a larger proportion of the total generation on a system, these resources may provide
voltage regulation and reactive power control capabilities comparable to that of conventional generation. Further,
wind plants may provide dynamic and static reactive power support as well as voltage control in order to contribute
to power system reliability.” 41
Available at http://energy.sandia.gov/wp/wp-content/gallery/uploads/ReactivePower_IEEE_final.pdf. 42
Available at http://www.nrel.gov/electricity/transmission/active_power.html. 43
Available at http://www.nrel.gov/electricity/transmission/pdfs/wind_workshop2_13bartlett.pdf.

13 | P a g e
Frequency
response
-Adding wind can help system frequency
response by causing conventional
generation to be dispatched down44
-Wind can provide frequency response,
but it is typically more costly for it to do
so than for other resources as it requires
curtailing wind generation in advance45
-A market-based solution would procure
frequency response from the lowest cost
resources
- Changes in conventional generator
operating procedures have greatly
reduced frequency response46
- Only 70-75% of generators have
governors that are capable of sustaining
frequency response for more than one
minute, and about half of conventional
generators have controls that may
withdraw sustained frequency response
for economic reasons47
- “Only 30% of the units on-line provide
primary frequency response. Two-thirds
of the units that did respond exhibit
withdrawal of primary frequency
response.” So, “Only 10% of units on-
line sustain primary frequency
response.”48
- The cost of providing and sustaining
frequency response is very low for a
conventional generator, so a market-
based solution would incentivize the
needed frequency response at low cost
Inertial
response
-Can provide with no lost production by
using power electronics and the inertia
of the wind turbine rotor; this capability
is commercially available but not widely
deployed because there is no payment
for any resource to provide this service49
-Provides
44
Available at http://www.nerc.com/pa/RAPA/ra/Reliability%20Assessments%20DL/2014LTRA_ERATTA.pdf at
page 29, “However, by causing conventional generators to have their output dispatched down, wind and solar
generation can increase generator headroom and, therefore, the amount of total frequency response being provided.”
45 Id., “Wind resources can offer inertia and frequency response, depending on the design attributes of a given wind
plant.” 46
Available at http://www.nerc.com/files/FinalFile_Comments_Resp_to_Sept_Freq_Resp_Tech_Conf.pdf. 47
Available at http://www.nerc.com/docs/pc/FRI_Report_10-30-12_Master_w-appendices.pdf, pages 32-33. 48
Id. at page 37. 49
Available at
http://web.mit.edu/windenergy/windweek/Presentations/GE%20Impact%20of%20Frequency%20Responsive%20Wi
nd%20Plant%20Controls%20Pres%20and%20Paper.pdf; http://www.nerc.com/files/ivgtf_report_041609.pdf, page
18, “In common with Type 3 wind turbine-generators, this decoupling means that in the standard design inertial
response can be a programmed feature during a frequency event and the Type 4 wind turbine-generators can provide
comparable inertial response/ performance to a conventional generator.”

14 | P a g e
Increases
need for
operating
reserves,
integration
cost
- Very small impact on total reserve
need and integration cost
-Contingency reserve needs and costs are
quite large
IV. More transmission is needed, with or without the Clean Power Plan.
While reliability can be preserved under the Clean Power Plan given the wide range of tools and
flexibility provided, cost-effective implementation will require transmission investment.
Through FERC leadership, and the leadership of states and participants such as in SPP and
MISO, success in building high voltage interstate transmission has been demonstrated. This
shows how to do it, not that the job is done. This recent period of activity followed many
decades of neglect, so much of the transmission that has been built recently is simply backfilling
long-standing reliability needs that had been deferred for too long. Many regions have made only
minimal transmission investments as they do not yet have the right policies in place, and there is
still no mechanism to pay for the interregional transmission lines that are most desperately
needed. Moreover, only a small share of this transmission is designed to facilitate the
interconnection of new generation resources or manage the generation mix change that is already
underway and will be accelerated by the Clean Power Plan.50
New infrastructure will be essential if we are cost-effectively to deploy any of the low-emission
generation options at the scale needed. While distributed generation, “smart grid,” and other
innovative solutions provide some benefit and should be part of the solution, they provide much
less cost-effective carbon reduction for states to comply with the Clean Power Plan than utility-
scale renewables, which require high-voltage transmission from resource areas to load centers.
We can follow successful models from recent experience of transmission projects that are
helping to increase reliability, reduce costly congestion, and integrate large quantities of new
generation resources. These include the CREZ lines in Texas, the Priority Projects in SPP, the
Multi-Value Projects in MISO, the Tehachapi project in California, and the Open Season lines in
the Bonneville Power Administration service territory. These success stories stand as models of
what can happen when the right transmission policies – pro-active planning and broad cost
allocation – are put in place.
50
Available at www.nerc.com/pa/RAPA/ra/Reliability Assessments DL/2014LTRA_ERATTA.pdf, “According to
the 2014 LTRA reference case, 16 percent of new transmission projects (under construction, planned, or conceptual)
identify variable resource integration as a primary driver.”

15 | P a g e
One of transmission’s greatest values is that it serves as an insurance policy against the
unexpected. For example, the CREZ lines have paid numerous and often unexpected dividends,
from allowing Texas to nearly double its use of wind energy, to accommodating increased
electricity demand for oil and gas drilling in West Texas,51
to averting reliability problems in
major cities like Dallas and San Antonio.52
The optionality provided by transmission will be extremely valuable because Clean Power Plan
decisions will have to be made under significant uncertainty about generator additions and
retirements, fuel prices, load growth, and other market forces. Transmission does have a long
lead time, so if we don’t act now we foreclose a whole branch of options that we may come to
wish dearly we had maintained.
Virtually all of the risk is on the do-nothing side of the ledger, while all of the reward is on the
transmission side. The speed with which CREZ transmission capacity has been subscribed in
ERCOT shows that the risk of a stranded asset is minimal to nonexistent. Even with near-record
low natural gas prices, wind’s declining costs and ability to reach 50%+ capacity factors in
newly opened up resource areas virtually guarantee it will be an attractive option. If you build it,
wind will come.
Without renewables and transmission, the cost of new generation for Clean Power Plan
compliance is essentially the price margin between gas and coal, each of which are highly
uncertain. By not building transmission, one is betting that the stars will align and throughout the
period of 5-15 years from now two fuel prices floating in a sea of uncertainty will still be as
close together as they are today.
The level of needed transmission investment is achievable. The forthcoming DOE Wind Vision
report concludes that obtaining 20% of our electricity from wind energy by 2030 only requires
890 miles/year of additional transmission from 2021 to 2030 beyond the baseline scenario. For
comparison, 21,800 circuit miles are currently planned with in-service dates before 2023.53
51
See full edition of article previewed here:
http://www.quorumreport.com%2fQuorum_Report_Daily_Buzz_2014%2ftexas_energy_report_smitherman_chafes
_at_comptroll_buzziid22608.html. 52
Available at
http://www.ercot.com/content/news/presentations/2013/2012%20Long%20Term%20System%20Assessment.pdf, at
pages 34-35 and 38. 53
Available at http://energy.gov/sites/prod/files/2015/01/f19/AWEA-2014-Fall-Symposium-Presentation-by-Jose-
Zayas.pdf, page 13.

16 | P a g e
V. FERC leadership will be essential.
While reliability can be maintained regardless, the Commission can take important steps to
ensure that infrastructure is in place for the Clean Power Plan to be met most cost-effectively.
These policies would be important even in the absence of the Clean Power Plan, though their
value is expanded as the changing generation mix makes planning even more important. These
steps include:
A. Encourage pro-active and comprehensive transmission planning. Ensure that
the Clean Power Plan is considered as a public policy requirement under
Order No. 1000 in each region’s transmission planning.
For states and regions to have the most cost-effective compliance options on the table, it is
critical that transmission planning begin now. Because state compliance plans may not be
finalized for several years at least, and those plans will be informed by what infrastructure is
expected to be available, we cannot wait until then to begin planning transmission. This situation
is much like the “chicken-or-the-egg” dilemma that has harmed transmission planning for
renewable generation, driven by the mismatch between the short amount of time it takes to build
renewable generation relative to the time it takes to build transmission and what had been the
hesitancy for transmission planning to proceed without planned generation and vice versa.
Pro-active transmission planning, as demonstrated through the success of Texas’s Competitive
Renewable Energy Zone process, MISO’s Regional Generation Outlet Study, and SPP’s
Integrated Transmission Planning process, is part of the solution. This approach plans
transmission to access general resource areas based on general resource zones and not specific
planned generators.
While there will be uncertainty about the precise mix of compliance solutions that will be
included in State Implementation Plans, scenario planning can provide a great deal of
information to inform states about the net costs and benefits of different options and also identify
“no regrets” transmission lines that will have value regardless of what mix of compliance options
is ultimately pursued. Transmission planning must always be conducted under significant
uncertainty about future fuel prices, electricity demand, generator additions and retirements, and
other factors, so uncertainty about the precise form of State Implementation Plans is not a valid
reason for delaying serious transmission planning. The transmission planning process itself will
also facilitate coordination among states in the development of State Implementation Plans,
which is likely to result in a more efficient compliance solution for all involved.
The other key policy design is broad transmission cost allocation, which is a critical feature in
the successful transmission policies in ERCOT, SPP, and MISO. This policy is consistent with

17 | P a g e
FERC cost allocation principles that the beneficiaries of upgrades should pay for the cost, as it
recognizes that large-scale transmission projects inherently provide benefits to all ratepayers in a
region through improved reliability, greater access to low-cost generation, improved market
efficiency, and protection against fuel price uncertainty.54
One key area for improving Order 1000 is for public policy requirements to be more than just
“considered.” That terminology was used before the Clean Power Plan emerged as one of the
most important factors affecting the electric sector, so now is a good time to revisit that question.
Most of the regional compliance filings under Order 1000 have weak provisions for the planning
of transmission for public policy matters.
B. Establish functioning inter-regional transmission planning and cost
allocation policies.
Inter-regional planning remains a major gap that can be improved upon. The economic and
reliability benefits are massive, given the significant economies of scale in very high-voltage
transmission. However, it is very hard to achieve consensus on cost allocation for such lines.
The Order 1000 Interregional provisions, while an improvement, do not provide a sufficient
framework for building transmission to access the most cost-effective carbon solutions. One
important part of the solution will be long distance high voltage DC lines from wind-rich areas to
load centers, which requires less regulatory action.
There is currently no effective mechanism to plan and pay for inter-regional transmission, though
this can be solved using the same policies that have worked to plan and pay for transmission at
the regional level, as discussed above. Order 1000 provided the start of a process for inter-
regional transmission planning and cost allocation, and FERC must not hesitate to use this
authority that has now been validated by the courts.
C. Promote grid operating reforms that are beneficial with or without the Clean
Power Plan.
Regardless of the Clean Power Plan, a weak grid compounded by a lack of situational awareness
caused by obsolete grid operating practices is a major reliability threat, having contributed to the
September 2011 Southwest blackout and other recent reliability events.55
By improving power
system efficiency, grid operating reforms provide large net economic benefits to consumers,
even without the presence of renewable generation. A primary focus should be implementation
54
Available at
http://cleanenergytransmission.org/uploads/WIRES%20Brattle%20Rpt%20Benefits%20Transmission%20July%202
013.pdf. 55
Available at http://www.ferc.gov/legal/staff-reports/04-27-2012-ferc-nerc-report.pdf, page 5.

18 | P a g e
of an Energy Imbalance Market, which has provided large net benefits in the Southwest Power
Pool56
and studies have indicated would create major net benefits in the Western U.S.57
D. Ensure the independence of NERC and reliability authorities.
FERC should continue, consistent with its statutory mandate, to ensure that NERC and the
regional EROs represent the full balance of interests in developing reliability studies and
otherwise exercising their duties. NERC, as well as the regional EROs, are supposed to be
independent of the users and owners and operators of the bulk-power system. Some analyses
being done are truly “garbage-in/garbage-out” exercises using outdated assumptions about clean
energy. Such analyses with built-in biases should not be viewed as credible. In short, FERC
needs to make sure, through audits or other oversight tools, that NERC’s and the regional
authorities’ studies do not unduly represent the interests of a particular segment of the electric
power industry and their assessments of reliability issues can relied upon for their objectivity and
thoroughness.
56
Available at http://www.spp.org/publications/spp_market_launch_feb_01_2007.pdf. 57
Available at http://www.nrel.gov/docs/fy13osti/57115.pdf .