Embed Size (px)
Citation preview
JTChair - 1 - No.2
Case StudyStatus Quo Standards versus an Alternative Standard, East Claytontwo alternative development site standards compared
I. Introduction
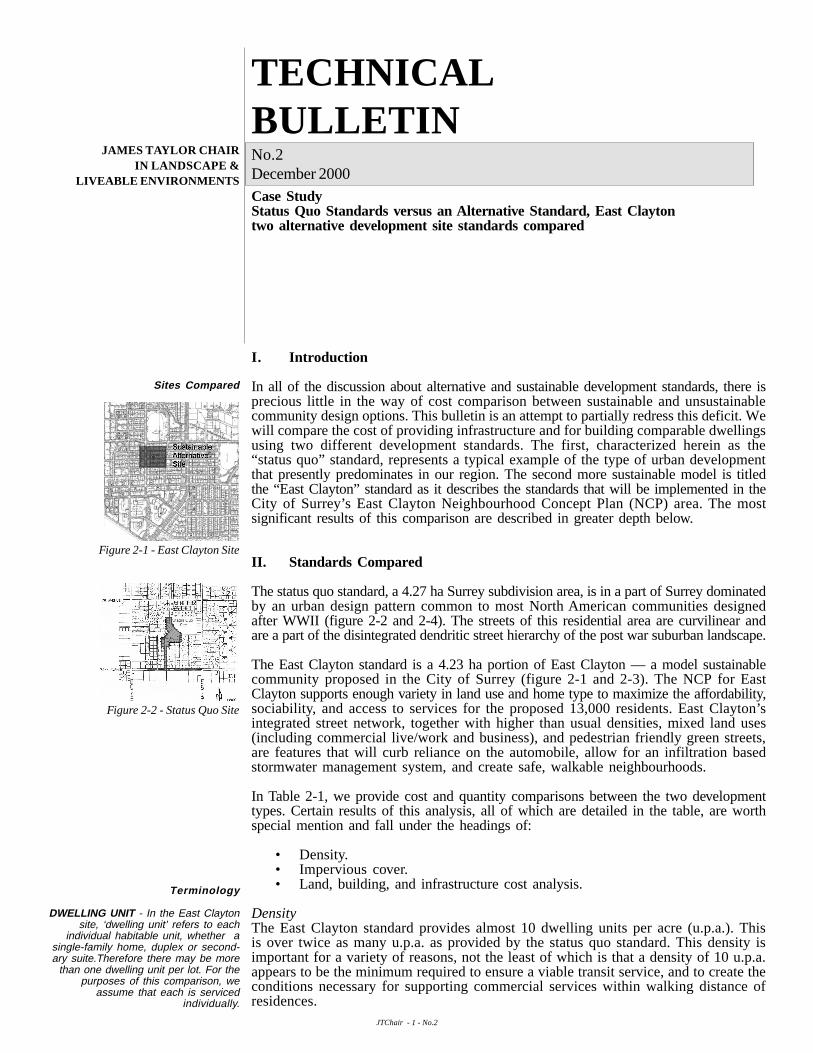
In all of the discussion about alternative and sustainable development standards, there isprecious little in the way of cost comparison between sustainable and unsustainablecommunity design options. This bulletin is an attempt to partially redress this deficit. Wewill compare the cost of providing infrastructure and for building comparable dwellingsusing two different development standards. The first, characterized herein as the“status quo” standard, represents a typical example of the type of urban developmentthat presently predominates in our region. The second more sustainable model is titledthe “East Clayton” standard as it describes the standards that will be implemented in theCity of Surrey’s East Clayton Neighbourhood Concept Plan (NCP) area. The mostsignificant results of this comparison are described in greater depth below.
II. Standards Compared
The status quo standard, a 4.27 ha Surrey subdivision area, is in a part of Surrey dominatedby an urban design pattern common to most North American communities designedafter WWII (figure 2-2 and 2-4). The streets of this residential area are curvilinear andare a part of the disintegrated dendritic street hierarchy of the post war suburban landscape.
The East Clayton standard is a 4.23 ha portion of East Clayton — a model sustainablecommunity proposed in the City of Surrey (figure 2-1 and 2-3). The NCP for EastClayton supports enough variety in land use and home type to maximize the affordability,sociability, and access to services for the proposed 13,000 residents. East Clayton’sintegrated street network, together with higher than usual densities, mixed land uses(including commercial live/work and business), and pedestrian friendly green streets,are features that will curb reliance on the automobile, allow for an infiltration basedstormwater management system, and create safe, walkable neighbourhoods.
In Table 2-1, we provide cost and quantity comparisons between the two developmenttypes. Certain results of this analysis, all of which are detailed in the table, are worthspecial mention and fall under the headings of:
• Density.• Impervious cover.• Land, building, and infrastructure cost analysis.
DensityThe East Clayton standard provides almost 10 dwelling units per acre (u.p.a.). Thisis over twice as many u.p.a. as provided by the status quo standard. This density isimportant for a variety of reasons, not the least of which is that a density of 10 u.p.a.appears to be the minimum required to ensure a viable transit service, and to create theconditions necessary for supporting commercial services within walking distance ofresidences.
JAMES TAYLOR CHAIRIN LANDSCAPE &
LIVEABLE ENVIRONMENTS
TECHNICALBULLETINNo.2December 2000
Terminology
DWELLING UNIT - In the East Claytonsite, ‘dwelling unit’ refers to each
individual habitable unit, whether asingle-family home, duplex or second-ary suite.Therefore there may be more
than one dwelling unit per lot. For thepurposes of this comparison, we
assume that each is servicedindividually.
Sites Compared
Figure 2-2 - Status Quo Site
Figure 2-1 - East Clayton Site
JTchair - 2 - No. 2
Impervious coverThe percent of impervious surface in both standards is about the same at approximately50%. Considering the higher density, the East Clayton standard performs even better thanexpected for impervious cover because the dwelling units are relatively thin and tall, and roadsare narrower. Despite the land efficiency of the East Clayton standard, every dwelling unitincludes at least a small terrace or small backyard, and in some cases a backyard comparableto those found in the status quo standard.
Land, building and infrastructure cost analysisOn a per dwelling unit basis, the cost for land is $48,000 less in the East Clayton standardas compared to the status quo standard. This difference is primarily a result of the higherdensity and more efficient street layout in the East Clayton standard.
Sites Compared
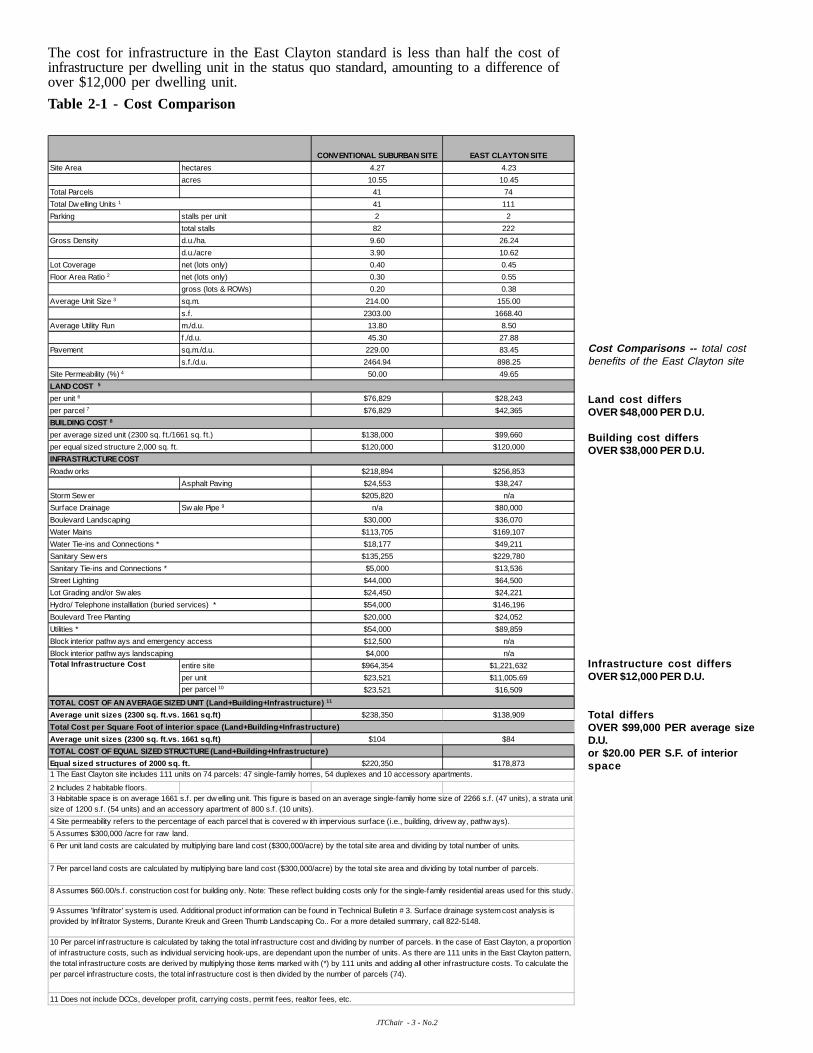
Figure 2-4 - Status Quo site - Aresidential development in South
Newton, B.C. comprised of a 4.27 haarea of single-family homes on largelots with a curvilinear street pattern.
The density is 4 dwelling units per acre.
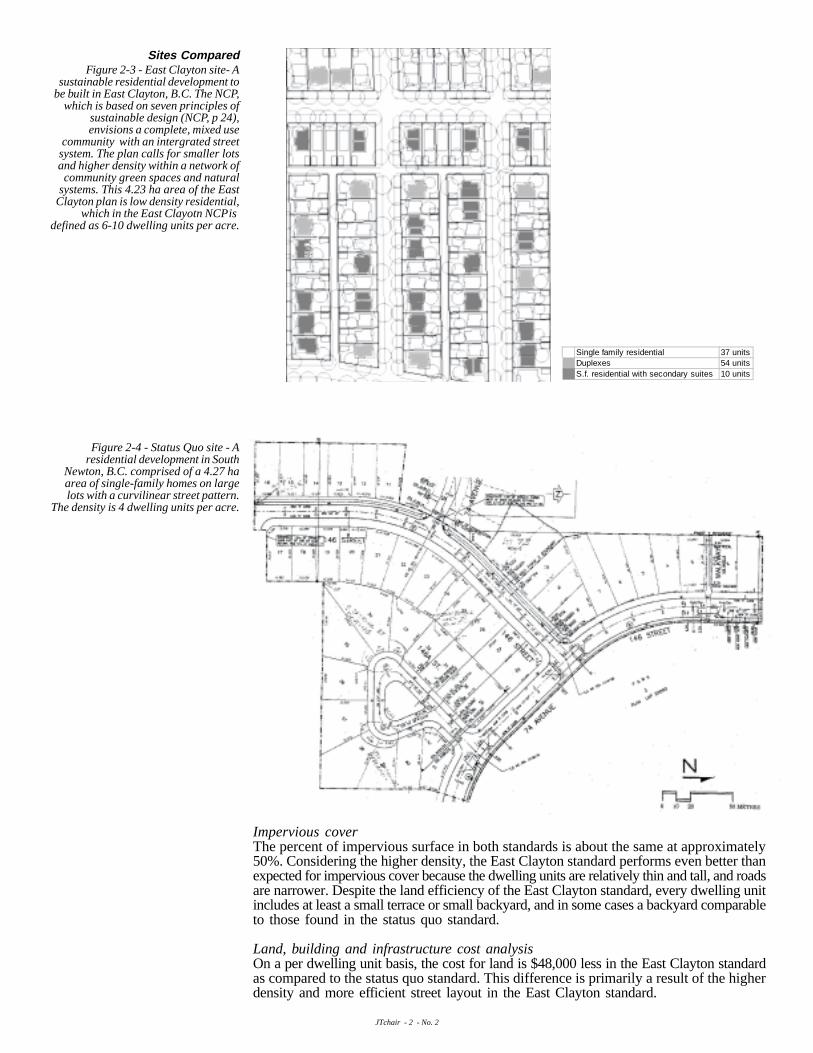
Figure 2-3 - East Clayton site- Asustainable residential development to
be built in East Clayton, B.C. The NCP,which is based on seven principles of
sustainable design (NCP, p 24),envisions a complete, mixed use
community with an intergrated streetsystem. The plan calls for smaller lotsand higher density within a network ofcommunity green spaces and natural
systems. This 4.23 ha area of the EastClayton plan is low density residential,
which in the East Clayotn NCP isdefined as 6-10 dwelling units per acre.
Single family residential 37 unitsDuplexes 54 unitsS.f. residential with secondary suites 10 units
JTChair - 3 - No.2
Cost Comparisons -- total costbenefits of the East Clayton site
Land cost differsOVER $48,000 PER D.U.
Building cost differsOVER $38,000 PER D.U.
The cost for infrastructure in the East Clayton standard is less than half the cost ofinfrastructure per dwelling unit in the status quo standard, amounting to a difference ofover $12,000 per dwelling unit.
Table 2-1 - Cost Comparison
Infrastructure cost differsOVER $12,000 PER D.U.
Total differsOVER $99,000 PER average sizeD.U.or $20.00 PER S.F. of interiorspace
Site Area hectares 4.27 4.23
acres 10.55 10.45
Total Parcels 41 74
41 111
Parking stalls per unit 2 2
total stalls 82 222
Gross Density d.u./ha. 9.60 26.24
d.u./acre 3.90 10.62
Lot Coverage net (lots only) 0.40 0.45
Floor Area Ratio 2 net (lots only) 0.30 0.55
gross (lots & ROWs) 0.20 0.38
Average Unit Size 3 sq.m. 214.00 155.00
s.f. 2303.00 1668.40
Average Utility Run m./d.u. 13.80 8.50
f./d.u. 45.30 27.88
Pavement sq.m./d.u. 229.00 83.45
s.f./d.u. 2464.94 898.25
50.00 49.65
$76,829 $28,243
$76,829 $42,365
$138,000 $99,660
$120,000 $120,000
$218,894 $256,853
Asphalt Paving $24,553 $38,247
$205,820 n/a
Surface Drainage Sw ale Pipe 9 n/a $80,000
$30,000 $36,070
$113,705 $169,107
$18,177 $49,211
$135,255 $229,780
$5,000 $13,536
$44,000 $64,500
$24,450 $24,221
$54,000 $146,196
$20,000 $24,052
$54,000 $89,859
$12,500 n/a
$4,000 n/a
entire site $964,354 $1,221,632
per unit $23,521 $11,005.69
per parcel 10 $23,521 $16,509
$238,350 $138,909
$104 $84
TOTAL COST OF EQUAL SIZED STRUCTURE (Land+Building+Infrastructure)
Equal sized structures of 2000 sq. ft. $220,350 $178,873
2 Includes 2 habitable f loors.
Total Cost per Square Foot of interior space (Land+Building+Infrastructure)
Average unit sizes (2300 sq. ft.vs. 1661 sq.ft)
9 Assumes 'Infiltrator' system is used. Additional product information can be found in Technical Bulletin # 3. Surface drainage system cost analysis is provided by Inf iltrator Systems, Durante Kreuk and Green Thumb Landscaping Co.. For a more detailed summary, call 822-5148.
10 Per parcel infrastructure is calculated by taking the total infrastructure cost and dividing by number of parcels. In the case of East Clayton, a proportion of infrastructure costs, such as individual servicing hook-ups, are dependant upon the number of units. As there are 111 units in the East Clayton pattern, the total infrastructure costs are derived by multiplying those items marked w ith (*) by 111 units and adding all other infrastructure costs. To calculate the per parcel infrastructure costs, the total infrastructure cost is then divided by the number of parcels (74).
11 Does not include DCCs, developer profit, carrying costs, permit fees, realtor fees, etc.
5 Assumes $300,000 /acre for raw land.
6 Per unit land costs are calculated by multiplying bare land cost ($300,000/acre) by the total site area and dividing by total number of units.
7 Per parcel land costs are calculated by multiplying bare land cost ($300,000/acre) by the total site area and dividing by total number of parcels.
8 Assumes $60.00/s.f. construction cost for building only. Note: These ref lect building costs only for the single-family residential areas used for this study.
Average unit sizes (2300 sq. ft.vs. 1661 sq.ft)
1 The East Clayton site includes 111 units on 74 parcels: 47 single-family homes, 54 duplexes and 10 accessory apartments.
3 Habitable space is on average 1661 s.f. per dw elling unit. This figure is based on an average single-family home size of 2266 s.f. (47 units), a strata unit size of 1200 s.f. (54 units) and an accessory apartment of 800 s.f. (10 units).
4 Site permeability refers to the percentage of each parcel that is covered w ith impervious surface (i.e., building, drivew ay, pathw ays).
Block interior pathw ays and emergency access
Block interior pathw ays landscaping Total Infrastructure Cost
TOTAL COST OF AN AVERAGE SIZED UNIT (Land+Building+Infrastructure) 11
Lot Grading and/or Sw ales
Hydro/ Telephone installlation (buried services) *
Boulevard Tree Planting
Utilities *
Water Tie-ins and Connections *
Sanitary Sew ers
Sanitary Tie-ins and Connections *
Street Lighting
Roadw orks
Storm Sew er
Boulevard Landscaping
Water Mains
BUILDING COST 8
per average sized unit (2300 sq. f t./1661 sq. f t.)
per equal sized structure 2,000 sq. ft.
INFRASTRUCTURE COST
Site Permeability (%) 4
LAND COST 5
per unit 6
per parcel 7
CONVENTIONAL SUBURBAN SITE EAST CLAYTON SITE
Total Dw elling Units 1
JTchair - 4 - No. 2
Contact Us:
JAMES TAYLOR CHAIRIN LANDSCAPE & LIVEABLE ENVIRONMENTS
University of British ColumbiaLandscape Architecture Program
2357 Main MallVancouver, BC
V6T 1Z2
For more information please visit our site:www. sustainable-communities.agsci.ubc.ca
or email us at:[email protected]
UNIVERSITY OFBRITISH COLUMBIA
The total average cost (land, building and infrastructure) per dwelling unit in the statusquo standard is over $99,000 more than the average cost per delling unit in the EastClayton standard. The total savings come from reductions in infrastructure cost and fromincreased density. As a way of comparing "apples to apples”, the total cost of equal sizedstructures is calculated by adding the per parcel land costs, the per parcel infrastructurecosts and a 2,000 sq. ft. building cost. The total cost of equal sized structures is over $41,000more in the conventional plan when compared to the East Clayton plan.1
An additional important consideration for the City is the relationship between the valueof its homes and the future cost of replacing the infrastructure that serves them, especiallyas it relates to municipal tax revenue. The higher the relative value of the homes to thereplacement cost of the infrastructure the better. Given that there is almost twice as muchhousing value per acre in the East Clayton site than in the status quo site, the potentialtax revenues would also be double, while the infrastructure to serve the area would beabout equal in cost to replace.
Finally it should be recognized that our computations do not consider the effect of thetwo alternative proposals on off-site infrastructure and development cost charges; however,most assessments of this question support the common sense conclusion that a tightercommunity pattern requires lower per capita expenditures for roads, storm drains, utilitytrunk lines, and sanitary systems than do more sprawling communities.
ResourcesBerridge Lewinberg Greenberg Dark Gabor LTD. 1996. “The Integrated Community: A study of alternative land developmentstandards.” Canada: Canadian Mortgage and Housing Corporation.
Cornell Development Group. 1994. Municipal Infrastructure Volumes 1 & 2: Servicing Standards and Cost Analysis.Prepared by Marshall Macklin Monaghan, August.
Condon, Patrick. 1997. Alternative Development Standard for Sustainable Communities: Design Workbook. University ofBritish Columbia: UBC Press.
City of Surrey. 1999. East Clayton NCP - Engineering Services Plan. Prepared by Reid Crowther & Partners Ltd.
City of Surrey. 2000. East Clayton Neighbourhood Concept Plan. Prepared by UBC James Taylor Chair in Landscape andLiveable Landscapes.
Essiamgre-Phillips-Desjardins Associates. 1995. “Infrastructure Costs Associated with Conventianal and AlternativeDevelopment Pattens.” Prepared for Canada Mortgage and Housing Corporation.
Frank, James E. 1989. The Costs of Alternative Development Patterns: A Review of the Literature. Urban Land Institute.
Marshall Macklin Monaghan Limited and Berridge Lewinberg Greenberg Dark Gabor Ltd. 1995. Making choices:alternative development standards guidelines. Prepared for Ontario Ministry of Housing and Ministry of Municipal Affairs.
Ministry of Municipal Affairs and Housing. 1997. Breaking Ground: An Illustration of Alternative Development Standardsin Ontario’s New Communities. Ontario: Queen’s Printer for Ontario.