Embed Size (px)
Citation preview

Marine Sanctuaries Conservation Series ONMS-15-12
Technical Appendix: A Socioeconomic Profile of
Recreation Users of the California Northern
Central Coast Region, Greater Farallones
National Marine Sanctuary, and the northern
portion of Monterey Bay National Marine
Sanctuary, 2011
U.S. Department of Commerce
National Oceanic and Atmospheric Administration
National Ocean Service
Office of National Marine Sanctuaries September 2015

About the Marine Sanctuaries Conservation Series
The Office of National Marine Sanctuaries, part of the National Oceanic and
Atmospheric Administration, serves as the trustee for a system of 14 marine protected
areas encompassing more than 170,000 square miles of ocean and Great Lakes waters.
The 13 national marine sanctuaries and one marine national monument within the
National Marine Sanctuary System represent areas of America’s ocean and Great Lakes
environment that are of special national significance. Within their waters, giant
humpback whales breed and calve their young, coral colonies flourish, and shipwrecks
tell stories of our maritime history. Habitats include beautiful coral reefs, lush kelp
forests, whale migrations corridors, spectacular deep-sea canyons, and underwater
archaeological sites. These special places also provide homes to thousands of unique or
endangered species and are important to America’s cultural heritage. Sites range in size
from one square mile to almost 140,000 square miles and serve as natural classrooms,
cherished recreational spots, and are home to valuable commercial industries.
Because of considerable differences in settings, resources, and threats, each marine
sanctuary has a tailored management plan. Conservation, education, research,
monitoring and enforcement programs vary accordingly. The integration of these
programs is fundamental to marine protected area management. The Marine
Sanctuaries Conservation Series reflects and supports this integration by providing a
forum for publication and discussion of the complex issues currently facing the sanctuary
system. Topics of published reports vary substantially and may include descriptions of
educational programs, discussions on resource management issues, and results of
scientific research and monitoring projects. The series facilitates integration of natural
sciences, socioeconomic and cultural sciences, education, and policy development to
accomplish the diverse needs of NOAA’s resource protection mandate. All publications
are available on the Office of National Marine Sanctuaries Web site
(http://www.sanctuaries.noaa.gov).
Technical Appendix: A Socioeconomic Profile of Recreation
Users of the California Northern Central Coast Region,
Greater Farallones National Marine Sanctuary and the
northern portion of the Monterey Bay National Marine
Sanctuary, 2011
Vernon R. Leeworthy, Danielle Schwarzmann and Daniela Reyes Saade
NOAA’s Office of National Marine Sanctuaries
Conservation Science Division
Silver Spring, Maryland
December 2015
U.S. Department of Commerce
Penny Pritzker, Secretary
National Oceanic and Atmospheric Administration
Kathryn Sullivan, Ph.D.
Under Secretary of Commerce for Oceans and Atmosphere
National Ocean Service
Russell Callender, Ph.D., Acting Assistant Administrator
Office of National Marine Sanctuaries
John Armor, Acting Director
U.S. Department of Commerce
Carlos M. Gutierrez, Secretary
National Oceanic and Atmospheric Administration
VADM Conrad C. Lautenbacher, Jr. (USN-ret.)
f Commerce for Oceans and Atmosphere
National Ocean Service
John H. Dunnigan, Assistant Administrator
Office of National Marine Sanctuaries
Daniel J. Basta, Director
Disclaimer
Report content does not necessarily reflect the views and policies of the Office of
National Marine Sanctuaries or the National Oceanic and Atmospheric Administration,
nor does the mention of trade names or commercial products constitute endorsement or
recommendation for use.
Report Availability
Electronic copies of this report may be downloaded from the Office of National Marine
Sanctuaries web site at http://sanctuaries.noaa.gov.
Cover
Robert Pittman/NOAA/Killer Whales
Suggested Citation
Leeworthy,V., Schwarzmann, D., and Reyes Saade, D. 2015. Technical Appendix: A
Socioeconomic Profile of Recreation Users of the California Northern Central Coast
Region, Greater Farallones National Marine Sanctuary and the northern portion of the
Monterey Bay National Marine Sanctuary, 2011. Marine Sanctuaries Conservation
Series ONMS-15-12. U.S. Department of Commerce, National Oceanic and Atmospheric
Administration, Office of National Marine Sanctuaries, Silver Spring, MD. 74 pp.
Contact
Dr. Vernon R. (Bob) Leeworthy Dr. Danielle N. Schwarzmann
Chief Economist Economist
Office of National Marine Sanctuaries Office of National Marine Sanctuaries
1305 East West Highway, SSMC4, 11th floor 1305 East West Highway
Silver Spring, MD 20910 Silver Spring, MD 20910
Telephone: (301) 713-7261 Telephone: (301) 713-7254
Fax: (301) 713-0404 Fax: (301) 713-040
E-mail: [email protected] [email protected]

i
Abstract
This is the technical appendix for the reports “A Socioeconomic Profile of Recreation
Users of the California Northern Central Coast Region, Greater Farallones National
Marine Sanctuary and the northern portion of the Monterey Bay National Marine
Sanctuary, 2011 (Leeworthy et al., 2015) . All the methods of estimation and statistical
tests performed for differences in demographic profiles are documented here.
Key Words
Demographics, recreation use, expenditures, economic impact, methods, surveys,
income, jobs, sanctuaries

ii
Table of Contents
Topic Page
Abstract ................................................................................................................................ i Key Words ........................................................................................................................... i
Table of Contents ................................................................................................................ ii List of Figures and Tables.................................................................................................. iv 1. Introduction .................................................................................................................... 6
Source of Information ..................................................................................................... 6 Survey Methodology ....................................................................................................... 6
What was Estimated ........................................................................................................ 6
Definition of the Study Areas ......................................................................................... 7 Organization of Report ................................................................................................. 15
2. Demographic Profiles of Users .................................................................................... 16
Age. ............................................................................................................................... 17 Gender. .......................................................................................................................... 18
Race/Ethnicity. .............................................................................................................. 19 Marital Status. ............................................................................................................... 19 Head of Household. ...................................................................................................... 20
Household Size. ............................................................................................................ 20 Housing Type. ............................................................................................................... 21
Employment Status. ...................................................................................................... 22 Educational Level. ........................................................................................................ 22
Household Income. ....................................................................................................... 23 Place of Residence – Zip Code. .................................................................................... 24
Place of Residence – County ........................................................................................ 33 3. Recreation Use ............................................................................................................. 34
Annual and Last Trip Activity Participation ................................................................. 34 Total Person-trips and Person-days .............................................................................. 39
4. Expenditures ................................................................................................................. 51 Outlier Analysis ............................................................................................................ 51 NCC Region All Visitors .............................................................................................. 53 NCC Region – Non-Consumptive Recreation Only ..................................................... 57 GFNMS – Non-Consumptive Recreation Only ............................................................ 61
northern portion of MBNMS ........................................................................................ 63
Sanctuaries as a Proportion of the NCC Region – Non-Consumptive Recreation ....... 65
5. Economic Contributions ............................................................................................... 66 Study Area Identification .............................................................................................. 66 IMPLAN ....................................................................................................................... 67 Economic Impacts/Contributions NCC Region – All Visitors ..................................... 69 Economic Impacts/Contributions NCC Region – Non-Consumptive Recreation Only 70 Economic Impacts/Contributions from Greater Farallones National Marine Sanctuary
....................................................................................................................................... 71
iii
Economic Impacts/Contributions from the Northern Portion of Monterey Bay National
Marine Sanctuary .......................................................................................................... 72 References ......................................................................................................................... 74

iv
List of Figures and Tables
Figure/Table Number and Title Page
Figure 1.1 Map of Survey Sampling Area .......................................................................... 8 Figure 1.2 Map of the Areas of Recreation ....................................................................... 10
Figure 1.3 NCC Region Economic Impact Study Area .................................................... 12 Figure 1.4 GFNMS Economic Impact Study Area ........................................................... 13 Figure 1.5 northern portion of MBNMS Economic Impact Study Area .......................... 14
Table 1.1 Survey Sampling Study Area for the NCC Region ........................................... 7 Table 2.1 Statistical Test Results for Differences in Demographic Factors ..................... 17
Table 2.2 Age Distributions of Recreators in theThree Study Areas ............................... 18 Table 2.3 Summary Statistics for Age of Recreators in the Three Study Areas ............... 18 Table 2.4 Gender of Recreators in the Three Study Areas ............................................... 19
Table 2.5 Race/Ethnicity of Recreators in the Three Study Areas ................................... 19 Table 2.6 Marital Status of Recreators in the Three Study Areas. ................................... 20
Table 2.7 Head of Household of Recreators in the Three Study Areas ............................ 20 Table 2.8 Household Size of Recreators in the Three Study Areas ................................. 21 Table 2.9 Summary Statistics for Household Size for Recreators in the Three Study Areas
........................................................................................................................................... 21 Table 2.10 Housing Type of Recreators in the Three Study Areas .................................. 22
Table 2.11 Employment Status of Recreators in the Three Study Areas .......................... 22
Table 2.12 Educational Level of Recreators in the Three Study Areas ............................ 23
Table 2.13 Household Income for Recreators in the Three Study Areas ......................... 24 Table 2.14 Place of Residence-Zip Code of Recreators in the Three Study Areas .......... 25 Table 2.15 Place of Residence - County for Recreators in the Three Study Areas .......... 33
Table 3.1 Activity Participation by Activity Group and Activity for the Last 12 months
and Last Trip: NCC Region .............................................................................................. 35 Table 3.2 Activity Participation by Activity Group and Activity for the Last 12 months
and Last Trip: GFNMS ..................................................................................................... 36 Table 3.3 Activity Participation by Activity Group and Activity for the Last 12 months
and the Last Trip: northern portion of MBNMS ............................................................... 38 Table 3.4 Person-trips by Activity/Activity Group for the Three Study Areas ................ 43 Table 3.5 Person-days by Activity/Activity Group for the Three Study Areas ................ 45
Table 3.6 Person-trips by Activity/Activity Group for the Three Study Areas: Non-
Consumptive Recreation Only .......................................................................................... 47
Table 3.7 Person-days by Activity/Activity Group for the Three Study Areas: Non-
Consumptive Recreation Only .......................................................................................... 49 Table 4.1 Average Trip Expenditures Per Person Across All Respondents, Last Trip:
NCC Region ...................................................................................................................... 52 Table 4.2 Average Trip Expenditures Per Person Last Trip: NCC Region, All Visiting
Residents ........................................................................................................................... 54

v
Table 4.3 Average Trip Expenditures Per Person Last Trip: NCC Region, All Visiting
Non-Residents ................................................................................................................... 55 Table 4.4 Total Expenditures for All Visitors to the NCC Region, by Residential Status 56 Table 4.5 Expenditures Per Person-day by Residential Status: NCC Region All Visitor 57
Table 4.6 Average Trip Expenditures Per Person Last Trip: NCC Region, Residents
Non-Consumptive Recreation Only .................................................................................. 58 Table 4.7 Average Trip Expenditures Per Person Last Trip: NCC Region, Non-Residents
Non-Consumptive Recreation Only .................................................................................. 59 Table 4.8 Total Expenditures : NCC Region by Resident Status Non-Consumptive
Recreation Only ................................................................................................................ 60 Table 4.9 Expenditures Per Person-day by Residential Status: NCC Region Non-
Consumptive Recreation Only .......................................................................................... 61 Table 4.10 Average Trip Expenditures Per Person, Last Trip: GFNMS Non-Consumptive
Recreation Only ................................................................................................................ 62 Table 4.11 Total Expenditures and Expenditures Per Person-day for GFNMS Non-
Consumptive Recreation Only .......................................................................................... 63 Table 4.12 Average Trip Expenditures Per Person: np MBNMS Non-Consumptive
Recreation Only ................................................................................................................ 64 Table 4.13 Total Expenditures and Expenditures Per Person-day for np of MBNMS Non-
Consumptive Recreation Only .......................................................................................... 65
Table 4.14 Estimated Proportion of Expenditures Accounted for by Sanctuaries ......... 65 Table 5.1Primary and Secondary Counties in the Study Area for the Economic Impact
Analysis NCC Region ....................................................................................................... 66 Table 5.2 Primary and Secondary Counties in the Study Area for the Economic Impact
Analysis GFNMS .............................................................................................................. 67
Table 5.3 Primary and Secondary Counties in the Study Area for the Economic Impact
Analysis northern portion of MBNMS ............................................................................. 67 Table 5.4 IMPLAN Economic Indicators’ Definitions ..................................................... 68 Table 5.5 Impact Type Definitions ................................................................................... 68
Table 5.6 IMPLAN Model Industry Sector Codes for each Expenditure Category ........ 69 Table 5.7 Total Economic Impacts for All Visiting Residents to the NCC Region (2015
$) ....................................................................................................................................... 70 Table 5.8 Total Economic Impacts for All Visiting Non-Residents to the NCC Region
(2015 $) ............................................................................................................................. 70 Table 5.9 Total Economic Impacts for All Visitors to the NCC Region (2015 $) .......... 70 Table 5.10Total Economic Impacts for All Residents to the NCC Region, Non-
Consumptive Recreation Only (2015 $) ........................................................................... 71 Table 5.11 Total Economic Impacts for All Non-Residents to the NCC Region, Non-
Consumptive Recreation Only (2015 $) ........................................................................... 71
Table 5.12 Total Economic Impacts for All Visitors to the NCC Region, Non-
Consumptive Recreation Only (2015 $) ........................................................................... 71 Table 5.13 GFNMS Non-Consumptive Recreation Only Impacts (2015 $) .................... 72 Table 5.14 northern portion of MBNMS Non-Consumptive Recreation Only Impacts
(2015 $) ............................................................................................................................. 72 Table 5.15 Estimated Proportion of Economic Impacts Accounted for by Sanctuaries in
the NCC Region Non-Consumptive Recreation Only ...................................................... 73

6
1. Introduction
Source of Information
The information used here was from a study conducted by Ecotrust (Chen et al., 2013) supported
by the State Coastal Conservancy, the State of California, and the California Department of Fish
and Wildlife through the California Sea Grant Program. The study provided a baseline for
socioeconomic monitoring in the MPA Program under the Marine Life Protection Act for the
North Central California (NCC) Region. The NCC Region covers an area which includes
Greater Farallones National Marine Sanctuary (GFNMS), the northern portion of Monterey Bay
National Marine Sanctuary (MBNMS) and Cordell Bank National Marine Sanctuary (CBNMS),
however no observations were obtained for CBNMS. In 2015, we obtained the data and
documentation from Ecotrust.
Survey Methodology
Chen et al. (2013) used an Internet Panel developed by Knowledge Networks, Inc. (KN) for 13
counties in North Central California within a one-day’s trip to the NCC Region. In 2010, the
study area’s population included 6,943,138 people age 18 or older out of the total population of
8,984,415 (U.S. Census 2010). The KN panel included 6,129 people and 5,079 panel members
responded to the survey for a response rate of 82.9%. Spatial information was obtained using an
on-line tool developed to obtain the spatial use by activity type on the respondent’s last trip.
About 60 percent of respondents completed the mapping portion of the survey (3,018
respondents that mapped 13,955 data points). The data was weighted by KN to make it
representative of the study area population using the 2010 Census by gender, race, and ethnicity
(Hispanic and Non-Hispanic) for those ages 18 or older. See Chen et al. (2013) for details.
What was Estimated
The data was for the year 2011 and covered all recreation uses, but was primarily focused on
non-consumptive recreation uses. Many users do both consumptive and non-consumptive
recreation over a 12-month period or even on their last trip to the NCC Region. Since we
recently had estimated recreational fishing use and the economic impacts of that use (Leeworthy
and Schwarzman 2015), we focused here on non-consumptive recreation use. All the estimates
included here cover the entire NCC Region, GFNMS and the northern portion of the MBNMS.
Since the data obtained spatial use, it allowed us to estimate recreation uses within the two
sanctuary areas along with a socioeconomic profile of the users. Recreation use was estimated by
type of recreation activity. Comparative demographic profiles of users were developed for the
NCC Region, GFNMS and the northern portion of MBNMS and tested for statistical differences.
Expenditure profiles by category were also developed for the three areas and the IMPLAN input-
output model was used to estimate the economic impact of these expenditures on the local area
economies for the NCC Region, GFNMS and the northern portion of MBNMS in terms of total
output, value added, income and employment. The Chen et al. (2013) report did not include
estimates of the economic impact of the expenditures, so we did two estimates for the economic

7
impact of the NCC Region; one with all visitors and all recreation activities and one with only
non-consumptive recreation for comparison with the GFNMS and the northern portion of
MBNMS.
Definition of the Study Areas
In this report, there are three types of study areas: 1) the survey sampling area, 2) the areas where
the recreation activity takes place, and the areas where the primary socioeconomic impacts take
place.
Survey Sampling Area. The survey sampling area included 13 counties within a reasonable one-
day’s trip to the NCC Region (Table 1.1 and Figure 1.1).
Table 1.1 Survey Sampling Study Area for the NCC Region
Counties
Alameda
Contra Costa
Lake Marin
Marin
Mendocino
Napa
Sacramento
San Francisco
San Mateo
Santa Clara
Santa Cruz
Solano
Sonoma
Source: Chen et al. (2013)

8
Figure 1.1 Map of Survey Sampling Area
9
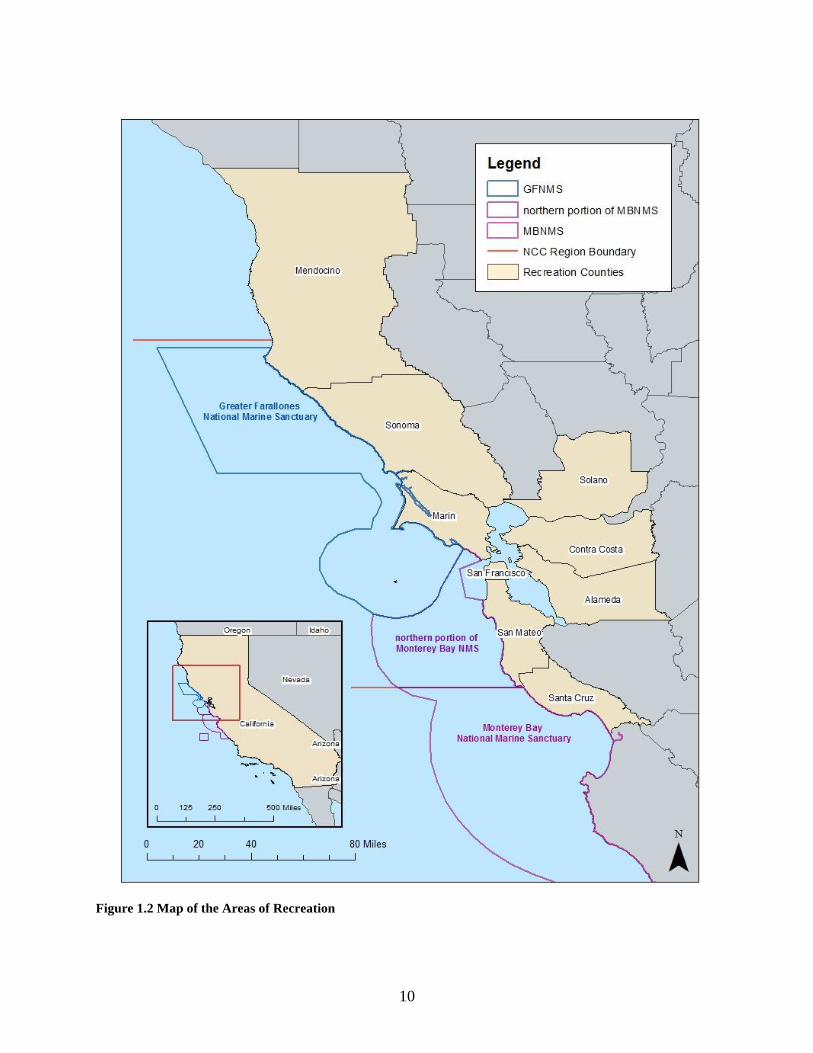
Areas of Recreation Activity. The NCC Region extends from Alder Creek in the north to Pigeon
Point in the south. The GFNMS and the northern portion of the MBNMS are generally sub-sets
of the NCC Region, however the northern portion of MBNMS doesn’t include San Francisco
Bay or an area offshore from the mouth of San Francisco Bay, which is being evaluated to be
included in MBNMS. The GFNMS extends from a point just below the NCC Region boundary
in the north to Rocky Point in Marin County in the south. The northern portion of MBNMS
extends from the southern boundary of Marin County in the north to Pigeon Point in the south.
The seaward sanctuary boundaries are shown in Figure 1.2.
10
Figure 1.2 Map of the Areas of Recreation

11
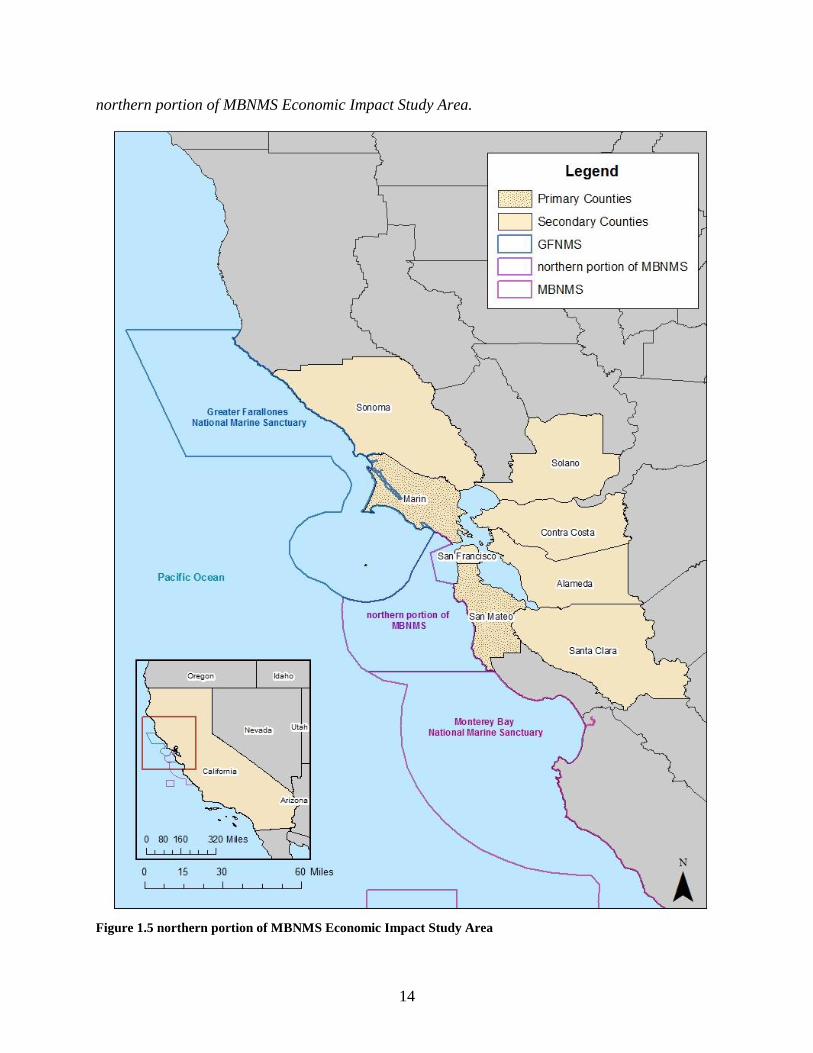
Areas of Economic Impact. Each of the three areas of recreation activity has their own separate
areas where the primary socioeconomic impacts of the recreation activity take place. Here we
focus on where the primary economic impacts take place from spending associated with the
recreation activities. In using the IMPLAN input-output model, the first task is to define the
study area for the economic impact estimation. IMPLAN uses a county as the basic unit and one
can build a study area as an aggregation of counties. Because IMPLAN estimates the
“multiplier” impacts, which include indirect and induced impacts (see Chapter 5 for definitions),
it is important to capture counties which account for a high proportion of the inputs into
production, especially labor since many people who work in coastal counties live inland in
adjacent counties. We defined counties as primary counties (counties adjacent to the coastal and
ocean waters) and secondary counties (counties for which a high number of employees in the
primary counties live). The employees in primary counties that live in secondary counties spend
a portion of their incomes in their home counties for housing, food, transportation and other
services and this makes up the “induced” portion of the “multiplier” in IMPLAN.
We used the “Census of Inter-county Commuters” (U.S. Census 2009-2013), which provides the
employment by county of residence and county of work to determine secondary counties of
impact. We used a cut-off of 4,000 employees to establish whether a county would be counted
as a secondary impact county. The details of this estimation are provided in Chapter 5.

12
NCC Region Economic Impact Study Area.
Figure 1.3 NCC Region Economic Impact Study Area

13
GFNMS Economic Impact Study Area.
Figure 1.4 GFNMS Economic Impact Study Area
14
northern portion of MBNMS Economic Impact Study Area.
Figure 1.5 northern portion of MBNMS Economic Impact Study Area

15
Organization of Report
In Chapter 2, we address comparative demographic profiles for the three study areas of activities
and test for statistical differences for each demographic variable. In Chapter 3, we provide
estimates of total use measured as annual person-trips and annual person-days for 2011.
Estimates are then provided for detailed activity profiles, including activity participation by type
of activity for all trips over the past 12 months and the last trip, and the number of person-trips
and person-days by activity type. In Chapter 4, we estimate expenditures per person-trip by
category of expenditure and extrapolate these estimates to total expenditures. We also estimate
expenditures per person-day by expenditure category to support expenditure profiles that could
be used in management/policy applications that affect recreation use in the study areas. In
Chapter 5, we take the estimated total expenditures and run the IMPLAN input-output model to
estimate the economic impact/contribution of the spending on the local area economies in terms
of total output, value-added, income and employment. In each Chapter, we provide definitions
of terms used in estimation.
16
2. Demographic Profiles of Users
Chen et al. (2013) didn’t provide demographic profiles of the recreation users for the NCC
Region. Here we provide comparative demographic profiles between all recreators to the NCC
Region, recreators in the GFNMS, and recreators in the northern portion of MBNMS. In
addition, the data included demographics of the Internet Panel, which was a representative panel
of the 13 counties in the State of California (see Table 1.1) for the population 18 years of age and
older. We did not include comparisons between the recreating samples and the entire Internet
Panel. This could be done in future research to develop recreation participation functions to
forecast future recreation use. The data and documentation from this project can be obtained
from the authors on request.
For recreators, we do three sets of comparisons; NCC Region versus GFNMS, NCC Region
versus the northern portion of MBNMS and GFNMS versus the northern portion of MBNMS.
We used a non-parametric test for statistical differences, the Kolmogorov-Smirnov two-sample
test and the Kuiper two-sample exact test, testing the empirical distribution function (SAS V.9.4,
NPAR1WAY procedure). The demographics tested included age, gender, race/ethnicity, marital
status, head of household, household size, housing type, employment status, educational level,
and household income.
To perform the statistical tests we first had to rearrange the data and form three groups for the
pairwise tests. Since people who did recreation activities in the NCC Region could also do
recreation activities in the GFNMS and the northern portion of MBNMS, and some that did
recreation activities in the GFNMS could also have done activities in the northern portion of
MBNMS, we pulled all those who did recreation activities in the GFNMS and the northern
portion of MBNMS into separate data files. We then concatenated the three files (NCC Region,
GFNMS and the northern portion of MBNMS). We treated each area sample as separate
samples, but we know there is some correlation because of the overlapping users. This was one
of the reasons we chose the KS and Kuiper two-sample nonparametric tests for statistical
differences. The only statistically significant differences found were for educational level
between recreators in the GFNMS and the northern portion of MBNMS and between recreators
in the NCC Region and GFNMS (Table 2.1).

17
Table 2.1 Statistical Test Results for Differences in Demographic Factors
Demographic Factors
NCC Region NCC Region GFNMS
versus versus versus
GFNMS np MBNMS np MBNMS
Age (Continuous) KS1,3 0.32 0.28 0.82
Kuiper1,3 0.67 0.45 0.49
Age (Categories)
KS1,3 0.65 1.00 0.92
Kuiper1,3 0.99 1.00 0.97
Gender
KS1,3 0.58 1.00 1.00
Kuiper1,3 0.98 1.00 1.00
Race/Ethnicity
KS1,3 0.96 1.00 1.00
Kuiper1,3 1.00 1.00 1.00
Marital Status
KS1,3 0.65 0.47 0.15
Kuiper1,3 0.99 0.96 0.64
Head of Household
KS1,3 1.00 1.00 1.00
Kuiper1,3 1.00 1.00 1.00
Household Size (Continuous)
KS1,3 0.43 0.11 0.96
Kuiper1,3 0.94 0.32 0.98
Housing Type
KS1,3 1.00 1.00 0.99
Kuiper1,3 1.00 1.00 1.00
Employment Status
KS1,3 1.00 0.92 0.87
Kuiper1,3 1.00 0.93 1.00
Educational Level
KS1,3 0.01 0.19 0.00
Kuiper1,3 0.05 0.65 0.00
Household Income
KS1,3 0.98 0.12 0.49
Kuiper1,3 1.00 0.24 0.42
1. Kolmogorov-Smirnov (KS) two-sample test of significance. Significant difference if less
than or equal to 0.05.
2. Kuiper two-sample exact test of significance. Significant difference if less than or equal
to 0.05
3. Bold indicates statistically significant difference.
Age. There were no statistically significant differences in the ages of the recreators years 18 and
older between the three study areas (Table 2.1). The highest proportion of recreators was in the
age category of “55-64” for the NCC Region and the northern portion of MBNMS, while for the
18
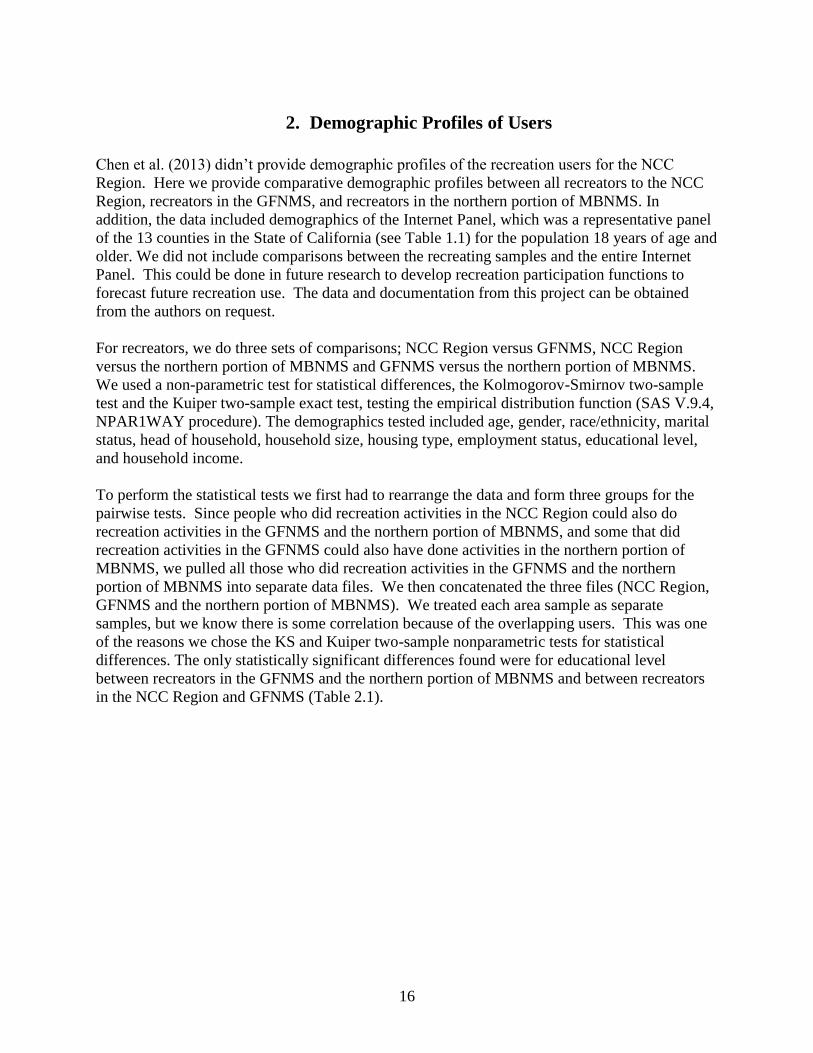
GFNMS it was “25-34” (Table 2.2). The mean ages ranged from 45 to 46 years old, while the
median age ranged from 43 to 46 years old (Table 2.3).
Table 2.2 Age Distributions of Recreators in the Three Study Areas
Age NCC Region GFNMS northern portion
of MBNMS
18 - 24 9.08 11.98 10.43
25 - 34 19.06 20.15 19.71
35 - 44 18.3 18.69 15.46
45 - 54 17.17 12.56 17
55 - 64 24.03 19.48 27.84
65 - 74 11.45 15.76 9.37 75 and over 0.91 1.37 0.18
Source: Ecotrust Survey of North Central California Region
Table 2.3 Summary Statistics for Age of Recreators in the Three Study Areas
Statistic NCC Region GFNMS northern portion
of MBNMS
Minimum 18 19 18
Maximum 100 78 75
Mean 46.21 45.56 45.34
Median 46 43 46
Mode 56 56 56
Source: Ecotrust Survey of North Central California Region
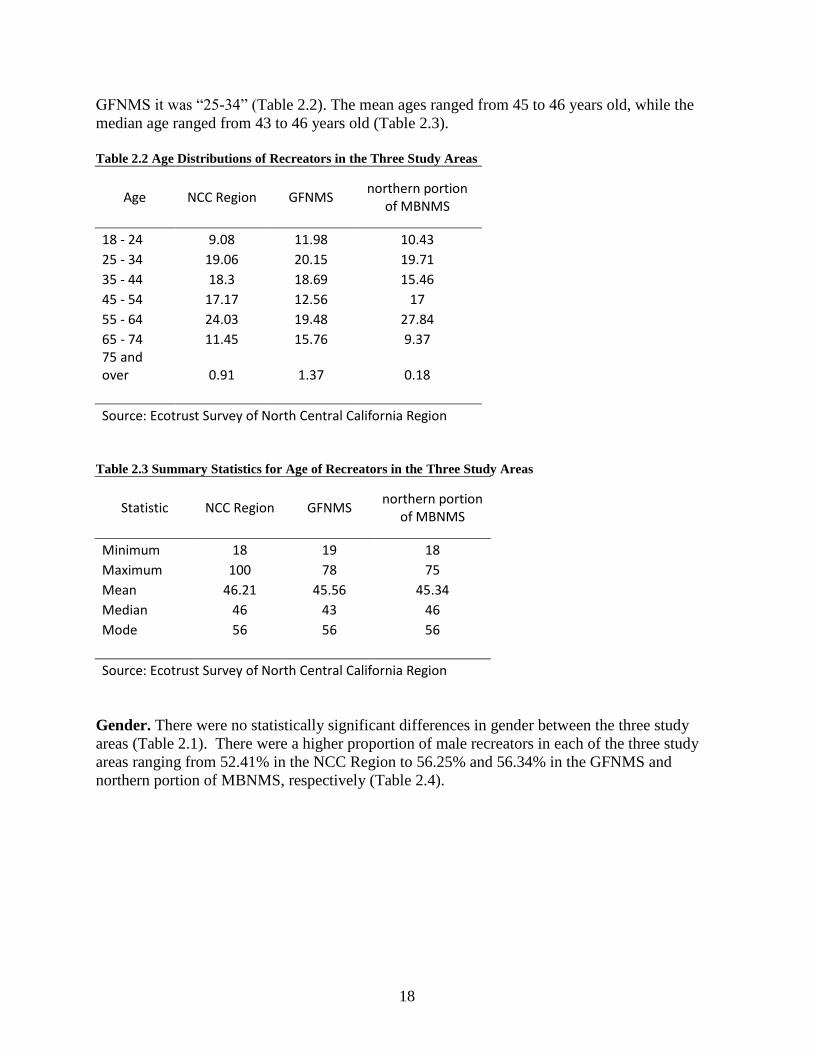
Gender. There were no statistically significant differences in gender between the three study
areas (Table 2.1). There were a higher proportion of male recreators in each of the three study
areas ranging from 52.41% in the NCC Region to 56.25% and 56.34% in the GFNMS and
northern portion of MBNMS, respectively (Table 2.4).
19
Table 2.4 Gender of Recreators in the Three Study Areas
Gender NCC Region Recreators
Greater Farallones NMS
northern portion of MBNMS
Male 52.41% 56.25% 56.34%
Female 47.59% 43.75% 43.66%
Source: Ecotrust Survey of North Central California Region
Race/Ethnicity. There were no statistically significant differences in race/ethnicity between
recreators in the three study areas (Table 2.1). In all three study areas, the highest proportion of
recreators was “White, non-Hispanic ranging from 54.96% in the northern portion of MBNMS to
56.97% in the NCC Region (Table 2.5). The Hispanic population ranged from 15.76% in the
NCC Region to 19.47% in the northern portion of the MBNMS (Table 2.5).
Table 2.5 Race/Ethnicity of Recreators in the Three Study Areas
Race/Ethnicity NCC Region Recreators
Greater Farallones NMS
northern portion of MBNMS
White, non-Hispanic 56.97% 56.92% 54.96%
Black, non-Hispanic 4.63% 4.38% 3.34%
Other, non-Hispanic 16.87% 14.12% 17.12%
Hispanic 15.76% 17.18% 19.47%
2+ Races, non-Hispanic 5.78% 7.41% 5.10%
Source: Ecotrust Survey of North Central California Region
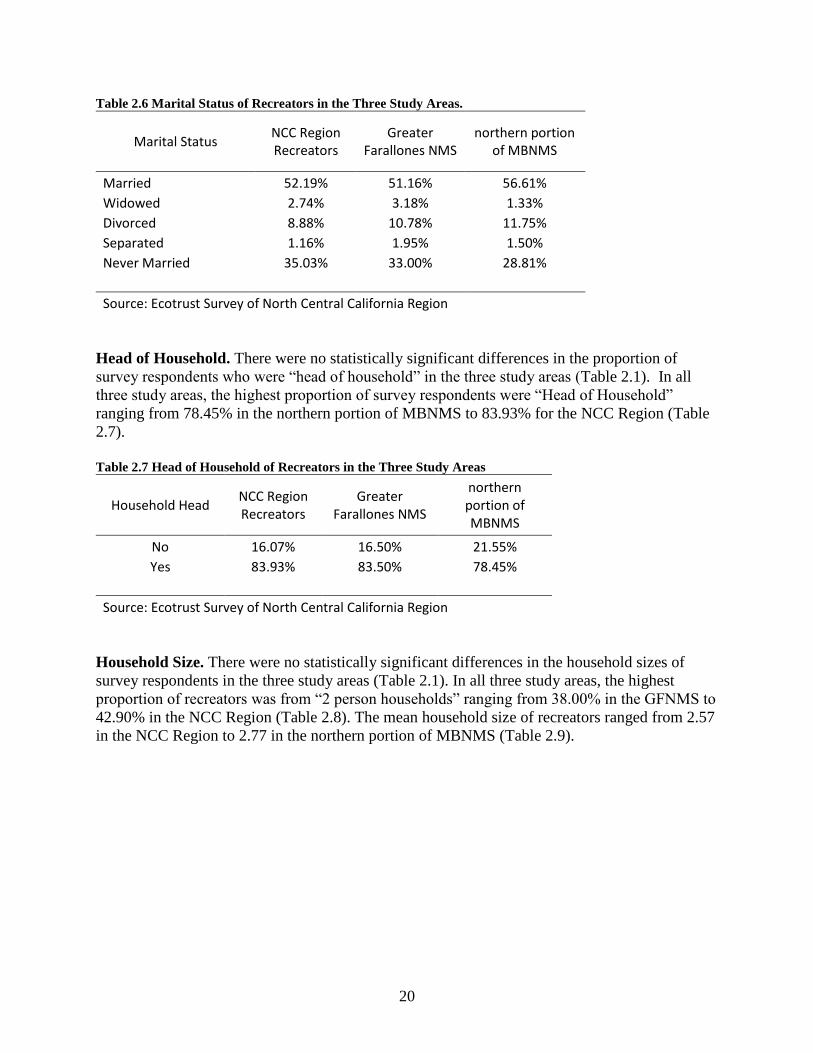
Marital Status. There were no statically significant differences in the marital status of recreators
in the three study areas (Table 2.1). In the three study areas, the highest proportion of recreators
were married ranging from 51.16% in the GFNMS to 56.61% in the northern portion of
MBNMS, while the second highest proportion of recreators in all three study areas were “Never
Married” ranging from 28.81% in the northern portion of MBNMS to 35.03% in the NCC
Region (Table 2.6).
20
Table 2.6 Marital Status of Recreators in the Three Study Areas.
Marital Status NCC Region Recreators
Greater Farallones NMS
northern portion of MBNMS
Married 52.19% 51.16% 56.61%
Widowed 2.74% 3.18% 1.33%
Divorced 8.88% 10.78% 11.75%
Separated 1.16% 1.95% 1.50%
Never Married 35.03% 33.00% 28.81%
Source: Ecotrust Survey of North Central California Region
Head of Household. There were no statistically significant differences in the proportion of
survey respondents who were “head of household” in the three study areas (Table 2.1). In all
three study areas, the highest proportion of survey respondents were “Head of Household”
ranging from 78.45% in the northern portion of MBNMS to 83.93% for the NCC Region (Table
2.7).
Table 2.7 Head of Household of Recreators in the Three Study Areas
Household Head NCC Region Recreators
Greater Farallones NMS
northern portion of MBNMS
No 16.07% 16.50% 21.55%
Yes 83.93% 83.50% 78.45%
Source: Ecotrust Survey of North Central California Region
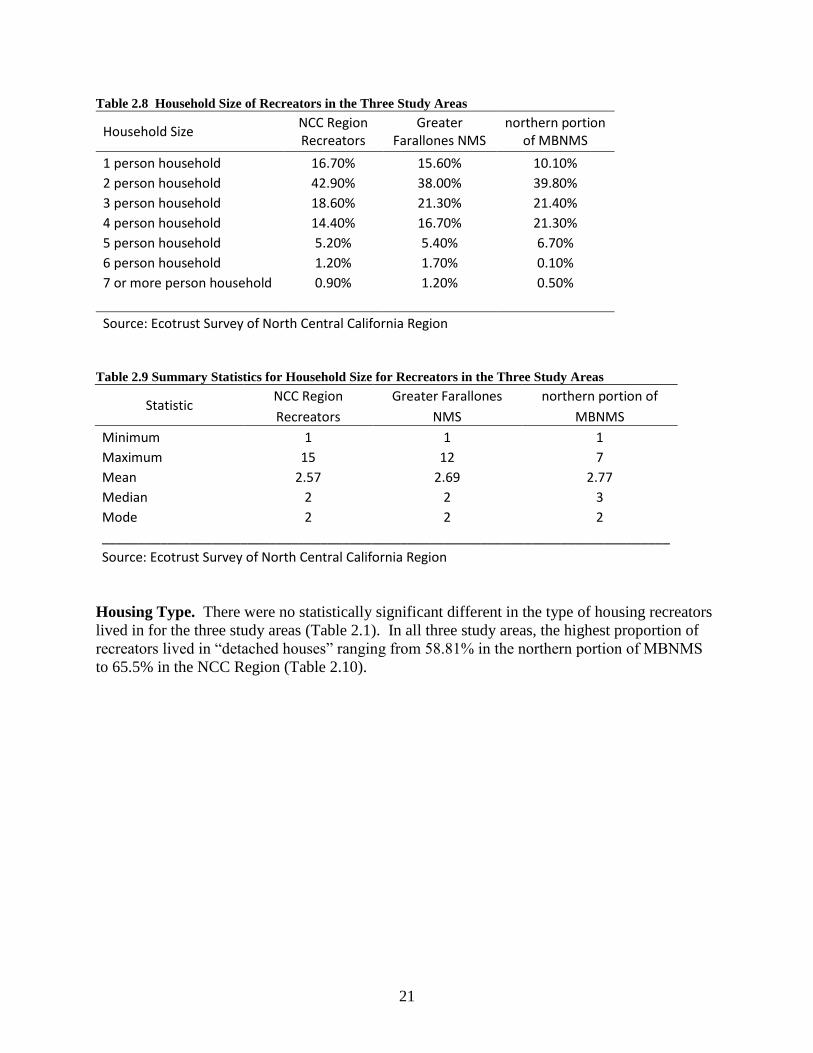
Household Size. There were no statistically significant differences in the household sizes of
survey respondents in the three study areas (Table 2.1). In all three study areas, the highest
proportion of recreators was from “2 person households” ranging from 38.00% in the GFNMS to
42.90% in the NCC Region (Table 2.8). The mean household size of recreators ranged from 2.57
in the NCC Region to 2.77 in the northern portion of MBNMS (Table 2.9).
21
Table 2.8 Household Size of Recreators in the Three Study Areas
Household Size NCC Region Recreators
Greater Farallones NMS
northern portion of MBNMS
1 person household 16.70% 15.60% 10.10%
2 person household 42.90% 38.00% 39.80%
3 person household 18.60% 21.30% 21.40%
4 person household 14.40% 16.70% 21.30%
5 person household 5.20% 5.40% 6.70%
6 person household 1.20% 1.70% 0.10%
7 or more person household 0.90% 1.20% 0.50%
Source: Ecotrust Survey of North Central California Region
Table 2.9 Summary Statistics for Household Size for Recreators in the Three Study Areas
Statistic NCC Region Greater Farallones northern portion of
Recreators NMS MBNMS
Minimum 1 1 1
Maximum 15 12 7
Mean 2.57 2.69 2.77
Median 2 2 3
Mode 2 2 2
______________________________________________________________________________
Source: Ecotrust Survey of North Central California Region
Housing Type. There were no statistically significant different in the type of housing recreators
lived in for the three study areas (Table 2.1). In all three study areas, the highest proportion of
recreators lived in “detached houses” ranging from 58.81% in the northern portion of MBNMS
to 65.5% in the NCC Region (Table 2.10).

22
Table 2.10 Housing Type of Recreators in the Three Study Areas
Housing Type NCC Region Recreators
Greater Farallones NMS
northern portion of MBNMS
House- detached 65.50% 64.92% 58.81%
House- attached 11.32% 14.30% 18.42%
Apartment building 21.63% 18.36% 19.81%
Mobile Home 1.44% 1.50% 2.96%
Boat, RV, Van 0.11% 0.92% -
Source: Ecotrust Survey of North Central California Region
Employment Status. There were no statistically significant differences in the employment status
of recreators in the three study areas (Table 2.1). In all three study areas, the highest proportion
of recreators’ employment status was “Working-paid employee” ranging from 52.29% in the
northern portion of MBNMS to 58.56% in the NCC Region. The second highest proportion of
recreators’ employment status for all three areas was for “Not Working-retired” ranging from
11.86% in the northern portion of MBNMS to 17.66% for the GFNMS (Table 2.11).
Table 2.11 Employment Status of Recreators in the Three Study Areas
Current Employment Status NCC Region Recreators
Greater Farallones NMS
northern portion of MBNMS
Working- paid employee 58.56% 57.14% 52.29%
Working- self employed 9.84% 11.34% 8.14%
Not Working- temp layoff 0.76% 1.75% 1.68%
Not Working- looking for work 7.75% 7.70% 12.20%
Not Working- retired 16.22% 17.66% 11.86%
Not Working- disabled 1.91% 2.08% 6.82%
Not Working- other 4.96% 2.33% 7.02%
Source: Ecotrust Survey of North Central California Region
Educational Level. There were statistically significant differences between recreators in the
NCC Region and recreators in the GFNMS and between recreators in the GFNMS and in the
northern portion of MBNMS; however there wasn’t a statistically significant difference between
recreators in the NCC Region and the northern portion of MBNMS (Table 2.1). Of the
recreators in the three study areas, recreators in the GFNMS had the lowest level of educational
achievement, while the recreators in the northern portion of MBNMS had the highest level.
Recreators in the northern portion of MBNMS had the highest proportion of recreators with a
Bachelors Degree of higher at 57.75% versus 49.23% for the NCC Region and 42.82% for the
GFNMS (Table 2.12).

23
Table 2.12 Educational Level of Recreators in the Three Study Areas
Education NCC Region Recreators
Greater Farallones NMS
northern portion of MBNMS
No formal education 0.11% - -
1st, 2nd, 3rd, or 4th grade - - -
5th or 6th grade 0.07% 0.56% -
7th or 8th grade - - 0.80%
9th grade 0.06% - -
10th grade 0.02% - -
11th grade 0.02% - -
12th grade 0.56% 0.78% 0.58%
High school grad or equivalent 6.41% 7.08% 4.15%
Some college, no degree 28.48% 35.02% 21.58%
Associate degree 15.04% 13.74% 15.14%
Bachelor’s degree 27.17% 22.64% 32.79%
Master’s degree 13.57% 13.89% 14.20%
Professional or Doctorate 8.49% 6.29% 10.76%
Source: Ecotrust Survey of North Central California Region
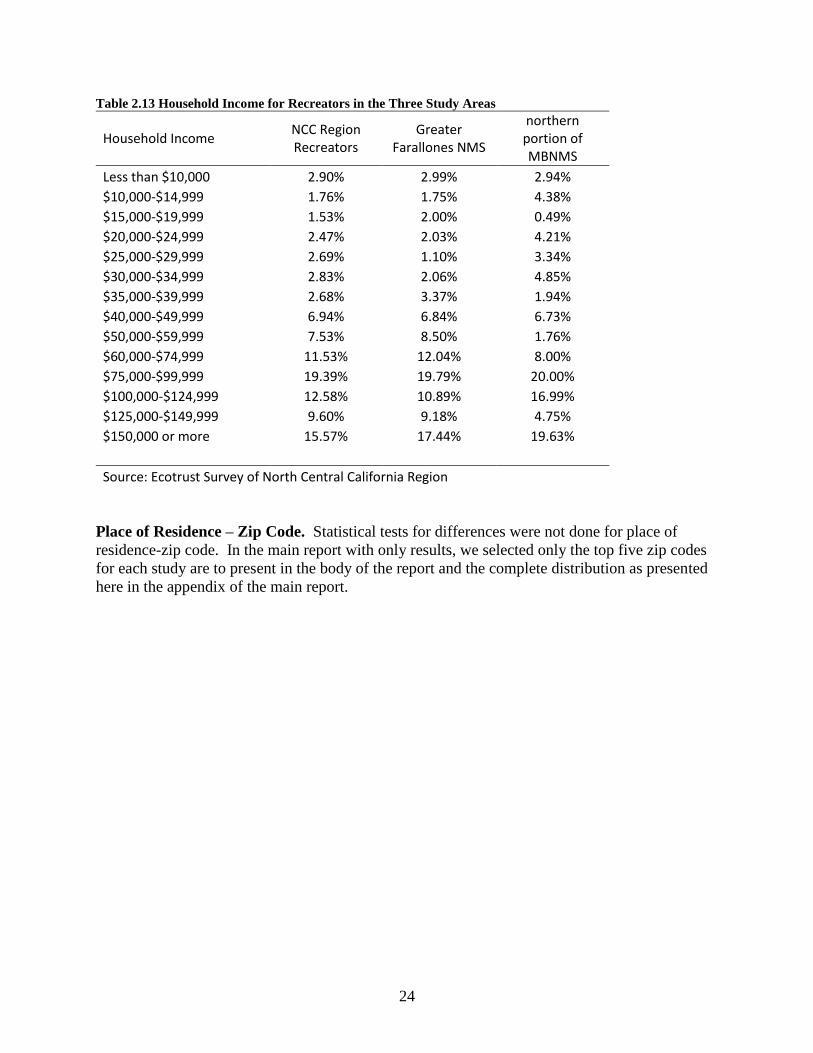
Household Income. Although there were differences in educational levels between the
recreators in the three study areas, there were no statistically significant differences in household
income for recreators in the three study areas (Table 2.1). In all three study areas, the highest
proportion of recreators came from households with incomes “$75,000-$99,999” ranging from
19.39% in the NCC Region to 20.0% in the northern portion of MBNMS (Table 2.13).
24
Table 2.13 Household Income for Recreators in the Three Study Areas
Household Income NCC Region Recreators
Greater Farallones NMS
northern portion of MBNMS
Less than $10,000 2.90% 2.99% 2.94%
$10,000-$14,999 1.76% 1.75% 4.38%
$15,000-$19,999 1.53% 2.00% 0.49%
$20,000-$24,999 2.47% 2.03% 4.21%
$25,000-$29,999 2.69% 1.10% 3.34%
$30,000-$34,999 2.83% 2.06% 4.85%
$35,000-$39,999 2.68% 3.37% 1.94%
$40,000-$49,999 6.94% 6.84% 6.73%
$50,000-$59,999 7.53% 8.50% 1.76%
$60,000-$74,999 11.53% 12.04% 8.00%
$75,000-$99,999 19.39% 19.79% 20.00%
$100,000-$124,999 12.58% 10.89% 16.99%
$125,000-$149,999 9.60% 9.18% 4.75%
$150,000 or more 15.57% 17.44% 19.63%
Source: Ecotrust Survey of North Central California Region
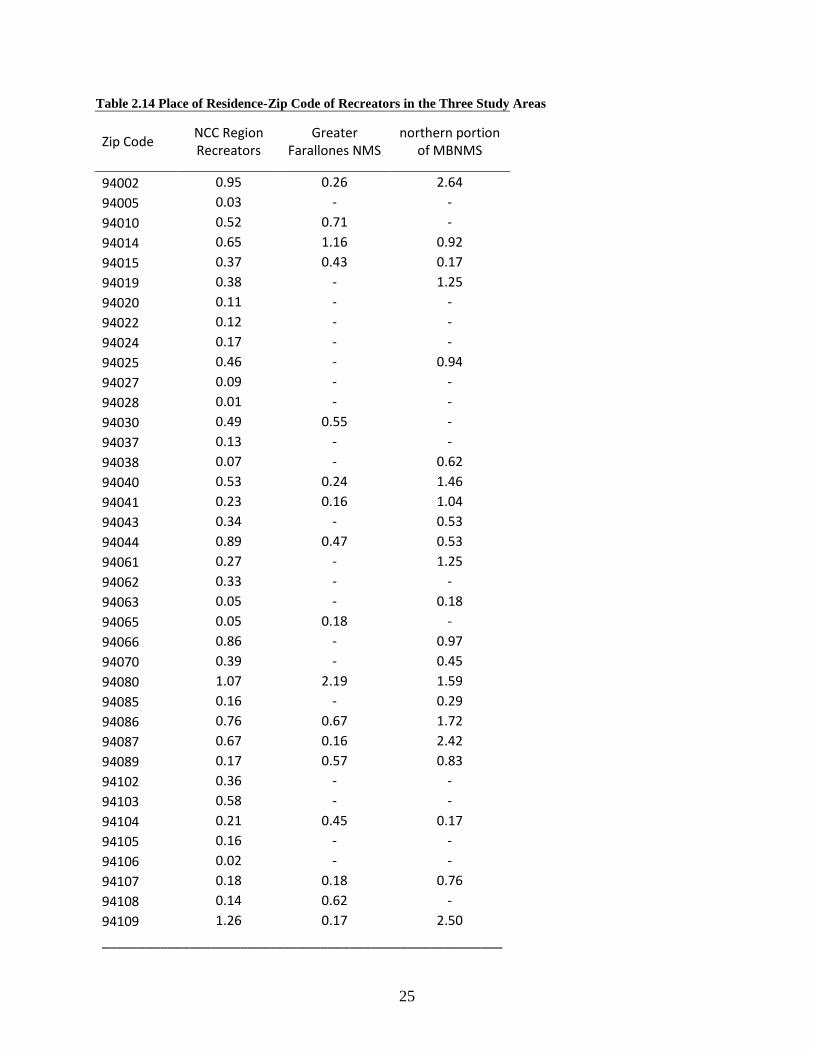
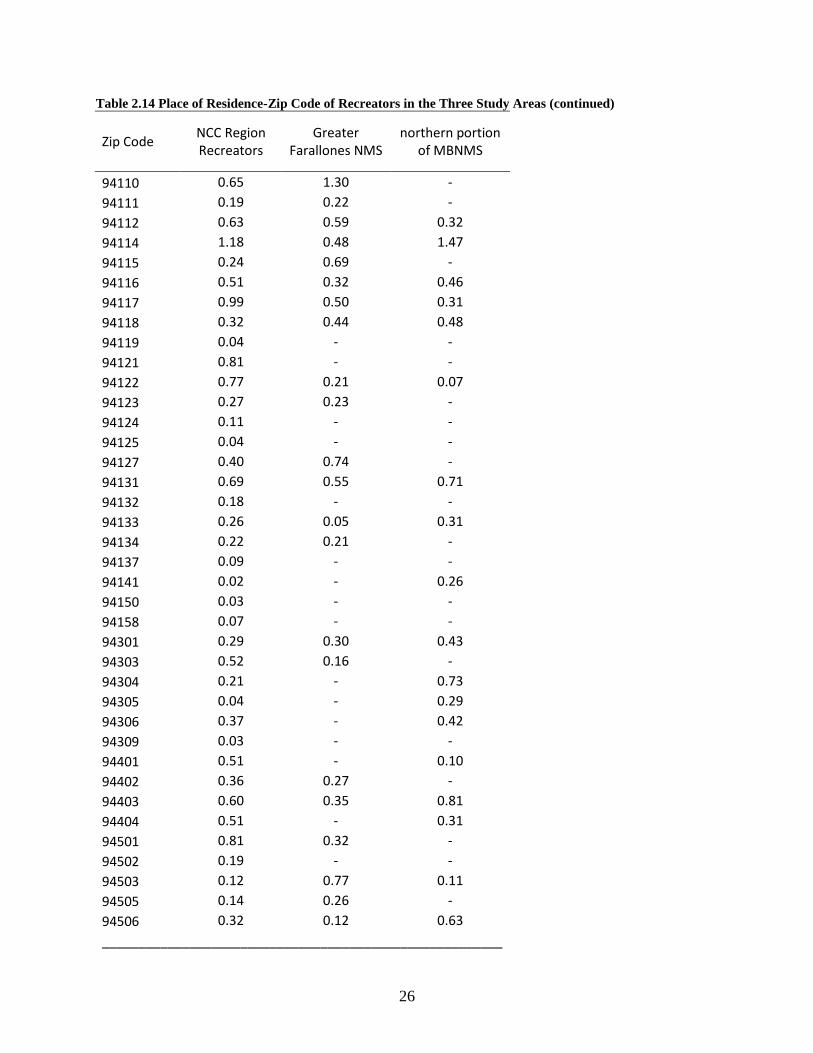
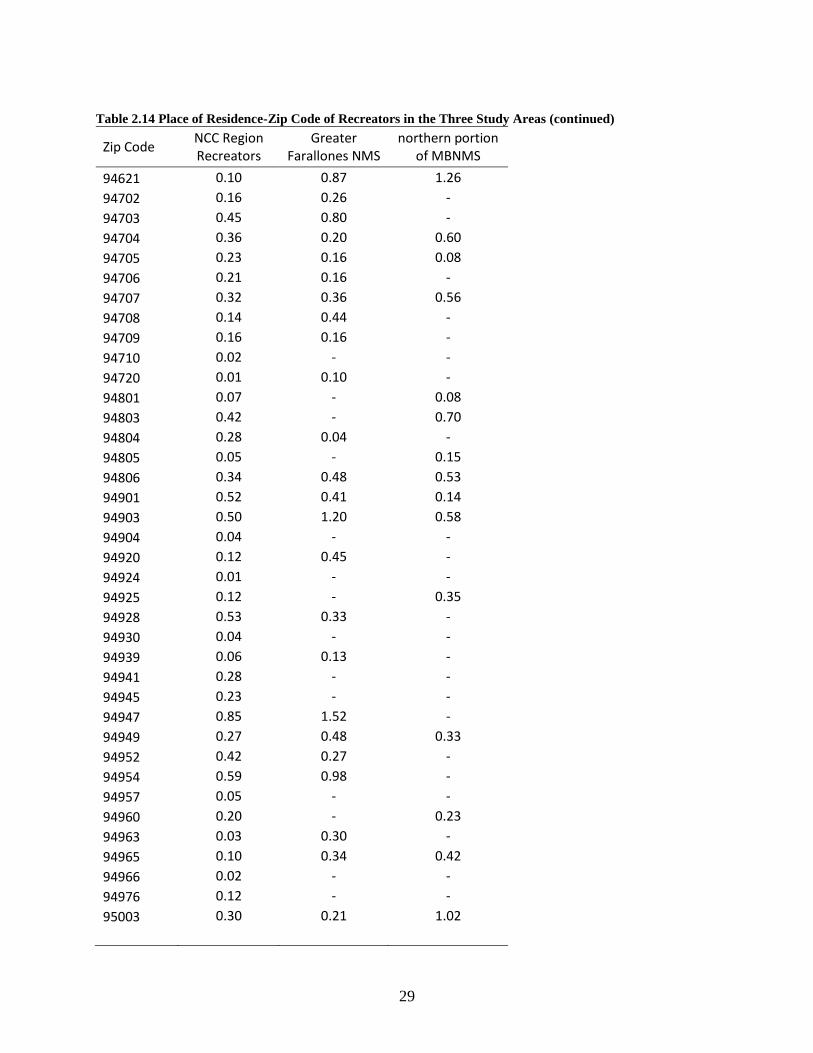
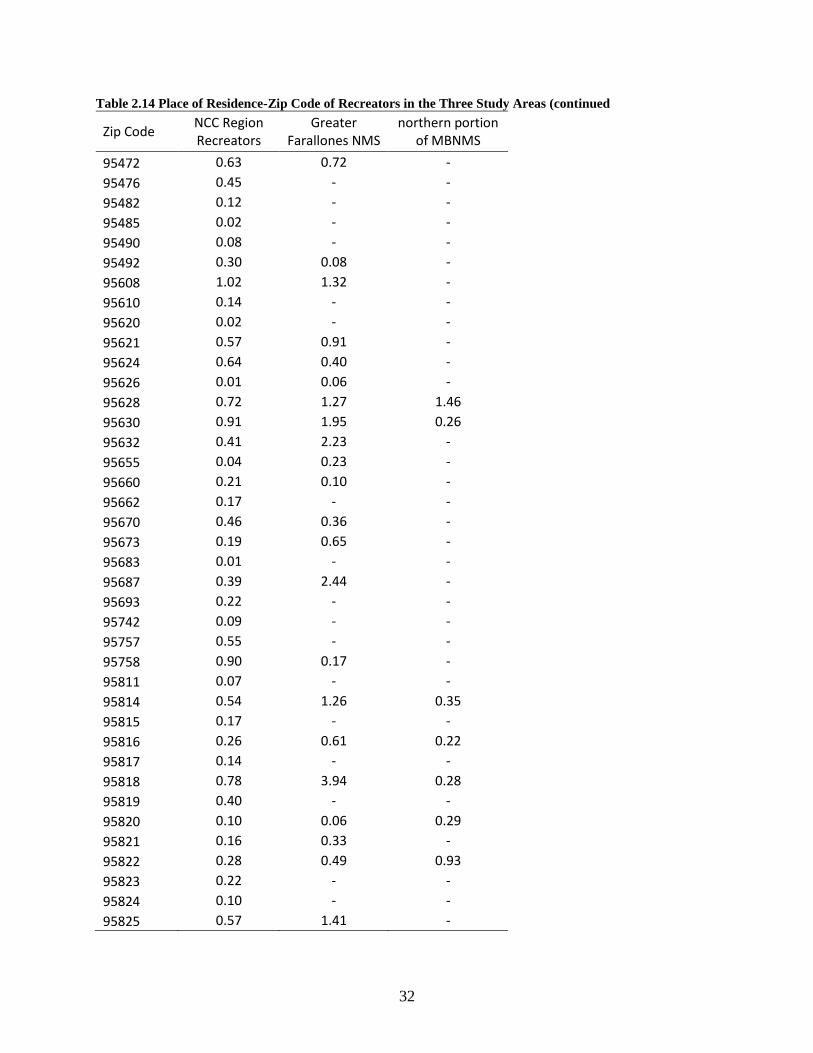
Place of Residence – Zip Code. Statistical tests for differences were not done for place of
residence-zip code. In the main report with only results, we selected only the top five zip codes
for each study are to present in the body of the report and the complete distribution as presented
here in the appendix of the main report.
25
Table 2.14 Place of Residence-Zip Code of Recreators in the Three Study Areas
Zip Code NCC Region Recreators
Greater Farallones NMS
northern portion of MBNMS
94002 0.95 0.26 2.64
94005 0.03 - -
94010 0.52 0.71 -
94014 0.65 1.16 0.92
94015 0.37 0.43 0.17
94019 0.38 - 1.25
94020 0.11 - -
94022 0.12 - -
94024 0.17 - -
94025 0.46 - 0.94
94027 0.09 - -
94028 0.01 - -
94030 0.49 0.55 -
94037 0.13 - -
94038 0.07 - 0.62
94040 0.53 0.24 1.46
94041 0.23 0.16 1.04
94043 0.34 - 0.53
94044 0.89 0.47 0.53
94061 0.27 - 1.25
94062 0.33 - -
94063 0.05 - 0.18
94065 0.05 0.18 -
94066 0.86 - 0.97
94070 0.39 - 0.45
94080 1.07 2.19 1.59
94085 0.16 - 0.29
94086 0.76 0.67 1.72
94087 0.67 0.16 2.42
94089 0.17 0.57 0.83
94102 0.36 - -
94103 0.58 - -
94104 0.21 0.45 0.17
94105 0.16 - -
94106 0.02 - -
94107 0.18 0.18 0.76
94108 0.14 0.62 -
94109 1.26 0.17 2.50
_______________________________________________________
26
Table 2.14 Place of Residence-Zip Code of Recreators in the Three Study Areas (continued)
Zip Code NCC Region Recreators
Greater Farallones NMS
northern portion of MBNMS
94110 0.65 1.30 -
94111 0.19 0.22 -
94112 0.63 0.59 0.32
94114 1.18 0.48 1.47
94115 0.24 0.69 -
94116 0.51 0.32 0.46
94117 0.99 0.50 0.31
94118 0.32 0.44 0.48
94119 0.04 - -
94121 0.81 - -
94122 0.77 0.21 0.07
94123 0.27 0.23 -
94124 0.11 - -
94125 0.04 - -
94127 0.40 0.74 -
94131 0.69 0.55 0.71
94132 0.18 - -
94133 0.26 0.05 0.31
94134 0.22 0.21 -
94137 0.09 - -
94141 0.02 - 0.26
94150 0.03 - -
94158 0.07 - -
94301 0.29 0.30 0.43
94303 0.52 0.16 -
94304 0.21 - 0.73
94305 0.04 - 0.29
94306 0.37 - 0.42
94309 0.03 - -
94401 0.51 - 0.10
94402 0.36 0.27 -
94403 0.60 0.35 0.81
94404 0.51 - 0.31
94501 0.81 0.32 -
94502 0.19 - -
94503 0.12 0.77 0.11
94505 0.14 0.26 -
94506 0.32 0.12 0.63
_______________________________________________________

27
Table 2.14 Place of Residence-Zip Code of Recreators in the Three Study Areas (continued)
Zip Code NCC Region Recreators
Greater Farallones NMS
northern portion of MBNMS
94507 0.26 0.85 0.41
94508 0.03 - -
94509 0.47 0.73 -
94510 0.05 0.16 0.40
94511 0.01 - -
94513 0.32 0.20 -
94515 0.15 - -
94517 0.43 0.25 0.55
94518 0.21 0.74 -
94519 0.26 0.16 -
94520 0.28 0.48 -
94521 1.12 1.86 1.07
94523 0.67 1.10 0.54
94525 0.01 - -
94526 0.43 0.33 1.44
94530 0.35 0.17 0.70
94531 0.10 - -
94533 0.31 - 0.31
94536 0.82 0.17 1.25
94538 0.53 - 2.23
94539 0.33 0.21 -
94541 0.89 0.50 6.06
94542 0.23 - -
94544 0.41 0.15 0.84
94545 0.31 0.77 0.62
94546 0.72 0.23 1.56
94547 0.51 0.91 -
94549 0.36 0.36 -
94550 0.64 0.36 1.88
94551 0.49 - -
94552 0.15 - -
94553 0.57 0.78 0.24
94555 0.19 0.11 0.63
94556 0.12 0.40 -
94558 0.40 0.55 -
94559 0.31 0.27 -
94560 0.33 - -
94561 0.71 0.94 -
______________________________________________________

28
Table 2.14 Place of Residence-Zip Code of Recreators in the Three Study Areas (continued)
Zip Code NCC Region Recreators
Greater Farallones NMS
northern portion of MBNMS
94562 0.01 - -
94563 0.18 - 0.08
94564 0.71 -
94565 0.65 0.58 0.42
94566 0.51 1.40 0.14
94568 0.59 0.12 0.91
94572 0.11 0.51 -
94574 0.01 - -
94577 0.39 0.36 1.05
94578 0.31 - -
94579 0.07 0.33 -
94580 0.55 - 0.46
94582 0.23 0.38 0.44
94583 0.63 0.25 1.18
94587 0.16 0.42 -
94588 0.38 0.19 -
94589 0.01 - -
94590 0.15 - -
94595 0.24 1.32 0.24
94596 0.39 0.34 0.47
94597 0.33 0.12 -
94598 0.32 0.87 -
94599 0.03 - -
94601 0.11 0.20 0.29
94602 0.16 0.05 -
94603 0.06 - -
94604 0.02 - -
94605 0.63 - -
94606 0.26 - 0.28
94607 0.10 0.16 -
94608 0.45 - -
94609 0.39 - -
94610 0.22 0.25 0.36
94611 0.63 0.65 0.50
94612 0.25 0.81 0.39
94614 0.02 - -
94618 0.38 0.48 -
94619 0.22 0.62 -
_______________________________________________________
29
Table 2.14 Place of Residence-Zip Code of Recreators in the Three Study Areas (continued)
Zip Code NCC Region Recreators
Greater Farallones NMS
northern portion of MBNMS
94621 0.10 0.87 1.26
94702 0.16 0.26 -
94703 0.45 0.80 -
94704 0.36 0.20 0.60
94705 0.23 0.16 0.08
94706 0.21 0.16 -
94707 0.32 0.36 0.56
94708 0.14 0.44 -
94709 0.16 0.16 -
94710 0.02 - -
94720 0.01 0.10 -
94801 0.07 - 0.08
94803 0.42 - 0.70
94804 0.28 0.04 -
94805 0.05 - 0.15
94806 0.34 0.48 0.53
94901 0.52 0.41 0.14
94903 0.50 1.20 0.58
94904 0.04 - -
94920 0.12 0.45 -
94924 0.01 - -
94925 0.12 - 0.35
94928 0.53 0.33 -
94930 0.04 - -
94939 0.06 0.13 -
94941 0.28 - -
94945 0.23 - -
94947 0.85 1.52 -
94949 0.27 0.48 0.33
94952 0.42 0.27 -
94954 0.59 0.98 -
94957 0.05 - -
94960 0.20 - 0.23
94963 0.03 0.30 -
94965 0.10 0.34 0.42
94966 0.02 - -
94976 0.12 - -
95003 0.30 0.21 1.02

30
Table 2.14 Place of Residence-Zip Code of Recreators in the Three Study Areas (continued)
Zip Code NCC Region Recreators
Greater Farallones NMS
northern portion of MBNMS
95005 0.01 - 0.07
95006 0.14 0.08 -
95008 0.61 0.48 0.50
95010 0.03 - -
95013 0.11 - 1.35
95014 0.53 - 1.67
95018 0.09 - 0.78
95019 0.09 - -
95020 0.29 - -
95030 0.04 - -
95032 0.49 1.53 0.33
95033 0.19 - 0.09
95035 0.46 0.39 0.57
95037 0.14 0.04 0.29
95046 0.03 - -
95050 0.50 0.43 1.69
95051 0.43 0.55 0.75
95052 0.02 - -
95053 0.06 - 0.80
95054 0.23 0.05 1.04
95060 0.45 0.59 0.84
95062 0.70 - 3.33
95064 0.04 - -
95065 0.10 - 0.97
95066 0.11 - 0.86
95070 0.46 - -
95073 0.04 - 0.07
95076 0.20 - -
95110 0.16 0.18 -
95111 0.16 0.45 -
95112 0.47 0.37 -
95115 0.02 - -
95116 0.08 - 0.66
95117 0.46 0.27 -
95118 0.12 0.14 -
95119 0.19 - 0.15
95120 0.39 0.18 1.52
95121 0.33 0.19 -
______________________________________________________

31
Table 2.14 Place of Residence-Zip Code of Recreators in the Three Study Areas (continued)
Zip Code NCC Region Recreators
Greater Farallones NMS
northern portion of MBNMS
95122 0.41 - -
95123 0.94 1.09 0.43
95124 0.41 0.29 0.74
95125 0.48 0.29 -
95126 0.47 - 1.28
95127 0.26 0.85 -
95128 0.29 - 0.81
95129 0.30 0.34 1.01
95130 0.21 0.33 -
95131 0.28 - -
95132 0.27 - 0.45
95133 0.23 - 1.45
95134 0.52 0.38 0.65
95135 0.18 0.11 -
95136 0.19 - -
95138 0.10 0.69 -
95139 0.05 - 0.18
95148 0.54 1.25 -
95401 0.46 1.98 -
95403 0.60 0.71 0.49
95404 0.48 0.26 0.21
95405 0.79 1.94 -
95407 0.22 0.10 -
95409 0.67 0.30 -
95412 0.02 - -
95420 0.01 - -
95425 0.17 0.72 -
95436 0.14 0.88 -
95437 0.27 0.57 -
95442 0.04 - -
95445 0.04 0.29 -
95446 0.10 - -
95448 0.12 0.26 -
95453 0.02 - -
95458 0.11 - -
95460 0.06 - -
95461 0.01 - -
95462 0.04 - -
95467 0.13 - -
_______________________________________________________
32
Table 2.14 Place of Residence-Zip Code of Recreators in the Three Study Areas (continued
Zip Code NCC Region Recreators
Greater Farallones NMS
northern portion of MBNMS
95472 0.63 0.72 -
95476 0.45 - -
95482 0.12 - -
95485 0.02 - -
95490 0.08 - -
95492 0.30 0.08 -
95608 1.02 1.32 -
95610 0.14 - -
95620 0.02 - -
95621 0.57 0.91 -
95624 0.64 0.40 -
95626 0.01 0.06 -
95628 0.72 1.27 1.46
95630 0.91 1.95 0.26
95632 0.41 2.23 -
95655 0.04 0.23 -
95660 0.21 0.10 -
95662 0.17 - -
95670 0.46 0.36 -
95673 0.19 0.65 -
95683 0.01 - -
95687 0.39 2.44 -
95693 0.22 - -
95742 0.09 - -
95757 0.55 - -
95758 0.90 0.17 -
95811 0.07 - -
95814 0.54 1.26 0.35
95815 0.17 - -
95816 0.26 0.61 0.22
95817 0.14 - -
95818 0.78 3.94 0.28
95819 0.40 - -
95820 0.10 0.06 0.29
95821 0.16 0.33 -
95822 0.28 0.49 0.93
95823 0.22 - -
95824 0.10 - -
95825 0.57 1.41 -

33
Table 2.14 Place of Residence-Zip Code of Recreators in the Three Study Areas (continued)
Zip Code NCC Region Recreators
Greater Farallones NMS
northern portion of MBNMS
95826 0.63 - -
95827 0.33 - 0.72
95828 0.11 0.08 -
95829 0.28 0.18 -
95831 1.25 0.94 0.73
95832 0.01 - -
95833 0.42 0.18 0.22
95834 0.47 1.24 0.42
95835 0.33 0.83 0.17
95838 0.09 - 1.09
95841 0.4 0.90 -
95842 0.19 0.36 0.14
95843 0.45 1.10 0.23
95864 0.42 0.59 -
95866 0.04 - -
Source: Ecotrust Survey of North Central California Region
Place of Residence – County. As with zip code, we did not do statistical tests on the differences
in place of residence-county for recreators in the three study areas. Again, in the main report we
presented the top five counties for each study area in the main body of the report and included
the full results in an appendix table.
Table 2.15 Place of Residence - County for Recreators in the Three Study Areas
County NCC Region Recreators
Greater Farallones NMS
northern portion of MBNMS
Alameda 16.04 12.38 21.95
Contra Costa 12.57 15.52 9.88
Lake 0.28 - -
Marin 3.57 4.84 2.06
Mendocino 0.57 0.85 -
Napa 1.05 1.59 0.11
Sacramento 16.45 24.15 7.50
San Francisco 11.61 7.94 7.81
San Mateo 10.15 6.57 12.73
Santa Clara 17.52 13.13 28.50
Santa Cruz 2.49 0.88 8.04
Solano 0.93 2.60 0.72
Sonoma 6.76 9.54 0.70
Source: Ecotrust Survey of North Central California Region

34
3. Recreation Use
Chen et al. (2013) provided estimates of total person-trips for the NCC Region for all visitors to
the NCC Region including those who did not do any recreation activities. They also provided
activity profiles for annual (last 12 months) activity participation by activity and activity
participation on the last trip to the NCC Region. Last trip information is important for two
reasons: 1) mapping of activity by type of activity was done for the last trip and 2) expenditures
were obtained for the last trip.
We go much further in estimating recreation use. We used the mapped data to estimate the
proportion of use in each sanctuary area. This requires the assumption that the last trip is
representative of the distribution of activity across the entire year. Since the survey wasn’t
specifically designed to estimate the amount of use in each sanctuary area (i.e. we simply
exploited existing data to estimate the amount of use in the two sanctuary areas), there is some
unknown amount of error in estimation.
For activity participation, we estimated the annual and last trip participation rates for all
activities and for non-consumptive recreation only. The reason for the latter is that when we
estimate expenditures and economic impact for the two sanctuary areas, we limit it to non-
consumptive recreation activities because we have previously estimated recreational fishing
activity, expenditures and economic impact in another study (Leeworthy and Schwarzmann,
2015).
For each study area, we estimated the total annual amount of person-trips and person-days of
visitation and the distribution of person-trips and person-days by type of recreation. A person-
trip is one person taking a trip of any length (measured in days per trip). A person-day is a better
measurement of intensity of activity and is defined as one person visiting or taking part in an
activity for a day or any part of a day. To estimate person-trips and person-days by recreation
activity, we take the estimates of total person-trips and person-days of recreation activity and
distribute across activities using the percentage distribution of activities mapped in the
geographic information system (GIS) with the percentages across activities adding to 100 percent
to eliminate double-counting across activities, since a person could do multiple activities in a
single day. Again, we do this for with and without fishing.
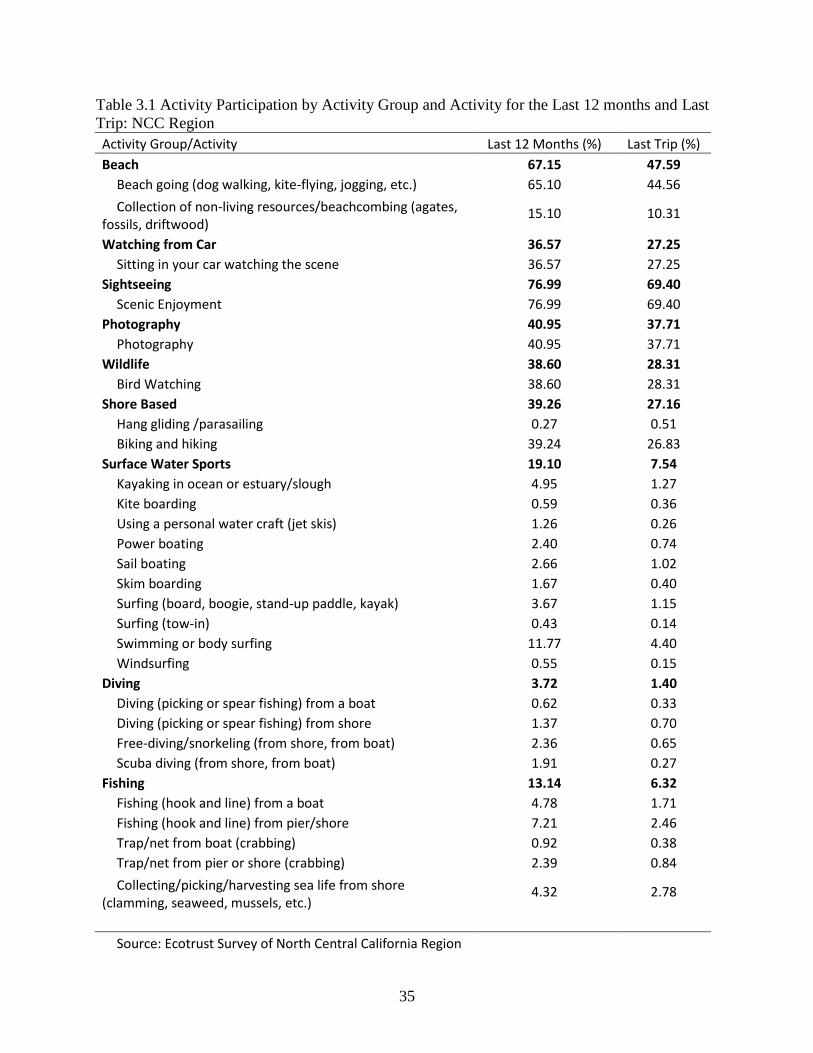
Annual and Last Trip Activity Participation
NCC Region
The activity participation estimates provided here are in agreement with those provided in Chen
et al. (2013) for the NCC Region. They are repeated here for easy comparison with the profiles
for the two sanctuary areas. We departed from Chen et al. (2013) in that we formed nine activity
groupings. Some of our groupings are single activity groups. We use the criterion that a group
had to enough sample observations that we could develop separate activity maps. Diving was an
exception to this since only 1.4% of respondents did it on their last trip for which activities were
mapped. Table 3.1 summarizes the estimates for participation in the NCC Region.
35
Table 3.1 Activity Participation by Activity Group and Activity for the Last 12 months and Last
Trip: NCC Region
Activity Group/Activity Last 12 Months (%) Last Trip (%)
Beach 67.15 47.59
Beach going (dog walking, kite-flying, jogging, etc.) 65.10 44.56
Collection of non-living resources/beachcombing (agates, fossils, driftwood)
15.10 10.31
Watching from Car 36.57 27.25
Sitting in your car watching the scene 36.57 27.25
Sightseeing 76.99 69.40
Scenic Enjoyment 76.99 69.40
Photography 40.95 37.71
Photography 40.95 37.71
Wildlife 38.60 28.31
Bird Watching 38.60 28.31
Shore Based 39.26 27.16
Hang gliding /parasailing 0.27 0.51
Biking and hiking 39.24 26.83
Surface Water Sports 19.10 7.54
Kayaking in ocean or estuary/slough 4.95 1.27
Kite boarding 0.59 0.36
Using a personal water craft (jet skis) 1.26 0.26
Power boating 2.40 0.74
Sail boating 2.66 1.02
Skim boarding 1.67 0.40
Surfing (board, boogie, stand-up paddle, kayak) 3.67 1.15
Surfing (tow-in) 0.43 0.14
Swimming or body surfing 11.77 4.40
Windsurfing 0.55 0.15
Diving 3.72 1.40
Diving (picking or spear fishing) from a boat 0.62 0.33
Diving (picking or spear fishing) from shore 1.37 0.70
Free-diving/snorkeling (from shore, from boat) 2.36 0.65
Scuba diving (from shore, from boat) 1.91 0.27
Fishing 13.14 6.32
Fishing (hook and line) from a boat 4.78 1.71
Fishing (hook and line) from pier/shore 7.21 2.46
Trap/net from boat (crabbing) 0.92 0.38
Trap/net from pier or shore (crabbing) 2.39 0.84
Collecting/picking/harvesting sea life from shore (clamming, seaweed, mussels, etc.)
4.32 2.78
Source: Ecotrust Survey of North Central California Region
36
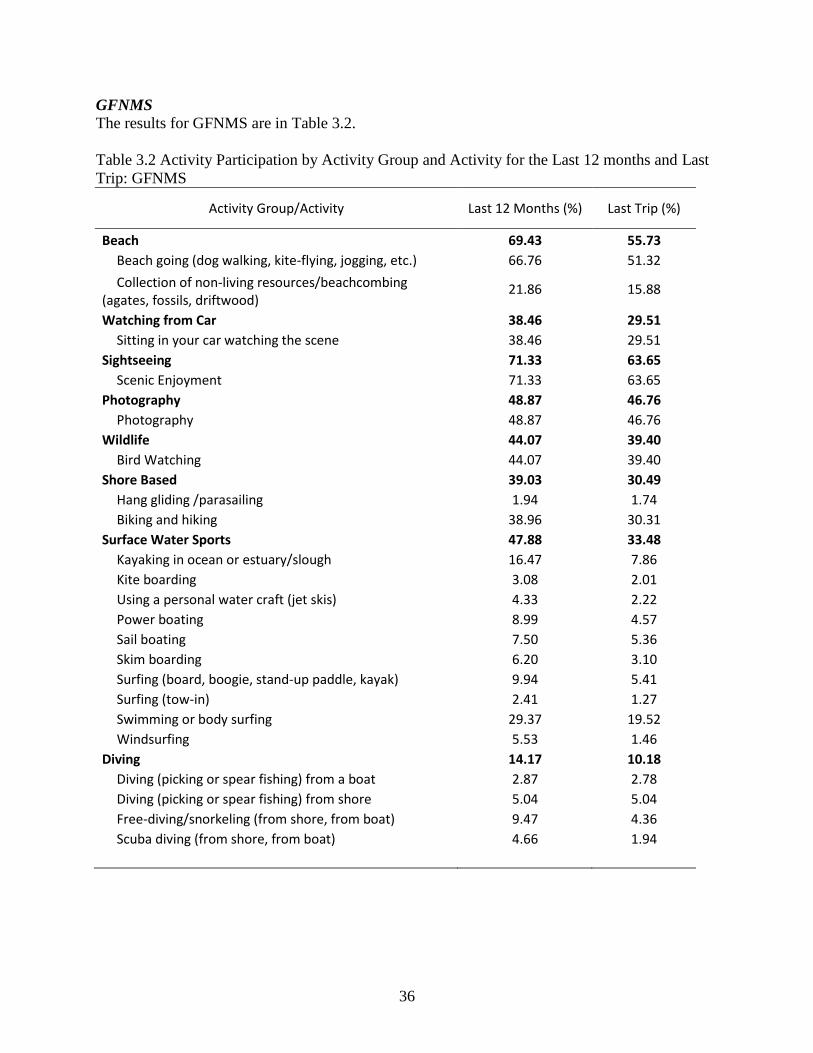
GFNMS The results for GFNMS are in Table 3.2.
Table 3.2 Activity Participation by Activity Group and Activity for the Last 12 months and Last
Trip: GFNMS
Activity Group/Activity Last 12 Months (%) Last Trip (%)
Beach 69.43 55.73
Beach going (dog walking, kite-flying, jogging, etc.) 66.76 51.32
Collection of non-living resources/beachcombing (agates, fossils, driftwood)
21.86 15.88
Watching from Car 38.46 29.51
Sitting in your car watching the scene 38.46 29.51
Sightseeing 71.33 63.65
Scenic Enjoyment 71.33 63.65
Photography 48.87 46.76
Photography 48.87 46.76
Wildlife 44.07 39.40
Bird Watching 44.07 39.40
Shore Based 39.03 30.49
Hang gliding /parasailing 1.94 1.74
Biking and hiking 38.96 30.31
Surface Water Sports 47.88 33.48
Kayaking in ocean or estuary/slough 16.47 7.86
Kite boarding 3.08 2.01
Using a personal water craft (jet skis) 4.33 2.22
Power boating 8.99 4.57
Sail boating 7.50 5.36
Skim boarding 6.20 3.10
Surfing (board, boogie, stand-up paddle, kayak) 9.94 5.41
Surfing (tow-in) 2.41 1.27
Swimming or body surfing 29.37 19.52
Windsurfing 5.53 1.46
Diving 14.17 10.18
Diving (picking or spear fishing) from a boat 2.87 2.78
Diving (picking or spear fishing) from shore 5.04 5.04
Free-diving/snorkeling (from shore, from boat) 9.47 4.36
Scuba diving (from shore, from boat) 4.66 1.94

37
Table 3.2 Activity Participation by Activity Group and Activity for the Last 12 months and Last Trip:
GFNMS (continued)
Activity Group/Activity Last 12 Months (%) Last Trip (%)
Fishing 38.83 34.34
Fishing (hook and line) from a boat 16.86 10.73
Fishing (hook and line) from pier/shore 21.64 13.29
Trap/net from boat (crabbing) 4.79 3.12
Trap/net from pier or shore (crabbing) 9.57 6.25
Collecting/picking/harvesting sea life from shore (clamming, seaweed, mussels, etc.)
15.32 16.49
Source: Ecotrust Survey of North Central California Region

38
northern portion of the MBNMS
The results for the northern portion of MBNMS are in Table 3.3.
Table 3.3 Activity Participation by Activity Group and Activity for the Last 12 months and the Last Trip:
northern portion of MBNMS
Activity Group/Activity Last 12 Months
(%) Last Trip (%)
Beach 73.85 60.96
Beach going (dog walking, kite-flying, jogging, etc.) 72.42 57.61
Collection of non-living resources/beachcombing (agates, fossils, driftwood) 16.66 12.03
Watching from Car 42.36 33.90
Sitting in your car watching the scene 42.36 33.90
Sightseeing 76.05 72.32
Scenic Enjoyment 76.05 72.32
Photography 49.63 48.61
Photography 49.63 48.61
Wildlife 50.75 39.07
Bird Watching 50.75 39.07
Shore Based 40.29 29.13
Hang gliding /parasailing 0.53 3.27
Biking and hiking 40.02 26.02
Surface Water Sports 31.59 25.07
Kayaking in ocean or estuary/slough 5.85 3.19
Kite boarding 0.57 0.00
Using a personal water craft (jet skis) 0.79 0.68
Power boating 3.19 0.91
Sail boating 5.00 0.72
Skim boarding 1.27 0.53
Surfing (board, boogie, stand-up paddle, kayak) 10.02 7.27
Surfing (tow-in) 0.78 0.00
Swimming or body surfing 19.84 14.99
Windsurfing 1.38 0.53
Diving 2.42 1.56
Diving (picking or spear fishing) from a boat 0.25 0.00
Diving (picking or spear fishing) from shore 0.60 0.57
Free-diving/snorkeling (from shore, from boat) 1.37 1.40
Scuba diving (from shore, from boat) 1.46 0.40

39
Table 3.3 Activity Participation by Activity Group and Activity for the Last 12 months and the Last Trip:
northern portion of MBNMS (continued)
Activity Group/Activity Last 12 Months (%) Last Trip (%)
Fishing 22.55 13.47
Fishing (hook and line) from a boat 6.31 1.76
Fishing (hook and line) from pier/shore 11.23 4.44
Trap/net from boat (crabbing) 1.40 0.78
Trap/net from pier or shore (crabbing) 1.01 0.17
Collecting/picking/harvesting sea life from shore (clamming, seaweed, mussels, etc.) 10.14 6.49
_______________________________________________________________________________
Source: Ecotrust Survey of North Central California Region
Total Person-trips and Person-days
NCC Region – All Visitors
Person-trips - All Visitors. All estimation here uses as its starting point the estimates of person-
trips for all visitors to the NCC Region found in Chen et al. (2013):
6,943,138 Study Area Population 18 years old or older that visited the NCC Region Last 12
months
x
3.20 mean number of trips to the NCC Region Last 12 month
= 22,197,663 Total Person-trips by All Visitors to the NCC Region Last 12 months
x .7766 Percent of All Visitors that are Residents of the Study Area
= 17,238,705 Resident Person-trips – All Visitors
22,197663 – 17,238,705 = 4,958,958 Non-Resident Person-trips – All Visitors
Chen et al. (2013) estimated that 6,943,138 people 18 years of age and older visited the NCC
Region in 2011. They estimated that the average person took 3.20 trips per year to the NCC
Region (includes those who did not visit as zero trips) yielding an estimate of 22,197,663 person-
trips for all visitors to the NCC Region in 2011. We then defined “Residents” of the NCC
Region as anyone who lived in the area we defined as our study area for estimating economic
impact (see Figure 1.3). For the NCC Region our estimate was 77.66%. This was multiplied by
the estimate of person-trips for all visitors to yield an estimate of 17,238,705 resident person-
trips. Non-resident person-trips were then the difference between total person-trips and resident
person-trips. These estimates are important because they are used to extrapolate expenditures
per person-trip by resident status to total expenditures in Chapter 5.
Person-days – All Visitors. Person-trips derived above were then used to estimate person-days
by multiplying by the mean length of trips measured in days by residential status. The mean days
per trip were 2.09 for “All Visitors”, 2.01 for “Resident Visitors” and 2.37 for “Non-resident
Visitors”. This yielded estimates for person-days for “All Visitors” of 46,393,116; 34,649,797

40
person-days for “Resident Visitors”; and 11,743,319 person-days for “Non-Resident Visitors” to
the NCC Region.
NCC Region – Recreating Visitors
We estimated person-trips and person-days for those who visited the NCC region and did at least
one recreation activity there in the past 12 months. The estimates of total person-trips for those
who recreated were important as control totals for distributing person-trips by activity/activity
group. The estimates for person-days served as control totals for distributing person-days by
activity/activity group and to normalize total expenditures by spending category to expenditures
per person-day for Chapter 4. These estimates can be used for assessing the impacts on the local
economies from oil spills, chemical spills or other hazards that affect use or in assessing changes
in rules and regulations.
Person-trips – Recreating Visitors. We first estimated the percent of all visitors that took at least
one trip to the NCC region in the last 12 months that did at least one recreation activity. We
estimated that 60.03% of all visitors to the NCC Region did at least one recreation activity there
in the past 12 month. This was then multiplied by the estimate of 6,943,138 people who visited
the NCC Region to yield an estimate of 4,167,966 people age 18 years of age an older that
visited the NCC Region and did at least one recreation activity there in the past 12 month. On
average, these visitors made 5.16 trips per year yielding an estimate of 21,506,705 person-trips
for recreation. Table 3.4 includes the estimates of person-trips by activity and activity group for
all activities, including fishing.
6,943,138 Number of people 18 years of age or older that Visited the NCC Region in the past 12
months
x
0.6003 The percent of all visitors to the NCC Region that did at least one recreation activity in
past 12 months
= 4,167,966 Number of Visitors 18 years of age and older that did recreation in the past 12
months
x
5.16 Mean number of trips where at least one recreation activity was done in the last 12 month
= 21,506,705 Total number of person-trips where at least one recreation activity was done in the
past 12 months
Person-days – Recreating Visitors. The person-trips estimated above were then used to estimate
person-days for the recreating visitors. For all recreating visitors, the mean length of trip was
1.75 days. Multiplying the mean days per trip by the person-trips yielded estimates of
37,636,734 person-days for all recreating visitors. Table 3.5 includes the estimates of person-
days by activity and activity group for all activities, including fishing.

41
NCC Region – Recreating Visitors (Non-Consumptive Recreation Only)
Since we restricted our estimates of person-trips and person-days for the two sanctuary areas to
non-consumptive recreation activities only, we also developed comparable estimates for the
NCC Region. To do this required using the last trip information in the GIS to estimate the
percent of trips that were for non-consumptive recreation and estimating the proportion of trips
for fishing and subtracting it from the totals for person-trips and person-days.
Person-trips Recreating Visitors (Non-Consumptive Recreation Only). We estimated that
98.87% of all person-trips by recreating visitors to the NCC Region where non-consumptive
recreation was done yielding an estimate of 21,221,593 person-trips (Table 3.4). Next we
estimated that 78.72% of the person-trips that were done by residents of the economic impact
study area were done in the NCC Region yielding an estimate of 16,705,638 person-trips for
residents and 4,515,955 person-trips for non-residents. These estimates can then be used to
estimate the relative proportion of non-consumptive recreation activity in the NCC Region which
is done in each of the sanctuary areas. The estimates can also be used as control totals for
distributing person-trips by activity/activity group and for extrapolating expenditures per person-
trip to total expenditures for estimating economic impact in Chapter 5. Table 3.6 provides the
distribution by activity and activity group for person-trips for only non-consumptive recreation.
The estimates of person-trips are the same as in Table 3.4, the difference is the percentages. The
percentages are the distribution across non-consumptive recreation adding to 100 percent.
Person-days Recreating Visitors (Non-Consumptive Recreation Only). Using our estimates of
person-trips above, we multiply these by estimates of the mean number of days per trip. All non-
consumptive recreators had an estimated 1.75 days per trip; resident non-consumptive recreators
had an estimated mean number of days per trip of 1.60; and non-resident non-consumptive
recreators had a mean number of days per trip of 2.30. This yielded estimates of 37,137,788
person-days for all non-consumptive recreation in the NCC Region. Residents of the economic
impact study area for the NCC Region had an estimated 26,729,021 person-days, and non-
residents had 10,408,767. These person-day estimates are used as control totals for estimating
the person-days by activity/activity group and for normalizing total expenditures on a per person-
day basis in Chapter 4. Table 3.7 provides the distribution by activity and activity group for
person-days for only non-consumptive recreation. The estimates of person-days are the same as
in Table 3.5, the difference is the percentages. The percentages are the distribution across non-
consumptive recreation adding to 100 percent.
All Sanctuary Areas in NCC Region – All Recreating Visitors
Person-trips All Recreating Visitors. We estimated the proportion of all recreating visitors to
both sanctuaries using the proportion of activity points in the GIS that took place in both
sanctuary areas at 10.52%. This translated into 2,262,505 person-trips. More than half of these
person-trips (56.33%) were in the GFNMS and 43.67% in the northern portion of MBNMS. This
translated into 1,274,469 person-trips in the GFNMS and 988,036 person-trips in the northern
portion of MBNMS. These estimates are only used as control totals for estimating person-trips
by recreation activity/activity group and for estimating the proportion of NCC Region activity
done in sanctuary areas. Table 3.4 provides the distribution by activity and activity group to
42
person-trips. Table 3.4 includes the estimates of person-trips by activity and activity group for all
activities, including fishing. These estimates are only provided for comparison with those of the
NCC Region and are not used in estimating the economic impact of these activities on the local
area economies.
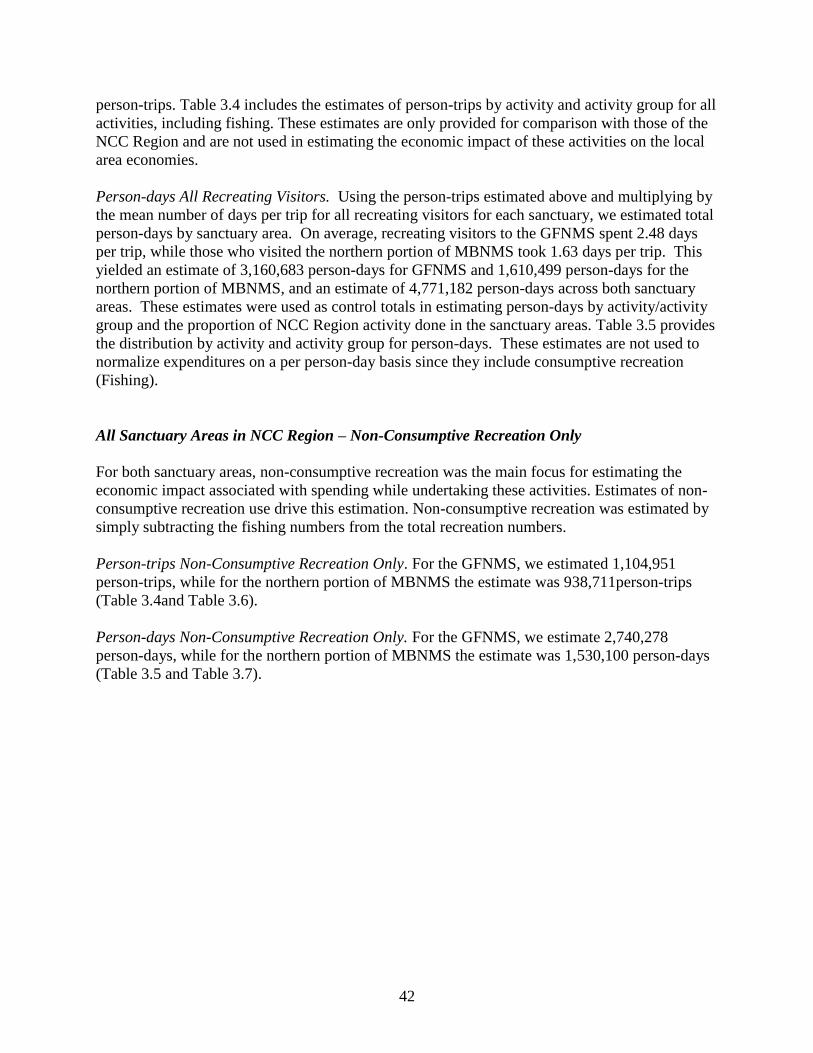
Person-days All Recreating Visitors. Using the person-trips estimated above and multiplying by
the mean number of days per trip for all recreating visitors for each sanctuary, we estimated total
person-days by sanctuary area. On average, recreating visitors to the GFNMS spent 2.48 days
per trip, while those who visited the northern portion of MBNMS took 1.63 days per trip. This
yielded an estimate of 3,160,683 person-days for GFNMS and 1,610,499 person-days for the
northern portion of MBNMS, and an estimate of 4,771,182 person-days across both sanctuary
areas. These estimates were used as control totals in estimating person-days by activity/activity
group and the proportion of NCC Region activity done in the sanctuary areas. Table 3.5 provides
the distribution by activity and activity group for person-days. These estimates are not used to
normalize expenditures on a per person-day basis since they include consumptive recreation
(Fishing).
All Sanctuary Areas in NCC Region – Non-Consumptive Recreation Only
For both sanctuary areas, non-consumptive recreation was the main focus for estimating the
economic impact associated with spending while undertaking these activities. Estimates of non-
consumptive recreation use drive this estimation. Non-consumptive recreation was estimated by
simply subtracting the fishing numbers from the total recreation numbers.
Person-trips Non-Consumptive Recreation Only. For the GFNMS, we estimated 1,104,951
person-trips, while for the northern portion of MBNMS the estimate was 938,711person-trips
(Table 3.4and Table 3.6).
Person-days Non-Consumptive Recreation Only. For the GFNMS, we estimate 2,740,278
person-days, while for the northern portion of MBNMS the estimate was 1,530,100 person-days
(Table 3.5 and Table 3.7).

43
Table 3.4 Person-trips by Activity/Activity Group for the Three Study Areas
Activity Group/Activity NCC Region GFNMS northern portion of MBNMS
Person-Trips (%) Person-Trips (%) Person-Trips (%)
Beach 4,088,663 19.01 174,141 13.66 175,719 17.78
Beach going (dog walking, kite-flying, jogging, etc.) 3,402,852 15.82 146,402 11.49 141,809 14.35
Collection of non-living resources/beachcombing (agates, fossils, driftwood)
685,810 3.19 27,739 2.18 33,911 3.43
Watching from Car 1,792,354 8.33 43,150 3.39 66,280 6.71
Sitting in your car watching the scene 1,792,354 8.33 43,150 3.39 66,280 6.71
Sightseeing 6,465,111 30.06 231,161 18.14 245,082 24.80
Scenic Enjoyment 6,465,111 30.06 231,161 18.14 245,082 24.80
Photography 3,552,344 16.52 146,402 11.49 155,681 15.76
Photography 3,552,344 16.52 146,402 11.49 155,681 15.76
Wildlife 2,431,930 11.31 110,957 8.71 103,274 10.45
Bird Watching 2,431,930 11.31 110,957 8.71 103,274 10.45
Shore Based 2,299,391 10.69 101,711 7.98 81,694 8.27
Hang gliding /parasailing 16,953 0.08 0 0.00 1,541 0.16
Biking and hiking 2,282,439 10.61 101,711 7.98 80,153 8.11
Surface Water Sports 513,202 2.39 246,572 19.35 104,815 10.61
Kayaking in ocean or estuary/slough 63,187 0.29 47,773 3.75 7,707 0.78
Kite boarding 12,329 0.06 6,164 0.48 0 0.00
Using a personal water craft (jet skis) 20,035 0.09 13,870 1.09 1,541 0.16
Powerboating 44,693 0.21 20,034 1.57 4,624 0.47
Sail boating 55,481 0.26 27,739 2.18 4,624 0.47
Skim boarding 21,576 0.10 15,411 1.21 0 0.00
Surfing (board, boogie, stand-up paddle, kayak) 70,893 0.33 16,952 1.33 23,121 2.34
Surfing (tow-in) 4,623 0.02 1,541 0.12 0 0.00
Swimming or body surfing 211,137 0.98 90,923 7.13 63,197 6.40
Windsurfing 9,247 0.04 6,164 0.48 0 0.00

44
Table 3.4 Person-trips by Activity/Activity Group for the Three Study Areas (continued)
Activity Group/Activity NCC Region GFNMS northern portion of MBNMS
Person-Trips (%) Person-Trips (%) Person-Trips (%)
Diving 78,598 0.37 50,855 3.99 6,166 0.62
Diving (picking or spear fishing) from a boat 12,329 0.06 6,164 0.48 0 0.00
Diving (picking or spear fishing) from shore 27,741 0.13 21,575 1.69 1,541 0.16
Free-diving/snorkeling (from shore, from boat) 26,199 0.12 16,952 1.33 3,083 0.31
Scuba diving (from shore, from boat) 12,329 0.06 6,164 0.48 1,541 0.16
Fishing 285,112 1.33 169,518 13.30 49,325 4.99
Fishing (hook and line) from a boat 50,858 0.24 38,527 3.02 6,166 0.62
Fishing (hook and line) from pier/shore 80,140 0.37 35,445 2.78 15,414 1.56
Trap/net from boat (crabbing) 18,494 0.09 10,788 0.85 3,083 0.31
Trap/net from pier or shore (crabbing) 35,446 0.16 20,034 1.57 3,083 0.31
Collecting/picking/harvesting sea life from shore (clamming, seaweed, mussels, etc.) 100,175 0.47 64,725 5.08 21,580 2.18
Total with Fishing 21,506,705 100 1,274,469 100 988,036 100
Total without Fishing 21,221,593
1,104,951
938,711
Source: Ecotrust Survey of North Central California Region

45
Table 3.5 Person-days by Activity/Activity Group for the Three Study Areas
Activity Group/Activity NCC Region GFNMS northern portion of MBNMS
Person-Days (%) Person-Days (%) Person-Days (%)
Beach 7,155,160 19.01 431,871 13.66 286,423 17.78
Beach going (dog walking, kite-flying, jogging, etc.) 5,954,992 15.82 363,077 11.49 231,148 14.35
Collection of non-living resources/beachcombing (agates, fossils, driftwood) 1,200,168 3.19 68,794 2.18 55,275 3.43
Watching from Car 3,136,619 8.33 107,012 3.39 108,037 6.71
Sitting in your car watching the scene 3,136,619 8.33 107,012 3.39 108,037 6.71
Sightseeing 11,312,087 30.06 573,280 18.14 399,484 24.80
Scenic Enjoyment 11,313,945 30.06 573,280 18.14 399,484 24.80
Photography 6,216,601 16.52 363,077 11.49 253,760 15.76
Photography 6,216,601 16.52 363,077 11.49 253,760 15.76
Wildlife 4,255,877 11.31 275,174 8.71 168,336 10.45
Bird Watching 4,255,877 11.31 275,174 8.71 168,336 10.45
Shore Based 4,023,935 10.69 252,243 7.98 133,161 8.27
Hang gliding /parasailing 29,667 0.08 0 0.00 2,512 0.16
Biking and hiking 3,994,268 10.61 252,243 7.98 130,649 8.11
Surface Water Sports 898,103 2.39 611,499 19.35 170,849 10.61
Kayaking in ocean or estuary/slough 110,577 0.29 118,478 3.75 12,562 0.78
Kite boarding 21,576 0.06 15,287 0.48 0 0.00
Using a personal water craft (jet skis) 35,061 0.09 34,397 1.09 2,512 0.16
Powerboating 78,213 0.21 49,684 1.57 7,537 0.47
Sail boating 97,092 0.26 68,794 2.18 7,537 0.47
Skim boarding 37,758 0.10 38,219 1.21 0 0.00
Surfing (board, boogie, stand-up paddle, kayak) 124,062 0.33 42,041 1.33 37,687 2.34
Surfing (tow-in) 8,091 0.02 3,822 0.12 0 0.00
Swimming or body surfing 369,490 0.98 225,490 7.13 103,012 6.40
Windsurfing 16,182 0.04 15,287 0.48 0 0.00
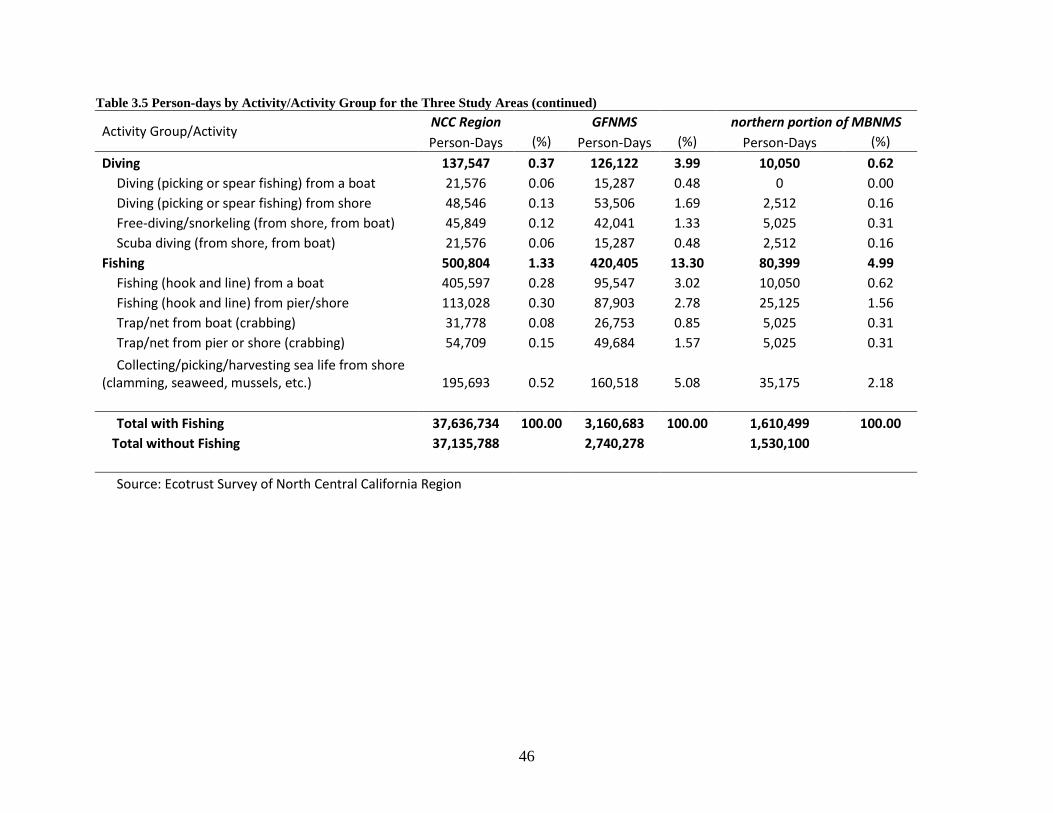
46
Table 3.5 Person-days by Activity/Activity Group for the Three Study Areas (continued)
Activity Group/Activity NCC Region GFNMS northern portion of MBNMS
Person-Days (%) Person-Days (%) Person-Days (%)
Diving 137,547 0.37 126,122 3.99 10,050 0.62
Diving (picking or spear fishing) from a boat 21,576 0.06 15,287 0.48 0 0.00
Diving (picking or spear fishing) from shore 48,546 0.13 53,506 1.69 2,512 0.16
Free-diving/snorkeling (from shore, from boat) 45,849 0.12 42,041 1.33 5,025 0.31
Scuba diving (from shore, from boat) 21,576 0.06 15,287 0.48 2,512 0.16
Fishing 500,804 1.33 420,405 13.30 80,399 4.99
Fishing (hook and line) from a boat 405,597 0.28 95,547 3.02 10,050 0.62
Fishing (hook and line) from pier/shore 113,028 0.30 87,903 2.78 25,125 1.56
Trap/net from boat (crabbing) 31,778 0.08 26,753 0.85 5,025 0.31
Trap/net from pier or shore (crabbing) 54,709 0.15 49,684 1.57 5,025 0.31
Collecting/picking/harvesting sea life from shore (clamming, seaweed, mussels, etc.) 195,693 0.52 160,518 5.08 35,175 2.18
Total with Fishing 37,636,734 100.00 3,160,683 100.00 1,610,499 100.00
Total without Fishing 37,135,788
2,740,278
1,530,100
Source: Ecotrust Survey of North Central California Region
47
Table 3.6 Person-trips by Activity/Activity Group for the Three Study Areas: Non-Consumptive Recreation Only
Activity Group/Activity NCC Region GFNMS northern portion of MBNMS
Person-Trips (%) Person-Trips (%) Person-Trips (%)
Beach 4,088,663 19.27 174,141 15.76 175,719 18.72
Beach going (dog walking, kite-flying, jogging, etc.) 3,402,852 16.03 146,402 13.25 141,809 15.11
Collection of non-living resources/beachcombing (agates, fossils, driftwood)
685,810 3.23 27,739 2.51 33,911 3.61
Watching from Car 1,792,354 8.45 43,150 3.91 66,280 7.06
Sitting in your car watching the scene 1,792,354 8.45 43,150 3.91 66,280 7.06
Sightseeing 6,465,111 30.46 231,161 20.92 245,082 26.11
Scenic Enjoyment 6,465,111 30.46 231,161 20.92 245,082 26.11
Photography 3,552,344 16.74 146,402 13.25 155,681 16.58
Photography 3,552,344 16.74 146,402 13.25 155,681 16.58
Wildlife 2,431,930 11.46 110,957 10.04 103,274 11.00
Bird Watching 2,431,930 11.46 110,957 10.04 103,274 11.00
Shore Based 2,299,391 10.84 101,711 9.21 81,694 8.70
Hang gliding /parasailing 16,953 0.08 0 0.00 1,541 0.16
Biking and hiking 2,282,439 10.76 101,711 9.21 80,153 8.54
Surface Water Sports 513,202 2.42 246,572 22.32 104,815 11.17
Kayaking in ocean or estuary/slough 63,187 0.30 47,773 4.32 7,707 0.82
Kite boarding 12,329 0.06 6,164 0.56 0 0.00
Using a personal water craft (jet skis) 20,035 0.09 13,870 1.26 1,541 0.16
Powerboating 44,693 0.21 20,034 1.81 4,624 0.49
Sail boating 55,481 0.26 27,739 2.51 4,624 0.49
Skim boarding 21,576 0.10 15,411 1.39 0 0.00
Surfing (board, boogie, stand-up paddle, kayak) 70,893 0.33 16,952 1.53 23,121 2.46
Surfing (tow-in) 4,623 0.02 1,541 0.14 0 0.00
Swimming or body surfing 211,137 0.99 90,923 8.23 63,197 6.73
Windsurfing 9,247 0.04 6,164 0.56 0 0.00

48
Table 3.6 Person-trips by Activity/Activity Group for the Three Study Areas: Non-Consumptive Recreation Only (continued)\
Activity Group/Activity NCC Region GFNMS northern portion of MBNMS
Person-Trips (%) Person-Trips (%) Person-Trips (%)
Diving 78,598 0.37 50,855 4.60 6,166 0.66
Diving (picking or spear fishing) from a boat 12,329 0.06 6,164 0.56 0 0.00
Diving (picking or spear fishing) from shore 27,741 0.13 21,575 1.95 1,541 0.16
Free-diving/snorkeling (from shore, from boat) 26,199 0.12 16,952 1.53 3,083 0.33
Scuba diving (from shore, from boat) 12,329 0.06 6,164 0.56 1,541 0.16
Total Non-Consumptive 21,221,593 100.00 1,104,951 100.00 938,711 100.00
Source: Ecotrust Survey of North Central California Region
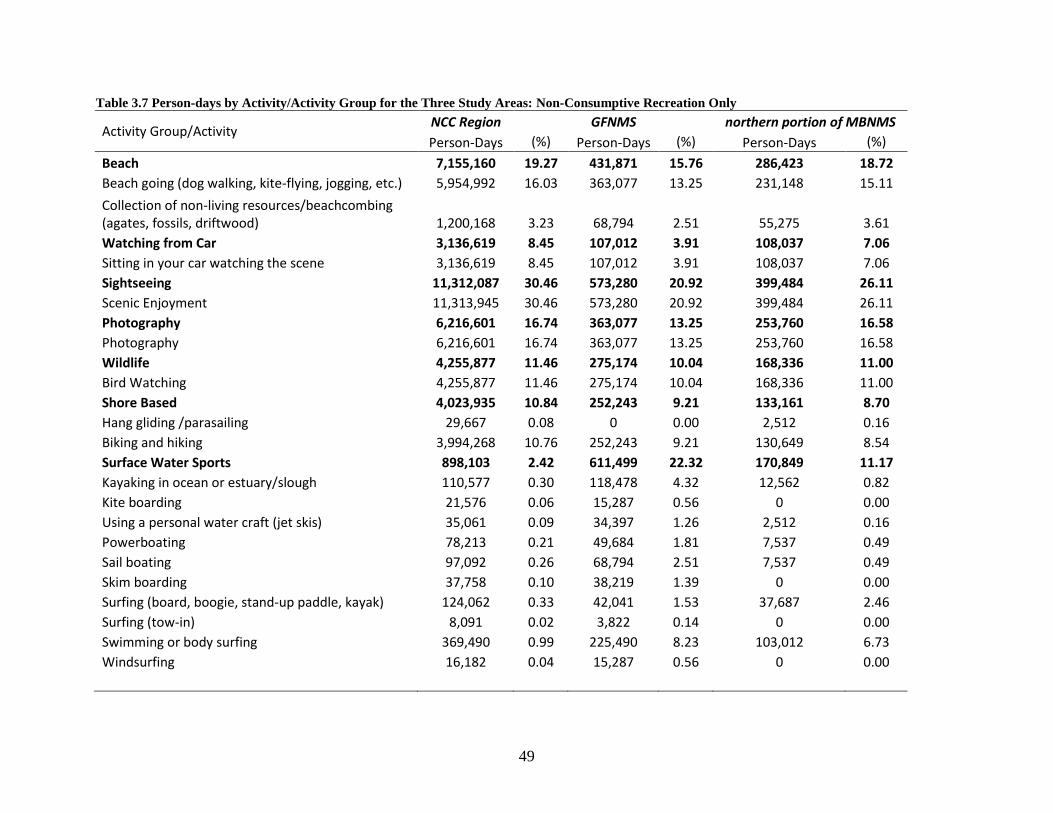
49
Table 3.7 Person-days by Activity/Activity Group for the Three Study Areas: Non-Consumptive Recreation Only
Activity Group/Activity NCC Region GFNMS northern portion of MBNMS
Person-Days (%) Person-Days (%) Person-Days (%)
Beach 7,155,160 19.27 431,871 15.76 286,423 18.72
Beach going (dog walking, kite-flying, jogging, etc.) 5,954,992 16.03 363,077 13.25 231,148 15.11
Collection of non-living resources/beachcombing (agates, fossils, driftwood) 1,200,168 3.23 68,794 2.51 55,275 3.61
Watching from Car 3,136,619 8.45 107,012 3.91 108,037 7.06
Sitting in your car watching the scene 3,136,619 8.45 107,012 3.91 108,037 7.06
Sightseeing 11,312,087 30.46 573,280 20.92 399,484 26.11
Scenic Enjoyment 11,313,945 30.46 573,280 20.92 399,484 26.11
Photography 6,216,601 16.74 363,077 13.25 253,760 16.58
Photography 6,216,601 16.74 363,077 13.25 253,760 16.58
Wildlife 4,255,877 11.46 275,174 10.04 168,336 11.00
Bird Watching 4,255,877 11.46 275,174 10.04 168,336 11.00
Shore Based 4,023,935 10.84 252,243 9.21 133,161 8.70
Hang gliding /parasailing 29,667 0.08 0 0.00 2,512 0.16
Biking and hiking 3,994,268 10.76 252,243 9.21 130,649 8.54
Surface Water Sports 898,103 2.42 611,499 22.32 170,849 11.17
Kayaking in ocean or estuary/slough 110,577 0.30 118,478 4.32 12,562 0.82
Kite boarding 21,576 0.06 15,287 0.56 0 0.00
Using a personal water craft (jet skis) 35,061 0.09 34,397 1.26 2,512 0.16
Powerboating 78,213 0.21 49,684 1.81 7,537 0.49
Sail boating 97,092 0.26 68,794 2.51 7,537 0.49
Skim boarding 37,758 0.10 38,219 1.39 0 0.00
Surfing (board, boogie, stand-up paddle, kayak) 124,062 0.33 42,041 1.53 37,687 2.46
Surfing (tow-in) 8,091 0.02 3,822 0.14 0 0.00
Swimming or body surfing 369,490 0.99 225,490 8.23 103,012 6.73
Windsurfing 16,182 0.04 15,287 0.56 0 0.00
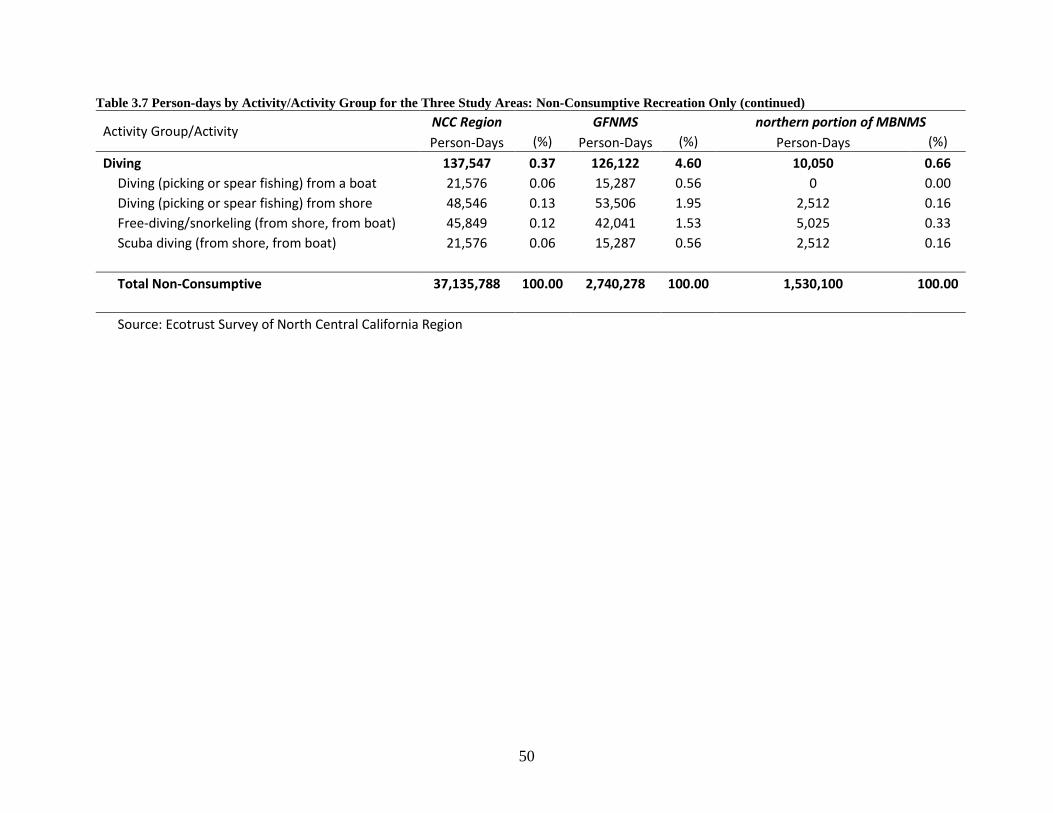
50
Table 3.7 Person-days by Activity/Activity Group for the Three Study Areas: Non-Consumptive Recreation Only (continued)
Activity Group/Activity NCC Region GFNMS northern portion of MBNMS
Person-Days (%) Person-Days (%) Person-Days (%)
Diving 137,547 0.37 126,122 4.60 10,050 0.66
Diving (picking or spear fishing) from a boat 21,576 0.06 15,287 0.56 0 0.00
Diving (picking or spear fishing) from shore 48,546 0.13 53,506 1.95 2,512 0.16
Free-diving/snorkeling (from shore, from boat) 45,849 0.12 42,041 1.53 5,025 0.33
Scuba diving (from shore, from boat) 21,576 0.06 15,287 0.56 2,512 0.16
Total Non-Consumptive 37,135,788 100.00 2,740,278 100.00 1,530,100 100.00
Source: Ecotrust Survey of North Central California Region
51
4. Expenditures
The first step in estimating expenditures was to replicate the estimates of expenditures per person
per trip in Chen et al. (2013). In our first runs we were not able to replicate all the estimates.
After consulting with the authors, we learned they eliminated some outliers. We conducted our
own outlier analysis and after completing it, we were able to replicate, within rounding error, all
the estimates except for three expenditure categories. Overall, the difference in total
expenditures per person per trip was less than one-half of one percent (0.047%).
Outlier Analysis
NCC Region
We eliminated observations for each category of expenditure if they accounted for a significant
portion of the weighted sum of expenditures and therefore had high influence on the estimated
mean expenditure per person per trip. The following outliers were eliminated:
Food and Beverages at a restaurant or bar: Greater than $200
Lodging (if stayed overnight): Greater than $400
Food and Beverages from a store: Greater than or equal to $500
Souvenirs (t-shirts, posters, gifts, etc.): Greater than or equal to $500
Parking: Greater than or equal to $400
Museum, aquarium, or other entrance fee: Greater than or equal to $3,000
After deleting these outliers, we were able to replicate all the published expenditures in Chen et
al. (2013) except for Food and Beverages from a store (their estimate was $6.24 and ours was
$6.19); Parking (their estimate was $2.51 and ours was $1.53); and Lessons, clinics, camps (their
estimate was $0.30 and ours was $0.33). In total, the Chen et al. (2013) estimate was $54.48 per
person per trip, while our estimate was $53.54, a difference of $0.94 or 1.7%. Most of the
difference was due to the estimate for “parking”. We could not resolve the difference. Our
estimates for the NCC Region for All Visitors are summarized in Table 4.1.

52
Table 4.1 Average Trip Expenditures Per Person Across All Respondents, Last Trip: NCC Region
Expenditure Type Average
N Min Max Expenditure ($)1
Food and Beverages at a restaurant or bar $18.47 3,296 $0.00 $200.00
Lodging (if you stayed overnight) $18.02 3,321 $0.00 $400.00
Food and Beverages from a store $6.19 3,328 $0.00 $180.00
Souvenirs (t-shirts, posters, gifts, etc.) $3.29 3,347 $0.00 $250.00
Parking $1.53 3,337 $0.00 $150.00
Museum, aquarium, or other entrance fee $1.67 3,353 $0.00 $75.00
Car rental $0.86 3,379 $0.00 $400.00
Sundries (sunscreen, surf wax, motion sickness pills, $0.54 3,361 $0.00 $100.00
batteries, film and processing, etc.)
Boat rental $0.49 3,381 $0.00 $116.67
Charter fee (whale watching, etc.) $0.44 3,382 $0.00 $200.00
Bike rental $0.34 3,381 $0.00 $100.00
Lessons, clinics, camps $0.33 3,380 $0.00 $500.00
Kayak rental $0.28 3,382 $0.00 $150.00
Dive equipment rental and air fills $0.28 3,381 $0.00 $150.00
Boat fuel $0.24 3,382 $0.00 $100.00
Bait and tackle $0.20 3,376 $0.00 $50.00
One-day fishing license fee $0.15 3,379 $0.00 $62.50
Surfboard or body board rental $0.14 3,381 $0.00 $100.00
Ramp fees $0.06 3,383 $0.00 $35.00
Hang glide rental $0.02 3,383 $0.00 $100.00
Total Expenditures $53.54
1. Estimates in bold difference from those in Chen et al. (2013). Source: Ecotrust Survey of NCC Region.
GFNMS
For GFNMS, we only estimated expenditures for those that did non-consumptive recreation. We
dropped the spending categories of “bait & tackle” and “One-day fishing license fee”. Since
sample size for the GFNMS was much lower for all expenditure categories, we conducted further
outlier analysis to determine if additional outliers needed to be eliminated. We eliminated the
following outliers for estimation of the expenditures per person per trip for the GFNMS:
Food and Beverages from a restaurant or bar: Greater than or equal to $125
Lodging: Greater than $200
53
Food and Beverages from a store: Greater than or equal to $100
Souvenirs (t-shirts, posters, gifts, etc.): Greater than or equal to $1,500
Parking: Greater than or equal to $400
Museum, aquarium, or other entrance fee: Greater than or equal to $3,000
Bike rental: Greater than or equal to $50
Surfboard or body board rental: Greater than or equal to $100
northern portion of MBNMS
For the northern portion of MBNMS, there were only two expenditure categories with
outliers. We eliminated the following outliers:
Lodging: Greater than $200
Lessons, clinics, camps: Greater than or equal to $500
NCC Region All Visitors
In Chen et al. (2013), total expenditures were estimated by taking the mean expenditure per
person per trip for all visitors ($54.48) to the NCC Region and multiplying by the number of
estimated person-trips to the NCC Region (22,197,663) yielding an estimate of $1,209,258,380.
They then provided a lower bound estimate for all recreation by multiplying by the percent of all
visitor whose primary purpose for the last trip was for recreation (86.9%) yielding an estimate of
$1,050,845,532.
We take a different approach by separately estimating expenditures per person-trip for residents
and non-residents by expenditure category and use the estimates we made of the number of
person-trips by residents and non-residents (Chapter 3) for the economic impact study area (see
Figure 1.3). The reason was we estimate the economic impact of total expenditures by resident
status using the IMPLAN input-output model (Chapter 5).
Residents spent an average of $46.03 per person per trip (Table 4.2) versus $82.69 for non-
residents (Table 4.3). Total expenditures were then estimated by multiplying the estimated per
person trip expenditures by the estimated number of resident and non-resident person-trips. For
residents, we estimate total expenditures of $793,497,591, and for non-residents of $410,056,237
for a total expenditure of $1,203,553,828 (Table 4.4). This is compared to the Chen et al. (2013)
estimate of $1,209,258,380 a difference of $5,704,552 or (0.47%), an insignificant difference.
We also estimated the expenditures on a per person-day basis. We do this by taking the total
expenditures by residential status and dividing by the total estimated person-days by residential
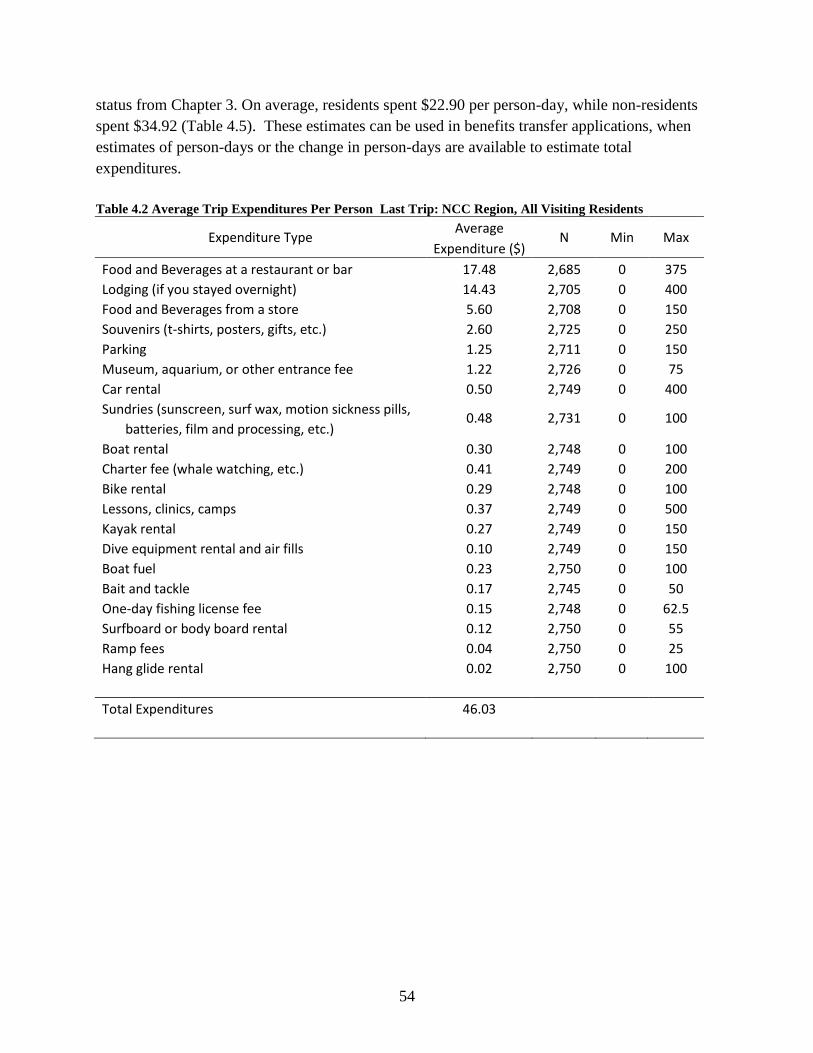
54
status from Chapter 3. On average, residents spent $22.90 per person-day, while non-residents
spent $34.92 (Table 4.5). These estimates can be used in benefits transfer applications, when
estimates of person-days or the change in person-days are available to estimate total
expenditures.
Table 4.2 Average Trip Expenditures Per Person Last Trip: NCC Region, All Visiting Residents
Expenditure Type Average
N Min Max Expenditure ($)
Food and Beverages at a restaurant or bar 17.48 2,685 0 375
Lodging (if you stayed overnight) 14.43 2,705 0 400
Food and Beverages from a store 5.60 2,708 0 150
Souvenirs (t-shirts, posters, gifts, etc.) 2.60 2,725 0 250
Parking 1.25 2,711 0 150
Museum, aquarium, or other entrance fee 1.22 2,726 0 75
Car rental 0.50 2,749 0 400
Sundries (sunscreen, surf wax, motion sickness pills, 0.48 2,731 0 100
batteries, film and processing, etc.)
Boat rental 0.30 2,748 0 100
Charter fee (whale watching, etc.) 0.41 2,749 0 200
Bike rental 0.29 2,748 0 100
Lessons, clinics, camps 0.37 2,749 0 500
Kayak rental 0.27 2,749 0 150
Dive equipment rental and air fills 0.10 2,749 0 150
Boat fuel 0.23 2,750 0 100
Bait and tackle 0.17 2,745 0 50
One-day fishing license fee 0.15 2,748 0 62.5
Surfboard or body board rental 0.12 2,750 0 55
Ramp fees 0.04 2,750 0 25
Hang glide rental 0.02 2,750 0 100
Total Expenditures 46.03

55
Table 4.3 Average Trip Expenditures Per Person Last Trip: NCC Region, All Visiting Non-Residents
Expenditure Type Average
N Min Max Expenditure ($)
Food and Beverages at a restaurant or bar 22.88 612 0 150
Lodging (if you stayed overnight) 31.68 616 0 375
Food and Beverages from a store 8.45 620 0 180
Souvenirs (t-shirts, posters, gifts, etc.) 5.88 622 0 100
Parking 2.59 626 0 82.50
Museum, aquarium, or other entrance fee 3.33 627 0 66.67
Car rental 2.22 630 0 250
Sundries (sunscreen, surf wax, motion sickness pills, 0.76 630 0 60
batteries, film and processing, etc.)
Boat rental 1.22 633 0 116.67
Charter fee (whale watching, etc.) 0.58 633 0 120
Bike rental 0.55 633 0 100
Lessons, clinics, camps 0.21 631 0 200
Kayak rental 0.31 633 0 110
Dive equipment rental and air fills 0.92 632 0 125
Boat fuel 0.24 632 0 50
Bait and tackle 0.34 631 0 27.50
One-day fishing license fee 0.14 631 0 30
Surfboard or body board rental 0.23 631 0 100
Ramp fees 0.16 633 0 35
Hang glide rental 0.00 633 0 0
Total Expenditures 82.69

56
Table 4.4 Total Expenditures for All Visitors to the NCC Region, by Residential Status
Expenditure Type
Residents Non-Residents Total
Expenditures Total Total
Expenditures Expenditures
Food and Beverages at a restaurant or bar 301,332,563 113,460,959 414,793,522
Lodging (if you stayed overnight) 248,754,513 157,099,789 405,854,303
Food and Beverages from a store 96,536,748 41,903,195 138,439,943
Souvenirs (t-shirts, posters, gifts, etc.) 44,820,633 29,158,673 73,979,306
Parking 21,548,381 12,843,701 34,392,082
Museum, aquarium, or other entrance fee 21,031,220 16,513,330 37,544,550
Car rental 8,619,353 11,008,887 19,628,239
Sundries (sunscreen, surf wax, motion sickness pills, 8,274,578 3,768,808 12,043,386
batteries, film and processing, etc.)
Boat rental 5,171,612 6,049,929 11,221,540
Charter fee (whale watching, etc.) 7,067,869 2,876,196 9,944,065
Bike rental 4,999,224 2,727,427 7,726,651
Lessons, clinics, camps 6,378,321 1,041,381 7,419,702
Kayak rental 4,654,450 1,537,277 6,191,727
Dive equipment rental and air fills 1,723,871 4,562,241 6,286,112
Boat fuel 3,964,902 1,190,150 5,155,052
Bait and tackle 2,930,580 1,686,046 4,616,626
One-day fishing license fee 2,585,806 694,254 3,280,060
Surfboard or body board rental 2,068,645 1,140,560 3,209,205
Ramp fees 689,548 793,433 1,482,981
Hang glide rental 344,774 0 344,774
Total 793,497,591 410,056,237 1,203,553,828
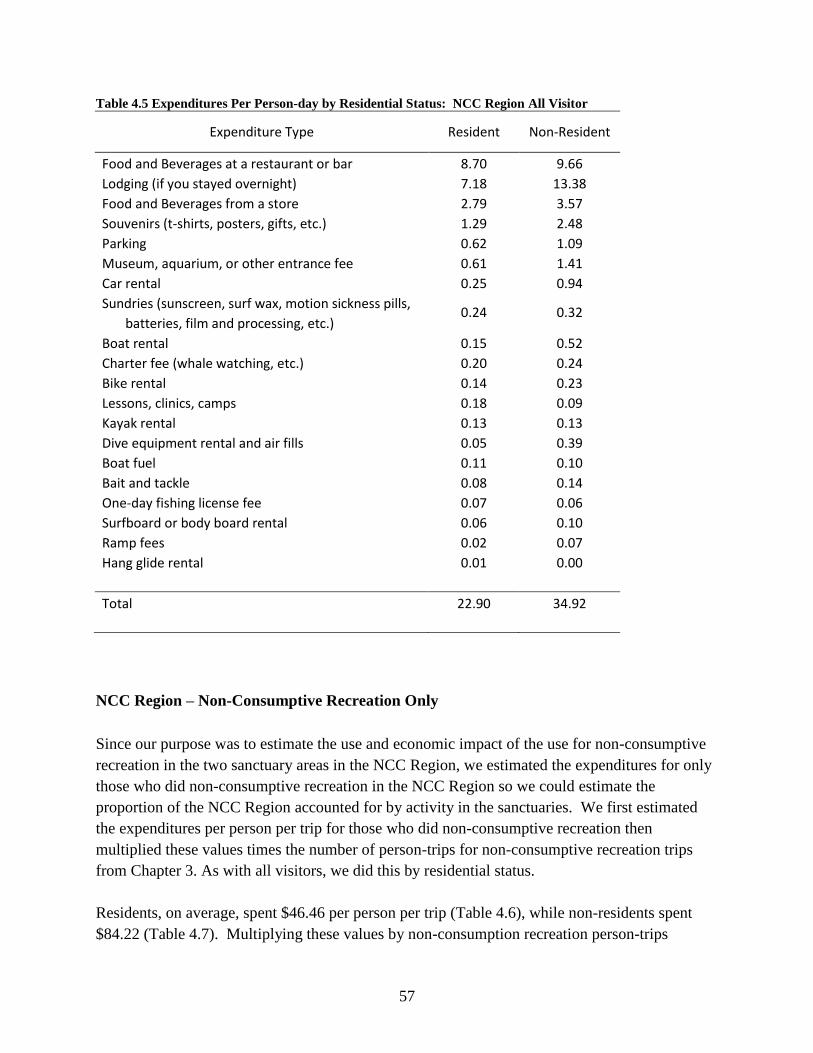
57
Table 4.5 Expenditures Per Person-day by Residential Status: NCC Region All Visitor
Expenditure Type Resident Non-Resident
Food and Beverages at a restaurant or bar 8.70 9.66
Lodging (if you stayed overnight) 7.18 13.38
Food and Beverages from a store 2.79 3.57
Souvenirs (t-shirts, posters, gifts, etc.) 1.29 2.48
Parking 0.62 1.09
Museum, aquarium, or other entrance fee 0.61 1.41
Car rental 0.25 0.94
Sundries (sunscreen, surf wax, motion sickness pills, 0.24 0.32
batteries, film and processing, etc.)
Boat rental 0.15 0.52
Charter fee (whale watching, etc.) 0.20 0.24
Bike rental 0.14 0.23
Lessons, clinics, camps 0.18 0.09
Kayak rental 0.13 0.13
Dive equipment rental and air fills 0.05 0.39
Boat fuel 0.11 0.10
Bait and tackle 0.08 0.14
One-day fishing license fee 0.07 0.06
Surfboard or body board rental 0.06 0.10
Ramp fees 0.02 0.07
Hang glide rental 0.01 0.00
Total 22.90 34.92
NCC Region – Non-Consumptive Recreation Only
Since our purpose was to estimate the use and economic impact of the use for non-consumptive
recreation in the two sanctuary areas in the NCC Region, we estimated the expenditures for only
those who did non-consumptive recreation in the NCC Region so we could estimate the
proportion of the NCC Region accounted for by activity in the sanctuaries. We first estimated
the expenditures per person per trip for those who did non-consumptive recreation then
multiplied these values times the number of person-trips for non-consumptive recreation trips
from Chapter 3. As with all visitors, we did this by residential status.
Residents, on average, spent $46.46 per person per trip (Table 4.6), while non-residents spent
$84.22 (Table 4.7). Multiplying these values by non-consumption recreation person-trips
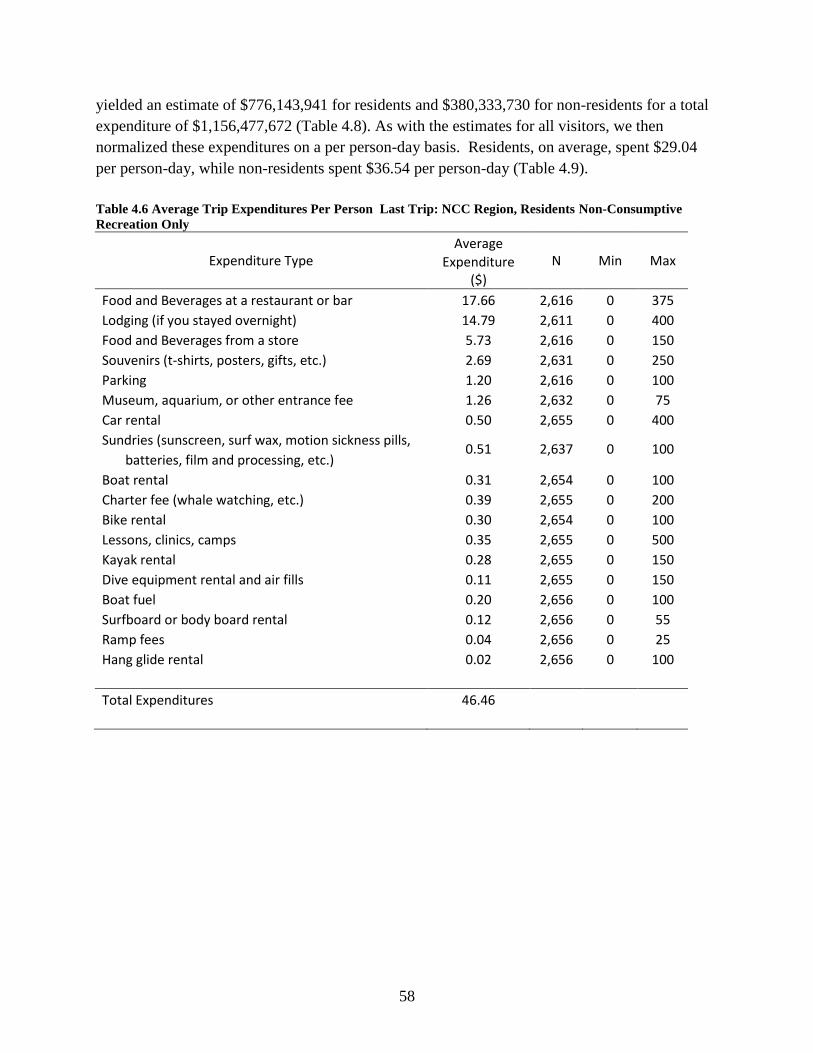
58
yielded an estimate of $776,143,941 for residents and $380,333,730 for non-residents for a total
expenditure of $1,156,477,672 (Table 4.8). As with the estimates for all visitors, we then
normalized these expenditures on a per person-day basis. Residents, on average, spent $29.04
per person-day, while non-residents spent $36.54 per person-day (Table 4.9).
Table 4.6 Average Trip Expenditures Per Person Last Trip: NCC Region, Residents Non-Consumptive
Recreation Only
Expenditure Type Average
N Min Max Expenditure ($)
Food and Beverages at a restaurant or bar 17.66 2,616 0 375
Lodging (if you stayed overnight) 14.79 2,611 0 400
Food and Beverages from a store 5.73 2,616 0 150
Souvenirs (t-shirts, posters, gifts, etc.) 2.69 2,631 0 250
Parking 1.20 2,616 0 100
Museum, aquarium, or other entrance fee 1.26 2,632 0 75
Car rental 0.50 2,655 0 400
Sundries (sunscreen, surf wax, motion sickness pills, 0.51 2,637 0 100
batteries, film and processing, etc.)
Boat rental 0.31 2,654 0 100
Charter fee (whale watching, etc.) 0.39 2,655 0 200
Bike rental 0.30 2,654 0 100
Lessons, clinics, camps 0.35 2,655 0 500
Kayak rental 0.28 2,655 0 150
Dive equipment rental and air fills 0.11 2,655 0 150
Boat fuel 0.20 2,656 0 100
Surfboard or body board rental 0.12 2,656 0 55
Ramp fees 0.04 2,656 0 25
Hang glide rental 0.02 2,656 0 100
Total Expenditures 46.46
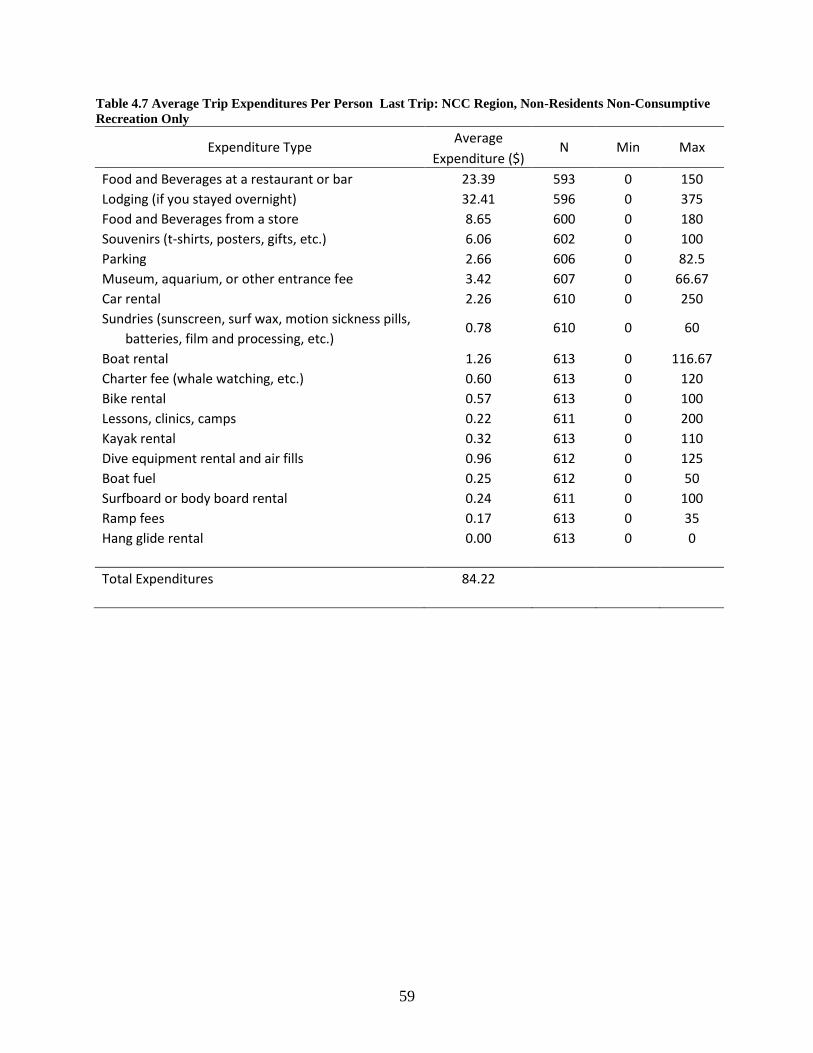
59
Table 4.7 Average Trip Expenditures Per Person Last Trip: NCC Region, Non-Residents Non-Consumptive
Recreation Only
Expenditure Type Average
N Min Max Expenditure ($)
Food and Beverages at a restaurant or bar 23.39 593 0 150
Lodging (if you stayed overnight) 32.41 596 0 375
Food and Beverages from a store 8.65 600 0 180
Souvenirs (t-shirts, posters, gifts, etc.) 6.06 602 0 100
Parking 2.66 606 0 82.5
Museum, aquarium, or other entrance fee 3.42 607 0 66.67
Car rental 2.26 610 0 250
Sundries (sunscreen, surf wax, motion sickness pills, 0.78 610 0 60
batteries, film and processing, etc.)
Boat rental 1.26 613 0 116.67
Charter fee (whale watching, etc.) 0.60 613 0 120
Bike rental 0.57 613 0 100
Lessons, clinics, camps 0.22 611 0 200
Kayak rental 0.32 613 0 110
Dive equipment rental and air fills 0.96 612 0 125
Boat fuel 0.25 612 0 50
Surfboard or body board rental 0.24 611 0 100
Ramp fees 0.17 613 0 35
Hang glide rental 0.00 613 0 0
Total Expenditures 84.22
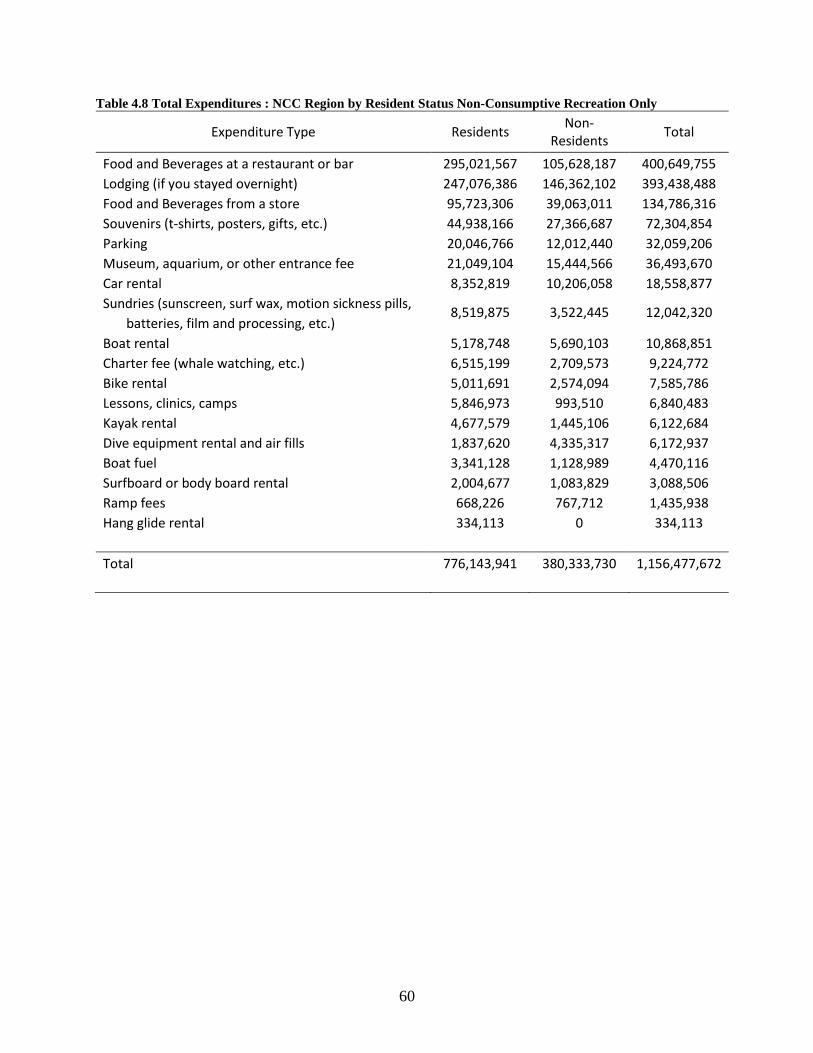
60
Table 4.8 Total Expenditures : NCC Region by Resident Status Non-Consumptive Recreation Only
Expenditure Type Residents Non-
Residents Total
Food and Beverages at a restaurant or bar 295,021,567 105,628,187 400,649,755
Lodging (if you stayed overnight) 247,076,386 146,362,102 393,438,488
Food and Beverages from a store 95,723,306 39,063,011 134,786,316
Souvenirs (t-shirts, posters, gifts, etc.) 44,938,166 27,366,687 72,304,854
Parking 20,046,766 12,012,440 32,059,206
Museum, aquarium, or other entrance fee 21,049,104 15,444,566 36,493,670
Car rental 8,352,819 10,206,058 18,558,877
Sundries (sunscreen, surf wax, motion sickness pills, 8,519,875 3,522,445 12,042,320
batteries, film and processing, etc.)
Boat rental 5,178,748 5,690,103 10,868,851
Charter fee (whale watching, etc.) 6,515,199 2,709,573 9,224,772
Bike rental 5,011,691 2,574,094 7,585,786
Lessons, clinics, camps 5,846,973 993,510 6,840,483
Kayak rental 4,677,579 1,445,106 6,122,684
Dive equipment rental and air fills 1,837,620 4,335,317 6,172,937
Boat fuel 3,341,128 1,128,989 4,470,116
Surfboard or body board rental 2,004,677 1,083,829 3,088,506
Ramp fees 668,226 767,712 1,435,938
Hang glide rental 334,113 0 334,113
Total 776,143,941 380,333,730 1,156,477,672

61
Table 4.9 Expenditures Per Person-day by Residential Status: NCC Region Non-Consumptive Recreation
Only
Expenditure Type Residents Non-
Residents Total
Food and Beverages at a restaurant or bar 11.04 10.15 10.79
Lodging (if you stayed overnight) 9.24 14.06 10.59
Food and Beverages from a store 3.58 3.75 3.63
Souvenirs (t-shirts, posters, gifts, etc.) 1.68 2.63 1.95
Parking 0.75 1.15 0.86
Museum, aquarium, or other entrance fee 0.79 1.48 0.98
Car rental 0.31 0.98 0.50
Sundries (sunscreen, surf wax, motion sickness pills,
batteries, film and processing, etc.) 0.32 0.34 0.32
Boat rental 0.19 0.55 0.29
Charter fee (whale watching, etc.) 0.24 0.26 0.25
Bike rental 0.19 0.25 0.20
Lessons, clinics, camps 0.22 0.10 0.18
Kayak rental 0.17 0.14 0.16
Dive equipment rental and air fills 0.07 0.42 0.17
Boat fuel 0.12 0.11 0.12
Surfboard or body board rental 0.07 0.10 0.08
Ramp fees 0.02 0.07 0.04
Hang glide rental 0.01 0.00 0.01
Total 29.04 36.54 31.14
GFNMS – Non-Consumptive Recreation Only
For the GFNMS, we were not able to estimate expenditures by residential status due to sample
sizes. Instead, we pooled expenditures per person per trip, however they are properly weighted.
We derived estimates of total expenditures by multiplying the expenditures per person per trip by
the estimates of total person-trips for non-consumptive recreation in Chapter 3. We then
estimated expenditures per person-day by dividing total estimated expenditures by the estimate
of total person-days for non-consumptive recreation in Chapter 3.
Non-consumptive recreators in GFNMS, on average spent $78.06 per person-trip (Table 4.10).
Multiplying these values by the estimated number of person-trips for non-consumptive recreation
yielded an estimate of total expenditures of $86,252,475 (Table 4.11). Normalizing the

62
expenditures on a per person-day basis yielded an estimate of $31.48 per person-day (Table
4.11).
Table 4.10 Average Trip Expenditures Per Person, Last Trip: GFNMS Non-Consumptive Recreation Only
Expenditure Type Average
N Min Max Expenditure ($)
Food and Beverages at a restaurant or bar 22.68 319 0 250
Lodging (if you stayed overnight) 22.70 309 0 200
Food and Beverages from a store 10.53 320 0 75
Souvenirs (t-shirts, posters, gifts, etc.) 5.08 325 0 100
Parking 2.69 329 0 100
Museum, aquarium, or other entrance fee 2.87 326 0 66.67
Car rental 1.27 331 0 100
Sundries (sunscreen, surf wax, motion sickness pills, 1.36 328 0 50
batteries, film and processing, etc.)
Boat rental 1.79 332 0 100
Charter fee (whale watching, etc.) 1.12 333 0 105
Bike rental 0.77 331 0 37.5
Lessons, clinics, camps 0.26 331 0 200
Kayak rental 1.62 333 0 100
Dive equipment rental and air fills 1.29 332 0 150
Boat fuel 0.97 332 0 50
Surfboard or body board rental 0.65 331 0 50
Ramp fees 0.22 333 0 25
Hang glide rental 0.19 333 0 100
Total Expenditures 78.06
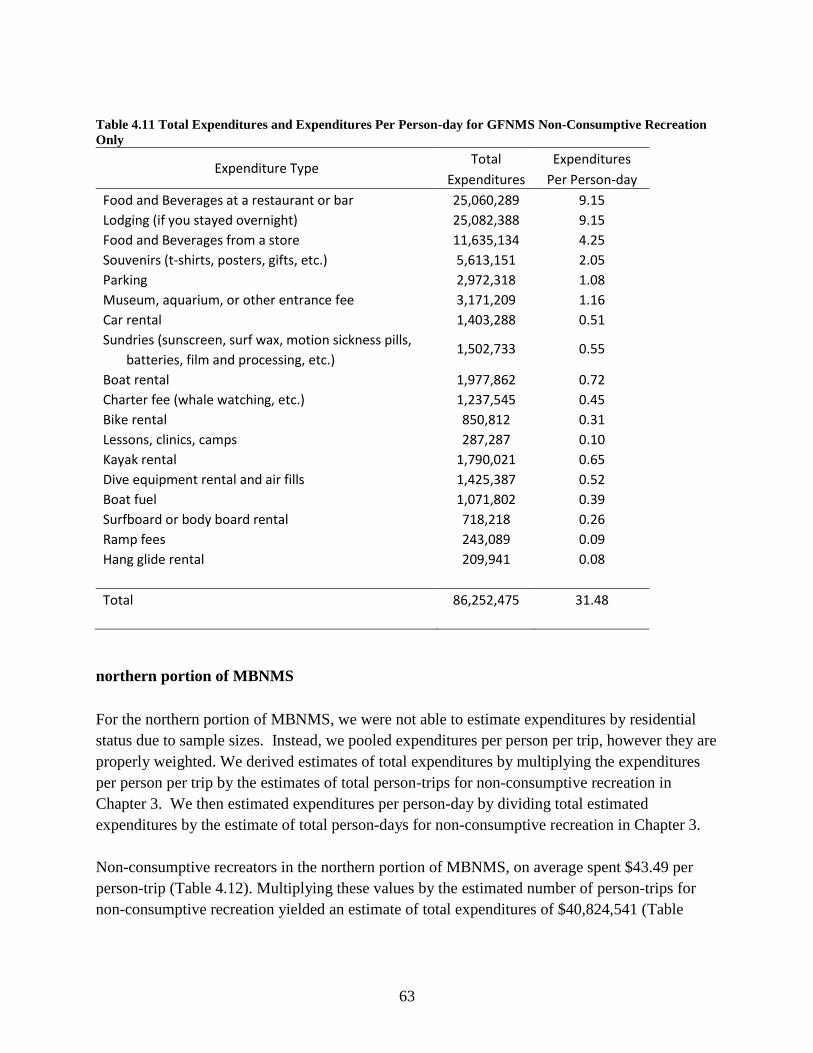
63
Table 4.11 Total Expenditures and Expenditures Per Person-day for GFNMS Non-Consumptive Recreation
Only
Expenditure Type Total Expenditures
Expenditures Per Person-day
Food and Beverages at a restaurant or bar 25,060,289 9.15
Lodging (if you stayed overnight) 25,082,388 9.15
Food and Beverages from a store 11,635,134 4.25
Souvenirs (t-shirts, posters, gifts, etc.) 5,613,151 2.05
Parking 2,972,318 1.08
Museum, aquarium, or other entrance fee 3,171,209 1.16
Car rental 1,403,288 0.51
Sundries (sunscreen, surf wax, motion sickness pills, 1,502,733 0.55
batteries, film and processing, etc.)
Boat rental 1,977,862 0.72
Charter fee (whale watching, etc.) 1,237,545 0.45
Bike rental 850,812 0.31
Lessons, clinics, camps 287,287 0.10
Kayak rental 1,790,021 0.65
Dive equipment rental and air fills 1,425,387 0.52
Boat fuel 1,071,802 0.39
Surfboard or body board rental 718,218 0.26
Ramp fees 243,089 0.09
Hang glide rental 209,941 0.08
Total 86,252,475 31.48
northern portion of MBNMS
For the northern portion of MBNMS, we were not able to estimate expenditures by residential
status due to sample sizes. Instead, we pooled expenditures per person per trip, however they are
properly weighted. We derived estimates of total expenditures by multiplying the expenditures
per person per trip by the estimates of total person-trips for non-consumptive recreation in
Chapter 3. We then estimated expenditures per person-day by dividing total estimated
expenditures by the estimate of total person-days for non-consumptive recreation in Chapter 3.
Non-consumptive recreators in the northern portion of MBNMS, on average spent $43.49 per
person-trip (Table 4.12). Multiplying these values by the estimated number of person-trips for
non-consumptive recreation yielded an estimate of total expenditures of $40,824,541 (Table

64
4.13). Normalizing the expenditures on a per person-day basis yielded an estimate of $26.68 per
person-day (Table 4.13).
Table 4.12 Average Trip Expenditures Per Person: np MBNMS Non-Consumptive Recreation Only
Expenditure Type Average
N Min Max Expenditure ($)
Food and Beverages at a restaurant or bar 13.96 229 0 140
Lodging (if you stayed overnight) 8.99 229 0 200
Food and Beverages from a store 5.64 228 0 150
Souvenirs (t-shirts, posters, gifts, etc.) 2.68 233 0 100
Parking 1.53 227 0 50
Museum, aquarium, or other entrance fee 2.37 232 0 66.67
Car rental 0.54 235 0 50
Sundries (sunscreen, surf wax, motion sickness pills, 1.20 233 0 100
batteries, film and processing, etc.)
Boat rental 0.61 235 0 37.5
Charter fee (whale watching, etc.) 1.21 235 0 120
Bike rental 0.59 235 0 40
Lessons, clinics, camps 1.14 234 0 200
Kayak rental 1.07 235 0 110
Dive equipment rental and air fills 0.00 234 0 0
Boat fuel 0.71 235 0 100
Surfboard or body board rental 1.05 235 0 55
Ramp fees 0.04 235 0 5
Hang glide rental 0.16 235 0 100
Total Expenditures 43.49
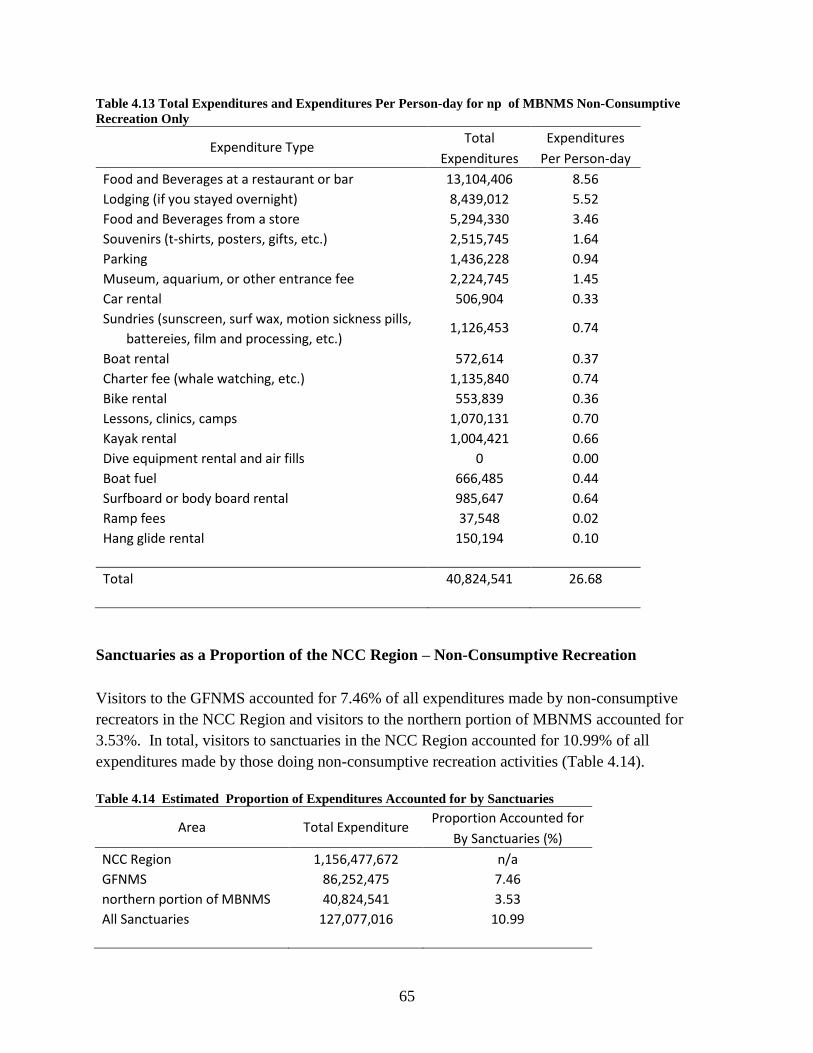
65
Table 4.13 Total Expenditures and Expenditures Per Person-day for np of MBNMS Non-Consumptive
Recreation Only
Expenditure Type Total Expenditures
Expenditures Per Person-day
Food and Beverages at a restaurant or bar 13,104,406 8.56
Lodging (if you stayed overnight) 8,439,012 5.52
Food and Beverages from a store 5,294,330 3.46
Souvenirs (t-shirts, posters, gifts, etc.) 2,515,745 1.64
Parking 1,436,228 0.94
Museum, aquarium, or other entrance fee 2,224,745 1.45
Car rental 506,904 0.33
Sundries (sunscreen, surf wax, motion sickness pills, 1,126,453 0.74
battereies, film and processing, etc.)
Boat rental 572,614 0.37
Charter fee (whale watching, etc.) 1,135,840 0.74
Bike rental 553,839 0.36
Lessons, clinics, camps 1,070,131 0.70
Kayak rental 1,004,421 0.66
Dive equipment rental and air fills 0 0.00
Boat fuel 666,485 0.44
Surfboard or body board rental 985,647 0.64
Ramp fees 37,548 0.02
Hang glide rental 150,194 0.10
Total 40,824,541 26.68
Sanctuaries as a Proportion of the NCC Region – Non-Consumptive Recreation
Visitors to the GFNMS accounted for 7.46% of all expenditures made by non-consumptive
recreators in the NCC Region and visitors to the northern portion of MBNMS accounted for
3.53%. In total, visitors to sanctuaries in the NCC Region accounted for 10.99% of all
expenditures made by those doing non-consumptive recreation activities (Table 4.14).
Table 4.14 Estimated Proportion of Expenditures Accounted for by Sanctuaries
Area Total Expenditure Proportion Accounted for
By Sanctuaries (%)
NCC Region 1,156,477,672 n/a
GFNMS 86,252,475 7.46
northern portion of MBNMS 40,824,541 3.53
All Sanctuaries 127,077,016 10.99

66
5. Economic Contributions
Study Area Identification
To estimate the economic impacts of recreational activities for the NCC Region and within
GFNMS and the northern portion of MBNMS the study area must be identified and defined.
Though the multiplier process, theoretically one could include all areas in the chain of producing
goods and services used. This could even include other countries, i.e. a rod or reel or outboard
motor could have been produced outside the country. In Chapter 1, we defined the study areas
for economic impact for each sanctuary limiting our impact areas to more local area counties that
capture the majority of the local economic impact.
The first step to determining the study areas were to identify the coastal counties that are
adjacent to the sanctuaries. These are called the primary counties. The non-coastal counties
included in the study areas were identified by analyzing data from the American Community
Survey regarding inter-county commuter data. The non-coastal counties are referred to as
secondary counties in this report. If roughly 5,000 or more residents lived in a non-coastal
county, but commuted to a primary county for work, then that non-coastal county was included
in the study area.
These secondary counties are included in the study area to prevent leakage. Leakage occurs
when money leaves the study area resulting in that money not being multiplied throughout the
study area when calculating impacts. By including counties that have a large amount of residents
working in coastal counties, the study area is including these significant secondary economic
impacts and prevents leakage. The study areas for NCC, GFNMS and the northern portion of
MBNMS are presented below.
Table 5.1Primary and Secondary Counties in the Study Area for the Economic Impact Analysis NCC Region
Primary Counties (5)1 Secondary Counties (5)2
Mendocino Alameda
Sonoma Contra Costa
Marin Napa
San Francisco Santa Clara
San Mateo Solano
1 Ocean adjacent counties where primary economic impact take place.
2 Counties where significant secondary economic impacts take place.
Source: US Department of Commerce, Bureau of the Census, Inter-county Commuters.

67
Table 5.2 Primary and Secondary Counties in the Study Area for the Economic Impact Analysis GFNMS
Primary Counties (3)1 Secondary Counties (5)2
Mendocino Alameda
Sonoma Contra Costa
Marin Napa
San Francisco
Solano
1 Ocean adjacent counties where primary economic impact take place.
2 Counties where significant secondary economic impacts take place.
Source: US Department of Commerce, Bureau of the Census, Inter-county Commuters.
Table 5.3 Primary and Secondary Counties in the Study Area for the Economic Impact Analysis northern
portion of MBNMS
Primary Counties (2)1 Secondary Counties (6)2
Marin Alameda
San Mateo Contra Costa
San Francisco
Santa Clara
Solano
Sonoma 1 Ocean adjacent counties where primary economic impact take place.
2 Counties where significant secondary economic impacts take place.
Source: US Department of Commerce, Bureau of the Census, Inter-county Commuters.
IMPLAN
Using the person-trip estimates from Chapter 3 and the expenditure profiles developed in Chapter
4 of this report, the economic impacts of recreational activities in the sanctuaries and along the
North Central California Coast can be estimated. Table 5.4 provides a more detailed explanation
of the terminology used in this report, as defined by IMPLAN.
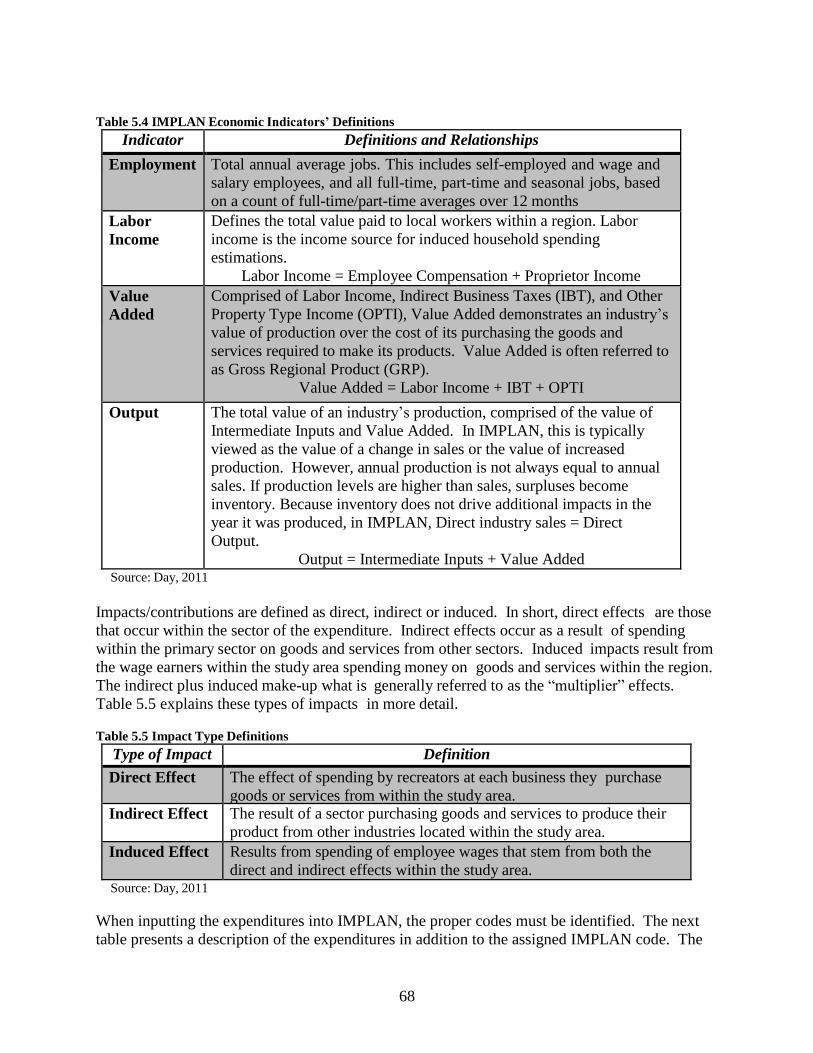
68
Table 5.4 IMPLAN Economic Indicators’ Definitions
Indicator Definitions and Relationships
Employment Total annual average jobs. This includes self-employed and wage and
salary employees, and all full-time, part-time and seasonal jobs, based
on a count of full-time/part-time averages over 12 months
Labor
Income
Defines the total value paid to local workers within a region. Labor
income is the income source for induced household spending
estimations.
Labor Income = Employee Compensation + Proprietor Income
Value
Added
Comprised of Labor Income, Indirect Business Taxes (IBT), and Other
Property Type Income (OPTI), Value Added demonstrates an industry’s
value of production over the cost of its purchasing the goods and
services required to make its products. Value Added is often referred to
as Gross Regional Product (GRP).
Value Added = Labor Income + IBT + OPTI
Output The total value of an industry’s production, comprised of the value of
Intermediate Inputs and Value Added. In IMPLAN, this is typically
viewed as the value of a change in sales or the value of increased
production. However, annual production is not always equal to annual
sales. If production levels are higher than sales, surpluses become
inventory. Because inventory does not drive additional impacts in the
year it was produced, in IMPLAN, Direct industry sales = Direct
Output.
Output = Intermediate Inputs + Value Added Source: Day, 2011
Impacts/contributions are defined as direct, indirect or induced. In short, direct effects are those
that occur within the sector of the expenditure. Indirect effects occur as a result of spending
within the primary sector on goods and services from other sectors. Induced impacts result from
the wage earners within the study area spending money on goods and services within the region.
The indirect plus induced make-up what is generally referred to as the “multiplier” effects.
Table 5.5 explains these types of impacts in more detail.
Table 5.5 Impact Type Definitions
Type of Impact Definition
Direct Effect The effect of spending by recreators at each business they purchase
goods or services from within the study area. Indirect Effect The result of a sector purchasing goods and services to produce their
product from other industries located within the study area.
Induced Effect Results from spending of employee wages that stem from both the
direct and indirect effects within the study area. Source: Day, 2011
When inputting the expenditures into IMPLAN, the proper codes must be identified. The next
table presents a description of the expenditures in addition to the assigned IMPLAN code. The
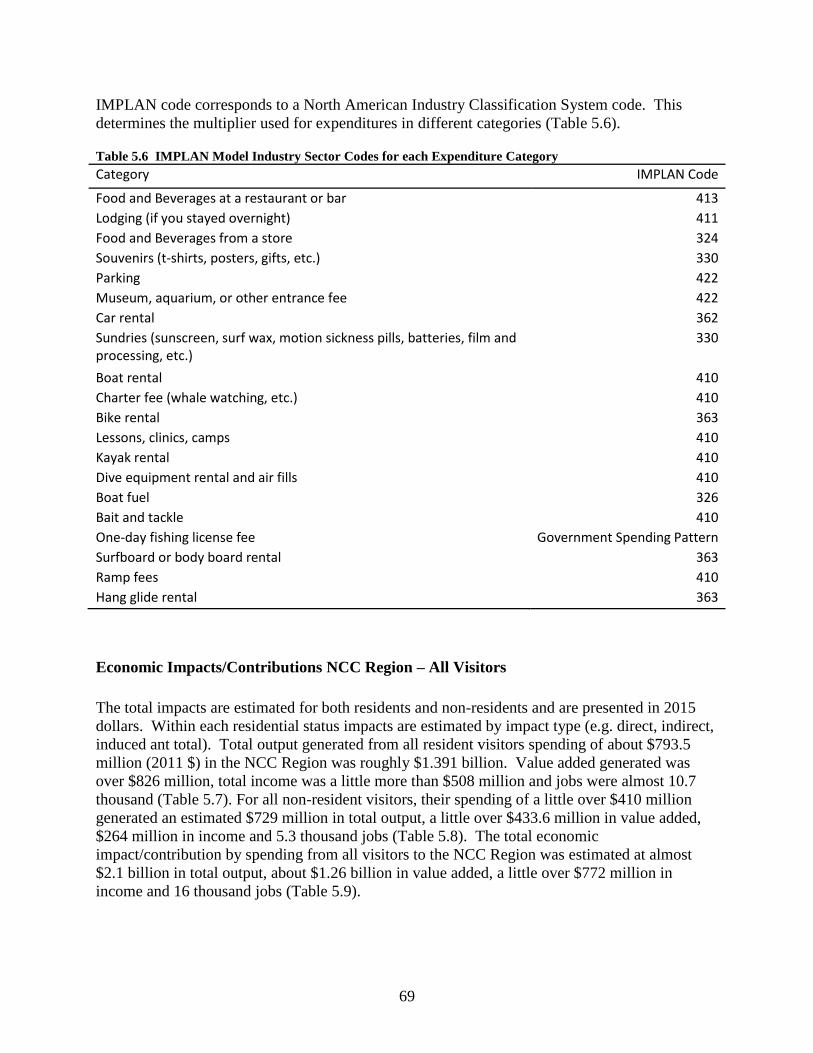
69
IMPLAN code corresponds to a North American Industry Classification System code. This
determines the multiplier used for expenditures in different categories (Table 5.6). Table 5.6 IMPLAN Model Industry Sector Codes for each Expenditure Category
Category IMPLAN Code
Food and Beverages at a restaurant or bar 413
Lodging (if you stayed overnight) 411
Food and Beverages from a store 324
Souvenirs (t-shirts, posters, gifts, etc.) 330
Parking 422
Museum, aquarium, or other entrance fee 422
Car rental 362
Sundries (sunscreen, surf wax, motion sickness pills, batteries, film and processing, etc.)
330
Boat rental 410
Charter fee (whale watching, etc.) 410
Bike rental 363
Lessons, clinics, camps 410
Kayak rental 410
Dive equipment rental and air fills 410
Boat fuel 326
Bait and tackle 410
One-day fishing license fee Government Spending Pattern
Surfboard or body board rental 363
Ramp fees 410
Hang glide rental 363
Economic Impacts/Contributions NCC Region – All Visitors
The total impacts are estimated for both residents and non-residents and are presented in 2015
dollars. Within each residential status impacts are estimated by impact type (e.g. direct, indirect,
induced ant total). Total output generated from all resident visitors spending of about $793.5
million (2011 $) in the NCC Region was roughly $1.391 billion. Value added generated was
over $826 million, total income was a little more than $508 million and jobs were almost 10.7
thousand (Table 5.7). For all non-resident visitors, their spending of a little over $410 million
generated an estimated $729 million in total output, a little over $433.6 million in value added,
$264 million in income and 5.3 thousand jobs (Table 5.8). The total economic
impact/contribution by spending from all visitors to the NCC Region was estimated at almost
$2.1 billion in total output, about $1.26 billion in value added, a little over $772 million in
income and 16 thousand jobs (Table 5.9).

70
Table 5.7 Total Economic Impacts for All Visiting Residents to the NCC Region (2015 $)
Impact Type Employment Labor Income Value Added Output
____________________________________________________________________________________
Direct Effect 7,474 292,385,515 448,329,727 764,202,484
Indirect Effect 1,514 109,127,989 184,879,963 318,001,838
Induced Effect 1,703 106,785,858 193,373,221 308,595,658
Total effect 10,692 508,299,363 826,582,910 1,390,799,981
____________________________________________________________________________________
Table 5.8 Total Economic Impacts for All Visiting Non-Residents to the NCC Region (2015 $)
Impact Type Employment Labor Income Value Added Output
____________________________________________________________________________________
Direct Effect 3,607 149,541,975 234,223,783 399,276,709
Indirect Effect 818 59,031,178 98,550,611 169,302,078
Induced Effect 885 55,489,096 100,483,881 160,351,078
Total effect 5,310 264,062,249 433,258,275 728,929,865
____________________________________________________________________________________
Table 5.9 Total Economic Impacts for All Visitors to the NCC Region (2015 $)
Impact Type Employment Labor Income Value Added Output
____________________________________________________________________________________
Direct Effect 11,081 441,927,490 682,553,510 1,163,479,193
Indirect Effect 2,332 168,159,167 283,430,574 487,303,916
Induced Effect 2,589 162,274,954 293,857,102 468,946,736
Total effect 16,002 772,361,612 1,259,841,185 2,119,729,846
____________________________________________________________________________________
Economic Impacts/Contributions NCC Region – Non-Consumptive Recreation Only
Here we eliminated all fishing related expenditures and developed estimates for non-
consumptive recreation only to develop estimates that could be compared with the estimates
developed for the two sanctuary areas. We can then estimate the proportion of the NCC Region
the non-consumptive activities in the sanctuary areas accounted for. The total impacts are
estimated for both residents and non-residents and are presented in 2015 dollars. Within each
residential status impacts are estimated by impact type (e.g. direct, indirect, induced ant total).
Total output generated, from all resident visitors doing non-consumptive recreation activities
who spent about $776.1 million (2011 $) in the NCC Region, was about $1.36 billion (2015 $).
Value added generated was over $806 million, total income was a little more than $495 million
and jobs were a little over 10.4 thousand (Table 5.10). For all non-resident visitors that did non-
consumptive recreation activities, their spending of a little over $380 million generated an
estimated $675.5 million in total output, a little over $401 million in value added, $244.4 million
in income and 4.9 thousand jobs (Table 5.11). The total economic impact/contribution by
spending from all visitors that did non-consumptive recreation activities in the NCC Region was

71
estimated at little over $2.0 billion in total output, about $1.21 billion in value added, about
$739.5 million in income and 15.3 thousand jobs (Table 5.12).
Table 5.10Total Economic Impacts for All Residents to the NCC Region, Non-Consumptive Recreation Only
(2015 $)
Impact Type Employment Labor
Income Value Added Output
___________________________________________________________________________
Direct Effect 7,293 284,064,030 436,744,248 745,796,698
Indirect Effect 1,483 106,983,514 181,122,971 311,584,679
Induced Effect 16,459 104,005,089 188,337,889 300,558,948
Total effect 10,435 495,052,633 806,205,109 1,357,940,324
___________________________________________________________________________
Table 5.11 Total Economic Impacts for All Non-Residents to the NCC Region, Non-Consumptive Recreation
Only (2015 $)
Impact Type Employment Labor
Income Value Added Output
___________________________________________________________________________
Direct Effect 3,339 138,243,175 216,720,344 369,860,227
Indirect Effect 760 54,833,434 91,519,866 157,224,852
Induced Effect 820 51,368,167 93,021,537 148,442,063
Total effect 4,918 244,444,776 401,261,747 675,527,142
___________________________________________________________________________
Table 5.12 Total Economic Impacts for All Visitors to the NCC Region, Non-Consumptive Recreation Only
(2015 $)
Impact Type Employment Labor
Income Value Added Output
___________________________________________________________________________
Direct Effect 10,632 422,307,205 653,464,592 1,115,656,925
Indirect Effect 2,243 161,816,948 272,642,837 468,809,531
Induced Effect 2,479 155,373,256 281,359,426 449,001,011
Total effect 15,354 739,497,409 1,207,466,856 2,033,467,466
___________________________________________________________________________
Economic Impacts/Contributions from Greater Farallones National Marine Sanctuary
The total economic impacts were estimated for GFNMS for non-consumptive recreation
expenditures only. Additionally, expenditures are not differentiated between residents and non-
residents due to the smaller sample size of those who recreate within GFNMS. Non-
consumptive recreational activities that occurred within GFNMS resulted in spending of $86.25

72
million (2011$) which generated an estimated total output of $145.8 million (2015$), value
added of $87.2 million, income of $53.8 million and 1.1 thousand jobs (Table 5.13).
Table 5.13 GFNMS Non-Consumptive Recreation Only Impacts (2015 $)
Impact Type Employment Labor Income Value Added Output
___________________________________________________________________________
Direct Effect 777 31,455,346 48,068,461 80,796,050
Indirect Effect 163 11,017,910 18,628,425 32,211,667
Induced Effect 190 11,356,179 20,536,704 32,802,479
Total effect 1,131 53,829,435 87,233,590 145,810,197
___________________________________________________________________________
Economic Impacts/Contributions from the northern portion of Monterey Bay National
Marine Sanctuary
The total economic impacts were estimated for the northern portion of MBNMS for non-
consumptive recreation expenditures only. Additionally, expenditures are not differentiated
between residents and non-residents due to the smaller sample size of those who recreate within
the northern portion of MBNMS. As a result of recreational activities that occurred within the
northern portion of MBNMS resulted in spending of $40.82 Million (2011$) which generated an
estimated total output of about $69.4 million (2015$), $41.75 million in value added, $26.2
million in income and 542 jobs (Table 5.14).
Table 5.14 northern portion of MBNMS Non-Consumptive Recreation Only Impacts (2015 $)
Impact Type Employment Labor Income Value Added Output
____________________________________________________________________________
Direct Effect 381 15,393,331 22,703,916 38,037,303
Indirect Effect 74 5,326,774 9,124,524 15,521,321
Induced Effect 87 5,472,957 9,920,114 15,807,385
Total effect 542 26,193,062 41,748,553 69,366,010
____________________________________________________________________________
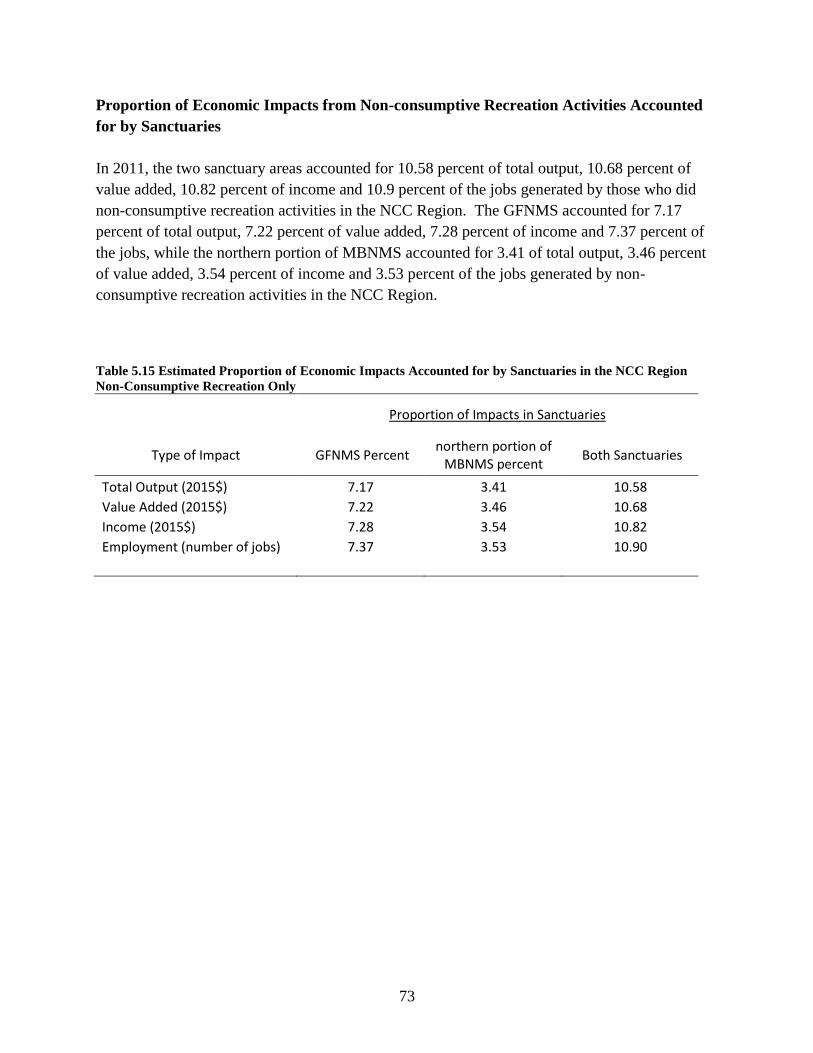
73
Proportion of Economic Impacts from Non-consumptive Recreation Activities Accounted
for by Sanctuaries
In 2011, the two sanctuary areas accounted for 10.58 percent of total output, 10.68 percent of
value added, 10.82 percent of income and 10.9 percent of the jobs generated by those who did
non-consumptive recreation activities in the NCC Region. The GFNMS accounted for 7.17
percent of total output, 7.22 percent of value added, 7.28 percent of income and 7.37 percent of
the jobs, while the northern portion of MBNMS accounted for 3.41 of total output, 3.46 percent
of value added, 3.54 percent of income and 3.53 percent of the jobs generated by non-
consumptive recreation activities in the NCC Region.
Table 5.15 Estimated Proportion of Economic Impacts Accounted for by Sanctuaries in the NCC Region
Non-Consumptive Recreation Only
Proportion of Impacts in Sanctuaries
Type of Impact GFNMS Percent
northern portion of MBNMS percent
Both Sanctuaries
Total Output (2015$) 7.17 3.41 10.58
Value Added (2015$) 7.22 3.46 10.68
Income (2015$) 7.28 3.54 10.82
Employment (number of jobs) 7.37 3.53 10.90

74
References
Chen, Cheryl, LaFranchi. Chris, Sheeran, Kristen, Steinback, Charles, Hesselgrave, Taylor,
Perry, Matthew, and Bonkoski, Jon. 2013. An Economic and Spatial Baseline of Coastal
Recreation in the North Central Coast of California. Report to The California Sea Grant
College Program in partial fulfillment of Grant No. #09-015 through the California Sea
Grant College Program. April 23, 2013 pp30.
Day, Francis. 2011. Principles of Impact Analysis & IMPLAN Applications. First Edition. MIG.
Ecotrust. 2013. Data and Documentation for the Survey of Recreation Uses of the North Central
Coast of California. Cheryl Chen, Marine Planning Project Manager, Ecotrust, 721 NW
9th
Avenue, Suite 200, Portland, OR 97209.
Leeworthy, V., & Schwarzmann, D. 2015. Economic Impact of the Recreational Fisheries on Local
County Economies in the Greater Farallones National Marine Sanctuary 2010, 2011 and 2012.
Marine Sanctuaries Conservation Series ONMS-2015-04. U.S. Department of Commerce,
National Oceanic and Atmospheric Administration, Office of National Marine Sanctuaries,
Silver Spring, MD. 29 pp.
Leeworthy,V., Schwarzmann, D., and Reyes Saade, D. 2015. A Socioeconomic Profile of
Recreation Users of the California Northern Central Coast Region, Greater Farallones
National Marine Sanctuary and the northern portion of the Monterey Bay National Marine
Sanctuary, 2011. Marine Sanctuaries Conservation Series ONMS-2015-11. U.S. Department
of Commerce, National Oceanic and Atmospheric Administration, Office of National Marine
Sanctuaries, Silver Spring, MD. 73 pp.
SAS Institute, Inc. 2004. SAS/STAT 9.1 User’s Guide and Version 9.4 Software, Cary, NC,
USA.
U.S. Department of Commerce, Census Bureau 2006-2010. Table 1. Residence County to
Workplace County Flows for the United States and Puerto Rico Sorted by Residence
Geography 2006-2010 and Table 2. Residence County to Workplace Flows for the United
States and Puerto Rico by Workplace Geography 2006-2010.
http://www.census.gov/population/metro/data/other.html