Embed Size (px)
Citation preview

International Journal of Current Engineering and Technology E-ISSN 2277 – 4106, P-ISSN 2347 – 5161 ©2018 INPRESSCO®, All Rights Reserved Available at http://inpressco.com/category/ijcet
Research Article
555| International Journal of Current Engineering and Technology, Vol.8, No.3 (May/June 2018)
Technical and Economical Assessment of using Static Compensators for Improving Power Quality in Distribution Power Systems Reza Tajik* Bandar-e-Abbas University of Applied Science and Technology, Iran
Received 15 March 2018, Accepted 18 May 2018, Available online 20 May 2018, Vol.8, No.3 (May/June 2018)
Abstract Nowadays, various issues regarding the power quality have been widely considered. Regarding to the progress made in power electronics in recent years, the best way to improve the reliability of reducing voltage deviations, reducing losses, and generally providing high quality to consumers is to use custom power devices (CPDs). Series, parallel, or hybrid devices come from a subset of CPDs such as a dynamic voltage restorer, distribution static compensator, and unified power quality conditioner. In this work, the purpose of place these devices are to achieve various goals of improving power quality and reducing system costs. To achieve these goals, at first, the problem of single-objective optimization for each of the objective functions was solved separately. After determining the optimal value of each of the objective functions, the fuzzy membership functions for each of the objective functions were suitably optimized for each objective function. A mixed integer genetic algorithm was used to find the optimal answer to this multi-objective problem. The simulation results show that the proposed algorithm has worked well to find the optimal solution. The results of multi-objective planning proposed in this study show that with proper planning, it can be done at a low cost and even with a relatively high profit to cost and with the proper place of CPDs, to solve issues related to power quality issues in distribution networks. Keywords: technical and economical assessment, static compensators, power quality, distribution power systems 1. Introduction
1 Today, the problem related to power quality improvement, in electrical energy distribution systems are the main issues associated with the needs of consumers. Given the advances made in power electronics in recent years, the best way to improve the reliability of reducing voltage deviations, reducing losses, and generally providing high quality to consumers is to use the custom power devices (Digvijay et al, 2015). Separate, parallel, or hybrid devices come from a subset of consumer power device that are dynamic voltage restorer, distribution static compensator and unified power quality conditioner. In general, the optimal location of a custom- power device can be centralized or distributed (Vinod et al, 2013). Latest innovative ideas to make the life easier using the technology depends upon the application of power electronics in turn about power quality. With increasing quantities of non-linear loads being added to electrical systems, it has become necessary to establish criteria for limiting problems from system voltage degradation (S.Khalid et al, 2012). *Corresponding author’s ORCID ID: 0000-0001-0002-0003 DOI: https://doi.org/10.14741/ijcet/v.8.3.11
Power quality is a set of electrical boundaries that allows a piece of equipment to function in its intended manner without significant loss of performance or life expectancy. All electrical devices are prone to failure when exposed to one or more power quality problems. The electrical device might be an electric motor, a transformer, a generator, a computer, a printer, communication equipment, or a household appliance (R.K.Rojin et al, 2013). A recent survey of Power Quality experts indicates that 50% of all Power Quality problems are related to grounding, ground bonds, and neutral to ground voltages, ground loops, ground current or other ground associated issues. Electrically operated or connect ed equipment is affected by Power Quality.
So far, many configurations, topologies, and control algorithms have been proposed for power quality issues. For example, in (F. Shahnia, 2014), static distribution compensators (DSTATCOM) and dynamic voltage regulators (DVRs) are a variety of custom-made equipment for improving power quality in low voltage feeders. Reference (Y. Pal, 2008) provides a comprehensive overview of custom power device. In general, this study is made to the review of the dynamic voltage restorer, distribution static compensator and unified power quality conditioner. The purpose of this study

Reza Tajik Technical and Economical Assessment of using Static Compensators for Improving Power Quality in Distribution Power Systems
556| International Journal of Current Engineering and Technology, Vol.8, No.3 (May/June 2018)
was to provide an overview for engineers and researchers to improve the quality of power using this equipment. Reference (Z. Changjiang, 1999) introduces the implementation of a unified power quality conditioner to improve the quality of electrical power. This realization involves a serial converter and a parallel converter with bandwidth modulation. In this realization of an energy storage battery for various functions such as eliminating harmonics, reactive power control, voltage drop compensation, and uninterruptible power supply are used. The base algorithm provided in this reference for controlling this equipment is based on frequent compensation based on bandwidth modulation. Om & Shaik (2016) believed recently utilities are continuously seeking cost-effective and accurate power quality (PQ) improvement techniques in order to achieve customer satisfaction. They intends to provide a comprehensive review on the status of topological aspects of techniques used to improve the power quality in distribution network for the researchers, designers and engineers working in this area. More than 300 research publications on the state of the art of PQ improvement techniques have been rigorously analyzed, classified and listed for quick reference Mahela, 2016). The paper B.Muruganantham, 2017) addresses the impact of real and reactive power allocation for the seasonal variation of source and load demand on IEEE 37 node test feeder. Solar PV is integrated at remote locations of the feeder and load flow analysis is performed for different load profiles. Time series simulations are performed to analyze the dynamic behavior of the network. The nodal voltage solutions and power flow solutions are explored with and without Distribution static compensator (DSTATCOM) switching sequence of the DSTATCOM for different seasons is computed and the reactive power reallocation is done for the DN. The improvement in voltage profile and power factor at various nodes with DSTATCOM has been demonstrated.
In work (Andreas Poullikkas, 2014), a prediction of the effects of introducing energy storage systems on the network stability of the distribution network of Cyprus and a comparison in terms of cost with a traditional solution is carried out. In particular, for solving possible overvoltage problems, several scenarios of storage units' installation are used and compared with the alternative solution of extra cable connection between the node with the lowest voltage and the node with the highest voltage of the distribution network. The results indicated that the performance indicator of each solution depends on the type, the size and the position of installation of the storage unit. Also, as more storage units are installed the better the performance indicator and the more attractive is the investment in storage units to solve power quality problems in the distribution network. The purpose of this study is to distribute these devices to achieve various goals of improving power quality
and reducing system costs. Given the various goals, it is imperative to use an appropriate formulation and an efficient method for modeling the problem. Here, a multi-objective fuzzy optimization method will be used. In this way, first, single-objective problems are solved first, and with the help of the answer, proper membership functions are generated. Then, using these functions, the multi-objective problem is formulated. To solve the general optimization problem, a Mixed Integer Genetic Algorithm (MIGA) will be used. 2. Custom power device Like the flexible AC transmission equipment at the transmission level, the devices can be divided into three main categories, which are similar to Static Var Compensator (STATCOM), Static Synchronous Series Compensator (SSSC) and Unified Power Flow Controller (UPFC), but in terms of power and control modes and how they are used are completely different from the ones mentioned. These devices are referred to as distribution static compensator, dynamic voltage restorer, and unified power quality conditioner. 2.1 Distribution static compensator The distribution static compensator is a three-phase equipment’s that has the ability to dynamics control continuously by injecting the current into the distribution system at the connection bus. This device has the ability of capacitive and reactive compensator. Then, the amount of current and voltage necessary to eliminate the turbulence caused by the load is generated. Therefore, this device does not distribute load induced disturbances to the system. The cost of these devices depends on the maximum reactive compensation and the load voltage range.
Figure 1 Structure of distribution static compensator
2.2 Dynamic voltage restorer
The dynamic voltage restorer is in terms of the structure quite similar to the static distribution distributor, with the difference that the transformer is connected in series with the line. The main task of this is to voltage dynamic injection to the system to compensate for and improve the voltage profile and to simulate dynamic fluctuations. Its performance is very fast and in milliseconds. For example, in the event of a

Reza Tajik Technical and Economical Assessment of using Static Compensators for Improving Power Quality in Distribution Power Systems
557| International Journal of Current Engineering and Technology, Vol.8, No.3 (May/June 2018)
voltage shortage mainly due to short circuit faults in adjacent feeders or the launch of heavy loads, dynamic voltage restorer can be achieved with fast response; it compensates for the voltage drop and does not feel any shortage of end-users. Figure 2 shows the structure of this equipment. The cost of these devices depends on the maximum voltage compensation and line voltage range.
Figure 2 Structure of dynamic voltage restorer 2.3 Unified Power Flow Controller The unified power quality controller, coupled with a parallel series of voltage source converters connected to a dc capacitor, can be used as a powerful solution to eliminate almost all power quality disturbances. This device has the ability to compensate for flickr, lack of imbalance, reactive power, negative sequence flow and harmonics. The main function of the serial component is the harmonic isolation between the distribution system and the super-distribution system. The main task of the parallel component is the harmonic current absorption, reactive power compensation and negative sequence compensation, and the voltage regulation of the dc capacitor. Figure 3 shows the structure of this equipment. The cost of this equipment depends on maximum voltage compensation, maximum reactive compensation, and the range of the line current and the voltage range of the connection bus.
Figure 3 Structure of unified power flow controller
2.4 Power quality concepts that can be dealt with custom power devices in distribution networks In order to prioritize custom power devices in these three types of household, commercial and industrial distribution networks, these devices are compared. Table 1 summarizes this prioritization.
Table 1 Comparison and prioritization of custom power devices in various distribution networks
first
priority second priority
third priority
Type of phenomenon
load improvement
Reactive power shortage compensation, power factor
correction, current non-equilibrium compensation,
harmonic distortion compensation
D-STATCOM
UPQC -
Type of phenomenon
Network improvement
Lack of voltage and voltage overvoltage
DVR D-STATCOM UPQC
Voltage fluctuations (Flickr) D-
STATCOM UPQC -
Voltage drop (short term view), over voltage (long-
term view), unbalanced voltage and
harmonics voltage
DVR UPQC
Type of phenomenon load and network improvement
Simultaneous improvement of various phenomena
UPQC - -
3. Genetic Algorithm In genetic algorithms based on the natural reproduction research of intelligent animals and the results of the research in the procedure for the reproduction of natural entities to participate and match with smart system designers. The genetic algorithm is computationally simple and conducts an effective search and search in a possible and different space for problem solving.
Figure 4 The Basic Cycle of the Genetic Algorithm
A reasonable approach is to select and maintain a collection of sample groups (population) according to the scope of the problem. For example, in optimization

Reza Tajik Technical and Economical Assessment of using Static Compensators for Improving Power Quality in Distribution Power Systems
558| International Journal of Current Engineering and Technology, Vol.8, No.3 (May/June 2018)
problems, some of these populations are manipulated and evaluated using the randomization case called genetic operators. During each recurrence, according to the population of the first population in the population and the new generation, they sought the appropriate range of problem solving and an evaluation exercise based on comparing the appropriate values and the premiere of the new population that by the previous bands has been achieved. It is done using a reproductive genetic operator to yield a beneficial result. 3.1 Mixed Integer Genetic Algorithm (MIGA) Basic genetic algorithm designed for solving optimization problems with continuous variables that described in the previous section. In this section, the changes that need to be made in this algorithm are presented. These changes are in the direction in which the algorithm can solve optimization problems in which decision variables can either be continuous or can be integers. 3.2 Modeling and Proposed Method The purpose of operating and planning power systems in refurbished markets is to maximize public welfare, or in other words minimize energy costs. Since the cost of investment and utilization of custom power devices is high, there is a considerable risk of using it; as a result, optimum placement and finding the right size are very important. In other words, the location and measurement of custom power devices should be such that the profits from the investment cost are maximized while the risk of investment is minimized. In this work, the following objective functions are considered for allocation of distributed generation sources: Maximizing the cost reduction by minimizing the cost of losses and reducing costs at peak load (through the reduction of losses), including elimination or a delay in the need to improve the network. Improvement of the power quality that the voltage deviation is minimized from acceptable values at different buses in network. Membership functions for each of these goals include a low limit; a high limit and a steady downside function are among these two values. These membership functions are described below.
3.2.1 Membership function fee related to cost reduction
Costs reduction incurred through the use of custom power device, can be expressed in the form of the following equation:
(1) 1
yr kN N
Peak Peak CPD
P yr E k k
yr k
NS K T LR IC K LR
In this regard, the NS is Net Saving, the Kp coefficient is used to convert the loss reduction rate at peak load to the corresponding cost reduction, and its unit is the dollar per kilowatt. The time period when the charge is
peak load is expressed in TPeak a and Peak
yrLRthe rate of
loss reduction in peak load in year yr. Also, the KE coefficient is used to convert the rate of loss reduction into the reduction of the cost of losses, and its unit is the dollar per kilowatt-hour. The ratio of the time the load is at the k level is expressed in the entire range in
and reducing losses at this load level LRk. To have a positive cost savings:
(2)
1
yr k
CPD
k N NPeak Peak
P yr E k k
yr k
ICx
K T LR K LR
The variable x is defined as follows. If the amount of this variable is high, cost saving is less and if the amount of this variable is low, the costs are reduced more, which means the degree of belief is more likely to meet this goal. In the following figure, the membership function for this purpose is presented.
Figure 5 Membership function of cost saving Based on this objective function, the following equations can be expressed for this membership function.
(3)
(4)
(5)
As stated in this study, the maximal value of x is 1. To find the minimum of this variable, which is equivalent to the maximum cost reduction, an optimization has been made to maximize the cost reduction without considering improving the power quality of the network bus. The minimum value of x is obtained by maximizing the profit / cost ratio. 3.2.2 Membership function for the purpose of improving the power quality (voltage deviation minimization) at various buses
The goal here is to reduce the distortion of the bus voltages to an acceptable level. We have the following k levels:
k
maxmin max
max min
( )
( )
kk k
x xs for x x x
x x
min1k ks for x x
max0k ks for x x

Reza Tajik Technical and Economical Assessment of using Static Compensators for Improving Power Quality in Distribution Power Systems
559| International Journal of Current Engineering and Technology, Vol.8, No.3 (May/June 2018)
(6) ,max( ( )) 2,3,...,k n i k By abs V V for i N
Where is the voltage range in the bus i at the k th
level of charge in terms of the Per-unit and the rated voltage, which is equal to one in terms of the Per-unit. Whatever the maximum voltage deviation to be smaller number, the assigned number in the membership function is closer to the one to show the degree of satisfaction of this target. In the following figure, the membership function for this target is presented.
Figure 6 membership function of voltages of network buses based on the objective function shown, the
following equations can be expressed for this membership function.
(7)
(8)
(9)
In this study, and are 5% and 10% respectively.
Also, for negative values miny
and maxy
negative numbers are -5 and -10 percent were selected. According to above mentioned, regarding to the choice of rated voltage with a Per-unit, it can be said that in this study, to the point where the maximum voltage deviation is not more than 5%, the goal of minimizing the bus voltage deviation is fully satisfied. The acceptable maximum for this deviation is also 10%.
4. Numerical results In this study, case studies are conducted on the IEEE 33-bus standard test network. The goal of fit location is active power conditioner (APC). Here, the location targets are to increase the profit / cost ratio, reduce the voltage deviation, and reduce the total harmonic distortion. To achieve these goals, the objective of single-objective optimization is firstly solved separately for each objective function. Then, by fuzzing the target functions appropriately, according to the optimal amount of each of the objective functions, the objective function of the multi-objective problem is formed. A mixed integer genetic
algorithm will be used to find the optimal answer to this multi-objective problem. In the following, after the brief introduction of the active power conditioner, each of these steps will be described and the results of each step will be presented. Here, the locating targets are to increase the profit to cost ratio, reduce the voltage deviation and reduce the Total Harmonic Distortion (THD). To achieve these goals, the objective of single-objective optimization is firstly solved separately for each objective function. Then, by fuzzing the target functions appropriately, according to the optimal amount of each of the target functions, the objective function of the multi-objective problem is formed. A mixed integer genetic algorithm is used to find the optimal answer to this multi-objective problem. Following a brief introduction of the active power conditioner, each of these steps will be described and the results of each step will be presented. 4.1 Active power conditioner modeling The simplified orbital structure and equation for this equipment is shown in Figure 7. In this study, it is assumed that this equipment after connecting to the network is able to inject in different harmonics appropriate streams to reduce harmonic distortions to the network.
Figure 7 Circuit simplified structure and equation
An active power conditioner is actually a multifunctional custom power device which can improve the various disturbances associated with power quality issues, including the sharp decrease in the voltage due to reactive power consumption in the network. It also somewhat improves the loss of voltages caused by high active power consumption in the network. On the other hand, by injecting the appropriate harmonic currents, the harmonic distortion of the voltage in the network improved. In this way, this consume power device is one of the most efficient electronic power-based equipment in the
,i kV
nV
max
max min
max
max min
( )0
( )
( )0
( )
kk
k
kk
y yy
y yV
y yy
y y
min min1 k kV for y y y
max max0 k k kV for y y or y y
miny
maxy
Reza Tajik Technical and Economical Assessment of using Static Compensators for Improving Power Quality in Distribution Power Systems
560| International Journal of Current Engineering and Technology, Vol.8, No.3 (May/June 2018)
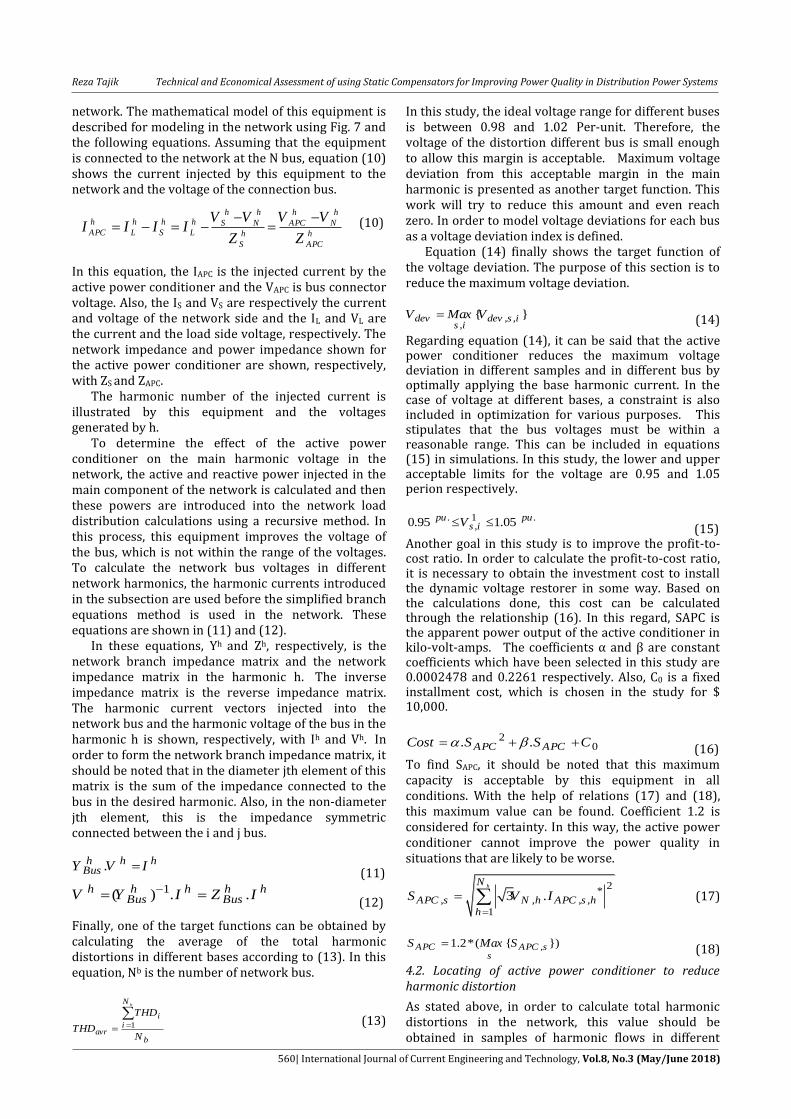
network. The mathematical model of this equipment is described for modeling in the network using Fig. 7 and the following equations. Assuming that the equipment is connected to the network at the N bus, equation (10) shows the current injected by this equipment to the network and the voltage of the connection bus.
(10)
In this equation, the IAPC is the injected current by the active power conditioner and the VAPC is bus connector voltage. Also, the IS and VS are respectively the current and voltage of the network side and the IL and VL are the current and the load side voltage, respectively. The network impedance and power impedance shown for the active power conditioner are shown, respectively, with ZS and ZAPC. The harmonic number of the injected current is illustrated by this equipment and the voltages generated by h. To determine the effect of the active power conditioner on the main harmonic voltage in the network, the active and reactive power injected in the main component of the network is calculated and then these powers are introduced into the network load distribution calculations using a recursive method. In this process, this equipment improves the voltage of the bus, which is not within the range of the voltages. To calculate the network bus voltages in different network harmonics, the harmonic currents introduced in the subsection are used before the simplified branch equations method is used in the network. These equations are shown in (11) and (12). In these equations, Yh and Zh, respectively, is the network branch impedance matrix and the network impedance matrix in the harmonic h. The inverse impedance matrix is the reverse impedance matrix. The harmonic current vectors injected into the network bus and the harmonic voltage of the bus in the harmonic h is shown, respectively, with Ih and Vh. In order to form the network branch impedance matrix, it should be noted that in the diameter jth element of this matrix is the sum of the impedance connected to the bus in the desired harmonic. Also, in the non-diameter jth element, this is the impedance symmetric connected between the i and j bus.
. h h hBusY V I
(11) 1( ) . . h h h h h
Bus BusV Y I Z I (12)
Finally, one of the target functions can be obtained by calculating the average of the total harmonic distortions in different bases according to (13). In this equation, Nb is the number of network bus.
1
b
N
ii
avrb
THD
THDN
(13)
In this study, the ideal voltage range for different buses is between 0.98 and 1.02 Per-unit. Therefore, the voltage of the distortion different bus is small enough to allow this margin is acceptable. Maximum voltage deviation from this acceptable margin in the main harmonic is presented as another target function. This work will try to reduce this amount and even reach zero. In order to model voltage deviations for each bus as a voltage deviation index is defined. Equation (14) finally shows the target function of the voltage deviation. The purpose of this section is to reduce the maximum voltage deviation.
, ,,
{ }dev dev s is i
V Max V
(14)
Regarding equation (14), it can be said that the active power conditioner reduces the maximum voltage deviation in different samples and in different bus by optimally applying the base harmonic current. In the case of voltage at different bases, a constraint is also included in optimization for various purposes. This stipulates that the bus voltages must be within a reasonable range. This can be included in equations (15) in simulations. In this study, the lower and upper acceptable limits for the voltage are 0.95 and 1.05 perion respectively.
. 1 .,0.95 1.05 pu pu
s iV (15)
Another goal in this study is to improve the profit-to-cost ratio. In order to calculate the profit-to-cost ratio, it is necessary to obtain the investment cost to install the dynamic voltage restorer in some way. Based on the calculations done, this cost can be calculated through the relationship (16). In this regard, SAPC is the apparent power output of the active conditioner in kilo-volt-amps. The coefficients α and β are constant coefficients which have been selected in this study are 0.0002478 and 0.2261 respectively. Also, C0 is a fixed installment cost, which is chosen in the study for $ 10,000.
20. . APC APCCost S S C
(16) To find SAPC, it should be noted that this maximum capacity is acceptable by this equipment in all conditions. With the help of relations (17) and (18), this maximum value can be found. Coefficient 1.2 is considered for certainty. In this way, the active power conditioner cannot improve the power quality in situations that are likely to be worse.
2*
, , , ,1
3 .
h
N
APC s N h APC s hh
S V I
(17)
,1.2*( { })APC APC ss
S Max S
(18)
4.2. Locating of active power conditioner to reduce harmonic distortion
As stated above, in order to calculate total harmonic distortions in the network, this value should be obtained in samples of harmonic flows in different
h h h hh h h h S N APC NAPC L S L h h
S APC
V V V VI I I I
Z Z

Reza Tajik Technical and Economical Assessment of using Static Compensators for Improving Power Quality in Distribution Power Systems
561| International Journal of Current Engineering and Technology, Vol.8, No.3 (May/June 2018)
buses. Then its value is obtained in different bus of networks on different samples of harmonic current. Finally, the objective function of this section can be obtained by calculating the average of the total harmonic distortions in different buses according to equation (13). By optimizing using a mixed integer genetic algorithm, Table 2 shows the results of suitable location for installing the active power conditioner and the current of first components and harmonic, which is to minimize the total harmonic distortion by this equipment indicates slow injection. The average of the total harmonic distortions, the ratio of profit to cost, and voltage deviation for this answer are presented in Table (3).
Table 2 Optimization response for the objective function of minimizing total harmonic distortion
Harmonic number 1 5 7 9 11 13 15
Injection flow size
488.165 17.458 11.784 10.654 6.875 7.653 5.213
Injection flow angle
-0.845 -0.654 -0.689 -0.659 -
0.678 -
0.378 -
0.546
installation location
Bus 4
Table 3 The amount of different objective functions for
the objective function of minimizing total harmonic distortions
ratio of profit to
cost
Voltage deviation
total harmonic distortions
objective function
1.2 0.0189 0.0125 value
Figure 8 shows the average of the total harmonic distortions in the various bus of network. Comparing this figure with Figure 7, it can be seen that the average of the total harmonic distortions in the network bus has been significantly reduced. Finally, the average of this indicator for the network bus is after the active power conditioner is 0.004 which is much lower than non-compensation status.
Figure 8 Total harmonic distortion with presence of active power conditioner for minimizing total
harmonic distortion
4.3 Locating of active power conditioner to reduce the voltage deviation Improving the voltage profile is one of the most important issues related to power quality issues. This
section will try to reduce the voltage deviations from acceptable values. The ideal voltage range for different bus is between 0.98 and 1.02 pre-unit. Equation (14) model the voltage-deviation target function. By optimizing with a mixed integer genetic algorithm, Table (4) shows the results of the appropriate location for installing the active power conditioner and the first component flows that must be injected with this equipment. The average of the total harmonic distortions, the profit-to-cost ratio and the voltage deviation for this response are presented in Table 5. Table 4 Optimization response for the target function
of minimizing voltage deviation
Harmonic number 1 5 7 9 11 13 15
Injection flow size
378.125 - - - - - -
Injection flow angle
0.125 - - - - - -
installation location
Bus 7
Table 5 The amount of different target functions for the target function of minimizing voltage deviation
Ratio of profit to expense
Voltage deviation
total harmonic distortions
objective function
1.6 0 0.0201 value
Figure 8 shows the average of the total harmonic distortions in the various bus of network. Comparing this figure with figure 7, it can be seen that the average of the total harmonic distortions in the network buss has not changed.
Figure 8 Total harmonic distortion with presence of active power conditioner for minimizing voltage
deviation
4.4 Locating of active power conditioner to increase the profit to cost ratio By optimizing the mixed integer genetic algorithm, table 6 shows the results of the appropriate location for installing the active power conditioner and the first and harmonic component flows that the equipment must be injected to maximize the profit-to-cost ratio. The average of the total harmonic distortions,
0 5 10 15 20 25 30 35 0
0.002
0.004
0.006
0.008
0.01
0.012
0.014
Bus No.
TH
Db
0 5 10 15 20 25 30 0
0.005
0.01
0.015
0.02
0.025
0.03
0.035
0.04
0.045
Bus No.
TH
Dav
r

Reza Tajik Technical and Economical Assessment of using Static Compensators for Improving Power Quality in Distribution Power Systems
562| International Journal of Current Engineering and Technology, Vol.8, No.3 (May/June 2018)
the benefit / cost ratio and the voltage deviation for this response are presented in Table 7.
Table 6 Optimization response for the objective function maximizing the profit to cost ratio
Harmonic number
1 5 7 9 11 13 15 Injection flow size
298.012 - - - - - -
Injection flow angle
0.145 - - - - - -
installation location
Bus 7
Table 7 The amount of different objective functions for
maximizing the profit-to-cost ratio
Ratio of profit to expense
Voltage deviation
total harmonic distortions
objective function
2.9 0.0178 0.0198 value
Voltage values of different bus with the help of the forward-forward load-transfer method, figure 9 is given for the answer in this section. Voltage values are presented in many buses far from the optimal margin, but are within acceptable limits.
Figure 9 Network Voltage Profile without the presence of active power conditioner and with the presence of
this equipment for the purpose of maximizing the profit / cost ratio
4.5 Locating active power conditioner for multi-objective fuzzy optimization
In this section, the objective function of the optimization problem is determined with the help of membership functions. Here, the goals of the locating include increasing the proportion of profit to cost, reducing voltage deviations and reducing the total harmonic distortion. The optimal level of each of this target objective is 3.2, and 0.004 respectively. By optimizing with mixed integer genetic algorithm, Table (8) shows the results of the appropriate location for installing the active power conditioner and the first and harmonic currents that the device needs to be injected to optimize the objective function of the multi-objective problem. The average of the total harmonic distortions, the ratio of profit to cost, and voltage deviation for this response are presented in Table 9.
Table 8 Optimization response for multi objective optimization objective function
Harmonic number 1 5 7 9 11 13 15
Injection flow size
389.122 17.458 11.784 10.658 6.956 7.635 5.457
Injection flow angle
-0.875 -0.653 -0.488 -0.356 -
0.458 -
0.235 -
0.356
installation location
Bus 4
Table 9 The amount of different objective functions for
the multi-objective optimization objective function
Ratio of profit to expense
Voltage deviation
total harmonic distortions
objective function
2.5 0 0.01458 value
Figure 10 shows the average of the total harmonic distortions in the various bus of network. Comparing this figure with Figure 9, it can be seen that the average of the total harmonic distortions in the network bus has been significantly reduced. Finally, the average for the network buss after the active power conditioner is placed is 0.0078 which is much lower than no compensation.
Figure 10 shows the total harmonic distortion with the
presence of active power conditioner for multi-objective optimization
4.6 Locating active power conditioner to increase the profit-to-cost ratio on the 33-bus network In this section, the objective function is to optimize the profit-to-cost ratio. In this section, as in the case study, harmonic currents injected by this device have no effect on optimizing the profit / cost ratio. The average of the total harmonic distortions, the benefit / cost ratio, the voltage deviation for this response, and the suitable location for the active power conditioner is provided in Table (10). The voltages of the bus are shown in Figure 11 for the response of this section.
Table 10 The amount of different objective functions for the objective function of maximizing the profit /
cost ratio
Ratio of profit
to expense Voltage
deviation total harmonic
distortions objective function
2.5 0.0289 0.0125 value
Bus 47 Installation place
0 5 10 15 20 25 30 35 0.9
0.92
0.94
0.96
0.98
1
1.02
1.04
Bus No.
Vb
(p
u.)
0 5 10 15 20 25 30 35 0
0.002
0.004
0.006
0.008
0.01
0.012
0.014
0.016
Bus No.
TH
Db

Reza Tajik Technical and Economical Assessment of using Static Compensators for Improving Power Quality in Distribution Power Systems
563| International Journal of Current Engineering and Technology, Vol.8, No.3 (May/June 2018)
Figure 11 Network voltage profile with this equipment for the purpose of maximizing the profit / cost ratio
4.7 Locating active power conditioner for multi-objective fuzzy optimization in 33 bus of network In this section, the objective function of the optimization problem is determined using the membership functions. In fact, by fuzzing the target functions as described above, the objective function of the multi-objective problem is formed and a mixed integer genetic algorithm will be used to find the optimal answer to this multi-objective problem. The program tries to find the right place for installing an active power conditioner and the first and harmonic currents that the device must inject into the network to optimize the objective function of the multi-objective problem. The average of the total harmonic distortions, the ratio of profit to cost, and voltage deviation for this response is provided for the installation of an active power conditioner in Table 11.
Table 11 The amount of different objective functions for the multi-objective optimization target function
ratio of profit to expense
voltage deviation
total harmonic
distortions
objective function
2.6 0.002 0.0124 value Bus 57 installation place
Figure 12 Shows the total harmonic distortion with
the presence of an active power conditioner for multi-objective optimization
Figure 12 shows the average of the total harmonic distortion in the various bus of the network. The average of the total harmonic distortions in the network buss has decreased significantly. Conclusion The simulation results indicate that the proposed algorithm is used to find the optimal solution of the problem, which includes the location of the desired custom power device and the flow rate and this equipment should be injected into the network in different harmonics and in different situations, it can solve the problem well. Various studies in this study have been conducted on the 33-bus network. Separately, attempting to resolve each of the network problems revealed that optimizing a network would not solve other network problems only by considering a problem and in some cases exacerbate these problems. Therefore, the use of multi-purpose planning seems necessary to overcome these problems. The multi-objective planning outcomes proposed in this study show that with proper planning, it can be done at a low cost and even with a relatively high profit / cost ratio with the proper location of custom device, the power to solve issues related to power quality issues in distribution networks. However, for the sample network introduced in this study, the proposed multi-objective method is considered by an active power conditioner and the bus voltage will not only be within the permissible range, but also within a very small range, very close to the reference voltage. There is also a remarkable improvement in terms of total harmonic distortion through the proper location of this device. This is while the profit / cost ratio is very good here. Some problems with the distribution network are spreading or aggravating by placing distributed generation resources on these networks. These include harmonic distortion problems and dynamic stability issues in the presence of distributed generation sources. Performing a multi-purpose planning to promote the network using the optimal location of the custom power device is suggested for future research. References Digvijay B Kanase ; A. R Thorat ; H. T Jadhav (2015).
Distribution static compensator for power quality improvement using PV array. 2015 IEEE International Conference on Electrical, Computer and Communication Technologies (ICECCT), IEEE. DOI: 10.1109/ICECCT.2015.7225995
Vinod S. Tejwani ; Hitesh B. Kapadiya ; A. S. Pandya ; Jignesh B. Bhati (2013). Power quality improvement in power distribution system using D-STATCOM. Engineering (NUiCONE), 2013 Nirma University International Conference. IEEE. DOI: 10.1109/NUiCONE.2013.6780153
S.Khalid & Bharti Dwivedi (2012). Power quality issues, problems, standards & their effects in industry with corrective means. International Journal of Advances in Engineering & Technology, May 2011. Vol. 1,Issue 2,pp.1-11
0 10 20 30 40 50 60 70 0.975
0.98
0.985
0.99
0.995
1
1.005
1.01
1.015
1.02
1.025
Bus Voltages
Bus No.
Vb
(pu
)
0 10 20 30 40 50 60 70 0
0.005
0.01
0.015
0.02
0.025
0.03
0.035
0.04 THD
Bus No.
TH
Dav
r

Reza Tajik Technical and Economical Assessment of using Static Compensators for Improving Power Quality in Distribution Power Systems
564| International Journal of Current Engineering and Technology, Vol.8, No.3 (May/June 2018)
R.K.Rojin (2013). A review of power quality problems and solutions in electrical power system. International Journal of Advanced Research in Electrical, Electronics and Instrumentation Engineering. Vol. 2, Issue. 11, November 2013
Shailesh M. Deshmukh, BhartiDewani, S. P. Gawande (2013) , A review of Power Quality Problems-Voltage Sags for Different Faults.International Journal of Scientific Engineering and Technology, Volume No.2, Issue No.5, pp. 392-3971, 2013.
Steven Warren Blume (2007), Electric power system basics: for the nonelectrical professional. John Wiley & Sons, pp. 199,2007.
Anurag Agarwal, Sanjiv Kumar, Sajid Ali (2012), “A Research Review of Power Quality Problems in Electrical Power System”. MIT International Journal of Electrical and Instrumentation Engineering, Vol. 2(2), pp. 88-93, 2012.
Anurag Agarwal, Sanjiv Kumar, Sajid Ali, “A Research Review of Power Quality Problems in Electrical Power System”. MIT International Journal of Electrical and Instrumentation Engineering, Vol. 2(2), pp. 88-93, 2012.
M. Sharanya, B. Basavaraja, M. Sasikala, "Voltage quality improvement and harmonic mitigation using custom power devices: DVR and hybrid filters," Microelectronics and Electronics (PrimeAsia), 2013 IEEE Asia Pacific Conference on Postgraduate Research, pp. 213-218, 19-21 Dec. 2013.
Raj, P.A.D.V., et al. Particle Swarm Optimization Based Energy Optimized Dynamic Voltage Restorer in Joint International Conference on Power System Technology and IEEE Power India Conference 2008. 1-6.
J. Guerrero, M. Chandorkar, T. Lee, P. Loh, Advanced control architectures for intelligent microgrids. Part II: Power quality, energy storage, and AC/DC micro-grids, IEEE Trans. Ind. Electron. 60 (April (4)) (2013) 1263–1270.
Sirjani, R., A. Mohamed, and H. Shareef. Optimal placement
and sizing of Static Var Compensators in power systems
using Improved Harmony Search Algorithm. Przeglad
Elektrotechniczny, 87 (2011), No.7, 214-218.
F. Shahnia, A. Ghosh, G. Ledwich, F. Zare, Voltage unbalance
improvement in low voltage residential feeders with
rooftop PVs using custom power devices, Int. J. Electr.
Power Energy Syst. 55 (February) (2014) 362–377.
Y. Pal, A. Swarup, B. Singh, "A Review of Compensating Type
Custom Power Devices for Power Quality Improvement,"
Power System Technology and IEEE Power India
Conference, 2008. POWERCON 2008. Joint International
Conference on, pp. 1-8, 12-15 Oct. 2008.
Z. Changjiang; W. Manchung; Y. Han, H. Yingduo, Z. Liangbing,
"Universal custom power conditioner (UCPC) in
distribution networks," Power Electronics and Drive
Systems, 1999. PEDS '99. Proceedings of the IEEE 1999
International Conference on, vol. 2, pp. 1067-1072, 1999
Mahela, Om & Shaik, Abdul (2016). Topological Aspects of
Power Quality Improvement Techniques: A
Comprehensive Overview. Renewable and Sustainable
Energy Reviews. 58. 1129–1142.
10.1016/j.rser.2015.12.251.
B.Muruganantham, R.Gnanadass, N.P.Padhy (2017). Reactive
Power Reallocation in the Distribution System with
DSTATCOM. 1st International Conference on Power
Engineering, Computing and CONtrol, PECCON-2017, 2-4
March 2017, VIT University, Chennai Campus. Energy
Procedia 117 (2017). 485–492.
Andreas Poullikkas, Savvas Papadouris, George Kourtis,
Ioannis Hadjipaschalis. Storage Solutions for Power Quality
Problems in Cyprus Electricity Distribution Network. AIMS
Energy, 2014, 2(1): 1-17. doi: 10.3934/energy.2014.1.1


![7-Detailed Modeling of Static Var Compensators Using-00169616[1]](https://img.pdfslide.us/doc/110x75/577cc3a51a28aba71196b441/7-detailed-modeling-of-static-var-compensators-using-001696161.jpg)