Embed Size (px)
Citation preview
Energy Sector Management Assistance Program 1818 H Street, NW Washington, DC 20433 USA Tel: 1.202.458.2321 Fax: 1.202.522.3018 Internet: www.esmap.org E-mail: [email protected]
Energy Sector Management Assistance Program
Technical and Economic Assessment of Off-grid, Mini-grid and Grid Electrification Technologies
ESMAP Technical Paper 121/07 December 2007
Tech
nica
l and E
conom
ic Asse
ssment o
f Off-g
rid, M
ini-g
rid a
nd G
rid E
lectrifica
tion Te
chnolo
gie
s Te
chnica
l Paper 1
21/0
7
Energy Sector Management Assistance Program
Purpose
The Energy Sector Management Assistance Program (ESMAP) is a global technical assistance partnership
administered by the World Bank since 1983 and sponsored by bilateral donors. ESMAP's mission is to
promote the role of energy in poverty reduction and economic growth in an environmentally responsible
manner. Its work applies to low-income, emerging, and transition economies and contributes to the
achievement of internationally agreed development goals through knowledge products such as free technical
assistance; specific studies; advisory services; pilot projects; knowledge generation and dissemination; training,
workshops, and seminars; conferences and round-tables; and publications.
The Program focuses on four key thematic areas: energy security, renewable energy, energy poverty, and
market efficiency and governance.
Governance and Operations
ESMAP is governed by a Consultative Group (CG) composed of representatives of the World Bank, other
donors, and development experts from regions that benefit from ESMAP assistance. The ESMAP CG is
chaired by a World Bank Vice-President and advised by a Technical Advisory Group of independent energy
experts that reviews the Program's strategic agenda, work plan, and achievements. ESMAP relies on a
cadre of engineers, energy planners, and economists from the World Bank, and from the energy and
development community at large, to conduct its activities.
Funding
ESMAP is a knowledge partnership supported by the World Bank and official donors from Belgium, Canada,
Denmark, Finland, France, Germany, Iceland, the Netherlands, Norway, Sweden, Switzerland, United
Kingdom, United Nations Foundation, and the United States Department of State. It has also enjoyed the
support of private donors as well as in-kind support from a number of partners in the energy and development
community.
Further Information
Please visit www.esmap.org or contact ESMAP via email ([email protected]) or mail at:
ESMAP
c/o Energy, Transport and Water Department
The World Bank Group
1818 H Street, NW
Washington, DC 20433 USA
Tel.: 202.458.2321
Fax: 202.522.3018
ESMAP Technical Paper 121/07
Technical and EconomicAssessment of Off-grid,Mini-grid and GridElectrification Technologies
Energy and Mining Sector BoardThe World Bank Group
Energy Sector Management Assistance Program

Copyright © 2007The International Bank for Reconstructionand Development/THE WORLD BANK1818 H Street, NWWashington, DC 20433 USA
All rights reservedProduced in IndiaFirst printing December 2007
ESMAP Reports are published to communicate the results of ESMAP’s work to thedevelopment community with the least possible delay. The typescript of the paper thereforehas not been prepared in accordance with the procedures appropriate to formal documents.Some sources cited in this paper may be informal documents that are not readily available.
The findings, interpretations, and conclusions expressed in this paper are entirely those ofthe author and should not be attributed in any manner to the World Bank or its affiliatedorganizations, or to members of its Board of Executive Directors or the countries theyrepresent. The World Bank does not guarantee the accuracy of the data included in thispublication and accepts no responsibility whatsoever for any consequence of their use. Theboundaries, colors, denominations, other information shown on any map in this volume donot imply on the part of the World Bank Group any judgment on the legal status of anyterritory or the endorsement or acceptance of such boundaries.
The material in this publication is copyrighted. Requests for permission to reproduce portionsof it should be sent to the ESMAP Manager at the address shown in the copyright noticeabove. ESMAP encourages dissemination of its work and will normally give permissionpromptly and, when the reproduction is for noncommercial purposes, without asking a fee.
(Papers in the ESMAP Technical Series are discussion documents, not final project reports.They are subject to the same copyright as other ESMAP publications.)
Acronyms and Abbreviations xv
Units of Measure xviii
Chemical Symbols xix
Foreword xxi
Acknowledgments xxiii
Executive Summary xxv
1. Introduction 1Purpose and Scope 2Methodology 2
Costing Formulations and Projections 3Uncertainty Analysis 4Capacity Factor 6Deployment Venue 6Fuel Price Forecasts 6Regional Adjustments 6
Study Limitations 7
2. Power Generation Technology Assessment 9Renewable Technologies 9Solar Photovoltaic Power Systems 9
Wind Power Systems 11SPV-wind Hybrid Power Systems 13Solar-thermal Electric Power Systems 14Geothermal Electric Power Systems 15Biomass Gasifier Power Systems 17Biomass-steam Electric Power Systems 19Municipal Waste-to-power via Anaerobic Digestion System 20Biogas Power Systems 22
Contents
iii
TECHNICAL AND ECONOMIC ASSESSMENT OF OFF-GRID, MINI-GRID AND GRID ELECTRIFICATION TECHNOLOGIES
iv
Micro- and Pico-hydroelectric Power Systems 23Mini-hydroelectric Power Systems 25Large Hydroelectric and Pumped Storage Power Systems 26
Conventional Power Generation Systems 28Diesel/Gasoline Engine-generator Power Systems 28Combustion Turbine Power Systems 29Coal-steam Electric Power Systems 31Oil-fired Steam-electric Power Systems 32Emerging Power Generation Technologies 33Coal IGCC Power Systems 34Coal-fired AFBC Power Systems 35Microturbine Power Systems 35Fuel Cell Power Systems 37
3. Technical and Economic Assessment of Power Delivery 39Transmission and Distribution Facilities 40Operations and Maintenance Requirements 41Power Delivery Losses 41Economic Assessment of Power Delivery 42
Distribution Costs 42Transmission Costs 45Grid Integration Issues 47
4. Results and Discussion 49Power Generation Technology Configurations 50Results: Power Generation Capital Costs 50Results: Levelized Power Generating Costs 54Discussion: Power Delivery Costs 57Discussion: Sensitivity of Projected Generation Costs to Technology
Change and Fuel Costs 57Conclusion 58
5. References 61
Annexes
Annex 1: Detailed Technology Descriptions and Cost Assumptions 69Annex 2: Wind Electric Power Systems 77Annex 3: SPV-wind Hybrid Systems 87Annex 4: Solar-thermal Electric Power Systems 95Annex 5: Geothermal Power Systems 101Annex 6: Biomass Gasifier Power Systems 109Annex 7: Biomass-steam Power Systems 117Annex 8: Muncipal Waste-to-power System Using Anaerobic Digestion 123
v
Annex 9: Biogas Power Systems 129Annex 10: Micro- and Pico-hydroelectric Power Systems 135Annex 11: Mini-hydroelectric Power Systems 141Annex 12: Large-hydroelectric Power and Pumped Storage Systems 147Annex 13: Diesel/Gasoline Engine-generator Power Systems 153Annex 14: Combustion Turbine Power Systems 161Annex 15: Coal-steam Electric Power Systems 169Annex 16: Coal-IGCC Power Systems 179Annex 17: Coal-fired AFBC Power Systems 187Annex 18: Oil-fired Steam-electric Power Systems 195Annex 19: Microturbine Power Systems 201Annex 20: Fuel Cells 207Annex 21: Description of Economic Assessment Methodology 215Annex 22: Power Generation Technology Capital Cost Projections 237Annex 23: High/Low Charts for Power Generation Capital and Generating Costs 255Annex 24: Data Tables for Generation Capital Cost and Generating Costs 267Annex 25: Environmental Externalities 273Annex References 285
CONTENTS

TECHNICAL AND ECONOMIC ASSESSMENT OF OFF-GRID, MINI-GRID AND GRID ELECTRIFICATION TECHNOLOGIES
vi
Table 1: World Bank FY 2003-05 Investment in Electricity Access xxvi
Table 2: Generation Technology Options and Configurations xxviii
Table 1.1: Capital Costs Projections by Generation Technology 4
Table 1.2: Uncertainty Variables for Analysis 5
Table 1.3: Fossil Fuel Price Projections 7
Table 2.1: Solar PV Configurations Assessed 10
Table 2.2: Targets for SPV Future Costs 11
Table 2.3: Wind Turbine Performance Assumptions 12
Table 2.4: Solar-thermal Electric Power System Design Parameters 15
Table 2.5: Design Assumptions for Geothermal Power Plants 16
Table 2.6: Geothermal Power Capital Costs by Project Development Phase 17
Table 2.7: Biomass Gasifier Design Assumptions 18
Table 2.8: Biomass-steam Electric Power Plant Design Assumptions 20
Table 2.9: Municipal Waste-to-power System Characteristics 21
Table 2.10: Biogas Power System Design Assumptions 23
Table 2.11: Micro- and Pico-hydroelectric Power Plant Design Assumptions 25
Table 2.12: Mini-hydroelectric Power Plant Design Assumptions 25
Table 2.13: Large Hydroelectric Power Design Assumptions 27
Table 2.14: Gasoline and Diesel Engine-generator Design Assumptions 29
Table 2.15: Emission Characteristics of Diesel Generators 29
Table 2.16: CT and CCGT Design Assumptions 30
Table 2.17: Coal-fired Steam-electric Power Plant Design Assumptions 31
Table 2.18: Oil-fired Steam-electric Power Plant Design Assumptions 33
Tables
vii
Table 2.19: Emissions from Oil-fired Steam-electric Power Plants 33
Table 2.20: Coal-fired IGCC Power Plant Design Assumptions 34
Table 2.21: Emission Results for a Coal-fired AFBC Power Plant 35
Table 2.22: Gas-fired Microturbine Design Assumptions 37
Table 2.23: Fuel Cell Power System Design Assumptions 38
Table 3.1: Power Delivery Requirements According to Generation Configuration 39
Table 3.2: Transmission Voltages in Developing Countries 40
Table 3.3: Power Delivery Loss Rates in Selected Countries 41
Table 3.4: Power Delivery Costs Associated with Mini-grid Configurations 44
Table 3.5: Assigning Transmission Line Costs According to Power Station Output 46
Table 3.6: Power Delivery Costs Associated with Transmission Facilities 46
Table 3.7: Costs of Accommodating Wind Power Intermittency 48
Table 4.1: 2005 Renewable Power Technology Capital Costs 51
Table 4.2: 2005 Conventional and Emerging Power Technology Capital Costs 52
Table 4.3: Power Generation Technology Capital Costs Now and in Future(2005, 2010, 2015) 52
Table 4.4: 2005 Renewable Power Technology Generating Costs 55
Table 4.5: 2005 Conventional/Emerging Power Technology Generating Costs 56
Table 4.6: Levelized Generating Cost with Uncertainty Analysis 59
Table A1.1: Characteristics of Solar Cells 67
Table A1.2: SPV System Configurations and Design Assumptions 67
Table A1.3: SPV 2005 Capital Costs 68
Table A1.4: SPV 2005 System Generating Costs 68
Table A1.5: Projected SPV Module Costs 69
Table A1.6: SPV System Capital Costs Projections 70
Table A1.7: Uncertainty Analysis of SPV Generation Costs 70
Table A2.1: Wind Turbine Design Assumptions 77
Table A2.2: Wind Turbine Capital Costs in 2005 77
Table A2.3: Wind Turbine Generating Costs in 2005 78
Table A2.4: Present and Projected Wind Turbine Capital Costs 80
Table A2.5: Present and Projected Wind Turbine Generation Costs 80
Table A3.1: PV-wind Hybrid Power System 2005 Capital Costs 85
CONTENTS

TECHNICAL AND ECONOMIC ASSESSMENT OF OFF-GRID, MINI-GRID AND GRID ELECTRIFICATION TECHNOLOGIES
viii
Table A3.2: PV-wind Hybrid Power System 2005 Generating Costs 86
Table A3.3: PV-wind Hybrid Power System Projected Capital Costs 86
Table A3.4: PV-wind Hybrid Power System Projected Generating Costs 87
Table A4.1: Solar-thermal Electric Power System Design Assumptions 92
Table A4.2: Solar-thermal Electric Power System 2005 Capital Costs 93
Table A4.3: Solar-thermal Electric Power 2005 Generating Costs 93
Table A4.4: Solar-thermal Electric Power Capital Costs Projections 94
Table A4.5: Solar-thermal Electric Power Generating Costs Projections 94
Table A5.1: Basic Characteristics of Geothermal Electric Power Plants 99
Table A5.2: Geothermal Electric Power Plant 2005 Capital Costs 100
Table A5.3: Geothermal Capital Costs by Development Phase 100
Table A5.4: Geothermal Power Plant 2005 Generation Costs 101
Table A5.5: Geothermal Power Plant Capital Costs Projections 101
Table A5.6: Geothermal Power Plant Capital Costs Uncertainty Range 102
Table A5.7: Geothermal Power Plant Projected Generating Costs 102
Table A6.1: Principle Chemical Reactions in a Gasifier Plant 105
Table A6.2: Biomass Gasifier System Design Assumptions 107
Table A6.3: Biomass Gasifier Power System 2005 Capital Costs 108
Table A6.4: Biomass Gasifier Power System 2005 Generating Costs 108
Table A6.5: Biomass Gasifier Power System Capital Costs Projections 109
Table A6.6: Biomass Gasifier Power Generating Costs Projections 109
Table A7.1: Biomass-steam Electric Power System Design Assumptions 114
Table A7.2: Biomass-steam Electric Power Plant 2005 Capital Costs 114
Table A7.3: Biomass-steam Electric Power Plant 2005 Generating Costs 115
Table A7.4: Biomass-steam Electric Power Plant Projected Capital Costs 115
Table A7.5: Biomass-steam Electric Power Projected Generating Costs 116
Table A8.1: Municipal Waste-to-power System Design Assumptions 120
Table A8.2: Municipal Waste-to-power System 2005 Capital Costs 120
Table A8.3: Municipal Waste-to-power System 2005 Generating Costs 121
Table A8.4: Municipal Waste-to-power System Projected Capital Costs 121
Table A8.5: Municipal Waste-to-power Projected Generating Costs 121
ix
Table A9.1: Biogas Power System Design Assumptions 126
Table A9.2: Biogas Power System 2005 Capital Costs 127
Table A9.3: Biogas Power System 2005 Generating Costs 127
Table A9.4: Biogas Power System Capital Costs Projections 128
Table A9.5: Biogas Power System Generating Costs Projections 128
Table A10.1: Micro/Pico-hydroelectric Power Plant Design Assumptions 133
Table A10.2: Micro/Pico-hydroelectric Power Plant 2005 Capital Costs 133
Table A10.3: Micro/Pico-hydroelectric Power 2005 Generating Costs 133
Table A10.4: Micro/Pico-hydroelectric Power Capital Costs Projections 134
Table A10.5: Micro/Pico-hydroelectric Power Generating Costs Projections 134
Table A11.1: Mini-hydroelectric Power Plant Design Assumptions 138
Table A11.2: Mini-hydroelectric Power Plant 2005 Capital Costs 138
Table A11.3: Mini-hydroelectric Power Plant 2005 Generating Costs 139
Table A11.4: Mini-hydroelectric Power Plant Capital Costs Projections 139
Table A11.5: Mini-hydroelectric Power Generating Costs Projections 139
Table A12.1: Large-hydroelectric Power Plant Design Assumptions 144
Table A12.2: Large-hydroelectric Power Plant 2005 Capital Costs 145
Table A12.3: Large-hydroelectric Power Plant 2005 Generating Costs 145
Table A12.4: Large-hydroelectric Power Plant Capital Costs Projections 145
Table A12.5: Large-hydroelectric Power Generating Costs Projections 146
Table A13.1: Characteristics of Gasoline and Diesel Generators 149
Table A13.2: Gasoline and Diesel Power System Design Assumptions 150
Table A13.3: Air Emission Characteristics of Gasoline and Diesel Power Systems 151
Table A13.4: Gasoline and Diesel Power System 2005 Capital Costs 151
Table A13.5: Gasoline and Diesel Power System 2005 Generating Costs 152
Table A13.6: Gasoline and Diesel Power System Projected Capital Costs 152
Table A13.7: Gasoline/Diesel Power System Projected Generating Costs 153
Table A14.1: CT and CCGT Power Plant Design Assumptions 159
Table A14.2: Air Emission Characteristics of Gas Turbine Power Plants 160
Table A14.3: Gas Turbine Power Plant 2005 Capital Costs 160
Table A14.4: Gas Turbine Power Plant 2005 Generating Costs 161
CONTENTS
TECHNICAL AND ECONOMIC ASSESSMENT OF OFF-GRID, MINI-GRID AND GRID ELECTRIFICATION TECHNOLOGIES
x
Table A14.5: Gas Turbine Power Plant Capital Costs Projections 161
Table A14.6: Gas Turbine Power Plant Generating Costs Projections 161
Table A15.1: European SuperCritical Pulverized Coal Power Plants 167
Table A15.2: Air Emissions from a 300 MW Pulverized Coal-steamElectric Power Plant 168
Table A15.3: Pulverized Coal-steam Electric Power Plant Design Assumptions 169
Table A15.4: Pulverized Coal-steam Electric Power Plant Capital Costs Breakdown 170
Table A15.5: Pulverized Coal-steam Electric Power 2005 Generating Costs 170
Table A15.6: Pulverized Coal-steam Electric Power Capital Costs Projections 170
Table A15.7: Pulverized Coal-steam Electric Power Generating Costs Projections 171
Table A16.1: Coal-IGCC Power System Design Assumptions 177
Table A16.2: The World Bank Air Emission Standards and IGCC Emissions 177
Table A16.3: Coal-IGCC Power Plant 2005 Capital Costs 178
Table A16.4: Coal-IGCC Power Plant 2005 Generating Costs 178
Table A16.5: Coal-IGCC Capital and Generating Costs Projections 179
Table A17.1: AFBC Emission Results and the World Bank Standards 185
Table A17.2: Indicative AFBC Installations and Capital Costs Estimates 186
Table A17.3: Coal-fired AFBC Power Plant 2005 Capital Costs 186
Table A17.4: Coal-fired AFBC Power Plant 2005 O&M Costs 187
Table A17.5: Coal-fired AFBC Power Plant 2005 Generating Costs 187
Table A17.6: Coal-fired AFBC Power Plant Projected Capital and Generating Costs 188
Table A18.1: Oil-fired Steam-electric Power Plant Design Assumptions 192
Table A18.2: Oil-fired Steam-electric Power Plant Air Emissions 193
Table A18.3: Oil-fired Steam-electric Power Plant 2005 Capital Costs 193
Table A18.4: Oil-fired Steam-electric Power 2005 Generating Costs 193
Table A18.5: Oil-fired Steam-electric Power Plant Projected Capital andGenerating Costs 194
Table A19.1: Microturbine Power Plant Design Assumptions 198
Table A19.2: Microturbine Power System 2005 Capital Costs 198
Table A19.3: Microturbine Power Plant 2005 Generating Costs 199
Table A19.4: Microturbine Power System Target Price 199
Table A19.5: Microturbine Power Plant Projected Capital and Generating Costs 199
xi
Table A20.1: Fuel Cell Power System Design Assumptions 204
Table A20.2: Fuel Cell Power System Air Emissions 205
Table A20.3: Fuel Cell Power System Carbon Dioxide Emissions 205
Table A20.4: Fuel Cell Power System 2005 Capital Costs 205
Table A20.5: Fuel Cell Power System 2005 Generating Costs 206
Table A20.6: Fuel Cell Power System Projected Capital and Generating Costs 206
Table A20.7: Uncertainty in Fuel Cell Capital Costs Projections 207
Table A20.8: Uncertainty in Fuel Cell Generating Costs Projections 207
Table A21.1: Power Generation Technology Configurations andDesign Assumptions 211
Table A21.2: Average Capital Costs of Distribution 215
Table A21.3: Proportion of Capital Costs by Component of a 11 kV Line 216
Table A21.4: Levelized Capital Costs and O&M Costs 216
Table A21.5: Capital and Variable Costs for Power Delivery,by Power Generation Technology 216
Table A21.6: Voltage Level and Line-type Relative to Rated Power Station Output 217
Table A21.7: Levelized Capital Costs and O&M Costs per Unit 218
Table A21.8: Transmission Losses 218
Table A21.9: Capital and Delivery Costs of Transmission 219
Table A21.10: Forecast Rate of Decrease in Power Generation Technologies 220
Table A21.11: Availability Factor Values Found in the Power Literature 225
Table A21.12: Fossil Fuel Price Assumptions 226
Table A21.13: Other Fuel Costs 228
Table A22.1: Capital Costs Projections Power Generation Technology 233
Table A24.1: Generation Capital Cost and Generating Costs 263
Table A25.1: Indicative Results of Environmental Externality Studies 273
Table A25.2: Externality Values for Two Chinese Cities 274
Table A25.3: Key Parameters for Hunan Externality Costs Assessment 275
Table A25.4: Hunan Province: SO2 Emission Damage Costs (1995-2000) 275
Table A25.5: TSP Emission Damage Costs in Changsha City and Hunan Province 276
Table A25.6: NOX Emission Damage Costs in Changsha City and Hunan Province 277
CONTENTS
TECHNICAL AND ECONOMIC ASSESSMENT OF OFF-GRID, MINI-GRID AND GRID ELECTRIFICATION TECHNOLOGIES
xii
Figure 1: Off-grid Forecast Generating Cost xxix
Figure 2: Mini-grid Forecast Generating Costs xxx
Figure 3: Grid-connected Forecast Generating Costs xxxiii
Figure 1.1: JSIM Labor Factor by Region 8
Figure 2.1: Stand-alone Solar Photovoltaic System 10
Figure 2.2: Projected Wind Power Costs, 2000-25 12
Figure 2.3: SPV-wind DC- and AC-coupled Arrangement 13
Figure 2.4: Solar-thermal Electric Power Plant 14
Figure 2.5: Binary Hydrothermal Power Plant Schematic 17
Figure 2.6: Biomass Gasification Process Schematic 18
Figure 2.7: Biomass-fired Steam Electric Power Plant 19
Figure 2.8: Municipal Waste-to-power via Anaerobic Digestion 21
Figure 2.9: Fixed Dome Biogas Plant 22
Figure 2.10: Micro-hydroelectric Power Scheme 24
Figure 2.11: Conduit-type Intake Arrangement for Large HydroelectricPower Plant 26
Figure 2.12: Pumped Storage Hydroelectric Power Arrangement 27
Figure 2.13: Diesel-electric Power Generation Scheme 28
Figure 2.14: Combined Cycle Gas Turbine Schematic 30
Figure 2.15: Coal-fired Steam-electric Power Plant 31
Figure 2.16: Oil-fired Steam-electric Power Plant 32
Figure 2.17: Coal-fired IGCC Power Plant Arrangements 34
Figure 2.18: Coal-fired AFBC Boiler Schematic 36
Figure 2.19: Gas-fired Microturbine Schematic 36
Figure 2.20: Operation of a Fuel Cell 38
Figure 3.1: Calculation Model for Distribution Costs 43
Figure 3.2: Calculation Model for Transmission Costs 45
Figure A1.1: Typical SPV System Arrangement 65
Figures
xiii
Figure A2.1: Wind Turbine Schematics 73
Figure A2.2: Wind Power Project Cost Trends 78
Figure A2.3: Wind Power Cost Projections 79
Figure A3.1: Mixed DC- and AC-coupled PV-wind Hybrid Power System 84
Figure A3.2: Pure AC PV-wind Hybrid Power System 84
Figure A4.1: Solar-thermal Electric Power Plant Schematic 91
Figure A5.1: Binary Hydrothermal Electric Power System Schematic 98
Figure A5.2: Flash Hydrothermal Electric Power System 99
Figure A6.1: Biomass Gasifier Power System Schematic 106
Figure A7.1: Biomass-steam Electric Power System Schematic 113
Figure A8.1: Municipal Waste-to-power System Schematic 119
Figure A9.1: Floating Drum Biogas Plant View 125
Figure A9.2: Fixed Dome Biogas Plant View 126
Figure A10.1: Typical Micro-hydroelectric Power Scheme 131
Figure A12.1: Conduit-type Intake System for a Large Hydroelectric Power Plant 144
Figure A13.1: Diesel-electric Power Plant Schematic 150
Figure A14.1: Combined Cycle Gas Turbine Power Plant 158
Figure A14.2: Simple Cycle and Combined Cycle Gas Turbine Layouts 159
Figure A15.1: Pulverized Coal-steam Electric Power Plant Schematic 165
Figure A15.2: Heat Rate Improvements from SuperCritical Steam Conditions 167
Figure A16.1: Coal-IGCC Power System Schematic 176
Figure A17.1: AFBC Process Schematic 184
Figure A18.1: Oil-fired Steam-electric Power Plant 191
Figure A19.1: Gas-fired Microturbine Power System 197
Figure A20.1: Operating Principles of a Fuel Cell 203
Figure A21.1: Fossil Fuel Price Assumptions 227
Figure A21.2: Procedure for Estimating LNG Prices 228
Figure A21.3: JSIM Location Factor for Southeast Asia (2002) 230
Figure A23.1: Off-grid Forecast Capital Cost 251
Figure A23.2: Mini-grid Forecast Capital Cost 252
Figure A23.3: Grid-connected (5-50 MW) Forecast Capital Cost 253
Figure A23.4: Grid-connected (50-300 MW) Forecast Capital Cost 254
Figure A23.5: Off-grid Forecast Generating Cost 255
Figure A23.6: Mini-grid Forecast Generating Cost 256
Figure A23.7: Grid-connected (5-50 MW) Forecast Generating Cost 257
Figure A23.8: Grid-connected (50-300 MW) Forecast Generating Cost 258
Figure A23.9: Coal-fired (300-500 MW) Forecast Generating Cost 259
CONTENTS

Acronyms and Abbreviations
ACSR aluminum conductor steel reinforced
AD anaerobic digestion
AFBC atmospheric fluidized bed combustion
AFUDC allowance for funds used during construction
AHEC Alternate Hydro Energy Centre
BoS balance of system
CCGT combined cycle gas turbine
CFB circulating fluidized bed
CHP combined heat and power
CT combustion turbine
DD direct drive
DFIG doubly-fed induction generator
DRR dose-response relationship
DSS direct solar steam
EGS engineered geothermal systems
EnTEC Energy Technologies Enterprises Corporation
EPC engineering, procurement and construction
EPRI Electric Power Research Institute
ESHA European Small Hydro Association
ESP electrostatic precipitator
EWEA European Wind Energy Association
FGD flue gas desulfurization
FY fiscal year (July 1-June 30)
GDP gross domestic product
GEA Global Energy Associates, Inc.
GEF Global Environment Facility
xv

TECHNICAL AND ECONOMIC ASSESSMENT OF OFF-GRID, MINI-GRID AND GRID ELECTRIFICATION TECHNOLOGIES
xvi
GHGs Greenhouse gases
HRSG heat recovery steam generator
HRT hydraulic retention time
IAP infrastructure action plan
IBRD International Bank for Reconstruction and Development
IC internal combustion
ICB international competitive bidding
IDA International Development Association
IEA International Energy Agency
IGCC integrated gasification combined cycle
IN-SHP International Network for Small Hydro Power
JICA Japan International Cooperation Agency
LAC Latin America and Caribbean
LHV lower heating value
LNG liquefied natural gas
LPG liquefied petroleum gas
MCFC molten carbonate fuel cell
MENA Middle East North Africa
MDGs Millennium Development Goals
MSW municipal solid waste
NERC North American Reliability Council
NREL National Renewable Energy Laboratory
O&M operation and maintenance
PAFC phosphoric acid fuel cell
PC pulverized coal
PEFC polymer electrolyte fuel cell
PERI Princeton Energy Resources International
PM particulate matter
PV photovoltaic
RE renewable energy
RETs renewable energy technologies
RoR run-of-the-river
RPM resolutions per minute
SC SuperCritical
SCR selective catalytic reduction
xvii
ACRONYMS AND ABBREVIATIONS
SHP small hydro power
SNCR selective noncatalytic reduction
SOFC solid oxide fuel cell
SPV solar photovoltaic
SVC Static VAR Compensato
TAG Technical Assessment Guide
TCR total capital requirement
T&D transmission and distribution
TPC total plant cost
TPI total plant investment
USC UltraSuperCritical
USDoE The United States Department of Energy

xviii
AC alternating current
C celsius
DC direct current
F fahrenheit
Kg kilogram (s)
kV kilo volt
kW kilo watt (s)
kWh kilo watt (s) per hour
m meter (s)
MW mega watt (s)
PPM parts per million
V volt
W watt
Units of Measure

xix
C carbon
CaSO4 calcium sulfate
CO carbon monoxide
CO2 carbon dioxide
CH4 methane
H hydrogen
HCl hydrogen chloride
Hg mercury
H2S hydrogen sulfide
K potassium
N nitrogen
NA sodium
NOx nitrogen oxides
NH3 ammonia
O oxygen
SiO2 silica
SO2 sulfur dioxide
SOx sulfur oxides
Chemical Symbols

Foreword
Helping power sector planners in developing economies to factor in emerging electrificationtechnologies and configurations is essential to realizing national electrification agendas atminimum cost. New generation technologies, especially based on renewable energy (RE),and new electrification approaches, especially based on stand-alone mini-grids or off-gridconfigurations, are part of the growing complexity which electrification policy makers andpower system planners must be able to factor into their investment programs.
This report is part of the Energy and Water Department’s commitment to providing newtechniques and knowledge which complement the direct investment and other assistance toelectrification as provided by the International Bank for Reconstruction and Development(IBRD) and the International Development Association (IDA).
Our hope is that it will stimulate discussion among practitioners both within the World Bankand, in the larger community of power system planners. We note that the findings andresults are imperfect at best and that much additional analytic work is required to keep upwith the growing variety of power generation technologies and increasing complexity offormulating least-cost power sector development and electrification plans.
Jamal SaghirDirector
Energy and Water DepartmentChair, Energy and Mining Sector Board
The World Bank
xxi

Acknowledgments
The electrification assessment study was undertaken by a team comprising Toyo EngineeringCorporation, Chubu Electric Power Co. Inc., Princeton Energy Resources International (PERI),Energy Technologies Enterprises Corp (EnTEC), and Global Energy Associates, Inc (GEA).The report itself was prepared by several authors including Mr. K. R. Umesh (Toyo EngineeringCompany), Mr. Takashi Nakase, Mr. Keiichi Yoneyama and Toshiomi Sahara (Chubu ElectricPower Company), Mr. Stratos Tavoulareas (EnTEC), Mr. Mahesh Vipradas (TERI) andMr. Grayson Heffner (GEA). Mr. Chuck McGowan of Electric Power Research Institute (EPRI),and Mr. Joe Cohen and Mr. John Rezaiyan of PERI provided many helpful comments on thetechnical and economic assumptions underlying our assessment. The study and reportpreparation were managed by Mr. Masaki Takahashi of the Energy and Water Departmentwith the assistance of Mr. Anil Cabraal.
The study team members and the World Bank staff would like to dedicate this report to thememory of Dr. Tom Schweizer of Princeton Energy Resources International (PERI) who passedaway last year as the assessment phase of the study was nearing completion. Tom was adedicated and invaluable colleague always ready to cooperate and offer his servicesand advice.
Please address any questions or comments about this report to Mr. Masaki Takahashi([email protected]).
xxiii

Executive Summary
Background
Today’s levels of energy services fail to meet the needs of the poor. Worldwide, two billionpeople rely on traditional biomass fuels for cooking and 1.6 billion people do not haveaccess to electricity. Unless investments in providing modern energy services are expandedsignificantly, this number is expected to actually increase over the next 30 years (InternationalEnergy Agency [IEA], 2002). This lack of access to quality energy services, especially electricity,is a situation which entrenches poverty, constrains the delivery of social services, limitsopportunities for women and girls, and erodes environmental sustainability at the local,national and global levels. Ignoring the situation will undermine economic growth andexacerbate the health and environmental problems now experienced in many parts ofthe world.
Developing and transition countries face huge investments in providing the energy accessneeded to achieve the Millennium Development Goals (MDGs). The IEA estimates theelectricity sector investment requirements in developing countries to reach the MDG goal ofhalving poverty to be US$16 billion annually over the next 10 years (IEA, 2004). Mobilizingsuch investment and, in particular, undertaking the challenges of rural electrification willrequire strong political determination, a willingness to prioritize electrification within theoverall development agenda and considerable skill in the selection and implementation oftechnical and economic strategies for electrification.
Experience throughout the world has shown that there is no single or unique way of achievingelectrification, either from a financing and implementation viewpoint or from anelectrification technology viewpoint. Furthermore, the range of electrification technologiesis constantly expanding, and the factors determining the ultimate affordability, availabilityand sustainability of a particular electrification scheme are becoming increasingly complex.Developments in generation technology and electrification business models have resulted
xxv
TECHNICAL AND ECONOMIC ASSESSMENT OF OFF-GRID, MINI-GRID AND GRID ELECTRIFICATION TECHNOLOGIES
xxvi
in increasing diversity in how electricity is generated and delivered to end users, includinggrid-connected mini-grid and off-grid arrangements.
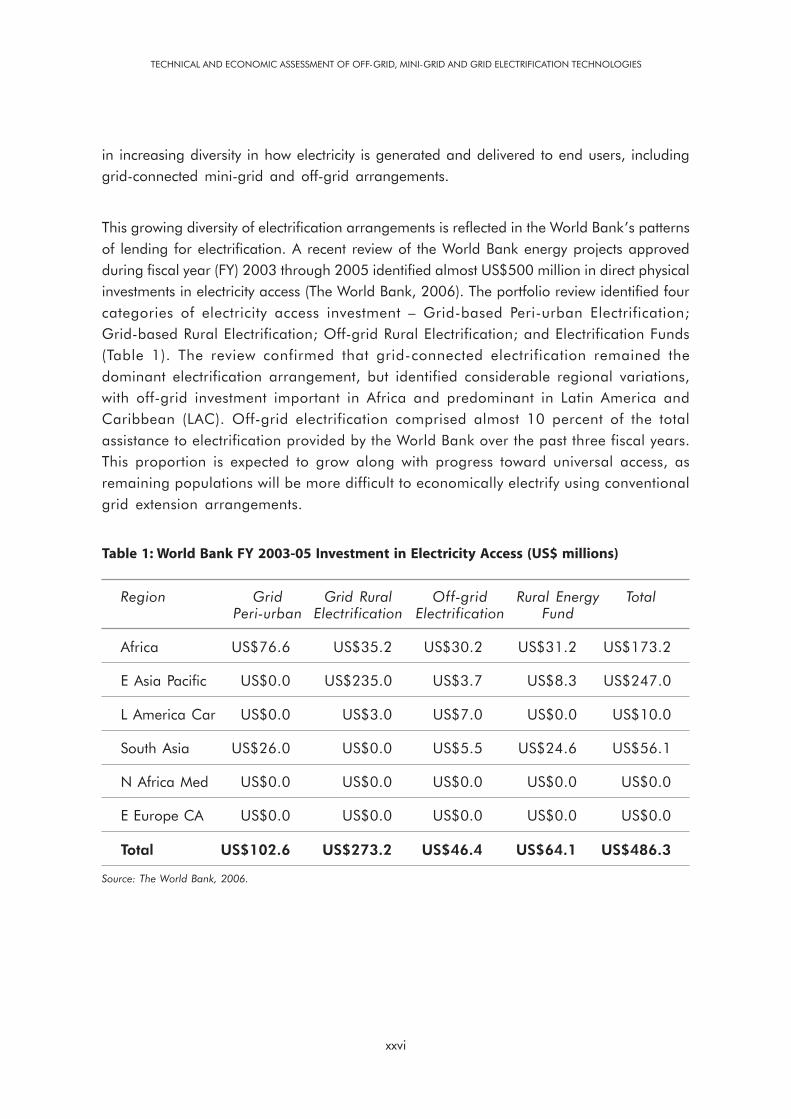
This growing diversity of electrification arrangements is reflected in the World Bank’s patternsof lending for electrification. A recent review of the World Bank energy projects approvedduring fiscal year (FY) 2003 through 2005 identified almost US$500 million in direct physicalinvestments in electricity access (The World Bank, 2006). The portfolio review identified fourcategories of electricity access investment – Grid-based Peri-urban Electrification;Grid-based Rural Electrification; Off-grid Rural Electrification; and Electrification Funds(Table 1). The review confirmed that grid-connected electrification remained thedominant electrification arrangement, but identified considerable regional variations,with off-grid investment important in Africa and predominant in Latin America andCaribbean (LAC). Off-grid electrification comprised almost 10 percent of the totalassistance to electrification provided by the World Bank over the past three fiscal years.This proportion is expected to grow along with progress toward universal access, asremaining populations will be more difficult to economically electrify using conventionalgrid extension arrangements.
Table 1: World Bank FY 2003-05 Investment in Electricity Access (US$ millions)
Region Grid Grid Rural Off-grid Rural Energy TotalPeri-urban Electrification Electrification Fund
Africa US$76.6 US$35.2 US$30.2 US$31.2 US$173.2
E Asia Pacific US$0.0 US$235.0 US$3.7 US$8.3 US$247.0
L America Car US$0.0 US$3.0 US$7.0 US$0.0 US$10.0
South Asia US$26.0 US$0.0 US$5.5 US$24.6 US$56.1
N Africa Med US$0.0 US$0.0 US$0.0 US$0.0 US$0.0
E Europe CA US$0.0 US$0.0 US$0.0 US$0.0 US$0.0
Total US$102.6 US$273.2 US$46.4 US$64.1 US$486.3
Source: The World Bank, 2006.
xxvii
Purpose
The purpose of this report is to convey the results of an assessment of the current and futureeconomic readiness of electric power generation alternatives for developing countries.The objective of the technical and economic assessment was to systematically characterizethe commercial and economic prospects of renewable and fossil fuel-fired electricitygeneration technologies now, and in the near future.
Our hope is that this assessment will be useful to electrification planners concerned withanticipating technological change in the power sector over the next 10 years, especially asregards emerging RE technology, new prime mover technology and hybrid configurationswhich can potentially deliver improved performance and better economics for a givenelectrification situation. We also wanted to provide these planners and policy makers withsystematic comparisons of the economics of various technologies when configured ingrid-connected, mini-grid and off-grid applications.
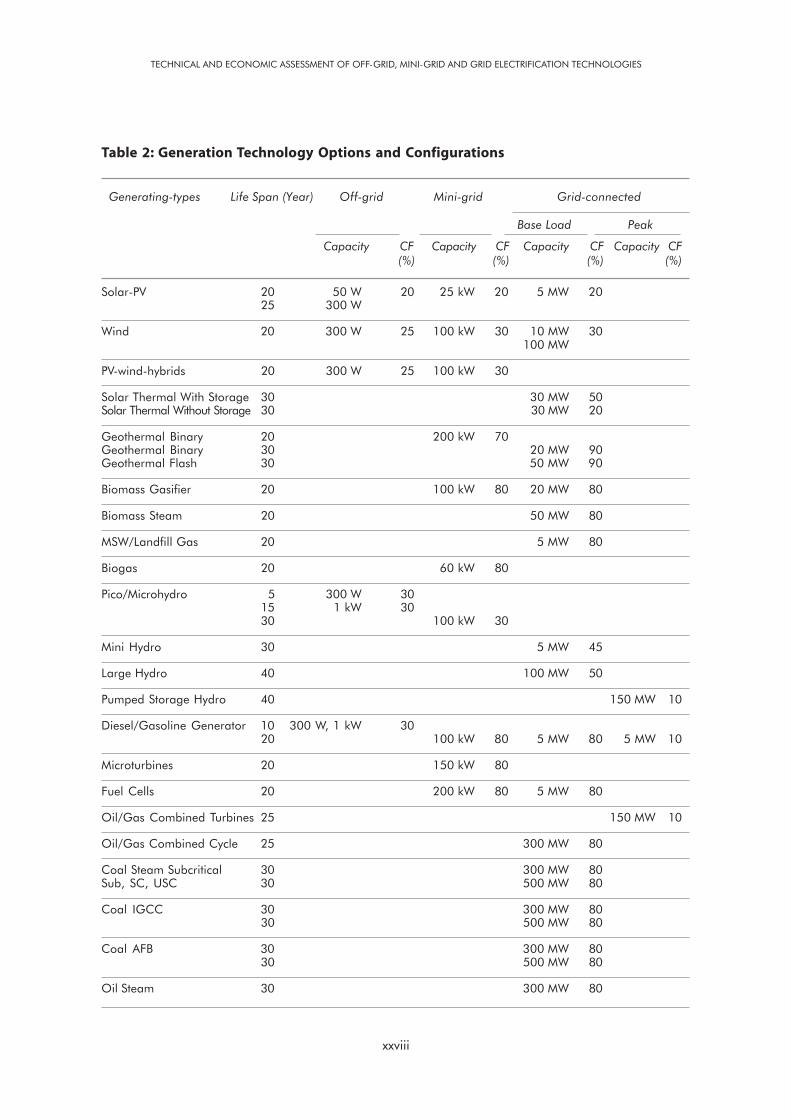
Scope
We examined power generation technologies across a size range of 50 watt (W) to500 mega watt (s) (MW) organized into three distinct electricity delivery configurations:off-grid, mini-grid and grid (Table 2). Generation technologies examined included renewableenergy technologies (RETs), (photovoltaic [PV], wind, geothermal, hydro,biomass-electric, biogas-electric); conventional generation technologies (gasoline or dieselgenerator; oil/gas steam-electric, combustion turbines (CTs) and combined cycle;coal-fired steam-electric); and emerging technologies (integrated gasification combinedcycle [IGCC], Atmospheric Fluidized Bed Combustion [AFBC], fuel cells and microturbines).The economic assessment was performed for three different time periods (2005, 2010 and2015) in order to incorporate projected cost reductions from scaling-up of emergingtechnologies. A levelized analysis of capital and generation costs was conducted in economic,rather than financial terms, to allow generic applications of results to any developing country.Capital and generation cost projections incorporated uncertainty analysis, allowing theresults to reflect sensitivity to key input assumptions. The study results make it possible tocompare the levelized economic costs of electricity technologies over a broad range ofdeployment modes and demand levels, both at present, and in the future.
EXECUTIVE SUMMARY
TECHNICAL AND ECONOMIC ASSESSMENT OF OFF-GRID, MINI-GRID AND GRID ELECTRIFICATION TECHNOLOGIES
xxviii
Table 2: Generation Technology Options and Configurations
Generating-types Life Span (Year) Off-grid Mini-grid Grid-connected
Base Load Peak
Capacity CF Capacity CF Capacity CF Capacity CF(%) (%) (%) (%)
Solar-PV 20 50 W 20 25 kW 20 5 MW 2025 300 W
Wind 20 300 W 25 100 kW 30 10 MW 30100 MW
PV-wind-hybrids 20 300 W 25 100 kW 30
Solar Thermal With Storage 30 30 MW 50Solar Thermal Without Storage 30 30 MW 20
Geothermal Binary 20 200 kW 70Geothermal Binary 30 20 MW 90Geothermal Flash 30 50 MW 90
Biomass Gasifier 20 100 kW 80 20 MW 80
Biomass Steam 20 50 MW 80
MSW/Landfill Gas 20 5 MW 80
Biogas 20 60 kW 80
Pico/Microhydro 5 300 W 3015 1 kW 3030 100 kW 30
Mini Hydro 30 5 MW 45
Large Hydro 40 100 MW 50
Pumped Storage Hydro 40 150 MW 10
Diesel/Gasoline Generator 10 300 W, 1 kW 3020 100 kW 80 5 MW 80 5 MW 10
Microturbines 20 150 kW 80
Fuel Cells 20 200 kW 80 5 MW 80
Oil/Gas Combined Turbines 25 150 MW 10
Oil/Gas Combined Cycle 25 300 MW 80
Coal Steam Subcritical 30 300 MW 80Sub, SC, USC 30 500 MW 80
Coal IGCC 30 300 MW 8030 500 MW 80
Coal AFB 30 300 MW 8030 500 MW 80
Oil Steam 30 300 MW 80
xxix
Findings
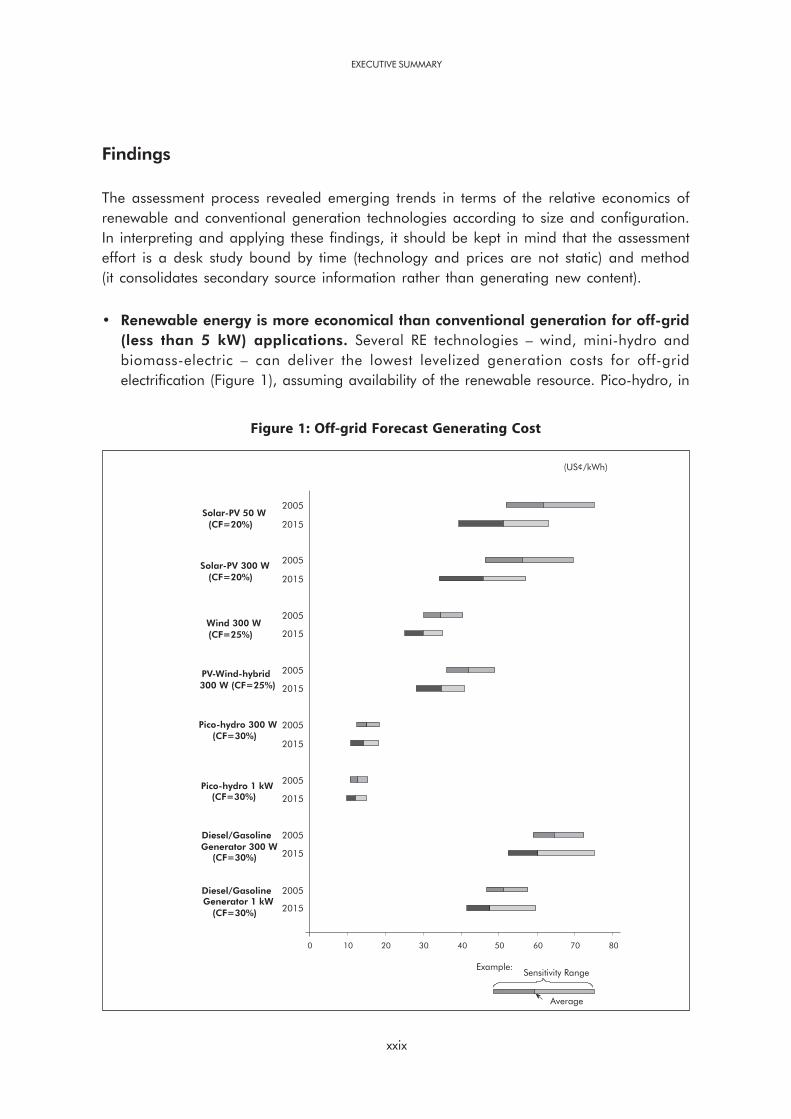
The assessment process revealed emerging trends in terms of the relative economics ofrenewable and conventional generation technologies according to size and configuration.In interpreting and applying these findings, it should be kept in mind that the assessmenteffort is a desk study bound by time (technology and prices are not static) and method(it consolidates secondary source information rather than generating new content).
• Renewable energy is more economical than conventional generation for off-grid(less than 5 kW) applications. Several RE technologies – wind, mini-hydro andbiomass-electric – can deliver the lowest levelized generation costs for off-gridelectrification (Figure 1), assuming availability of the renewable resource. Pico-hydro, in
EXECUTIVE SUMMARY
Figure 1: Off-grid Forecast Generating Cost
(US¢/kWh)
0 10 20 30 40 50 60 70 80
2005
2015
2005
2015
2005
2015
2005
2015
2005
2015
2005
2015
2005
2015
2005
2015
Diesel/GasolineGenerator 1 kW
(CF=30%)
Diesel/Gasoline
Generator 300 W(CF=30%)
Pico-hydro 1 kW(CF=30%)
Pico-hydro 300 W
(CF=30%)
PV-Wind-hybrid
300 W (CF=25%)
Wind 300 W
(CF=25%)
Solar-PV 300 W
(CF=20%)
Solar-PV 50 W
(CF=20%)
Average
Sensitivity RangeExample:
TECHNICAL AND ECONOMIC ASSESSMENT OF OFF-GRID, MINI-GRID AND GRID ELECTRIFICATION TECHNOLOGIES
xxx
particular, can deliver electricity for US¢10-20/kilo watt (s) per hour (kWh), less thanone-quarter of the US¢40-60/kWh for comparably-sized gasoline and diesel enginegenerators. Even relatively expensive RET (solar PV) is comparable in levelized electricitycosts to the small fuel-using engine generators under 1 kilo watt (s) (kW) in size.
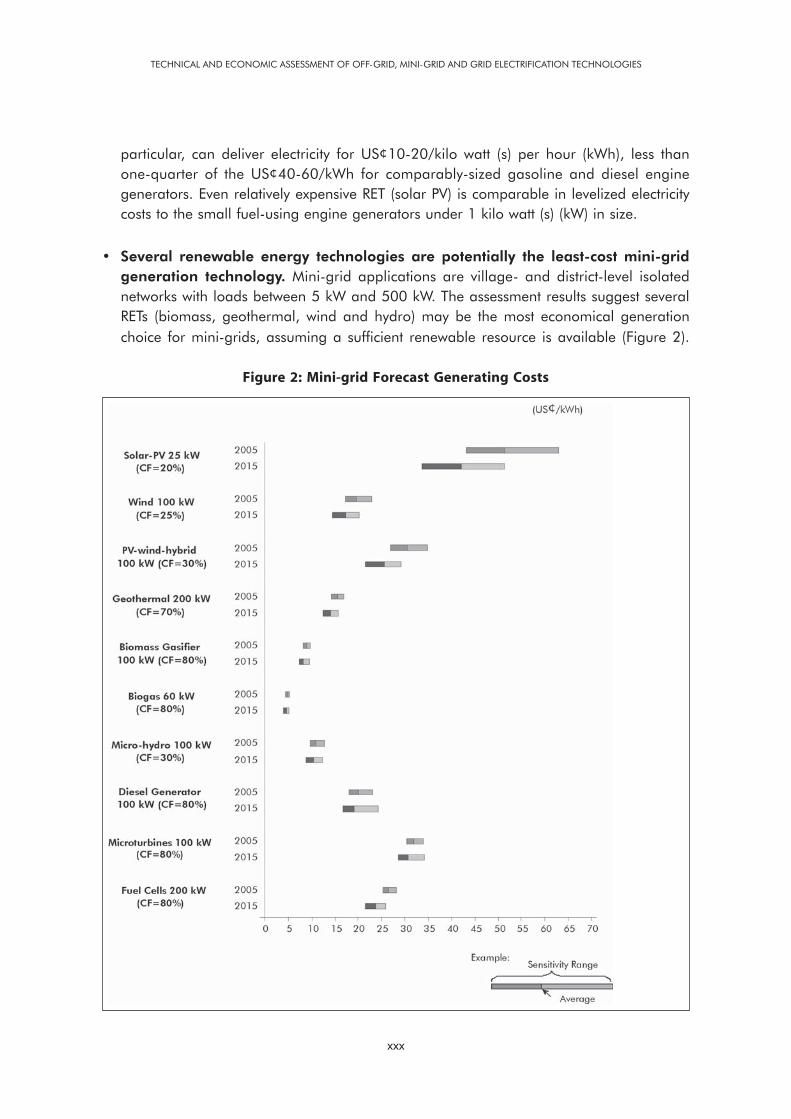
• Several renewable energy technologies are potentially the least-cost mini-gridgeneration technology. Mini-grid applications are village- and district-level isolatednetworks with loads between 5 kW and 500 kW. The assessment results suggest severalRETs (biomass, geothermal, wind and hydro) may be the most economical generationchoice for mini-grids, assuming a sufficient renewable resource is available (Figure 2).
Figure 2: Mini-grid Forecast Generating Costs
xxxi
EXECUTIVE SUMMARY
Two biomass technologies – biogas digesters and biomass gasifiers – seem particularlypromising, due to their high capacity factors and availability in size ranges matched tomini-grid loads. Since so many RE sources are viable in this size range, mini-grid plannersshould thoroughly review their options to make the best selection.
• Conventional power generation technologies (open cycle and combined cyclegas turbines [CCGTs], coal- and oil-fired steam turbines) remain moreeconomical for most large grid-connected applications, even with increasesin oil price forecasts (Figure 3). Site-specific considerations, such as load profile,demand and cost differentials between oil, natural gas and coal prices, determinewhich configuration is the least expensive. Using SuperCritical or UltraSuperCritical(USC) for very large (over 500 MW) power plants is most cost-effective when fuelprices are high and carbon dioxide (CO2) reductions are sought.
• Two new coal technologies have considerable potential for developing economies.Two new coal-fired power plant technologies – Integrated Gasification Combined Cycle(IGCC) and AFBC – are attracting considerable attention by planners of large powergrids in countries with coal or lignite reserves. AFBC is already commercially availableup to 300 MW size, and is used widely worldwide, including China and India. Thistechnology is competitive in situations where low quality inexpensive fuel is availableand when sulfur dioxide (SO2) emission regulations require a wet scrubber. In the 100 to300 MW range, the circulating fluidized bed (CFB) option is preferable. The AFBC optionmay also be applicable to smaller thermal power plants (under 100 MW) using biomassand municipal solid wastes (MSW). IGCC is in the early commercialization stage andcould become a viable and competitive option in the future given its excellentenvironmental performance (Figure 3).
Considerations for Power System Planners
Power system planners generally operate on an incremental basis, with new capacityadditions selected to accommodate the location and pace of load growth on a least-costbasis. The findings provided here suggest that scale is a critical aspect affecting the economicsof different generation configurations. When the national or regional grid is developedand includes sufficient transmission capacity, and incremental load growth is fast, large,central-station gas combined cycle and coal-fired power plants would clearly be theleast-cost alternatives. However, if the size of the grid is limited, or the incremental loadgrowth is small, it may make economic sense to add several smaller power stations ratherthan one very large power station. Taking advantage of local resources such as indigenouscoal, gas, biomass or geothermal or wind or hydro, and constructing smaller power stations,

TECHNICAL AND ECONOMIC ASSESSMENT OF OFF-GRID, MINI-GRID AND GRID ELECTRIFICATION TECHNOLOGIES
xxxii
Figure 3: Grid-connected Forecast Generating Costs (US¢/kWh)
See Annex 4 for results for more grid-connected applications.
may provide energy security and avoid some of the uncertainty associated with internationalfuel prices as well as the risk associated with financing and constructing very largepower plants.
Recommendations for Future Work
The findings described above suggest that choosing generation technologies andelectrification arrangements is becoming a more complicated process. New technologies

xxxiii
1 See, for example, “A Level Playing Field for Renewables: Accounting for the Other Externality Benefits.” Shimon Awerbach, University of Sussex.Presented to the European Conference for Renewable Energy: Intelligent Policy Options, January 20, 2004.
are becoming more economical and technologically mature, uncertainty in fuel and otherinputs is creating increasing risk regarding future electricity costs, and old assumptionsabout economies of scale in generation may be breaking down. The assessment methodsused here provide a useful comparison among technologies, but need further refinementbefore becoming the basis of national or regional electrification plans. Accounting for thelocational and stochastic variability of renewable resources, as well as balancing costs,land costs, labor and transport costs, all need further investigation, as does the method ofaccounting for the incremental cost of delivering electricity. The need to accommodateenvironmental externalities in the economic assessment also needs more attention.Finally, the relative economics of conventional vs. RE is largely driven by forecasts of fuelprices together with certain construction and manufacturing materials prices, such as steel,concrete, glass and silicon. All these commodity prices are increasingly subject to uncertaintiesand price fluctuations in possibly countervailing directions, which make forecasts of futuregeneration costs extremely uncertain. Additional work, including use of hedging or otherfinancial risk mitigation instruments, is needed to quantify and reflect these future fuel andcommodity price uncertainties as part of the electrification planning process.1
EXECUTIVE SUMMARY

1
1. Introduction
This power generation technology assessment study is motivated by the World Bank’srenewed commitment to both infrastructure development generally, and scaling up accessto electricity, in particular. This renewed commitment to the importance of infrastructurewithin the overall development agenda is described in the 2003 infrastructure action plan(IAP), a comprehensive management tool, which will guide the World Bank Group’sinfrastructure business for the next few years. The action plan emphasizes more investments,as well as country diagnostic work and encouragement of more private participation, inorder to reposition infrastructure as a key contributor to achieving the MillenniumDevelopment Goals (MDGs) (The World Bank, 2003).
Embedded within the Infrastructure Action Plan are commitments by the World Bank Groupto scale up both investments in modern energy for the urban and rural poor, and its supportfor renewable energy (RE) development. Between 1994 and 2004, the World Bank(International Bank for Reconstruction and Development [IBRD] and InternationalDevelopment Association [IDA]) commitment in the power sector has totaled US$17 billion,a level that the IAP proposes to substantially increase. During the same period, IBRD andIDA commitments, together with carbon (C) financing and Global Environment Facility (GEF)cofinancing for RE, specifically, has totaled US$6 billion (The World Bank, 2005). At the2004 Bonn International Conference on Renewable Energy, the World Bank Group agreedto increase its RE support by 20 percent each year for the next five years. Increasedcommitment by the World Bank Group in these two overlapping areas is essential, as thecommitments made in Bonn by the developing countries alone is US$10 billion per yearfor the next 10 years, while annual power sector investment needs in developing and transitioncountries are expected to average US$280 billion per year – twice the level of investment inprevious years (International Energy Agency [IEA], 2004).
Carrying out these global commitments, to scaling up access to electricity and investmentin RE, requires the most up to date information on technologies and energy economicsavailable. Assessment of the technical, economic and commercial prospects for electricity
TECHNICAL AND ECONOMIC ASSESSMENT OF OFF-GRID, MINI-GRID AND GRID ELECTRIFICATION TECHNOLOGIES
2
generation and delivery technologies is needed in order to make intelligent decisionsregarding investments in delivering electricity services at the lowest economic cost, andwith maximum social and environmental benefits. An up to date electricity generationand delivery knowledge base in an easily accessible form will help in providing the
information needed for countries to incorporate the latest technology developments intheir national electrification plans.
Technologies for power generation and delivery continue to emerge and find commercialapplication. New prime mover technology, emerging renewable technology, new and hybridconfigurations combining to deliver improved power plant attributes and better economicsof small systems, all combine to create a broad spectrum of choice for power system planning
on a national, provincial, local, and even household level. The technical and economicassessment of electrification technologies provided here seeks to characterize and organizethis broad spectrum of technology choice for urban and rural energy planners.
Purpose and Scope
The purpose of this report is to provide a technical and economic assessment ofcommercially available and emerging power generation technologies. The study wasdesigned to cover the widest possible range of electrification applications faced byenergy services delivery and power system planners, whether supply is provided through
grid networks or stand-alone or mini-grid configurations. The assessment was conductedusing a standard approach and is presented in a consistent fashion for each powergeneration technology configuration. The assessment time frame includes current statusand forecast development trends over the period 2005-15, while the economicassessment considers a range of typical operating conditions (peak, off-peak) and grid
configurations (off-grid, mini-grid, interconnected grid) for various scales of demand.The technology characterization reflects the current stage of commercialization,including indicative cost reduction trends over 10 years. The study outputs allows forcomparison of levelized electricity costs for the full spectrum of electrificationtechnologies over a matrix of deployment modes and demand levels.
Methodology
The methodology comprises a five-step process. First, a technology assessment wasundertaken for each candidate generation technology. The assessment covered
operating principles, application for electrification purposes and prospects for performanceimprovement and capital cost reduction. An environmental characterization came next,

3
which focused on typical environmental impacts from normal operations using typicalemission control measures and costs.2 The assessment assumes use of emission controls inaccordance with the World Bank environmental guidelines; these costs are included inthe economic assessment. The third step was a capital cost assessment using a standardmathematical model and actual cost data (where available) and reflecting typicaldeployment.3 Future capital costs of generation were then developed, based ontechnology forecasts (for example, learning curves) and incorporating uncertainties inequipment cost, fuel cost and capacity factor. The uncertainty analysis is a parametricanalysis of variability in key inputs and generates a band of maximum and minimumcosts for each period (2005, 2010 and 2015). Finally, levelized generating costs werecalculated using a consistent economic analysis method, but differentiated accordingto deployment conditions. This last step also included an uncertainty analysis on theinputs to the levelized cost calculation, again generating a band of maximum andminimum costs for the 2005, 2010 and 2015 periods. All cost estimates were developedfor a single reference location (India) to minimize any site-specific discrepancies whencomparing technologies.
Costing Formulations and Projections
We selected commonly used formulations of capital costs and generation costs fromthe engineering economics literature. Capital cost is calculated on a unit basis(per [kilo watt (s) kW]) as the sum of equipment costs (including engineering) plus civil,construction and physical contingency costs. Operating costs are simply the sum of fixedand variable operation and maintenance (O&M) costs plus fuel costs expressed on a perunit output basis. Land cost is not included.
We define generating cost as the sum of capital cost and operating cost, expressed on alevelized unit cost basis (US$ per [kilo watt (s) per hour] kWh), with levelizing conducted overthe economic life of the plant. Levelizing is done using a 10 percent real discount rate thatis assumed to be the opportunity cost of capital.4
INTRODUCTION
2 Capital and operating cost calculations assume generating equipment complies with the World Bank environmentalguideline (Pollution Prevention and Abatement Handbook, July 1998). The Emission Standards are: (i) SOx (sulfur oxides)– <500 MW (mega watt (s) : 0.2 tpd/MW, or <2000 mg/Nm3; (ii) NOx (nitrogen oxides – Coal: 750 mg/Nm3; Oil:460; Gas:320; Gas Turbine:125 for gas; 165 for diesel; 300 for fuel oil; and (iii) PM – 50 mg/Nm3.3 As described in the Annexes, the cost assessment utilized a cost formulation based on the Electric Power ResearchInstitute's Technical Assessment Guide (TAG).4 Detailed formulation of these cost equations is provided in Annex 2.
TECHNICAL AND ECONOMIC ASSESSMENT OF OFF-GRID, MINI-GRID AND GRID ELECTRIFICATION TECHNOLOGIES
4
The analysis was conducted on an economic, rather than a financial basis. An economicanalysis assesses the opportunity costs for the project; transfer payments such as taxes,duties, interest payments (including interest during construction) and subsidies are notincluded. Similarly, physical contingencies are included in the analysis, but pricecontingencies are not. The analysis is done in real 2004 US$. The environmentalcosts/benefits of a particular technology are given in physical quantities without any attemptat monetary valuation, as such valuations must be country- and site-specific.
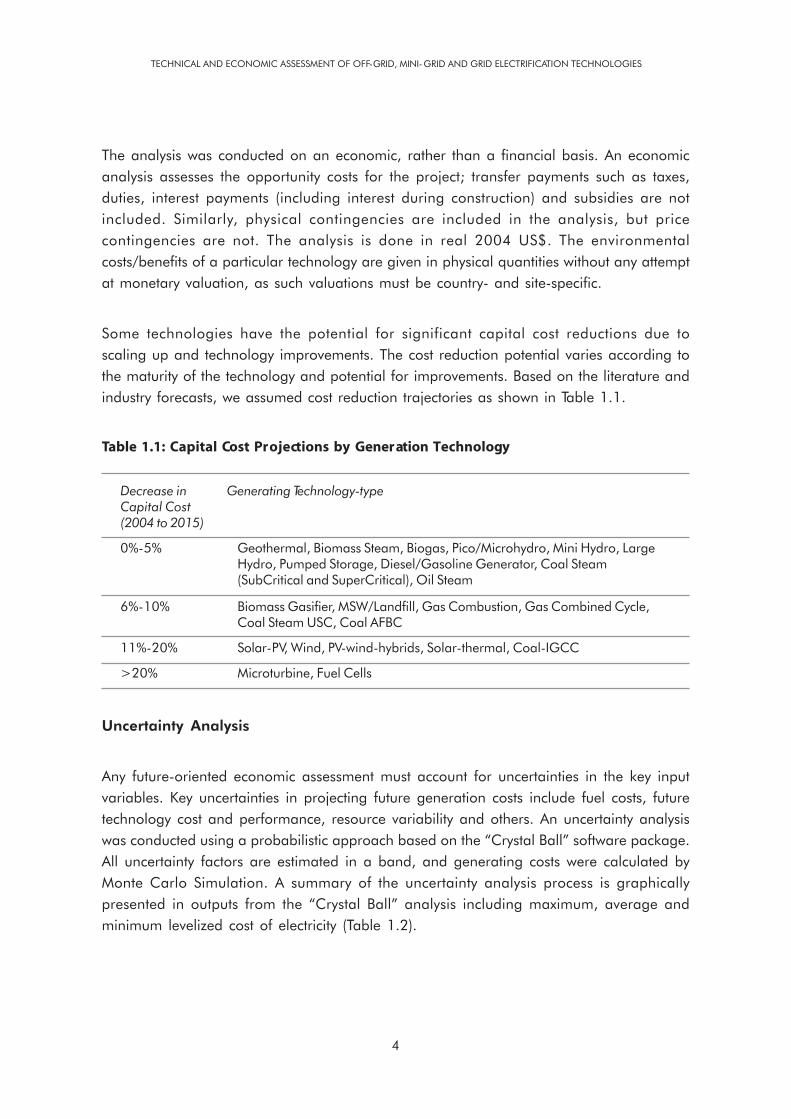
Some technologies have the potential for significant capital cost reductions due toscaling up and technology improvements. The cost reduction potential varies according tothe maturity of the technology and potential for improvements. Based on the literature andindustry forecasts, we assumed cost reduction trajectories as shown in Table 1.1.
Table 1.1: Capital Cost Projections by Generation Technology
Decrease in Generating Technology-typeCapital Cost(2004 to 2015)
0%-5% Geothermal, Biomass Steam, Biogas, Pico/Microhydro, Mini Hydro, LargeHydro, Pumped Storage, Diesel/Gasoline Generator, Coal Steam(SubCritical and SuperCritical), Oil Steam
6%-10% Biomass Gasifier, MSW/Landfill, Gas Combustion, Gas Combined Cycle,Coal Steam USC, Coal AFBC
11%-20% Solar-PV, Wind, PV-wind-hybrids, Solar-thermal, Coal-IGCC
>20% Microturbine, Fuel Cells
Uncertainty Analysis
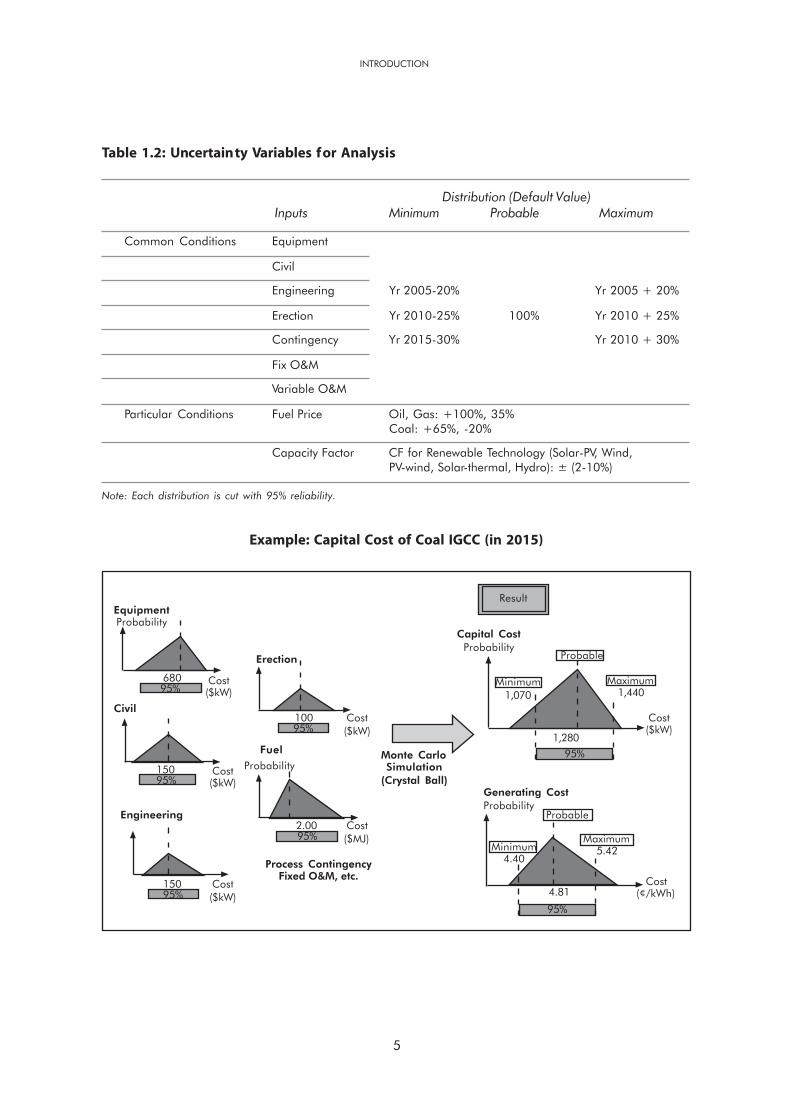
Any future-oriented economic assessment must account for uncertainties in the key inputvariables. Key uncertainties in projecting future generation costs include fuel costs, futuretechnology cost and performance, resource variability and others. An uncertainty analysiswas conducted using a probabilistic approach based on the “Crystal Ball” software package.All uncertainty factors are estimated in a band, and generating costs were calculated byMonte Carlo Simulation. A summary of the uncertainty analysis process is graphicallypresented in outputs from the “Crystal Ball” analysis including maximum, average andminimum levelized cost of electricity (Table 1.2).
5
INTRODUCTION
Table 1.2: Uncertainty Variables for Analysis
Distribution (Default Value)Inputs Minimum Probable Maximum
Common Conditions Equipment
Civil
Engineering Yr 2005-20% Yr 2005 + 20%
Erection Yr 2010-25% 100% Yr 2010 + 25%
Contingency Yr 2015-30% Yr 2010 + 30%
Fix O&M
Variable O&M
Particular Conditions Fuel Price Oil, Gas: +100%, 35%Coal: +65%, -20%
Capacity Factor CF for Renewable Technology (Solar-PV, Wind,PV-wind, Solar-thermal, Hydro): ± (2-10%)
Note: Each distribution is cut with 95% reliability.
Example: Capital Cost of Coal IGCC (in 2015)
EquipmentProbability
Civil
68095%
Cost($kW)
Erection
15095%
Engineering
Cost($kW)
Probability
15095%
Cost($kW)
2.0095%
Process ContingencyFixed O&M, etc.
Cost($kW)
10095%
Monte CarloSimulation
(Crystal Ball)
Cost($MJ)
Capital CostProbability
Result
Probable
Maximum1,440
Minimum1,070
Cost($kW)
1,280
95%Fuel
Minimum4.40
ProbableProbabilityGenerating Cost
Maximum5.42
4.81
95%
Cost(¢/kWh)
TECHNICAL AND ECONOMIC ASSESSMENT OF OFF-GRID, MINI-GRID AND GRID ELECTRIFICATION TECHNOLOGIES
6
Capacity Factor
Capacity factor is the ratio of the actual energy generated in a given period relative to themaximum possible if the generator produced its rated output all of the time. Capacityfactor is a key performance characteristic, as it expresses the productive output relative tothe installed capacity and allows for capital costs to be expressed in levelized terms.We chose capacity factor rather than availability factor or other expressions of productiveoutput per unit installed capacity because it is unambiguous and universally applicable.
Deployment Venue
Capital cost and operating costs for a given power generation technology can varyconsiderably depending on where the power plant is located. In order to simplify theeconomic assessment, we express all capital costs and operating costs on the basis that thepower plant is constructed in India. This allows extrapolation of capital and operating coststo other deployment venues based on a comparison of available national or regionalbenchmarks (for example, labor rates and fuel delivery surcharges).
Fuel Price Forecasts
Fuel prices used throughout this report are based on the IEA World Energy Outlook 2005forecast. We have levelized the forecast fuel price over the life span of each generatingtechnology assessed, taking into account forecast average price. We incorporated pricefluctuations by allowing a price range of up to 200 percent of forecast base fuel price.The resulting fuel price range for each time frame and each fuel is shown inTable 1.3.
Regional Adjustments
An objective of the assessment was to express all costing information (capital costs andgenerating costs) for the 22 power generation options on the same basis, includingassumed location and fuel supply arrangements. However, all infrastructure capital andoperating costs – engineering, equipment and material, construction, O&M, fuel, evencontingency – vary depending on location. A particularly area-sensitive cost variable islabor, which is an important determinant of both construction and O&M costs.

7
INTRODUCTION
Table 1.3: Fossil Fuel Price Projections
Crude OilUS$/bbl (US$/GJ)
FOB Price of Crude Oil 2005 2010 2015
Crude Oil (Dubai, Brent, WTI) Base 53 (9.2) 38 (6.6) 37 (6.5)
High – 56 (9.8) 61 (10.6)
Low – 24 (4.2) 23 (4.0)
CoalUS$/ton (US$/GJ)
FOB Price of Coal 2005 2010 2015
Coal (Australia) Base 57 (2.07) 38 (1.38) 39 (1.42)
High – 53 (1.92) 56 (2.04)
Low – 30 (1.10) 30 (1.10)
Natural Gas
US$/MMBTU (US$/GJ)
FOB Price of Natural Gas 2005 2010 2015
Gas (U.S., European) Base 7.5 (7.1) 5.1 (4.8) 5.1 (4.8)
High – 7.0 (6.6) 7.6 (7.2)
Low – 4.0 (3.8) 3.3 (3.1)
Note: “–” means no cost needed.
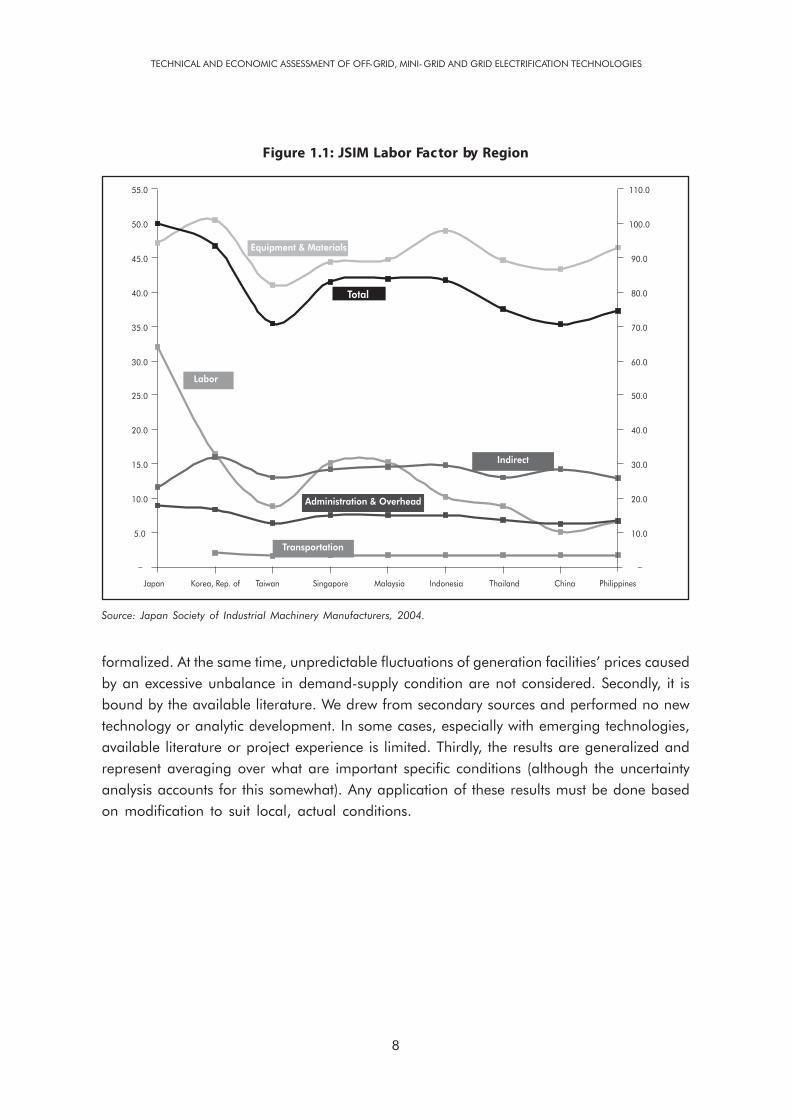
Location factors for the Asian region are provided in Figure 1.1. In addition to the datapresented for developing countries, we also provide data for one industrial economy (Japan).The data shown in Figure 1.1 suggest that the variation in costs of engineering, equipmentand materials is quite small when procurement is done under the international competitivebidding (ICB) or comparable guidelines. The labor costs vary from region to region,depending on the gross domestic product (GDP) and per capita incomes.5
Study Limitations
This study is limited in several ways. First, it is time-bound. It does not reflect new technologydevelopments or new secular trends that have emerged since the terms of reference were
5 Useful references on this topic include: http://www.cia.gov/cia/publications/factbook, http://hdr.undp.org/reports/global/2003, http://www.worldfactsandfigures.com/gdp_country_desc.php, http://stats.bls.gov/fls/hcompsupptabtoc.htm,http://www.ggdc.net/dseries/totecon.html, and http://www-ilo-mirror.cornell.edu/public/english/employment/strat/publ/ep00-5.htm.
TECHNICAL AND ECONOMIC ASSESSMENT OF OFF-GRID, MINI-GRID AND GRID ELECTRIFICATION TECHNOLOGIES
8
Source: Japan Society of Industrial Machinery Manufacturers, 2004.
Figure 1.1: JSIM Labor Factor by Region
5.0
10.0
15.0
20.0
25.0
30.0
35.0
40.0
45.0
50.0
55.0
Japan Korea, Rep. of Taiwan Singapore Malaysia Indonesia Thailand China Philippines
10.0
20.0
30.0
40.0
50.0
60.0
70.0
80.0
90.0
100.0
110.0
Equipment & Materials
Labor
Indirect
Administration & Overhead
Transportation
Total
––
formalized. At the same time, unpredictable fluctuations of generation facilities’ prices causedby an excessive unbalance in demand-supply condition are not considered. Secondly, it isbound by the available literature. We drew from secondary sources and performed no newtechnology or analytic development. In some cases, especially with emerging technologies,available literature or project experience is limited. Thirdly, the results are generalized andrepresent averaging over what are important specific conditions (although the uncertaintyanalysis accounts for this somewhat). Any application of these results must be done basedon modification to suit local, actual conditions.

9
This section presents the detailed technology descriptions and results of the technical andeconomic assessment for 22 selected off-grid, mini-grid and grid electrification technologyapplications. The technology descriptions are presented in three groups – renewable powergeneration technologies, conventional power generation technologies and emerging powergeneration technologies.
Renewable Technologies
Six major renewable energy technologies (RETs) are reviewed in this study – solar photovoltaic(SPV), wind electric, solar thermal electric, geothermal electric, biomass electric andhydroelectric. Within each of these broad categories, there are one, and sometimes severalconfigurations corresponding to combinations, permutations (including size) and hybridarrangements of the individual technologies.
Solar Photovoltaic Power Systems
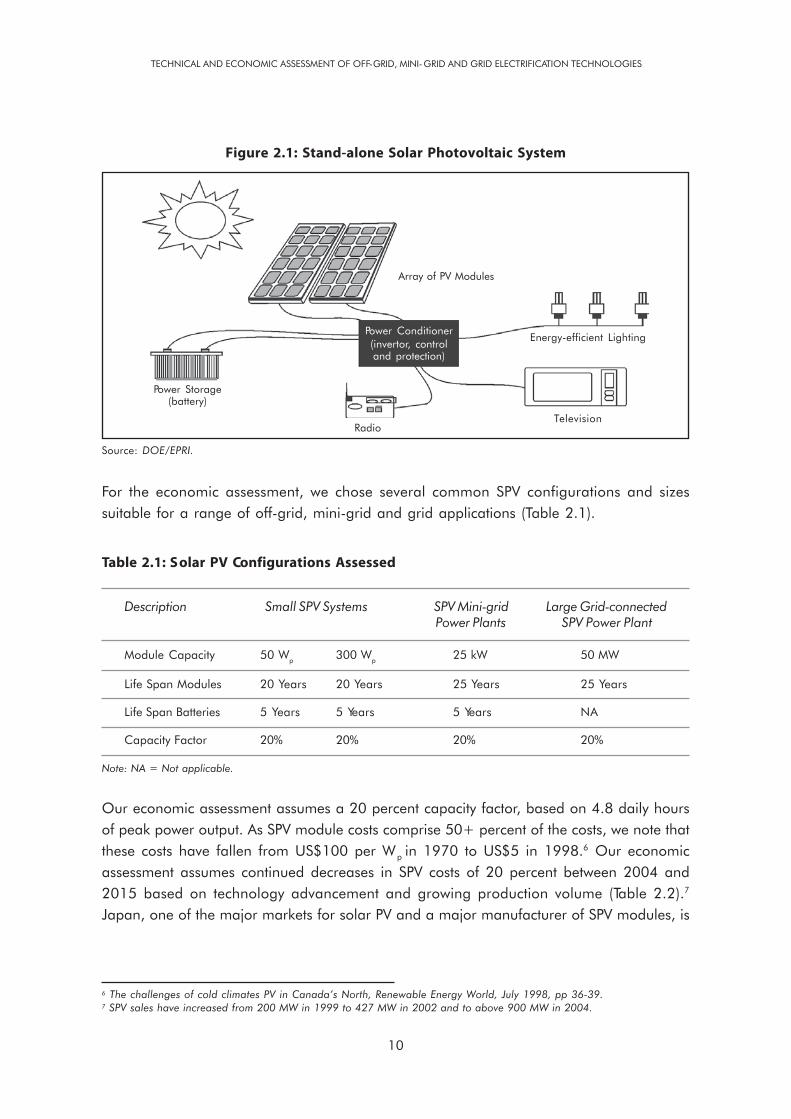
SPV systems utilize semiconductor-based materials (solar cells) which directly convert solarenergy into electricity. First developed in the 50s, SPV technology has steadily fallen in priceand has gained many niche applications, notably as satisfying remote power needs fortelecommunications, pumping and lighting. SPV systems have many attractive features,including modularity, no fuel requirements, zero emissions, no noise and no need forgrid connection. SPV systems can be classified according to three principal applications(Figure 2.1):
• Stand-alone solar devices purpose-built for a particular end use, for example, cathodicprotection, home power and water pumping;
• Small solar power plants designed to provide village-scale electricity; and• Grid-connected SPV power plants.
2. Power GenerationTechnology Assessment
TECHNICAL AND ECONOMIC ASSESSMENT OF OFF-GRID, MINI-GRID AND GRID ELECTRIFICATION TECHNOLOGIES
10
Figure 2.1: Stand-alone Solar Photovoltaic System
Power Storage(battery)
RadioTelevision
Energy-efficient Lighting
Array of PV Modules
Power Conditioner(invertor, controland protection)
Source: DOE/EPRI.
6 The challenges of cold climates PV in Canada’s North, Renewable Energy World, July 1998, pp 36-39.7 SPV sales have increased from 200 MW in 1999 to 427 MW in 2002 and to above 900 MW in 2004.
For the economic assessment, we chose several common SPV configurations and sizessuitable for a range of off-grid, mini-grid and grid applications (Table 2.1).
Table 2.1: Solar PV Configurations Assessed
Description Small SPV Systems SPV Mini-grid Large Grid-connectedPower Plants SPV Power Plant
Module Capacity 50 Wp 300 Wp 25 kW 50 MW
Life Span Modules 20 Years 20 Years 25 Years 25 Years
Life Span Batteries 5 Years 5 Years 5 Years NA
Capacity Factor 20% 20% 20% 20%
Note: NA = Not applicable.
Our economic assessment assumes a 20 percent capacity factor, based on 4.8 daily hoursof peak power output. As SPV module costs comprise 50+ percent of the costs, we note thatthese costs have fallen from US$100 per Wp in 1970 to US$5 in 1998.6 Our economicassessment assumes continued decreases in SPV costs of 20 percent between 2004 and2015 based on technology advancement and growing production volume (Table 2.2).7
Japan, one of the major markets for solar PV and a major manufacturer of SPV modules, is
11
forecasting production cost reductions from 100 yen (¥)/Wp today to ¥75/Wp by 2010 and¥50/Wp by 2030. The solar PV industry in Europe and the United States is targeting costs ofUS$1.5-2.00/Wp within 10 years, based on technological improvements as well as a growthin production volumes of 20-30 percent.
Table 2.2: Targets for SPV Future Costs
Cost Europe United States Japan India
2004 SPV Module Costs €5.71/Wp US$5.12/Wp ¥100/Wp Rs 150/Wp
Target Cost in 2010 €1.5-2/Wp US$1.5-2/Wp ¥75/Wp Rs 126/Wp*(@2.75/Wp)
Expected Cost in 2015 €0.5/Wp NA ¥50/Wp Rs 92/Wp* (US$2/Wp)(in 2030)
Note: NA = Not applicable.
Wind Power Systems
Wind turbines are classified into two types: small (up to 100 kW) and large. Small windturbines are used for off-grid, mini-grid and grid-connected applications, while large windturbines are used exclusively for grid-connected power supply. Wind turbine componentsinclude the rotor blades, generator (asynchronous/induction or synchronous), powerregulation, aerodynamic (Yaw) mechanisms and the tower. Wind turbine componenttechnology continues to improve, including the blades (increasing use of C epoxy andother composite materials to improve the weight/swept area ratio); generators(doubly-fed induction generators and direct-drive synchronous machines providing improvedefficiency over broader wind speed ranges); power regulation (through active stall pitchcontrols); and towers (tubular towers minimize vibration, allow for larger machines to beconstructed and reduce maintenance costs by providing easier access to the nacelle).
The major applications for small wind turbines are charging batteries and supplying electricalloads in direct current (DC) (12 or 24 volts [V]), bus-based off-grid power systems.When configured with a DC alternating current (AC) inverter and a battery bank, the smallwind turbine can deliver power to a village or district mini-grid, usually in a hybridconfiguration with diesel generators or SPV.
Design assumptions regarding wind turbines with output from 0.3 kW to 100,000 kW are shownin Table 2.3. Capacity factors depend on wind speeds at a given location and can vary from20 percent to 40 percent. An average value of 25 percent is assumed with the uncertaintyanalysis incorporating the broader range of likely location-specific capacity factors.
POWER GENERATION TECHNOLOGY ASSESSMENT
TECHNICAL AND ECONOMIC ASSESSMENT OF OFF-GRID, MINI-GRID AND GRID ELECTRIFICATION TECHNOLOGIES
12
8 Renewable Energy Technical Assessment Guide – TAG-RE: 2004, EPRI, 2004.9 Wind Energy – The Facts, Vol. 2: Costs and Prices, EWEA, 2003.
900
800
700
600
500
400
300
2000 2005 2010 2015 2020 2025
Year
Proje
ct C
ost
(€/k
W)
Source: European Wind Energy Association.
Figure 2.2: Projected Wind Power Costs, 2000-25
Table 2.3: Wind Turbine Performance Assumptions
Capacity 300 W 100 kW 10 MW 100 MW
Capacity Factor (%) 25 25 30 30
Life Span (year) 20 20 20 20
Annual Gross Generated Electricity (MWh) 0.657 219 26,280 262,800
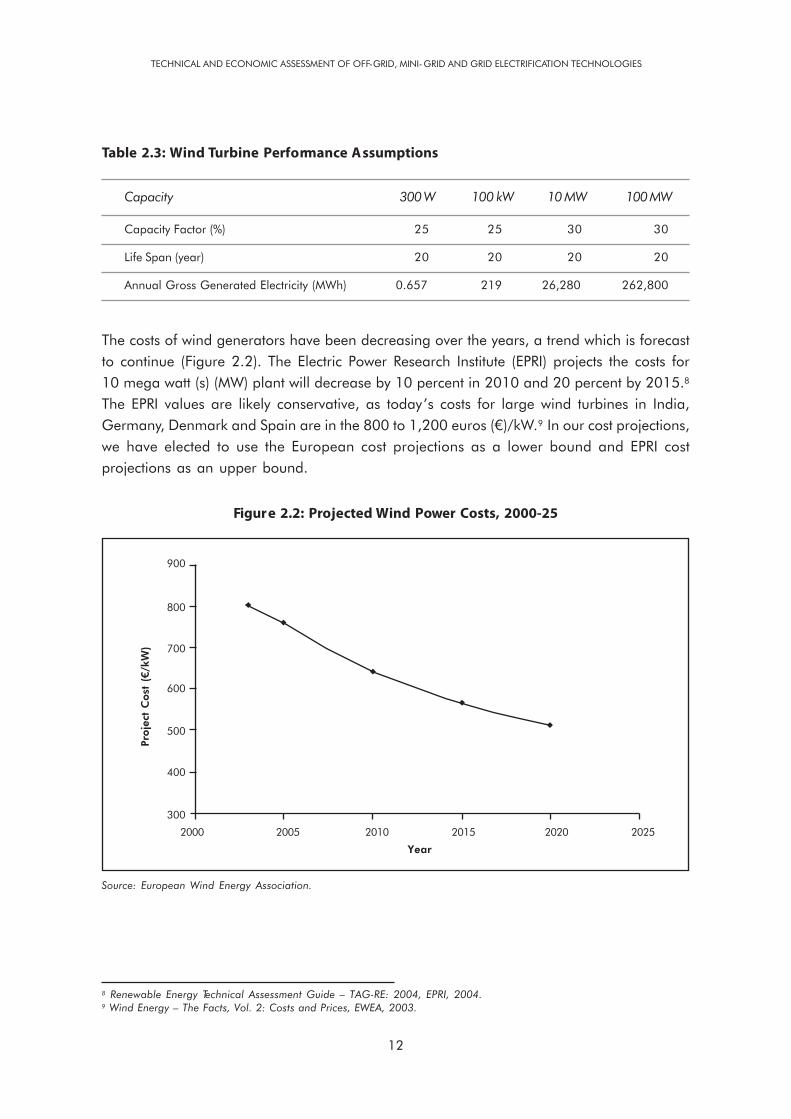
The costs of wind generators have been decreasing over the years, a trend which is forecastto continue (Figure 2.2). The Electric Power Research Institute (EPRI) projects the costs for10 mega watt (s) (MW) plant will decrease by 10 percent in 2010 and 20 percent by 2015.8
The EPRI values are likely conservative, as today’s costs for large wind turbines in India,Germany, Denmark and Spain are in the 800 to 1,200 euros (€)/kW.9 In our cost projections,we have elected to use the European cost projections as a lower bound and EPRI costprojections as an upper bound.
13
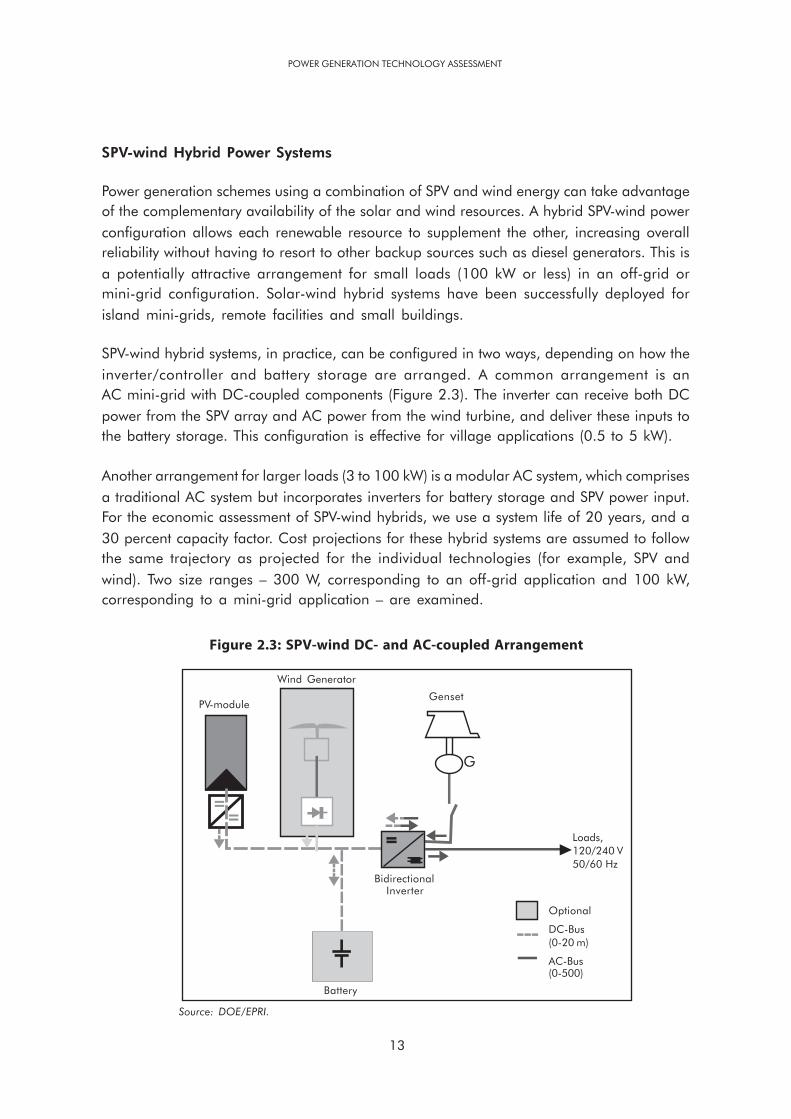
SPV-wind Hybrid Power Systems
Power generation schemes using a combination of SPV and wind energy can take advantageof the complementary availability of the solar and wind resources. A hybrid SPV-wind powerconfiguration allows each renewable resource to supplement the other, increasing overallreliability without having to resort to other backup sources such as diesel generators. This isa potentially attractive arrangement for small loads (100 kW or less) in an off-grid ormini-grid configuration. Solar-wind hybrid systems have been successfully deployed forisland mini-grids, remote facilities and small buildings.
SPV-wind hybrid systems, in practice, can be configured in two ways, depending on how theinverter/controller and battery storage are arranged. A common arrangement is anAC mini-grid with DC-coupled components (Figure 2.3). The inverter can receive both DCpower from the SPV array and AC power from the wind turbine, and deliver these inputs tothe battery storage. This configuration is effective for village applications (0.5 to 5 kW).
Another arrangement for larger loads (3 to 100 kW) is a modular AC system, which comprisesa traditional AC system but incorporates inverters for battery storage and SPV power input.For the economic assessment of SPV-wind hybrids, we use a system life of 20 years, and a30 percent capacity factor. Cost projections for these hybrid systems are assumed to followthe same trajectory as projected for the individual technologies (for example, SPV andwind). Two size ranges – 300 W, corresponding to an off-grid application and 100 kW,corresponding to a mini-grid application – are examined.
POWER GENERATION TECHNOLOGY ASSESSMENT
Figure 2.3: SPV-wind DC- and AC-coupled Arrangement
Source: DOE/EPRI.
Loads,120/240 V50/60 Hz
Optional
DC-Bus(0-20 m)
AC-Bus(0-500)
G
PV-module
Wind Generator
Genset
BidirectionalInverter
Battery
TECHNICAL AND ECONOMIC ASSESSMENT OF OFF-GRID, MINI-GRID AND GRID ELECTRIFICATION TECHNOLOGIES
14
Solar-thermal Electric Power Systems
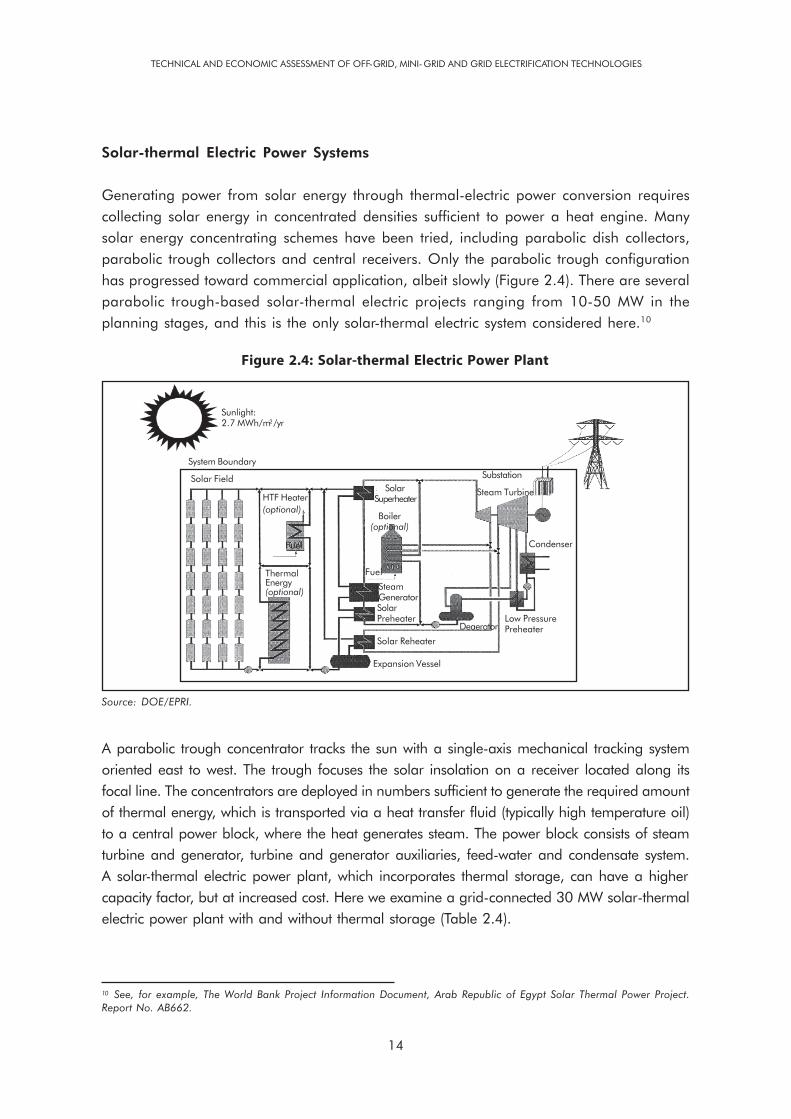
Generating power from solar energy through thermal-electric power conversion requirescollecting solar energy in concentrated densities sufficient to power a heat engine. Manysolar energy concentrating schemes have been tried, including parabolic dish collectors,parabolic trough collectors and central receivers. Only the parabolic trough configurationhas progressed toward commercial application, albeit slowly (Figure 2.4). There are severalparabolic trough-based solar-thermal electric projects ranging from 10-50 MW in theplanning stages, and this is the only solar-thermal electric system considered here.10
10 See, for example, The World Bank Project Information Document, Arab Republic of Egypt Solar Thermal Power Project.Report No. AB662.
Figure 2.4: Solar-thermal Electric Power Plant
Source: DOE/EPRI.
A parabolic trough concentrator tracks the sun with a single-axis mechanical tracking systemoriented east to west. The trough focuses the solar insolation on a receiver located along itsfocal line. The concentrators are deployed in numbers sufficient to generate the required amountof thermal energy, which is transported via a heat transfer fluid (typically high temperature oil)to a central power block, where the heat generates steam. The power block consists of steamturbine and generator, turbine and generator auxiliaries, feed-water and condensate system.A solar-thermal electric power plant, which incorporates thermal storage, can have a highercapacity factor, but at increased cost. Here we examine a grid-connected 30 MW solar-thermalelectric power plant with and without thermal storage (Table 2.4).
Sunlight:2.7 MWh/m2/yr
System Boundary
Solar Field Substation
Steam Turbine
Condenser
Low PressurePreheaterDeaerator
SolarSuperheater
Boiler(optional)
Fuel
SteamGeneratorSolarPreheater
Solar Reheater
Expansion Vessel
HTF Heater(optional)
Fuel
ThermalEnergy(optional)
15
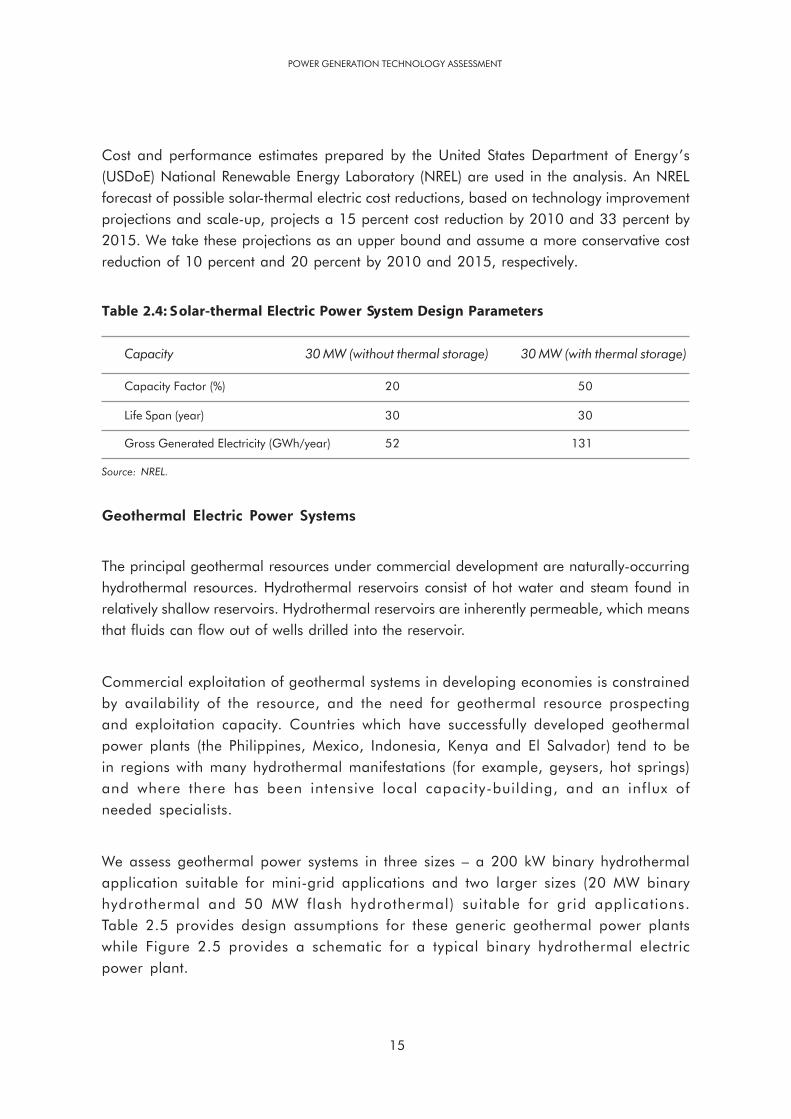
Cost and performance estimates prepared by the United States Department of Energy’s(USDoE) National Renewable Energy Laboratory (NREL) are used in the analysis. An NRELforecast of possible solar-thermal electric cost reductions, based on technology improvementprojections and scale-up, projects a 15 percent cost reduction by 2010 and 33 percent by2015. We take these projections as an upper bound and assume a more conservative costreduction of 10 percent and 20 percent by 2010 and 2015, respectively.
Table 2.4: Solar-thermal Electric Power System Design Parameters
Capacity 30 MW (without thermal storage) 30 MW (with thermal storage)
Capacity Factor (%) 20 50
Life Span (year) 30 30
Gross Generated Electricity (GWh/year) 52 131
Source: NREL.
Geothermal Electric Power Systems
The principal geothermal resources under commercial development are naturally-occurringhydrothermal resources. Hydrothermal reservoirs consist of hot water and steam found inrelatively shallow reservoirs. Hydrothermal reservoirs are inherently permeable, which meansthat fluids can flow out of wells drilled into the reservoir.
Commercial exploitation of geothermal systems in developing economies is constrainedby availability of the resource, and the need for geothermal resource prospectingand exploitation capacity. Countries which have successfully developed geothermalpower plants (the Philippines, Mexico, Indonesia, Kenya and El Salvador) tend to bein regions with many hydrothermal manifestations (for example, geysers, hot springs)and where there has been intensive local capacity-building, and an influx ofneeded specialists.
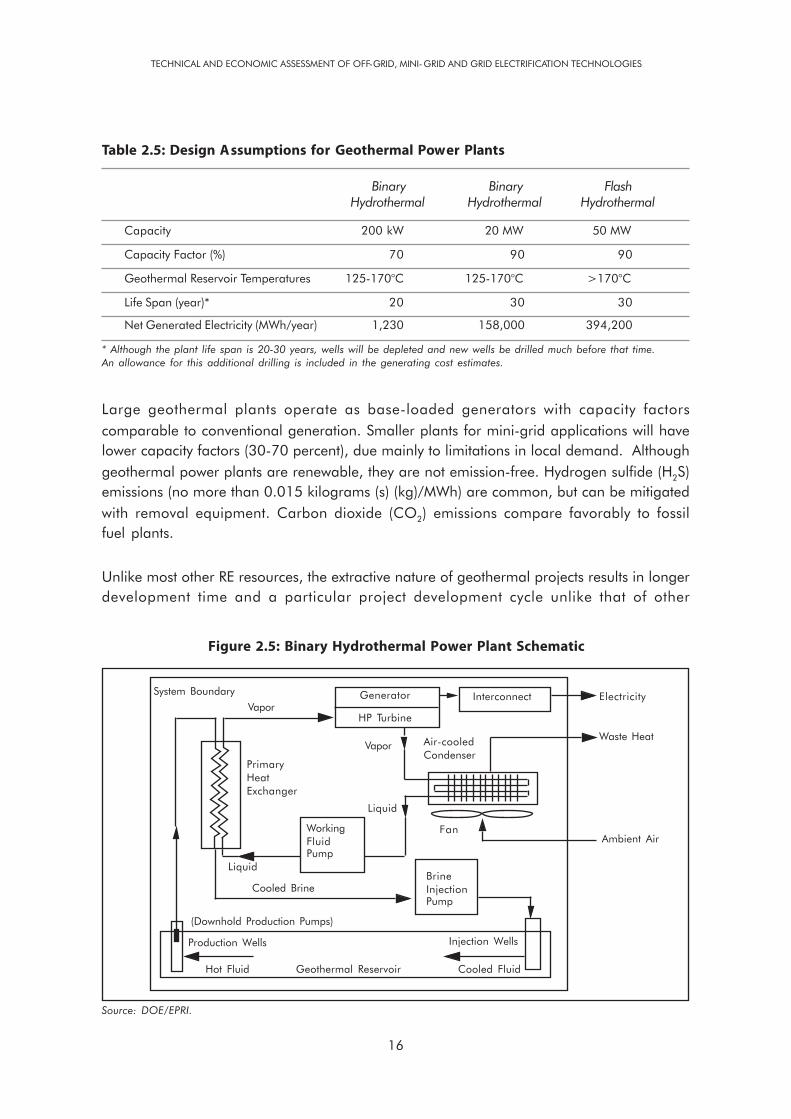
We assess geothermal power systems in three sizes – a 200 kW binary hydrothermalapplication suitable for mini-grid applications and two larger sizes (20 MW binaryhydrothermal and 50 MW flash hydrothermal) suitable for grid applications.Table 2.5 provides design assumptions for these generic geothermal power plantswhile Figure 2.5 provides a schematic for a typical binary hydrothermal electricpower plant.
POWER GENERATION TECHNOLOGY ASSESSMENT
TECHNICAL AND ECONOMIC ASSESSMENT OF OFF-GRID, MINI-GRID AND GRID ELECTRIFICATION TECHNOLOGIES
16
Table 2.5: Design Assumptions for Geothermal Power Plants
Binary Binary FlashHydrothermal Hydrothermal Hydrothermal
Capacity 200 kW 20 MW 50 MW
Capacity Factor (%) 70 90 90
Geothermal Reservoir Temperatures 125-170°C 125-170°C >170°C
Life Span (year)* 20 30 30
Net Generated Electricity (MWh/year) 1,230 158,000 394,200
* Although the plant life span is 20-30 years, wells will be depleted and new wells be drilled much before that time.An allowance for this additional drilling is included in the generating cost estimates.
Large geothermal plants operate as base-loaded generators with capacity factorscomparable to conventional generation. Smaller plants for mini-grid applications will havelower capacity factors (30-70 percent), due mainly to limitations in local demand. Althoughgeothermal power plants are renewable, they are not emission-free. Hydrogen sulfide (H2S)emissions (no more than 0.015 kilograms (s) (kg)/MWh) are common, but can be mitigatedwith removal equipment. Carbon dioxide (CO2) emissions compare favorably to fossilfuel plants.
Unlike most other RE resources, the extractive nature of geothermal projects results in longerdevelopment time and a particular project development cycle unlike that of other
Figure 2.5: Binary Hydrothermal Power Plant Schematic
System Boundary
VaporGenerator
HP Turbine
Interconnect
Vapor Air-cooledCondenser
PrimaryHeatExchanger
Liquid
Liquid
Cooled BrineBrineInjectionPump
Waste Heat
Ambient AirFan
(Downhold Production Pumps)
Production Wells
Hot Fluid Geothermal Reservoir Cooled Fluid
Injection Wells
Electricity
Source: DOE/EPRI.
WorkingFluidPump

17
technologies assessed. Table 2.6 provides a breakdown of the capital cost estimatesorganized by the development sequence (for example, exploration, confirmation, mainwells), showing that fully one-quarter of the capital costs is expended before ground is evenbroken on the geothermal power plant. For this reason, we assume extra contingency costsfor this option.
Table 2.6: Geothermal Power Capital Costs by Project Development Phase (2004 US$)
Item 200 kW Binary Plant 20 MW Binary Plant 50 MW Flash Plant
Exploration 300 320 240
Confirmation 400 470 370
Main Wells 800 710 540
Power Plant 4,250 2,120 1,080
Other 1,450 480 280
Total 7,200 4,100 2,510
It is difficult to predict future prices for geothermal power systems. Although there havebeen significant long-term price declines since 1980 (about 2 percent per year for powerplants), recent increases in oil prices have driven up the cost of geothermal wells. Manyindustry analysts contend that research and large-scale deployment can resume a downwardtrend in geothermal power costs. We assume a flat cost trajectory for this technology, andcapture the potential for significant cost reductions in the uncertainty analysis.11
Biomass Gasifier Power Systems
A biomass gasifier converts solid biomass material (woody cellulose and other organicsolids) into a combustible gas mixture known as “producer gas” with relatively low thermalvalue (1,000-1,100 (Kilo Calorie (s) [kcal]/Cubic Meter [m3]). The gasification process involvessuccessive drying, pyrolysis, oxidation/combustion and reduction in a staged chamber underdifferent temperatures and pressures. The producer gas (containing 52 percent Nitrogen[N], 12 percent CO
2, 2 percent methane (CH
4), 20 percent carbon monoxide [CO] and
14 percent hydrogen [H]) is then filtered, scrubbed and treated before being combusted ina standard engine-generator configuration (Figure 2.6).
11 We draw from the EPRI work on RE to establish a range of expected capital cost reductions (generally, -20% and +10%) overthe study period.
POWER GENERATION TECHNOLOGY ASSESSMENT

TECHNICAL AND ECONOMIC ASSESSMENT OF OFF-GRID, MINI-GRID AND GRID ELECTRIFICATION TECHNOLOGIES
18
Figure 2.6: Biomass Gasification Process Schematic
Gasifier
HeatExchanger Cyclone
SandBedFilter
VenturiScrubber
MistCycloneSeparator
PaperFilter
AirFilter
Wire Mesh Filter
Types of gasifiers in use include down draft, updraft and cross draft, fluidized bed andpyrolyzers. Choice of gasifier design affects the thermal value of the produced gas andits inert contents (tar, ash, particulates, CO), as well as the amount of treatment necessarybefore it can be used. Fuel cost is the most important parameter in estimating thegeneration costs of any biomass-based power generation technology. The cost ofbiomass depends on many parameters, including project location, type of biomassfeedstock, quantity required and present and future alternative use. We assess twosizes/applications of biomass gasifier technology – a small (100 kW) system applicableto mini-grid applications and a large (20 MW) system applicable to grid-connecteduse. Table 2.7 gives details of the design and performance parameters we assume forthe economic assessment of these two cases.
Table 2.7: Biomass Gasifier Design Assumptions
Capacity (kW) 100 kW 20 MW
Fuel Wood/Wood Waste/Agro Waste Wood/Wood Waste/Agro Waste
Calorific Value of Fuel 4,000 kcal/kg 4,000 kcal/kg
Capacity Factor 80% 80%
Producer Gas Calorific Value 1,000-1,200 kcal/Nm3 1,000-1,200 kcal/Nm3
Life Span of System 20 Years 20 Years
Specific Fuel Consumption 1.6 kg/kWh 1.5 kg/kWh
Engine withAlternator

19
Environmental impacts associated with combustion of the biomass gas are assumed to beconstrained by emissions control regulation, consistent with the World Bank standards.The future cost of these systems will likely be less than at present, as biomass gasificationhas considerable potential for technology improvements and economies of mass production.Our economic assessment assumes that improvements in the areas of low tar-producinggasifiers and improved cleaning and cooling equipment will yield a 5 percent reduction incapital costs by 2010, and a 10 percent reduction by 2015.
Biomass-steam Electric Power Systems
A biomass-steam electric power system is for the most part indistinguishable from othersteam electric power systems (for example, oil and coal) that combust fuel in a boiler togenerate steam for power production. A biomass-fired boiler generates high-pressure steamby direct combustion of biomass in a boiler. There are two major types of biomass combustionboilers – pile burners utilizing stationary or traveling grate combustors and fluidized-bedcombustors. A schematic diagram of direct-fired biomass electricity generating system isshown in Figure 2.7.
Figure 2.7: Biomass-fired Steam Electric Power Plant
Flue Gas
Boiler
SteamTurbine
Generator
StorageBiomass
Preparationand Processing
Air
Water Pump
In a pile burner combustion boiler, the biomass burns on a grate in the lower chamber,releasing volatile gases which then burn in the upper chamber. Current biomass combustordesigns utilize high efficiency boilers and stationary or traveling grate combustors withautomatic feeders that distribute the fuel onto a grate to burn. Fluidized-bed combustorsare the most advanced biomass combustors. In a fluidized-bed combustor, the biomassfuel is in a small granular form (for example, rice husk) and is mixed and burned in a hotbed of sand. Injection of air into the bed creates turbulence, which distributes and suspendsthe fuel while increasing the heat transfer and allowing for combustion below the temperaturethat normally creates nitrogen oxides (NO
x) emissions.
POWER GENERATION TECHNOLOGY ASSESSMENT
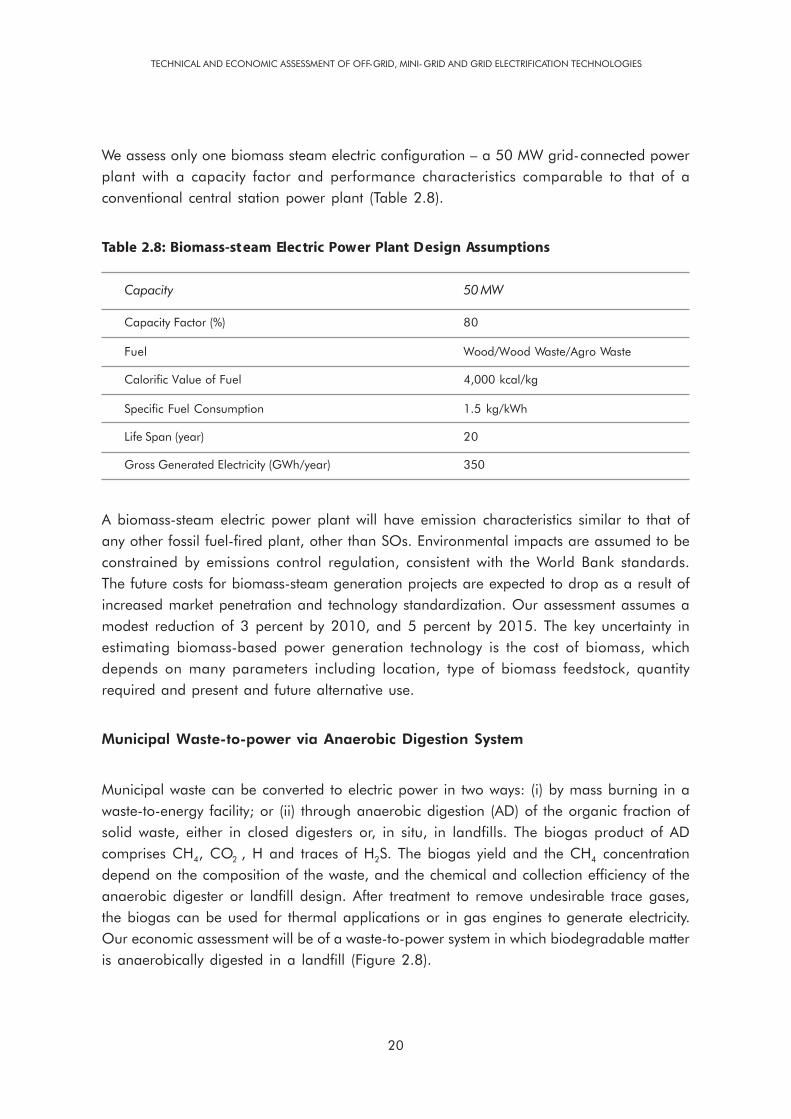
TECHNICAL AND ECONOMIC ASSESSMENT OF OFF-GRID, MINI-GRID AND GRID ELECTRIFICATION TECHNOLOGIES
20
We assess only one biomass steam electric configuration – a 50 MW grid-connected powerplant with a capacity factor and performance characteristics comparable to that of aconventional central station power plant (Table 2.8).
Table 2.8: Biomass-steam Electric Power Plant Design Assumptions
Capacity 50 MW
Capacity Factor (%) 80
Fuel Wood/Wood Waste/Agro Waste
Calorific Value of Fuel 4,000 kcal/kg
Specific Fuel Consumption 1.5 kg/kWh
Life Span (year) 20
Gross Generated Electricity (GWh/year) 350
A biomass-steam electric power plant will have emission characteristics similar to that ofany other fossil fuel-fired plant, other than SOs. Environmental impacts are assumed to beconstrained by emissions control regulation, consistent with the World Bank standards.The future costs for biomass-steam generation projects are expected to drop as a result ofincreased market penetration and technology standardization. Our assessment assumes amodest reduction of 3 percent by 2010, and 5 percent by 2015. The key uncertainty inestimating biomass-based power generation technology is the cost of biomass, whichdepends on many parameters including location, type of biomass feedstock, quantityrequired and present and future alternative use.
Municipal Waste-to-power via Anaerobic Digestion System
Municipal waste can be converted to electric power in two ways: (i) by mass burning in awaste-to-energy facility; or (ii) through anaerobic digestion (AD) of the organic fraction ofsolid waste, either in closed digesters or, in situ, in landfills. The biogas product of ADcomprises CH4, CO2 , H and traces of H2S. The biogas yield and the CH4 concentrationdepend on the composition of the waste, and the chemical and collection efficiency of theanaerobic digester or landfill design. After treatment to remove undesirable trace gases,the biogas can be used for thermal applications or in gas engines to generate electricity.Our economic assessment will be of a waste-to-power system in which biodegradable matteris anaerobically digested in a landfill (Figure 2.8).

21
We examine only one configuration, that of a large (5 MW), grid-connected waste-to-energypower plant with performance parameters as shown in Table 2.9.
Table 2.9: Municipal Waste-to-power System Characteristics
Capacity 5 MW
Capacity Factor (%) 80
Fuel-type Municipal Solid Waste
Life Span (year) 20
Gross Generated Electricity (GWh/year) 35
Environmental impacts of the digestion process should be minimal, as any H2S or other
organic volatiles can be scrubbed before utilization of the biogas product. Waste-to-energyprojects have highly desirable net Greenhouse Gas (GHG) impacts, as CH
4 emissions that
might otherwise emanate from landfill sites are sequestered.
We project a decrease in both capital and generating costs of waste-to-power systems infuture, as significant reductions are likely from technological development and domestic
Figure 2.8: Municipal Waste-to-power via Anaerobic Digestion
Source: Ministry of Environment, Government of Japan.
MSW Landfill Site
LPGGas Capture Pipelines LPG
CH4-CO
2
Flare Stack
LPGSelf-consumption Self-consumption
CH4-CO
2
ElectricPower
ThermalEnergy
Supplied toLandfill ThermalEnergy Demand
Supplied toLandfill Electric
Demand
Cogeneration System
Blower
Gas Engine G
GasHolder
Gas TreatmentEquipment
POWER GENERATION TECHNOLOGY ASSESSMENT
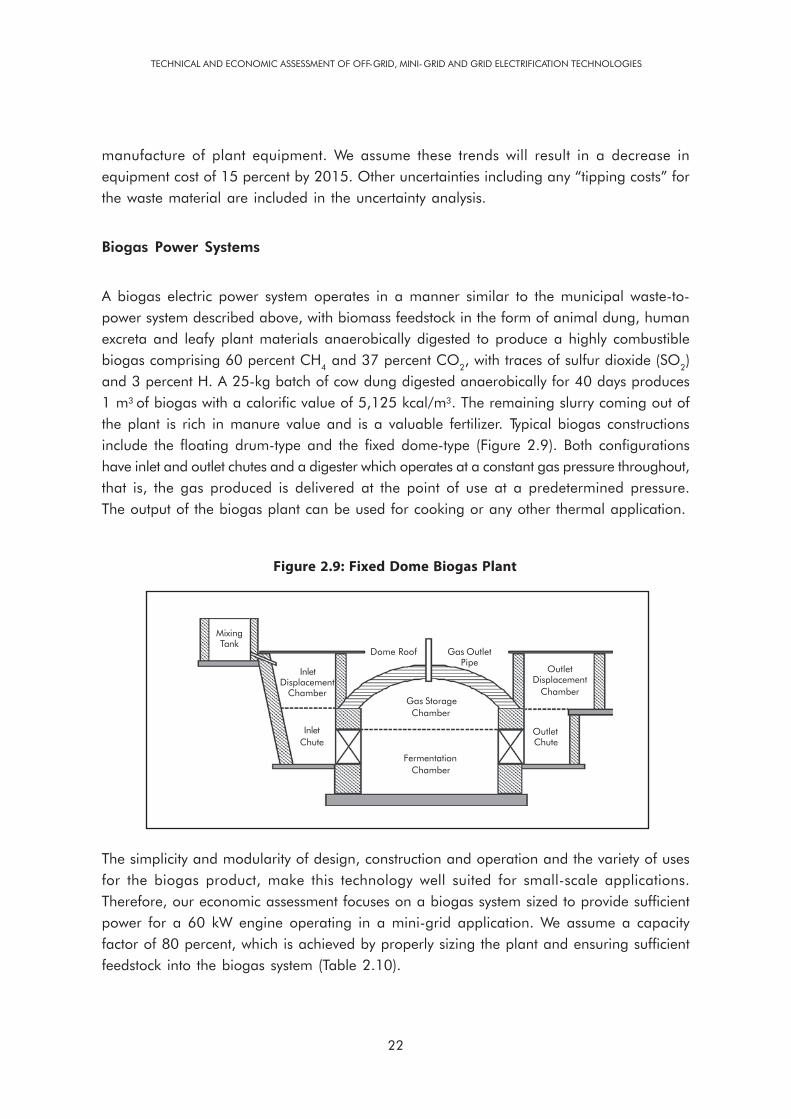
TECHNICAL AND ECONOMIC ASSESSMENT OF OFF-GRID, MINI-GRID AND GRID ELECTRIFICATION TECHNOLOGIES
22
manufacture of plant equipment. We assume these trends will result in a decrease inequipment cost of 15 percent by 2015. Other uncertainties including any “tipping costs” forthe waste material are included in the uncertainty analysis.
Biogas Power Systems
A biogas electric power system operates in a manner similar to the municipal waste-to-power system described above, with biomass feedstock in the form of animal dung, humanexcreta and leafy plant materials anaerobically digested to produce a highly combustiblebiogas comprising 60 percent CH
4 and 37 percent CO
2, with traces of sulfur dioxide (SO
2)
and 3 percent H. A 25-kg batch of cow dung digested anaerobically for 40 days produces1 m3 of biogas with a calorific value of 5,125 kcal/m3. The remaining slurry coming out ofthe plant is rich in manure value and is a valuable fertilizer. Typical biogas constructionsinclude the floating drum-type and the fixed dome-type (Figure 2.9). Both configurationshave inlet and outlet chutes and a digester which operates at a constant gas pressure throughout,that is, the gas produced is delivered at the point of use at a predetermined pressure.The output of the biogas plant can be used for cooking or any other thermal application.
Figure 2.9: Fixed Dome Biogas Plant
MixingTank
InletDisplacement
Chamber
InletChute
Dome Roof Gas OutletPipe
Gas StorageChamber
FermentationChamber
OutletDisplacement
Chamber
OutletChute
The simplicity and modularity of design, construction and operation and the variety of usesfor the biogas product, make this technology well suited for small-scale applications.Therefore, our economic assessment focuses on a biogas system sized to provide sufficientpower for a 60 kW engine operating in a mini-grid application. We assume a capacityfactor of 80 percent, which is achieved by properly sizing the plant and ensuring sufficientfeedstock into the biogas system (Table 2.10).

23
Table 2.10: Biogas Power System Design Assumptions
Capacity 60 kW
Capacity Factor (%) 80
Life Span (year) 20
Gross Generated Electricity 0.42 GWh
As with the other biomass applications, the GHG impacts are highly positive, as the designsequesters and utilizes CH
4 that would otherwise escape to the atmosphere. Since biogas
technology is very simple, uses local resources and has been in commercial operation for along time, we do not project any dramatic reduction in future system costs.
Micro- and Pico-hydroelectric Power Systems
Micro-hydro power projects are usually “run-of-the-river” (RoR) schemes that divert some ofthe water flow through civil works, for example, an intake weir, fore bay, and, formicro-hydro options, a penstock. Such schemes require no water catchments or storage,and thus have minimal environmental impacts. A drawback of such a scheme is seasonalvariation in flow, making it difficult in some cases to balance load with power output.Because micro- and pico-hydro systems are simple, scaleable, reasonably reliable andlow cost, they provide a source of cheap, independent and continuous power withoutthe need for environmental safeguards.
A micro-hydroelectric power plant comprises civil works and electro-mechanical equipment.Civil works include the weir, which provides a regulated discharge to the feeder channel;the feeder channel, constructed of concrete with desilting tanks along its length; the forebay, a concrete or steel tank designed providing a steady design head for the project; andthe penstock, a steel, concrete or PVC pipe, sized to provide a steady and laminar waterflow into the turbine (Figure 2.10). The electro-mechanical works include a Pelton or Turgoturbine (for high-head applications) or a Kaplan or Francis turbine (for low-headapplications); an induction or synchronous generator (induction for low power outputs andsynchronous for large-capacity units); and an electronic load governor or electronic loadcontroller, depending on whether the turbine and generator operate at full power or varyingload conditions.
A pico-hydroelectric power plant is much smaller than a micro-hydro (for example, 1 kW or300 W), and incorporates all of the electro-mechanical elements into one portable device.A pico-hydro device is easy to install, with 300 W-class pico-hydroelectric units typically
POWER GENERATION TECHNOLOGY ASSESSMENT

TECHNICAL AND ECONOMIC ASSESSMENT OF OFF-GRID, MINI-GRID AND GRID ELECTRIFICATION TECHNOLOGIES
24
installed by the purchaser because of the low 1-2 meters (m) head requirement, while larger(1 kW) units require a small amount of construction work to accommodate somewhat higher(5-6 m) head requirements. They are typically installed on the river or stream embankmentand can be removed during floods or low flow periods. The power output is sufficient for asingle house or small business. Earlier pico-hydro devices were not equipped with any voltageor load control, which was a drawback as it produced lighting flicker and reduced appliancelife. Newer pico-hydro machines come with embedded power electronics to regulate voltageand balance loads.
For our economic assessment, we chose three design points – a micro-hydro scheme of100 kW suitable for a mini-grid application and two pico-hydro schemes (1 kW and300 W) suitable for off-grid applications (Table 2.11). As with other renewable power systems,capacity factor varies according to site conditions and loading. We assume an averagecapacity factor and incorporate wider variations in the uncertainly analysis.
There has been very little variation in the equipment cost of micro- and pico-hydro electricequipment. Our economic assessment assumes that the capital costs will decline by lessthan 5 percent over the study period. Our uncertainty analysis attempted to account forwide variations in capacity factor depending upon the availability of hydro resource andthe quality of the sizing and design process.
WeirIntake
Penstock
TransmissionLines
Transformer
PowerHouse
Tailrace
Source: http://www.microhydropower.net.
Figure 2.10: Micro-hydroelectric Power Scheme

25
Table 2.11: Micro- and Pico-hydroelectric Power Plant Design Assumptions
Capacity 300 W 1 kW 100 kW
Capacity Factor (%) 30 30 30
Source River River River
Life Span (year) 5 15 30
Gross Generated Electricity (kWh/year) 788 2,628 26,2800
Mini-hydroelectric Power Systems
Mini-hydroelectric power schemes are “RoR” schemes using the same design principlesand civil and electro-mechanical components as micro-hydro schemes. Mini-hydrotechnology is well established around the world and has found favor with private investors.The systems are simple enough to be built locally at low cost and have simple O&Mrequirements, which gives rise to better long-term reliability. These systems provide a sourceof cheap, independent and continuous power, without degrading the environment. Oureconomic assessment envisions a larger (5 MW) mini-hydro project developed for a largemini-grid or grid-connected application, as shown in Table 2.12. A properly-sited,well-designed mini-hydro project should have a capacity factor of 45 percent on an average.12
Table 2.12: Mini-hydroelectric Power Plant Design Assumptions
Capacity 5 MW
Capacity Factor (%) 45
Source River
Life Span (year) 30
Gross Generated Electricity (GWh/year) 19.71
The capital cost of mini-hydro projects is very site-specific and can range betweenUS$1,400/kW and US$2,200/kW. The probable capital cost is US$1,800/kW.The equipment cost for mini-hydroelectric schemes has not changed over the past five years;therefore, we project only modest equipment cost declines over the study period.
12 Based on several sources: (i) inputs from Alternate Hydro Energy Centre (AHEC), Roorkee; (ii) small hydro power (SHP):China’s Practice – Prof Tong Jiandong, Director General, International Network for Small Hydro Power (IN-SHP); and(iii) Blue AGE Report, 2004 – A strategic study for the development of Small Hydro Power in the European Union, publishedby European Small Hydro Association (ESHA).
POWER GENERATION TECHNOLOGY ASSESSMENT

TECHNICAL AND ECONOMIC ASSESSMENT OF OFF-GRID, MINI-GRID AND GRID ELECTRIFICATION TECHNOLOGIES
26
Large Hydroelectric and Pumped Storage Power Systems
Unlike mini-, micro- and pico-hydro schemes, large hydroelectric projects typically includedams and water catchments in order to ensure a very high capacity factor consistent withthe high construction cost of these facilities. The distinguishing characteristic of largehydroelectric and large pumped storage projects is the dam design, which is highlysite-specific and can be of four general categories – gravity, concrete, earth or other fill andarch concrete. The water intake system determines the amount of pressure head and howwater flows to the turbines. Dams with hydroelectric turbines located at the dam site obtaintheir head from the surface level of the reservoir. The hydroelectric power plants are installeddirectly under the dam, which allows effective use of water and no need for a feed channel.A conduit water intake system introduces the flow to the hydroelectric turbine via a feedchannel and penstock (Figure 2.11).
Figure 2.11: Conduit-type Intake Arrangement for Large Hydroelectric Power Plant
Dam andSpillway
Penstock
IntakeTower
PipelineTunnel
Pipeline
Surge Tank
Power House
Surge Tank Intake Tower HeadWater
PipelineRockTunnel
Penstock
TailWater
H.W.Elevation
A pumped storage power generation scheme is a specialized scheme in which several powerplants are used to optimize the power output in accordance with diurnal variation in system,load. In this scheme the hydroelectric power plant acts both as a generator and a pump,allowing water in a lower reservoir to be pumped up to upper reservoir during the low-loadovernight period, and then generating electricity during peak load periods(Figure 2.12).
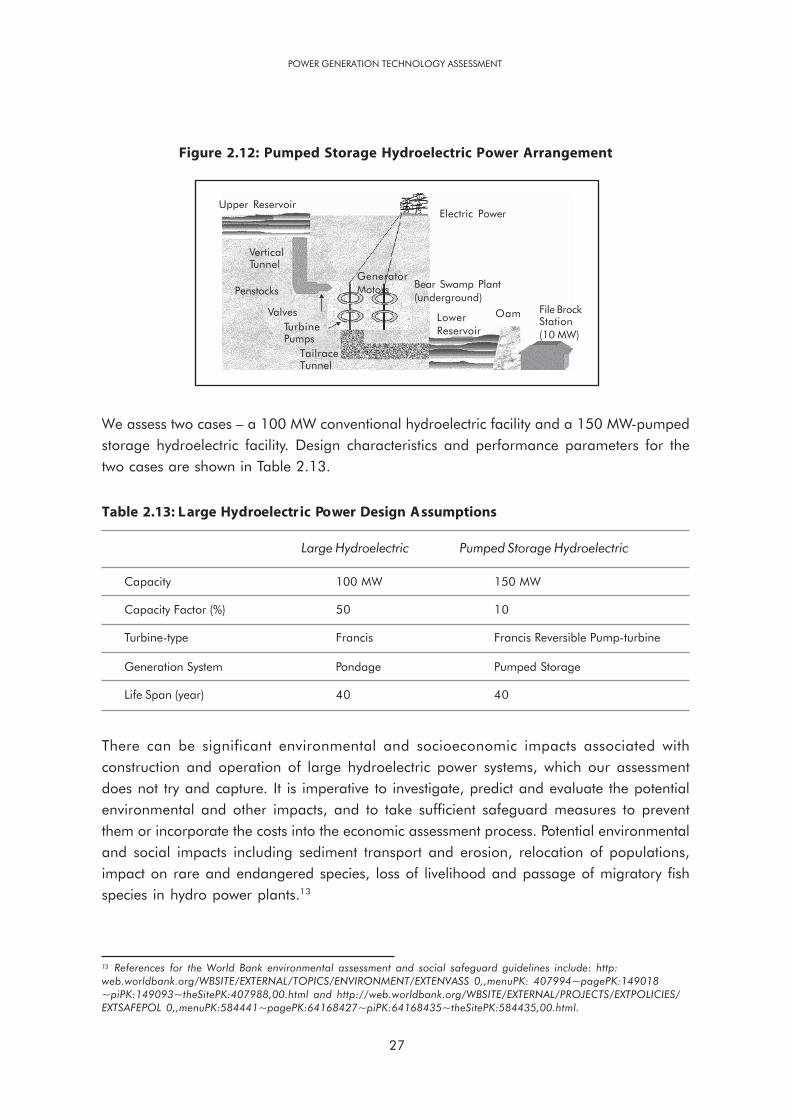
27
We assess two cases – a 100 MW conventional hydroelectric facility and a 150 MW-pumpedstorage hydroelectric facility. Design characteristics and performance parameters for thetwo cases are shown in Table 2.13.
Table 2.13: Large Hydroelectric Power Design Assumptions
Large Hydroelectric Pumped Storage Hydroelectric
Capacity 100 MW 150 MW
Capacity Factor (%) 50 10
Turbine-type Francis Francis Reversible Pump-turbine
Generation System Pondage Pumped Storage
Life Span (year) 40 40
There can be significant environmental and socioeconomic impacts associated withconstruction and operation of large hydroelectric power systems, which our assessmentdoes not try and capture. It is imperative to investigate, predict and evaluate the potentialenvironmental and other impacts, and to take sufficient safeguard measures to preventthem or incorporate the costs into the economic assessment process. Potential environmentaland social impacts including sediment transport and erosion, relocation of populations,impact on rare and endangered species, loss of livelihood and passage of migratory fishspecies in hydro power plants.13
13 References for the World Bank environmental assessment and social safeguard guidelines include: http:web.worldbank.org/WBSITE/EXTERNAL/TOPICS/ENVIRONMENT/EXTENVASS 0,,menuPK: 407994~pagePK:149018~piPK:149093~theSitePK:407988,00.html and http://web.worldbank.org/WBSITE/EXTERNAL/PROJECTS/EXTPOLICIES/EXTSAFEPOL 0,,menuPK:584441~pagePK:64168427~piPK:64168435~theSitePK:584435,00.html.
POWER GENERATION TECHNOLOGY ASSESSMENT
Figure 2.12: Pumped Storage Hydroelectric Power Arrangement
Upper Reservoir
VerticalTunnel
Penstocks
ValvesTurbinePumps
TailraceTunnel
Electric Power
GeneratorMotors Bear Swamp Plant
(underground)
LowerReservoir
Oam File BrockStation(10 MW)
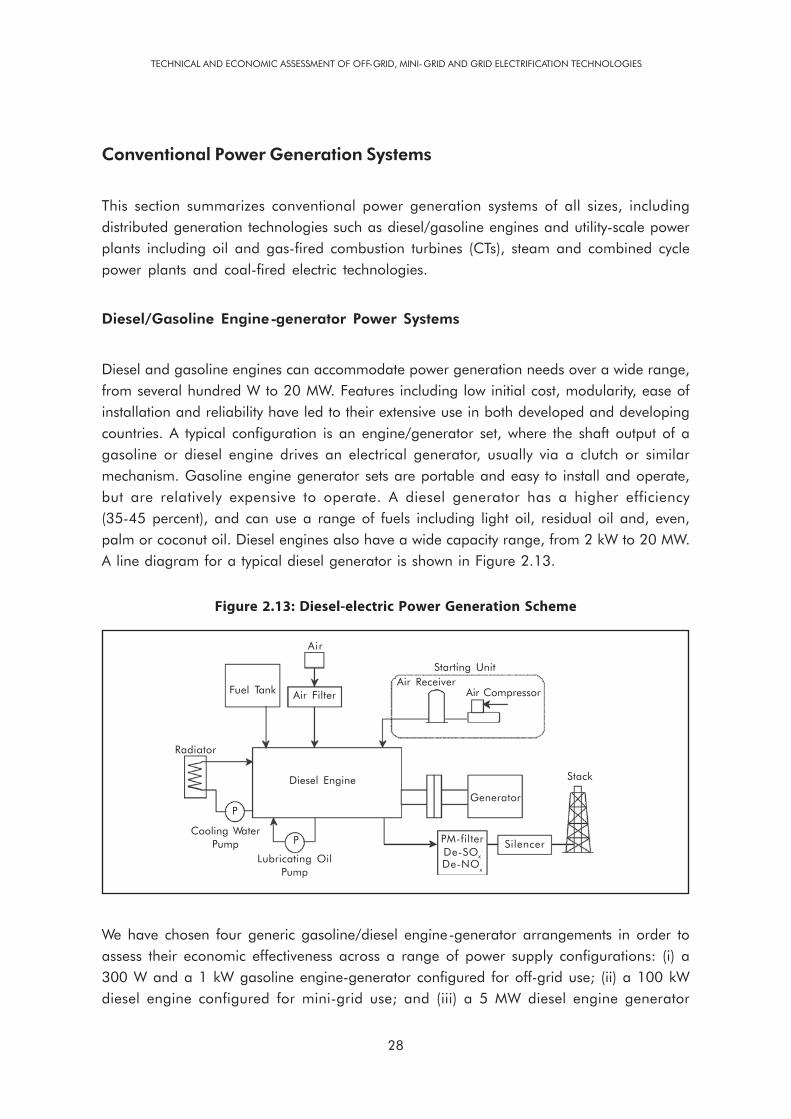
TECHNICAL AND ECONOMIC ASSESSMENT OF OFF-GRID, MINI-GRID AND GRID ELECTRIFICATION TECHNOLOGIES
28
Conventional Power Generation Systems
This section summarizes conventional power generation systems of all sizes, includingdistributed generation technologies such as diesel/gasoline engines and utility-scale powerplants including oil and gas-fired combustion turbines (CTs), steam and combined cyclepower plants and coal-fired electric technologies.
Diesel/Gasoline Engine-generator Power Systems
Diesel and gasoline engines can accommodate power generation needs over a wide range,from several hundred W to 20 MW. Features including low initial cost, modularity, ease ofinstallation and reliability have led to their extensive use in both developed and developingcountries. A typical configuration is an engine/generator set, where the shaft output of agasoline or diesel engine drives an electrical generator, usually via a clutch or similarmechanism. Gasoline engine generator sets are portable and easy to install and operate,but are relatively expensive to operate. A diesel generator has a higher efficiency(35-45 percent), and can use a range of fuels including light oil, residual oil and, even,palm or coconut oil. Diesel engines also have a wide capacity range, from 2 kW to 20 MW.A line diagram for a typical diesel generator is shown in Figure 2.13.
Figure 2.13: Diesel-electric Power Generation Scheme
Fuel Tank Air Filter
Air
Starting UnitAir Receiver
Air Compressor
Radiator
Cooling WaterPump
P
P
Lubricating OilPump
PM-filterDe-SOxDe-NO
x
Silencer
Generator
StackDiesel Engine
We have chosen four generic gasoline/diesel engine-generator arrangements in order toassess their economic effectiveness across a range of power supply configurations: (i) a300 W and a 1 kW gasoline engine-generator configured for off-grid use; (ii) a 100 kWdiesel engine configured for mini-grid use; and (iii) a 5 MW diesel engine generator

29
configured for grid connection. The type of engine and fuel reflect the commonly availablecommercial products. The design and operating parameters for each case are shownin Table 2.14.
Table 2.14: Gasoline and Diesel Engine-generator Design Assumptions
300 W 1 kW 100 kW 5 MW(off-grid) (off-grid) (mini-grid) (grid)
Capacity Factor (%) 30 30 80 80/10
Engine-type Gasoline Gasoline Diesel Diesel
Fuel-type Gasoline Gasoline Light Oil Residual Oil
Thermal Efficiency (Gross, LHV, %) 13 16 38 43
Life Span (year) 10 10 20 20
Generated Electricity (GWh/year) 0.0008 0.003 0.7 35.0/4.4
Diesel engines have significant air emissions and require emissions control equipment(Table 2.15). These costs are included in the diesel generator economic assessment.
Table 2.15: Emission Characteristics of Diesel Generators
Emission Standard Gasoline Engine Diesel Engine
300 W 1 kW 100 kW 5 MW
PM 50mg/Nm3 Zero Zero 80-120 100-200
SOx 2000mg/Nm3 Very Small Very Small 1,800-2,000 4,400-4,700(<500MW:0.2tpd/MW)
NOx Oil: 460 1,000-1,40014 1,600-2,000
CO2 g-CO2/net-kWh 1,500-1,900 650
Combustion Turbine Power Systems
Oil and Gas Combustion Turbines (CT) and Combined Cycle Gas Turbine (CCGT) powerplants are considered together, as both utilize gas turbines burning natural gas or
14 Smallest gasoline engines emit NOx beyond the World Bank’s standard; however, it is not realistic to add removal
equipment to these small generators. Thus, this cost is not included.
POWER GENERATION TECHNOLOGY ASSESSMENT

TECHNICAL AND ECONOMIC ASSESSMENT OF OFF-GRID, MINI-GRID AND GRID ELECTRIFICATION TECHNOLOGIES
30
light/residual oil. CTs are desirable for power applications because of their quick start-upcapability, modularity (1 MW-10 MW), small footprint and low capital cost. Gas turbinescan be used for emergency power or for remote loads; however, they require high qualityfuels and have high O&M requirements. A CCGT combines a combustion turbine cycle(s)with a steam turbine to form a multicycle system. For our assessment, we focus on a300 MW CCGT power plant combining a super-high temperature (1,300 [celsius] oC) gasturbine with two bottom-cycles using the 300 oC and 600 oC waste heat out of the combustionturbine (Figure 2.14). This approach boosts the overall thermal efficiency from 36 percentfor a CT to 51 percent for a CCGT.
For the economic assessment, we focus on two common configurations, both suited forgrid-connected operation. For the CT, we assume only a 10 percent capacity factor, reflectinga typical peak loading application. For the CCGT, we assume a combination of base loadoperations and load following (Table 2.16).
Table 2.16: CT and CCGT Design Assumptions
Combustion Turbine Combined Cycle
Capacity 150 MW 300 MW
Capacity Factor (%) 10 80
Thermal Efficiency (gross, LHV, %) 34 51
Life Span (year) 25 25
Combustion turbines burning light oil or gas have very low air emissions other than NOx
and, thus, emission control equipment costs are nominal. There is an expectation of capital
Figure 2.14: Combined Cycle Gas Turbine Schematic
-------Combined Cycle-only
StartingMotor Generator Steam Turbine
Air
Compressor
Condenser
Feed Water Pump
Fuel
Combustor
Gas Turbine
Oil Cooler
LubricatingOil Pump
CoolingWater Pump
Radiator
Stack
Heat RecoverySteam Gas
Boiler
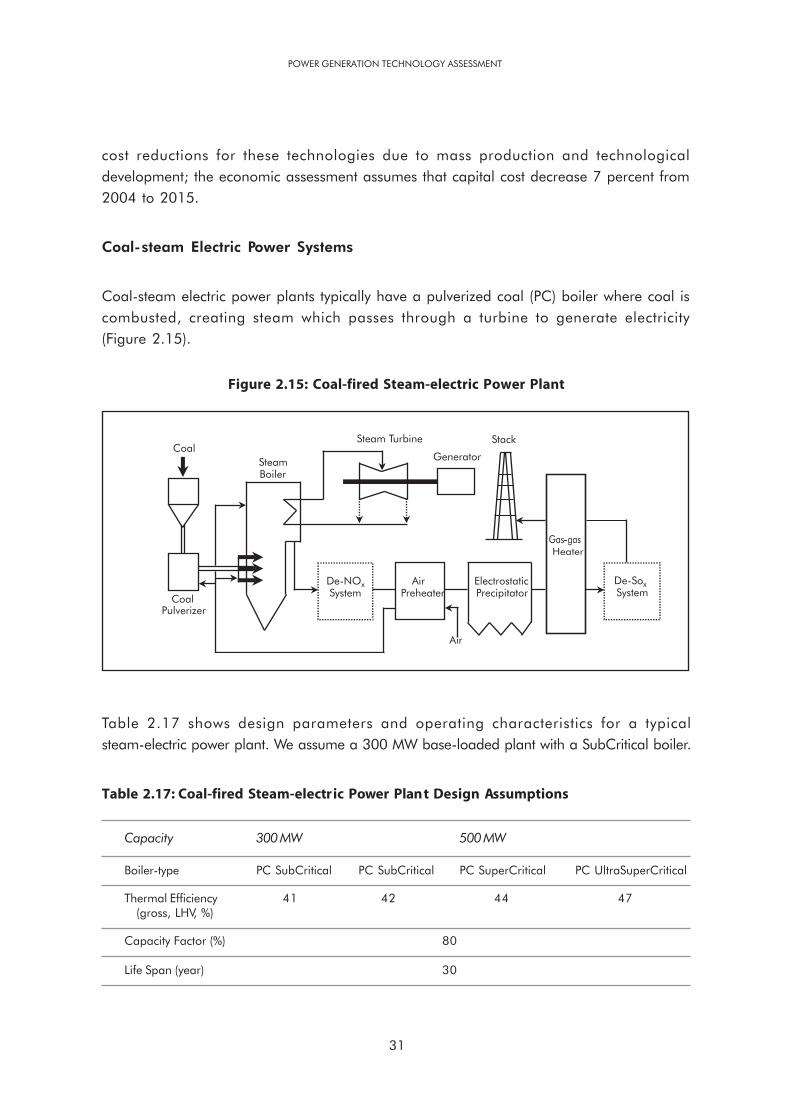
31
cost reductions for these technologies due to mass production and technologicaldevelopment; the economic assessment assumes that capital cost decrease 7 percent from2004 to 2015.
Coal-steam Electric Power Systems
Coal-steam electric power plants typically have a pulverized coal (PC) boiler where coal iscombusted, creating steam which passes through a turbine to generate electricity(Figure 2.15).
Figure 2.15: Coal-fired Steam-electric Power Plant
Table 2.17 shows design parameters and operating characteristics for a typicalsteam-electric power plant. We assume a 300 MW base-loaded plant with a SubCritical boiler.
Table 2.17: Coal-fired Steam-electric Power Plant Design Assumptions
Capacity 300 MW 500 MW
Boiler-type PC SubCritical PC SubCritical PC SuperCritical PC UltraSuperCritical
Thermal Efficiency 41 42 44 47(gross, LHV, %)
Capacity Factor (%) 80
Life Span (year) 30
POWER GENERATION TECHNOLOGY ASSESSMENT
Steam Turbine
Generator
Stack
De-SoxSystem
AirPreheater
De-NOxSystem
ElectrostaticPrecipitator
Coal
CoalPulverizer
SteamBoiler
Air
Gas-gas-Heater
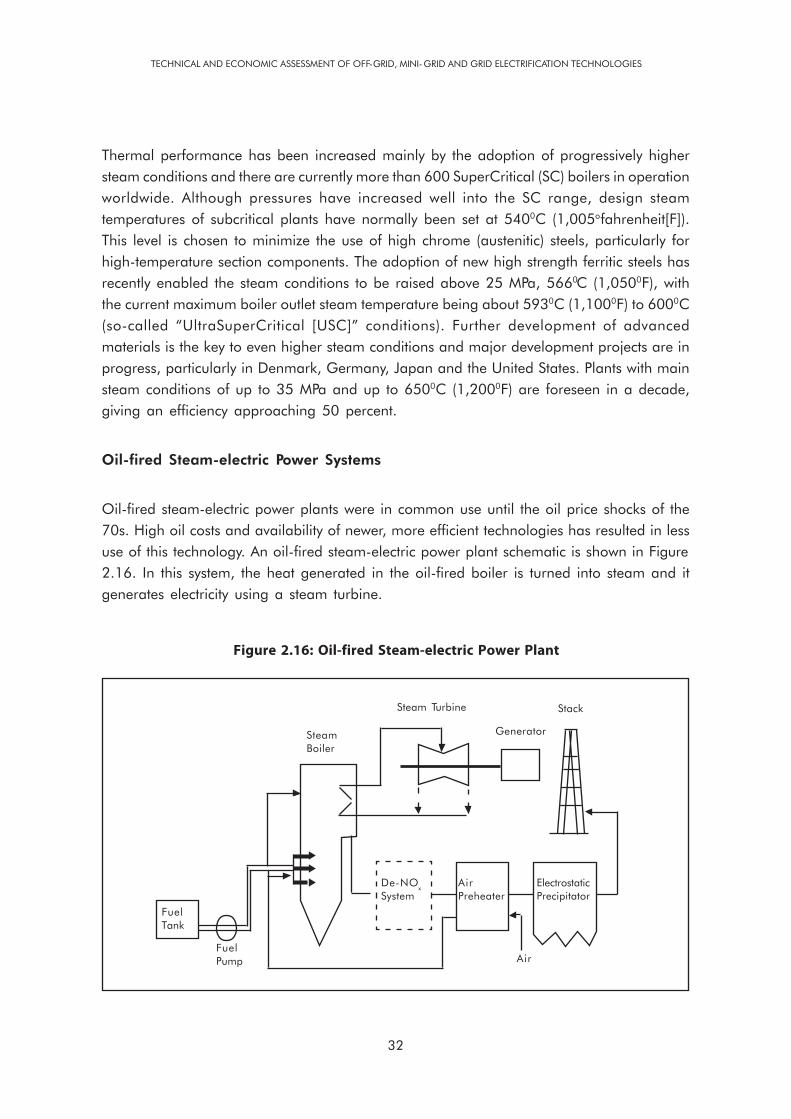
TECHNICAL AND ECONOMIC ASSESSMENT OF OFF-GRID, MINI-GRID AND GRID ELECTRIFICATION TECHNOLOGIES
32
Thermal performance has been increased mainly by the adoption of progressively highersteam conditions and there are currently more than 600 SuperCritical (SC) boilers in operationworldwide. Although pressures have increased well into the SC range, design steamtemperatures of subcritical plants have normally been set at 5400C (1,005ofahrenheit[F]).This level is chosen to minimize the use of high chrome (austenitic) steels, particularly forhigh-temperature section components. The adoption of new high strength ferritic steels hasrecently enabled the steam conditions to be raised above 25 MPa, 5660C (1,0500F), withthe current maximum boiler outlet steam temperature being about 5930C (1,1000F) to 6000C(so-called “UltraSuperCritical [USC]” conditions). Further development of advancedmaterials is the key to even higher steam conditions and major development projects are inprogress, particularly in Denmark, Germany, Japan and the United States. Plants with mainsteam conditions of up to 35 MPa and up to 6500C (1,2000F) are foreseen in a decade,giving an efficiency approaching 50 percent.
Oil-fired Steam-electric Power Systems
Oil-fired steam-electric power plants were in common use until the oil price shocks of the70s. High oil costs and availability of newer, more efficient technologies has resulted in lessuse of this technology. An oil-fired steam-electric power plant schematic is shown in Figure2.16. In this system, the heat generated in the oil-fired boiler is turned into steam and itgenerates electricity using a steam turbine.
Figure 2.16: Oil-fired Steam-electric Power Plant
SteamBoiler
Steam Turbine Stack
Generator
De-NOx
System
FuelTank
FuelPump
ElectrostaticPrecipitator
Air
AirPreheater
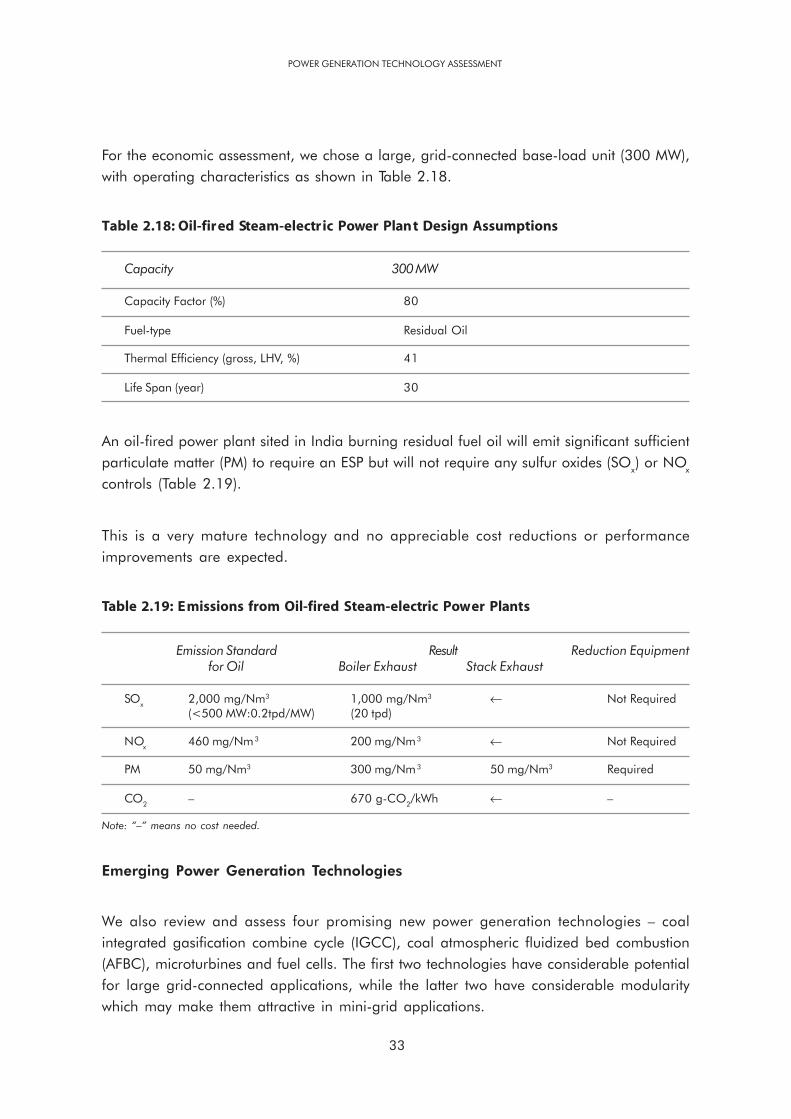
33
For the economic assessment, we chose a large, grid-connected base-load unit (300 MW),with operating characteristics as shown in Table 2.18.
Table 2.18: Oil-fired Steam-electric Power Plant Design Assumptions
Capacity 300 MW
Capacity Factor (%) 80
Fuel-type Residual Oil
Thermal Efficiency (gross, LHV, %) 41
Life Span (year) 30
An oil-fired power plant sited in India burning residual fuel oil will emit significant sufficientparticulate matter (PM) to require an ESP but will not require any sulfur oxides (SO
x) or NO
x
controls (Table 2.19).
This is a very mature technology and no appreciable cost reductions or performanceimprovements are expected.
Table 2.19: Emissions from Oil-fired Steam-electric Power Plants
Emission Standard Result Reduction Equipmentfor Oil Boiler Exhaust Stack Exhaust
SOx 2,000 mg/Nm3 1,000 mg/Nm3 ← Not Required(<500 MW:0.2tpd/MW) (20 tpd)
NOx 460 mg/Nm3 200 mg/Nm3 ← Not Required
PM 50 mg/Nm3 300 mg/Nm3 50 mg/Nm3 Required
CO2 – 670 g-CO2/kWh ← –
Note: “–” means no cost needed.
Emerging Power Generation Technologies
We also review and assess four promising new power generation technologies – coalintegrated gasification combine cycle (IGCC), coal atmospheric fluidized bed combustion(AFBC), microturbines and fuel cells. The first two technologies have considerable potentialfor large grid-connected applications, while the latter two have considerable modularitywhich may make them attractive in mini-grid applications.
POWER GENERATION TECHNOLOGY ASSESSMENT
TECHNICAL AND ECONOMIC ASSESSMENT OF OFF-GRID, MINI-GRID AND GRID ELECTRIFICATION TECHNOLOGIES
34
Coal IGCC Power Systems
An IGCC power plant gasifies coal to produce a synthesis gas which can be fired in a gasturbine. The hot exhaust from the gas turbine passes through a heat recovery steam generator(HRSG) where it produces steam that drives a turbine. Power is produced from both the gasand steam turbine generators. By removing the emission-forming constituents from thesynthetic gas, an IGCC power plant can meet extremely stringent emission standards.Figure 2.17 shows a typical configuration for a coal-fired IGCC power plant as consideredin this study. Table 2.20 provides the design parameters and operating characteristicsassumed for the 300 MW coal-fired IGCC power plant assessed here.
IGCC power plants are capable of removing 99 percent of Sulfur (S) in the fuel as elementalS; hence the S emissions are extremely low. The high pressure and low temperature ofcombustion also drastically mitigates NO
x formation. IGCC technology is very new, thus
the cost of these plants will not decrease significantly over the term of this study.
Figure 2.17: Coal-fired IGCC Power Plant Arrangements
Air Separation Unit Sulfur Recovery
CoalFeed Preparation Gasification Unit Gas Cooling Acid Gas Removal
GasTurbine HRSG
SteamTurbine
Air
Table 2.20: Coal-fired IGCC Power Plant Design Assumptions
Capacity 300 MW 500 MW
Efficiency (gross, LHV, %) 47 48
Capacity Factor (%) 80
Life Span (year) 30
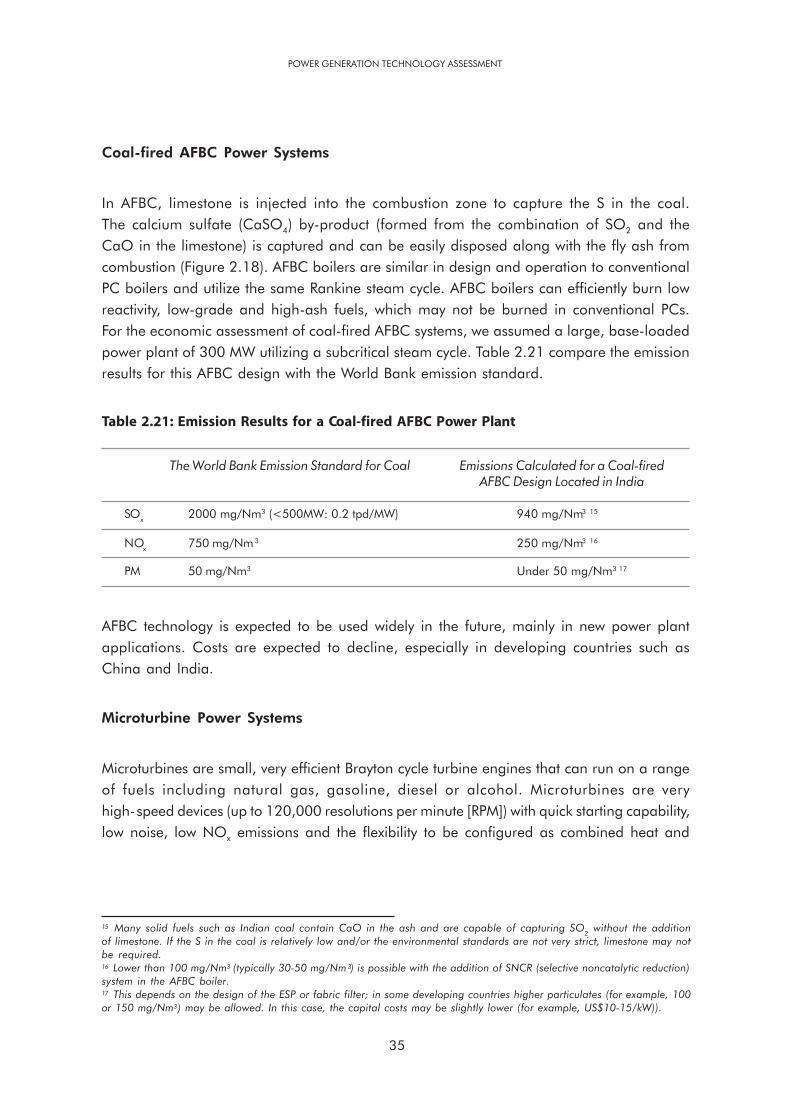
35
Coal-fired AFBC Power Systems
In AFBC, limestone is injected into the combustion zone to capture the S in the coal.The calcium sulfate (CaSO4) by-product (formed from the combination of SO2 and theCaO in the limestone) is captured and can be easily disposed along with the fly ash fromcombustion (Figure 2.18). AFBC boilers are similar in design and operation to conventionalPC boilers and utilize the same Rankine steam cycle. AFBC boilers can efficiently burn lowreactivity, low-grade and high-ash fuels, which may not be burned in conventional PCs.For the economic assessment of coal-fired AFBC systems, we assumed a large, base-loadedpower plant of 300 MW utilizing a subcritical steam cycle. Table 2.21 compare the emissionresults for this AFBC design with the World Bank emission standard.
Table 2.21: Emission Results for a Coal-fired AFBC Power Plant
The World Bank Emission Standard for Coal Emissions Calculated for a Coal-firedAFBC Design Located in India
SOx 2000 mg/Nm3 (<500MW: 0.2 tpd/MW) 940 mg/Nm3 15
NOx 750 mg/Nm3 250 mg/Nm3 16
PM 50 mg/Nm3 Under 50 mg/Nm3 17
AFBC technology is expected to be used widely in the future, mainly in new power plantapplications. Costs are expected to decline, especially in developing countries such asChina and India.
Microturbine Power Systems
Microturbines are small, very efficient Brayton cycle turbine engines that can run on a rangeof fuels including natural gas, gasoline, diesel or alcohol. Microturbines are veryhigh-speed devices (up to 120,000 resolutions per minute [RPM]) with quick starting capability,low noise, low NOx emissions and the flexibility to be configured as combined heat and
POWER GENERATION TECHNOLOGY ASSESSMENT
15 Many solid fuels such as Indian coal contain CaO in the ash and are capable of capturing SO2 without the addition
of limestone. If the S in the coal is relatively low and/or the environmental standards are not very strict, limestone may notbe required.16 Lower than 100 mg/Nm3 (typically 30-50 mg/Nm 3) is possible with the addition of SNCR (selective noncatalytic reduction)system in the AFBC boiler.17 This depends on the design of the ESP or fabric filter; in some developing countries higher particulates (for example, 100or 150 mg/Nm3) may be allowed. In this case, the capital costs may be slightly lower (for example, US$10-15/kW)).

TECHNICAL AND ECONOMIC ASSESSMENT OF OFF-GRID, MINI-GRID AND GRID ELECTRIFICATION TECHNOLOGIES
36
18 “The Current State of Atmospheric Fluidized-bed Combustion Technology,” Washington, DC: The World Bank, TechnicalPaper # 107, Fall 1989.
power (CHP) devices with overall thermal efficiencies approaching 60 percent. The basiclayout of a micro-turbine is identical to that of a larger scale simple cycle or closed cyclegas turbine plant (Figure 2.19).
Figure 2.19: Gas-fired Microturbine Schematic
Heat Exchanger
Exhaust
Compressor
Air
Fuel
Combustor
Gas Turbine Generator
Figure 2.18: Coal-fired AFBC Boiler Schematic
Coal Limestone
Combustor
SecondaryAir
Heat Exchanger(Optional)
Hot Cyclone
Solids
Recycle Flue Gas
Convection PassGas
Source: The World Bank.18
Primary Air

37
For the economic assessment, we focus on a larger microturbine with operating characteristics
as shown in Table 2.22 and configured for electricity production in a mini-grid.
The environmental impacts of microturbines are extremely low and no emission control
equipment is required. This technology is rapidly evolving and the two leading manufacturers
(Elliot and Capstone) are promising a 50 percent reduction in capital costs (from US$1,500/
kW to US$500/kW) within 20 years. Our assessment assumes a 4 percent annual capital
cost reduction over the study period.
Table 2.22: Gas-fired Microturbine Design Assumptions
Capacity 150 kW
Capacity Factor (%) 80
Fuel-type Natural Gas
Thermal Efficiency (LHV, %) 30
Life Span (year) 20
Fuel Cell Power Systems
Fuel cells operate through an electrochemical process in which H and air pass through a
reactor, producing power and harmless by-products (Figure 2.20). This technology is in the
early stages of commercialization (some 200 devices have been installed to date) and
there are several competing cell designs including polymer electrolyte fuel cell (PEFC),
phosphoric acid fuel cell (PAFC), molten carbonate fuel cell (MCFC) and solid oxide fuel
cell (SOFC). Fuel cells can be configured to suit the load requirements and installations of
200 kW to 11 MW are in service. The MCFC design, rated at 300 kW, is considered ready
for commercialization.
We will assess two fuel cell configurations (Table 2.23), one for mini-grid applications and
one for small grid-connected applications.
POWER GENERATION TECHNOLOGY ASSESSMENT

TECHNICAL AND ECONOMIC ASSESSMENT OF OFF-GRID, MINI-GRID AND GRID ELECTRIFICATION TECHNOLOGIES
38
Figure 2.20: Operation of a Fuel Cell
Load2e-
Fuel In Electrolyte Oxidant In
Positive Ion
orNegative Ion
H2
H2O
Depleted Fuel andProduct Gases Out
Cathode
½O 2
H2O
Depleted Oxidant andProduct Gases Out
Anode
Source: U.S. DOE Office of Fossil Energy NETL, 2000.
Table 2.23: Fuel Cell Power System Design Assumptions
200 kW Fuel Cell 5 MW Fuel Cell
Capacity 200 kW 5 MW
Capacity Factor (%) 80 80
Fuel-type Natural Gas Natural Gas
Electrical Efficiency (LHV, %)19 50 50
Life Span (year) 20 20
Fuel cells have essentially negligible air emission characteristics, although they do produceCO2 in approximately the same amounts as a gas-fired power plant. Fuel cell manufacturersexpect significant performance improvements and capital cost reductions as this newtechnology is commercialized. Our economic assessment assumes reductions of 20 percentby 2010 and 40 percent by 2015.
19 Operating fuel cells as a combined heat and power (CHP) plant can increase fuel cell plant efficiency to 70 percent.

39
Unless located in an off-grid or premise-scale application, power generation technologiesare deployed as part of an integrated electricity grid or an electrically-isolated mini-grid.The grid serves to transport the electric power from the generator to the customer viahigh-voltage, long-distance transmission and low-voltage distribution networks. This Chapterbriefly describes the requirements for transmitting and distributing electricity production toend users, and discusses grid integration issues associated with certain renewable powergeneration technologies.
Power delivery requirements and associated costs derive entirely from the specific powersystem configuration. Table 3.1 summarizes the power delivery requirements andindicative associated levelized costs, inclusive of capital costs, O&M costs and technicallosses, for the four power generation configurations considered in this study. The balanceof this section provides more detail on the technical and economic characteristics ofpower delivery.
Table 3.1: Power Delivery Requirements According to Generation Configuration
Grid-connected
Large Small Mini-grid Off-grid
Typical Generator Size (kW) 50-300 MW 5-50 MW 5 kW-250 kW 0.3-5.0 kW
Annual Output 1,000 GWh 35 GWh 1 GWh 0.005 GWh
Transmission Costs ~US¢0.25/kWh ~US¢0.5/kWh None None(100 km circuit) (20 km circuit)
Distribution Costs None None ~US¢1-7/kWh None
3. Technical and EconomicAssessment of Power Delivery
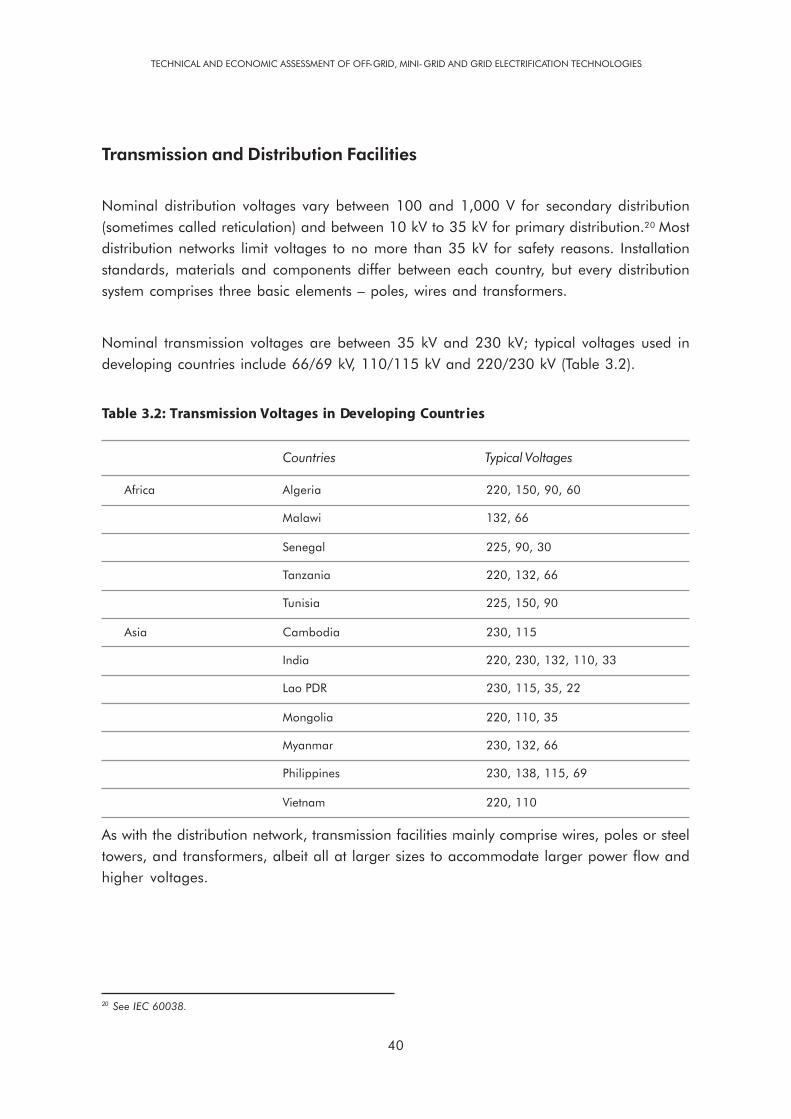
TECHNICAL AND ECONOMIC ASSESSMENT OF OFF-GRID, MINI-GRID AND GRID ELECTRIFICATION TECHNOLOGIES
40
Transmission and Distribution Facilities
Nominal distribution voltages vary between 100 and 1,000 V for secondary distribution(sometimes called reticulation) and between 10 kV to 35 kV for primary distribution.20 Mostdistribution networks limit voltages to no more than 35 kV for safety reasons. Installationstandards, materials and components differ between each country, but every distributionsystem comprises three basic elements – poles, wires and transformers.
Nominal transmission voltages are between 35 kV and 230 kV; typical voltages used indeveloping countries include 66/69 kV, 110/115 kV and 220/230 kV (Table 3.2).
Table 3.2: Transmission Voltages in Developing Countries
Countries Typical Voltages
Africa Algeria 220, 150, 90, 60
Malawi 132, 66
Senegal 225, 90, 30
Tanzania 220, 132, 66
Tunisia 225, 150, 90
Asia Cambodia 230, 115
India 220, 230, 132, 110, 33
Lao PDR 230, 115, 35, 22
Mongolia 220, 110, 35
Myanmar 230, 132, 66
Philippines 230, 138, 115, 69
Vietnam 220, 110
As with the distribution network, transmission facilities mainly comprise wires, poles or steeltowers, and transformers, albeit all at larger sizes to accommodate larger power flow andhigher voltages.
20 See IEC 60038.
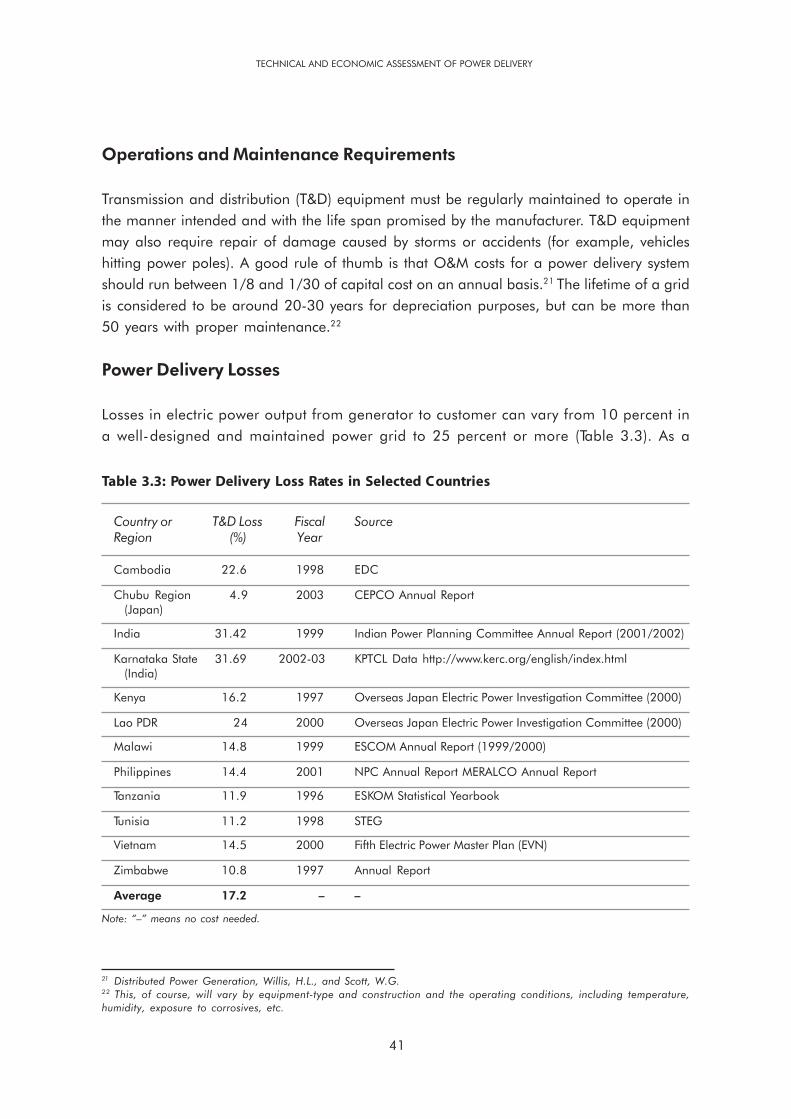
41
Operations and Maintenance Requirements
Transmission and distribution (T&D) equipment must be regularly maintained to operate inthe manner intended and with the life span promised by the manufacturer. T&D equipmentmay also require repair of damage caused by storms or accidents (for example, vehicleshitting power poles). A good rule of thumb is that O&M costs for a power delivery systemshould run between 1/8 and 1/30 of capital cost on an annual basis.21 The lifetime of a gridis considered to be around 20-30 years for depreciation purposes, but can be more than50 years with proper maintenance.22
Power Delivery Losses
Losses in electric power output from generator to customer can vary from 10 percent ina well-designed and maintained power grid to 25 percent or more (Table 3.3). As a
21 Distributed Power Generation, Willis, H.L., and Scott, W.G.22 This, of course, will vary by equipment-type and construction and the operating conditions, including temperature,humidity, exposure to corrosives, etc.
TECHNICAL AND ECONOMIC ASSESSMENT OF POWER DELIVERY
Table 3.3: Power Delivery Loss Rates in Selected Countries
Country or T&D Loss Fiscal SourceRegion (%) Year
Cambodia 22.6 1998 EDC
Chubu Region 4.9 2003 CEPCO Annual Report(Japan)
India 31.42 1999 Indian Power Planning Committee Annual Report (2001/2002)
Karnataka State 31.69 2002-03 KPTCL Data http://www.kerc.org/english/index.html(India)
Kenya 16.2 1997 Overseas Japan Electric Power Investigation Committee (2000)
Lao PDR 24 2000 Overseas Japan Electric Power Investigation Committee (2000)
Malawi 14.8 1999 ESCOM Annual Report (1999/2000)
Philippines 14.4 2001 NPC Annual Report MERALCO Annual Report
Tanzania 11.9 1996 ESKOM Statistical Yearbook
Tunisia 11.2 1998 STEG
Vietnam 14.5 2000 Fifth Electric Power Master Plan (EVN)
Zimbabwe 10.8 1997 Annual Report
Average 17.2 – –
Note: “–” means no cost needed.
TECHNICAL AND ECONOMIC ASSESSMENT OF OFF-GRID, MINI-GRID AND GRID ELECTRIFICATION TECHNOLOGIES
42
general rule, distribution losses account for more than two-third of the total power
delivery losses. Losses are higher at the distribution level because resistance losses inconductors are proportional to the square of the electric current I2A. Since lower
distribution voltages translate into higher current flows, the distribution system isinherently less efficient.
Economic Assessment of Power Delivery
A detailed formulation of the cost equations is provided in the CD-ROM (see Annex 2) to thisreport. Here we provide an overview of the approach and summary results. We assume
overhead line construction, reflecting rural electrification practice in developing economies,and use of international (IEC) standards for component choice and construction. We assume
there are no environmental or social impacts of power transmission and delivery. As T&Dtechnology is very mature, we do not project any cost reductions or performance
improvements over the term of the assessment.
As with the calculation of generation costs, we convert the capital costs of T&D facilities
into a levelized cost (US$/kWh) over the life span of the equipment and the volume ofpower delivered. Transmission costs and distribution costs can then be expressed simply
as the sum of their respective levelized capital cost plus O&M costs plus the costof losses.
Distribution Costs
The capital cost of distribution facilities is proportional to both the circuit-kilometer of
distribution conductor and the rated output of the generation source. Only a low-voltagedistribution network is needed when the power station output is 60 kW or less, as loss
reductions will be nominal unless the distribution circuit kilometers are very large. A powerstation output of 100 kW may require a higher voltage network with transformers, depending
on factors such as customer density and size of the mini-grid. The capital cost formulationused here is shown in Figure 3.1.
A distribution capital cost calculation was performed for each power generation technology
configured to serve a mini-grid. Actual installed distribution costs typical of Indian ruralelectrification programs were used (US$5,000 per circuit km for medium voltage (33 kV)
and US$3,500/circuit-km for low-voltage reticulation (0.2 kV), along with US$3,500 per
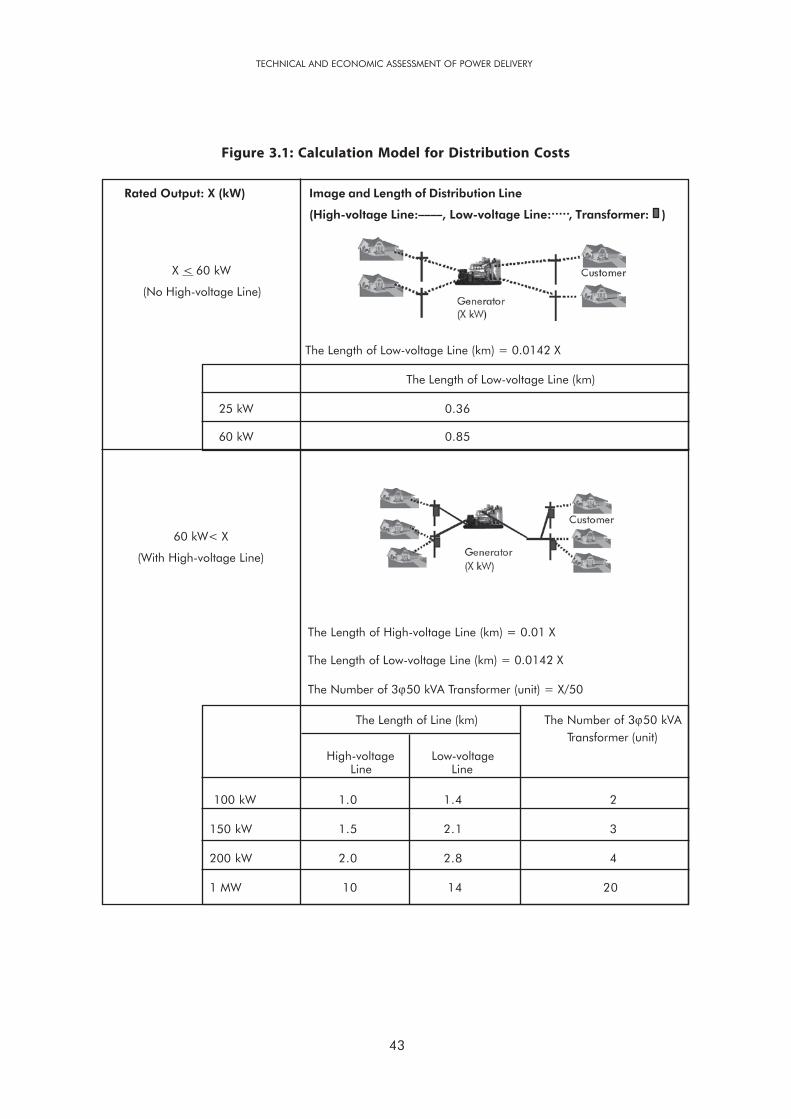
43
Figure 3.1: Calculation Model for Distribution Costs
The Length of High-voltage Line (km) = 0.01 X
The Length of Low-voltage Line (km) = 0.0142 X
The Number of 3ϕ50 kVA Transformer (unit) = X/50
Rated Output: X (kW) Image and Length of Distribution Line
(High-voltage Line:____, Low-voltage Line:....., Transformer: )
X < 60 kW
(No High-voltage Line)
The Length of Low-voltage Line (km) = 0.0142 X
The Length of Low-voltage Line (km)
25 kW 0.36
60 kW 0.85
60 kW< X
(With High-voltage Line)
The Length of Line (km) The Number of 3ϕ50 kVATransformer (unit)
High-voltage Low-voltageLine Line
100 kW 1.0 1.4 2
150 kW 1.5 2.1 3
200 kW 2.0 2.8 4
1 MW 10 14 20
TECHNICAL AND ECONOMIC ASSESSMENT OF POWER DELIVERY
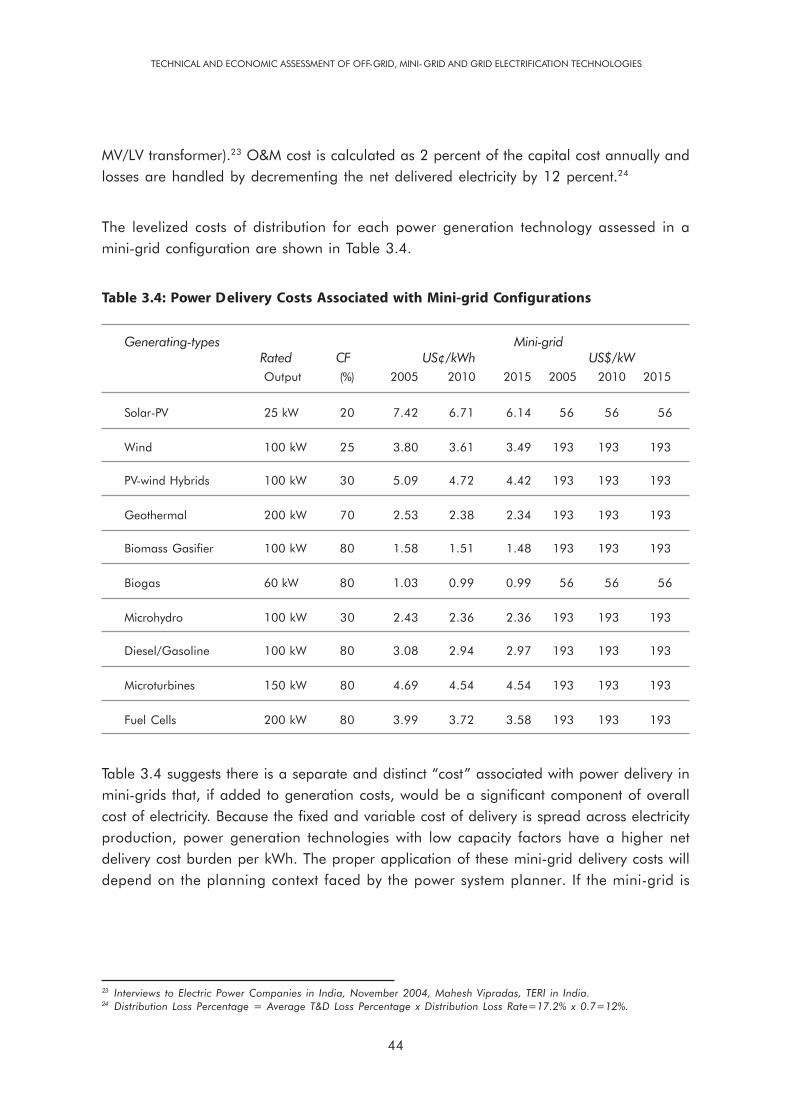
TECHNICAL AND ECONOMIC ASSESSMENT OF OFF-GRID, MINI-GRID AND GRID ELECTRIFICATION TECHNOLOGIES
44
MV/LV transformer).23 O&M cost is calculated as 2 percent of the capital cost annually andlosses are handled by decrementing the net delivered electricity by 12 percent.24
The levelized costs of distribution for each power generation technology assessed in amini-grid configuration are shown in Table 3.4.
Table 3.4: Power Delivery Costs Associated with Mini-grid Configurations
Generating-types Mini-gridRated CF US¢/kWh US$/kWOutput (%) 2005 2010 2015 2005 2010 2015
Solar-PV 25 kW 20 7.42 6.71 6.14 56 56 56
Wind 100 kW 25 3.80 3.61 3.49 193 193 193
PV-wind Hybrids 100 kW 30 5.09 4.72 4.42 193 193 193
Geothermal 200 kW 70 2.53 2.38 2.34 193 193 193
Biomass Gasifier 100 kW 80 1.58 1.51 1.48 193 193 193
Biogas 60 kW 80 1.03 0.99 0.99 56 56 56
Microhydro 100 kW 30 2.43 2.36 2.36 193 193 193
Diesel/Gasoline 100 kW 80 3.08 2.94 2.97 193 193 193
Microturbines 150 kW 80 4.69 4.54 4.54 193 193 193
Fuel Cells 200 kW 80 3.99 3.72 3.58 193 193 193
Table 3.4 suggests there is a separate and distinct “cost” associated with power delivery inmini-grids that, if added to generation costs, would be a significant component of overallcost of electricity. Because the fixed and variable cost of delivery is spread across electricityproduction, power generation technologies with low capacity factors have a higher netdelivery cost burden per kWh. The proper application of these mini-grid delivery costs willdepend on the planning context faced by the power system planner. If the mini-grid is
23 Interviews to Electric Power Companies in India, November 2004, Mahesh Vipradas, TERI in India.24 Distribution Loss Percentage = Average T&D Loss Percentage x Distribution Loss Rate=17.2% x 0.7=12%.
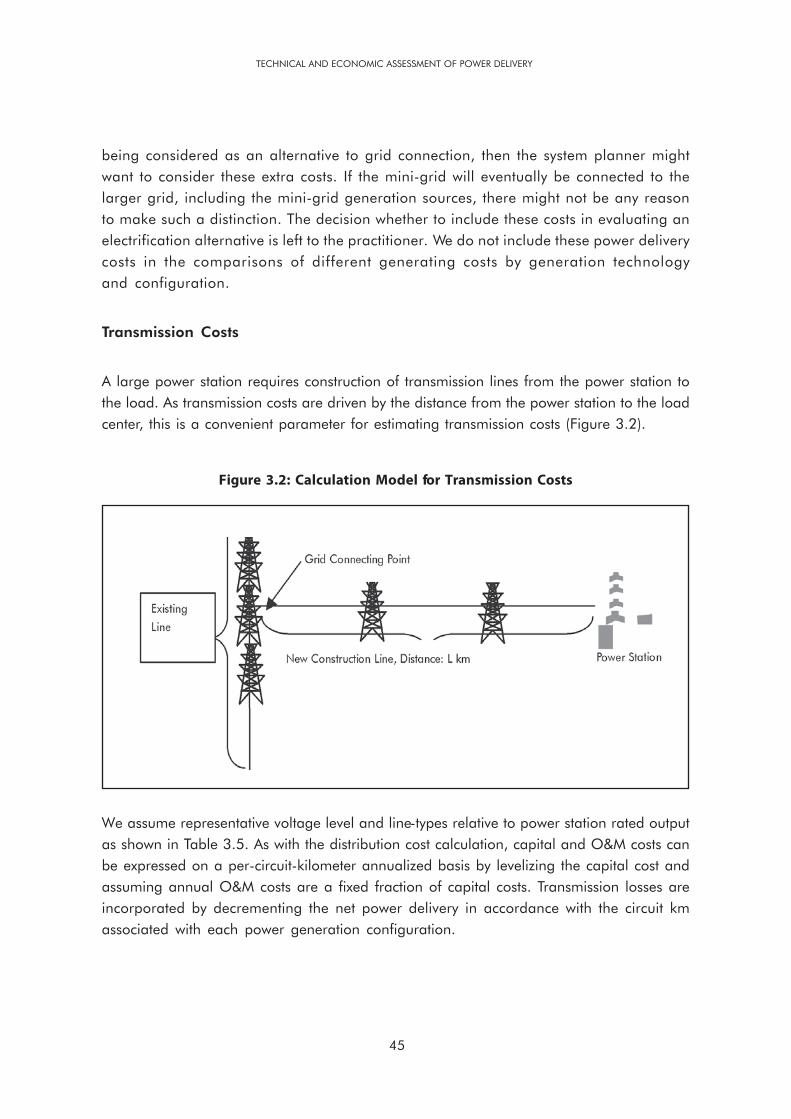
45
Figure 3.2: Calculation Model for Transmission Costs
being considered as an alternative to grid connection, then the system planner mightwant to consider these extra costs. If the mini-grid will eventually be connected to thelarger grid, including the mini-grid generation sources, there might not be any reasonto make such a distinction. The decision whether to include these costs in evaluating anelectrification alternative is left to the practitioner. We do not include these power deliverycosts in the comparisons of different generating costs by generation technologyand configuration.
Transmission Costs
A large power station requires construction of transmission lines from the power station tothe load. As transmission costs are driven by the distance from the power station to the loadcenter, this is a convenient parameter for estimating transmission costs (Figure 3.2).
TECHNICAL AND ECONOMIC ASSESSMENT OF POWER DELIVERY
We assume representative voltage level and line-types relative to power station rated outputas shown in Table 3.5. As with the distribution cost calculation, capital and O&M costs canbe expressed on a per-circuit-kilometer annualized basis by levelizing the capital cost andassuming annual O&M costs are a fixed fraction of capital costs. Transmission losses areincorporated by decrementing the net power delivery in accordance with the circuit kmassociated with each power generation configuration.
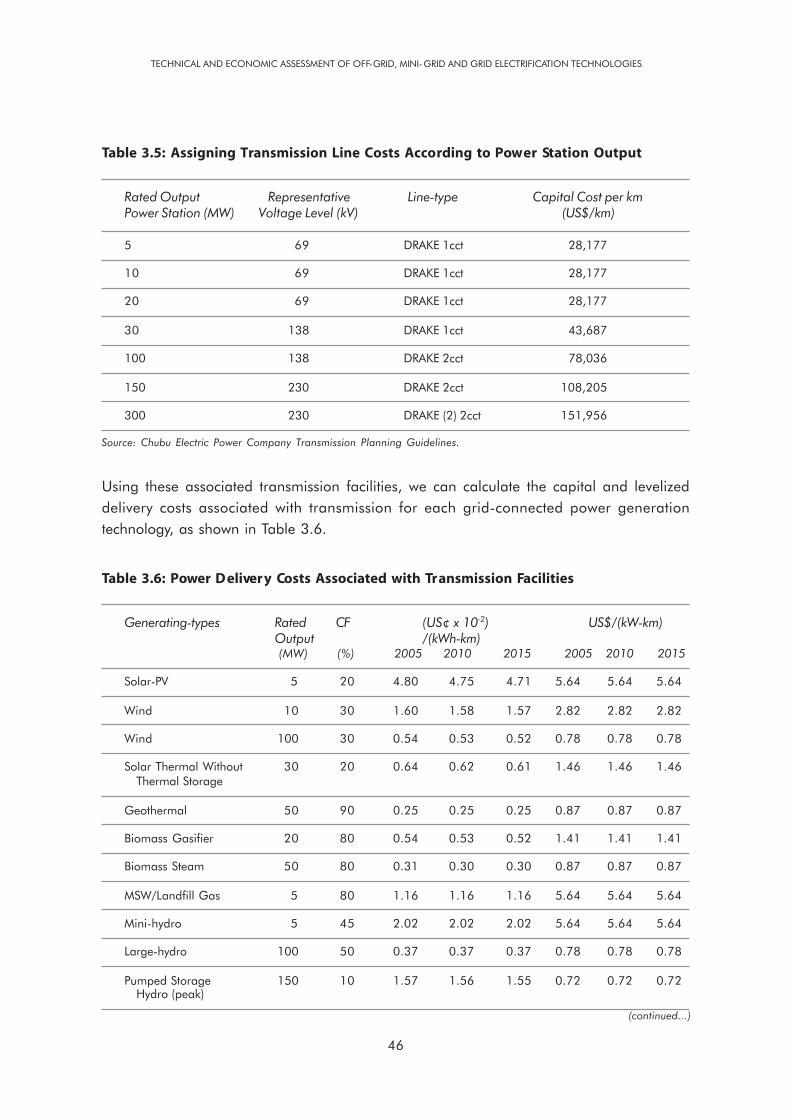
TECHNICAL AND ECONOMIC ASSESSMENT OF OFF-GRID, MINI-GRID AND GRID ELECTRIFICATION TECHNOLOGIES
46
Table 3.5: Assigning Transmission Line Costs According to Power Station Output
Rated Output Representative Line-type Capital Cost per kmPower Station (MW) Voltage Level (kV) (US$/km)
5 69 DRAKE 1cct 28,177
10 69 DRAKE 1cct 28,177
20 69 DRAKE 1cct 28,177
30 138 DRAKE 1cct 43,687
100 138 DRAKE 2cct 78,036
150 230 DRAKE 2cct 108,205
300 230 DRAKE (2) 2cct 151,956
Source: Chubu Electric Power Company Transmission Planning Guidelines.
Using these associated transmission facilities, we can calculate the capital and levelizeddelivery costs associated with transmission for each grid-connected power generationtechnology, as shown in Table 3.6.
Table 3.6: Power Delivery Costs Associated with Transmission Facilities
Generating-types Rated CF (US¢ x 10-2) US$/(kW-km)Output /(kWh-km)(MW) (%) 2005 2010 2015 2005 2010 2015
Solar-PV 5 20 4.80 4.75 4.71 5.64 5.64 5.64
Wind 10 30 1.60 1.58 1.57 2.82 2.82 2.82
Wind 100 30 0.54 0.53 0.52 0.78 0.78 0.78
Solar Thermal Without 30 20 0.64 0.62 0.61 1.46 1.46 1.46Thermal Storage
Geothermal 50 90 0.25 0.25 0.25 0.87 0.87 0.87
Biomass Gasifier 20 80 0.54 0.53 0.52 1.41 1.41 1.41
Biomass Steam 50 80 0.31 0.30 0.30 0.87 0.87 0.87
MSW/Landfill Gas 5 80 1.16 1.16 1.16 5.64 5.64 5.64
Mini-hydro 5 45 2.02 2.02 2.02 5.64 5.64 5.64
Large-hydro 100 50 0.37 0.37 0.37 0.78 0.78 0.78
Pumped Storage 150 10 1.57 1.56 1.55 0.72 0.72 0.72Hydro (peak)
(continued...)

47
Diesel/Gasoline 5 80 1.19 1.18 1.18 5.64 5.64 5.64Generator
Diesel/Gasoline 5 10 8.98 8.97 8.97 5.64 5.64 5.64Generator (peak)
Fuel Cells 5 80 1.24 1.22 1.21 5.64 5.64 5.64
Oil/Gas Combined 150 10 1.29 1.28 1.28 0.72 0.72 0.72Turbines (peak)
Oil/Gas Combined Cycle 300 80 0.17 0.16 0.16 0.51 0.51 0.51
Coal Steam 300 80 0.16 0.15 0.15 0.51 0.51 0.51
Coal AFB 300 80 0.15 0.15 0.15 0.51 0.51 0.51
Coal IGCC 300 80 0.17 0.16 0.16 0.51 0.51 0.51
Oil Steam 300 80 0.19 0.19 0.18 0.51 0.51 0.51
As we saw with power delivery costs associated with mini-grids, the levelized transmissioncosts for power generation technologies with low rated output and low capacity factor arequite high, as the high fixed costs of transmission are spread over lower annual electricityproduction. The calculation approach used here yields the cost of delivering the output of agiven power generation technology per circuit-km. This can be converted to a basis similarto the distribution costs by specifying the physical configuration of the transmission network.However, once again we present these results for informational purposes and do not makea blanket recommendation for how they should be used in the planning process. As withdistribution-related power delivery costs, we do not include these transmission-related powerdelivery costs in the comparisons of different generating costs by generation technologyand configuration.
Grid Integration Issues
Intermittent power sources connected to the power grid can cause frequency and voltagestability problems for the system operator. As more and more stochastic power sources suchas wind turbines are being interconnected to power grids, this topic has become the subjectof intensive study.25
25 Wind Power Impacts on Electric Power System Operating Costs: Summary and Perspective on Work to Date, J. CharlesSmith, UWIG, others.
TECHNICAL AND ECONOMIC ASSESSMENT OF POWER DELIVERY
Generating-types Rated CF (US¢ x 10-2) US$/(kW-km)Output /(kWh-km)(MW) (%) 2005 2010 2015 2005 2010 2015
(...Table 3.6 continued)
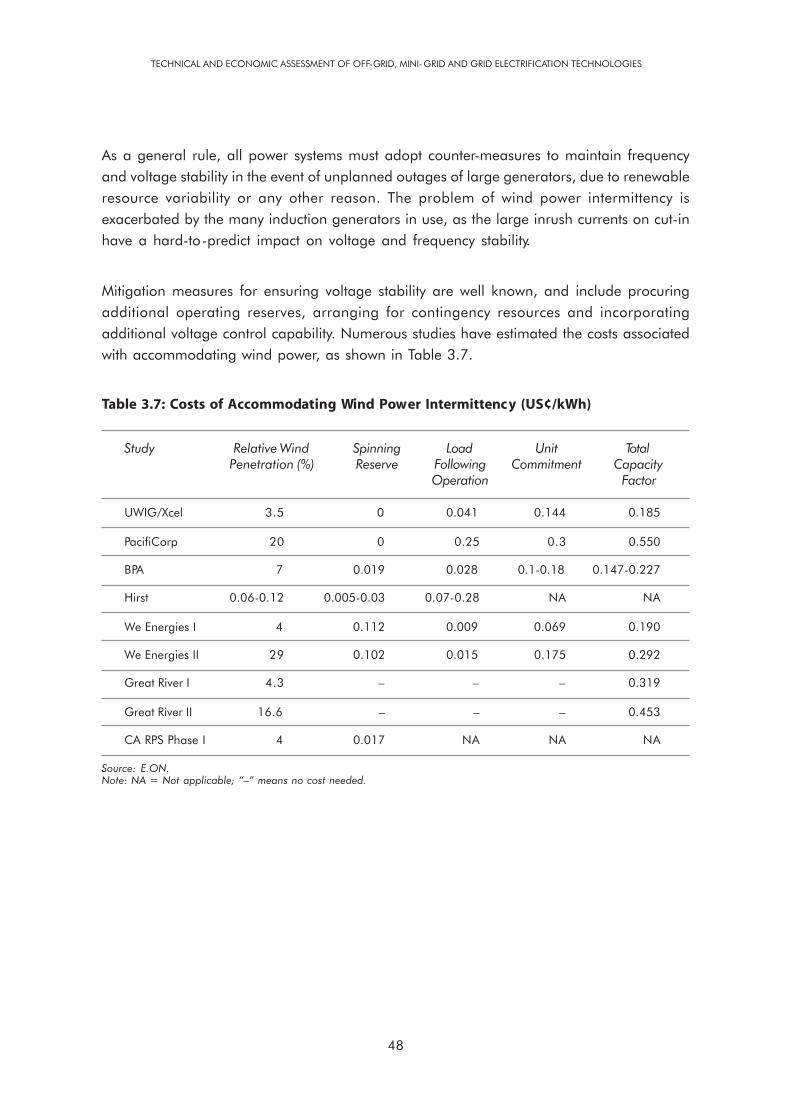
TECHNICAL AND ECONOMIC ASSESSMENT OF OFF-GRID, MINI-GRID AND GRID ELECTRIFICATION TECHNOLOGIES
48
As a general rule, all power systems must adopt counter-measures to maintain frequencyand voltage stability in the event of unplanned outages of large generators, due to renewableresource variability or any other reason. The problem of wind power intermittency isexacerbated by the many induction generators in use, as the large inrush currents on cut-inhave a hard-to-predict impact on voltage and frequency stability.
Mitigation measures for ensuring voltage stability are well known, and include procuringadditional operating reserves, arranging for contingency resources and incorporatingadditional voltage control capability. Numerous studies have estimated the costs associatedwith accommodating wind power, as shown in Table 3.7.
Table 3.7: Costs of Accommodating Wind Power Intermittency (US¢/kWh)
Study Relative Wind Spinning Load Unit TotalPenetration (%) Reserve Following Commitment Capacity
Operation Factor
UWIG/Xcel 3.5 0 0.041 0.144 0.185
PacifiCorp 20 0 0.25 0.3 0.550
BPA 7 0.019 0.028 0.1-0.18 0.147-0.227
Hirst 0.06-0.12 0.005-0.03 0.07-0.28 NA NA
We Energies I 4 0.112 0.009 0.069 0.190
We Energies II 29 0.102 0.015 0.175 0.292
Great River I 4.3 – – – 0.319
Great River II 16.6 – – – 0.453
CA RPS Phase I 4 0.017 NA NA NA
Source: E.ON.Note: NA = Not applicable; “–” means no cost needed.
49
This section presents the results of the economic assessment of power generation technologiesin various grid configurations. The work undertaken was intended to identify, characterizeand assess the technical, economic and commercial prospects for a broad spectrum ofelectricity generation and delivery technologies capable of serving rural, peri-urban andurban populations in developing countries. The study covered a total of 22 technologies,which, together, with applications, permutations and deployment configurations comprised42 total cases. The technologies included both renewable and fossil fuel-based powergeneration technologies in configurations suitable for off-grid, mini-grid and small andlarge grid-connected operations.
Our objective in developing these economic assessments was to assist the power systemplanner or policy maker to make the right technology selection, given local conditions andavailable resources. The assessment results are necessarily generic, providing an indicativebut not conclusive or specific comparison of relative generation capital cost and generatingcost. Given the variability in RE resources and other technology performance parameters,these first-order calculations need to be refined using national or site-specific data to yielda conclusive comparison. Furthermore, the analysis does not consider the interactions andcombinations of use of technologies within an overall power supply plan in order to provideelectricity at the least cost by appropriate combination of peak, mid-peak and off-peakgeneration options.
There are several summary result Tables included in the following subsections.Section 4.1 presents the generation capital costs of 22 electric power generationtechnologies in US$ per kW. Section 4.2 presents the corresponding levelized generatingcosts in US¢ per kWh. The economic assessment process generated similarly detailed datafor capital costs and generating costs projected for 2010 and 2015, including estimateduncertainty bands. This information is provided technology-by-technology in the CD-ROM(see Annex 3) to this report.
4. Results and Discussion
TECHNICAL AND ECONOMIC ASSESSMENT OF OFF-GRID, MINI-GRID AND GRID ELECTRIFICATION TECHNOLOGIES
50
Power Generation Technology Configurations
Throughout the presentation of assessment results we retain generation capacity as a simpleorganizing principle. We distinguish four size ranges: Large grid-connected powergeneration, small grid-connected power generation, power generation in mini-grids andoff-grid power generation.
Power generation technologies larger than 100 MW capacity are exclusively conventionalpower plants burning fossil fuels (coal, heavy oil or natural gas), or are large hydroelectricpower plants. In developing countries, power plants of this magnitude are operated bycentral or state electricity boards or in some cases by investor-owned utility companies orby independent power operations. The units in this range are always grid-connected andserve urban or peri-urban areas with high-load density.
Power generation technologies in the 5-50 MW range can be either conventional powerplants burning fossil fuels or renewable power plants using solar, wind, geothermal, hydro,biomass or biogas resources. The units in this range are usually grid-connected, but canalso be operated in a mini- or distributed-grid configuration or in auto-production mode.These power generation technology types and sizes find wide application in grid-connectedpower applications serving rural and suburban areas, dedicated industrial or largecommercial customers, and mini-grids serving rural or peri-urban areas. The option ofcombined heat and power plants are not considered in this evaluation.
Power generation technologies smaller than 5,000 kW are often configured for servingsmall stand-alone loads or noninterconnected mini-grids. These technologies frequentlyuse RE sources including solar, wind, hydro, biomass or biogas, are often configured inhybrid arrangements with small, diesel engine-generators as a back-up supply, and arefrequently found in mini-grid or off-grid applications and in developing countries.
Finally, it is possible to configure some power generation technologies down to the individualfacility, household or business. This type of off-grid arrangement is possible with solar, wind,hydro, biomass and diesel power generation technologies of size less than 25 kW. However,such an arrangement would be a least-cost electrification solution only if mini-gridarrangements or grid connection were not economical prospects.
Results: Power Generation Capital Costs
Table 4.1 and Table 4.2 provide detailed economic capital cost characterizations of eachpower generation technology configuration as of 2005, arranged according to use ofRE vs. fossil fuels. This data is useful for the planner attempting to estimate capital costrequirements for various technologies and size ranges. As would be expected, the largerconventional power stations are much less expensive in initial cost terms than the renewablepower technologies, although there are some exceptions. Biomass gasifiers, windpower and micro/mini hydro all have capital costs of less than US$1,800/kW. Table 4.3 showsthe range of 2005 and projected 2010 and 2015 capital costs for each generation technology.
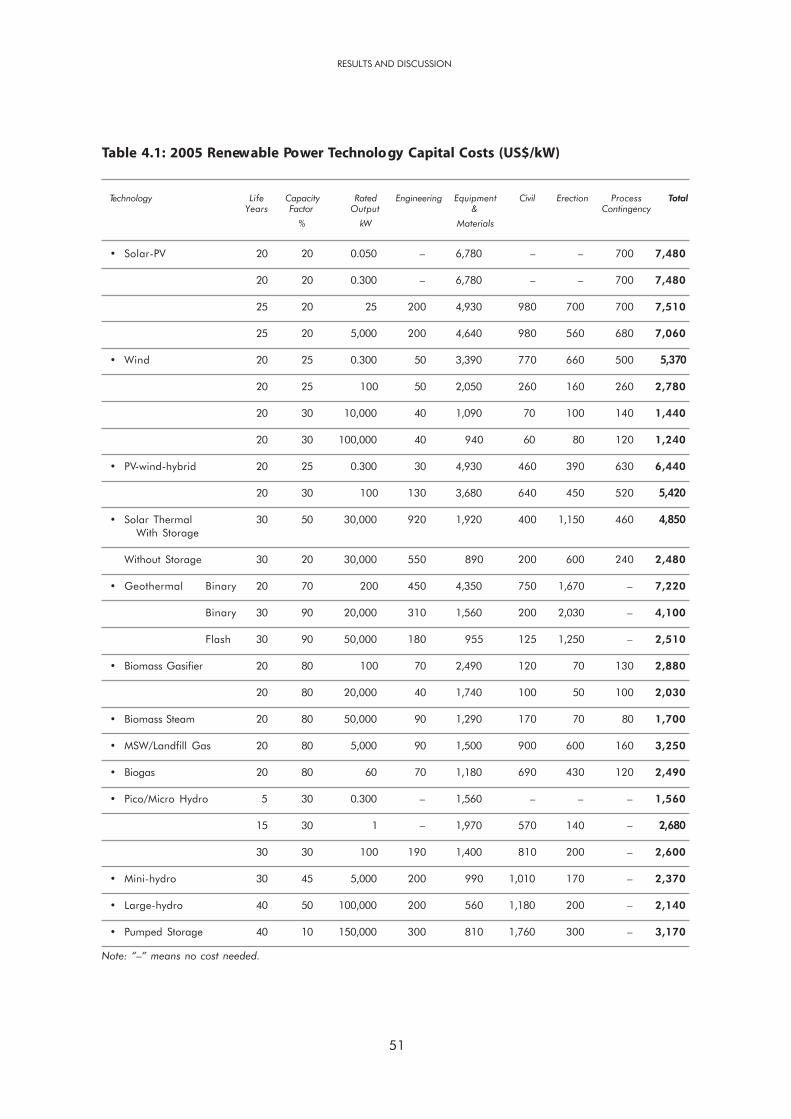
51
Table 4.1: 2005 Renewable Power Technology Capital Costs (US$/kW)
Technology Life Capacity Rated Engineering Equipment Civil Erection Process TotalYears Factor Output & Contingency
% kW Materials
• Solar-PV 20 20 0.050 – 6,780 – – 700 7,480
20 20 0.300 – 6,780 – – 700 7,480
25 20 25 200 4,930 980 700 700 7,510
25 20 5,000 200 4,640 980 560 680 7,060
• Wind 20 25 0.300 50 3,390 770 660 500 5,370
20 25 100 50 2,050 260 160 260 2,780
20 30 10,000 40 1,090 70 100 140 1,440
20 30 100,000 40 940 60 80 120 1,240
• PV-wind-hybrid 20 25 0.300 30 4,930 460 390 630 6,440
20 30 100 130 3,680 640 450 520 5,420
• Solar Thermal 30 50 30,000 920 1,920 400 1,150 460 4,850With Storage
Without Storage 30 20 30,000 550 890 200 600 240 2,480
• Geothermal Binary 20 70 200 450 4,350 750 1,670 – 7,220
Binary 30 90 20,000 310 1,560 200 2,030 – 4,100
Flash 30 90 50,000 180 955 125 1,250 – 2,510
• Biomass Gasifier 20 80 100 70 2,490 120 70 130 2,880
20 80 20,000 40 1,740 100 50 100 2,030
• Biomass Steam 20 80 50,000 90 1,290 170 70 80 1,700
• MSW/Landfill Gas 20 80 5,000 90 1,500 900 600 160 3,250
• Biogas 20 80 60 70 1,180 690 430 120 2,490
• Pico/Micro Hydro 5 30 0.300 – 1,560 – – – 1,560
15 30 1 – 1,970 570 140 – 2,680
30 30 100 190 1,400 810 200 – 2,600
• Mini-hydro 30 45 5,000 200 990 1,010 170 – 2,370
• Large-hydro 40 50 100,000 200 560 1,180 200 – 2,140
• Pumped Storage 40 10 150,000 300 810 1,760 300 – 3,170
Note: “–” means no cost needed.
RESULTS AND DISCUSSION
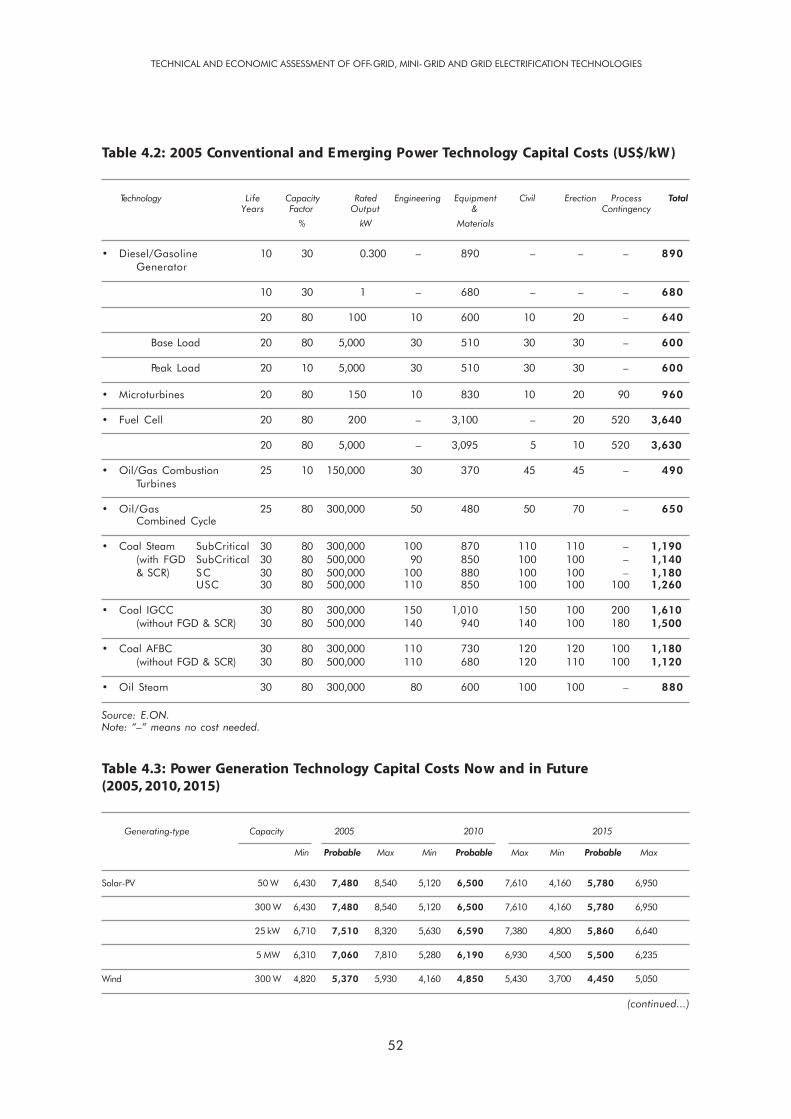
TECHNICAL AND ECONOMIC ASSESSMENT OF OFF-GRID, MINI-GRID AND GRID ELECTRIFICATION TECHNOLOGIES
52
Table 4.2: 2005 Conventional and Emerging Power Technology Capital Costs (US$/kW)
Technology Life Capacity Rated Engineering Equipment Civil Erection Process TotalYears Factor Output & Contingency
% kW Materials
• Diesel/Gasoline 10 30 0.300 – 890 – – – 890Generator
10 30 1 – 680 – – – 680
20 80 100 10 600 10 20 – 640
Base Load 20 80 5,000 30 510 30 30 – 600
Peak Load 20 10 5,000 30 510 30 30 – 600
• Microturbines 20 80 150 10 830 10 20 90 960
• Fuel Cell 20 80 200 – 3,100 – 20 520 3,640
20 80 5,000 – 3,095 5 10 520 3,630
• Oil/Gas Combustion 25 10 150,000 30 370 45 45 – 490Turbines
• Oil/Gas 25 80 300,000 50 480 50 70 – 650Combined Cycle
• Coal Steam SubCritical 30 80 300,000 100 870 110 110 – 1,190(with FGD SubCritical 30 80 500,000 90 850 100 100 – 1,140& SCR) SC 30 80 500,000 100 880 100 100 – 1,180
USC 30 80 500,000 110 850 100 100 100 1,260
• Coal IGCC 30 80 300,000 150 1,010 150 100 200 1,610(without FGD & SCR) 30 80 500,000 140 940 140 100 180 1,500
• Coal AFBC 30 80 300,000 110 730 120 120 100 1,180(without FGD & SCR) 30 80 500,000 110 680 120 110 100 1,120
• Oil Steam 30 80 300,000 80 600 100 100 – 880
Source: E.ON.Note: “–” means no cost needed.
Table 4.3: Power Generation Technology Capital Costs Now and in Future(2005, 2010, 2015)
Generating-type Capacity 2005 2010 2015
Min Probable Max Min Probable Max Min Probable Max
Solar-PV 50 W 6,430 7,480 8,540 5,120 6,500 7,610 4,160 5,780 6,950
300 W 6,430 7,480 8,540 5,120 6,500 7,610 4,160 5,780 6,950
25 kW 6,710 7,510 8,320 5,630 6,590 7,380 4,800 5,860 6,640
5 MW 6,310 7,060 7,810 5,280 6,190 6,930 4,500 5,500 6,235
Wind 300 W 4,820 5,370 5,930 4,160 4,850 5,430 3,700 4,450 5,050
(continued...)
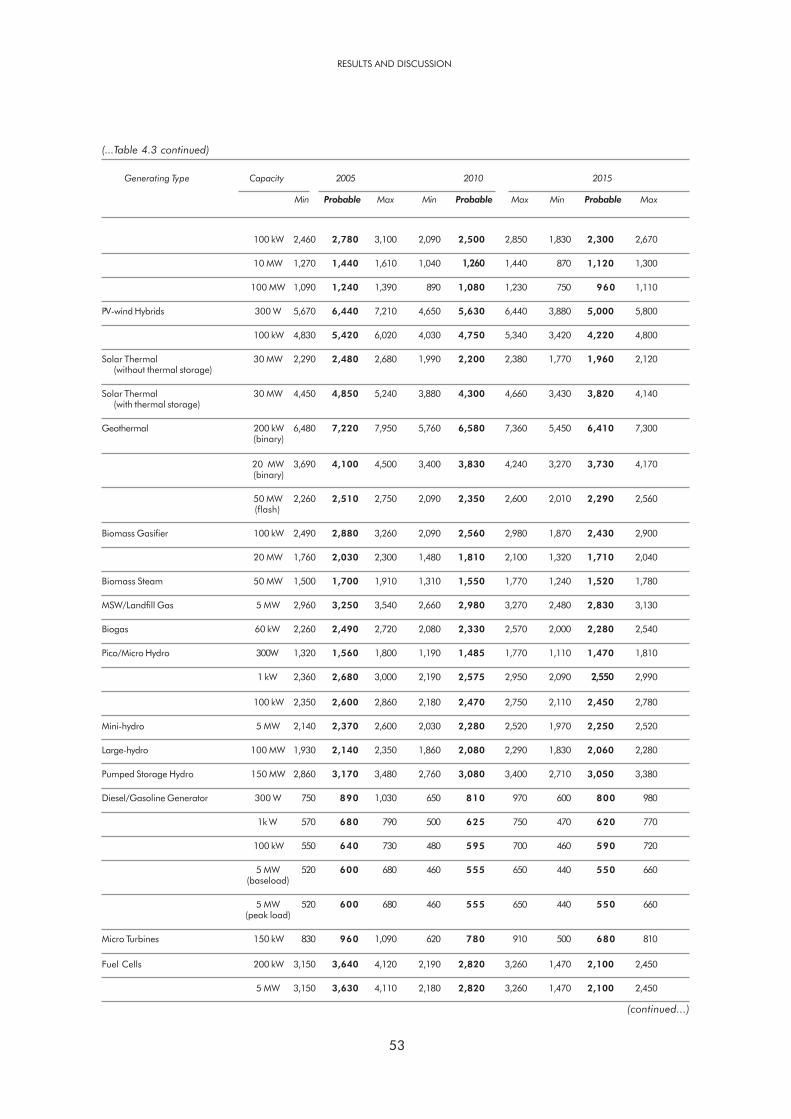
53
RESULTS AND DISCUSSION
100 kW 2,460 2,780 3,100 2,090 2,500 2,850 1,830 2,300 2,670
10 MW 1,270 1,440 1,610 1,040 1,260 1,440 870 1,120 1,300
100 MW 1,090 1,240 1,390 890 1,080 1,230 750 960 1,110
PV-wind Hybrids 300 W 5,670 6,440 7,210 4,650 5,630 6,440 3,880 5,000 5,800
100 kW 4,830 5,420 6,020 4,030 4,750 5,340 3,420 4,220 4,800
Solar Thermal 30 MW 2,290 2,480 2,680 1,990 2,200 2,380 1,770 1,960 2,120(without thermal storage)
Solar Thermal 30 MW 4,450 4,850 5,240 3,880 4,300 4,660 3,430 3,820 4,140(with thermal storage)
Geothermal 200 kW 6,480 7,220 7,950 5,760 6,580 7,360 5,450 6,410 7,300(binary)
20 MW 3,690 4,100 4,500 3,400 3,830 4,240 3,270 3,730 4,170(binary)
50 MW 2,260 2,510 2,750 2,090 2,350 2,600 2,010 2,290 2,560(flash)
Biomass Gasifier 100 kW 2,490 2,880 3,260 2,090 2,560 2,980 1,870 2,430 2,900
20 MW 1,760 2,030 2,300 1,480 1,810 2,100 1,320 1,710 2,040
Biomass Steam 50 MW 1,500 1,700 1,910 1,310 1,550 1,770 1,240 1,520 1,780
MSW/Landfill Gas 5 MW 2,960 3,250 3,540 2,660 2,980 3,270 2,480 2,830 3,130
Biogas 60 kW 2,260 2,490 2,720 2,080 2,330 2,570 2,000 2,280 2,540
Pico/Micro Hydro 300W 1,320 1,560 1,800 1,190 1,485 1,770 1,110 1,470 1,810
1 kW 2,360 2,680 3,000 2,190 2,575 2,950 2,090 2,550 2,990
100 kW 2,350 2,600 2,860 2,180 2,470 2,750 2,110 2,450 2,780
Mini-hydro 5 MW 2,140 2,370 2,600 2,030 2,280 2,520 1,970 2,250 2,520
Large-hydro 100 MW 1,930 2,140 2,350 1,860 2,080 2,290 1,830 2,060 2,280
Pumped Storage Hydro 150 MW 2,860 3,170 3,480 2,760 3,080 3,400 2,710 3,050 3,380
Diesel/Gasoline Generator 300 W 750 890 1,030 650 810 970 600 800 980
1k W 570 680 790 500 625 750 470 620 770
100 kW 550 640 730 480 595 700 460 590 720
5 MW 520 600 680 460 555 650 440 550 660(baseload)
5 MW 520 600 680 460 555 650 440 550 660(peak load)
Micro Turbines 150 kW 830 960 1,090 620 780 910 500 680 810
Fuel Cells 200 kW 3,150 3,640 4,120 2,190 2,820 3,260 1,470 2,100 2,450
5 MW 3,150 3,630 4,110 2,180 2,820 3,260 1,470 2,100 2,450
Generating Type Capacity 2005 2010 2015
Min Probable Max Min Probable Max Min Probable Max
(...Table 4.3 continued)
(continued...)
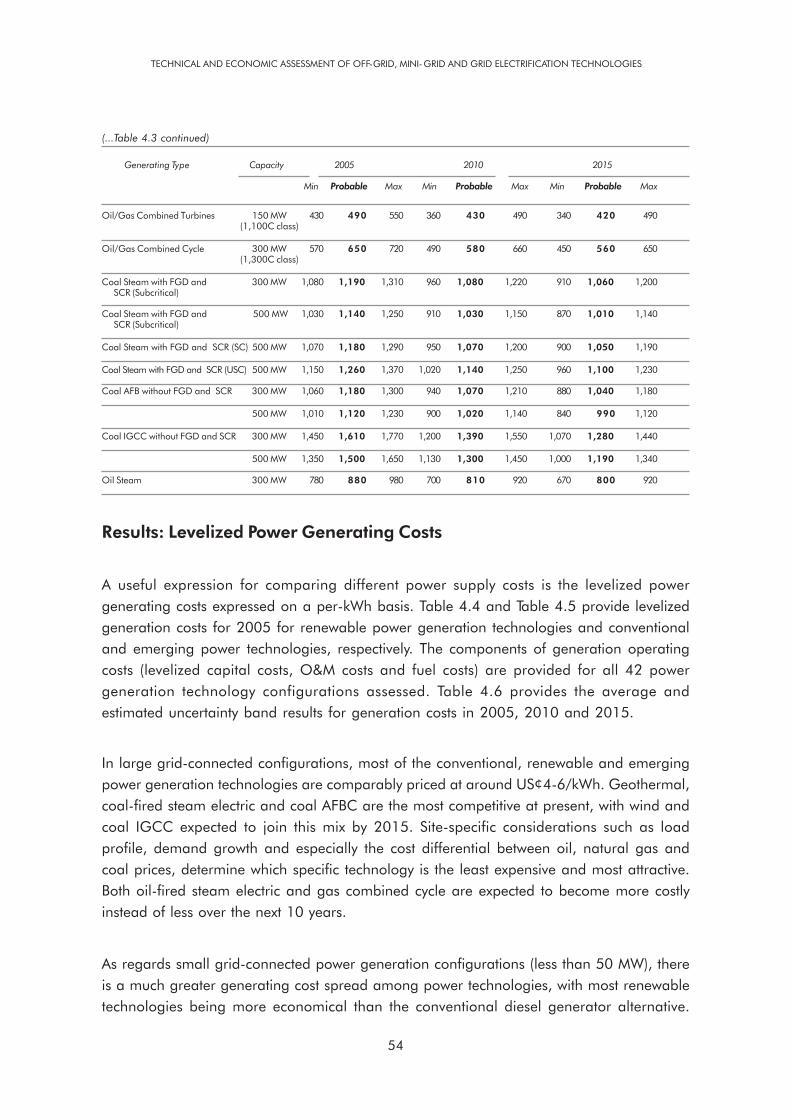
TECHNICAL AND ECONOMIC ASSESSMENT OF OFF-GRID, MINI-GRID AND GRID ELECTRIFICATION TECHNOLOGIES
54
Oil/Gas Combined Turbines 150 MW 430 490 550 360 430 490 340 420 490(1,100C class)
Oil/Gas Combined Cycle 300 MW 570 650 720 490 580 660 450 560 650(1,300C class)
Coal Steam with FGD and 300 MW 1,080 1,190 1,310 960 1,080 1,220 910 1,060 1,200SCR (Subcritical)
Coal Steam with FGD and 500 MW 1,030 1,140 1,250 910 1,030 1,150 870 1,010 1,140SCR (Subcritical)
Coal Steam with FGD and SCR (SC) 500 MW 1,070 1,180 1,290 950 1,070 1,200 900 1,050 1,190
Coal Steam with FGD and SCR (USC) 500 MW 1,150 1,260 1,370 1,020 1,140 1,250 960 1,100 1,230
Coal AFB without FGD and SCR 300 MW 1,060 1,180 1,300 940 1,070 1,210 880 1,040 1,180
500 MW 1,010 1,120 1,230 900 1,020 1,140 840 990 1,120
Coal IGCC without FGD and SCR 300 MW 1,450 1,610 1,770 1,200 1,390 1,550 1,070 1,280 1,440
500 MW 1,350 1,500 1,650 1,130 1,300 1,450 1,000 1,190 1,340
Oil Steam 300 MW 780 880 980 700 810 920 670 800 920
Results: Levelized Power Generating Costs
A useful expression for comparing different power supply costs is the levelized powergenerating costs expressed on a per-kWh basis. Table 4.4 and Table 4.5 provide levelizedgeneration costs for 2005 for renewable power generation technologies and conventionaland emerging power technologies, respectively. The components of generation operatingcosts (levelized capital costs, O&M costs and fuel costs) are provided for all 42 powergeneration technology configurations assessed. Table 4.6 provides the average andestimated uncertainty band results for generation costs in 2005, 2010 and 2015.
In large grid-connected configurations, most of the conventional, renewable and emergingpower generation technologies are comparably priced at around US¢4-6/kWh. Geothermal,coal-fired steam electric and coal AFBC are the most competitive at present, with wind andcoal IGCC expected to join this mix by 2015. Site-specific considerations such as loadprofile, demand growth and especially the cost differential between oil, natural gas andcoal prices, determine which specific technology is the least expensive and most attractive.Both oil-fired steam electric and gas combined cycle are expected to become more costlyinstead of less over the next 10 years.
As regards small grid-connected power generation configurations (less than 50 MW), thereis a much greater generating cost spread among power technologies, with most renewabletechnologies being more economical than the conventional diesel generator alternative.
Generating Type Capacity 2005 2010 2015
Min Probable Max Min Probable Max Min Probable Max
(...Table 4.3 continued)

55
RESULTS AND DISCUSSION
Table 4.4: 2005 Renewable Power Technology Generating Costs (US¢/kWh)
Technology Rated Output kW Levelized Fixed O&M Variable Fuel AverageCapital Cost Costs O&M Costs Costs Levelized Cost
• Solar-PV 0.050 45.59 3.00 13.00 – 61.59
0.300 45.59 2.50 8.00 – 56.09
25 42.93 1.50 7.00 – 51.43
5,000 40.36 0.97 0.24 – 41.57
• Wind 0.300 26.18 3.49 4.90 – 34.57
100 13.55 2.08 4.08 – 19.71
10,000 5.85 0.66 0.26 – 6.71
100,000 5.08 0.53 0.22 – 5.79
• PV-wind-hybrid 0.300 31.40 3.48 6.90 – 41.78
100 22.02 2.07 6.40 – 30.49
• Solar-thermal With Storage 30,000 10.68 1.82 0.45 – 12.95
Without Storage 30,000 13.65 3.01 0.75 – 17.41
• Geothermal Binary 200 12.57 2.00 1.00 – 15.57
Binary 20,000 5.02 1.30 0.40 – 6.72
Flash 50,000 3.07 0.90 0.30 – 4.27
• Biomass Gasifier 100 4.39 0.34 1.57 2.66 8.96
20,000 3.09 0.25 1.18 2.50 7.02
• Biomass Steam 50,000 2.59 0.45 0.41 2.50 5.95
• MSW/Landfill Gas 5,000 4.95 0.11 0.43 1.00 6.49
• Biogas 60 3.79 0.34 1.54 1.10 6.77
• Pico/Micro-hydro 0.300 14.24 0.00 0.90 – 15.14
1 12.19 0.00 0.54 – 12.73
100 9.54 1.05 0.42 – 11.01
• Mini-hydro 5,000 5.86 0.74 0.35 – 6.95
• Large-hydro 100,000 4.56 0.50 0.32 – 5.38
• Pumped Storage 150,000 34.08 0.32 0.33 – 34.73
Note: “–” means no cost needed.
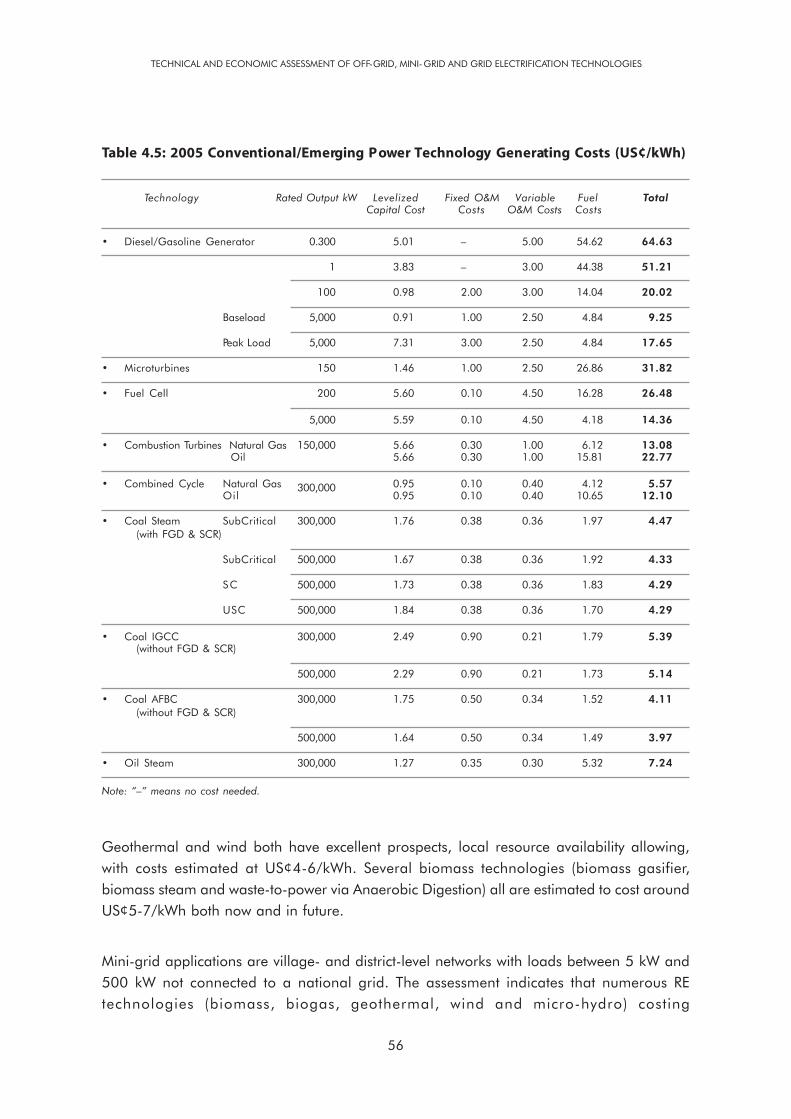
TECHNICAL AND ECONOMIC ASSESSMENT OF OFF-GRID, MINI-GRID AND GRID ELECTRIFICATION TECHNOLOGIES
56
Table 4.5: 2005 Conventional/Emerging Power Technology Generating Costs (US¢/kWh)
Technology Rated Output kW Levelized Fixed O&M Variable Fuel TotalCapital Cost Costs O&M Costs Costs
• Diesel/Gasoline Generator 0.300 5.01 – 5.00 54.62 64.63
1 3.83 – 3.00 44.38 51.21
100 0.98 2.00 3.00 14.04 20.02
Baseload 5,000 0.91 1.00 2.50 4.84 9.25
Peak Load 5,000 7.31 3.00 2.50 4.84 17.65
• Microturbines 150 1.46 1.00 2.50 26.86 31.82
• Fuel Cell 200 5.60 0.10 4.50 16.28 26.48
5,000 5.59 0.10 4.50 4.18 14.36
• Combustion Turbines Natural Gas 150,000 5.66 0.30 1.00 6.12 13.08 Oil 5.66 0.30 1.00 15.81 22.77
• Combined Cycle Natural Gas 0.95 0.10 0.40 4.12 5.57Oil
300,0000.95 0.10 0.40 10.65 12.10
• Coal Steam SubCritical 300,000 1.76 0.38 0.36 1.97 4.47(with FGD & SCR)
SubCritical 500,000 1.67 0.38 0.36 1.92 4.33
SC 500,000 1.73 0.38 0.36 1.83 4.29
USC 500,000 1.84 0.38 0.36 1.70 4.29
• Coal IGCC 300,000 2.49 0.90 0.21 1.79 5.39(without FGD & SCR)
500,000 2.29 0.90 0.21 1.73 5.14
• Coal AFBC 300,000 1.75 0.50 0.34 1.52 4.11(without FGD & SCR)
500,000 1.64 0.50 0.34 1.49 3.97
• Oil Steam 300,000 1.27 0.35 0.30 5.32 7.24
Note: “–” means no cost needed.
Geothermal and wind both have excellent prospects, local resource availability allowing,with costs estimated at US¢4-6/kWh. Several biomass technologies (biomass gasifier,biomass steam and waste-to-power via Anaerobic Digestion) all are estimated to cost aroundUS¢5-7/kWh both now and in future.
Mini-grid applications are village- and district-level networks with loads between 5 kW and500 kW not connected to a national grid. The assessment indicates that numerous REtechnologies (biomass, biogas, geothermal, wind and micro-hydro) costing
57
US¢6-15/kWh are the potential least-cost generation option for mini-grids, assuming asufficient RE resource is available. Two biomass technologies – biogas digesters and biomassgasifiers – seem particularly promising, due to their high capacity factors and availabilityin size ranges matched to mini-grid loads. Geothermal also appears economical,recognizing that it is restricted to a relatively few developing economies. Since so many REsources are viable in this size range, mini-grid planners should thoroughly review their optionsto make the best selection.
The only electrification technology choice for small, isolated loads is expensivediesel generation and several renewable power options, including pico-hydo, geothermal,small wind and solar PV. These renewable technologies are the least-cost option on alevelized generating cost basis for off-grid electrification, assuming resource availability.However, these off-grid configurations are very expensive (US¢30-50/kWh), with pico-hydrothe notable exception at only US¢12/kWh. However, they are economical when comparedwith the US¢45-60/kWh for a small, stand-alone gasoline or diesel engine generator.
Discussion: Power Delivery Costs
The costs of transmitting and distributing electricity production need to be included in theoverall economic assessment of different power generation configurations.As described in Section 3, the capital costs of transmission and delivery are driven by theamount of power transmitted and the distance over which delivery takes place. For largegrid-connected power plants, comparably located with respect to the load being servedthe associated transmission and distribution costs cancel out and a comparison can bemade based on generation costs alone. However, for some smaller loads with low capacityfactors, especially in a mini-grid configuration, the power delivery costs on a levelized basiscan vary considerably when spread across the amount of electricity delivered. These costsneed to be taken into account in a way that does not unduly tilt the economic assessmentaccording to capacity factor. Because the economic assessment of power deliveryrequirements needs more development, we do not include the capital cost or levelized costof power delivery in our comparisons of power generation technology alternatives.
Discussion: Sensitivity of Projected Generation Costs to TechnologyChange and Fuel Costs
As described in the Executive Summary, many renewable power generation technologiesare expected to have improved performance and lower capital costs in the near future.Some conventional power generation technologies, especially coal- and oil-fired steamelectric, also have prospects for improved performance and lower costs through use ofadvanced materials allowing higher temperature operation. Additionally, several emergingtechnologies, including microturbines and fuel cells as well as coal-fired IGCC and AFBC,
RESULTS AND DISCUSSION
TECHNICAL AND ECONOMIC ASSESSMENT OF OFF-GRID, MINI-GRID AND GRID ELECTRIFICATION TECHNOLOGIES
58
are expected to be very competitive within a few years. We have done our best to anticipatethe performance improvements and capital cost reductions of these technologies based onindustry literature and forecasts.
An additional key factor in projecting future costs is the cost of fuel. Any fossil fuel usingpower generation technology and especially oil- and gas-fired technologies are subject tosecular fuel price increases, fuel price fluctuations and growing risk of availability. Gas andoil price forecasts have uniformly taken on a broader error band just in the past year.
These factors – performance improvements outlook, cost reduction trajectories anduncertainties in cost input assumptions – were captured in projections of capital andproduction costs for each power generation technology in 2010 and 2015. An uncertaintyanalysis allowed future capital and generation cost projections to include an“uncertainty band” around the average cost estimate for each technology and configuration.
An argument can be made that conservative power system planners would be better off choosingpower generation technologies that have a narrower sensitivity range in future capital andgenerating costs forecasts. Generation technologies that are not dependent on fossil fuels andare fairly well developed at present will tend to have the narrowest sensitivities in forecast capitalor generating cost. This category includes several of the RETs, notably the biomass, hydroelectricand geothermal technologies across size ranges. Such insensitivity to technology or fuel pricevariability could be a competitive advantage for these technologies.
Conclusion
RETs fare surprisingly well in several electrification configurations. In addition to proving moreeconomical in the very expensive off-grid category, they are also more economical in mini-gridapplications and even when compared with small grid-connected generation (less than 50MW). Since power system planners generally operate on an incremental basis, with new capacityadditions (generation, transmission or distribution) timed and sized to accommodate the locationand pace of load growth, the findings here suggest that scale and insensitivity to fuel andtechnology change factors could affect the economics of choosing generation configurations infuture. When the national or regional grid is developed and includes sufficient transmissioncapacity, and incremental load growth is fast, large, central-station gas combined cycle andcoal fired power plants would clearly be the least-cost alternatives. However, if the size of thegrid is limited, or the incremental load growth is small, it may make economic sense to addseveral smaller renewable or diesel power stations rather than add one very large conventionalpower station. Taking advantage of local resources such as indigenous coal, gas, biomass orgeothermal or wind or hydro and constructing smaller power stations may provide energysecurity and avoid some of the uncertainty associated with international fuel prices.
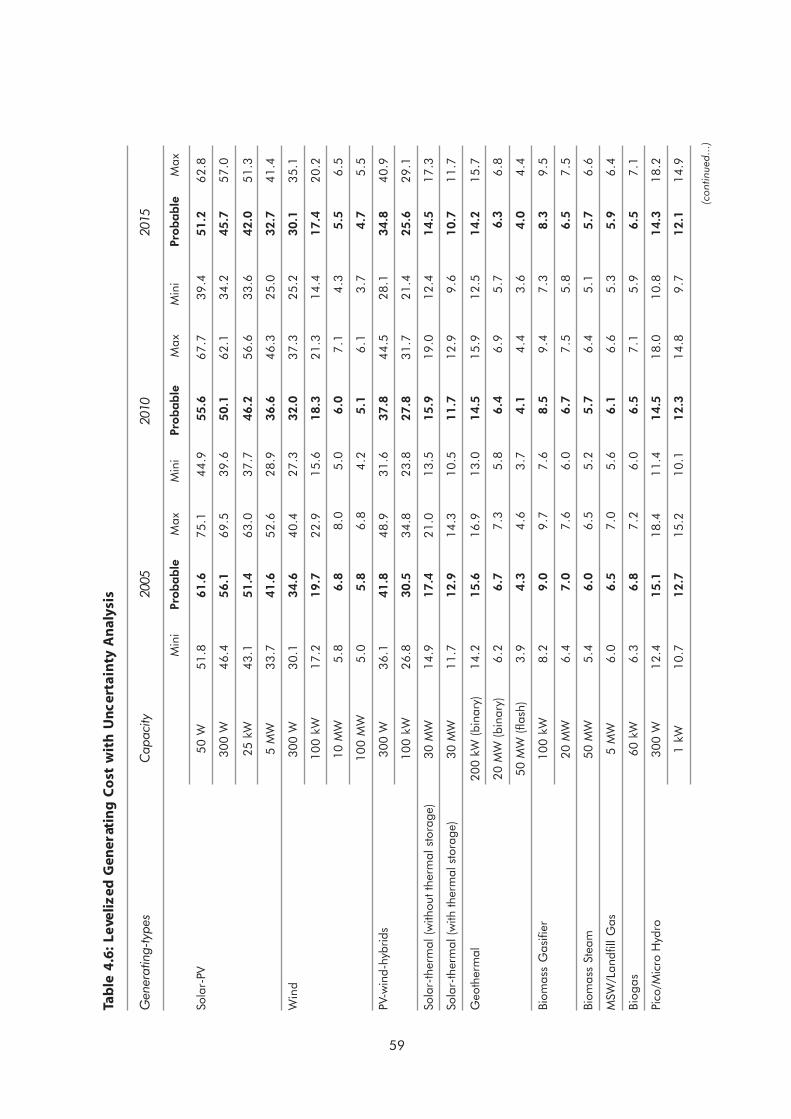
59
Tab
le 4
.6:
Leve
liz
ed G
ener
atin
g C
ost
wit
h U
ncer
tain
ty A
nal
ysis
(con
tinue
d...
)
Gen
erat
ing-
type
sC
apac
ity20
0520
1020
15
Min
iPr
obable
Max
Min
iPr
obable
Max
Min
iPr
obable
Max
Sola
r-PV
50 W
51
.861.6
75
.14
4.9
55.6
67
.73
9.4
51.2
62
.8
300
W4
6.4
56.1
69
.53
9.6
50.1
62
.13
4.2
45.7
57
.0
25 k
W4
3.1
51.4
63
.03
7.7
46.2
56
.63
3.6
42.0
51
.3
5 M
W3
3.7
41.6
52
.62
8.9
36.6
46
.32
5.0
32.7
41
.4
Win
d30
0 W
30
.134.6
40
.42
7.3
32.0
37
.32
5.2
30.1
35
.1
10
0 k
W1
7.2
19.7
22
.91
5.6
18.3
21
.31
4.4
17.4
20
.2
10 M
W5
.86
.88
.05
.06
.07
.14
.35
.56
.5
10
0 M
W5
.05
.86
.84
.25
.16
.13
.74
.75
.5
PV-w
ind-
hybr
ids
300
W3
6.1
41.8
48
.93
1.6
37.8
44
.52
8.1
34.8
40
.9
10
0 k
W2
6.8
30.5
34
.82
3.8
27.8
31
.72
1.4
25.6
29
.1
Sola
r-th
erm
al (w
ithou
t the
rmal
sto
rage
)30
MW
14
.917.4
21
.01
3.5
15.9
19
.01
2.4
14.5
17
.3
Sola
r-th
erm
al (w
ith th
erm
al s
tora
ge)
30 M
W1
1.7
12.9
14
.31
0.5
11.7
12
.99
.610.7
11
.7
Geo
ther
mal
200
kW (b
inar
y)1
4.2
15.6
16
.91
3.0
14.5
15
.91
2.5
14.2
15
.7
20 M
W (b
inar
y)6
.26
.77
.35
.86
.46
.95
.76.
36
.8
50 M
W (f
lash
)3
.94
.34
.63
.74
.14
.43
.64
.04
.4
Biom
ass
Gas
ifier
10
0 k
W8
.29
.09
.77
.68
.59
.47
.38
.39
.5
20 M
W6
.47
.07
.66
.06
.77
.55
.86
.57
.5
Biom
ass
Stea
m50
MW
5.4
6.0
6.5
5.2
5.7
6.4
5.1
5.7
6.6
MSW
/Lan
dfill
Gas
5 M
W6
.06
.57
.05
.66
.16
.65
.35
.96
.4
Biog
as60
kW
6.3
6.8
7.2
6.0
6.5
7.1
5.9
6.5
7.1
Pico
/Mic
ro H
ydro
300
W1
2.4
15.1
18
.41
1.4
14.5
18
.01
0.8
14.3
18
.2
1 kW
10
.712.7
15
.21
0.1
12.3
14
.89
.712.1
14
.9

TECHNICAL AND ECONOMIC ASSESSMENT OF OFF-GRID, MINI-GRID AND GRID ELECTRIFICATION TECHNOLOGIES
60
(...T
able
4.6
con
tinue
d)
10
0 k
W9
.611.0
12
.89
.110.5
12
.38
.910.5
12
.3
Min
i H
ydro
5 M
W5
.96
.98
.35
.76
.78
.15
.66
.68
.0
Larg
e H
ydro
100
MW
4.6
5.4
6.3
4.5
5.2
6.2
4.5
5.2
6.2
Pum
ped
Stor
age
Hyd
ro1
50
MW
31
.434.7
38
.13
0.3
33.8
37
.22
9.9
33.4
36
.9
Die
sel/
Gas
olin
e G
ener
ator
300
W5
9.0
64.6
72
.55
2.4
59.7
71
.85
2.5
60.2
75
.0
1 kW
46
.751.2
57
.64
1.4
47.3
57
.14
1.5
47.7
59
.7
10
0 k
W1
8.1
20.0
23
.11
6.6
19.0
23
.31
6.7
19.2
24
.3
5 M
W (
base
load
)8
.39
.31
0.8
7.6
8.7
10
.87
.68
.81
1.3
5 M
W (
peak
load
)1
6.2
17.7
19
.61
5.0
16.7
19
.11
4.9
16.7
19
.6
Mic
rotu
rbin
es1
50
kW
30
.431.8
33
.92
8.8
30.7
33
.52
8.5
30.7
34
.2
Fuel
Cel
ls2
00
kW
25
.226.5
28
.22
2.8
24.7
26
.62
1.5
23.7
25
.8
5 M
W1
3.2
14.4
15
.81
1.0
12.7
14
.49
.611.7
13
.4
Oil/
Gas
Com
bust
ion
Turb
ines
150
MW
(1,
100C
cla
ss)
11
.913.1
14
.71
0.4
11.8
14
.01
0.2
11.8
14
.5
Oil/
Gas
Com
bine
d C
ycle
300
MW
(1,
300C
cla
ss)
4.9
45.5
76
.55
4.2
65.1
06
.47
4.2
15.1
46
.85
Coa
l Ste
am w
ith F
GD
& S
CR
(Sub
Crit
ical
)3
00
MW
4.1
84.4
74
.95
3.9
14.2
04
.76
3.8
64.2
04
.84
Coa
l Ste
am w
ith F
GD
& S
CR
(Sub
Crit
ical
)5
00
MW
4.0
54.3
34
.79
3.7
74.0
74
.62
3.7
44.0
64
.69
Coa
l Ste
am w
ith F
GD
& S
CR
(Sub
Crit
ical
)5
00
MW
4.0
24.2
94
.74
3.7
44.0
44
.56
3.7
24.0
34
.63
Coa
l Ste
am w
ith F
GD
& S
CR
500
MW
4.0
24.2
94
.71
3.7
44.0
24
.51
3.6
93.9
94
.55
(Ultr
aSup
erC
ritic
al)
Coa
l A
FB w
ithou
t FG
D &
SC
R3
00
MW
3.8
84.1
14
.56
3.7
23.9
84
.55
3.6
73.9
64
.55
50
0 M
W3
.75
3.9
74
.40
3.6
13.8
64
.42
3.5
83.8
34
.71
Coa
l IG
CC
with
out
FGD
& S
CR
300
MW
5.0
55.3
95
.90
4.5
84.9
55
.52
4.4
04.8
15
.43
50
0 M
W4
.81
5.1
45
.62
4.3
84.7
45
.28
4.2
14.6
05
.19
Oil
Stea
m3
00
MW
6.2
17.2
49
.00
5.5
06.7
09
.08
5.4
96.7
89
.63
Gen
erat
ing-
type
sC
apac
ity20
0520
1020
15

61
ASTEA: “Statistical Analysis of Wind Farm Costs and Policy Regimes,” Working Paper.
Barnes, Douglas, 2006: Meeting the Challenge of Rural Electrification in DevelopingNations: The Experience of Successful Programs. ESMAP Discussion Paper, The World Bank,Washington, DC.
Bechtel Power: “Incremental Cost of CO2 Reduction in Power Plants,” presented at the ASMETurbo Expo, 2002.
Booras, G. (EPRI) “Pulverized Coal and IGCC Plant Cost and Performance Estimates,”Gasification Technologies 2004, Washington, DC, October 3-6, 2004.
DOE/EPRI (1997): “Renewable Energy Technology Characterizations,” TR-109496.
EPRI: “Gasification Process Selection – Trade offs and Ironies,” presented at the GasificationTechnologies Conference 2004.
Institute of Applied Energy: “Gas Microturbines.”
International Energy Agency (IEA). 2002: World Energy Outlook. Paris: InternationalEnergy Agency.
International Energy Agency (IEA). 2004: World Energy Outlook. Paris: InternationalEnergy Agency.
5. References
61
TECHNICAL AND ECONOMIC ASSESSMENT OF OFF-GRID, MINI-GRID AND GRID ELECTRIFICATION TECHNOLOGIES
62
Palkes, M., Waryasz, R.: “Economics and Feasibility of Rankine Cycle Improvements forCoal Fired Power Plants.” Final DOE-NETL Report under Cooperative Agreement No.DE-FCP-01NT41222 Prepared by Alstom Power Inc., February 2004 .
Saghir, Jamal, 2005: Energy and Poverty: Myths, Links, and Policy Issues. EnergyWorking Note No. 4, May 2005. Energy and Mining Sector Board Paper, The World Bank,Washington, DC.
The World Bank, 2001: ESMAP: “Technology Assessment of Clean Coal Technologies forChina: Electric Power Production,” Volume I, May 2001.
The World Bank, 2002: The World Bank Group’s Energy Program – Poverty Reduction,Sustainability, and Selectivity. Energy and Mining Sector Board Paper, The World Bank,Washington, DC.
The World Bank, 2003: Infrastructure Action Plan.
The World Bank, 2004: Renewing our Energy Business: The World Bank Group Energy ProgramImplementation Progress Report 2001-03. The World Bank, Washington, DC.
The World Bank, 2006: The Role of the World Bank for Energy Access: A Portfolio Review forFiscal Years 2003-05, September 2006. Douglas F. Barnes, Grayson Heffner andXiaoyu Shi.
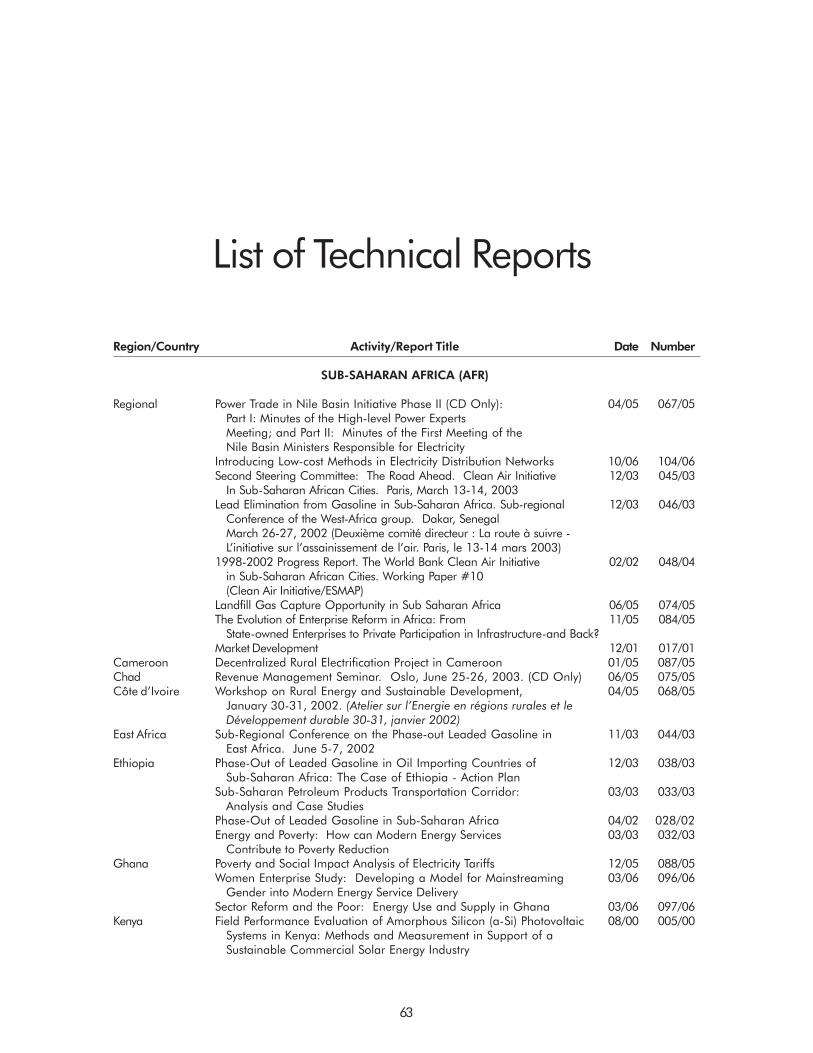
List of Technical Reports
Region/Country Activity/Report Title Date Number
SUB-SAHARAN AFRICA (AFR)
Regional Power Trade in Nile Basin Initiative Phase II (CD Only): 04/05 067/05 Part I: Minutes of the High-level Power Experts Meeting; and Part II: Minutes of the First Meeting of the Nile Basin Ministers Responsible for Electricity
Introducing Low-cost Methods in Electricity Distribution Networks 10/06 104/06 Second Steering Committee: The Road Ahead. Clean Air Initiative 12/03 045/03
In Sub-Saharan African Cities. Paris, March 13-14, 2003 Lead Elimination from Gasoline in Sub-Saharan Africa. Sub-regional 12/03 046/03
Conference of the West-Africa group. Dakar, Senegal March 26-27, 2002 (Deuxième comité directeur : La route à suivre - L’initiative sur l’assainissement de l’air. Paris, le 13-14 mars 2003)
1998-2002 Progress Report. The World Bank Clean Air Initiative 02/02 048/04 in Sub-Saharan African Cities. Working Paper #10 (Clean Air Initiative/ESMAP)
Landfill Gas Capture Opportunity in Sub Saharan Africa 06/05 074/05 The Evolution of Enterprise Reform in Africa: From 11/05 084/05
State-owned Enterprises to Private Participation in Infrastructure-and Back? Market Development 12/01 017/01
Cameroon Decentralized Rural Electrification Project in Cameroon 01/05 087/05 Chad Revenue Management Seminar. Oslo, June 25-26, 2003. (CD Only) 06/05 075/05 Côte d’Ivoire Workshop on Rural Energy and Sustainable Development, 04/05 068/05
January 30-31, 2002. (Atelier sur l’Energie en régions rurales et le Développement durable 30-31, janvier 2002)
East Africa Sub-Regional Conference on the Phase-out Leaded Gasoline in 11/03 044/03 East Africa. June 5-7, 2002
Ethiopia Phase-Out of Leaded Gasoline in Oil Importing Countries of 12/03 038/03 Sub-Saharan Africa: The Case of Ethiopia - Action Plan
Sub-Saharan Petroleum Products Transportation Corridor: 03/03 033/03 Analysis and Case Studies
Phase-Out of Leaded Gasoline in Sub-Saharan Africa 04/02 028/02 Energy and Poverty: How can Modern Energy Services 03/03 032/03
Contribute to Poverty Reduction Ghana Poverty and Social Impact Analysis of Electricity Tariffs 12/05 088/05
Women Enterprise Study: Developing a Model for Mainstreaming 03/06 096/06 Gender into Modern Energy Service Delivery
Sector Reform and the Poor: Energy Use and Supply in Ghana 03/06 097/06 Kenya Field Performance Evaluation of Amorphous Silicon (a-Si) Photovoltaic 08/00 005/00
Systems in Kenya: Methods and Measurement in Support of a Sustainable Commercial Solar Energy Industry
63
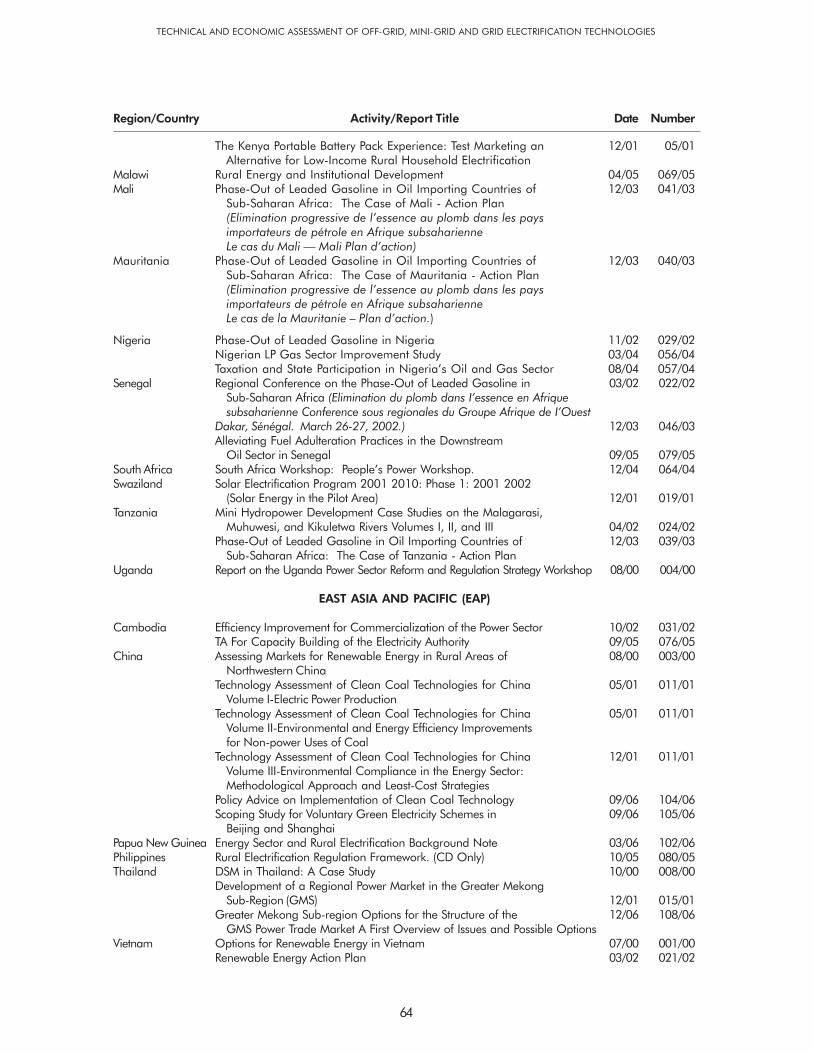
64
TECHNICAL AND ECONOMIC ASSESSMENT OF OFF-GRID, MINI-GRID AND GRID ELECTRIFICATION TECHNOLOGIES
The Kenya Portable Battery Pack Experience: Test Marketing an 12/01 05/01 Alternative for Low-Income Rural Household Electrification
Malawi Rural Energy and Institutional Development 04/05 069/05 Mali Phase-Out of Leaded Gasoline in Oil Importing Countries of 12/03 041/03
Sub-Saharan Africa: The Case of Mali - Action Plan (Elimination progressive de l’essence au plomb dans les pays importateurs de pétrole en Afrique subsaharienne Le cas du Mali — Mali Plan d’action)
Mauritania Phase-Out of Leaded Gasoline in Oil Importing Countries of 12/03 040/03 Sub-Saharan Africa: The Case of Mauritania - Action Plan (Elimination progressive de l’essence au plomb dans les pays importateurs de pétrole en Afrique subsaharienne Le cas de la Mauritanie – Plan d’action.)
Nigeria Phase-Out of Leaded Gasoline in Nigeria 11/02 029/02 Nigerian LP Gas Sector Improvement Study 03/04 056/04 Taxation and State Participation in Nigeria’s Oil and Gas Sector 08/04 057/04
Senegal Regional Conference on the Phase-Out of Leaded Gasoline in 03/02 022/02 Sub-Saharan Africa (Elimination du plomb dans I’essence en Afrique subsaharienne Conference sous regionales du Groupe Afrique de I’Ouest
Dakar, Sénégal. March 26-27, 2002.) 12/03 046/03 Alleviating Fuel Adulteration Practices in the Downstream
Oil Sector in Senegal 09/05 079/05 South Africa South Africa Workshop: People’s Power Workshop. 12/04 064/04 Swaziland Solar Electrification Program 2001 2010: Phase 1: 2001 2002
(Solar Energy in the Pilot Area) 12/01 019/01 Tanzania Mini Hydropower Development Case Studies on the Malagarasi,
Muhuwesi, and Kikuletwa Rivers Volumes I, II, and III 04/02 024/02 Phase-Out of Leaded Gasoline in Oil Importing Countries of 12/03 039/03
Sub-Saharan Africa: The Case of Tanzania - Action Plan Uganda Report on the Uganda Power Sector Reform and Regulation Strategy Workshop 08/00 004/00
EAST ASIA AND PACIFIC (EAP)
Cambodia Efficiency Improvement for Commercialization of the Power Sector 10/02 031/02 TA For Capacity Building of the Electricity Authority 09/05 076/05
China Assessing Markets for Renewable Energy in Rural Areas of 08/00 003/00 Northwestern China
Technology Assessment of Clean Coal Technologies for China 05/01 011/01 Volume I-Electric Power Production
Technology Assessment of Clean Coal Technologies for China 05/01 011/01 Volume II-Environmental and Energy Efficiency Improvements for Non-power Uses of Coal
Technology Assessment of Clean Coal Technologies for China 12/01 011/01 Volume III-Environmental Compliance in the Energy Sector: Methodological Approach and Least-Cost Strategies
Policy Advice on Implementation of Clean Coal Technology 09/06 104/06 Scoping Study for Voluntary Green Electricity Schemes in 09/06 105/06
Beijing and Shanghai Papua New Guinea Energy Sector and Rural Electrification Background Note 03/06 102/06 Philippines Rural Electrification Regulation Framework. (CD Only) 10/05 080/05 Thailand DSM in Thailand: A Case Study 10/00 008/00
Development of a Regional Power Market in the Greater Mekong Sub-Region (GMS) 12/01 015/01
Greater Mekong Sub-region Options for the Structure of the 12/06 108/06 GMS Power Trade Market A First Overview of Issues and Possible Options
Vietnam Options for Renewable Energy in Vietnam 07/00 001/00 Renewable Energy Action Plan 03/02 021/02
Region/Country Activity/Report Title Date Number
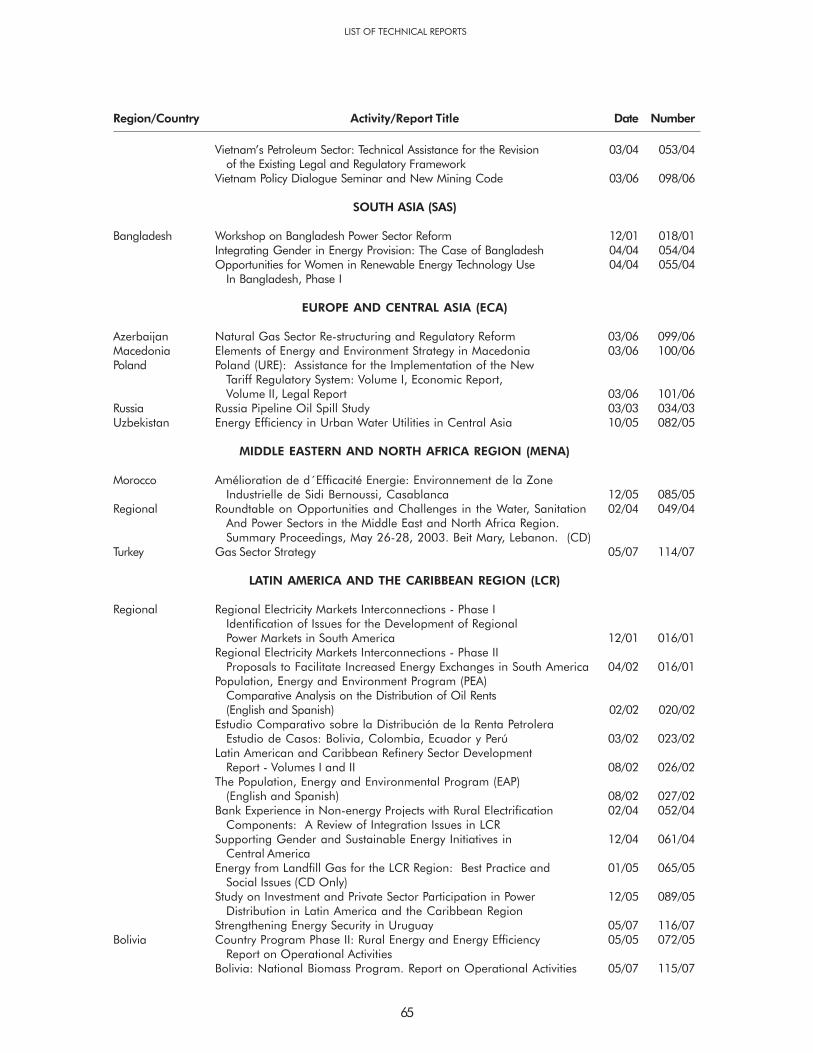
65
LIST OF TECHNICAL REPORTS
Vietnam’s Petroleum Sector: Technical Assistance for the Revision 03/04 053/04 of the Existing Legal and Regulatory Framework
Vietnam Policy Dialogue Seminar and New Mining Code 03/06 098/06
SOUTH ASIA (SAS)
Bangladesh Workshop on Bangladesh Power Sector Reform 12/01 018/01 Integrating Gender in Energy Provision: The Case of Bangladesh 04/04 054/04 Opportunities for Women in Renewable Energy Technology Use 04/04 055/04
In Bangladesh, Phase I
EUROPE AND CENTRAL ASIA (ECA)
Azerbaijan Natural Gas Sector Re-structuring and Regulatory Reform 03/06 099/06 Macedonia Elements of Energy and Environment Strategy in Macedonia 03/06 100/06 Poland Poland (URE): Assistance for the Implementation of the New
Tariff Regulatory System: Volume I, Economic Report, Volume II, Legal Report 03/06 101/06
Russia Russia Pipeline Oil Spill Study 03/03 034/03 Uzbekistan Energy Efficiency in Urban Water Utilities in Central Asia 10/05 082/05
MIDDLE EASTERN AND NORTH AFRICA REGION (MENA)
Morocco Amélioration de d´Efficacité Energie: Environnement de la Zone Industrielle de Sidi Bernoussi, Casablanca 12/05 085/05
Regional Roundtable on Opportunities and Challenges in the Water, Sanitation 02/04 049/04 And Power Sectors in the Middle East and North Africa Region. Summary Proceedings, May 26-28, 2003. Beit Mary, Lebanon. (CD)
Turkey Gas Sector Strategy 05/07 114/07
LATIN AMERICA AND THE CARIBBEAN REGION (LCR)
Regional Regional Electricity Markets Interconnections - Phase I Identification of Issues for the Development of Regional Power Markets in South America 12/01 016/01
Regional Electricity Markets Interconnections - Phase II Proposals to Facilitate Increased Energy Exchanges in South America 04/02 016/01
Population, Energy and Environment Program (PEA) Comparative Analysis on the Distribution of Oil Rents (English and Spanish) 02/02 020/02
Estudio Comparativo sobre la Distribución de la Renta Petrolera Estudio de Casos: Bolivia, Colombia, Ecuador y Perú 03/02 023/02
Latin American and Caribbean Refinery Sector Development Report - Volumes I and II 08/02 026/02
The Population, Energy and Environmental Program (EAP) (English and Spanish) 08/02 027/02
Bank Experience in Non-energy Projects with Rural Electrification 02/04 052/04 Components: A Review of Integration Issues in LCR
Supporting Gender and Sustainable Energy Initiatives in 12/04 061/04 Central America
Energy from Landfill Gas for the LCR Region: Best Practice and 01/05 065/05 Social Issues (CD Only)
Study on Investment and Private Sector Participation in Power 12/05 089/05 Distribution in Latin America and the Caribbean Region
Strengthening Energy Security in Uruguay 05/07 116/07 Bolivia Country Program Phase II: Rural Energy and Energy Efficiency 05/05 072/05
Report on Operational Activities Bolivia: National Biomass Program. Report on Operational Activities 05/07 115/07
Region/Country Activity/Report Title Date Number

66
TECHNICAL AND ECONOMIC ASSESSMENT OF OFF-GRID, MINI-GRID AND GRID ELECTRIFICATION TECHNOLOGIES
Brazil Background Study for a National Rural Electrification Strategy: 03/05 066/05 Aiming for Universal Access
How do Peri-Urban Poor Meet their Energy Needs: A Case Study of Caju Shantytown, Rio de Janeiro 02/06 094/06
Integration Strategy for the Southern Cone Gas Networks 05/07 113/07 Chile Desafíos de la Electrificación Rural 10/05 082/05 Colombia Desarrollo Económico Reciente en Infraestructura: Balanceando
las necesidades sociales y productivas de la infraestructura 03/07 325/05 Ecuador Programa de Entrenamiento a Representantes de Nacionalidades
Amazónicas en Temas Hidrocarburíferos 08/02 025/02 Stimulating the Picohydropower Market for Low-Income
Households in Ecuador 12/05 090/05 Guatemala Evaluation of Improved Stove Programs: Final Report of Project 12/04 060/04
Case Studies Haiti Strategy to Alleviate the Pressure of Fuel Demand on
National Woodfuel Resources (English) 04/07 112/07 (Stratégie pour l’allègement de la Pression sur les Ressources Ligneuses Nationales par la Demande en Combustibles)
Honduras Remote Energy Systems and Rural Connectivity: Technical Assistance to the Aldeas Solares Program of Honduras 12/05 092/05
Mexico Energy Policies and the Mexican Economy 01/04 047/04 Technical Assistance for Long-Term Program for Renewable
Energy Development 02/06 093/06
Nicaragua Aid-Memoir from the Rural Electrification Workshop (Spanish only) 03/03 030/04 Sustainable Charcoal Production in the Chinandega Region 04/05 071/05
Perû Extending the Use of Natural Gas to Inland Perú (Spanish/English) 04/06 103/06 Solar-diesel Hybrid Options for the Peruvian Amazon
Lessons Learned from Padre Cocha 04/07 111/07
GLOBAL
Impact of Power Sector Reform on the Poor: A Review of Issues and the Literature 07/00 002/00
Best Practices for Sustainable Development of Micro Hydro Power in Developing Countries 08/00 006/00
Mini-Grid Design Manual 09/00 007/00 Photovoltaic Applications in Rural Areas of the Developing World 11/00 009/00 Subsidies and Sustainable Rural Energy Services: Can we Create
Incentives Without Distorting Markets? 12/00 010/00 Sustainable Woodfuel Supplies from the Dry Tropical Woodlands 06/01 013/01 Key Factors for Private Sector Investment in Power Distribution 08/01 014/01 Cross-Border Oil and Gas Pipelines: Problems and Prospects 06/03 035/03 Monitoring and Evaluation in Rural Electrification Projects: 07/03 037/03
A Demand-Oriented Approach Household Energy Use in Developing Countries: A Multicountry Study 10/03 042/03 Knowledge Exchange: Online Consultation and Project Profile 12/03 043/03
from South Asia Practitioners Workshop. Colombo, Sri Lanka, June 2-4, 2003
Energy & Environmental Health: A Literature Review and 03/04 050/04 Recommendations
Petroleum Revenue Management Workshop 03/04 051/04 Operating Utility DSM Programs in a Restructuring Electricity Sector 12/05 058/04 Evaluation of ESMAP Regional Power Trade Portfolio (TAG Report) 12/04 059/04 Gender in Sustainable Energy Regional Workshop Series: 12/04 062/04
Mesoamerican Network on Gender in Sustainable Energy (GENES) Winrock and ESMAP Women in Mining Voices for a Change Conference (CD Only) 12/04 063/04
Region/Country Activity/Report Title Date Number
66
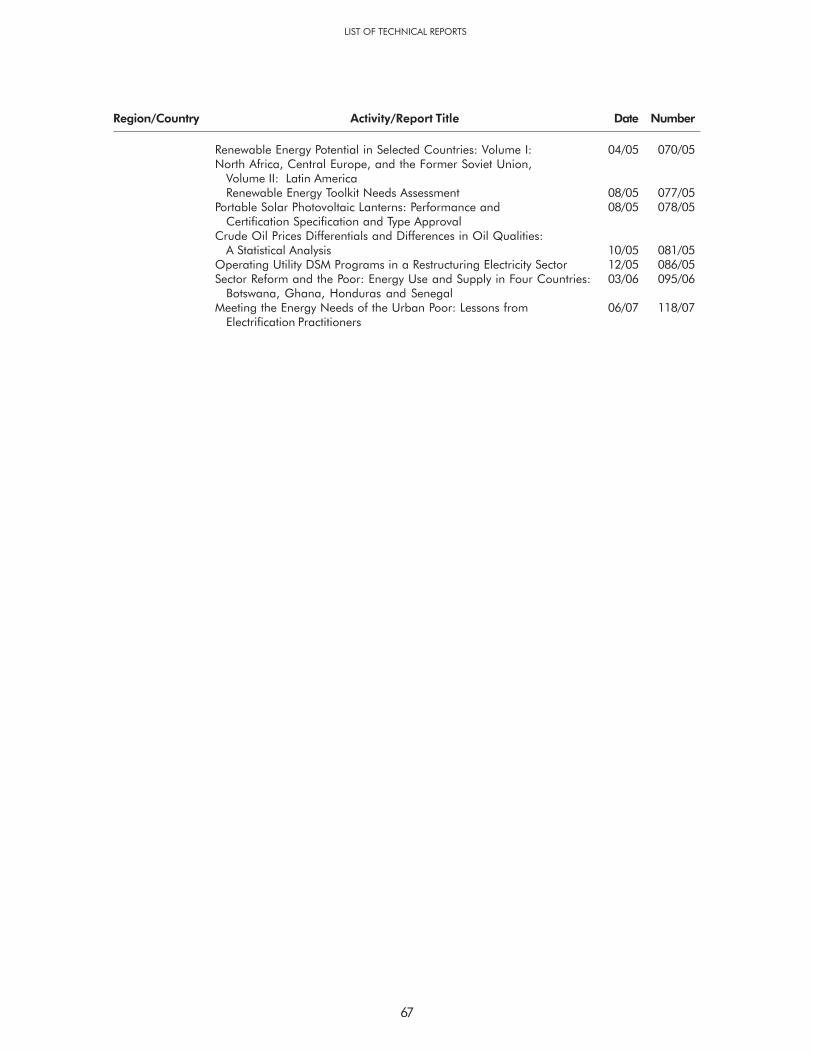
67
LIST OF TECHNICAL REPORTS
Region/Country Activity/Report Title Date Number
Renewable Energy Potential in Selected Countries: Volume I: 04/05 070/05 North Africa, Central Europe, and the Former Soviet Union,
Volume II: Latin America Renewable Energy Toolkit Needs Assessment 08/05 077/05
Portable Solar Photovoltaic Lanterns: Performance and 08/05 078/05 Certification Specification and Type Approval
Crude Oil Prices Differentials and Differences in Oil Qualities: A Statistical Analysis 10/05 081/05
Operating Utility DSM Programs in a Restructuring Electricity Sector 12/05 086/05 Sector Reform and the Poor: Energy Use and Supply in Four Countries: 03/06 095/06
Botswana, Ghana, Honduras and Senegal Meeting the Energy Needs of the Urban Poor: Lessons from 06/07 118/07
Electrification Practitioners


Energy Sector Management Assistance Program 1818 H Street, NW Washington, DC 20433 USA Tel: 1.202.458.2321 Fax: 1.202.522.3018 Internet: www.esmap.org E-mail: [email protected]
Energy Sector Management Assistance Program
Technical and Economic Assessment of Off-grid, Mini-grid and Grid Electrification Technologies
ESMAP Technical Paper 121/07 December 2007
Tech
nica
l and E
conom
ic Asse
ssment o
f Off-g
rid, M
ini-g
rid a
nd G
rid E
lectrifica
tion Te
chnolo
gie
s Te
chnica
l Paper 1
21/0
7