Embed Size (px)
Citation preview

20/11/2015
Technical Analysis
EUR/USD GBP/USD USD/JPY XAU/USD

Pair’s Outlook
Yesterday the EUR/USD cross strengthened the most since Nov 12,
by piercing through the 1.07 mark and consolidating somewhat
below 1.0750 by the end of trading. Both weekly pivot point and
monthly S1 at 1.0758/68 are unlikely to be crossed on Friday, unless
any shock for the Dollar appears unexpectedly. However, it will be
enough for the pair to eliminate losses of Monday-Tuesday. In the
meantime, Mario Draghi's speech later in day may renew a sell-off
today. Our expectations therefore remain fairly bearish.
Traders’ Sentiment
Bullish share of open positions contracted from 54% to 52% in the
SWFX market by Friday morning. Meanwhile, pending orders to buy
the Euro in 100-pip range from the spot returned to minority of 41%
(52% yesterday).
“The [German] producer-price index data has encouraged a lower euro.” - Canadian Imperial Bank of Commerce (based on Bloomberg)
EUR/USD on track to erode weekly losses
Dukascopy Bank SA, Route de Pre-Bois 20, International Center Cointrin, Entrance H, 1215 Geneva 15, Switzerland tel: +41 (0) 22 799 4888, fax: +41 (0) 22 799 4880 [email protected]
Level Rationale
■ Resistance 3 1.0836/41 20-day SMA; weekly R1
■ Resistance 2 1.0808/19 July and May lows
■ Resistance 1 1.0758/68 Weekly PP; monthly S1
■ Support 1 1.0686 Weekly S1
■ Support 2 1.0602 Weekly S2
■ Support 3 1.0564/19 Bollinger band; monthly S2; weekly S3; Apr low
Friday, November 20, 2015 08:30 GMT
Net Sentiment Last 1 day ago 5 days ago 10-day avg.
Open Positions 4% 8% 6% 6%
Orders (±50 pips) -8% 10% 10% -6%
Orders (±100 pips) -18% 4% -2% -15%
Indicator/Period Day Week Month
MACD (12; 26; 9) Buy Sell Sell
RSI (14) Neutral Neutral Neutral
Stochastic (5; 3; 3) Neutral Buy Neutral
ADX (14) Neutral Neutral Sell
CCI (14) Neutral Buy Neutral
AROON (14) Sell Sell Sell
Alligator (13; 8; 5) Sell Neutral Sell
SAR (0.02; 0.2) Sell Sell Sell

Pair’s Outlook
The GBP/USD reached as high as the 200-day SMA on Thursday, but
lost some of the gains and closed under 1.53. Today the Cable is
stuck in tight range between the 20 and 55-day SMAs and might
maintain trade within this area today due to lack of market movers.
A correction is still the most probable outcome, with a possibility of
the immediate support failing to hold the losses. Technical studies
are supporting this scenario, but one fundamental event could
provide the Sterling with sufficient strength to pierce the nearest
resistance levels and even retest the 200-day SMA at 1.5340.
Traders’ Sentiment
Bearish traders’ sentiment returned to its Wednesday’s level of 61%,
whereas no changes in the buy and the sell order ratio occurred.
“In terms of the trajectory of fed funds, we continue to see two more rate hikes in the first half of 2016. We then expect the Fed to remain on hold in the second half of 2016 to ascertain the effects of the cumulative 75 basis-point tightening on the economy and the financial markets.” - Deutsche Bank (based on WBP Online)
GBP/USD in limbo before UK Public Sector Net Borrowing
Dukascopy Bank SA, Route de Pre-Bois 20, International Center Cointrin, Entrance H, 1215 Geneva 15, Switzerland tel: +41 (0) 22 799 4888, fax: +41 (0) 22 799 4880 [email protected]
Level Rationale
■ Resistance 3 1.5466 Bollinger band
■ Resistance 2 1.5401/12 Weekly R2; 100-day SMA
■ Resistance 1 1.5311/60 55 and 200-day SMAs; monthly PP; down-trend
■ Support 1 1.5262 20-day SMA
■ Support 2 1.5185/79 Monthly S1; 23.60% Fibo; weekly PP
■ Support 3 1.5096 Weekly S1
Net Sentiment Last 1 day ago 5 days ago 10-day avg.
Open Positions -22% -20% -20% -18%
Orders (±50 pips) 10% 16% -16% -13%
Orders (±100 pips) -16% -16% -18% -15%
Indicator/Period Day Week Month
MACD (12; 26; 9) Sell Sell Sell
RSI (14) Neutral Neutral Neutral
Stochastic (5; 3; 3) Neutral Neutral Neutral
ADX (14) Neutral Neutral Sell
CCI (14) Neutral Neutral Neutral
AROON (14) Sell Sell Sell
Alligator (13; 8; 5) Sell Sell Sell
SAR (0.02; 0.2) Buy Sell Sell
Friday, November 20, 2015 08:30 GMT

Pair’s Outlook
The US currency lost over 75 pips against the Yen yesterday, caused
by the FOMC meeting minutes results, in spite of the December hike
possibility remaining in play. The second support barely managed to
hold the losses and is now providing resistance, leaving the USD/JPY
under the risk of falling again today. The closest support is now
represented by the up-trend, along with the weekly S1, monthly R1
and 20-day SMA. The Greenback is unlikely to recover from such a
slump today due to lack of market movers, whereas technical
indicators suggest the pair might trade flat over the day.
Traders’ Sentiment
Almost three quarters (74%) of all positions are now short
(previously 70%), while the share of buy orders slid from 51 to 46%.
“Foreign players appeared to have cleared out positions before the long Japanese weekend, pushing the dollar lower. Japanese investors, on the other hand, are buying on price dips and preventing a further decline.” - Global-info Co (based on Reuters)
USD/JPY trades flat, edges closer to the up-trend
Dukascopy Bank SA, Route de Pre-Bois 20, International Center Cointrin, Entrance H, 1215 Geneva 15, Switzerland tel: +41 (0) 22 799 4888, fax: +41 (0) 22 799 4880 [email protected]
Level Rationale
■ Resistance 3 124.03/26 Weekly R2; Bollinger band
■ Resistance 2 123.30/49 Weekly R1; monthly R2
■ Resistance 1 122.87 Weekly PP
■ Support 1 122.14/04 Weekly S1; 20-day SMA; up-trend; monthly R1
■ Support 2 121.74/71 100-day SMA; weekly S2
■ Support 3 121.34 200-day SMA
Net Sentiment Last 1 day ago 5 days ago 10-day avg.
Open Positions -48% -40% -50% -46%
Orders (±50 pips) -38% 74% 42% 13%
Orders (±100 pips) -8% 2% 48% 9%
Indicator/Period Day Week Month
MACD (12; 26; 9) Sell Sell Sell
RSI (14) Sell Neutral Neutral
Stochastic (5; 3; 3) Neutral Sell Neutral
ADX (14) Neutral Neutral Buy
CCI (14) Neutral Sell Neutral
AROON (14) Buy Sell Buy
Alligator (13; 8; 5) Buy Sell Buy
Buy Buy Buy SAR (0.02; 0.2)
Friday, November 20, 2015 08:30 GMT
Pair’s Outlook
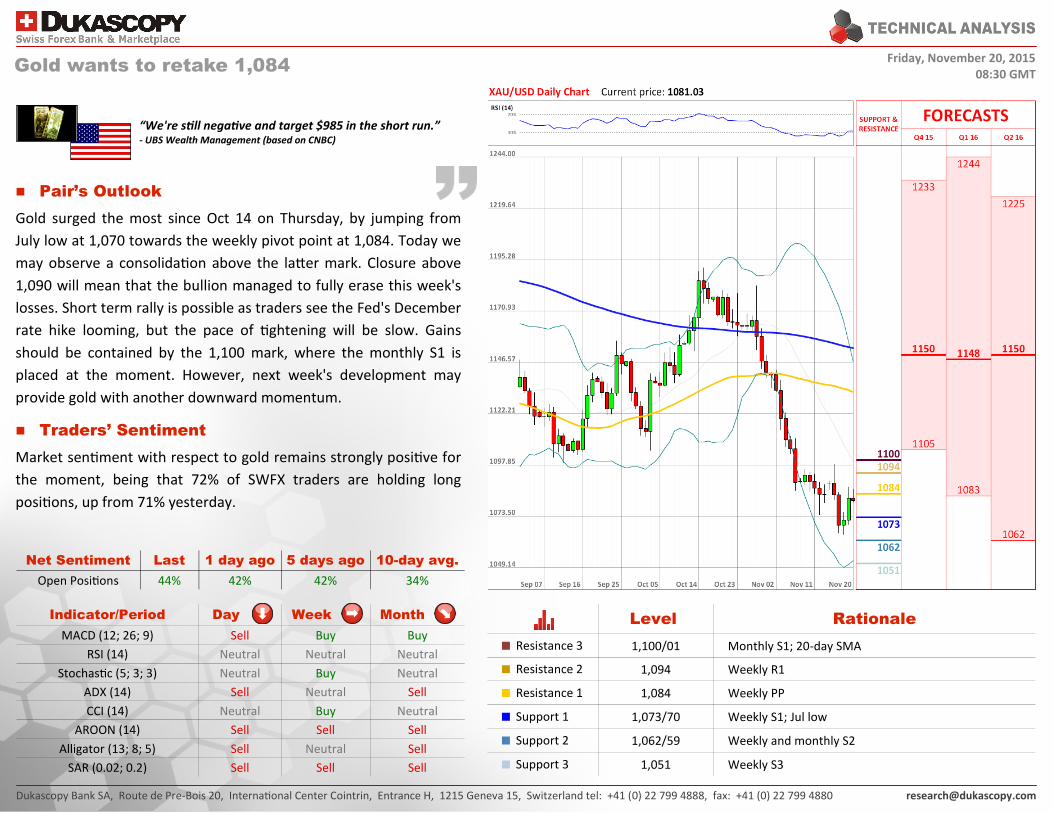
Gold surged the most since Oct 14 on Thursday, by jumping from
July low at 1,070 towards the weekly pivot point at 1,084. Today we
may observe a consolidation above the latter mark. Closure above
1,090 will mean that the bullion managed to fully erase this week's
losses. Short term rally is possible as traders see the Fed's December
rate hike looming, but the pace of tightening will be slow. Gains
should be contained by the 1,100 mark, where the monthly S1 is
placed at the moment. However, next week's development may
provide gold with another downward momentum.
Traders’ Sentiment
Market sentiment with respect to gold remains strongly positive for
the moment, being that 72% of SWFX traders are holding long
positions, up from 71% yesterday.
“We're still negative and target $985 in the short run.” - UBS Wealth Management (based on CNBC)
Gold wants to retake 1,084
Dukascopy Bank SA, Route de Pre-Bois 20, International Center Cointrin, Entrance H, 1215 Geneva 15, Switzerland tel: +41 (0) 22 799 4888, fax: +41 (0) 22 799 4880 [email protected]
Level Rationale
■ Resistance 3 1,100/01 Monthly S1; 20-day SMA
■ Resistance 2 1,094 Weekly R1
■ Resistance 1 1,084 Weekly PP
■ Support 1 1,073/70 Weekly S1; Jul low
■ Support 2 1,062/59 Weekly and monthly S2
■ Support 3 1,051 Weekly S3
Friday, November 20, 2015 08:30 GMT
Net Sentiment Last 1 day ago 5 days ago 10-day avg.
Open Positions 44% 42% 42% 34%
Indicator/Period Day Week Month
MACD (12; 26; 9) Sell Buy Buy
RSI (14) Neutral Neutral Neutral
Stochastic (5; 3; 3) Neutral Buy Neutral
ADX (14) Sell Neutral Sell
CCI (14) Neutral Buy Neutral
AROON (14) Sell Sell Sell
Alligator (13; 8; 5) Sell Neutral Sell
SAR (0.02; 0.2) Sell Sell Sell

Signals Buy – the pair shows a clear uptrend Sell – the pair shows a clear downtrend Neutral – no specific trend for the pair Chart SMA (55) – Simple Moving Average of 55 periods SMA (200) – Simple Moving Average of 200 periods Indicators MACD – Moving average convergence divergence – momentum indicator RSI – Relative strength index – compares the magnitude of recent gains to recent losses in attempt to determine ‘overbought’ and ‘oversold’ conditions of the asset Stochastic – technical momentum indicator that compares a currency pair’s closing price to its price range over a given time period ADX – Average directional index – trend strength indicators CCI – oscillator used in technical analysis to help determine when a currency has been overbought or oversold SAR – trending indicator – shows the direction of a trend AROON – measures strength of a trend and likelihood that it will continue Alligator – trending indicator demonstrates presence of a trend and its direction Forecasts
Third Quartile – separates 25% of the highest forecasts
Second Quartile – the median price based on the projections of the industry
First Quartile – separates 25% of the lowest forecasts
EXPLANATIONS
Dukascopy Bank SA, Route de Pre-Bois 20, International Center Cointrin, Entrance H, 1215 Geneva 15, Switzerland tel: +41 (0) 22 799 4888, fax: +41 (0) 22 799 4880 [email protected]

Dukascopy Bank SA, Route de Pre-Bois 20, International Center Cointrin, Entrance H, 1215 Geneva 15, Switzerland tel: +41 (0) 22 799 4888, fax: +41 (0) 22 799 4880 [email protected]
Disclaimer Everything in this article, including opinions and figures, is provided for informational purposes only and may not be interpreted as financial advice or solicitation of products. Dukascopy group assume no responsibility for the completeness or the accuracy of any data contained in this article. Financial figures indicated in this article have not been verified by the Dukascopy group. Views, opinions and analyses are those of the author of the article, and are not endorsed by the Dukascopy group. Dukascopy group waive any and all warranties, express or implied, regarding, but without limitation to, warranties of the merchantability or the fitness for a particular purpose, with respect to all information in this article. Dukascopy group shall under no circumstances be responsible for any direct, indirect, consequential, contingent or any other damages sustained in connection with the use of this article.
Newest releases and archive: Fundamental Analysis Technical Analysis Press Review Market Research Expert Commentary Dukascopy Sentiment Index Trade Pattern Ideas Global Stock Market Review Commodity Overview Economic Research Quarterly Report Aggregate Technical Indicator Additional information: Dukascopy Group Home Page Market News & Research FXSpider Live Webinars Dukascopy TV Daily Pivot Point Levels Economic Calendar Daily Highs/Lows SWFX Sentiment Index Movers & Shakers FX Forex Calculators Currency Converter Currency Index CoT Charts Social networks:
Fundamental Analysis Technical Analysis Press Review Market Research
Expert Commentary Dukascopy Bank Sentiment Index
Trade Pattern Ideas Global Stock Market Review
Commodity Overview Economic Research Dukascopy Aggregate Technical Indicator