Embed Size (px)
Citation preview
Technical Analysis:
Past, Present, and Future
Jasmina Hasanhodzic, Ph.D.
AlphaSimplex Group, LLC
MTA Educational Web Series
October 6, 2009
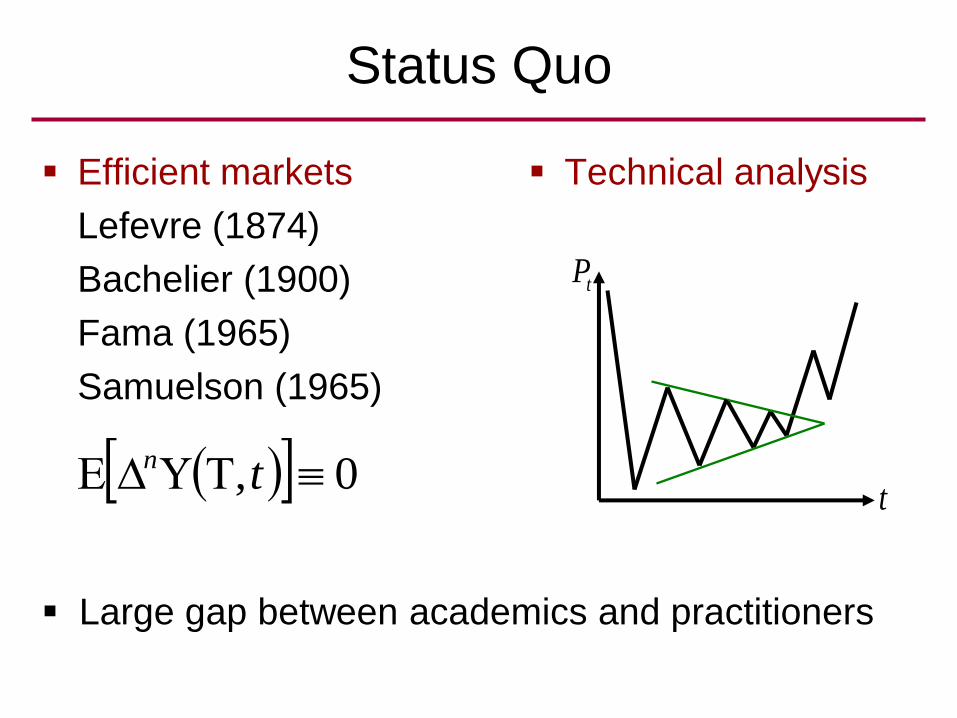
Status Quo
Efficient markets
Lefevre (1874)
Bachelier (1900)
Fama (1965)
Samuelson (1965)
Technical analysis
0, tn
Large gap between academics and practitioners
t
tP
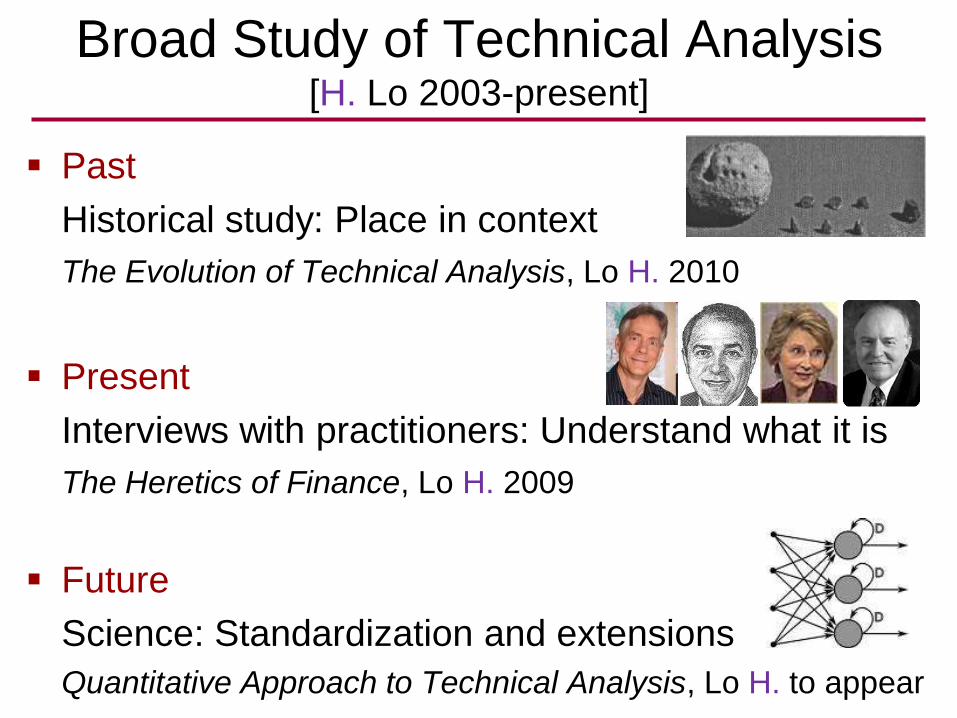
Broad Study of Technical Analysis[H. Lo 2003-present]
Past
Historical study: Place in context
The Evolution of Technical Analysis, Lo H. 2010
Present
Interviews with practitioners: Understand what it is
The Heretics of Finance, Lo H. 2009
Future
Science: Standardization and extensions
Quantitative Approach to Technical Analysis, Lo H. to appear
Outline
Past: History
Present: Interviews
Future: Science
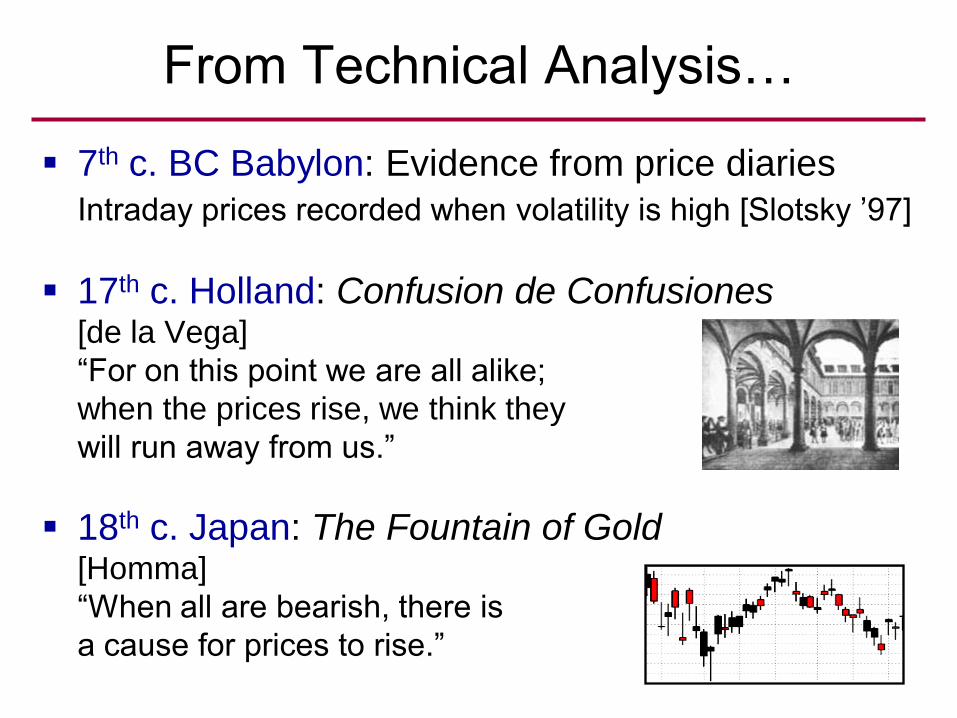
7th c. BC Babylon: Evidence from price diaries
Intraday prices recorded when volatility is high [Slotsky ’97]
17th c. Holland: Confusion de Confusiones [de la Vega]
―For on this point we are all alike;
when the prices rise, we think they
will run away from us.‖
18th c. Japan: The Fountain of Gold[Homma]
―When all are bearish, there is
a cause for prices to rise.‖
From Technical Analysis…
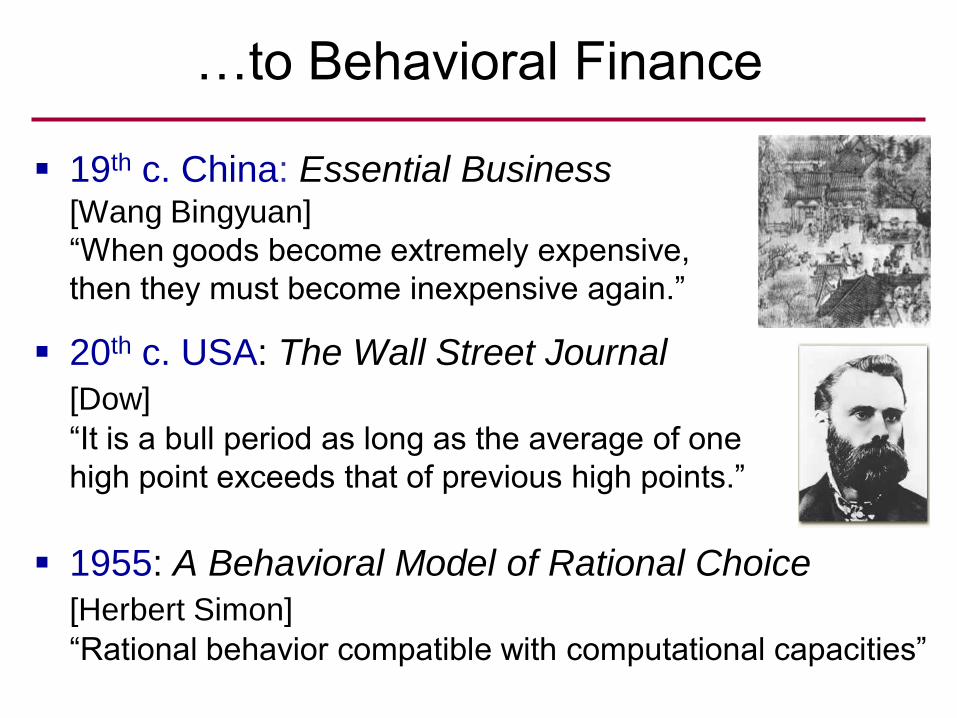
…to Behavioral Finance
19th c. China: Essential Business[Wang Bingyuan]
―When goods become extremely expensive,
then they must become inexpensive again.‖
20th c. USA: The Wall Street Journal
[Dow]
―It is a bull period as long as the average of one
high point exceeds that of previous high points.‖
1955: A Behavioral Model of Rational Choice
[Herbert Simon]
―Rational behavior compatible with computational capacities‖
Outline
Past: History
Present: Interviews
Future: Science
On market inefficiency
Raschke: Let's take the Renaissance Medallion
Fund. What more proof do you need?
Weinstein: I don’t know of any successful traders
who don’t acknowledge that charts and trends are
helpful.
In the Words of Masters
On behavioral finance
Acampora: That's the problem—it's not with what
we do, it's how we say it.
Murphy: Academics are now basically copying
what we do, renaming it, and trying to take credit
for it.
In the Words of Masters
On changing markets
Dudack: There is a greater amount of noise in
daily market action today, primarily generated by
hedge-fund managers. We need to measure the
market differently.
Deemer: I am convinced that the Rydex funds
reflect the hedge-fund trading activity which is the
driving force in the market.
In the Words of Masters
Interviews
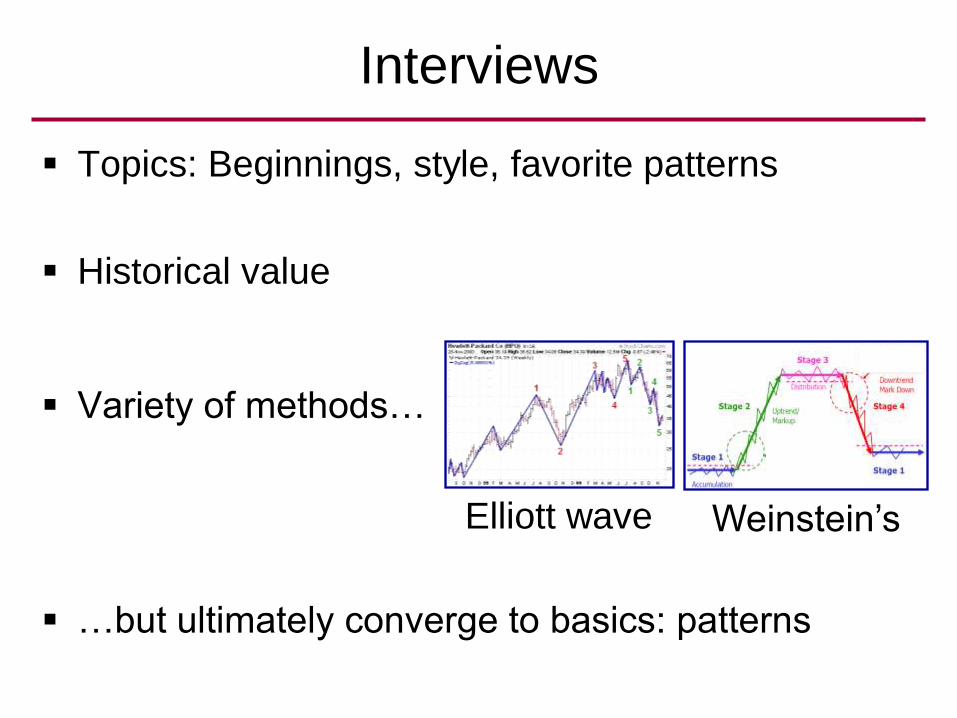
Topics: Beginnings, style, favorite patterns
Historical value
Variety of methods…
…but ultimately converge to basics: patterns
Elliott wave Weinstein’s
Outline
Past: History
Present: Interviews
Future: Science
Theory
Standardization
Extensions
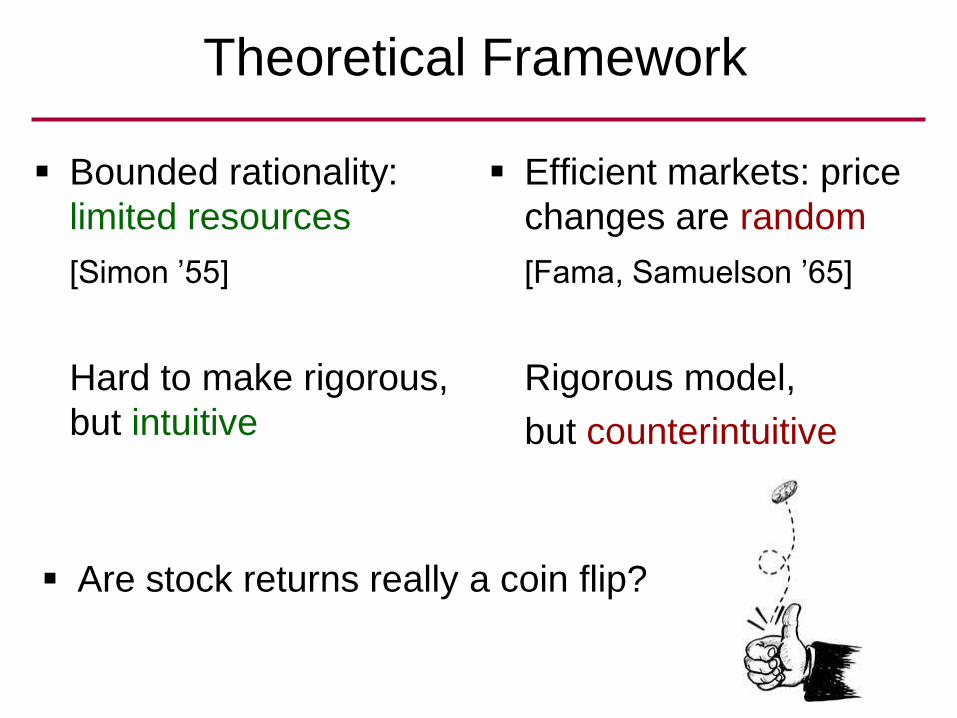
Theoretical Framework
Bounded rationality:
limited resources
[Simon ’55]
Hard to make rigorous,
but intuitive
Efficient markets: price
changes are random
[Fama, Samuelson ’65]
Rigorous model,
but counterintuitive
Are stock returns really a coin flip?
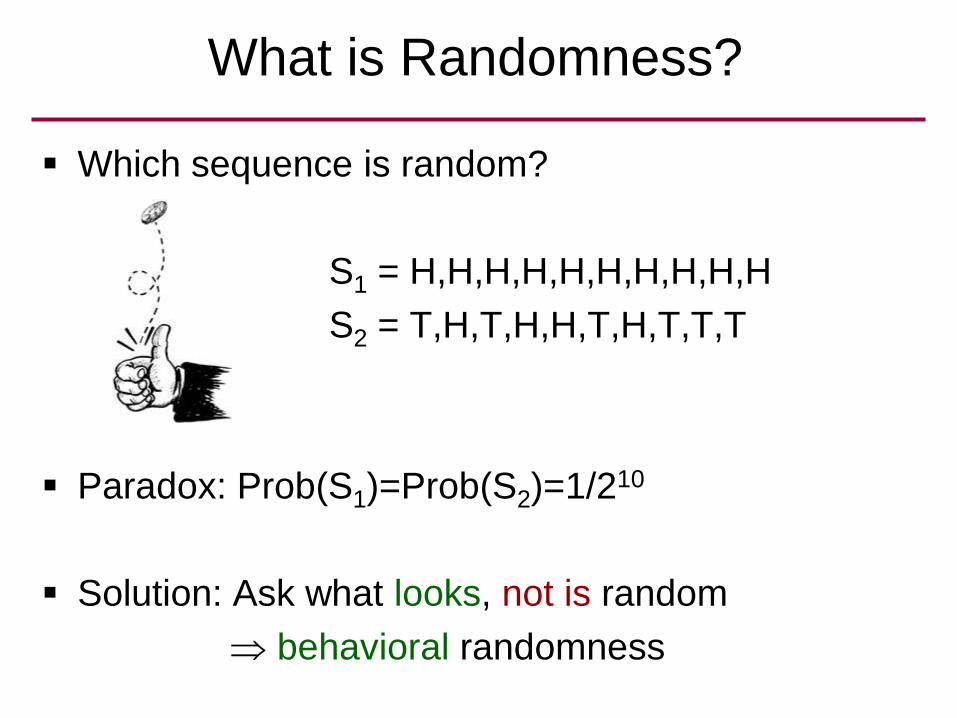
What is Randomness?
Which sequence is random?
S1 = H,H,H,H,H,H,H,H,H,H
S2 = T,H,T,H,H,T,H,T,T,T
Paradox: Prob(S1)=Prob(S2)=1/210
Solution: Ask what looks, not is random
behavioral randomness
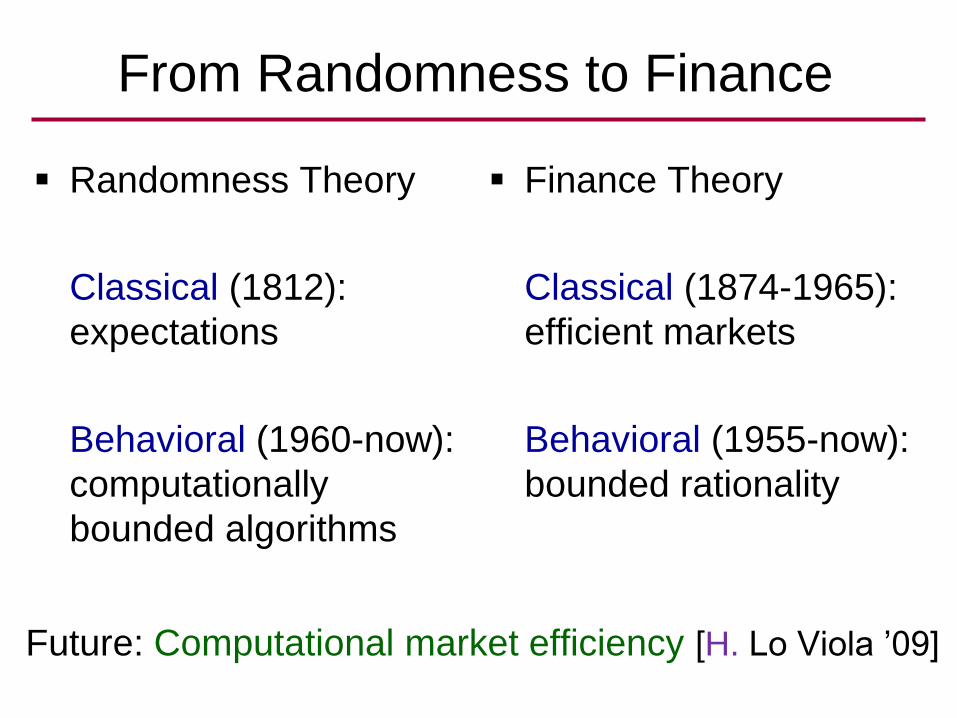
From Randomness to Finance
Randomness Theory
Classical (1812):
expectations
Behavioral (1960-now):
computationally
bounded algorithms
Finance Theory
Classical (1874-1965):
efficient markets
Behavioral (1955-now):
bounded rationality
Future: Computational market efficiency [H. Lo Viola ’09]
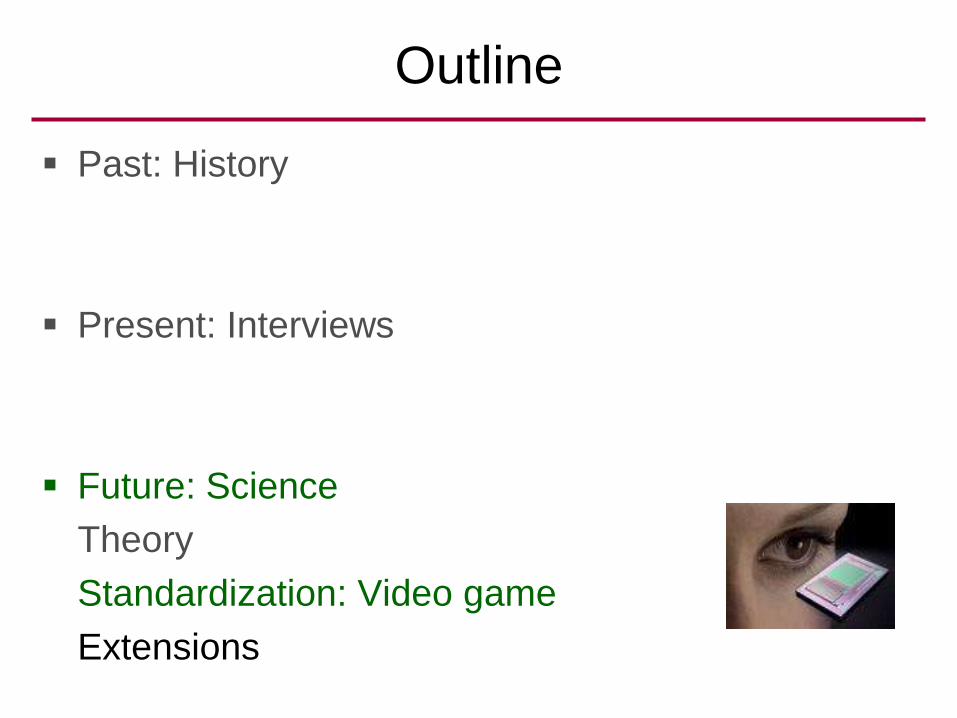
Outline
Past: History
Present: Interviews
Future: Science
Theory
Standardization: Video game
Extensions
Definition
Technical analysis:
Use of historical prices to predict the next price
Past: Naked eye
Future: Statistics
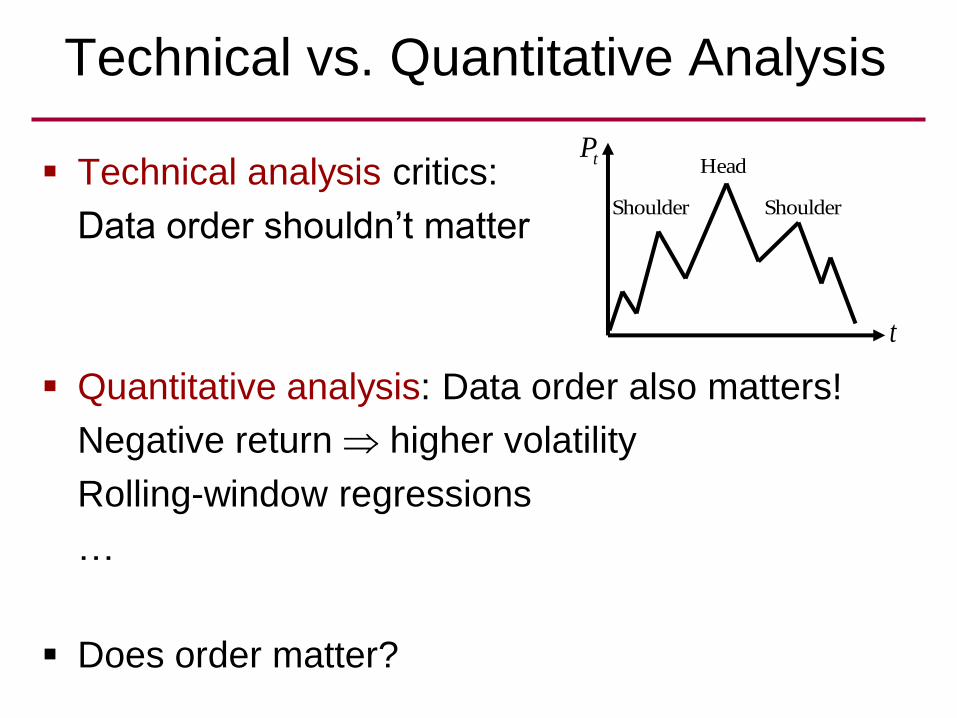
Technical vs. Quantitative Analysis
Technical analysis critics:
Data order shouldn’t matter
Quantitative analysis: Data order also matters!
Negative return higher volatility
Rolling-window regressions
…
Does order matter?
t
tPHead
Shoulder Shoulder
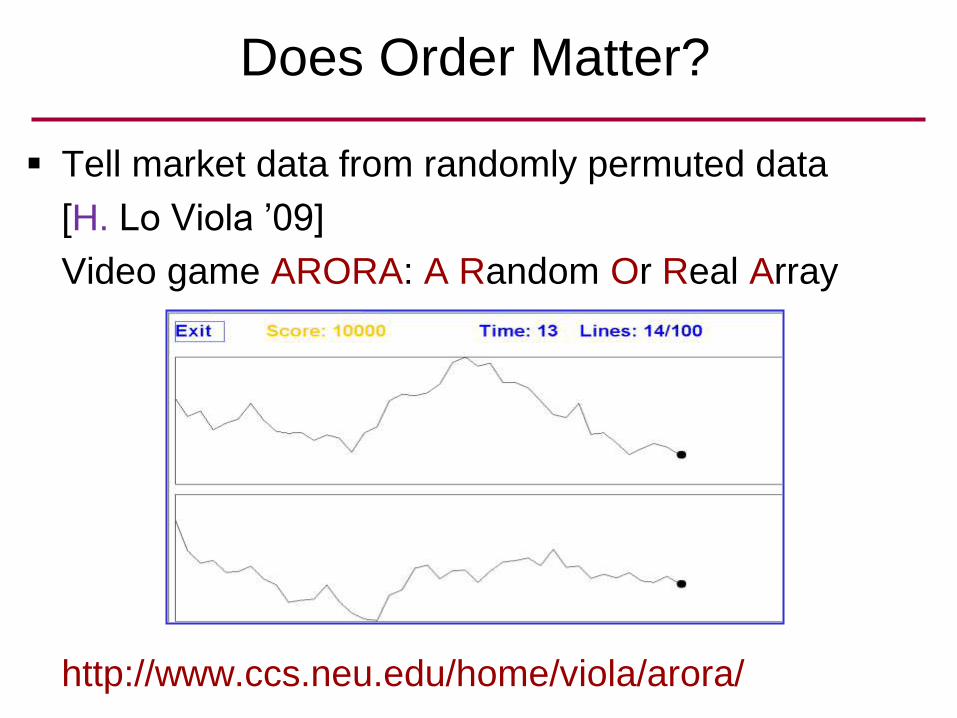
Does Order Matter?
Tell market data from randomly permuted data
[H. Lo Viola ’09]
Video game ARORA: A Random Or Real Array
http://www.ccs.neu.edu/home/viola/arora/

Outline
Past: History
Present: Interviews
Future: Science
Theory
Standardization: Make precise
Extensions
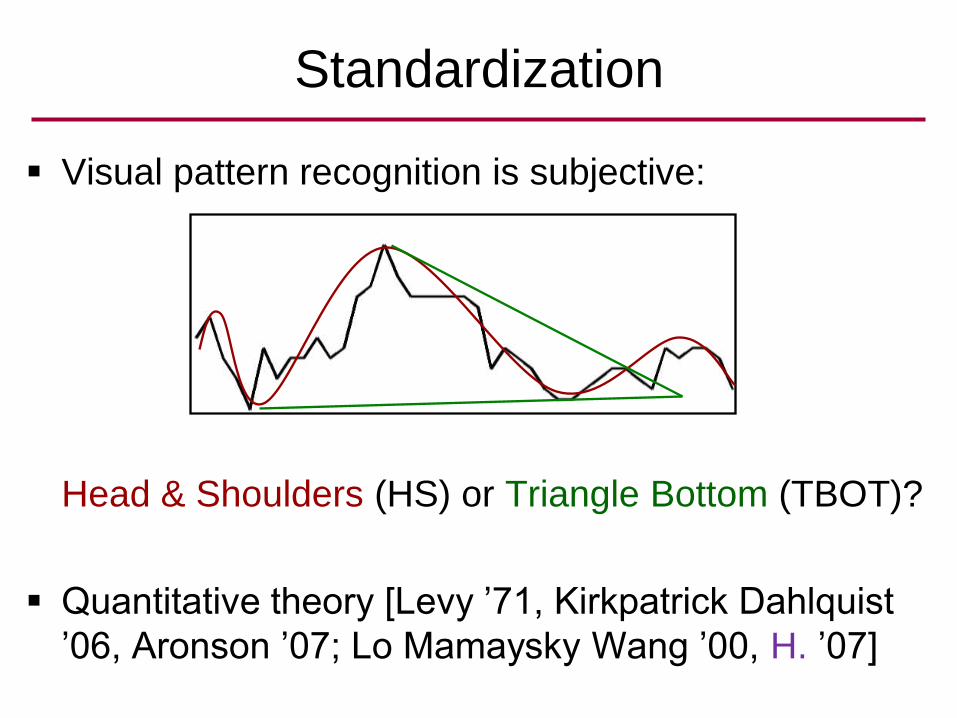
Visual pattern recognition is subjective:
Head & Shoulders (HS) or Triangle Bottom (TBOT)?
Quantitative theory [Levy ’71, Kirkpatrick Dahlquist
’06, Aronson ’07; Lo Mamaysky Wang ’00, H. ’07]
Standardization
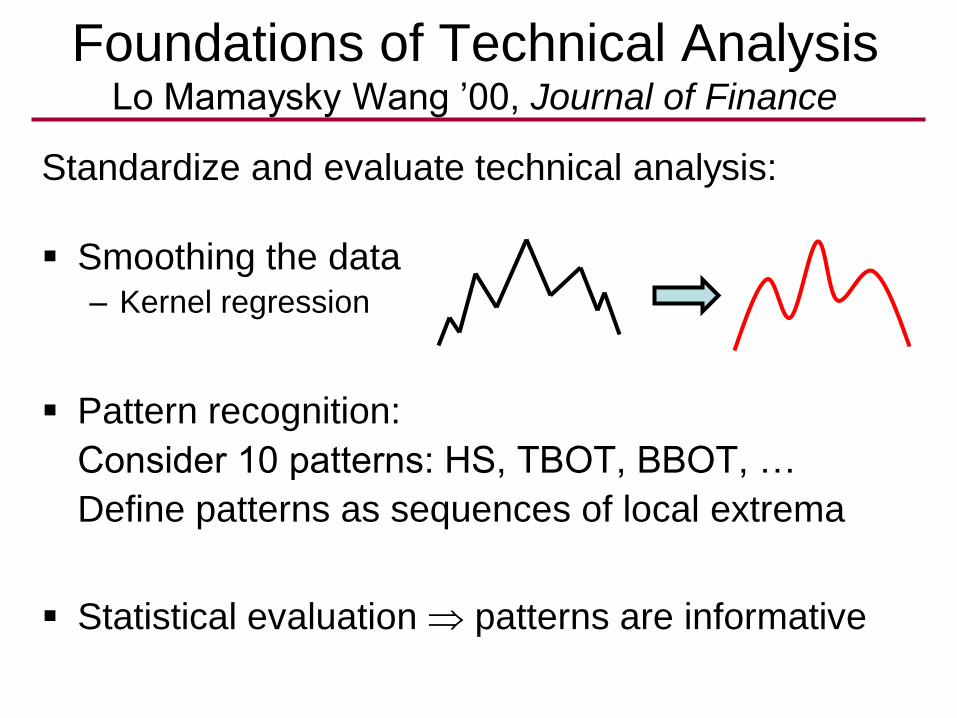
Foundations of Technical AnalysisLo Mamaysky Wang ’00, Journal of Finance
Standardize and evaluate technical analysis:
Smoothing the data– Kernel regression
Pattern recognition:
Consider 10 patterns: HS, TBOT, BBOT, …
Define patterns as sequences of local extrema
Statistical evaluation patterns are informative
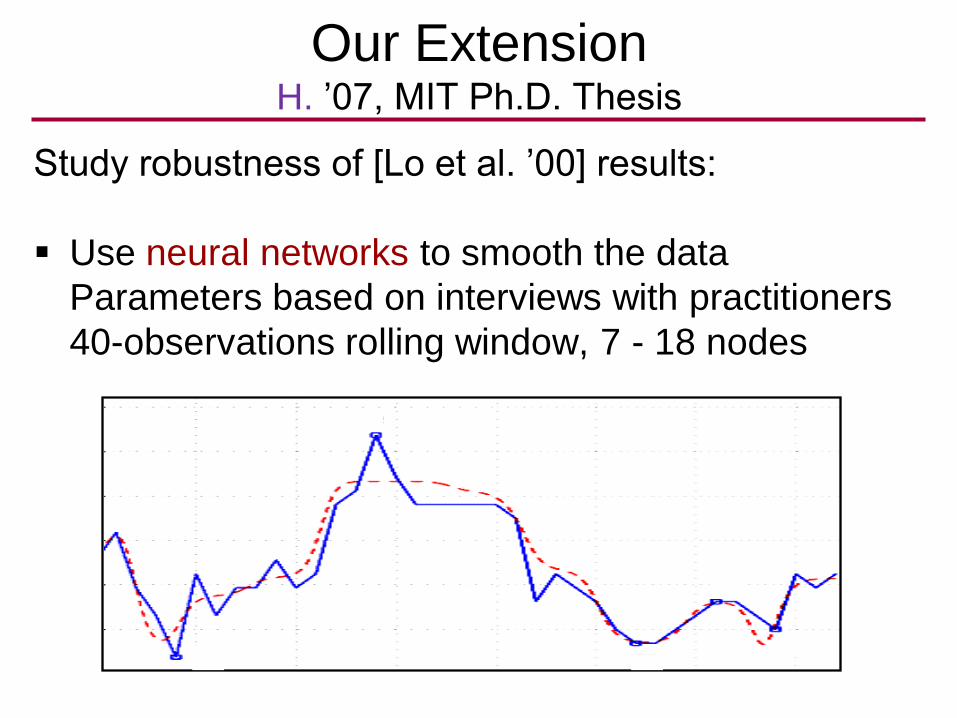
Our ExtensionH. ’07, MIT Ph.D. Thesis
Study robustness of [Lo et al. ’00] results:
Use neural networks to smooth the data
Parameters based on interviews with practitioners
40-observations rolling window, 7 - 18 nodes
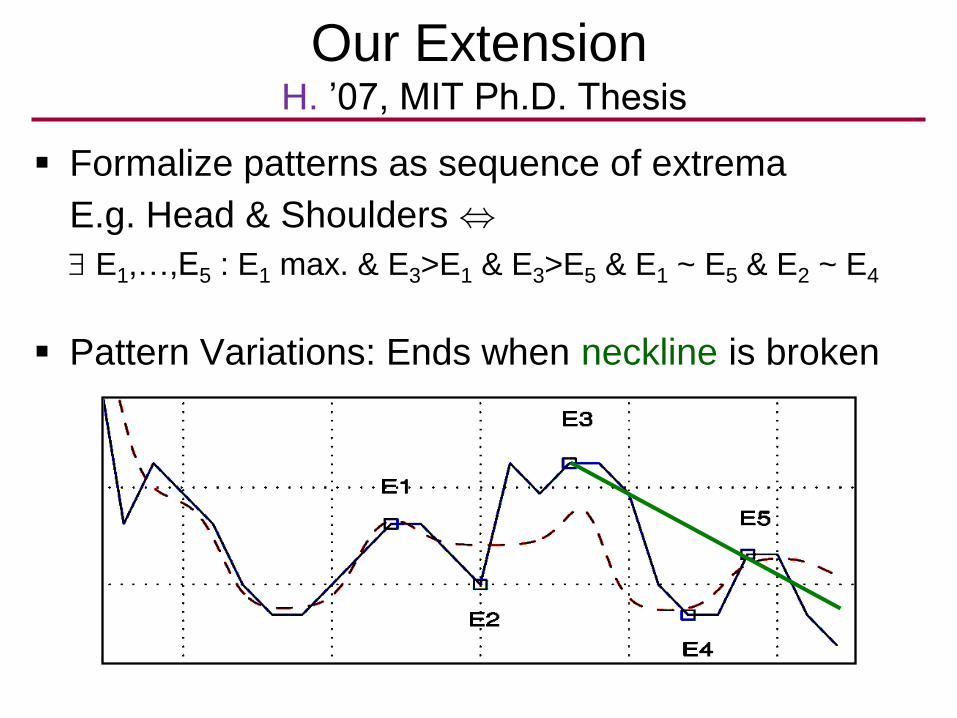
Our ExtensionH. ’07, MIT Ph.D. Thesis
Formalize patterns as sequence of extrema
E.g. Head & Shoulders ,
E1,…,E5 : E1 max. & E3>E1 & E3>E5 & E1 ~ E5 & E2 ~ E4
Pattern Variations: Ends when neckline is broken
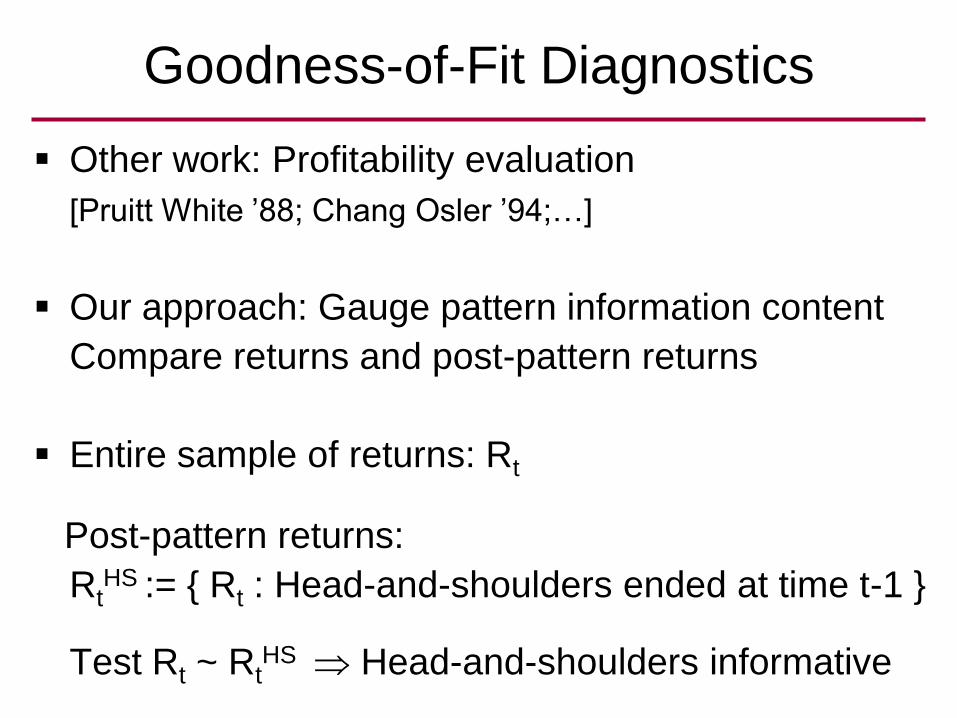
Goodness-of-Fit Diagnostics
Other work: Profitability evaluation
[Pruitt White ’88; Chang Osler ’94;…]
Our approach: Gauge pattern information content
Compare returns and post-pattern returns
Entire sample of returns: Rt
Post-pattern returns:
RtHS := { Rt : Head-and-shoulders ended at time t-1 }
Test Rt ~ RtHS Head-and-shoulders informative
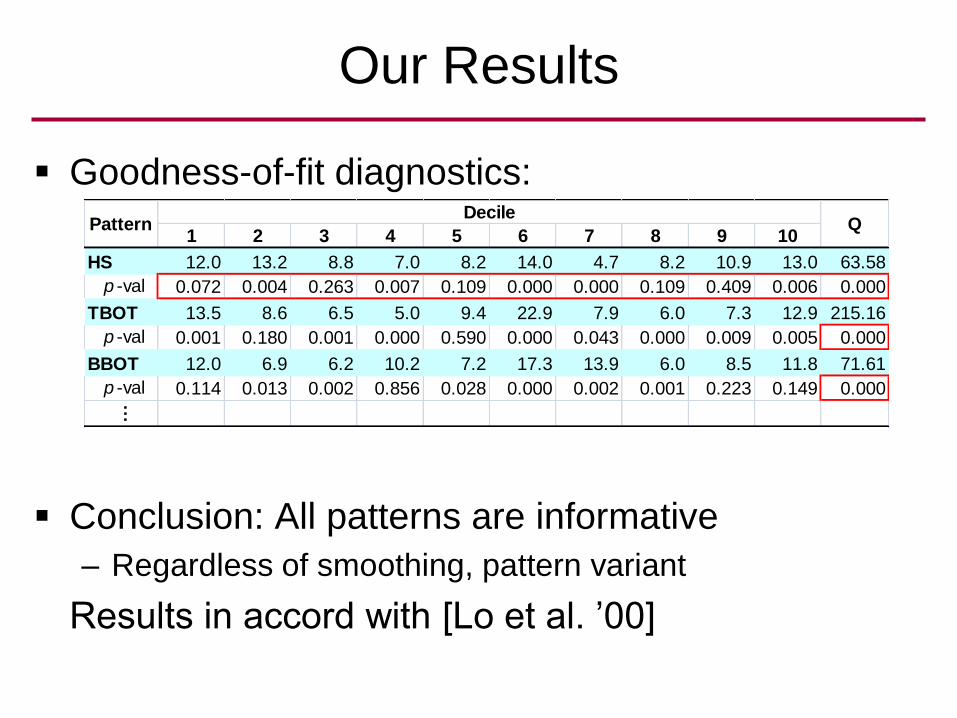
Goodness-of-fit diagnostics:
Conclusion: All patterns are informative
– Regardless of smoothing, pattern variant
Results in accord with [Lo et al. ’00]
Our Results
1 2 3 4 5 6 7 8 9 10
HS 12.0 13.2 8.8 7.0 8.2 14.0 4.7 8.2 10.9 13.0 63.58
p -val 0.072 0.004 0.263 0.007 0.109 0.000 0.000 0.109 0.409 0.006 0.000
TBOT 13.5 8.6 6.5 5.0 9.4 22.9 7.9 6.0 7.3 12.9 215.16
p -val 0.001 0.180 0.001 0.000 0.590 0.000 0.043 0.000 0.009 0.005 0.000
BBOT 12.0 6.9 6.2 10.2 7.2 17.3 13.9 6.0 8.5 11.8 71.61
p -val 0.114 0.013 0.002 0.856 0.028 0.000 0.002 0.001 0.223 0.149 0.000
…
DecilePattern Q
Outline
Past: History
Present: Interviews
Future: Science
Theory
Standardization
Extensions
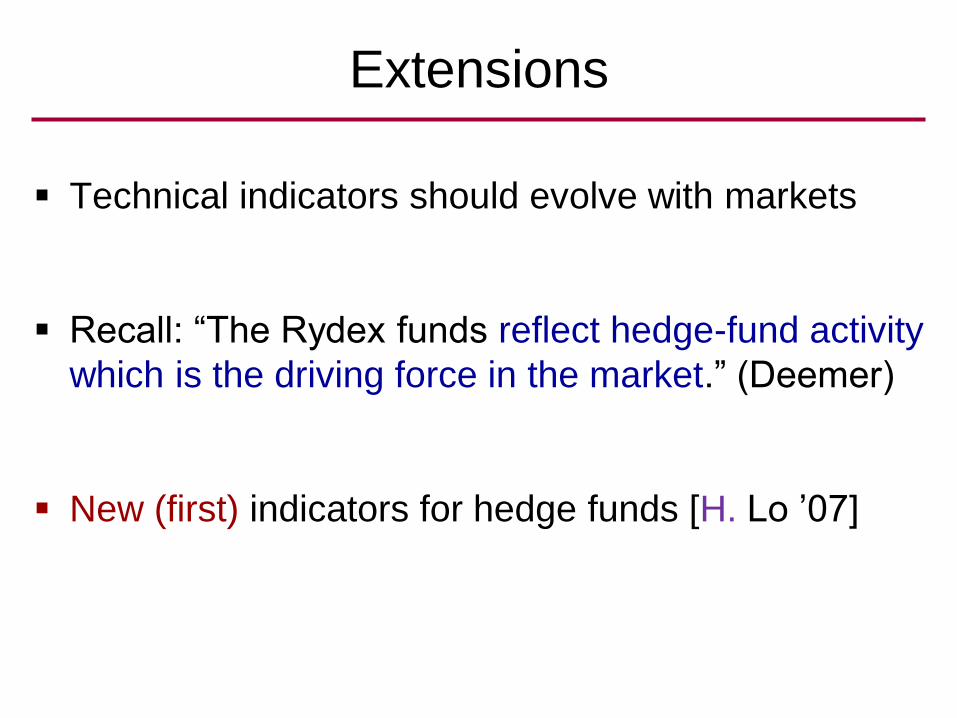
Extensions
Technical indicators should evolve with markets
Recall: ―The Rydex funds reflect hedge-fund activity
which is the driving force in the market.‖ (Deemer)
New (first) indicators for hedge funds [H. Lo ’07]
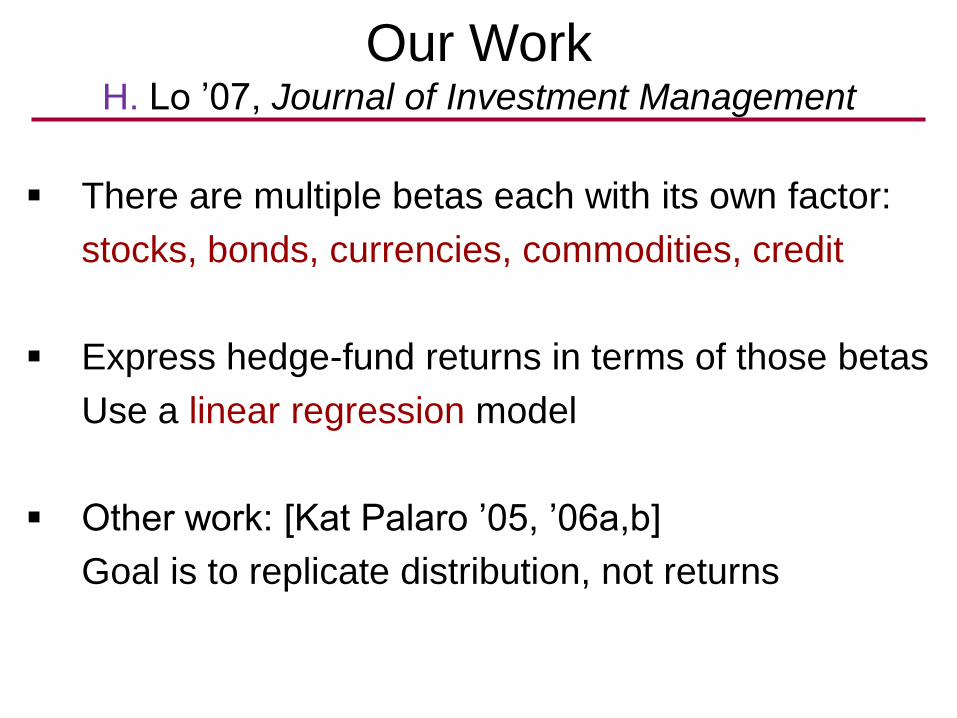
Our WorkH. Lo ’07, Journal of Investment Management
There are multiple betas each with its own factor:
stocks, bonds, currencies, commodities, credit
Express hedge-fund returns in terms of those betas
Use a linear regression model
Other work: [Kat Palaro ’05, ’06a,b]
Goal is to replicate distribution, not returns
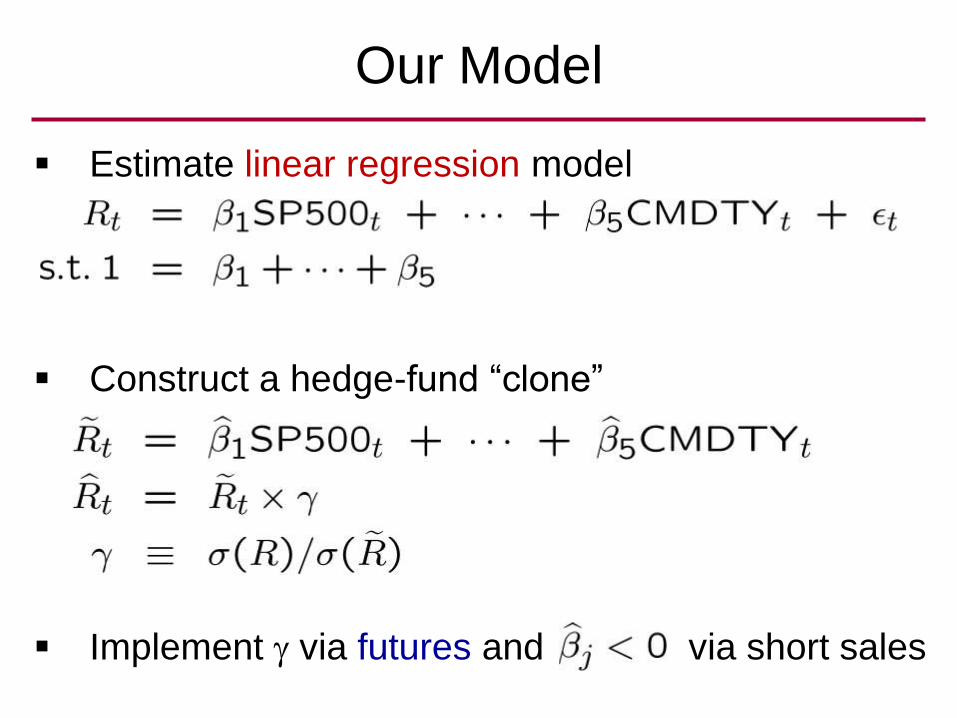
Our Model
Estimate linear regression model
Construct a hedge-fund ―clone‖
Implement via futures and via short sales
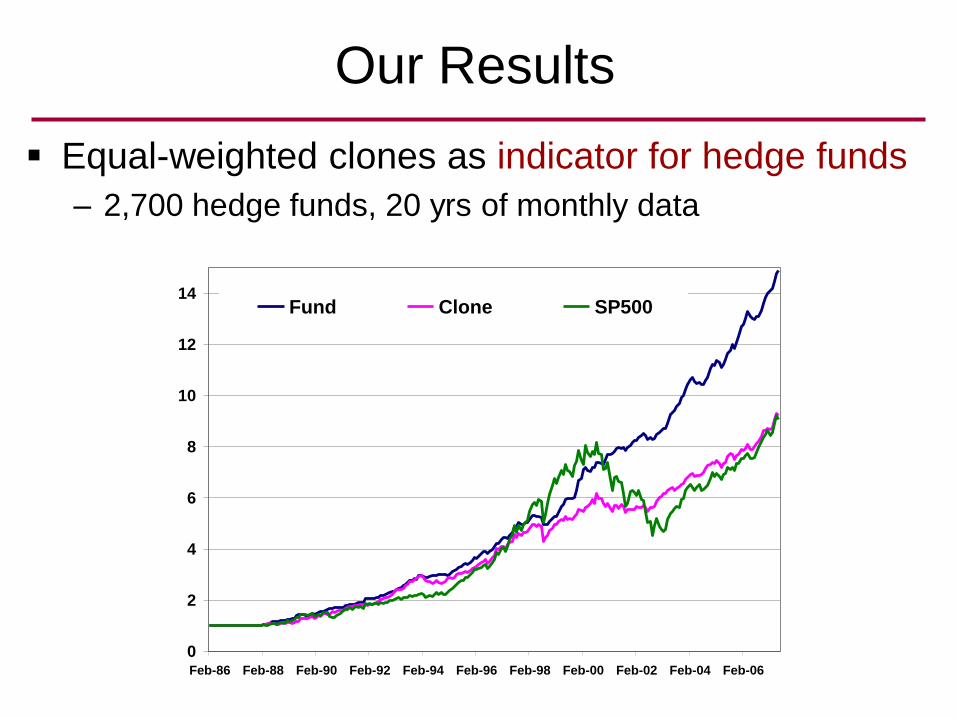
Our Results
Equal-weighted clones as indicator for hedge funds
– 2,700 hedge funds, 20 yrs of monthly data
0
2
4
6
8
10
12
14
Feb-86 Feb-88 Feb-90 Feb-92 Feb-94 Feb-96 Feb-98 Feb-00 Feb-02 Feb-04 Feb-06
Fund Clone SP500
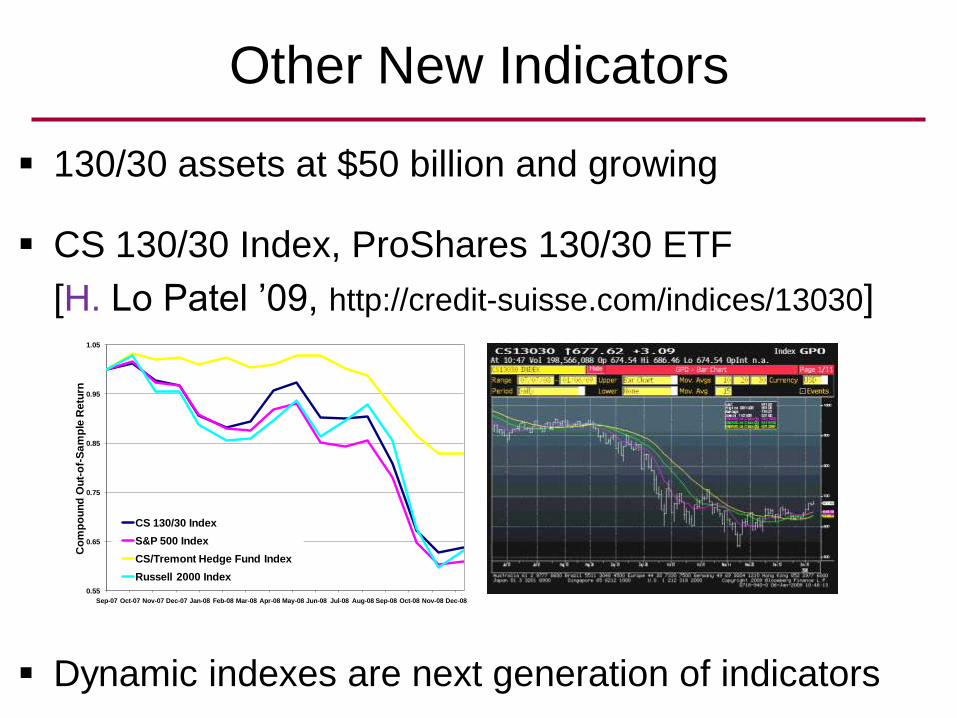
Other New Indicators
130/30 assets at $50 billion and growing
CS 130/30 Index, ProShares 130/30 ETF
[H. Lo Patel ’09, http://credit-suisse.com/indices/13030]
Dynamic indexes are next generation of indicators
0.55
0.65
0.75
0.85
0.95
1.05
Sep-07 Oct-07 Nov-07 Dec-07 Jan-08 Feb-08 Mar-08 Apr-08 May-08 Jun-08 Jul-08 Aug-08 Sep-08 Oct-08 Nov-08 Dec-08
Co
mp
ou
nd
Ou
t-o
f-S
am
ple
Re
turn
CS 130/30 Index
S&P 500 Index
CS/Tremont Hedge Fund Index
Russell 2000 Index
Conclusion
Broad study of technical analysis [H. Lo 2003-present]
Past: A force through history
Present: Wisdom from the masters
Future: Theory, standardize, extend

Thank you!