Embed Size (px)
Citation preview

Centre For Management Technology, Greater Noida Page 93
ABSTRACT
This report is about the fluctuations seen in the Power stocks in India and its analysis. Through this report I have tried to study the different patterns and trends in which the Power sector stocks fluctuate.
There are Several schools of thoughts when it comes to analyze the performance of stocks in the stock market mainly named as TECHNICAL ANALYSIS and FUNDAMENTAL ANALYSIS. In this I have tried to study the different trends and patterns depicted my Power stocks on day to day basis. To study and analyze the fluctuations in the Power stocks I have mainly used charts or graphs which is considered one of the most famous tools of Technical analysis. In fact technical analysts are mostly addressed as CHARTISTS.
Technical analysts believe that the stock price fluctuations are not always random and they follow some trend or other. One very important assumption of technical analysis is: “Trends tend to continue until and unless acted upon by any external force”.
The technical analysis is mainly based on two parameters: PRICE and TIME INTERVAL. I will try to study the analyze the change in the Power stock prices over a time period and based on some predefined rules and statistical tools I will try to predict in which direction the future prices may move.
During the study we will focus on 5 major stocks in the Power sector. These stocks are basically selected on the basis of their market capitalization, profitability and capital structure. The stocks which are chosen for the study are good indicator of the performance of the industry as a whole.
At the end of this study I will be in a position from where I can predict the future fluctuations in the Power sector stocks to some extent. I will be also be able to identify different trends and patterns which are common in different Power sector stocks.

Centre For Management Technology, Greater Noida Page 93
About the organization
RELIANCE MONEY
Reliance Money is a group company of Reliance Capital; one of India's leading and fastest growing private sector financial services companies, ranking among the top 3 private sector financial services and banking companies, in terms of net worth. It is a big size broking house which offers demat accounts by charging the least brokerage as compared to other broking houses all over India. Reliance Capital is a part of the Reliance Anil Dhirubhai Ambani Group. Reliance Capital has a networth of `5662 crores and total assets of ` 10,083 crores as of September 30, 2007 and over 16,000 employees.
Reliance Money is a comprehensive electronic transaction platform offering a wide range of asset classes. Its endeavor is to change the way India transacts in financial markets and avails financial services. Reliance Money is a single window, enabling you to access, amongst others in Equities, Equity & Commodities Derivatives, Mutual Funds, IPOs, and Life & General Insurance products, Offshore Investments, Money Transfer, Money Changing and Credit Cards. Reliance Money was the first company in India to offer a flat fee structure for trading in stocks, commodities and other instruments, as against the industry practice of percentage brokerage charges per transaction. The industry brokerage fees averages around 0.5 per cent for delivery-based equity trades, which would result into up to ` 2,500 for Rs five lakh of trading. Leading brokerages like ICICI Direct and HDFC Securities charge 0.25-0.75 per cent on delivery-based equity trades.
BENEFITS PROVIDED BY RELIANCE MONEY TO ITS CLIENTS
1) Reliance Money (owned by Reliance Capital) is offering lowest brokerage for trading in stock markets in India. The company is offering a value package under which one can do trading at very low cost.
2) Reliance money has different options for Beginner, Moderate Traders and Heavy Traders. A single window for Banking, Trading and Demat Account. The clients can easily transfer funds across accounts.

Centre For Management Technology, Greater Noida Page 93
3) Your account is safeguarded with a unique security number that act as a dynamic password and changes every 32 seconds.
4) Reliance Money also offers Risk Analyser for analysis of your risk profile.
5) RelianceMoney.com offers most dynamic web based trading environment to its customers. The new trading platform has many new features which basically fill up the gap between old online trading companies in India and their customers.
6) Branches are available in all major cities and the number is growing.
7)Its convenient, you can access Reliance Money’s services through the Internet, Transaction Kiosks and even through phone (Call and transact) and many more.
4. Our all - India network of associates on an assisted trade (through the Call Centre or our network of associates) a charge of `12 per executed trade will be applicable.
8)It provides you value-added services at www.reliancemoney.com where you get reliable research including views of external experts with an enviable track record.
Live news updates from Reuters and Dow Jones. CEOs/ Expert views on the economy and financial markets. Tools that help you plan your investments, tax, retirement, etc, in the Personal Finance section. Risk Analyser for analysis of your risk profile. Asset Allocators to build an appropriate investment portfolio.
CURRENT DEVELOPMENTS
1) Reliance Money has signed a deal with Canada-based Recognia Inc to offer a simplified, automated and sophisticated technical analysis to retail broking consumers on publicly traded companies. The service will cost Rs 99 for three months, ` 179 for six months and ` 299
for a year.
2) Reliance Money has announced plans to set up a separate platform to launch organized bullion trading with BSE and Bombay Bullion Association. The new BSM trading platform would be in line with London Bullion Market. It would help jewelers monitor international price movements on real time basis and facilitate retail investors in purchase of gold coins and bars.

Centre For Management Technology, Greater Noida Page 93
3) The company has launched its "Mobile Financial Portal", the first-of-its-kind portal offering a range of financial services and information to its investors, across all telecom operators.
MY EXPERIENCE IN RELIANCE MONEY
My 2 months of Summer Internship in Reliance Money has really been an experience of life time for me. It is a great organization to do your internship and the amount of corporate exposure provided to us was an honest attempt of the organization to provide us chance to watch and understand the corporate culture closely. The organization ensured that the budding managers like us must be trained in all possible the dimensions a manager can be trained.
It gave us ample of opportunities where we applied and tried to relate our academic knowledge with the real world situations. We have given chance to carry out different marketing activities for the company which was a great experience for me as we actually got an chance to implement our academic learning to the real life situation. Apart from the marketing we have also did some activities related to the operations of the company such as processing of Demat Accounts and documents etc. I am quite sure that the guidance that we got from the employees of Reliance money especially from our company guide during our Internship will certainly help us when we will join the corporate bandwagon.
One thing that impressed me most about the Reliance Money was there aggressiveness in whatever they do. They have a philosophy in their organization that “don’t wait for the things to happen rather make them happen for you”. The way they conduct their marketing activities such as product promotion and sales, it is impeccable. Today I can proudly state that I have done my Summer Internship in an organization which not only have an excellent goodwill in the market but also is a leader in its own segment.
Overall it has been a wonderful experience for me to do my Summer Internship in Reliance Money and I will also recommend others that if they ever get a chance to do their Summer Internship in Reliance Money then make the most of it. I don’t think that I can thank Reliance Money enough for the learning experiences they provided me.
Centre For Management Technology, Greater Noida Page 93
INTRODUCTION
The methods used to analyze securities and make investment decisions fall into two very broad categories: fundamental analysis and technical analysis.
Technical analysts consider the market to be 80% psychological and 20% logical. Fundamental analysts consider the market to be 20% psychological and 80% logical. Psychological or logical may be open for debate, but there is no questioning the current price of a security. The price set by the market reflects the sum knowledge of all participants of the market. Participants have considered (discounted) everything under the sun and settled on a price to buy or sell.
Even though there are some universal principles and rules that can be applied, it must be remembered that technical analysis is more an art form than a science. As an art form, it is subject to interpretation. However, it is also flexible in its approach and each investor should use only that which suits his or her style. Hence throughout the project I will try to study and analyze the past price movements of some selected stocks of Power sector through different technical analysis tools such as charts, graphs and other statistical methods. Then based on those findings I will try to predict the most likely behavior of the concerned stocks that they may depict over the time.
Objective of the study:
Identifying different patterns in which the stock prices of Power Sector fluctuates.
With the help of charts and past price trends we will try to predict the price movements of the stock in future (most likely behavior).
Studying whether the price of different stocks of Power sector fluctuates in the same manner or not.
Studying whether the price of different stocks of Power sector fluctuates in the same manner or not.

Centre For Management Technology, Greater Noida Page 93
Research Methodology:
Collecting daily prices of few companies (from Power Sector) for last few months.
Plotting graphs and charts of the fluctuations in the stock prices in different time frames.
Identifying various trends in which the stock prices of the Power companies fluctuates.
Using various Statistical methods such as moving average etc to study the different trends in which the stock prices fluctuates.
Limitations of the study:
This study will be confined to the Indian stock market only.
This study will be restricted up to the Power sector only.
Due to time constraint the study will be done on at most 5 stocks in Power sector.
Due to time constraint only TECHNICAL ANALYSIS will be used to analyze the price movement of the concerned stocks. This study will not include the fundamental analysis of the stocks.
The study will consider only the past one year’s data for the analysis of the price movements of the stocks because of time constraint.
Limitation on the availability of data.

Centre For Management Technology, Greater Noida Page 93
POWER SECTOR IN INDIA
A strong Power sector is the backbone of a strong economy. India has the fifth largest generation capacity in the world with an installed capacity of 152 GW as on 30 September 2009, which is about 4 percent of global Power generation. The top four countries, viz., US, Japan, China and Russia together consume about 49 percent of the total Power generated globally. The average per capita consumption of electricity in India is estimated to be 704 kWh during 2008-09. However, this is fairly low when compared to that of some of the developed and emerging nations such US (~15,000 kWh) and China (~1,800 kWh).The world average stands at 2,300 kWh. The Indian government has set ambitious goals in the 11th plan for Power sector owing to which the Power sector is poised for significant expansion. In order to provide availability of over 1000 units of per capita electricity by year 2012, it hasbeen estimated that need-based capacity addition of more than 100,000 MW would be required. This has resulted in massive addition plans being proposed in the sub-sectors of Generation Transmission and Distribution.
The electricity sector in India is predominantly controlled by the Government of India's public sector undertakings (PSUs). Major PSUs involved in the generation of electricity include National Thermal Power Corporation (NTPC), National Hydroelectric Power Corporation (NHPC) and Nuclear Power Corporation of India (NPCI). Besides PSUs, several state-level corporations, such as Maharashtra State Electricity Board (MSEB), are also involved in the generation and intra-state distribution of electricity. The Power Grid Corporation of India is responsible for the inter-state transmission of electricity and the development of national grid.
The Ministry of Power is the apex body responsible for the development of electrical energy in India. This ministry started functioning independently from 2 July 1992; earlier, it was known as the Ministry of Energy. The Union Minister of Power at present is Sushilkumar Shinde of the Congress Party who took charge of the ministry on the 28th of May, 2009.
India is world's 6th largest energy consumer, accounting for 3.4% of global energy consumption. Due to India's economic rise, the demand for energy has grown at an average of 3.6% per annum over the past 30 years. In March 2009, the installed

Centre For Management Technology, Greater Noida Page 93
Power generation capacity of India stood at 147,000 MW while the per capita Power consumption stood at 612 kWH.The country's annual Power production increased from about 190 billion kWH in 1986 to more than 680 billion kWH in 2006.The Indian government has set an ambitious target to add approximately 78,000 MW of installed generation capacity by 2012. The total demand for electricity in India is expected to cross 950,000 MW by 2030.
About 75% of the electricity consumed in India is generated by thermal Power plants, 21% by hydroelectric Power plants and 4% by nuclear Power plants. More than 50% of India's commercial energy demand is met through the country's vast coal reserves. The country has also invested heavily in recent years on renewable sources of energy such as wind energy. As of 2008, India's installed wind Power generation capacity stood at 9,655 MW. Additionally, India has committed massive amount of funds for the construction of various nuclear reactors which would generate at least 30,000 MW. In July 2009, India unveiled a $19 billion plan to produce 20,000 MW of solar Power by 2020.
Electricity losses in India during transmission and distribution are extremely high and vary between 30 to 45%. In 2004-05, electricity demand outstripped supply by 7-11%. Due to shortage of electricity, Power cuts are common throughout India and this has adversely effected the country's economic growth. Theft of electricity, common in most parts of urban India, amounts to 1.5% of India's GDP. Despite an ambitious rural electrification program, some 400 million Indians lose electricity access during blackouts. While 80 percent of Indian villages have at least an electricity line, just 44 percent of rural households have access to electricity. According to a sample of 97,882 households in 2002, electricity was the main source of lighting for 53% of rural households compared to 36% in 1993. Multi Commodity Exchange has sought permission to offer electricity future markets.

Centre For Management Technology, Greater Noida Page 93
GenerationGrand Total Installed Capacity is 160198 MW.
Thermal Power
Current installed capacity of Thermal Power (as of 12/2008) is 93,398.84 MW which is 64.7% of total installed capacity.
Current installed base of Coal Based Thermal Power is 77,458.89 MW which comes to 53.3% of total installed base.
Current installed base of Gas Based Thermal Power is 14,734.01 MW which is 10.5% of total installed base.
Current installed base of Oil Based Thermal Power is 1,199.75 MW which is 0.9% of total installed base.
The state of Maharashtra is the largest producer of thermal Power in the country.
Hydro Power
India was one of the pioneering countries in establishing hydro-electric Power plants. The Power plant at Darjeeling and Shimsha (Shivanasamudra) was established in 1898 and 1902 respectively and is one of the first in Asia. The installed capacity as of 2008 was approximately 36877.76[23]. The public sector has a predominant share of 97% in this sector
Nuclear Power
Currently, seventeen nuclear Power reactors produce 4,120.00 MW (2.9% of total installed base
Renewable Power
Current installed base of Renewable energy is 13,242.41 MW which is 7.7% of total installed base with the southern state of Tamil Nadu contributing nearly a third of it (4379.64 MW) largely through wind Power
Centre For Management Technology, Greater Noida Page 93
Transmission
The current installed transmission capacity is only 13 percent of the total installed generation capacity. With focus on increasing generation capacity over the next 8-10 years, the corresponding investments in the transmission sector is also expected to augment. The Ministry of Power plans to establish an integrated National Power Grid in the country by 2012 with close to 200,000 MW generation capacities and 37,700 MW of inter-regional Power transfer capacity. Considering that the current inter-regional Power transfer capacity of 20,750 MW4, this is indeed an ambitious objective for the country. Transmission of electricity is defined as bulk transfer of Power over a long distance at high voltage, generally of 132kV and above. In India bulk transmission has increased from 3,708ckm in 1950 to more than 165,000ckm today(as stated by Power Grid Corporation of India). The entire country has been divided into five regions for transmission systems, namely, Northern Region, North Eastern Region, Eastern Region, Southern Region and Western Region. The Interconnected transmission system within each region is also called the regional grid.
The transmission system planning in the country, in the past, had traditionally been linked to generation projects as part of the evacuation system. Ability of the Power system to safely withstand a contingency without generation rescheduling or load-shedding was the main criteria for planning the transmission system. However, due to various reasons such as spatial development of load in the network, non-commissioning of load center generating units originally planned and deficit in reactive compensation, certain pockets in the Power system could not safely operate even under normal conditions. This had necessitated backing down of generation and operating at a lower load generation balance in the past. Transmission planning has therefore moved away from the earlier generation evacuation system planning to integrate system planning.

Centre For Management Technology, Greater Noida Page 93
While the predominant technology for electricity transmission and distribution has been Alternating Current (AC) technology, High Voltage Direct Current (HVDC) technology has also been used for interconnection of all regional grids across the country and for bulk transmission of Power over long distances.
Certain provisions in the Electricity Act 2003 such as open access to the transmission and distribution network, recognition of Power trading as a distinct activity, the liberal definition of a captive generating plant and provision for supply in rural areas are expected to introduce and encourage competition in the electricity sector. It is expected that all the above measures on the generation, transmission and distribution front would result in formation of a robust electricity grid in the country.
Centre For Management Technology, Greater Noida Page 93
Distribution
While some progress has been made at reducing the Transmission and Distribution (T&D) losses, these still remain substantially higher than the global benchmarks, atapproximately 33 percent. In order to address some of the issues in this segment, reforms have been undertaken through unbundling the State Electricity Boards intoseparate Generation, Transmission and Distribution units and privatization of Power distribution has been initiated either through the outright privatization or the franchisee route; results of these initiatives have been some what mixed. While there has been a slow and gradual improvement in metering, billing and collection efficiency,the current loss levels still pose a significant challenge for distribution companies going forward.
The total installed generating capacity in the country is over 148,700MW and the total number of consumers is over 144 million. Apart from an extensive transmission system network at 500kV HVDC, 400kV, 220kV, 132kV and 66kV which has developed to transmit the Power from generating station to the grid substations, a vast network of sub transmission in distribution system has also come up for utilisation of the Power by the ultimate consumers.
However, due to lack of adequate investment on transmission and distribution (T&D) works, the T&D losses have been consistently on higher side, and reached to the level of 32.86% in the year 2000-01.The reduction of these losses was essential to bring economic viability to the State Utilities.
As the T&D loss was not able to capture all the losses in the net work, concept of Aggregate Technical and Commercial (AT&C) loss was introduced. AT&C loss captures technical as well as commercial losses in the network and is a true indicator of total losses in the system.

Centre For Management Technology, Greater Noida Page 93
High technical losses in the system are primarily due to inadequate investments over the years for system improvement works, which has resulted in unplanned extensions of the distribution lines, overloading of the system elements like transformers and conductors, and lack of adequate reactive Power support.
The commercial losses are mainly due to low metering efficiency, theft & pilferages. This may be eliminated by improving metering efficiency, proper energy accounting & auditing and improved billing & collection efficiency. Fixing of accountability of the personnel / feeder managers may help considerably in reduction of AT&C loss.
With the initiative of the Government of India and of the States, the Accelerated Power Development & Reform Programme (APDRP) was launched in 2001, for the strengthening of Sub – Transmission and Distribution network and reduction in AT&C losses.
The main objective of the programme was to bring Aggregate Technical & Commercial (AT&C) losses below 15% in five years in urban and in high-density areas. The programme, along with other initiatives of the Government of India and of the States, has led to reduction in the overall AT&C loss from 38.86% in 2001-02 to 34.54% in 2005-06. The commercial loss of the State Power Utilities reduced significantly during this period from `29331 Crore to `19546 Crore. The loss as percentage of turnover was reduced from 33% in 2000-01 to 16.60% in 2005-06.
The APDRP programme is being restructured by the Government of India, so that the desired level of 15% AT&C loss could be achieved by the end of 11th plan.
Centre For Management Technology, Greater Noida Page 93
Power for all by 2012The Government of India has an ambitious mission of POWER FOR ALL BY 2012. This mission would require that the installed generation capacity should be at least 200,000 MW by 2012 from the present level of 144,564.97 MW. Power requirement will double by 2020 to 400,000MW.
Objectives
Sufficient Power to achieve GDP growth rate of 8% Reliable Power Quality Power Optimum Power cost Commercial viability of Power industry Power for all
Strategies
Power Generation Strategy with focus on low cost generation, optimization of capacity utilization, controlling the input cost, optimisation of fuel mix, Technology upgradation and utilization of Non Conventional energy sources
Transmission Strategy with focus on development of National Grid including Interstate connections, Technology upgradation & optimization of transmission cost.
Distribution strategy to achieve Distribution Reforms with focus on System upgradation, loss reduction, theft control, consumer service orientation, quality Power supply commercialization, Decentralized distributed generation and supply for rural areas.
Regulation Strategy aimed at protecting Consumer interests and making the sector commercially viable.
Financing Strategy to generate resources for required growth of the Power sector.

Centre For Management Technology, Greater Noida Page 93
Conservation Strategy to optimise the utilization of electricity with focus on Demand Side management, Load management and Technology upgradation to provide energy efficient equipment / gadgets.
Communication Strategy for political consensus with media support to enhance the general public awareness.,
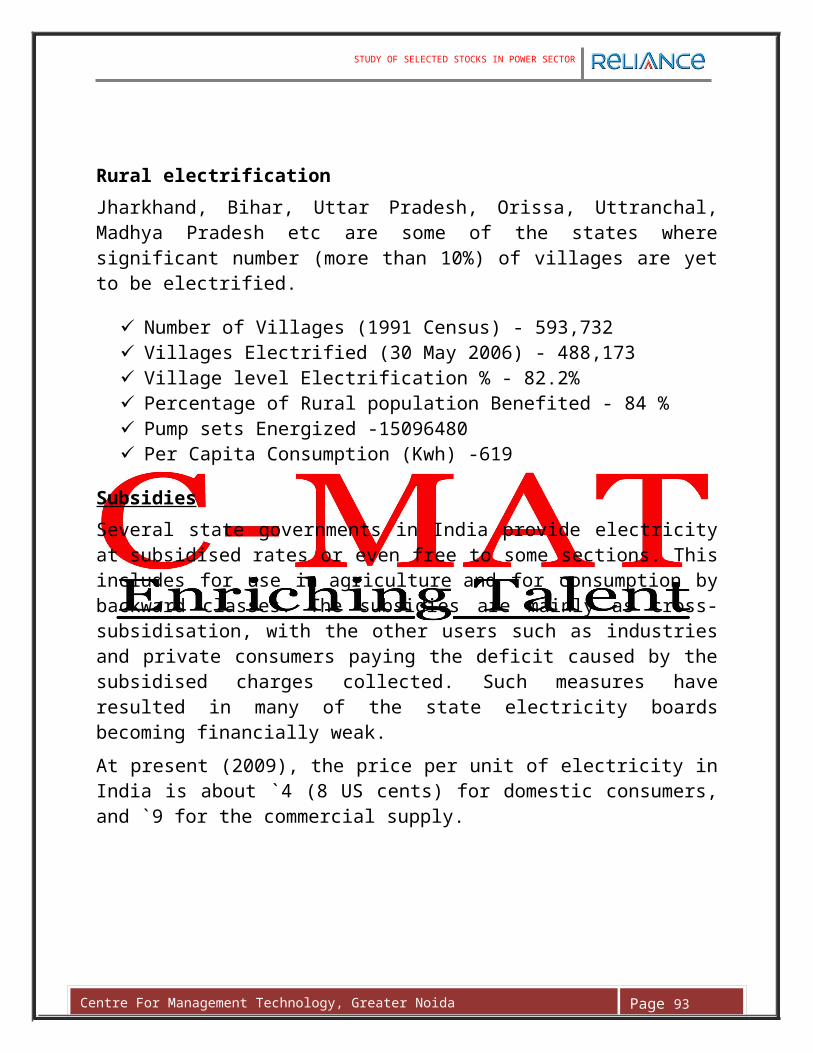
Rural electrification
Jharkhand, Bihar, Uttar Pradesh, Orissa, Uttranchal, Madhya Pradesh etc are some of the states where significant number (more than 10%) of villages are yet to be electrified.
Number of Villages (1991 Census) - 593,732 Villages Electrified (30 May 2006) - 488,173 Village level Electrification % - 82.2% Percentage of Rural population Benefited - 84 % Pump sets Energized -15096480 Per Capita Consumption (Kwh) -619
Subsidies
Several state governments in India provide electricity at subsidised rates or even free to some sections. This includes for use in agriculture and for consumption by backward classes. The subsidies are mainly as cross-subsidisation, with the other users such as industries and private consumers paying the deficit caused by the subsidised charges collected. Such measures have resulted in many of the state electricity boards becoming financially weak.
At present (2009), the price per unit of electricity in India is about `4 (8 US cents) for domestic consumers, and `9 for the commercial supply.

Centre For Management Technology, Greater Noida Page 93
The energy policy of India
The energy policy of India is characterized by tradeoffs between major drivers:
Rapidly growing economy, with a need for dependable and reliable supply of electricity, gas, and petroleum products;
Increasing household incomes, with a need for affordable and adequate supply of electricity, and clean cooking fuels;
Limited domestic reserves of fossil fuels, and the need to import a vast fraction of the gas, crude oil, and petroleum product requirements, and recently the need to import coal as well; and
Indoor, urban and regional environmental impacts, necessitating the need for the adoption of cleaner fuels and cleaner technologies.
Achieving optimum utilisation of existing equipments Rationalising the tariff structure Improving quality of services thereby achieving cost effectiveness Striving for energy conservation Encouraging Power generation utilising non-conventional sources
These trade-offs are often difficult to achieve. For example, the supply of adequate, yet affordable electricity generated and used cleanly is a continuing challenge because expansion of supply, and adoption of cleaner technologies, especially renewable energy, often means that this electricity is too expensive for many Indians, particularly in rural areas.

Centre For Management Technology, Greater Noida Page 93
The energy outlook of India
In order to fuel a rapidly growing economy, the Indian energy sector requires investments to the tune of US$ 120 - 150 billion over the next five years. The imperative for private sector investment is strong in order to complement thePublic sector in meeting this investment requirement and to bring in the required capabilities and technologies to enhance energy resource extraction.
The Government of India has recognized the need for private participation and policies to promote private investment are being implemented. Private participation in coal mining for captive use, in oil & gas exploration and in the Power sector is already seeing significant progress. It is also expected that private participation in nuclear energy would be allowed as and when the Indo-US Nuclear deal goes through.
Along with private participation, there is a move to bring in market mechanisms in the energy sector under an independent regulatory oversight. Progress has been made in sectors such as Power and oil & gas where private participation is already significant. A gradual approach is important till the supply side position improves and more players enter the sector so that markets can work effectively.
In parallel, the Government is making efforts to broaden the supply base both internally and externally. It is intended to diversify the fuel basket by increasing shares of Natural Gas, Hydro and even Nuclear energy. At the same time, both Government and private sector companies are looking to acquire equity in energy assets abroad and we have seen recent examples in the oil & gas and coal sectors. Energy transport infrastructure such as ports, railways, pipelines and Power transmission networks need significant investment. The policy now allows private participation in all these areas and some private sector activity is already under way.
Tariff reform in the energy sector and distribution reform in the Power sector are two important steps that need to be successfully carried out. Tariff reform to phase out subsidies or to target them effectively and distribution reforms to bring efficiency in the Power sector are vital. Steps have been taken in these directions with mixed results. Going forward, this is an important area to manage.
Centre For Management Technology, Greater Noida Page 93
Coal
India has vast reserves of coal and participation of the private sector in captivemining, across different user industries, is an immediate opportunity for investment. Thirty eight coal fields with mineable coal reserves in excess of 2,800 million tonnes have been identified and are in the process of being allocated for captive mining. This may imply a total capital requirement of around US$ 1.5-2 billion. Investment activity in other parts of the coal value chain such as in coal washeries has also been seen in recent times.Oil
The Government’s policy of allowing full private participation in upstream exploration and production has already attracted a number of private investors.Six rounds of competitive bidding under the Government policy, named New Exploration Licensing Policy (NELP), have already been done, around 185 blockswere awarded and reserves estimated at 700 MMT2 of oil and gas have been discovered. The sixth round of bidding (NELP-VI) for 65 blocks was successfullycompleted last year. In addition, India presents a lot of potential in the refining sector due to the strategic advantages of low cost and location; and is already a net exporter of products. The downstream marketing sector is also now open to private participation.
Gas
Discoveries of gas to the tune of 700 bcm2 in the last decade have meant that gas reserves hold promise in India. The potential for Coal Bed Methane appears to be very promising and will probably exceed the free natural gas reserves.While in the near term, potential for LNG may be limited due to inability of key sectors such as Power to absorb high international prices, in the longer term there would be place for LNG as the share of Natural Gas in India’s energy mix increases.
On the demand side, an emerging area is auto-CNG and piped gas which have together accounted for about 7 percent of the total gas demand in the last five years. In the next few years, at least 30 cities have been identified for city-wide gas coverage by private and public sector players.
The draft gas pipeline policy gives support to the development of a national gas rid meant to create a common gas market across the country.
Centre For Management Technology, Greater Noida Page 93
Nuclear
The envisaged growth of nuclear Power in India is possible provided robust technologies are developed for both the front-end and the back-end of the fuel cycle. India has one of the largest reserves of the nuclear fuel - thorium.However, the nuclear energy programme will continue to be uranium based until commercial production based on thorium becomes feasible. There is a persisting need for developing techniques for economic and efficient extraction of uranium from lean sources e.g. sea water. If the Indo-US nuclear deal goes through, there will be a boost to nuclear energy and private participation in this sector would be expected.
Hydro
India is endowed with a hydroelectric potential of about 150,000 MW3. However, only 17 percent of the hydroelectric potential has been harnessed so far; with another 5 percent under various stages of development. Private participation in the hydro sector will be important to meet the target of an additional 45,000 MW of hydro capacity within the next ten years. Various policy measures are beingcontemplated to encourage private participation which seek to address issuessuch as mitigating geological risks, resettlement and rehabilitation of project affected persons through Public Private Partnership initiatives and incentives for performance. The revised hydro policy is currently under discussion by the Government of India.
Renewable Energy
India has a vast potential for renewable energy sources, especially in areas such as solar Power , biomass and wind Power . The current installed capacity of renewable energy is around 92204 MW, constituting about 7.3 percent of India’s total installed generation capacity. India is already the fourth largest in the world in terms of wind energy installations and we are seeing significant investment activity in this area. Technological breakthroughs for cost-effective photovoltaic technology could generate a quantum leap in the renewable energy sector since India is well endowed with solar insolation (average of 6 kwh/ sq.mt./day).

Centre For Management Technology, Greater Noida Page 93
TECHNICAL ANALYSIS
Technical Analysis is the forecasting of future financial price movements based on an examination of past price movements. Like weather forecasting, technical analysis does not result in absolute predictions about the future. Instead, technical analysis can help investors anticipate what is "likely" to happen to prices over time. Technical analysis uses a wide variety of charts that show price over time.
Technical analysis is applicable to stocks, indices, commodities, futures or any tradable instrument where the price is influenced by the forces of supply and demand. Price refers to any combination of the open, high, low, or close for a given security over a specific time frame. The time frame can be based on intraday (1-minute, 5-minutes, 10-minutes, 15-minutes, 30-minutes or hourly), daily, weekly or monthly price data and last a few hours or many years. In addition, some technical analysts include volume or open interest figures with their study of price action.
TECHNICAL ANALYSIS VS FUNDAMENTAL ANALYSIS
Technical analysis and fundamental analysis are the two main schools of thought in the financial markets. Technical analysis looks at the price movement of a security and uses this data to predict its future price movements. Fundamental analysis, on the other hand, looks at economic factors, known as fundamentals. Let's get into the details of how these two approaches differ, the criticisms against technical analysis and how technical and fundamental analysis can be used together to analyze securities.
At the most basic level, a technical analyst approaches a security from the charts, while a fundamental analyst starts with the financial statements. Hence we can also say its “CHARTS VS. FINANCIAL STATEMENTS”.
Centre For Management Technology, Greater Noida Page 93
A fundamental analyst tries to determine a company's value by looking at its cash flow statement, income statement and balance sheet. In financial terms, an analyst attempts to measure a company's intrinsic value. In this approach, investment decisions are fairly easy to make - if the price of a stock trades below its intrinsic value, it's a good investment.
Technical traders, on the other hand, believe there is no reason to analyze a company's fundamentals because these are all accounted for in the stock's price. Technicians believe that all the information they need about a stock can be found in its charts
Fundamental analysis takes a relatively long-term approach to analyzing the market compared to technical analysis. While technical analysis can be used on a timeframe of weeks, days or even minutes, fundamental analysis often looks at data over a number of years.
Not only is technical analysis more short term in nature that fundamental analysis, but the goals of a purchase (or sale) of a stock are usually different for each approach. In general, technical analysis is used for a TRADE, whereas fundamental analysis is used to make an INVESTMENT. Investors buy assets they believe can increase in value, while traders buy assets they believe they can sell to somebody else at a greater price. The line between a trade and an investment can be blurry, but it does characterize a difference between the two schools.
Centre For Management Technology, Greater Noida Page 93
CAN TECHNICAL ANALYSIS AND FUNDAMENTAL ANALYSIS COEXIST?
Although technical analysis and fundamental analysis are seen by many as polar opposites - the oil and water of investing - many market participants have experienced great success by combining the two. For example, some fundamental analysts use technical analysis techniques to figure out the best time to enter into an undervalued security. Oftentimes, this situation occurs when the security is severely OVERSOLD. By timing entry into a security, the gains on the investment can be greatly improved.
Alternatively, some technical traders might look at fundamentals to add strength to a technical signal. For example, if a sell signal is given through technical patterns and indicators, a technical trader might look to reaffirm his or her decision by looking at some key fundamental data. Oftentimes, having both the fundamentals and technical on your side can provide the best-case scenario for a trade.
While mixing some of the components of technical and fundamental analysis is not
well received by the most devoted groups in each school, there are certainly b

Centre For Management Technology, Greater Noida Page 93
THE BASIS OF TECHNICAL ANALYSIS
The DOW THEORY laid the foundations for what was later to become modern technical analysis. Dow Theory was not presented as one complete amalgamation, but rather pieced together from the writings of CHARLES DOW over several years. Of the many theorems put forth by Dow, three stand out:
The Market Discounts Everything Price Movements Are Not Totally Random What Is More Important than Why
The Market Discounts Everything
A major criticism of technical analysis is that it only considers price movement, ignoring the fundamental factors of the company. However, technical analysis assumes that, at any given time, a stock's price reflects everything that has or could affect the company - including FUNDAMENTAL FACTORS. Technical analysts believe that the company's fundamentals, along with broader economic factors and MARKET PSYCHOLOGY, are all priced into the stock, removing the need to actually consider these factors separately. This only leaves the analysis of price movement, which technical theory views as a product of the supply and demand for a particular stock in the market.

Centre For Management Technology, Greater Noida Page 93
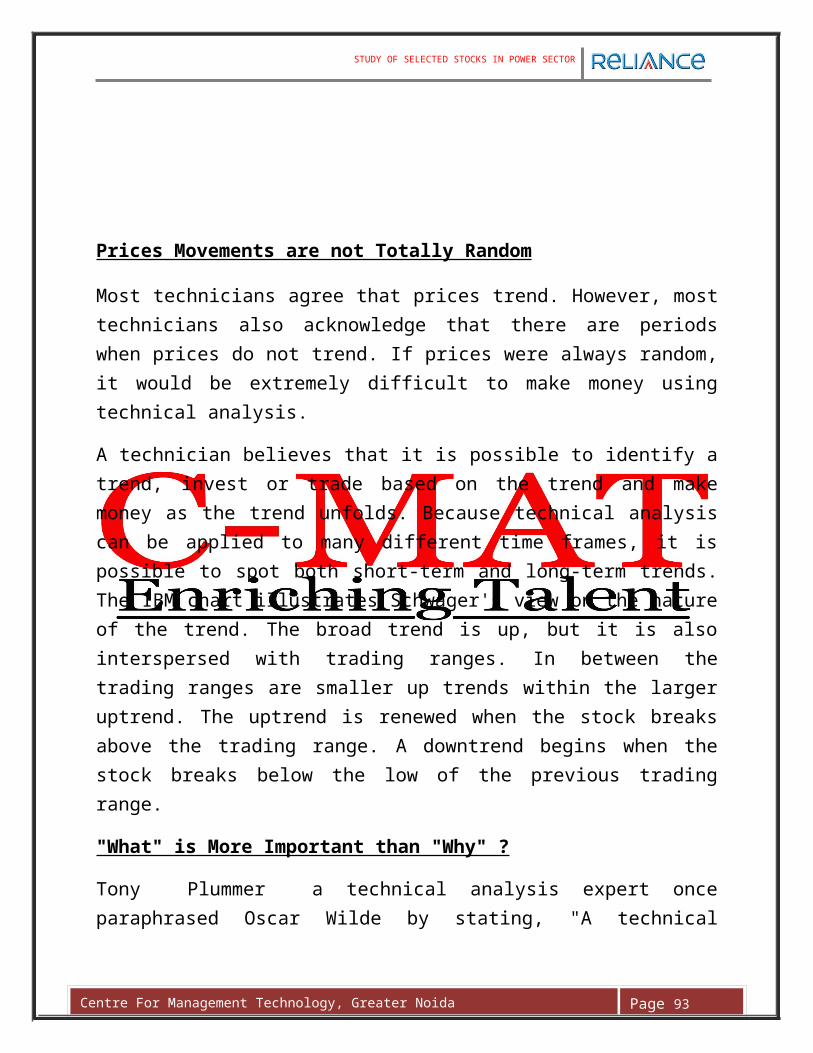
Prices Movements are not Totally Random
Most technicians agree that prices trend. However, most technicians also acknowledge that there are periods when prices do not trend. If prices were always random, it would be extremely difficult to make money using technical analysis.
A technician believes that it is possible to identify a trend, invest or trade based on the trend and make money as the trend unfolds. Because technical analysis can be applied to many different time frames, it is possible to spot both short-term and long-term trends. The IBM chart illustrates Schwager's view on the nature of the trend. The broad trend is up, but it is also interspersed with trading ranges. In between the trading ranges are smaller up trends within the larger uptrend. The uptrend is renewed when the stock breaks above the trading range. A downtrend begins when the stock breaks below the low of the previous trading range.
"What" is More Important than "Why" ?
Tony Plummer a technical analysis expert once paraphrased Oscar Wilde by stating, "A technical analyst knows the price of everything, but the value of nothing". Technicians, as technical analysts are called, are only concerned with two things:
What is the current price? What is the history of the price movement?
By focusing on price and only price, technical analysis represents a direct approach. Fundamentalists are concerned with why the price is what it is. For technicians, the why portion of the equation is too broad and many times the fundamental reasons given are highly suspect. Technicians believe it is best to concentrate on what and never mind why. Why did the price go up? It is simple, more buyers (demand) than sellers (supply). After all, the value of any asset is only what someone is willing to pay for it. Who needs to know why?

Centre For Management Technology, Greater Noida Page 93
POWER SECTOR COMPANIES
Before the analysis starts its very important select the companies whose stock prices I will analyze in my project. For this project which is mainly based on the analysis of Power sector stocks I have chosen 5 Power sector companies operating in India.
These companies are selected on the basis of their:
Market Capitalization.
Profitability.
Capital structure.
While selecting the companies I decided to choose only those companies which have shown good growth rate over the years. Their market capitalization must also be good and all these companies should have recorded good profit over the years. I have also taken care that all these firms must be leveraged firms means they have both equity and debt capital in their capital structure. The selected companies should act as a good indicator of the performance of the Power sector industry in the country. In other words these companies should be good representative of the Power industry as a whole.
So finally these 5 companies (Large Cap Stocks**) are selected for the analysis:
1. NTPC LTD.
2. NHPC LTD.
3. POWER GRID
4. TATA POWER
5. RELIANCE POWER
**:-Stocks with market capitalization more than 1000 crore are categorized as LARGE CAPS. Stocks with market capitalization between 500-1000 crore are categorized as MID CAPS. Stocks with market capitalization less than 500 crore are categorized as SMALL CAPS.

Centre For Management Technology, Greater Noida Page 93
Now, before we start the analysis of the stocks of above mentioned companies we need to know a bit about these companies and their history also.
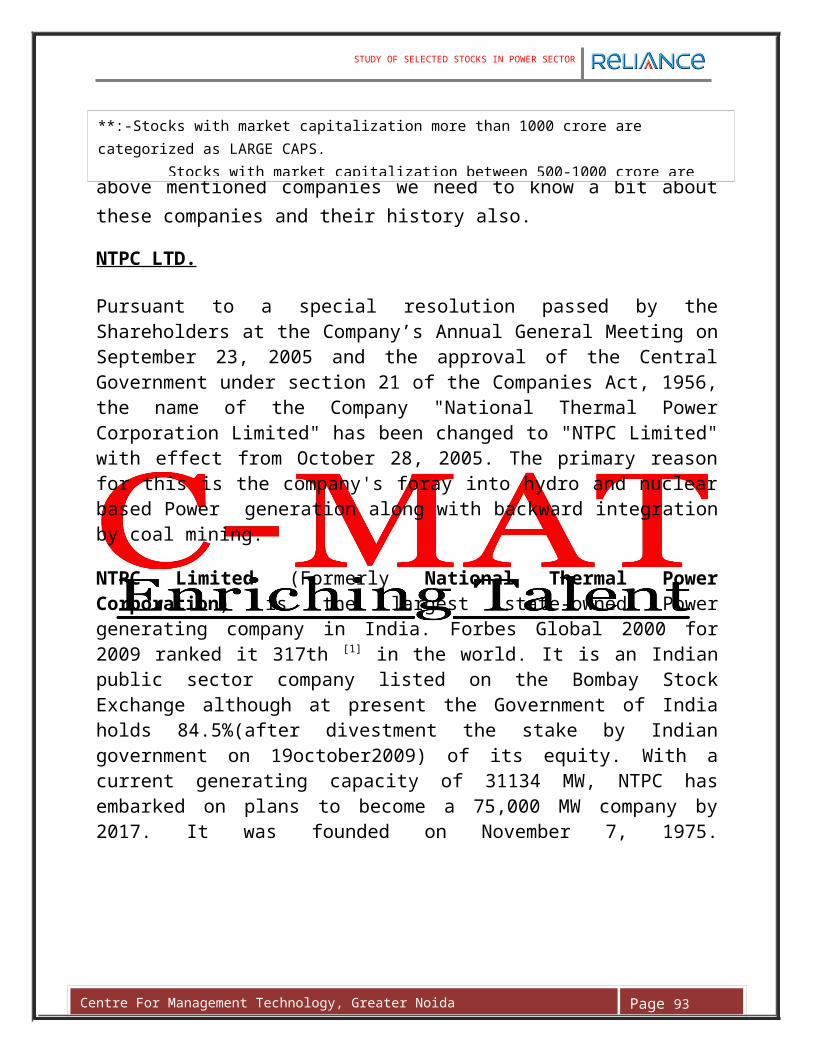
NTPC LTD.
Pursuant to a special resolution passed by the Shareholders at the Company’s Annual General Meeting on September 23, 2005 and the approval of the Central Government under section 21 of the Companies Act, 1956, the name of the Company "National Thermal Power Corporation Limited" has been changed to "NTPC Limited" with effect from October 28, 2005. The primary reason for this is the company's foray into hydro and nuclear based Power generation along with backward integration by coal mining.
NTPC Limited (Formerly National Thermal Power Corporation) is the largest state-owned Power generating company in India. Forbes Global 2000 for 2009 ranked it 317th [1] in the world. It is an Indian public sector company listed on the Bombay Stock Exchange although at present the Government of India holds 84.5%(after divestment the stake by Indian government on 19october2009) of its equity. With a current generating capacity of 31134 MW, NTPC has embarked on plans to become a 75,000 MW company by 2017. It was founded on November 7, 1975.
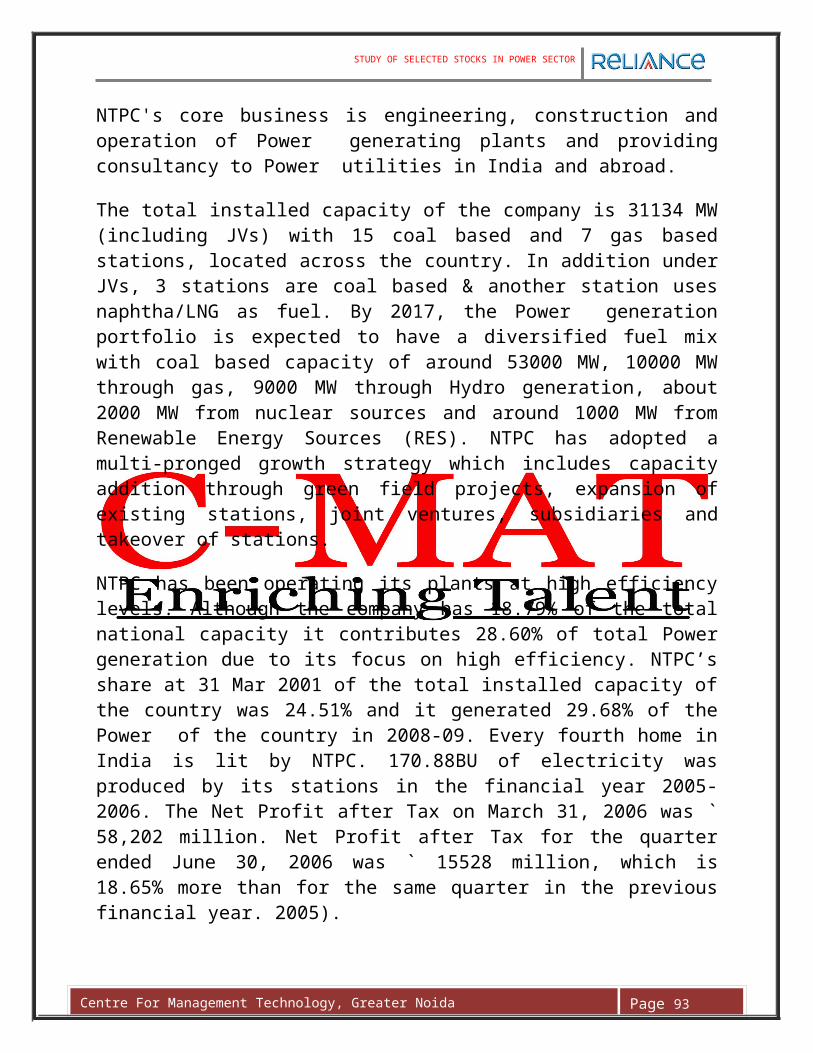
NTPC's core business is engineering, construction and operation of Power generating plants and providing consultancy to Power utilities in India and abroad.
The total installed capacity of the company is 31134 MW (including JVs) with 15 coal based and 7 gas based stations, located across the country. In addition under JVs, 3 stations are coal based & another station uses naphtha/LNG as fuel. By 2017, the Power generation portfolio is expected to have a diversified fuel mix with coal based capacity of around 53000 MW, 10000 MW through gas, 9000 MW through Hydro generation, about 2000 MW from nuclear sources and around 1000 MW from Renewable Energy Sources (RES). NTPC has adopted a multi-pronged growth strategy which includes capacity addition through green field projects, expansion of existing stations, joint ventures, subsidiaries and takeover of stations.
NTPC has been operating its plants at high efficiency levels. Although the company has 18.79% of the total national capacity it contributes 28.60% of total Power generation due to its focus on high efficiency. NTPC’s share at 31 Mar 2001 of the total installed capacity of the country was 24.51% and it generated 29.68% of the Power of the country in 2008-09. Every fourth home in India is lit

Centre For Management Technology, Greater Noida Page 93
by NTPC. 170.88BU of electricity was produced by its stations in the financial year 2005-2006. The Net Profit after Tax on March 31, 2006 was ` 58,202 million. Net Profit after Tax for the quarter ended June 30, 2006 was ` 15528 million, which is 18.65% more than for the same quarter in the previous financial year. 2005).
With an authorised share capital of Rs 10,000 crore and paid-up capital base of ` 7,812.5 crore, NTPC is also planning to hit the market with initial public offering of shares representing five per cent of its equity by early August.NTPC issued the equed share less then 15 % .
NHPC
NHPC Limited (Formerly National Hydroelectric Power Corporation), A Govt. of India Enterprise, was incorporated in the year 1975 with an authorised capital of `2000 million and with an objective to plan, promote and organize an integrated and efficient development of hydroelectric Power in all aspects. Later on NHPC expanded its objects to include other sources of energy like Geothermal, Tidal, Wind etc.
Initially, on incorporation, NHPC took over the execution of Salal Stage-I, Bairasiul and Loktak Hydro-electric Projects from Central Hydroelectric Projects Control Board. Since then, it has executed 13 projects with an installed capacity of 5175 MW on ownership basis including projects taken up in joint venture. NHPC has also executed 5 projects with an installed capacity of 89.35 MW on turnkey basis. Two of these projects have been commissioned in neighbouring countries i.e. Nepal and Bhutan.
Presently NHPC is engaged in the construction of 11 projects aggregating to a total installed capacity of 4622 MW . NHPC has planned to add 5322 MW during 11th Plan period. 10 projects of 9981 MW are awaiting clearances/Govt. approval for their implementation. Detailed Projects report or Feasibility Report are being prepared for 7 projects of 5755 MW.

Centre For Management Technology, Greater Noida Page 93
Since its inception in 1975, NHPC has grown to become one of the largest organizations in the field of hydro Power development in the country. With its present capabilities, NHPC can undertake all activities from concept to commissioning of hydroelectric projects.
At present, NHPC is a schedule 'A' Enterprise of the Govt. of India with an authorized share capital of ` 1,50,000 Million . With an investment base of over `2,20,000 million Approx. In 2009-2010 NHPC made a profit after tax of `2090 crores . A increase of 94% than the previous year profit of `1050 crores. NHPC is among the top ten companies in India in terms of investment. Department of Public Enterprise, Govt. of India recently conferred prestigious Miniratna status to NHPC.
POWER GRID
POWER GRID, a Navratna Public Sector Enterprise, is one of the largest transmission utilities in the world.POWER GRID wheels about 45% of the total Power generated in the country on its transmission network.POWER GRID has a pan India presence with around 77,000 Circuit Kms of Transmission network and 124 nos. of EHVAC & HVDC sub-stations with a total transformation capacity of 89,000 MVA.POWER GRID has also diversified into Telecom business and established a telecom network of more than 21,000 Kms across the country.POWER GRID has consistently maintained the transmission system availability over 99% which is at par with the International Utilities.
When referring to the Power industry, "grid" is a term used for an electricity network which may support all or some of the following four distinct operations:
Electricity generation Electric Power transmission Electricity distribution Electricity control
The sense of grid is as a network, and should not be taken to imply a particular physical layout, or breadth. "Grid" may be used to refer to an entire continent's

Centre For Management Technology, Greater Noida Page 93
electrical network, a regional transmission network or may be used to describe a subnetwork such as a local utility's transmission grid or distribution grid.
Electricity in a remote location might be provided by a simple distribution grid linking a central generator to homes. The traditional paradigm for moving electricity around in developed countries is more complex. Generating plants are usually located near a source of water, and away from heavily populated areas. They are usually quite large in order to take advantage of the Economies of scale. The electric Power which is generated is stepped up to a higher voltage—at which it connects to the transmission network. The transmission network will move (wheel) the Power long distances—often across state lines, and sometimes across international boundaries—until it reaches its wholesale customer (usually the company that owns the local distribution network). Upon arrival at the substation, the Power will be stepped down in voltage—from a transmission level voltage to a distribution level voltage. As it exits the substation, it enters the distribution wiring. Finally, upon arrival at the service location, the Power is stepped down again from the distribution voltage to the required service voltage(s).
This traditional centralized model along with its distinctions are breaking down with the introduction of new technologies. For example, the characteristics of Power generation can in some new grids be entirely opposite of those listed above. Generation can occur at low levels in dispersed locations, in highly populated areas, and not outside the distribution grids. Such characteristics could be attractive for some locales, and can be implemented if the grid uses a combination of new design options such as net metering, electric cars as a temporary energy source, or distributed generation.

Centre For Management Technology, Greater Noida Page 93
TATA POWER
Started as the Tata Hydroelectric Power Supply Company in 1911, it is an amalgamation of two entities: Tata Hydroelectric Power Supply Company and Andhra Valley Power Supply Company (1916). Today Tata Power Company Limited is India’s largest private sector electricity generating company with an installed generation capacity of over 2670 MW. The Company is a pioneer in the Indian Power sector. Tata Power has a presence in thermal, hydro, solar and wind areas of Power generation, transmission and retail. The founders of Tata Power pioneered the generation of electricity in India with the commissioning of India’s first large hydro-electric project in 1915 in Bhivpuri and Khopoli, Karjat.
The thermal Power stations of the company are located at Trombay in Mumbai, Jojobera in Jharkhand and Belgaum in Karnataka. The hydro stations are located in the Western Ghats of Maharashtra and the wind farm in Ahmednagar.
The Company has been a front-runner in introducing state-of-the-art Power technologies. Tata installed India’s first 500 MW unit at Trombay, the first 150 MW pumped storage unit at Bhira, and a flue gas desulphurization plant for pollution control at Trombay. At 2.4% the Company's transmission & distribution losses are among the lowest in the world. Tata Power has served Mumbai’s consumers for over nine decades.
Outside Mumbai, the company now has generation capacities in the States of Jharkhand and Karnataka and a Distribution Company in Delhi. The Distribution joint venture with the Government of Delhi called the “North Delhi Power Limited” (NDPL), has met with considerable success. This joint venture serves over 800,000 consumers (in a population of 4.5 million) spread over in an area of 510 km² and has a peak load of 1050 MW. NDPL has achieved some success in cutting down the losses from 51% to 28% in span of five years.

Centre For Management Technology, Greater Noida Page 93
Tata Power has entered into a 51:49 joint venture with Power Grid Corporation of India for the 1200 km Tala transmission project. The joint venture is India’s first transmission project to be executed withpublic-private partnership.
Tata Power has also won a contract for building 4000 MW Power plant at Mundra. A unique aspect of this project is that for the first time in India a 4000MW Power plant is being built utilizing one large construction project; all other large projects have always involved stage construction.
Tata Power has also entered into a 74:26 joint venture with Damodar Valley Corporation for building a 1050 MW coal based thermal Power plant at Maithon in Dhanbad district of Jharkhand.
Many other projects are also in pipeline.
Tata Power Company Ltd has allotted 98,94,000 Equity Shares of Rs 10/- each and 1,03,89,000 Warrants to Tata Sons Ltd (TSL) on a preferential basis.
The warrants allotted would permit TSL to subscribe to company’s equity shares after April 01, 2008 but not after 18 months from the date of issue of the Warrants.
The conversion of Warrants into Equity Shares to be allotted to TSL would not be at a price below ` 1,351.63 per Equity Share.

Centre For Management Technology, Greater Noida Page 93
RELIANCE POWER
Reliance Power Limited is a part of the Reliance ADA group, one of India’s largest business houses. The group comprises companies in the telecommunications, financial services, media and entertainment, infrastructure and energy sectors. The energy sector companies include Reliance Infrastructure Ltd, Reliance Natural Resources Limited, Reliance Energy Transmission, Reliance Energy Trading and Reliance-Power -Limited.
Reliance Power Limited is part of the Reliance Anil Dhirubhai Ambani Group and is established to develop, construct and operate Power projects domestically and internationally. The Company on its own and through subsidiaries has a portfolio of almost 35,000 MW of Power generation capacity, both operational as well as under-development.
The Power projects are planned to be diverse in geographic location, fuel type, fuel source and off-take, and each project is planned to be strategically located near an available fuel supply or load center. The company has over 1,000 MW of operational Power generation assets. The projects under development include seven coal-fired projects to be fueled by reserves from captive mines and supplies from India and abroad, two gas-fired projects to be fueled primarily by reserves from the Krishna Godavari Basin (the "KG Basin") off the east coast of India, and seven hydroelectric projects, six of them in Arunachal Pradesh and one in Uttarakhand.
The fuel supply for the majority of the projects has been tied up. Coal linkages have been allocated for domestic coal based projects. The company has domestic coal reserves of over 2 billion tonnes in India, the highest in the private sector in India. The company is expected to become the largest private sector coal mining company in India once the captive coal mines become operational.

Centre For Management Technology, Greater Noida Page 93
The company plans to sell the bulk of the Power generated through long term PPAs with distribution companies and through Case I bids. The company has also entered into long term contracts with industrial consumers to supply Power .
The company has won three of the four Ultra Mega Power Projects (Sasan UMPP, Krishnapatnam UMPP & Tilaiya UMPP) awarded by the Govt of India till date. The UMPP is an initiative by the government to collaborate with Power generation companies to set up 4,000 MW projects to ease the country’s Power deficit situation.
Two of Anil Dhirubhai Ambani Group firm--Reliance Power Ltd., and Reliance Natural Resources Ltd., or RNRL--on Sunday approved a scheme to amalgamate the two companies involving over `50,000 crore or $11 billion in an all-stock deal. The merger, undoing an earlier split, is subject to relevant approvals.
The boards of the two energy firms approved the swap-ratio of one equity share of Reliance Power for every four of RNRL. The exchange ratio was based on the valuation made by the global consultancy firm KPMG. The boards of RPL and RNRL had on Sunday approved the merger of the two companies, with a share swap ratio of 1:4 (1 equity share of RPL for every 4 shares of RNRL). Post the deal, the RPL stock surged 8.36% on Monday morning before closing the day at `181.40, still up 3.57% over Friday’s close.
Based on the proposal for issuance of bonus shares, the paid up share capital of the company will stand increased to 239.7 crore equity shares of `10 each.Reliance Power ’s IPO closed on January 18, 2008, receiving an overwhelming and record breaking response, with commitments of nearly `7,50,000 crore (US$ 190 billion), from nearly 500 institutional investors across the globe, and 5 million retail investors. Reliance Power has the world’s largest shareholder family of nearly 500 overseas and domestic institutional investors, and over 4 million retail investors.Reliance Power has a market capitalization of over `94,000 crores (over US$ 23 billion) – among India’s 10 most valuable private sector companies, and a net worth of nearly `14,000 crore (over US$ 3.5 billion) – among the top 5 private sector companies in India on this parameter.

Centre For Management Technology, Greater Noida Page 93
ANALYSIS
Data collection
In this project, data is mainly collected from the secondary sources such as
Internet i.e. Websites. Newspapers Especially Economic Times.
Since for this project we required the historical price data of the above mentioned stocks so all the data is collected from mainly NSE (National Stock Exchange) and BSE (Bombay Stock Exchange) websites.
Data such as everyday’s opening, closing, high and low of the individual stocks were required and hence these official sites of the stock exchanges worked as the most reliable and complete source of data collection.
Tools used for analysis
As mentioned above that in this project the Stock price movements will be analyzed mainly using the Technical Analysis method. So before the actual analysis starts we need to understand what all Technical Analysis tools will be used to analyze the stock price movements. Technical analysis of stocks can be done in primarily;
Statistical Method. Charting.
In this project we will mainly use charting to analyze the stock price movements. However we cannot completely deny the importance of Statistical tools in technical analysis hence it is very important to mention that at times few statistical tools also be used while analyzing the Stock Price Trends and Patterns. Such as
Moving Average. Standard Deviation etc.
Centre For Management Technology, Greater Noida Page 93
CHARTS
A chart pattern is a distinct formation on a stock chart that creates a trading signal, or a sign of future price movements. Chartists use these patterns to identify current trends and trend reversals and to trigger buy and sell signals. While there are general ideas and components to every chart pattern, there is no chart pattern that will tell you with 100% certainty where a security is headed. This creates some leeway and debate as to what a good pattern looks like, and is a major reason why charting is often seen as more of an art than a science.
There are two types of patterns within this area of technical analysis, reversal and continuation. A reversal pattern signals that a prior trend will reverse upon completion of the pattern. A continuation pattern, on the other hand, signals that a trend will continue once the pattern is complete. These patterns can be found over charts of any time frame.
Some of the popular chart patterns are as follows:
Head and Shoulders Double Tops and Bottoms Flag and Pennant Wedge

Centre For Management Technology, Greater Noida Page 93
PATTERNS
HEAD AND SHOULDERS
This is one of the most popular and reliable chart patterns in technical analysis. Head and shoulders is a reversal chart pattern that when formed, signals that the security is likely to move against the previous trend. There are two versions of the head and shoulders chart pattern. In figure 1 Head and shoulders top (shown on the left) is a chart pattern that is formed at the high of an upward movement and signals that the upward trend is about to end. Head and shoulders bottom, also known as inverse head and shoulders (shown on the right) is the lesser known of the two, but is used to signal a reversal in a downtrend.
Both of these head and shoulders patterns are similar in that there are four main parts: two shoulders, a head and a neckline. Also, each individual head and shoulder is comprised of a high and a low. For example, in the head and shoulders top image shown on the left side in Figure 1, the left shoulder is made up of a high followed by a low. In this pattern, the neckline is a level of support or resistance. Remember that an upward trend is a period of successive rising highs and rising lows. The head and shoulders chart pattern, therefore, illustrates a weakening in a trend by showing the deterioration in the successive movements of the highs and lows.
DOUBLE TOPS AND BOTTOMS
This chart pattern is another well-known pattern that signals a trend reversal - it is considered to be one of the most reliable and is commonly used. These patterns are
FIGURE 1

Centre For Management Technology, Greater Noida Page 93
formed after a sustained trend and signal to chartists that the trend is about to reverse. The pattern is created (figure 2) when a price movement tests support or resistance levels twice and is unable to break through. This pattern is often used to signal intermediate and long-term trend reversals.
FLAG AND PENNANT
These two short-term chart patterns are continuation patterns that are formed when there is a sharp price movement followed by a generally sideways price movement. This pattern is then completed upon another sharp price movement in the same direction as the move that started the trend. The patterns are generally thought to last from one to three weeks (figure 3).
WEDGE
FIGURE 2
FIGURE 3
Centre For Management Technology, Greater Noida Page 93
The wedge chart pattern can be either a continuation or reversal pattern. It is similar to a symmetrical triangle except that the wedge pattern slants in an upward or downward direction, while the symmetrical triangle generally shows a sideways movement. The other difference is that wedges tend to form over longer periods, usually between three and six months.
The fact that wedges are classified as both continuation and reversal patterns can make reading signals confusing. However, at the most basic level, a falling wedge is bullish and a rising wedge is bearish. In Figure 4, we have a falling wedge in which two trendlines are converging in a downward direction. If the price was to rise above the upper trendline, it would form a continuation pattern, while a move below the lower trendline would signal a reversal pattern.
FIGURE 4
Centre For Management Technology, Greater Noida Page 93
COMPANY WISE ANALYSIS
Now, when we have got some idea about the “TECHNICAL ANALYSIS”, we should move ahead with our analysis. Now we will analyze the above mentioned stocks one by one. We will try to study their past behavior and then will try to identify few patterns depicted by them in their price movement. Based on the analysis I will try to predict the most likely behavior these stocks are going to show in near future.**
Centre For Management Technology, Greater Noida Page 93
NTPC LTD.
MOVING AVERAGE
1 13 25 37 49 61 73 85 97 1091211331451571691811932052172292412532652772893013130
100
200
300
Close Price
Interpretation
Now we try to interpret the above graph (figure 14).
POINT 1—At this point as you can see that the stock price has fallen to good extent in respect of its moving average (DASHED LINE). But the steepness in the fall/rise of the moving average will always be less than the actual price movement. At this point we also see that the stock price has made a “DOUBLE BOTTOM” which is also considered as a signal for trend reversal and you can also see after that the Bulls took the control of the market.
At this point the stock price tested the support level twice (shown by a bold line) and the investors felt that the particular stock has been oversold and the price will not fall anymore. That is why the bears entered the market and supported the price and hence the stock prices started to rise.
21
3
FIGURE 14
SUPPORT LEVEL
RESISTENCE LEVEL
Centre For Management Technology, Greater Noida Page 93
In figure 15 we can see a Head and Shoulder pattern and we have already discussed that it is a trend reversal signal for the investors. And if we will look at the figure 14 we can also observe that after this pattern the NTPC stocks were in a downtrend.
By looking at the figure 15 you can clearly see the head and shoulder pattern. We can also observe that in figure 15 the moving average was well below the closing price line. As we know the closing price will always try to coincide with the moving average line so we can see the after the head the price of NTPC stocks fell steeply. So as of now we can say that this particular stock will continue to show a bearish trend for some time because if observed closely we can see double top being made just near the right shoulder. So we can say this bearish trend will continue in near future.
POINT 2—At this point you can see that the stock price has made a new resistance level( shown by a bold line) for itself and beforewards prices started to fall. This the time when investors think that the particular stock has been overbought and that’s when they start to sell off the stocks in hand and the bears
NECKLINE
SHOULDERS HEAD
FIGURE 15
Centre For Management Technology, Greater Noida Page 93
take the control over the market. That’s why we can see a continuous fall in the stock prices afterwards. However market tried to provide some support to the prices and the stock prices rose for some time but again continued to fall( Point-A).
POINT 3 – At this point you can see that in the the price didnot more fluctuate.so we can see the actual price andmoving average price has not difference.Investor have wait for buy or sale of stock. Because stock also depend upon the external factor( company policy,issued report about company, government policy etc).
BOLLINGER BANDS
1 14 27 40 53 66 79 92 105 118 131 144 157 170 183 196 209 222 235 248 261 274 287 3000
100
200
300
Plus dev
MOV AVG(15 DAY)
Minus Dev
LOW VOLATALITYHIGH
VOLATILITY
FIGURE 15

Centre For Management Technology, Greater Noida Page 93
Interpretation
While discussing the Bollinger Bands for NTPC LTD. we came to know that Bollinger Bands are very good indicator of market volatility. If the band width is more then we can infer that the market is very volatile and vice versa.
The zones of low volatility and high volatility are encircled in the above chart (Figure 15). By looking at the extreme right of the chart we can say that right now the market is very volatile in nature. Any investment made in near future will bear a little more risk than normal but at the same time investors can also expect good returns. As the rule says “high returns have high risk associated with them”.
VOHLC (Volume- Open- High- Low-Close Graph)
1 16 31 46 61 76 91 1061211361511661811962112262412562712863013160
5000000
10000000
15000000
20000000
25000000
30000000
0
50
100
150
200
250
300
VolumeLast Price
12 3
Interpretation
FIGURE 16
Centre For Management Technology, Greater Noida Page 93
FIGURE 17
DOJI

Centre For Management Technology, Greater Noida Page 93
POINT 1 and 2— Now we will discuss the point 1and 2 in the above graph (figure 16). If you will observe it closely you will see that its HEAD AND SHOULDER pattern (figure 16). In this section (figure 17) we can see trend reversal. Now the BEARS will take over the control of the market from the BULLS. Obviously this is the time when investors feel that this particular stock has been overbought and hence this the time to start selling the stocks in hand.
You can see in the figure 17 clearly that at point 30 the stock opened at a price above the last days closing however within that trading day it closed below the its opening price. And if observed carefully you will see this happened after 5 days when the stock closed at a price below its opening price. This can be regarded the first signal of the beginning of the BEARISH trend. But at this point of time we cannot predict this with certainty that the bearish trend has started. Now the very next day the stock opened at a price far below its last day’s closing price. This will certainly work as an alarm for the investors who have invested their money in this particular stock (NTPC). So this is the perfect time to sell off your stocks. If you want you can also wait for 1-2 days as it can be the retracement of another bullish trend but waiting for more days can be risky.
We can see this pattern stock price is try three time to rise, but stock price is start to fall.In stock volume also good fluctution. So the investor have been start to selling the stocks.
But as said earlier since the stock prices has already made an HEAD AND SHOULDER and as per the technical analysis it’s a trend reversal pattern, the bulls will start to overPower the bears. The very next point of DOJI i.e. POINT 55 the market almost opened at par with the last days closing and closed at price quite higher than its opening. The same day we also observe that a good volume was being traded.

Centre For Management Technology, Greater Noida Page 93
POINT 3— Figure 18.Now this point is very important in the context of this stock. Because when we were expecting a BEARISH TREND it has shown us a BULLISH TREND. So know we need to learn how to distinguish between a TREND and a RETRACEMENT.
Why we can say that it’s just an retracement of an Bearish trend and not the start of another Bullish trend because if we will look at the bars below the candlesticks we will find that its very surprising that even when there was not enough volume being traded in the market the stock prices were rising. In fact you can see when this bullish trend was occurring at that time the volume was declining. It can also be used as a reason to point this phase as a RETRACEMENT and not as a TREND REVERSAL. So you can say it’s just a retracement of a Bearish trend or some manipulation is being done with the stock prices. Otherwise how the stock prices can rise without any volume to support it?
FIGURE 18

Centre For Management Technology, Greater Noida Page 93
MACD (Moving Average Convergence /Divergence Graph)
1 15 29 43 57 71 85 99 113127141155169183197211225239253267281
-15
-10
-5
0
5
10
15
MACD
MACD
Interpretation
We have already discussed what to interpret for MACD charts, so we will not devote much time on discussing this. Whenever the MACD bars are above the signal line then it’s a buy signal for investors and vice versa.
So as of now looking at this graph and all the other kinds of graph discussed above, we can predict to some extent that in near future the prices of this particular scrip (NTPC) will Stable. The simple reason can be that the investors will feel that this stock has been over buy but its not touch Resistence level. That is when the BEARS will take over the control of the market from the BULLS.
FIGURE 19

Centre For Management Technology, Greater Noida Page 93
NHPC Ltd.
MOVING AVERAGE
1-Sep-09
13-Sep-09
25-Sep-09
7-Oct-
09
19-Oct-
09
31-Oct-
09
12-Nov-0
9
24-Nov-0
9
6-Dec-
09
18-Dec-
09
30-Dec-
09
11-Jan-10
23-Jan-10
4-Feb-10
16-Feb-10
28-Feb-10
12-Mar-
10
24-Mar-
10
5-Apr-1
0
17-Apr-1
0
29-Apr-1
0
11-May
-10
23-May
-10
4-Jun-10
16-Jun-10
28-Jun-10
10-Jul-1
00
5
10
15
20
25
30
35
40
Close Price
Mov avg(15 days)
A Moving Average is an indicator that shows the average value of a security's price over a period of time. When calculating a moving average, a mathematical analysis of the security's average value over a predetermined time period is made. As the security's price changes, its average price moves up or down.
There are several popular ways to calculate a moving average. I have calculated a "simple" moving average--meaning that equal weight is given to each price over the calculation period.
RESISTENCE LEVEL
SUPPORT PRICE
1 A
2
3 4
FIGURE 5
**-: This study is based on the stock prices and index value taken from the NSE.
Centre For Management Technology, Greater Noida Page 93
The most popular method of interpreting a moving average is to compare the relationship between a moving average of the security's price with the security's price itself. A buy signal is generated when the security's price rises above its moving average and a sell signal is generated when the security's price falls below its moving average.
Interpretation
Now we try to interpret the above graph (figure 5).
POINT 1—At this point you can see that the stock price has made a new resistance level( shown by a bold line) for itself and afterwards prices started to fall. This the time when investors think that the particular stock has been overbought and that’s when they start to sell off the stocks in hand and the bears take the control over the market. That’s why we can see a continuous fall in the stock prices afterwards. However market tried to provide some support to the prices and the stock prices rose for some time but again continued to fall( Point-A).
Now the question is why this happened. I will try to answer it while discussing VOHLC (Volume Open High Low Close) graph.
POINT 2—At this point as you can see that the stock price has fallen to good extent in respect of its moving average (DASHED LINE). But the steepness in the fall/rise of the moving average will always be less than the actual price movement. At this point we also see that the stock price has made a “DOUBLE BOTTOM” which is also considered as a signal for trend reversal and you can also see after that the Bulls took the control of the market.
At this point the stock price tested the support level twice (shown by a bold line) and the investors felt that the particular stock has been oversold and the price will not fall anymore. That is why the bears entered the market and supported the price and hence the stock prices started to rise
POINT 3—At this point we again see a DOUBLE BOTTOM being made which we know is a trend reversal signal and we can also see that after point 3 the stock prices kept on making higher lows for quite some time. We can also see that the moving average line was above the stock price line and hence they will try to coincide. That is why we saw a bearish trend for some time in the market.
POINT 4—At this point we can see that the stock price has got a new resistence level for itself and at the same time the moving average curve is less then the stock
Centre For Management Technology, Greater Noida Page 93
price curve. So to some extent we can predict that the stock price will move downward. Even if the price will rise for 2-3 days it will fall because as we know that the steepness of fall/rise of moving average curve is more than that of the stock price. So within a short span of time the stock will show some fall.according to graph buyer are start to purchase the stock.
BOLLINGER BANDS
1 10 19 28 37 46 55 64 73 82 91 100 109 118 127 136 145 154 163 172 181 190 1990
20
40
plus dev
Mov avg(15 days)
minus Dev
1 23
45 6 7
Bollinger Bands were created by John Bollinger.
Bollinger Bands are similar to moving average envelopes. The difference between Bollinger Bands and envelopes is envelopes are plotted at a fixed percentage above and below a moving average, whereas Bollinger Bands are plotted at standard deviation levels above and below a moving average. Since standard deviation is a
FIGURE 6
Centre For Management Technology, Greater Noida Page 93
measure of volatility, the bands are self-adjusting: widening during volatile markets and contracting during calmer periods.
Interpretation
POINT 3—At POINT 1,POINT 3 and POINT 7(figure 6) we observe that the market is going through a volatile phase. During these times the risk factor associated with any stock increases but at the same time investors can also reap good returns from the market.
POINT 2— At this point we see that the market for this particular stock is least volatile and it has been seen through Bollinger bands that sharp price changes tend to occur after the bands tighten, as volatility lessens. That’s why we see a good rise in the stock prices after the POINT 2 , POINT 4 , POINT 5,and POINT 6 (figure 6) which implies that the bulls have taken over the control from bears.
VOHLC (Volume- Open- High- Low-Close Graph)
1 10 19 28 37 46 55 64 73 82 91 100 109 118 127 136 145 154 163 172 181 190 199 2080
100000002000000030000000400000005000000060000000700000008000000090000000
100000000
0
10
20
30
40
50
Volume
Last
31 2
FIGURE 7

Centre For Management Technology, Greater Noida Page 93
Interpretation
POINT 1—We can observe here (figure 8) that for last few days there is not less or enough volume being traded. Even the intraday trading is also with minimum fluctuations. We can observe the candle sticks at POINTS 38-39 hardly have a body. These kind of situations forced the investors feel that may be the stock has been oversold and it will not fall anymore. At these times bulls enter the market with a view of buying these stocks as their prices have really came down. In fact at this point the stock price tested the support level and then bulls gave the market the thrust to rise. As we can see a good volume was traded between the POINTS 42-43.
One very interesting thing that I would like add here is that if watch the point one closely you will find that exactly at point 47 there is this candlestick with literally no body. It more or less looks like a plus(+) sign. This kind of candlestick is also called a DOJI( in Japanese) or CROSS OF INDECISION. The very next point of DOJI i.e. POINT 47 the market almost opened at par with the last days closing
DOJI
SUPPORT LEVEL
FIGURE 8
Centre For Management Technology, Greater Noida Page 93
and closed at price quite higher than its opening. The same day we also observe that a good volume was being traded.
All this conclude that the BULLS started to take control over the market at this phase.
SHOULDERS
FIGURE 9
HEAD
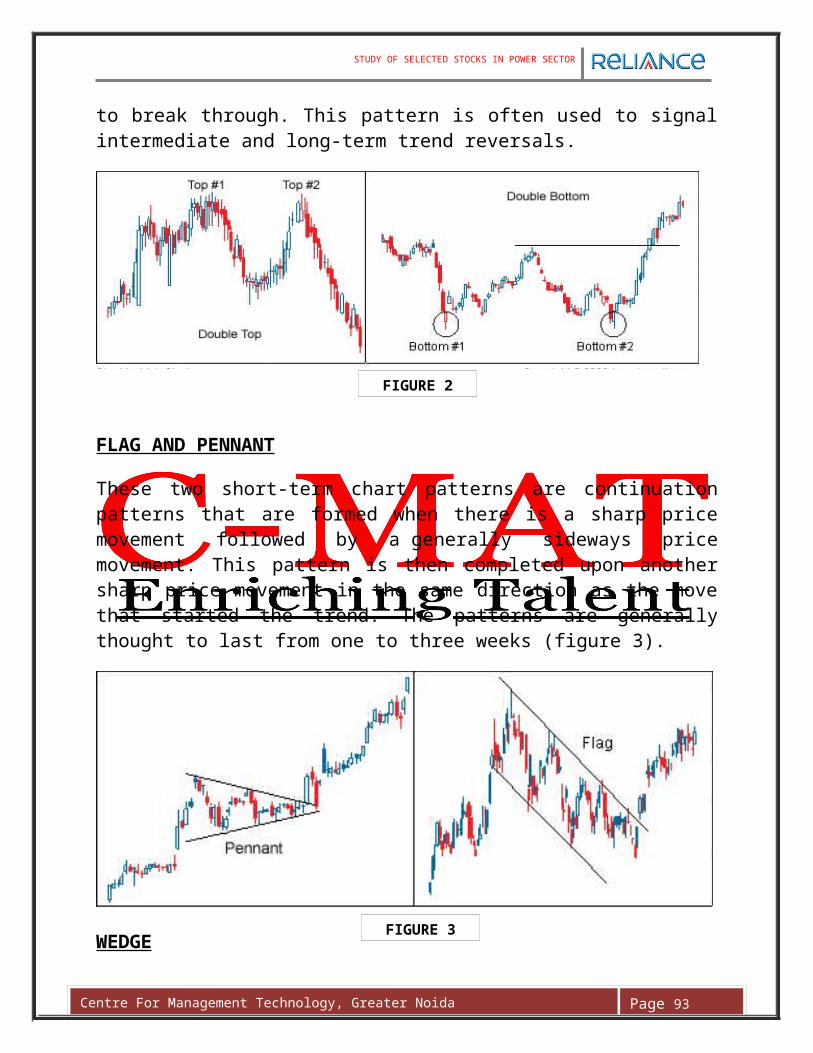
Centre For Management Technology, Greater Noida Page 93
POINT 2— Now we will discuss the point 2 in the above graph (figure 7). If you will observe it closely you will see that itsTWO SHOULDER AND HEADPATTERN. In this section (figure 9) we can see another trend reversal. Now the BEARS will take over the control of the market from the BULLS. Obviously this is the time when investors feel that this particular stock has been overbought and hence this the time to start selling the stocks in hand.
You can see in the figure 9 clearly that at point 77 the stock opened at a price above the last days closing however within that trading day it closed below the its opening price. And if observed carefully you will see this happened after 7 days when the stock closed at a price below its opening price. This can be regarded the first signal of the beginning of the BEARISH trend. But at this point of time we cannot predict this with certainty that the bearish trend has started. Now the very next day the stock opened at a price far below its last day’s closing price. This will certainly work as an alarm for the investors who have invested their money in this particular stock (NHPC). So this is the perfect time to sell off your stocks. If you want you can also wait for 1-2 days as it can be the retracement of another bullish trend but waiting for more than 2 days can be risky.
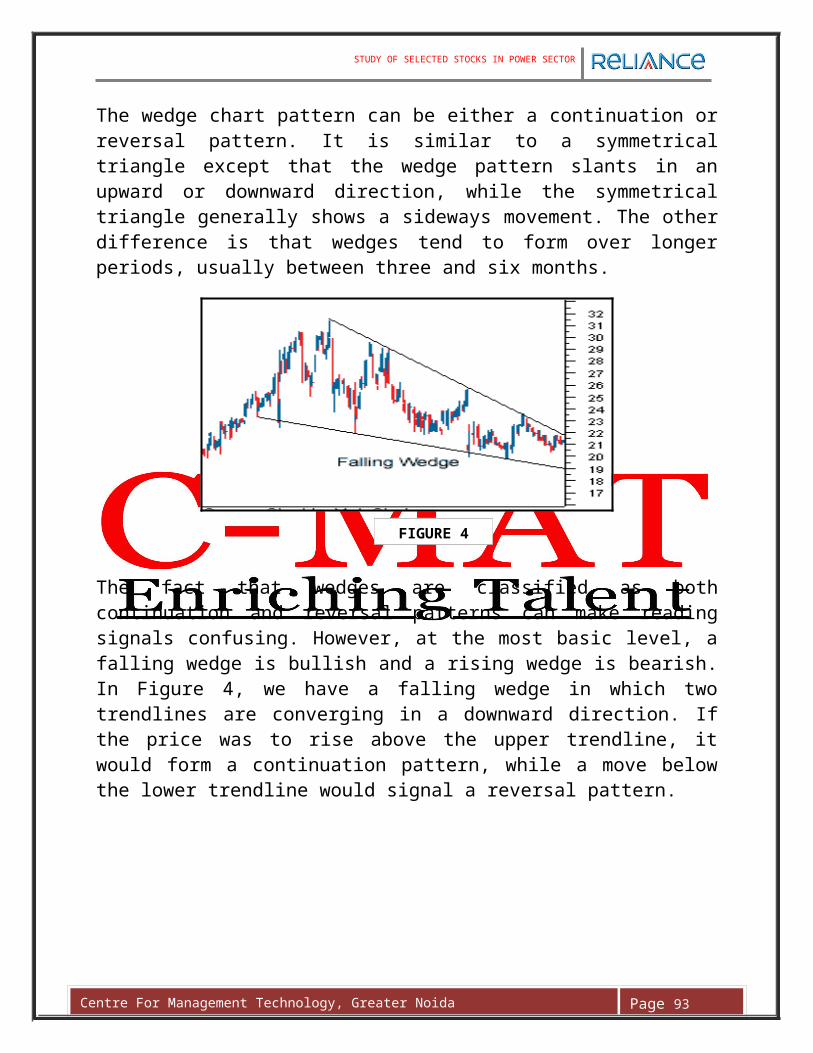
Centre For Management Technology, Greater Noida Page 93
POINT 3—Figure 10 we see that the there has been a not good fluctuation in the stock prices in trading and also no high movement in volume . It has also made a new SUPPORT level of price in the chart. That is the BEARISH TREAND .we see the stock price are try to rise and again fall in POINT 175 to 200. In thish point price are reapeted but break SUPPORT level .
By looking at this we can be a little confident in saying that the stock has got a new Support level with TRIPPLE BOTTOM PATTERN . It means the stock was over sale.It may now show an uptrend that is the beginning of BULLISH TREND.
FIGURE 10
SPINNING TOP

Centre For Management Technology, Greater Noida Page 93
At Figure 10 we see the POINT 179 – 200 had been great fluctuation in the stock price and volume.In this point market make a tripple bottom pattern .But in the POINT 201 had been great flutuation in the stock price and volume.Market was open rise price and close rise price of stock. And these day stock price is only rise not fall. It means the beginning of BULLISH TREND.
One more interesting thing shown in the figure 10 is SPINNING TOP. It is almost same as the cross of indecision but in this case its both tails( i.e. day’s high and low) are not of equal length as in DOJI. And in this spinning top we can see that the stock closed at a price lower than its opening and at the same time days lowest is also noticeable. The difference between the day’s lowest price and closing is more than difference of the day’s opening and the highest price. This can also be regarded as continuance of Bearish trend.
But the market always has this tendency of correcting itself. So no matter how much you manipulate, sooner or later it will correct itself. That is why we saw fall in the prices after the point 91 in the figure 7.
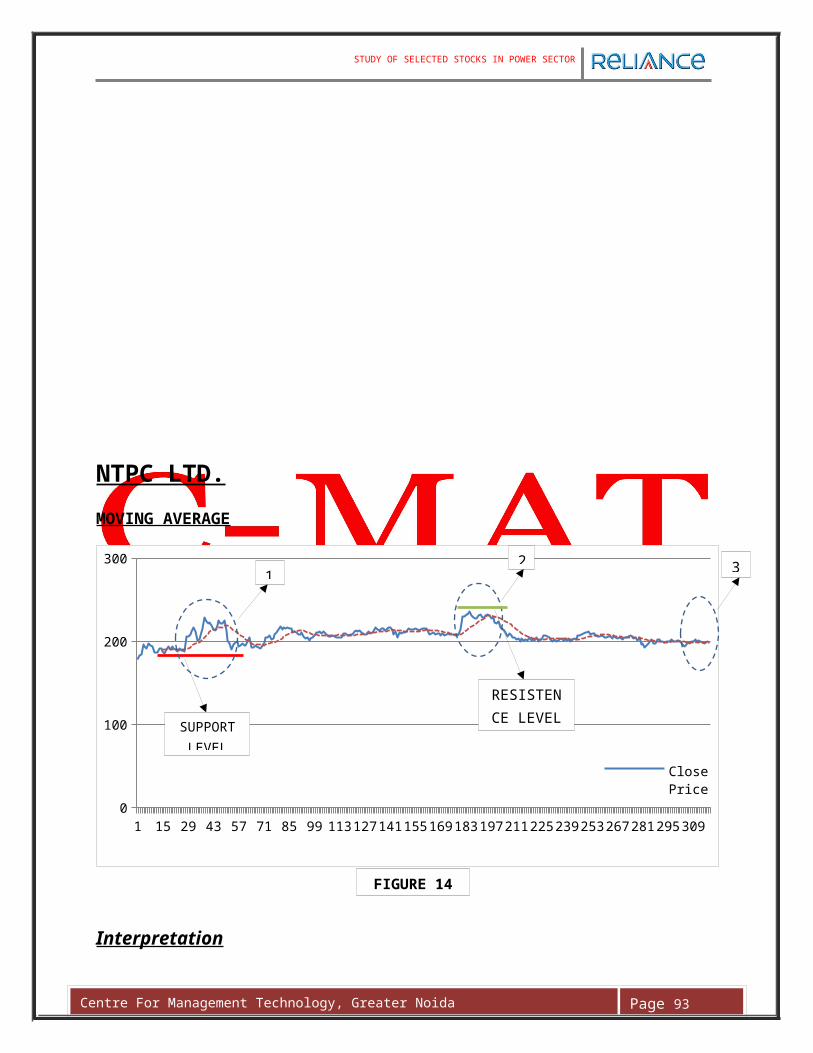
Centre For Management Technology, Greater Noida Page 93
MACD (Moving Average Convergence /Divergence Graph)
The MACD ("Moving Average Convergence/Divergence") is a trend following momentum indicator that shows the relationship between two moving averages of prices. The MACD was developed by Gerald Appel, publisher of Systems and Forecasts.
The MACD is the difference between a 26-day and 12-day exponential moving average. A 9-day exponential moving average, called the "signal" (or "trigger") line is plotted on top of the MACD to show buy/sell opportunities.
1 11 21 31 41 51 61 71 81 91 101 111 121 131 141 151 161 171 181
-1.5
-1
-0.5
0
0.5
1
1.5
2MACD
MACD
MACD is considered one of the most reliable tools for technical analysis of stock prices. It is also considered as one of the easiest charts to interpret and hence worldwide many technicians use this MACD charts to trade and advice their clients.
FIGURE 11
Centre For Management Technology, Greater Noida Page 93
Interpretation
POINT 1—When you will observe the point 1(Figure 11) closely you will find something known as MACD CROSSOVER. This section of graph is shown closely in figure 12.
The basic MACD trading rule is to sell when the MACD falls below its signal line. Similarly, a buy signal occurs when the MACD rises above its signal line. It is also popular to buy/sell when the MACD goes above/below zero. At point 100 you can see that crossover. Here the bars in the graph are crossing the signal line and entering into the lower half of the graph. This is the point where investors decide to sell the stocks in hand.
The MACD is also useful as an overbought/oversold indicator. When the shorter moving average pulls away dramatically from the longer moving average (i.e., the MACD rises), it is likely that the security price is overextending and will soon return to more realistic levels. MACD overbought and oversold conditions exist vary from security to security.
FIGURE 12
Centre For Management Technology, Greater Noida Page 93
POINT 2— This point has been highlighted because this will help us in understanding the future movement of this stock. If seen closely (figure 13) you will discover that the current trend is moving back to its signal line and if it continues to move like that again a crossover will take place.
This is also called the BEARISH DIVERGENCE because you will find that the MACD is making new lows while the prices fail to make new lows.
So as of now looking at this graph and all the other kinds of graph discussed above, we can predict to some extent that in near future the prices of this particular scrip (NHPC) will Stable. The simple reason can be that the investors will feel that this stock has been over buy but its not touch Resistence level. That is when the BEARS will take over the control of the market from the BULLS.
FIGURE 13
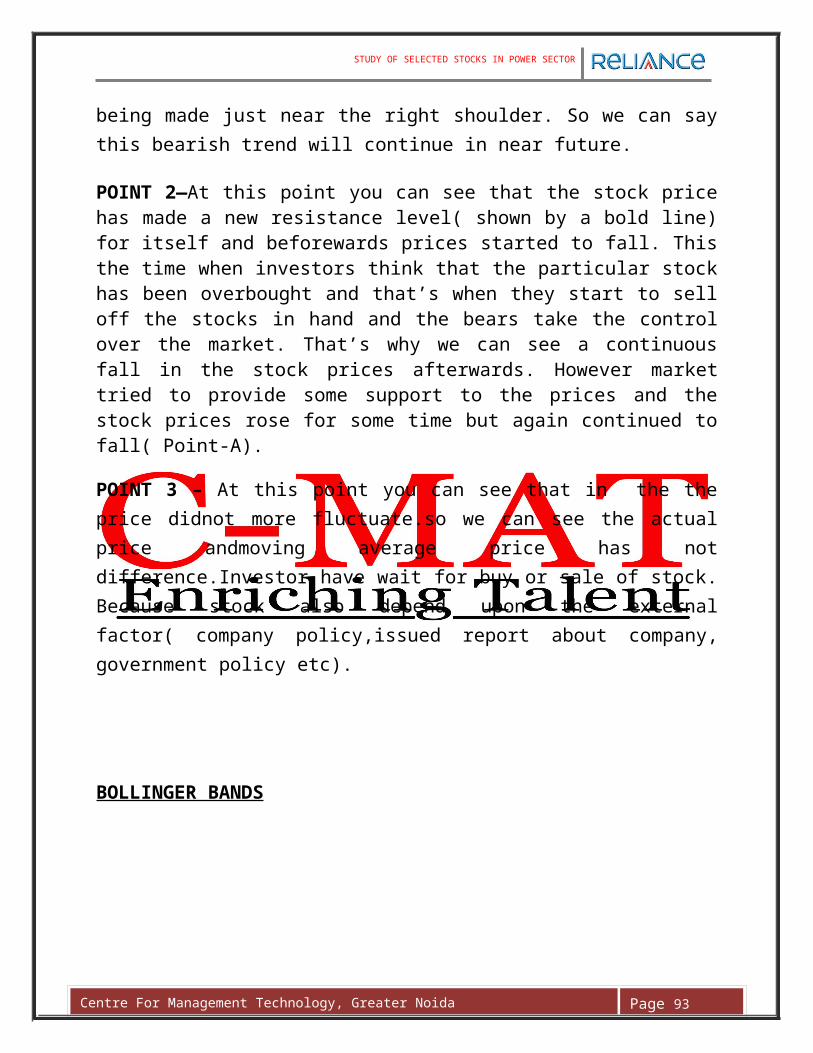
Centre For Management Technology, Greater Noida Page 93
POWER GRID
MOVING AVERAGE
1 14 27 40 53 66 79 92 105 118 131 144 157 170 183 196 209 222 235 248 261 274 287 300 3130
50
100
150
Last PriceMov avg(15 day)
RESISTENCE LEVEL
SUPPORT LEVEL
RESISTENCE LEVEL
Interpretation
POINT 1-In figure 14 we can see the stock price is get the new support line in point 1.After support level BULL takeover the market from BEAR. And start rise of the stock price.Because moving average level is above from last price of the stock.that the reason stock price is rise and make new rasistence level.it mean stock is oversold. Investors are start bought the Power grid stock.
POINT 2- In figure 14 point 2 stock price is start rise and make rasistence level.but we can see moving average level below the stock price level.it means stock pice any time will be fall.and some time start fall.But stock price and moving average equal then again start stock price rise and make new rasistence level.its means its a BULLISH TREAND.Investor are start selling Power grid stock.Stock price is start falling.BEAR is take over the BULLISH TREAND.This period is so risky there fore Investors are start selling the stock.
POINT 3- In frgure 14 point 3 we can see treand reversal pattern . This pattern is Head and Shoulder pattern and at the same time the moving average line was much below the closing price line which is also an indication that the stock prices of this particular scrip is going to fall.
FIGURE 14
1
2 3
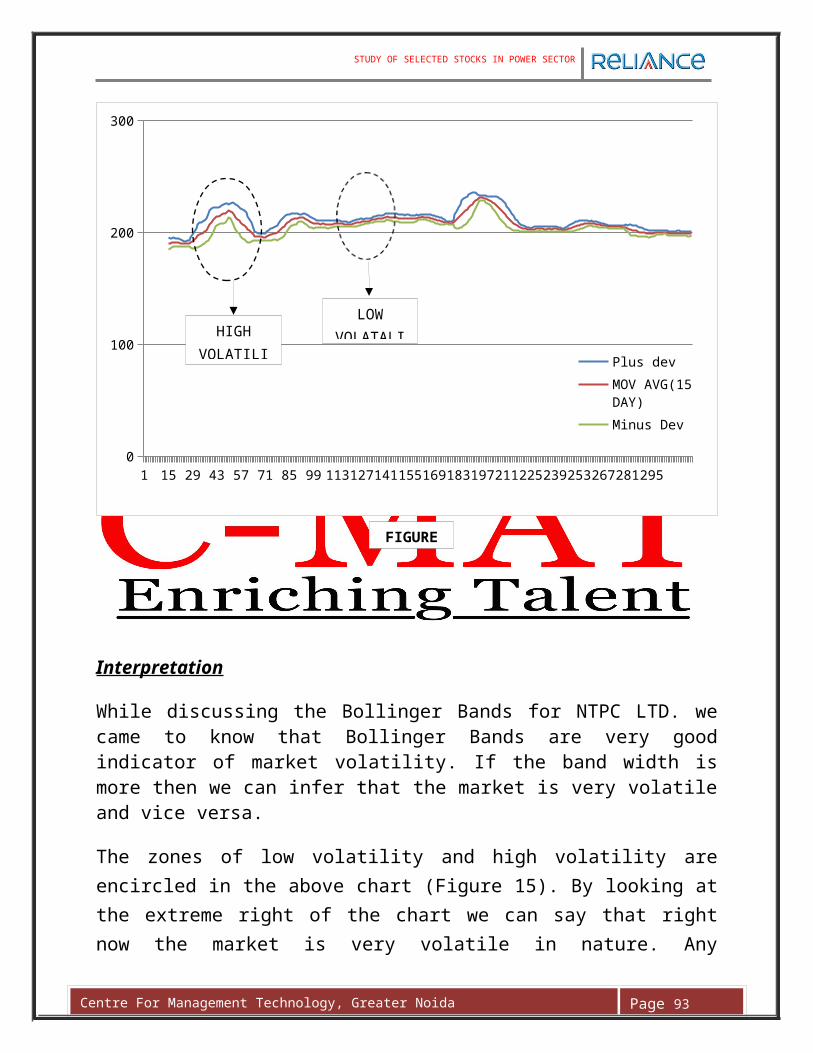
Centre For Management Technology, Greater Noida Page 93
BOLLINGER BANDS
1 14 27 40 53 66 79 92 1051181311441571701831962092222352482612742873000
50
100
150
PlusMov avg(15 day)MinusHIGH VOLATILITY
LOW VOLATILITY
Interpretation
While discussing the Bollinger Bands for POWER GRID we came to know that Bollinger Bands are very good indicator of market volatility. If the band width is more then we can infer that the market is very volatile and vice versa.
The zones of low volatility and high volatility are encircled in the above chart (Figure 16). By looking at the extreme right of the chart we can say that right now the market is very volatile in nature. Any investment made in near future will bear a little more risk than normal but at the same time investors can also expect good returns. As the rule says “high returns have high risk associated with them”.
FIGURE 15
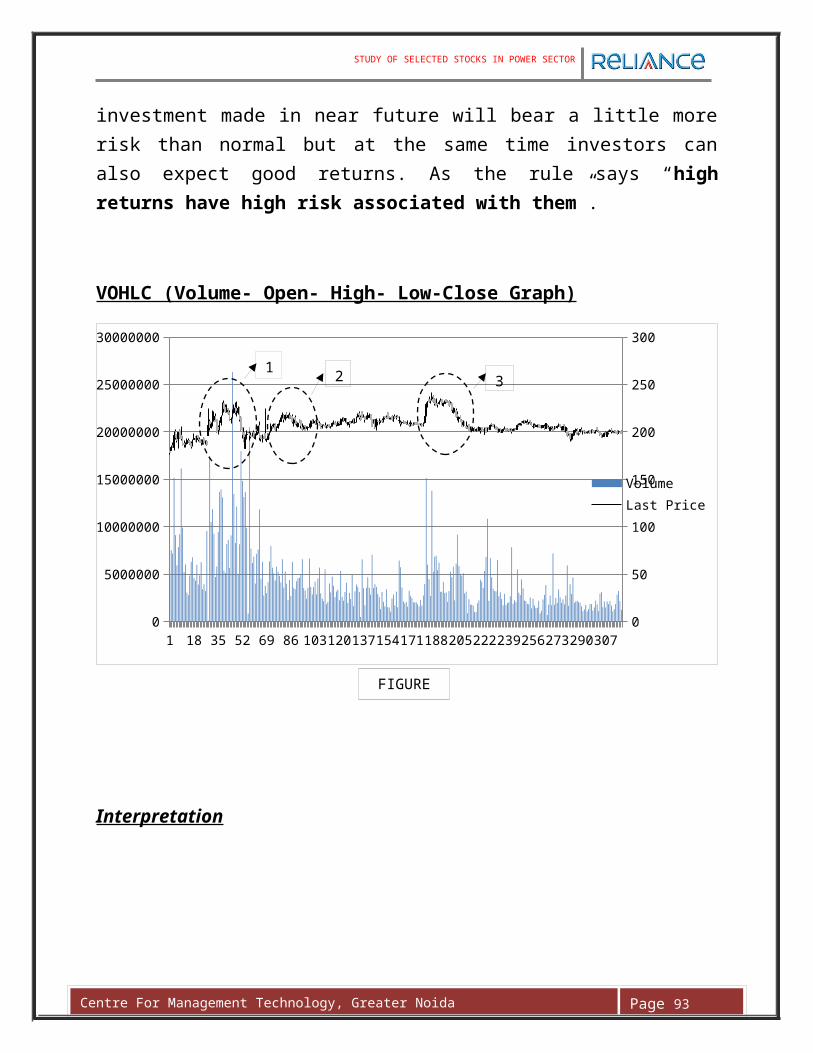
Centre For Management Technology, Greater Noida Page 93
VOHLC (Volume- Open- High- Low-Close Graph)
1 14 27 40 53 66 79 92 1051181311441571701831962092222352482612742873003130
5000000
10000000
15000000
20000000
25000000
0
20
40
60
80
100
120
140
Volume
Last Price
Interpretation
FIGURE 16
FIGURE 17
DOUBLE BOTTOM
1
2 3
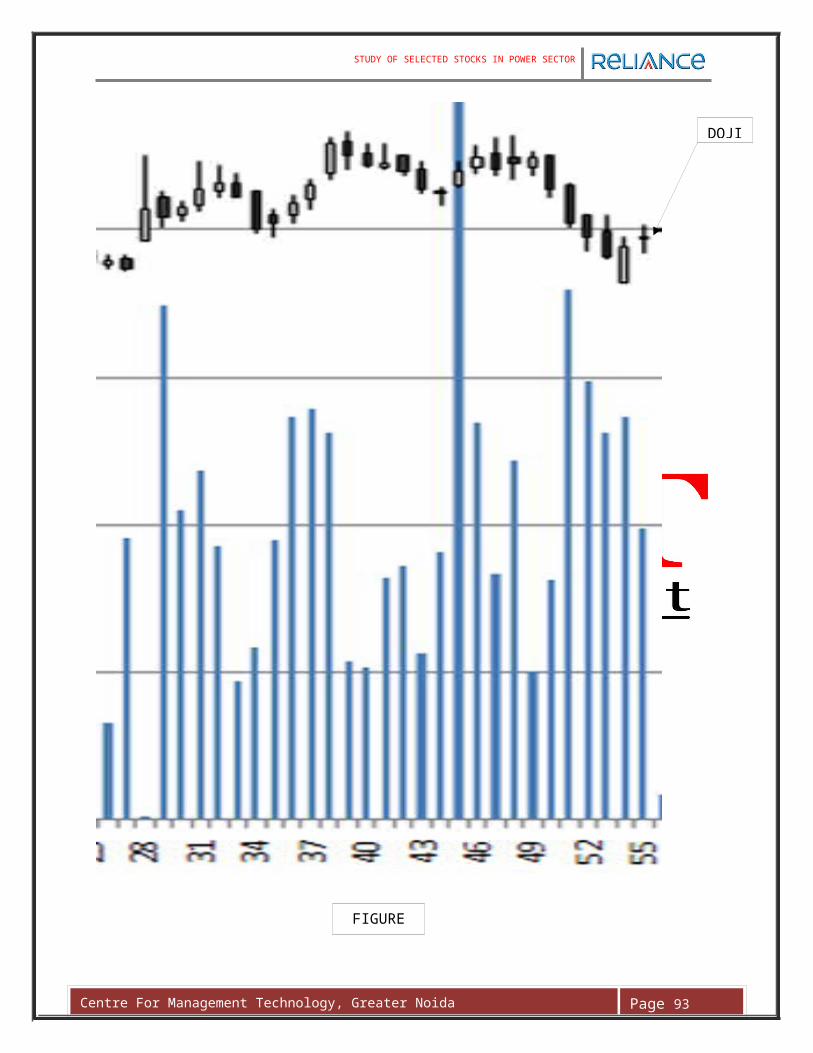
Centre For Management Technology, Greater Noida Page 93
POINT 1— If we will look at this section of VOHLC graph of POWER GRID you can discover trend reversal pattern. This pattern is known as DOUBLE BOTTOM.
Whenever this happens the market depicts a trend reversal. So at this point of time we can say the market may show a bullish trend for some time.
At the extreme right of the chart (Figure 17) you can see a long volume bar. That was the point where the bears wanted to give some pull to the market but very quickly the bulls regained the control over the market. And there after we a market continuously controlled by the bulls.In point 28 we can see stock price is `100.95.But point 29 we can see stock price is `117.05.we can the bulls take over the maket from bear , Investor are start to buy the stock for some time.
FIGURE 18
HEADSHOULDER
Centre For Management Technology, Greater Noida Page 93
POINT 2— If we will look at this section of VOHLC graph of SAIL you can discover another trend reversal pattern. This pattern is known as HEAD AND SHOULDER. It resembles with man with a head and two shoulders.
Whenever this happens the market depicts a trend reversal. So at this point of time we can say the market may show a bearish trend for some time.
At the extreme right of the chart (Figure 18) you can see a long volume bar. That was the point where the bulls wanted to give some thrust to the market but very quickly the bears regained the control over the market. And there after we a market continuously controlled by the bears.
However for how long this bearish trend will continue this cannot be predicted by this chart. For that we have to wait for any other trend reversal signal. That is the biggest drawback of technical analysis that it cannot predict the duration for which the trend may continue. Hence as of now the bearish market will continue until and unless we don’t see any other trend reversal signal.
Next we will discuss the MACD graph for SAIL. As we know MACD is one of the easiest graphs to interpret and generally it used to identify the buy and sell signals for any particular stock.
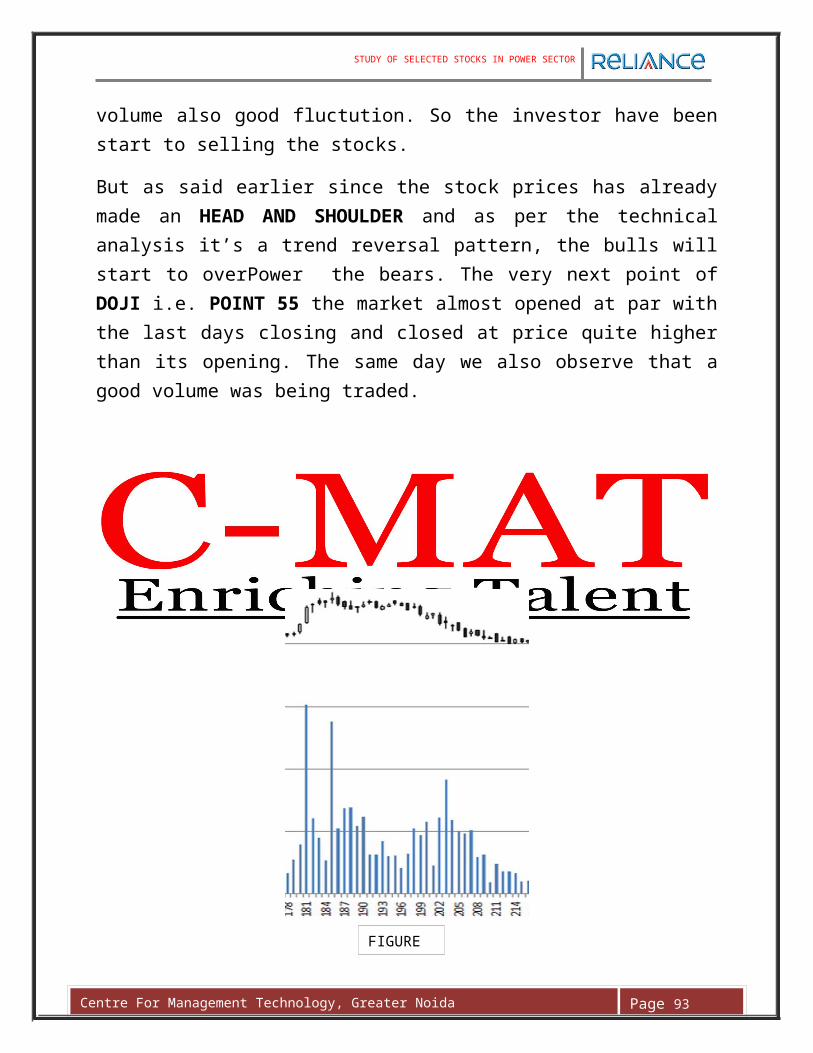
Centre For Management Technology, Greater Noida Page 93
POINT 3- WE can see the point 3 POWER GRID stock have get the another treand reversal pattern. This treand reversal is known as TRIPPLE BOTTOM.We can see this market is beraish treand,but bulls try to thrust the stock price. Bears are try tripple time pull the stock price.But bullish market are to take over the stock price from bearish.The chart are shown stock are oversold. Bull are thrust the stock price and investor are take a interest to buy stock. Stock price start to rise. Power grid Stock are give the good responce for investor .
TRIPPLE BOTTOM
FIGURE 19
Centre For Management Technology, Greater Noida Page 93
MACD (Moving Average Convergence /Divergence Graph)
1 16 31 46 61 76 91 106121136151166181196211226241256271286
-8
-6
-4
-2
0
2
4
6
8
10
12
MACD
MACD
Interpretation
We have already discussed what to interpret for MACD charts, so we will not devote much time on discussing this. Whenever the MACD bars are above the signal line then it’s a buy signal for investors and vice versa.
So as of now looking at this graph and all the other kinds of graph discussed above, we can predict to some extent that in near future the prices of this particular scrip (POWER GRID) will rise. The simple reason can be that the investors see the lots of fluctution in stock price and volume.Stock price was rise then fall.according to chart we can find stock price is rise or stable. This stock has been oversold and reached its new support level. That is when the BULLs will take over the control of the market from the bears.
FIGURE 20
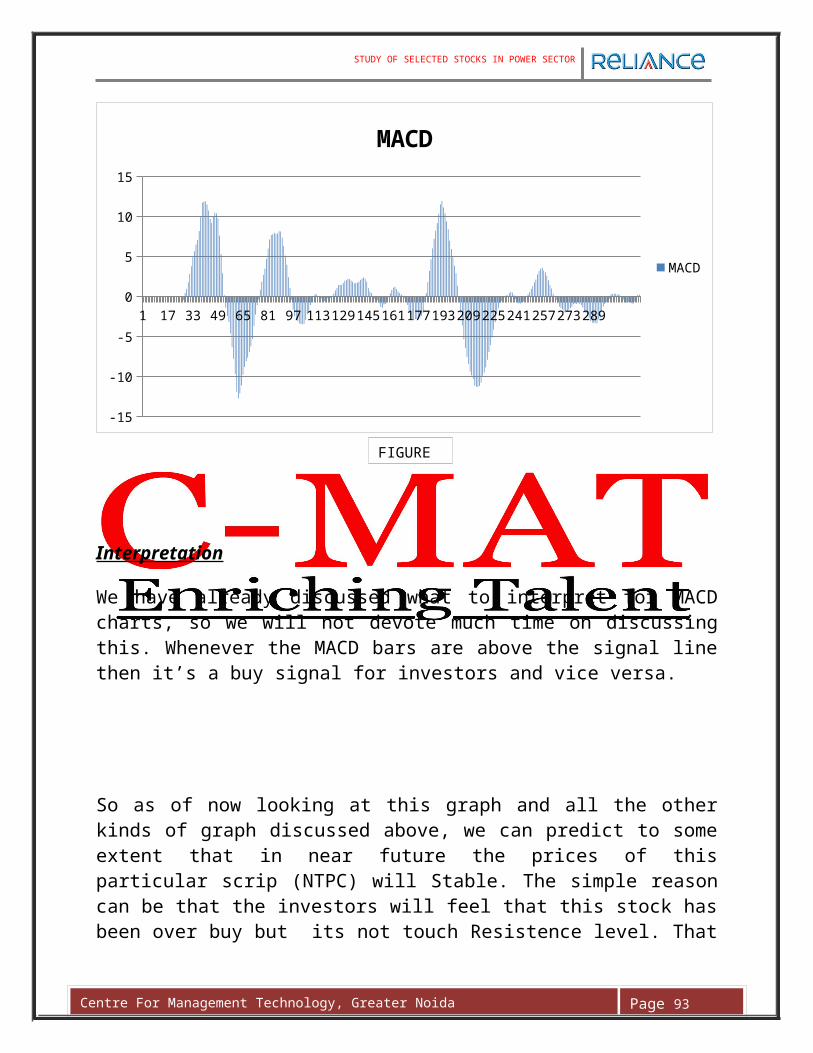
Centre For Management Technology, Greater Noida Page 93
TATA POWER
MOVING AVERAGE
1 13 25 37 49 61 73 85 97 1091211331451571691811932052172292412532652772893013130
400
800
1200
1600
Close PriceMov avg 15 day
FIGURE 21
1
SUPPORT LEVEL
23
RESISTENCE LEVEL
4
5
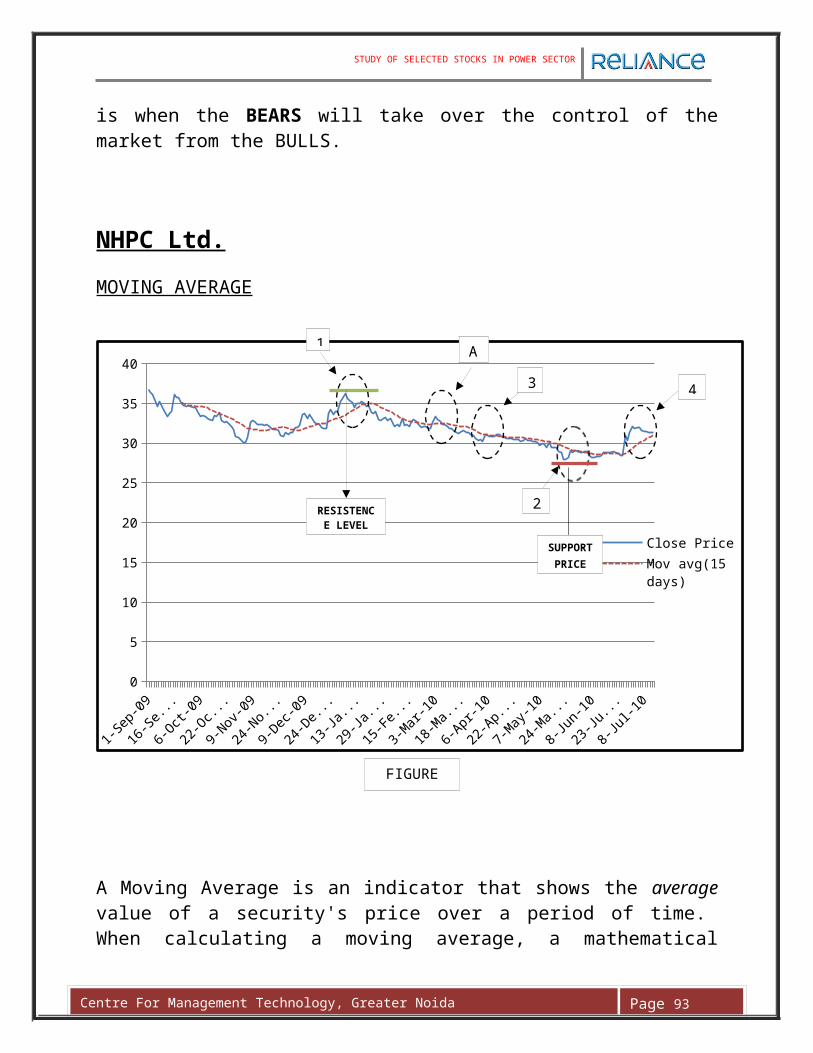
Centre For Management Technology, Greater Noida Page 93
Interpretation
While looking at the above chart (Figure 22) we will discuss two things:-
a) Fibonacci Retracement**.b) Head and Shoulders pattern.
POINT 1— While discussing point 1 in figure 21 we will try understand why stock prices move in a zig zag path. Elliott Wave Theory## interprets market actions in terms of recurrent price structures obedient to the Fibonacci sequence. The key difference between the Elliott Wave Principle and other cyclical theories is that this theory suggests no absolute time requirements for a cycle to complete. In figure 22 we can clearly see that when a stock price starts to rise it goes to a particular price and then retraces to some extent then again catches its breath and then again start to rise. The same phenomenon is also applicable for a downtrend.
Now the question arises, how we can differentiate between a retracement and a trend reversal. To understand this we need to learn more about Fibonacci Retracement.
FIGURE 22
HEAD
SHOULDER
**:- Fibonacci Retracement is explained in appendices.##:- Read more about Elliot wave theory in appendices.
Centre For Management Technology, Greater Noida Page 93
In figure 22 we can see a Head and Shoulder pattern and we have already discussed that it is a trend reversal signal for the investors. And if we will look at the figure 21 we can also observe that after this pattern the TATA POWER stocks were in a downtrend.
By looking at the figure 22 you can clearly see the head and shoulder pattern. We can also observe that in figure 21 the moving average was well below the closing price line. As we know the closing price will always try to coincide with the moving average line so we can see the after the head the price of TATA POWER fell steeply. So as of now we can say that this particular stock will continue to show a bearish trend for some time because if observed closely we can see double top being made just near the right shoulder. So we can say this bearish trend will continue in near future.
PONIT 2- We can see the figure 21 the moving average was below the closing stock price line. Investors are overbought the Power grid stock.Closing Price are shown the bullish market but stock price was fall sharply.we can observe the figure 21 market was make the new rasistence level, but stock price is top from the moving average.its mean we can see the chart any time stock price will be fall. Investor can start sale the TATA POWER stock. Market was to risky.Bears are start to take over the maket from bulls.
POINT 3,4,and 5-We can the Figure 21 ,point 3 BULLS thrust the stock price.Stock price are make a new rasistence level.After the stock price make new rasistence level,stock price was start fallling.the stock price and moving average was running equely.And again BULL thrust the stock and Stock price make new rasistence level with DOUBLE TOP pattern.
We can see the figure 21 stock price with trend reversal pattern.Stock price is start falling sharply. Bearish trend is start and take over the market from bulls.Market was make new support level in point 4 and 5.After the point 5 bulls are thrust the stock price .And Stock price was start rise and bull are take over the market.Investor can start invest the money for buying TATA POWER STOCK.
Centre For Management Technology, Greater Noida Page 93
BOLLINGER BANDS
1 14 27 40 53 66 79 92 1051181311441571701831962092222352482612742873000
400
800
1200
1600
Plus
Mov avg 15 day
Minus
Interpretation
While discussing the Bollinger Bands for TATA POWER we came to know that Bollinger Bands are very good indicator of market volatility. If the band width is more then we can infer that the market is very volatile and vice versa.
The zones of low volatility and high volatility are encircled in the above chart (Figure 23). By looking at the extreme right of the chart we can say that right now the market is very volatile in nature. Any investment made in near future will bear a little more risk than normal but at the same time investors can also expect good returns. As the rule says “high returns have high risk associated with them”.
HIGH VOLATILITY
LOW VOLATILITY
FIGURE 23
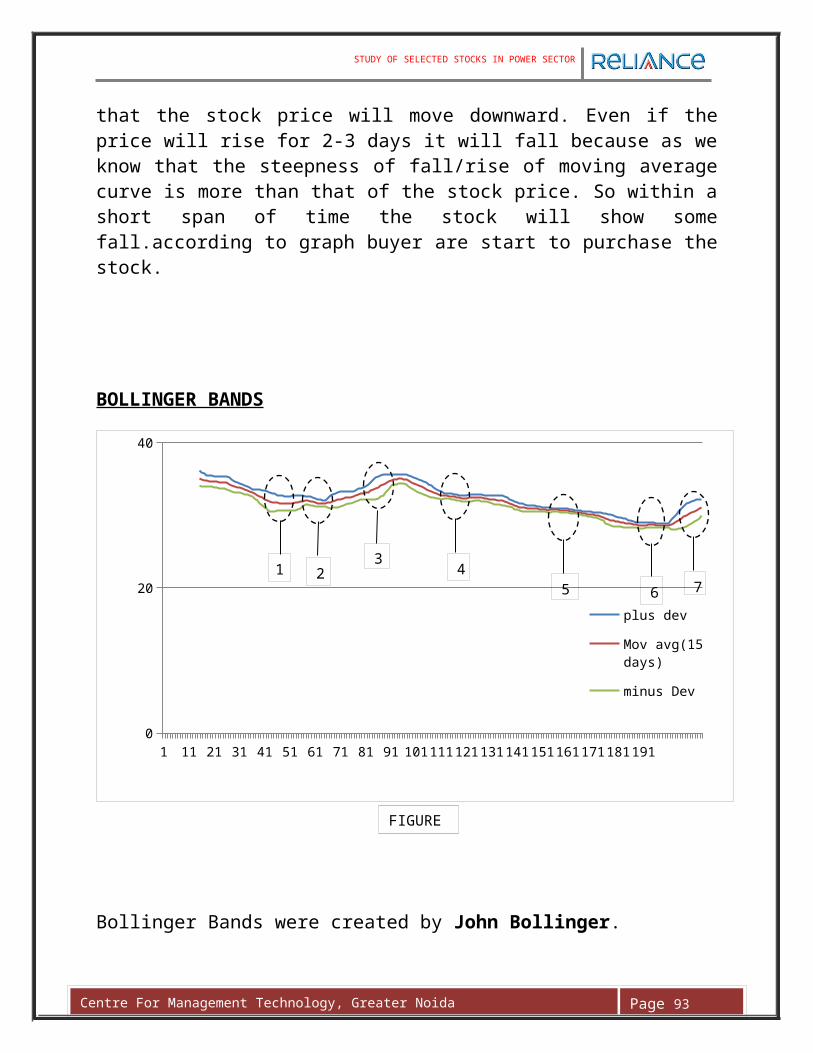
Centre For Management Technology, Greater Noida Page 93
VOHLC (Volume- Open- High- Low-Close Graph)
1 15 29 43 57 71 85 99 1131271411551691831972112252392532672812953090
200000
400000
600000
800000
1000000
1200000
1400000
1600000
1800000
0
200
400
600
800
1000
1200
1400
1600
Volume
Last Price
Rising wedge
DOUBLE TOP
1
2 3
FIGURE 24
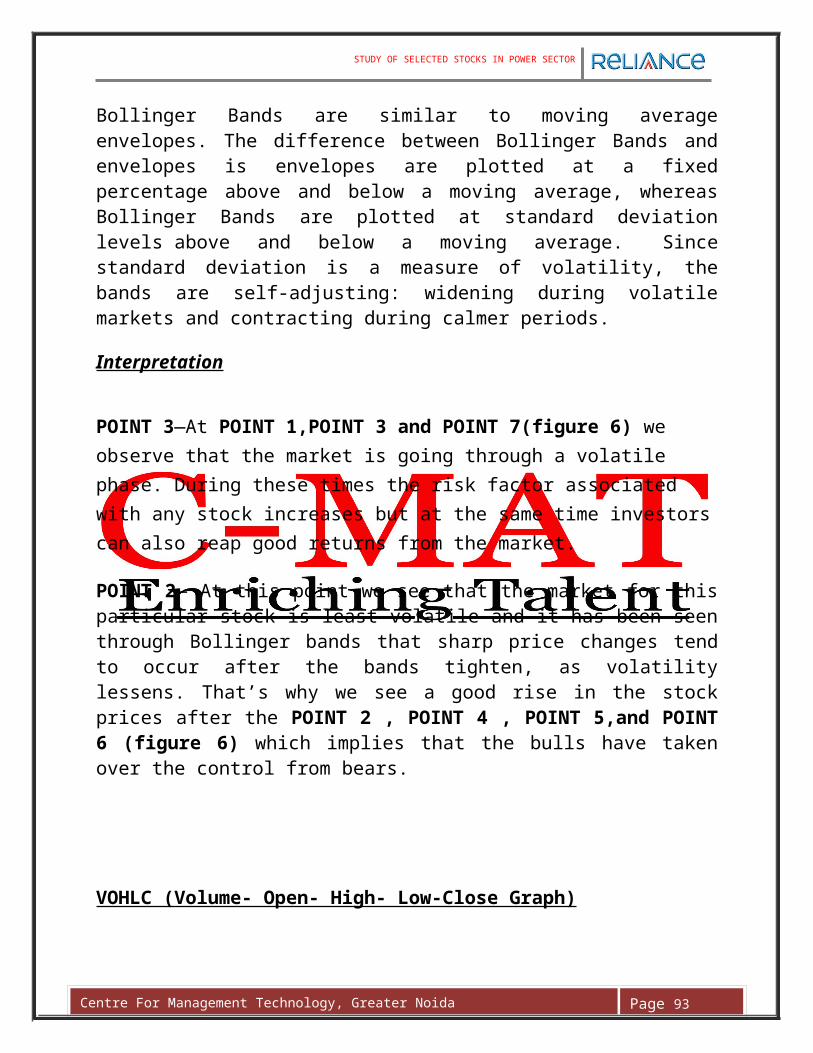
Centre For Management Technology, Greater Noida Page 93
Interpretation
POINT 1- If we will look at this section of VOHLC graph of TATA POWER you can discover trend reversal pattern. This pattern is known as DOUBLE TOP .
Whenever this happens the market depicts a trend reversal. So at this point of time we can say the market may show a bearish trend for some time. We can see the after the pattern stock price start falling.its means TATA POWER stock was over bought,and investor was start selling the stock.Bear was takeover the market for sometimes .But BULLs was again thrust the market, stock price was start rise.
FIGURE 25
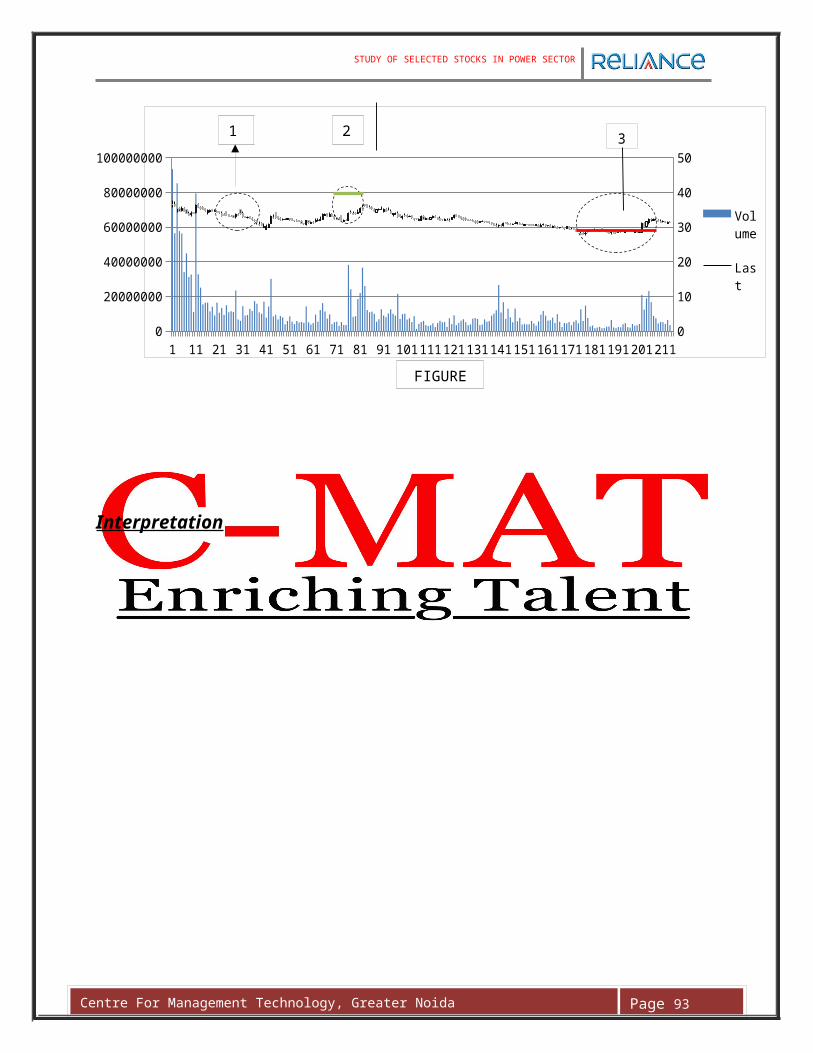
Centre For Management Technology, Greater Noida Page 93
POINT 2- If we will look at this section of VOHLC graph of TATA POWER you can discover another trend reversal pattern. This pattern is known as RISING WEDGE. The wedges trend to form over longer periods, usually between three and six months.
We can see the point 2 there were bearish market,but Bullish are try to thrust the market.its means market was trying to rise,but bear was pull the market.This type of market is called bearish trend.its means market are move upward any time. Stock was oversold,that the reason investor are bought the stock of TATA POWER .Bullish market are takeover the bearish market,and market start rising.The stock price was made new rasistence level.
DOJI
FIGURE 26
RISING WEDGE
Centre For Management Technology, Greater Noida Page 93
POINT 3-We can observe the point no 3 in figure 27 ,this graph look like a point 2. It means we can see another same trend reversal pattern. This pattern is also a rising wedge pattern.We are already about the graph before.
We can predict about stock price,stock price will be rise.Because we are already seen the after rising wedge pattern,and stock price was rising.
So the Investor are start buy the TATA POWER stock,Because this stock is give great return. And we can see the volume fluctution is also great.BULL are start thrust the stock price,And Bearish market are convert into Bullish market.
FIGURE 27
RISING WEDGE

Centre For Management Technology, Greater Noida Page 93
MACD (Moving Average Convergence /Divergence Graph)
1 15 29 43 57 71 85 99 113 127 141 155 169 183 197 211 225 239 253 267 281
-100
-50
0
50
100
150
MACD
MACD
Interpretation
We have already discussed what to interpret for MACD charts, so we will not devote much time on discussing this. Whenever the MACD bars are above the signal line then it’s a buy signal for investors and vice versa.
We can easly interpret the chart ant conclusion ,Investor can invest the money in TATA POWER stock and make profit.
FIGURE 28
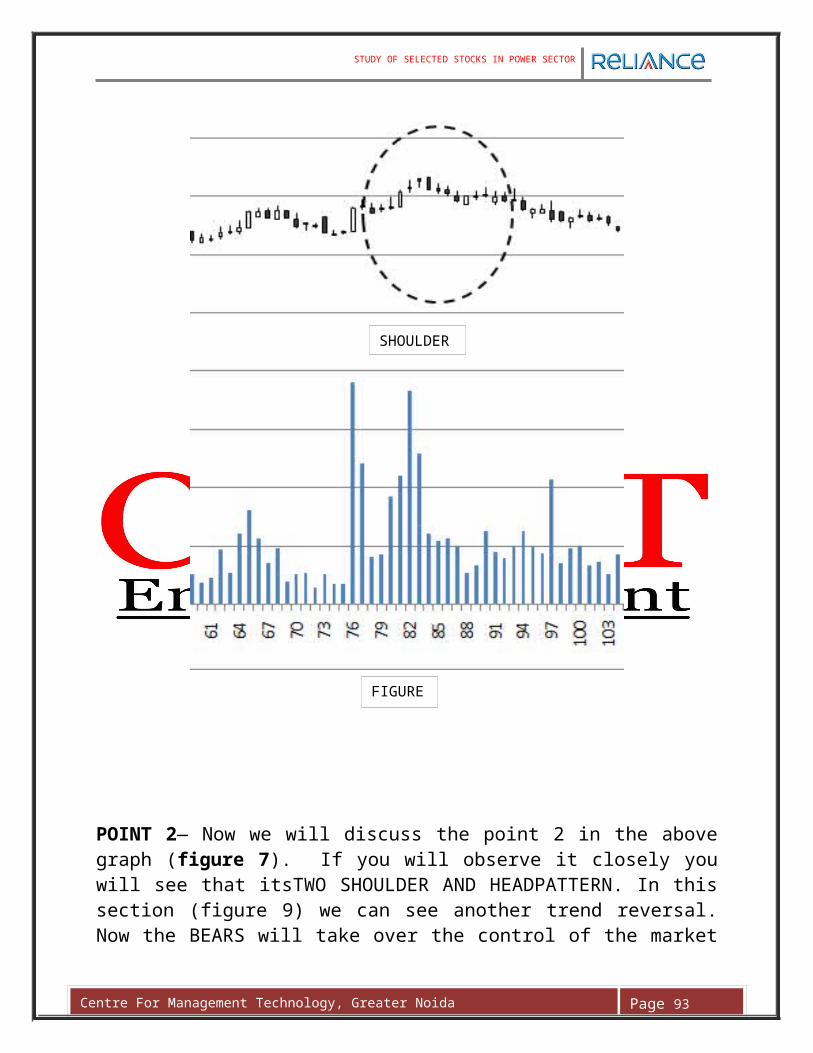
Centre For Management Technology, Greater Noida Page 93
RELIANCE POWER
MOVING AVERAGE
1 13 25 37 49 61 73 85 97 1091211331451571691811932052172292412532652772893013130
50
100
150
200
250
Last PriceMov avg
Interpretation
POINT 1- At this point you can see that the stock price has made a new resistance level( shown by a bold line) for itself and afterwards prices started to fall. This the time when investors think that the particular stock has been overbought and that’s when they start to sell off the stocks in hand and the bears take the control over the market. That’s why we can see a continuous fall in the stock prices afterwards.BULLs were tried to thrust stock price And stock rise for some time then start fall. However market tried to provide some support to the prices and the stock prices rise for some time but again continued to fall. There was bullish market but some times market was controled by bearish. And made a new support level (Point A).
Now the question is why this happened. I will try to answer it while discussing VOHLC (Volume Open High Low Close) graph.
FIGURE 29
RESISTENCE LEVEL
SUPPORT LEVEL
1
2A

Centre For Management Technology, Greater Noida Page 93
POINT 2—At this point as you can see that the stock price has fallen to good extent in respect of its moving average (DASHED LINE). But the steepness in the fall/rise of the moving average will always be less than the actual price movement. At this point we also see that the stock price has made a “DOUBLE BOTTOM” which is also considered as a signal for trend reversal and you can also see after that the Bulls took the control of the market.
At this point the stock price tested the support level twice (shown by a bold line) and the investors felt that the particular stock has been oversold and the price will not fall anymore. That is why the bears entered the market and supported the price and hence the stock prices started to rise.Bearish are try to pull the market but bull have a control over the market. Stock price start rising,Investor are start buyiny the particular stock(RPOWER ).
BOLLINGER BANDS
1 14 27 40 53 66 79 92 105 118 131 144 157 170 183 196 209 222 235 248 261 274 287 3000
50
100
150
200
250
Plus
Mov avg
Minus
Interpretation
We are all ready discuss about bollinger band.According tochart High volatile means high risk high return , And Low volatile low risk low return.
HIGH VOLATILITY
LOW VOLATILITY
FIGURE 30
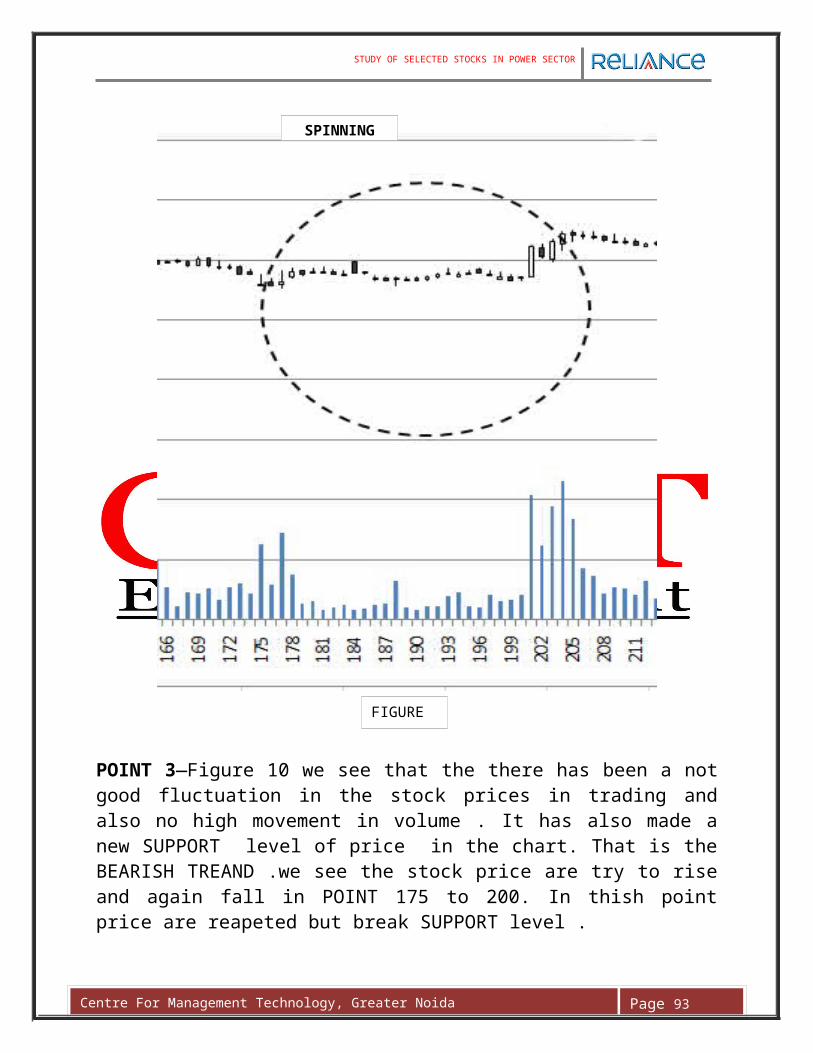
Centre For Management Technology, Greater Noida Page 93
VOHLC (Volume- Open- High- Low-Close Graph)
1 15 29 43 57 71 85 99 113 127 141 155 169 183 197 211 225 239 253 267 281 295 3090
5000000
10000000
15000000
20000000
25000000
30000000
35000000
0
50
100
150
200
250
Volume
Last Price
Interpretation
1
23
FIGURE 31
Centre For Management Technology, Greater Noida Page 93
DOJI
RESISTENCE 1
RESISTENCE 2
RESISTENCE 3
SUPPORT 1
SUPPORT 2
SUPPORT 3
HEAD
SHOULDER
FIGURE 32

Centre For Management Technology, Greater Noida Page 93
POINT 1—This section of the above chart (Figure 31) depicts a bullish trend in the market. We will try to analyze what was happening in the market at that point of time. In the figure 32 we can clearly see a cross of indecision or DOJI (already discussed) in the extreme left of the chart (Encircled). You can see after that the bulls took control of the market and started to push capital in that stock and hence you can see some long volume bars.
This uptrend in the market created a new support level (SUPPORT 1) for this scrip. Bulls gave enough thrust to the market reached to a new peak (RESISTANCE 1) and then the first retracement occurred. After the first retracement the price of RELIANCE POWER again started to move upwards and a new resistance and support level was created (RESISTANCE 2 AND SUPPORT 2). Whenever a BREAKOUT** happens then the last resistance level becomes the new support for that particular scrip (SUPPORT 3). However in this case it didn’t happen and at the time of retracement the price came below the expected support level and touched previous support that is SUPPORT 2.
It again bounced back and the bulls again supported the uptrend with enough trade volume and another breakout took place which created a new resistance (RESISTANCE 3). So this how the retracement takes place in stock market. The basic reason for the zigzag path of the stock prices is attributed to this retracement theory.
In this figure( Figure 31) we can also see a Head and Shoulder pattern and we have already discussed that it is a trend reversal pattern. So after looking at this head and shoulder pattern we can say that Jindal stocks are going to see some bearish trend in near future. If you will refer back to the Figure 31 you will find exactly a bearish trend after this Head and shoulder pattern.
So till now we have seen all the stocks are currently showing a BEARISH TREND** and they might just continue with this trend as there are no trend reversal signals in the chart after this Head and Shoulder pattern. But these stocks will bounce back of 16th JUN 2009. If you will look at the graph exactly at that point of time the stock prices of RELIANCE POWER started to fall sharply (Just after the Head and Shoulders)
**:- Breakout-A chart pattern used to indicate a rise in a stock's price above its resistance level (such as its previous high price) or a drop below its support level (commonly the last lowest price).
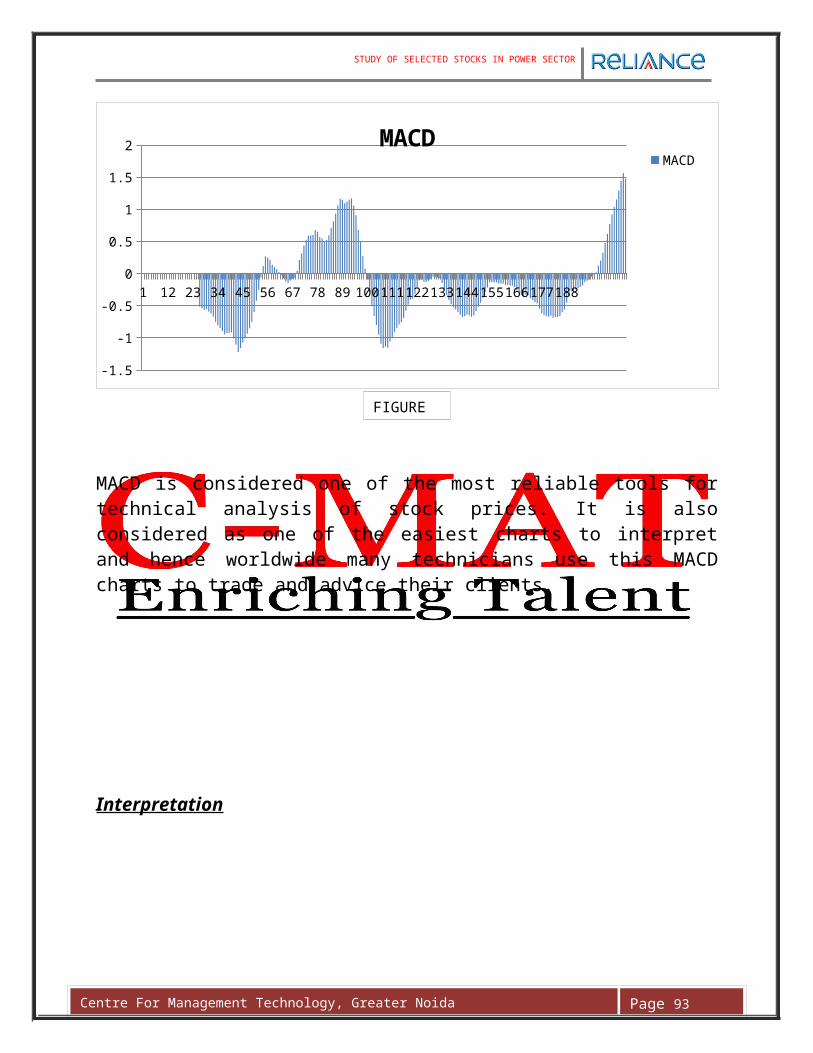
Centre For Management Technology, Greater Noida Page 93
POINT 2—In the figure below we can identify another important pattern which is regularly seen while doing the technical analysis. This pattern is called FLAG in the language of technical analysts. The patterns are generally thought to last from one to three weeks.
These two short-term chart patterns are continuation patterns that are formed when there is a sharp price movement followed by a generally sideways price movement. This short-term chart pattern is continuation pattern that is formed when there is a sharp price movement followed by a generally sideways price movement.
By looking at the Figure 33 we can draw an inference that after this pattern the stock will be bullish in nature that is its price will rise in near future. Why we say that its price will increase because the current trend is BULLISH. So when the trend will continue the price of this particular will rise and if you will refer back to original chart (Figure 31) we can see that the prices have actually rose after this Pattern. In fact after this pattern the market really shoots up and the prices went up tremendously.
FIGURE 33
FLAG
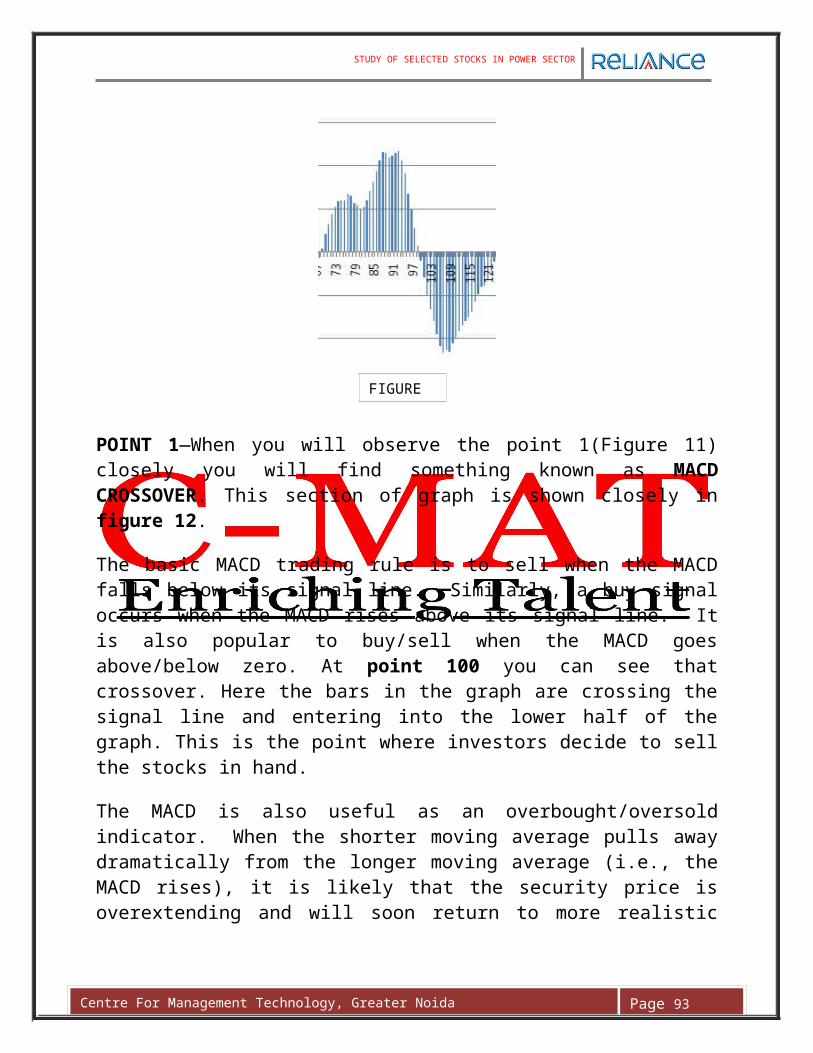
Centre For Management Technology, Greater Noida Page 93
POINT 3-We are allready discuss about this type of pattern.We can predict the stock of RELIANCE POWER will rise .Investor are uying and seling the stock regurally.The stock volume fluctution is great.This pattern are show the BULLISH TREAND.
FLAG
FIGURE 34

Centre For Management Technology, Greater Noida Page 93
MACD (Moving Average Convergence/Divergence Graph)
1 14 27 40 53 66 79 92 105118131144157170183196209222235248261274287
-15
-10
-5
0
5
10
15
20
25
MACD
MACD
Interpretation
We have already discussed what to interpret for MACD charts, so we will not devote much time on discussing this. Whenever the MACD bars are above the signal line then it’s a buy signal for investors and vice versa.
FIGURE 34
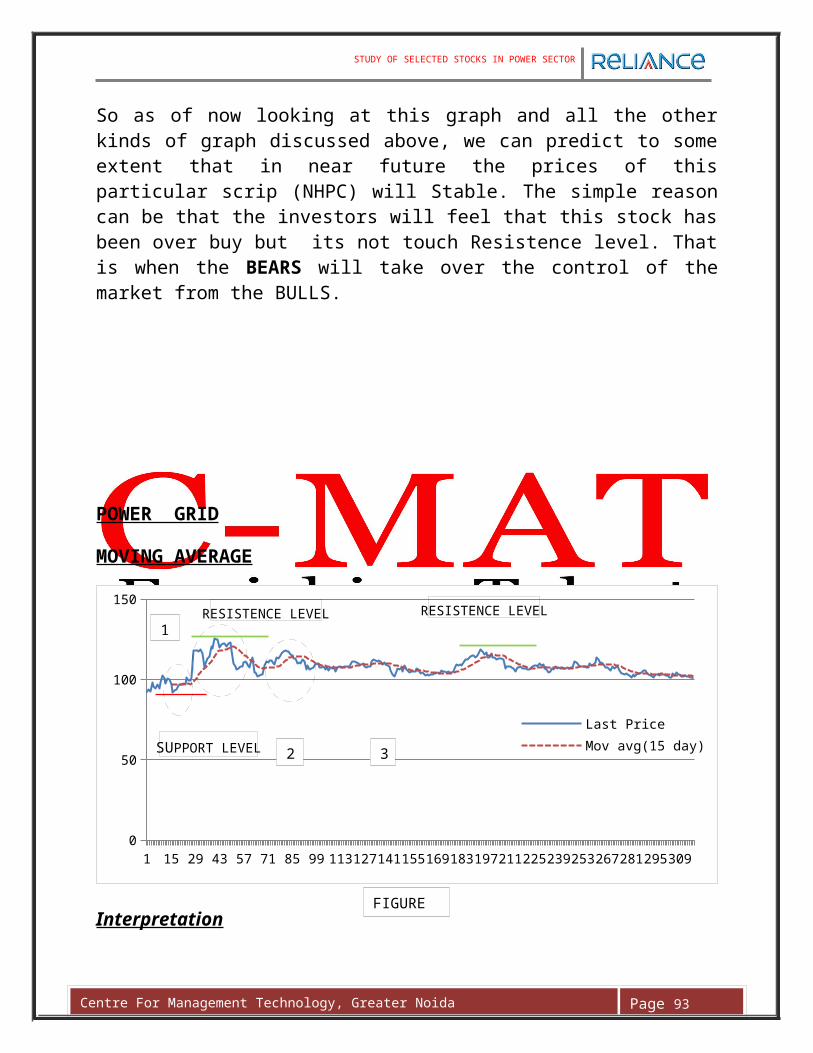
Centre For Management Technology, Greater Noida Page 93
RETRACEMENT IN STOCK PRICES
There is another way by which we can get a fair idea in which direction these Iron and Steel sector stocks are moving. If we can apply Fibonacci Retracement theory here then also we can discover whether after the crash of January 2008 the stocks of Iron and Steel sector has shown any trend reversal signal or not.
But to do this we have know what is the lowest price at which the stock has been traded after the crash and what was the highest price at which the stock has been traded after the lowest traded price.
What I mean to say here is, if after the crash the lowest price at which the stock got traded was `20 and after this stock price (` 20) if it went up to a highest traded price of ` 30 then we can say that this stock has retraced up to 50%. To analyze this we have to look into the prices before and after 31 st of March. On the basis of data collected from www.nseindia.com I have tried to find out what is magnitude of retracement all the 5 stocks ( Large Cap) has shown.
NTPC LTD.
In case of NTPC we will try to see the last retracement it has shown over last few weeks of trading. For that we will take whe the price were lowest in last weeks of its trading and when price were at peak.
Lowest Closing Price: `196 (25th June 2010)
Highest closing price: `235.65 (2nd July 2010)
Lowest Closing Price: `198.2 ( 9th July 2010)
Retracement: 65.89%.
It is not good retrachment .We can not say in few day the NTPC stock price will be rise in future.
Centre For Management Technology, Greater Noida Page 93
NHPC
In case of NHPC we will try to see the last retracement it has shown over last few weeks of trading. For that we will take whe the price were lowest in last weeks of its trading and when price were at peak.
Lowest Closing Price: `28.25 (23th June 2010)
Highest closing price: `32.15 (30th June 2010)
Lowest Closing Price: `31.3 ( 9th July 2010)
Retracement: 21.79%.
It is normal retrachment .We can say in few day the NHPC stock price will be rise in future.
POWER GRID
In case of POWER GRID we will try to see the last retracement it has shown over last few weeks of trading. For that we will take whe the price were lowest in last weeks of its trading and when price were at peak.
Lowest Closing Price: `102.05 (25th June 2010)
Highest closing price: `106.15 (4nd July 2010)
Lowest Closing Price: `102.8 ( 9th July 2010)
Retracement: 54.49%.
It is not good retrachment .We can not say in few day the POWER GRID stock price will be rise in future.
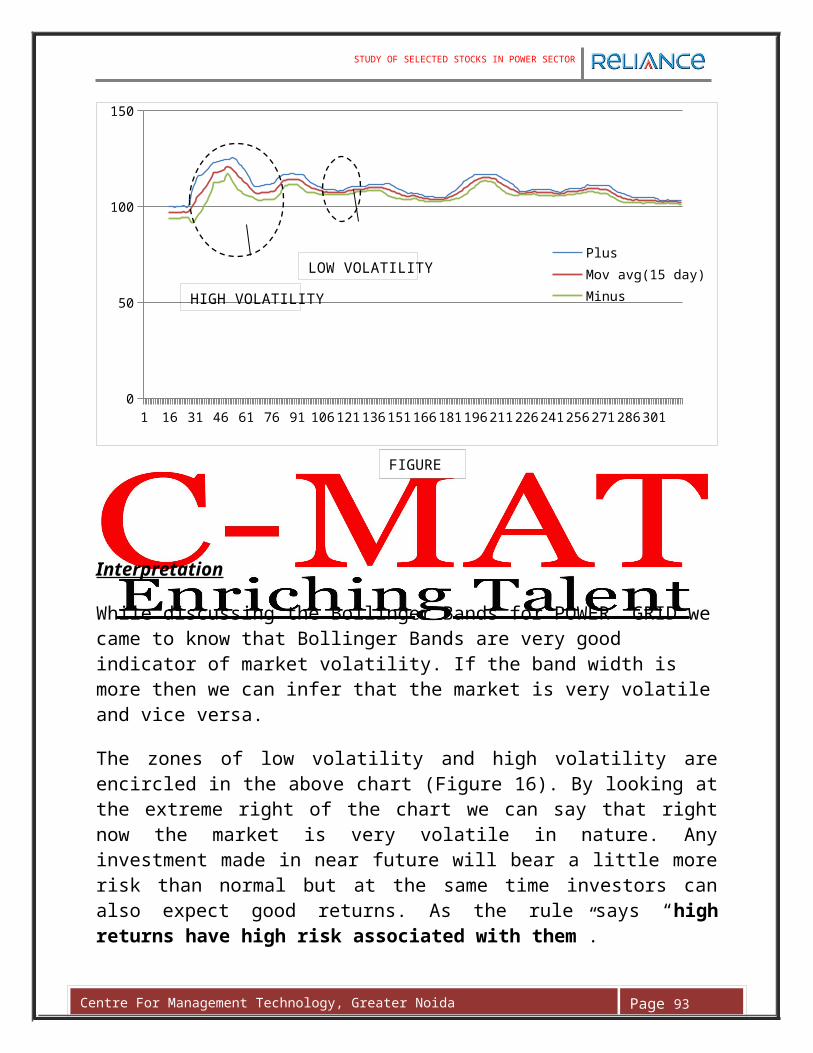
Centre For Management Technology, Greater Noida Page 93
TATA POWER
In case of TATA POWER we will try to see the last retracement it has shown over last few weeks of trading. For that we will take whe the price were lowest in last weeks of its trading and when price were at peak.
Lowest Closing Price: ` 1190 (25th June 2010)
Highest closing price: ` 1360 (25th June 2010)
Lowest Closing Price: ` 1283 (25th June 2010)
Retracement: 45.29%.
It is not good retrachment .We can not say in few day the TATA POWER stock price will be rise in future.
RELIANCE POWER
In case of RELIANCE POWER we will try to see the last retracement it has shown over last few weeks of trading. For that we will take whe the price were lowest in last weeks of its trading and when price were at peak.
Lowest Closing Price: ` 133 (21th May 2010)
Highest closing price: ` 181.7 (18th June 2010)
Lowest Closing Price: ` 166.25 ( 25th June 2010)
Retracement: 31.72%.
It is ormal retrachment .We can say in few day the RELIANCE POWER stock price will be rise in future and make profit for investor .
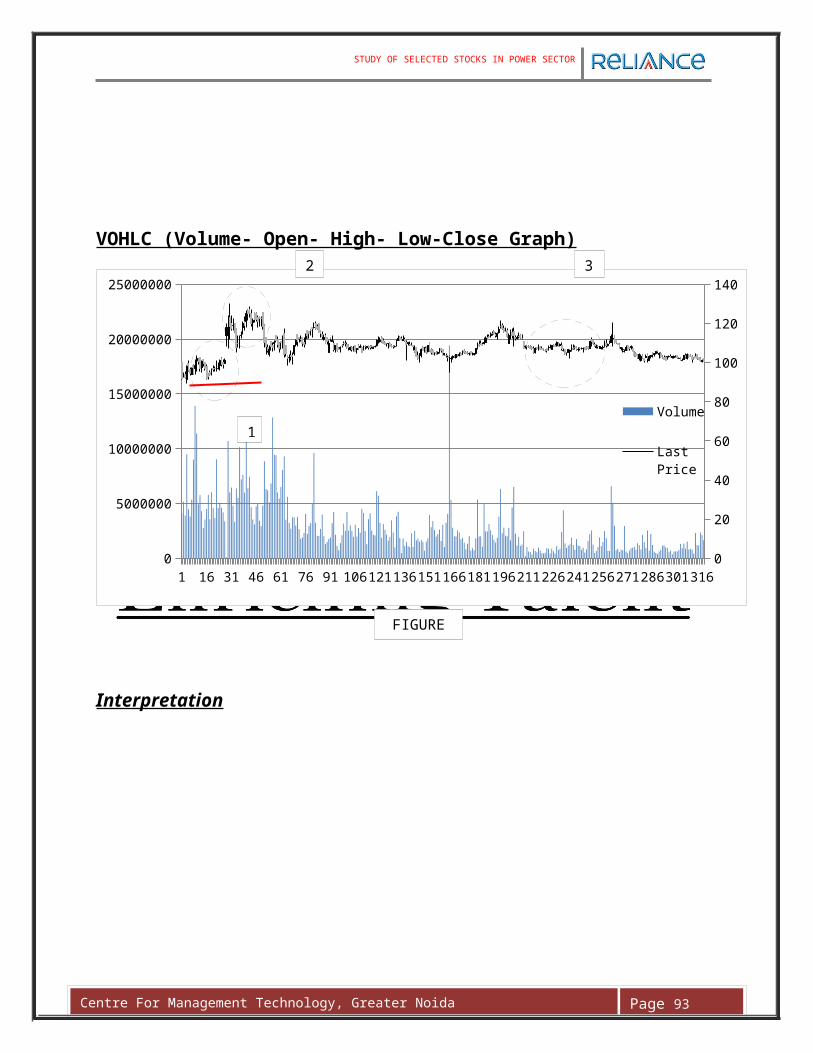
Centre For Management Technology, Greater Noida Page 93
Study of business cycle to analyze market trends
Both technical analysts and fundamental analysts believe that “business cycle is at the heart of analyzing market trends”. Because, economies do not grow in a steady, linear direction; "there are periods of expansion and contraction which tend to occur at regular intervals." To stock market investors, their advice is to focus on "readily identifiable long-term `themes' that are likely to affect economic growth and which are known as secular trends."
Though the stock market does not move exactly in step with the economy, there is a simple link between the two. "The most consistent long-term driver of stock values is corporate earnings and the main determinant of these earnings is the business cycle”. Rather than lock step with the economy, the stock market "tends to look ahead and discount underlying changes in the economy so shares usually rise ahead of recovery and fall before a recession. The market leads the economy by approximately six months, but the lead time can vary considerably."
Graphically we can present the interaction of these two cycles as follows:
So from the above figure (Figure 35) we can get an inference that Indian Stock market is somewhere between the MIDDLE BULL and LATE BULL as our Indian economy is in the expansion phase. It is generally observed that the stock market reaches its peak approximately 6 to 9 months before the economy of that
FIGURE 35
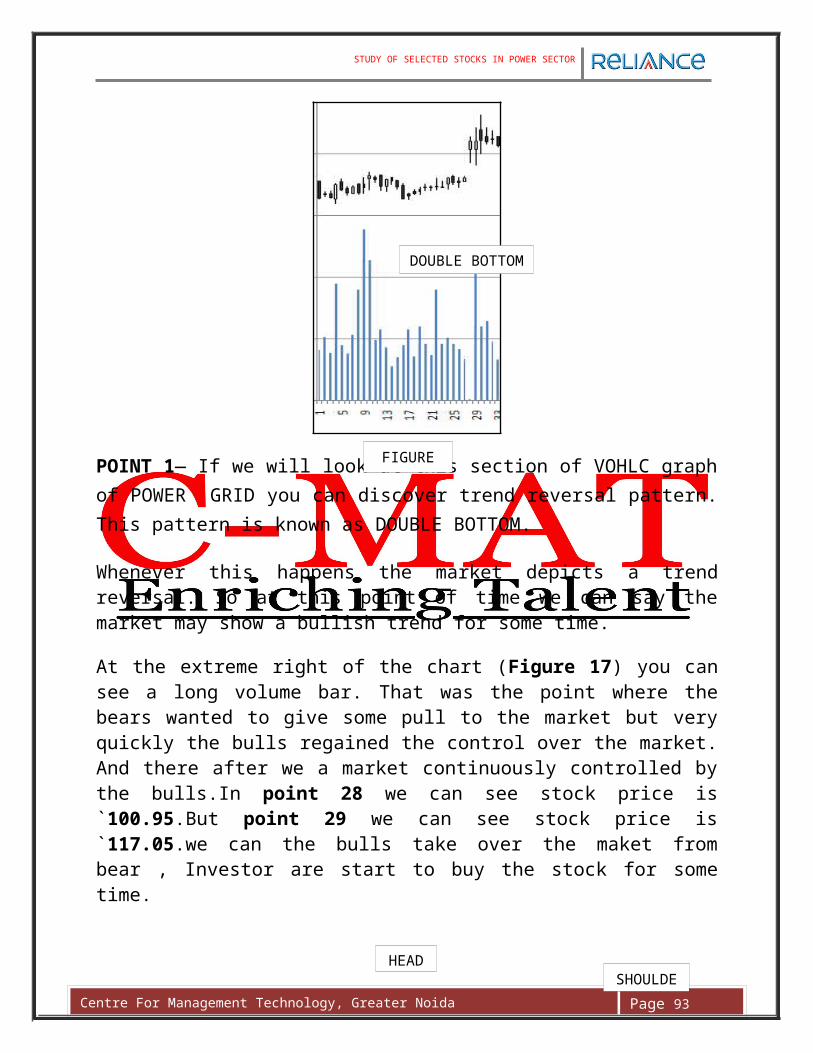
Centre For Management Technology, Greater Noida Page 93
country reaches to its peak or crest. The stock market will reach to its peak approximately 6 to 9 months before the Indian Economy will reach its CREST.
If we look at the market cycle (FIGURE 36) only then we will get the following pattern:
There are 4 phase in the MARKET CYCLE: ACCUMULATION, MARK UP, DISTRIBUTION and MARK DOWN.
Accumulation phase takes place when the market has bottomed and only innovators, smart money managers and experienced traders & investors begin to buy. Valuations are very attractive and the general sentiment of the market is BEARISH. And then the overall sentiment of the market starts to shift from bearish to neutral. Then the Mark Up phase starts. At this phase the market stabilizes and slowly and gradually shows an uptrend and the early majority joins the bandwagon of the buyers. The late majority enters the market at the end of this phase.
In Distribution phase is marked by a transition of bullish mark up phase sentiment to more of mixed sentiment. At last in the Mark Down phase the market becomes completely bearish. It is a painful phase especially for those who hold position inspired by greed in the Mark Up phase.
So based on this analysis we can say we are yet to witness the Indian stock market’s peak. So for those who want to go for a long term investment in the stock market it is just the right time because when the stock market will reach its peak they will surely end up with good return no matter in which sector they mobilize their investment.
FIGURE 36
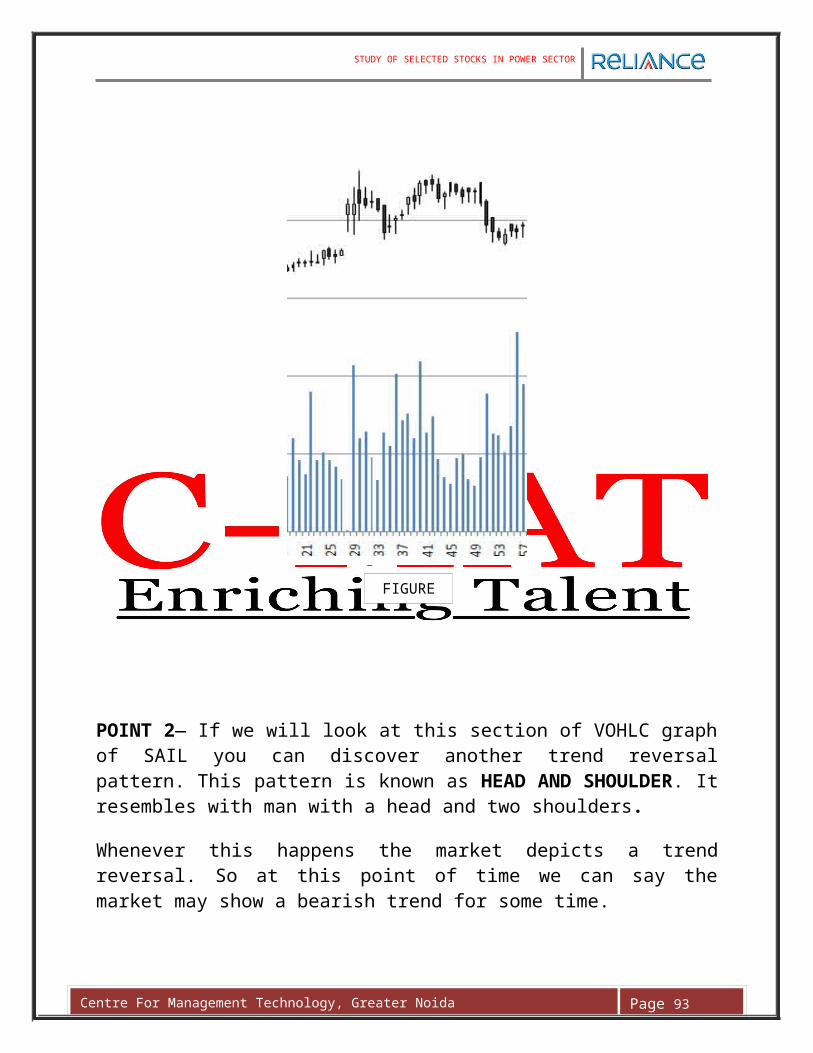
Centre For Management Technology, Greater Noida Page 93
CONCLUSION
Before I start to conclude the report there are few important facts that we need to know. The Power sector in India was set up to meet her domestic needs and support for the development of the nation.
“In India, apparent Power consumption increased by 704KWH in 2008-2009 and a further increase of 1000 KWH is expected in 2012 by Government.
www.indiamart.com
However recently Power sector has been very growing sector in india, Because power is more importance in our day to day life. India is 5 th largest power producer in the world. The Indian government has set ambitious goals in the 11th plan for Power sector owing to which the Power sector is poised for significant expansion. In order to provide availability of over 1000 units of per capita electricity by year 2012, it hasbeen estimated that need-based capacity addition of more than 100,000 MW would be required.
But what all these information means? What will be the future of Power sector in India is our main concern and what is the advice for the investors who have invested or going to invest in the Power sector (Through Stock Market).
On the basis of the analysis done in this report these are the few important findings:
The Future of the overall Power Industry is really good. As India's growing economy and expanding impacts demand and supply in major industry sectors including automotive, steel, and any companies or sector that are positioned in India as suppliers will benefit. The ever growing enviroment has also given a considerable thrust to the demand of Power in the country.
After the stock market crashed on 21st January 2008 the market was gradually recover and become normal. In fact through that crash the stock market corrected itself completely. However Sensex and Niffty have again in same position .
However for Power sector what we can say now is that at least in India it has great future prospects. Thanks to a rise in the consumption in every sectors .For last few years we have witnessed a good growth in the Power sector.

Centre For Management Technology, Greater Noida Page 93
All the stocks I analyzed in this report have also shown positive results. All these stocks have already started to show that they had recovered very quickly after the market shock of January 2008. However, one interesting finding is that PSU’s and Public power sector recoverd faster.
But when we talk about the industry as a whole then for investors I will say that investing in the Power Industry is a good preposition for them as this industry is really going to show great results in future and promises to provide wonderful returns to its investors.
In coming six weeks ,Public sector power companies all going to remain stable but at same time can provide small but sure returns to the Investors.
Going by risk – return principle , these Public sector companies have low risk associated with the investments and eventually result in low returns “LOW RISK ,LOW RETURNS”
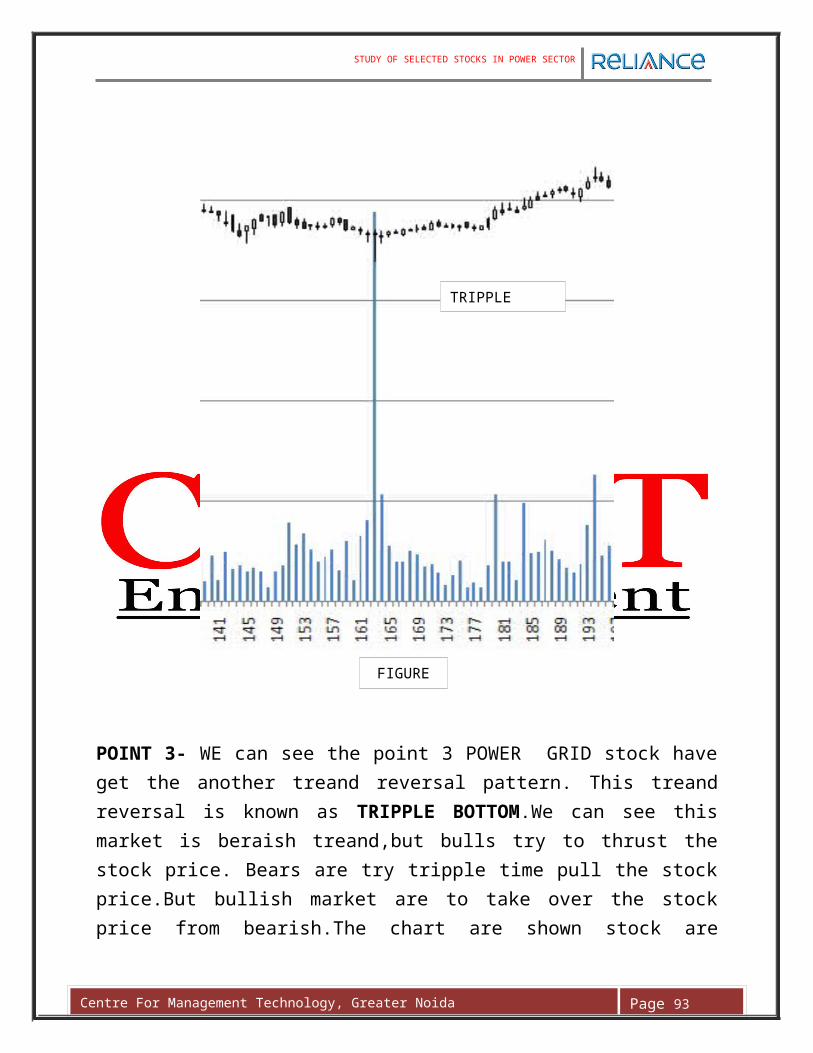
Centre For Management Technology, Greater Noida Page 93
SUGGESTION
For short term or the intraday traders I would like to say choose your stocks carefully and do at least the basic research work before investing. As I have already said that the Indian stock markets are still operating at a premium even after the crash and so called correction so if possible take help of analysts to help you with your selection of stocks.
As we know right now the global economy is going through a slowdown so there will hardly be any sector which will not be affected at all and power sector is no exception. But if you are planning for a long term investment in the stock market then the Power sector will be one of the smartest choices and be rest assured of good returns.
Here I have analysis five power sector company.In PSU’s sector three company and In public sector two company, I have predict the PSU’s sector are more stable rater then Public sector company.According to my prediction if investers are to make a high return then they can invest the money for short term in public sector company.Because high return comes with high risk.
And if Invester are want to take low risk then they can invest in PSU’s for short term and for long term and make secure return.
IMPULSE CORRECTION
Centre For Management Technology, Greater Noida Page 93
Appendix
FIBONACCI RETRACEMENT
Fibonacci numbers are the result of work by Leonardo Fibonacci in the early 1200's while studying the Great Pyramid of Gizeh. The Fibonacci series is a numerical sequence comprised of adding the previous numbers together, i.e. (1,2,3,5,8,13,21,34,55,89,144,233 etc..)
An interesting property of these numbers is that as the series proceeds, any given number is 1.618 times the preceding number and 0.618% of the next number.
(34/55 = 55/89 = 144/233 =0.618) (55/34 =89/55 =233/144 =1.618), and 1.618 =1/0.618
Fibonacci numbers are commonly used in Technical Analysis with or without knowledge of Elliot wave analysis to determine potential support, resistance, and price objectives. 38.2% retracements usually imply that the prior trend will continue, 61.8% retracements imply a new trend is establishing itself. A 50% retracement implies indecision. 38.2% retracements are considered natural retracements in a healthy trend.
ELIOT WAVE THEORY
The Elliott Wave Theory is named after Ralph Nelson Elliott. Inspired by the Dow Theory and by observations found throughout nature, Elliott concluded that the movement of the stock market could be predicted by observing and identifying a repetitive pattern of waves. In fact, Elliott believed that all of man's activities, not just the stock market, were influenced by these identifiable series of waves.
The whole theory of Elliott Wave can be classified into two parts:
IMPULSE PATTERN CORRECTIVE PATTERNS
The figure shows how actually the retracement takes place. Elliot states that any stock price moves in a 5:3 wave pattern that is 5 Impulsive waves then 3 correction waves. However the patterns may vary for different stocks but the Impulsive and corrective waves will always be there only the way they occur may vary.
To know more about this you can visit www.investopedia.com.
REFERENCES
Centre For Management Technology, Greater Noida Page 93
Investments Analysis and Management By Charles P. Jones. Stock Exchanges and Investments By V. Raghunathan. Investment Analysis Portfolio Management By Frank K. Reilly & Keith C. Brown Economic Times. Websites:
www.investopedia.com www.taguide.com www.tradingacademy.com www.sharemarketbasics.com www.stockcharts.com etc. www.wikipedia.com www.nseindia.com


![TSUBAKI KABELSCHLEPP Parts listkabelschlepp.ru/fileadmin/img/carrier/PDFs/spare... · Item Materialtext [remarks] KR 052 KR 065 KR 095 KR 125 KR 150 KR 180 KR 200 KR 225 1](https://img.pdfslide.us/doc/110x75/5faa70404ba8b17fd45cfabf/tsubaki-kabelschlepp-parts-item-materialtext-remarks-kr-052-kr-065-kr-095-kr-125.jpg)