Embed Size (px)
Citation preview
TTeecchhnniiccaall AAnnaallyyssiiss
CChhaarrttiinngg
Ökonometrische Prognose
WS 06/07
Univ.Prof.Dr. Robert Kunst
SSyyllvviiaa GGrruubbeerr,, 00115500663300
2
CCOONNTTEENNTT
I. Introduction to Technical Analysis ...................................................... 3
I.i. Dow Theory ................................................................................. 3 II. Support & Resistance ....................................................................... 4
II.i. Introduction ................................................................................. 4 II.ii. Support and Resistance Levels........................................................ 4 II.iii. Trend Lines ............................................................................... 5 II.iv. Channels .................................................................................. 6
III. Pattern Recognition .......................................................................... 7
III.i. Introduction ................................................................................. 7 III.ii. Continuation Patterns ................................................................. 8 III.ii.a. Flags and Pennants ................................................................. 8 III.ii.b. Triangles ............................................................................... 8
III.ii.b.1. Symmetrical Triangles .......................................................... 9 III.ii.b.2. Ascending Triangles.............................................................. 9 III.ii.b.3. Descending Triangles.......................................................... 10
III.iii. Reversal Patterns..................................................................... 10 III.iii.a. Head and Shoulders ........................................................... 11 III.iii.b. Double Tops and Bottoms.................................................... 11 III.iii.c. Triple Tops and Bottoms ..................................................... 12
Bibliography........................................................................................... 13
3
I. Introduction to Technical Analysis
„Technical Analysis, the prediction of price movements based on past price
movements, has been shown to generate statistically significant profits despite
its incompatibility with most economists‘ notions of efficient markets…“ Federal
Reserve Bank of NY, C.L. Ostler and P.H. Kevin Chang, 1995.
Technical Analysis has two very diverse origins. The first recorded use of
technical analysis was done by the early 18th century rice traders of Japan. The
technique that is perhaps best known is the Candlestick chart.
The other origin, particularly for western technical analysis, is the work of
Charles H Dow. In 1884, he produced the first publication of the stock market
averages, which has evolved to the modern day Dow Jones Index and has led to
similar indices around the world.
I.i. Dow Theory
The Dow Theory has six basic tenets:
� Everything is discounted in the price – All news, views, hopes and
disappointments are factored into the price
� Markets have three trends
o Primary trend ( lasts over three months)
o Secondary trend (3 weeks to 3 months)
o Minor Trend (less than 3 weeks)
� Major trends have three phases
o Accumulation Phase – investors buy into the market. Bad news is
still coming out but the price is not falling any more.
o Trending Phase – Trend followers, such as technical analysts, join
the initial move
o Distribution Phase – Wider range of investors begin to take profit on
their positions and the trend comes to an end.
� The averages must confirm each other – Dow was referring to his Road
and Rail averages. He noted that for a sustained change in trend of one
average, it had to be confirmed by a change in the other average
4
� Volume must confirm the trend – Volume is a secondary indicator but the
volume should also expand in the direction of the trend and vice versa.
� A trend is assumed to be in effect unless there are definite signals that it
has reversed
From Dow’s Theory three basic assumptions can be made:
� Market price action discounts everything – all news, view, hopes, and
disappointments are factored in the price
� Prices move in trends and trends tend to persist – Markets move up, down
and sideways. These trends are interrupted by shorter trends. Technical
Analysts believe these trends will continue until there are signs of them
ending and a greater force reversing them.
� History repeats itself – All markets are driven by human psychology (f.ex.
greed, hope, fear…). The psychologist Schiller said “Anyone taken as an
individual is tolerably sensible and reasonable, but as a member of a
crowd he at once becomes an idiot”. In order to use Technical Analysis one
must believe that history repeats itself.
II. Support & Resistance
II.i. Introduction
One of the most important concepts in Technical Analysis is the concept of
trend. Technical Analysts operate on the assumption that prices move in trends,
the goal being to identify the trend as early as possible in order to trade in that
direction. A trend can be defined as the direction of the market.
In fact, markets rarely move in straight lines but through a series of peaks and
troughs that are referred to as resistance and support levels. It is the direction of
these successive highs and lows that constitutes the market trend.
II.ii. Support and Resistance Levels
The basic idea behind this support-resistance theory is that the understanding of
the future lies in the past. Price levels that were significant in the past will be of
importance for the price action in the future.
Support or resistance levels are prices beyond which the market may have
difficulty in moving, so they should be considered as significant levels in
connection with buying and selling decisions. These may include:
5
� Previous highs or lows
� Big figures, which often become psychological resistance or support levels.
The bigger the figure, the more significant the potential support or
resistance.
� Price projections and retracements: these also give areas for support and
resistance on a chart.
Role Reversal
When a support or resistance level breaks it often reverses roles, then support
becomes resistance and resistance becomes support. For this reason, it is
important to keep a note of old levels of support and resistance for the future.
Trading Strategy
Once a level has provided significant support or resistance, when the price once
again trades to that level, a position should be taken on the assumption that the
level will once more hold with a stop (and reverse) to the other side of the line.
It is important to note that the longer the price has been support or resistance
and the more times the level has been touched and held the more important the
level.
II.iii. Trend Lines
Trend lines are harder to visualise than support & resistance lines. They are
diagonal lines that define either an area of support or resistance in the market. It
identifies the current trend of a market and a break of the trend line indicates
either a reversal or a retracement in that trend.
Definitions
An Uptrend is a succession of higher highs and higher lows
A Downtrend is a succession of lower highs and lower lows.
Unlike a support or resistance line, two points are needed to draw a trend line
but a third point is needed to confirm it. The more touches and the longer the
trend line has been in place the more important the line becomes.
In an uptrend a line is drawn connecting the lows to form a trend line. This is
illustrating that the buyers in the market are pushing the market higher.
Filters
They help to confirm the validity of a potential trend line break. A basic trend
change signal is created when either a support or resistance line has been
penetrated. The use of time and/or price filters is a common method of trying to
avoid false signals:
6
Time Filters
a) A session closes beyond a broken trend line is needed to confirm a break.
This is usually a daily close, but may be an hourly, 2-hourly close, etc. for
shorter time frame traders
b) For longer term trading, the Two-Day Rule states that the price must close
beyond the trend line for two consecutive periods for the break to be
considered valid.
Price Filters
A trend line must be broken by a predetermined value or percentage amount
(set by the dealer) before the break is considered to be valid.
Traders commonly use filters but it has to be remembered that they are a very
personal thing.
II.iv. Channels
A channel is an extension of the trend line.
� In an uptrend, the channel line is drawn parallel to trend line above price
action
� In a downtrend, the channel line is drawn parallel to trend line below price
action
� The trend line and channel line should engulf the price action
� Channels are more useful to an analyst than a simple trend line because
they identify a minimum price objective for the market should the price
break out of the channel
Still the most important line in a channel pattern is the trend line. The channel
line is purely a measuring line and should not be used as a trading signal. Once
the channel line has been drawn on the chart, the width can be measured and
projected from the break of the trend line. This is the Minimum Price Objective
(MPO).
7
Example
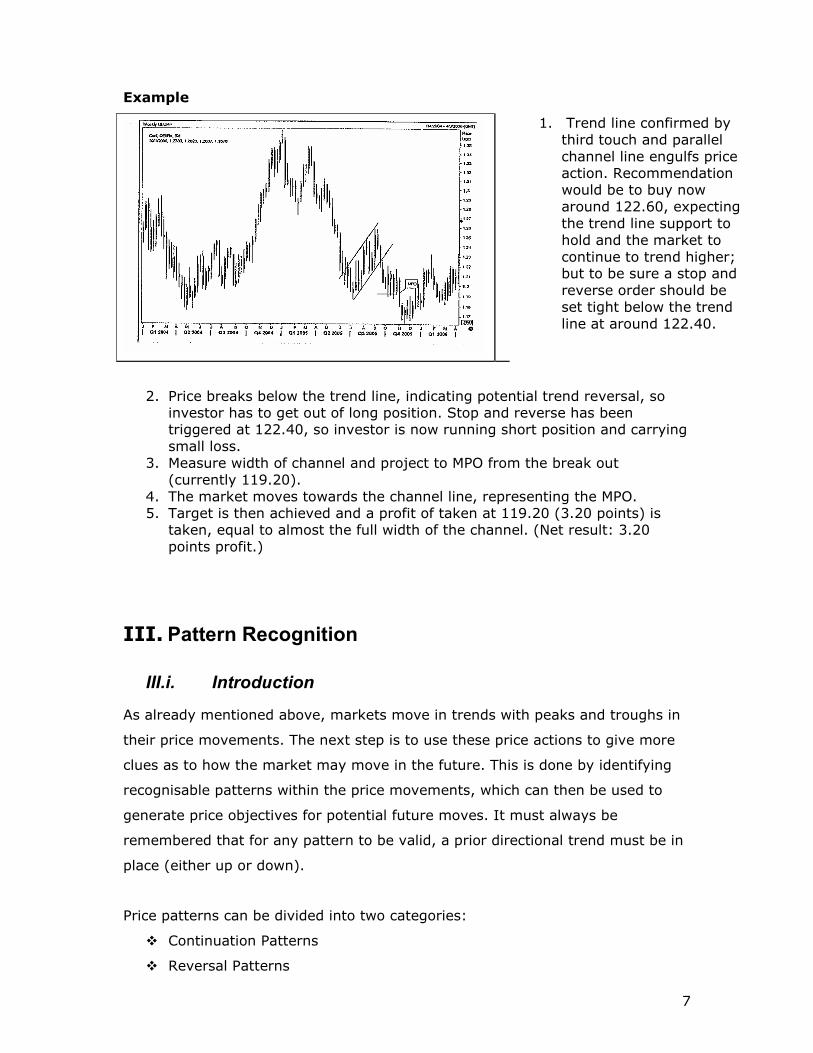
1. Trend line confirmed by third touch and parallel channel line engulfs price action. Recommendation would be to buy now around 122.60, expecting the trend line support to hold and the market to continue to trend higher; but to be sure a stop and reverse order should be set tight below the trend line at around 122.40.
2. Price breaks below the trend line, indicating potential trend reversal, so investor has to get out of long position. Stop and reverse has been triggered at 122.40, so investor is now running short position and carrying small loss.
3. Measure width of channel and project to MPO from the break out (currently 119.20).
4. The market moves towards the channel line, representing the MPO. 5. Target is then achieved and a profit of taken at 119.20 (3.20 points) is
taken, equal to almost the full width of the channel. (Net result: 3.20 points profit.)
III. Pattern Recognition
III.i. Introduction
As already mentioned above, markets move in trends with peaks and troughs in
their price movements. The next step is to use these price actions to give more
clues as to how the market may move in the future. This is done by identifying
recognisable patterns within the price movements, which can then be used to
generate price objectives for potential future moves. It must always be
remembered that for any pattern to be valid, a prior directional trend must be in
place (either up or down).
Price patterns can be divided into two categories:
� Continuation Patterns
� Reversal Patterns
8
III.ii. Continuation Patterns
They show that a sideways movement on a chart may be just a pause in the
prevailing (longer-term) trend, after which prices will continue to move in the
same direction as before. The main advantage of identifying a pattern is that we
can use it to define minimum price objectives at a fairly early stage to give us
time to profit from the expected future move.
III.ii.a. Flags and Pennants
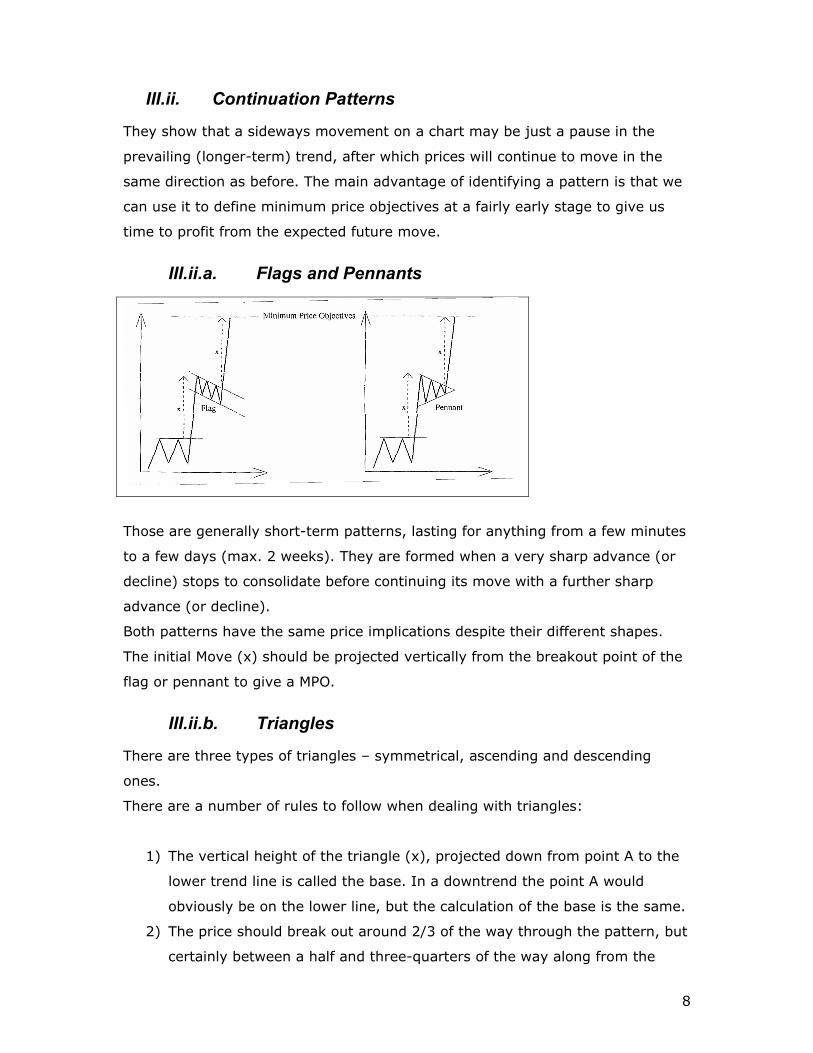
Those are generally short-term patterns, lasting for anything from a few minutes
to a few days (max. 2 weeks). They are formed when a very sharp advance (or
decline) stops to consolidate before continuing its move with a further sharp
advance (or decline).
Both patterns have the same price implications despite their different shapes.
The initial Move (x) should be projected vertically from the breakout point of the
flag or pennant to give a MPO.
III.ii.b. Triangles
There are three types of triangles – symmetrical, ascending and descending
ones.
There are a number of rules to follow when dealing with triangles:
1) The vertical height of the triangle (x), projected down from point A to the
lower trend line is called the base. In a downtrend the point A would
obviously be on the lower line, but the calculation of the base is the same.
2) The price should break out around 2/3 of the way through the pattern, but
certainly between a half and three-quarters of the way along from the
9
base to the apex (H). A breakout before halfway means that the triangle
has barely had time to take shape and should not be trusted. If the price
is still within the triangle beyond the three-quarters point, then there is
more likelihood that the price will simply continue to drift sideways and
lose its shape. That would nullify the measuring properties of the pattern.
3) Regarding measuring implications, the Minimum Price Ojective for a
triangle is the vertical height of the base, x, projected vertically from the
breakout point in the direction of the break.
4) Triangles are generally medium to long-term patterns, typically lasting for
1-3 months.
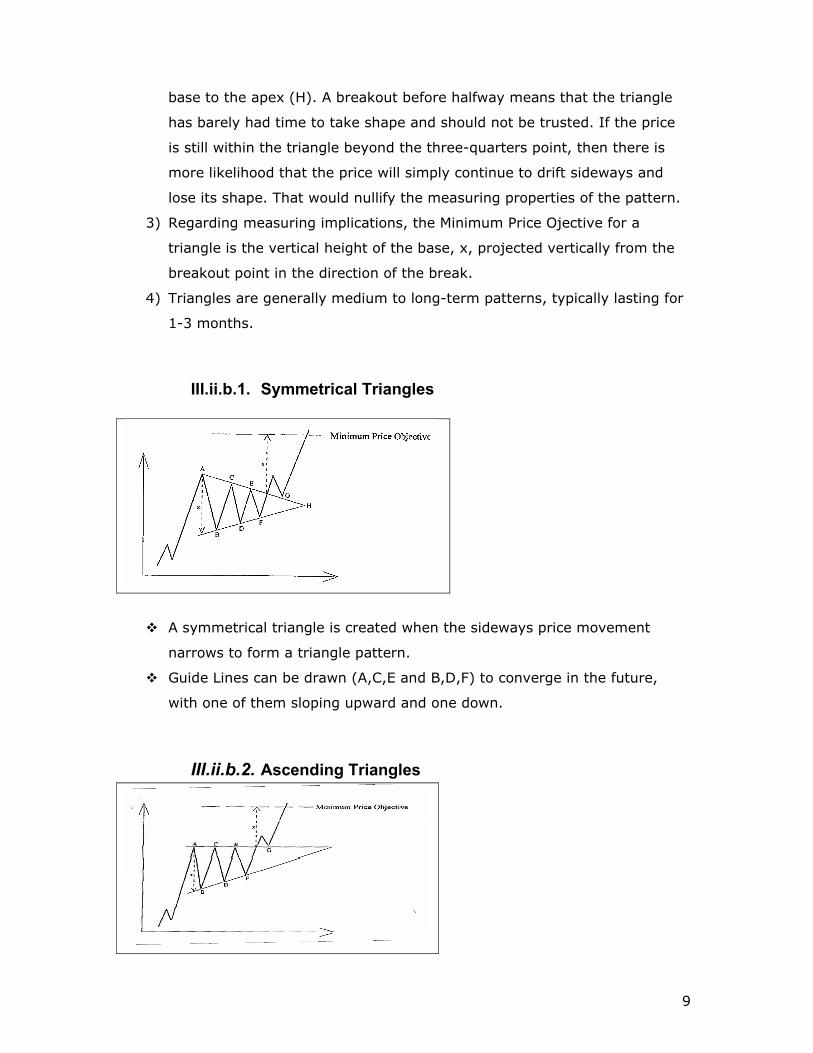
III.ii.b.1. Symmetrical Triangles
� A symmetrical triangle is created when the sideways price movement
narrows to form a triangle pattern.
� Guide Lines can be drawn (A,C,E and B,D,F) to converge in the future,
with one of them sloping upward and one down.
III.ii.b.2. Ascending Triangles
10
� Ascending Triangles are, most often, bullish patterns.
� They have a horizontal upper line (ACE) and an up-sloping lower line(BDF)
� The up sloping line is created by dealers being prepared to pay a slightly
higher price each time the price declines (that shows that buying pressure
is increasing)
� The flat upper line is telling that the sellers at A,C, and E are prepared to
wait for the price to rise before selling (that shows that selling pressure is
not increasing).
� It therefore makes sense that the price breaks out on the upside
� A return move to G is also quite common before the price moves off
towards the minimum price objective.
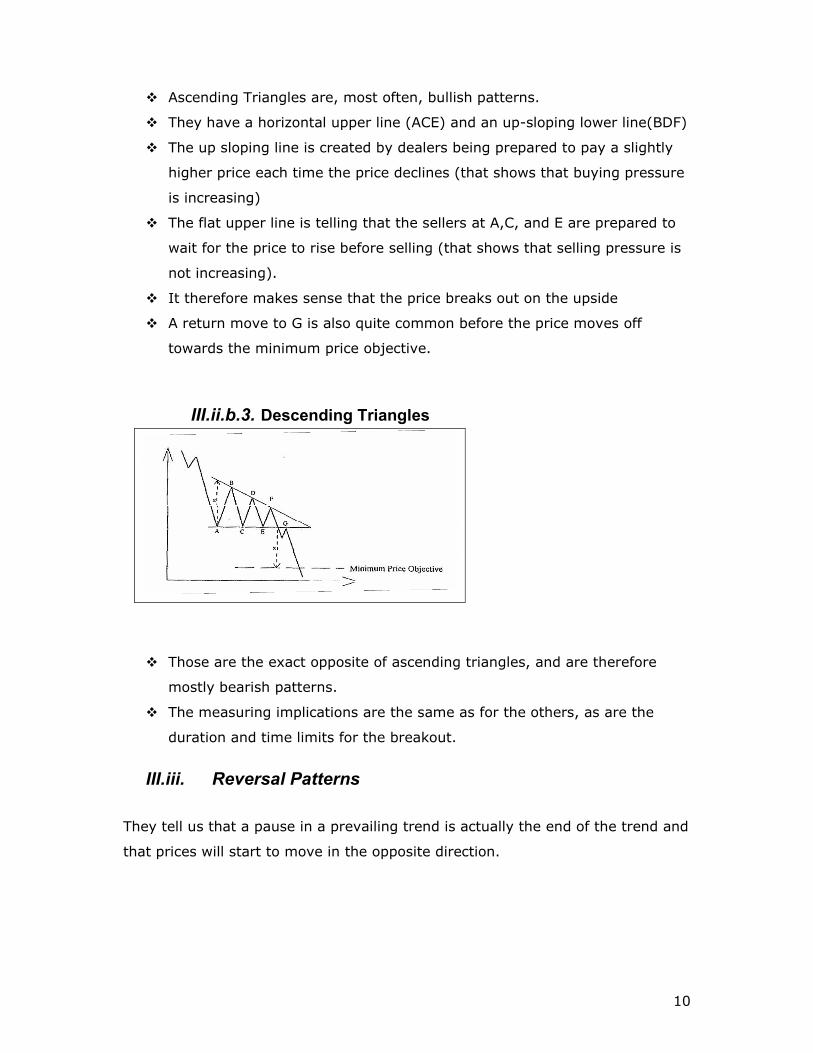
III.ii.b.3. Descending Triangles
� Those are the exact opposite of ascending triangles, and are therefore
mostly bearish patterns.
� The measuring implications are the same as for the others, as are the
duration and time limits for the breakout.
III.iii. Reversal Patterns
They tell us that a pause in a prevailing trend is actually the end of the trend and
that prices will start to move in the opposite direction.
11
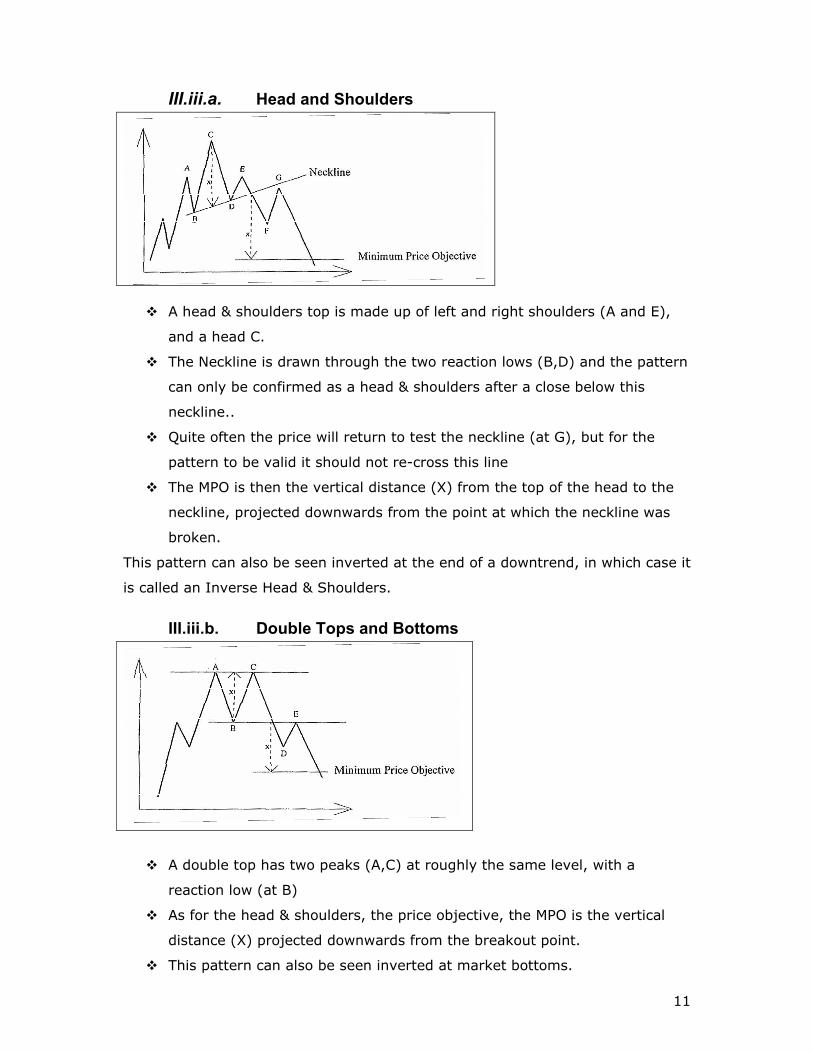
III.iii.a. Head and Shoulders
� A head & shoulders top is made up of left and right shoulders (A and E),
and a head C.
� The Neckline is drawn through the two reaction lows (B,D) and the pattern
can only be confirmed as a head & shoulders after a close below this
neckline..
� Quite often the price will return to test the neckline (at G), but for the
pattern to be valid it should not re-cross this line
� The MPO is then the vertical distance (X) from the top of the head to the
neckline, projected downwards from the point at which the neckline was
broken.
This pattern can also be seen inverted at the end of a downtrend, in which case it
is called an Inverse Head & Shoulders.
III.iii.b. Double Tops and Bottoms
� A double top has two peaks (A,C) at roughly the same level, with a
reaction low (at B)
� As for the head & shoulders, the price objective, the MPO is the vertical
distance (X) projected downwards from the breakout point.
� This pattern can also be seen inverted at market bottoms.
12
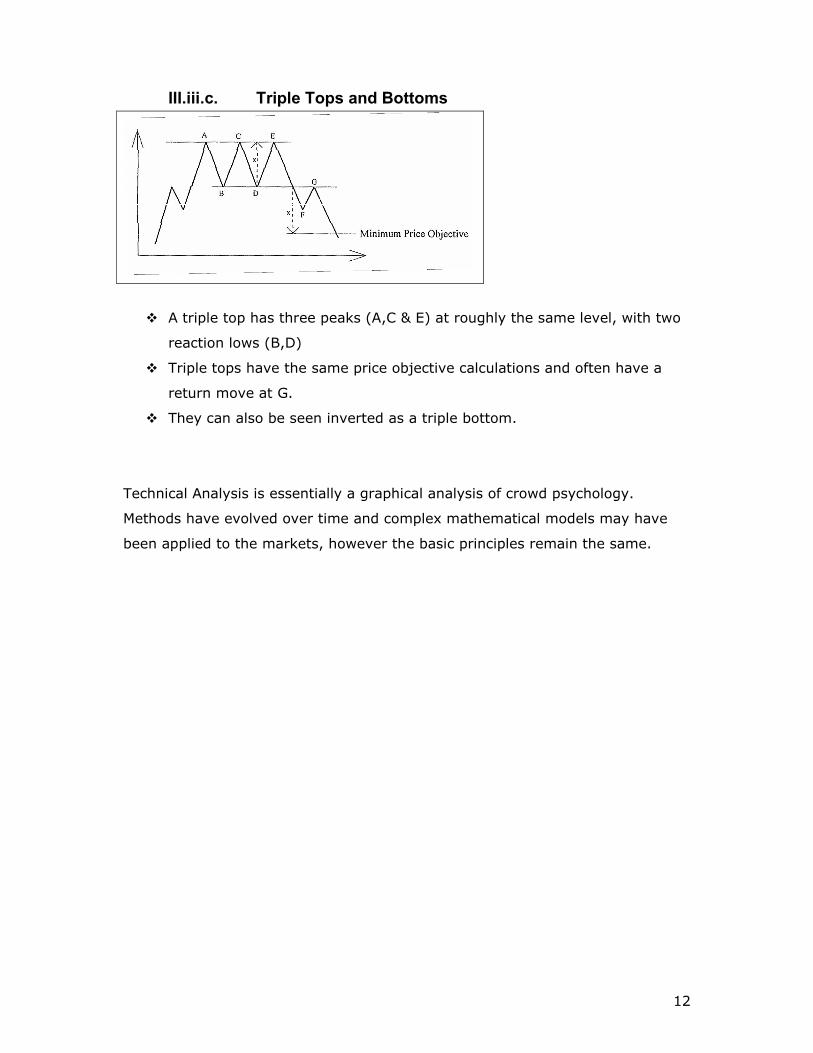
III.iii.c. Triple Tops and Bottoms
� A triple top has three peaks (A,C & E) at roughly the same level, with two
reaction lows (B,D)
� Triple tops have the same price objective calculations and often have a
return move at G.
� They can also be seen inverted as a triple bottom.
Technical Analysis is essentially a graphical analysis of crowd psychology.
Methods have evolved over time and complex mathematical models may have
been applied to the markets, however the basic principles remain the same.
13
Bibliography
� Achelis, Steven B. Technical Anaylsis from A to Z. Chicago, IL: Probus
Publishing Company, 1995
� Cohen, A.W. How to Use the Three-Point Reversal Method of Point&Figure
Stock Market Trading. Larchmont, NU: Chartcraft, 1984
� Denmark, Tom. The New Science of Technical Analysis. John Wiley&Sons,
1994
� Edwards, Robert D. and Magee, John. Technical Analysis of Stock Trends.
Sixth Edition. Boston, MA: John Magee, Inc., 1992. (Distributed by NY
Institute of Finance)
� Reuters in association with ßeta. Technical Analysis Seminar. Prague and
Vienna