Embed Size (px)
Citation preview
CMP 2642.35
Target Price 2900.00
ISIN: INE669C01028
NOVEMBER 15th
2014
TECH MAHINDRA LIMITED Result Update (CONSOLIDATED BASIS): Q2 FY15
BUYBUYBUYBUY
Index Details
Stock Data
Sector IT
BSE Code 532755
Face Value 10.00
52wk. High / Low (Rs.) 2665.00/1643.30
Volume (2wk. Avg.) 68000
Market Cap (Rs. in mn.) 622141.31
Annual Estimated Results (A*: Actual / E*: Estimated)
YEARS FY14A FY15E FY16E
Net Sales 188313.80 220327.15 248969.67
EBITDA 42967.80 50190.38 56066.06
Net Profit 30288.10 32240.62 36763.40
EPS 129.73 136.93 156.14
P/E 20.37 19.30 16.92
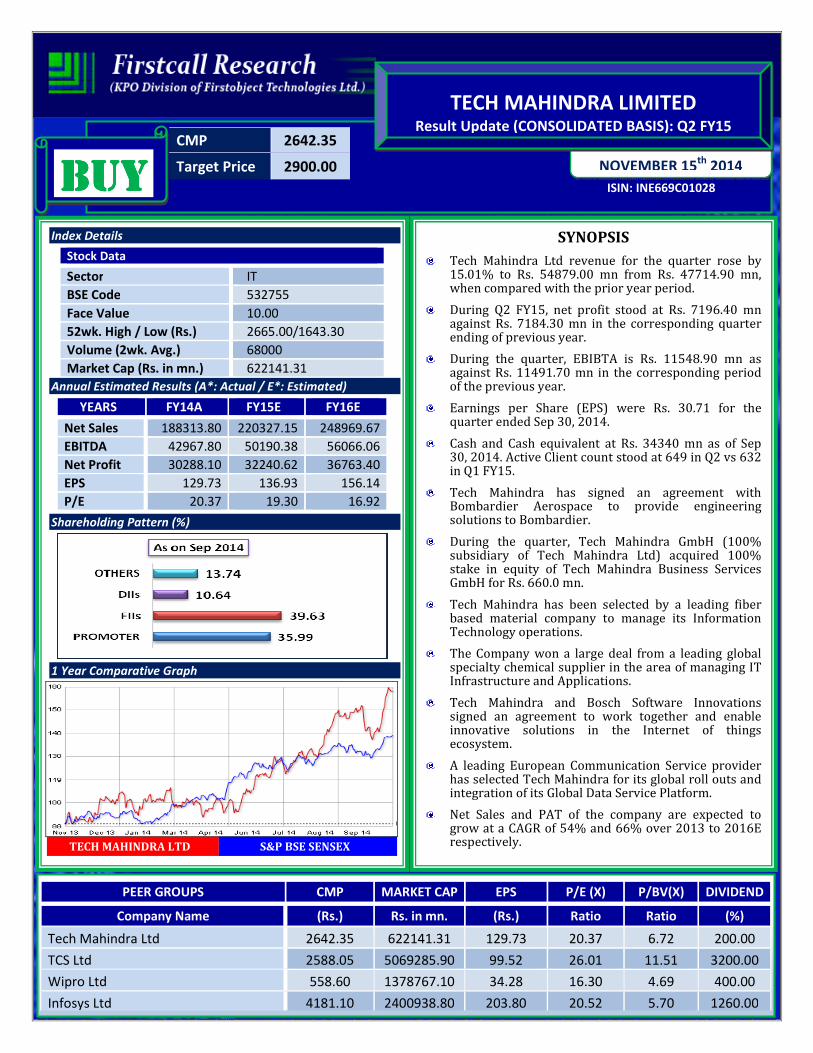
Shareholding Pattern (%)
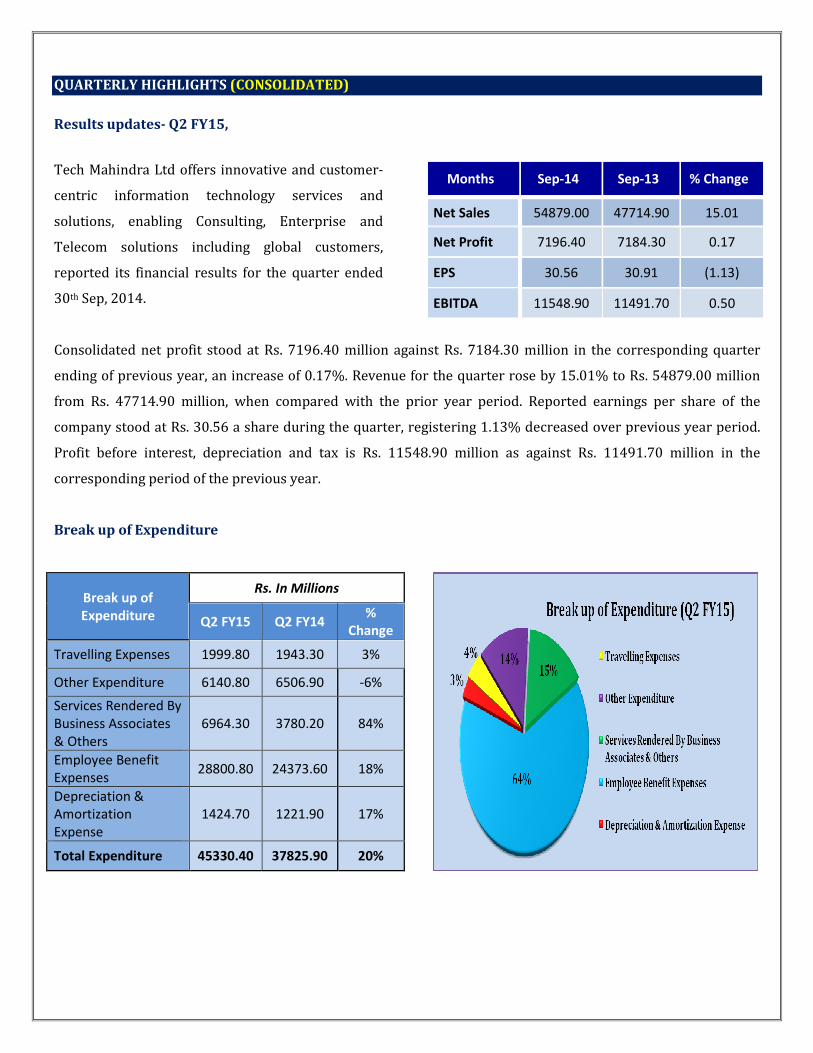
1 Year Comparative Graph
TECH MAHINDRA LTD S&P BSE SENSEX
SYNOPSIS
Tech Mahindra Ltd revenue for the quarter rose by 15.01% to Rs. 54879.00 mn from Rs. 47714.90 mn, when compared with the prior year period.
During Q2 FY15, net profit stood at Rs. 7196.40 mn against Rs. 7184.30 mn in the corresponding quarter ending of previous year.
During the quarter, EBIBTA is Rs. 11548.90 mn as against Rs. 11491.70 mn in the corresponding period of the previous year.
Earnings per Share (EPS) were Rs. 30.71 for the quarter ended Sep 30, 2014.
Cash and Cash equivalent at Rs. 34340 mn as of Sep 30, 2014. Active Client count stood at 649 in Q2 vs 632 in Q1 FY15.
Tech Mahindra has signed an agreement with Bombardier Aerospace to provide engineering solutions to Bombardier.
During the quarter, Tech Mahindra GmbH (100% subsidiary of Tech Mahindra Ltd) acquired 100% stake in equity of Tech Mahindra Business Services GmbH for Rs. 660.0 mn.
Tech Mahindra has been selected by a leading fiber based material company to manage its Information Technology operations.
The Company won a large deal from a leading global specialty chemical supplier in the area of managing IT Infrastructure and Applications.
Tech Mahindra and Bosch Software Innovations signed an agreement to work together and enable innovative solutions in the Internet of things ecosystem.
A leading European Communication Service provider has selected Tech Mahindra for its global roll outs and integration of its Global Data Service Platform.
Net Sales and PAT of the company are expected to grow at a CAGR of 54% and 66% over 2013 to 2016E respectively.
PEER GROUPS CMP MARKET CAP EPS P/E (X) P/BV(X) DIVIDEND
Company Name (Rs.) Rs. in mn. (Rs.) Ratio Ratio (%)
Tech Mahindra Ltd 2642.35 622141.31 129.73 20.37 6.72 200.00
TCS Ltd 2588.05 5069285.90 99.52 26.01 11.51 3200.00
Wipro Ltd 558.60 1378767.10 34.28 16.30 4.69 400.00
Infosys Ltd 4181.10 2400938.80 203.80 20.52 5.70 1260.00
QUARTERLY HIGHLIGHTS (CONSOLIDATED)
Results updates- Q2 FY15,
Tech Mahindra Ltd offers innovative and customer-
centric information technology services and
solutions, enabling Consulting, Enterprise and
Telecom solutions including global customers,
reported its financial results for the quarter ended
30th Sep, 2014.
Months Sep-14 Sep-13 % Change
Net Sales 54879.00 47714.90 15.01
Net Profit 7196.40 7184.30 0.17
EPS 30.56 30.91 (1.13)
EBITDA 11548.90 11491.70 0.50
Consolidated net profit stood at Rs. 7196.40 million against Rs. 7184.30 million in the corresponding quarter
ending of previous year, an increase of 0.17%. Revenue for the quarter rose by 15.01% to Rs. 54879.00 million
from Rs. 47714.90 million, when compared with the prior year period. Reported earnings per share of the
company stood at Rs. 30.56 a share during the quarter, registering 1.13% decreased over previous year period.
Profit before interest, depreciation and tax is Rs. 11548.90 million as against Rs. 11491.70 million in the
corresponding period of the previous year.
Break up of Expenditure
Break up of
Expenditure
Rs. In Millions
Q2 FY15 Q2 FY14 %
Change
Travelling Expenses 1999.80 1943.30 3%
Other Expenditure 6140.80 6506.90 -6%
Services Rendered By
Business Associates
& Others
6964.30 3780.20 84%
Employee Benefit
Expenses 28800.80 24373.60 18%
Depreciation &
Amortization
Expense
1424.70 1221.90 17%
Total Expenditure 45330.40 37825.90 20%
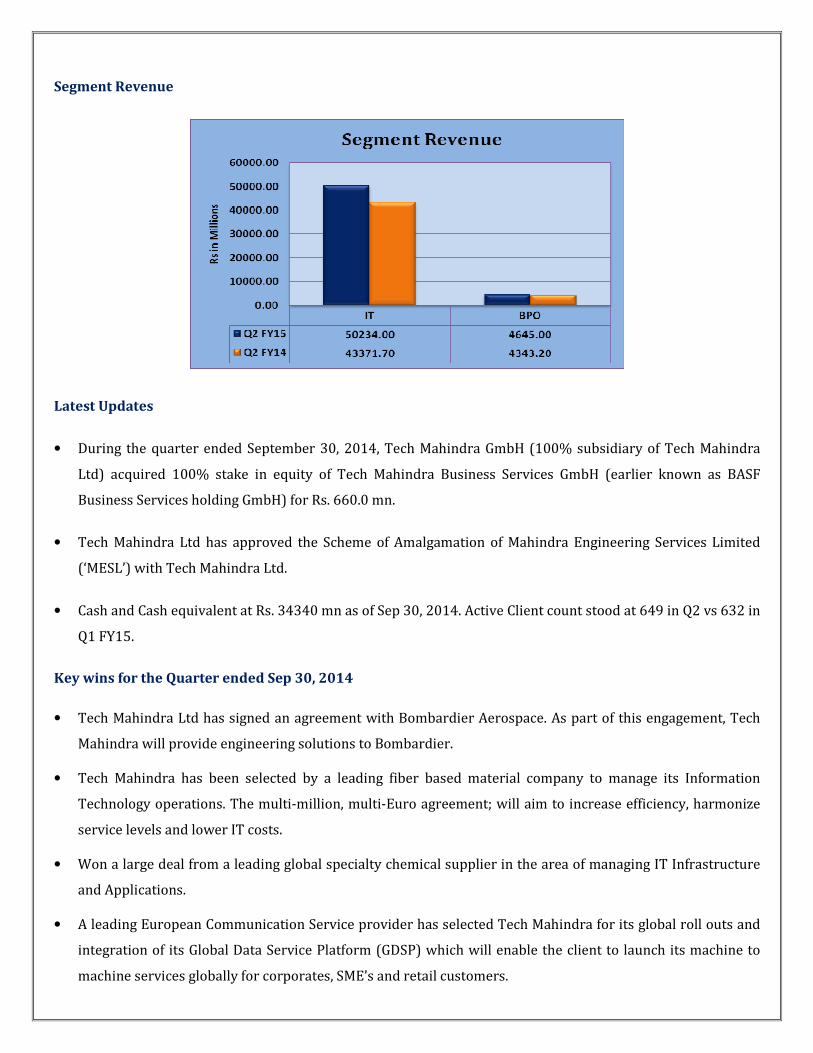
Segment Revenue
Latest Updates
• During the quarter ended September 30, 2014, Tech Mahindra GmbH (100% subsidiary of Tech Mahindra
Ltd) acquired 100% stake in equity of Tech Mahindra Business Services GmbH (earlier known as BASF
Business Services holding GmbH) for Rs. 660.0 mn.
• Tech Mahindra Ltd has approved the Scheme of Amalgamation of Mahindra Engineering Services Limited
(‘MESL’) with Tech Mahindra Ltd.
• Cash and Cash equivalent at Rs. 34340 mn as of Sep 30, 2014. Active Client count stood at 649 in Q2 vs 632 in
Q1 FY15.
Key wins for the Quarter ended Sep 30, 2014
• Tech Mahindra Ltd has signed an agreement with Bombardier Aerospace. As part of this engagement, Tech
Mahindra will provide engineering solutions to Bombardier.
• Tech Mahindra has been selected by a leading fiber based material company to manage its Information
Technology operations. The multi-million, multi-Euro agreement; will aim to increase efficiency, harmonize
service levels and lower IT costs.
• Won a large deal from a leading global specialty chemical supplier in the area of managing IT Infrastructure
and Applications.
• A leading European Communication Service provider has selected Tech Mahindra for its global roll outs and
integration of its Global Data Service Platform (GDSP) which will enable the client to launch its machine to
machine services globally for corporates, SME’s and retail customers.
• Engaged by a US fortune 500 Company in area of Global IT Infrastructure Project management as a service..
Tech Mahindra will enable the creation of a central Project Management Office organization that will act as a
Center of Excellence (COE) for project management.
• A fortune 25 conglomerate selected Tech Mahindra to work in the Area of Business Intelligence (BI) and Risk
& Liquidity application support.
• Tech Mahindra won a deal from a leading telecommunication tower company for implementation of its Smart
Tower Operation Center (TOC), enabling customer to transform and upgrade its infrastructure.
• A leading Global Innovative wellbeing and healthcare company selected Tech Mahindra for Quality
Assurance.
• Engaged by a leading Global Software and Devices company in the area of hardware engineering. Tech
Mahindra will provide services around hardware product development and testing.
Business Highlights for the Quarter ended Sep 30, 2014
• Tech Mahindra and Bosch Software Innovations signed an agreement to work together and enable innovative
solutions in the Internet of things ecosystem. The alliance will focus on developing connected solutions for
smart cities, enterprises and smart homes.
• Announced establishment of its new Canadian Aerospace Headquarters in Greater Montréal. The company
will offer innovative Engineering and Information Technology services and anticipates creation of
approximately 300 jobs over the next three years, mainly in the aerospace industry.
• The Texas A&M Engineering Experiment Station (TEES) and Tech Mahindra signed a Memorandum of
Understanding (MoU) to open a Joint Innovation Center for Computer Science in Houston.
• Signed Memorandum of Understanding (MoU) with Wichita State University, a state educational institution
in Kansas in the areas of aerospace engineering, certification, information technology and automotive testing.
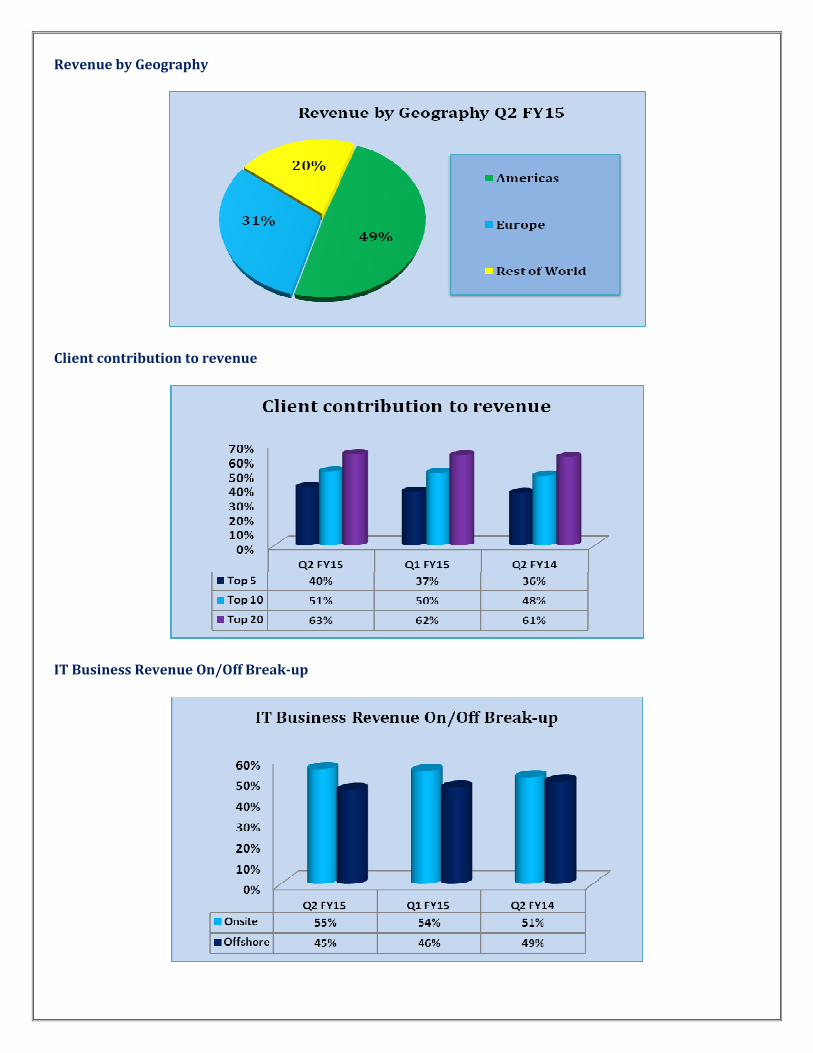
Revenue by Geography
Client contribution to revenue
IT Business Revenue On/Off Break-up
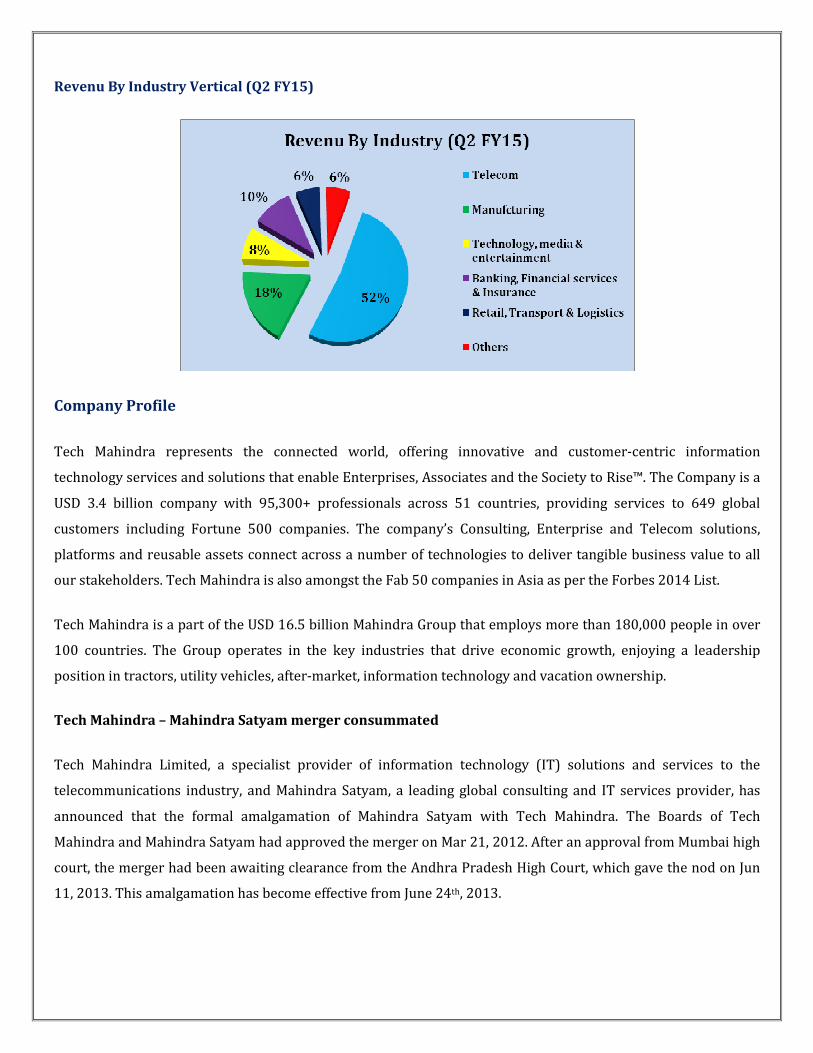
Revenu By Industry Vertical (Q2 FY15)
Company Profile
Tech Mahindra represents the connected world, offering innovative and customer-centric information
technology services and solutions that enable Enterprises, Associates and the Society to Rise™. The Company is a
USD 3.4 billion company with 95,300+ professionals across 51 countries, providing services to 649 global
customers including Fortune 500 companies. The company’s Consulting, Enterprise and Telecom solutions,
platforms and reusable assets connect across a number of technologies to deliver tangible business value to all
our stakeholders. Tech Mahindra is also amongst the Fab 50 companies in Asia as per the Forbes 2014 List.
Tech Mahindra is a part of the USD 16.5 billion Mahindra Group that employs more than 180,000 people in over
100 countries. The Group operates in the key industries that drive economic growth, enjoying a leadership
position in tractors, utility vehicles, after-market, information technology and vacation ownership.
Tech Mahindra – Mahindra Satyam merger consummated
Tech Mahindra Limited, a specialist provider of information technology (IT) solutions and services to the
telecommunications industry, and Mahindra Satyam, a leading global consulting and IT services provider, has
announced that the formal amalgamation of Mahindra Satyam with Tech Mahindra. The Boards of Tech
Mahindra and Mahindra Satyam had approved the merger on Mar 21, 2012. After an approval from Mumbai high
court, the merger had been awaiting clearance from the Andhra Pradesh High Court, which gave the nod on Jun
11, 2013. This amalgamation has become effective from June 24th, 2013.
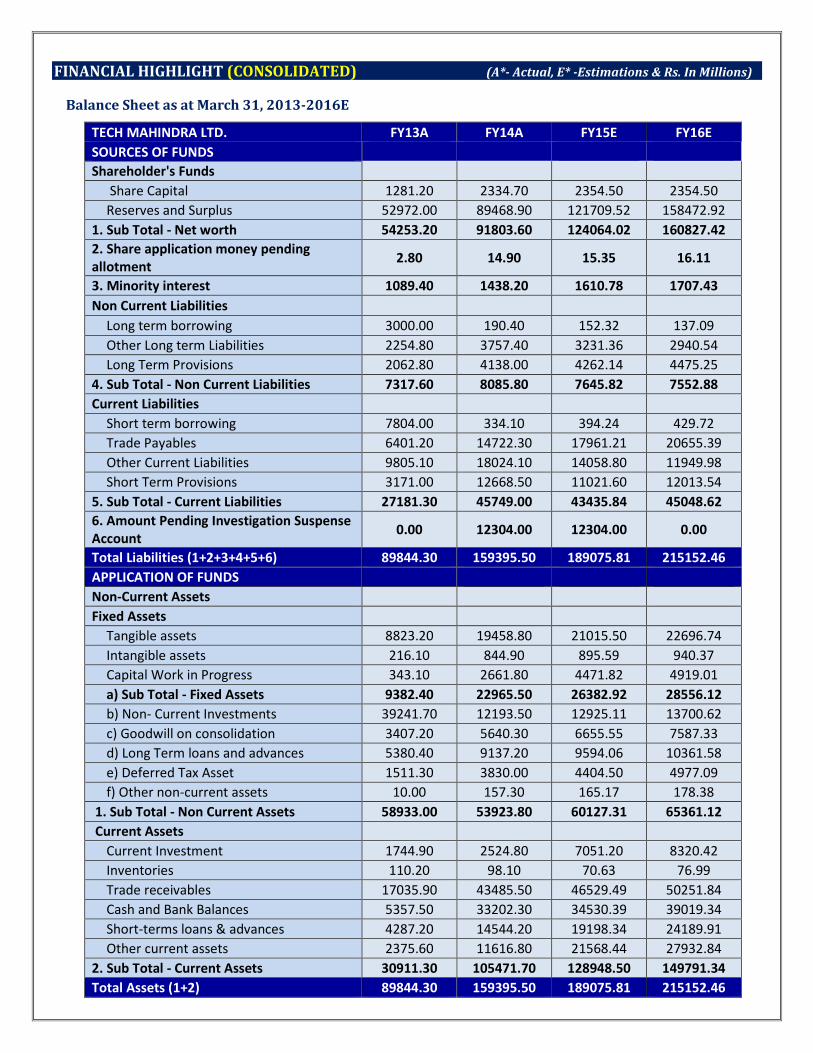
FINANCIAL HIGHLIGHT (CONSOLIDATED) (A*- Actual, E* -Estimations & Rs. In Millions)
Balance Sheet as at March 31, 2013-2016E
TECH MAHINDRA LTD. FY13A FY14A FY15E FY16E
SOURCES OF FUNDS
Shareholder's Funds
Share Capital 1281.20 2334.70 2354.50 2354.50
Reserves and Surplus 52972.00 89468.90 121709.52 158472.92
1. Sub Total - Net worth 54253.20 91803.60 124064.02 160827.42
2. Share application money pending
allotment 2.80 14.90 15.35 16.11
3. Minority interest 1089.40 1438.20 1610.78 1707.43
Non Current Liabilities
Long term borrowing 3000.00 190.40 152.32 137.09
Other Long term Liabilities 2254.80 3757.40 3231.36 2940.54
Long Term Provisions 2062.80 4138.00 4262.14 4475.25
4. Sub Total - Non Current Liabilities 7317.60 8085.80 7645.82 7552.88
Current Liabilities
Short term borrowing 7804.00 334.10 394.24 429.72
Trade Payables 6401.20 14722.30 17961.21 20655.39
Other Current Liabilities 9805.10 18024.10 14058.80 11949.98
Short Term Provisions 3171.00 12668.50 11021.60 12013.54
5. Sub Total - Current Liabilities 27181.30 45749.00 43435.84 45048.62
6. Amount Pending Investigation Suspense
Account 0.00 12304.00 12304.00 0.00
Total Liabilities (1+2+3+4+5+6) 89844.30 159395.50 189075.81 215152.46
APPLICATION OF FUNDS
Non-Current Assets
Fixed Assets
Tangible assets 8823.20 19458.80 21015.50 22696.74
Intangible assets 216.10 844.90 895.59 940.37
Capital Work in Progress 343.10 2661.80 4471.82 4919.01
a) Sub Total - Fixed Assets 9382.40 22965.50 26382.92 28556.12
b) Non- Current Investments 39241.70 12193.50 12925.11 13700.62
c) Goodwill on consolidation 3407.20 5640.30 6655.55 7587.33
d) Long Term loans and advances 5380.40 9137.20 9594.06 10361.58
e) Deferred Tax Asset 1511.30 3830.00 4404.50 4977.09
f) Other non-current assets 10.00 157.30 165.17 178.38
1. Sub Total - Non Current Assets 58933.00 53923.80 60127.31 65361.12
Current Assets
Current Investment 1744.90 2524.80 7051.20 8320.42
Inventories 110.20 98.10 70.63 76.99
Trade receivables 17035.90 43485.50 46529.49 50251.84
Cash and Bank Balances 5357.50 33202.30 34530.39 39019.34
Short-terms loans & advances 4287.20 14544.20 19198.34 24189.91
Other current assets 2375.60 11616.80 21568.44 27932.84
2. Sub Total - Current Assets 30911.30 105471.70 128948.50 149791.34
Total Assets (1+2) 89844.30 159395.50 189075.81 215152.46
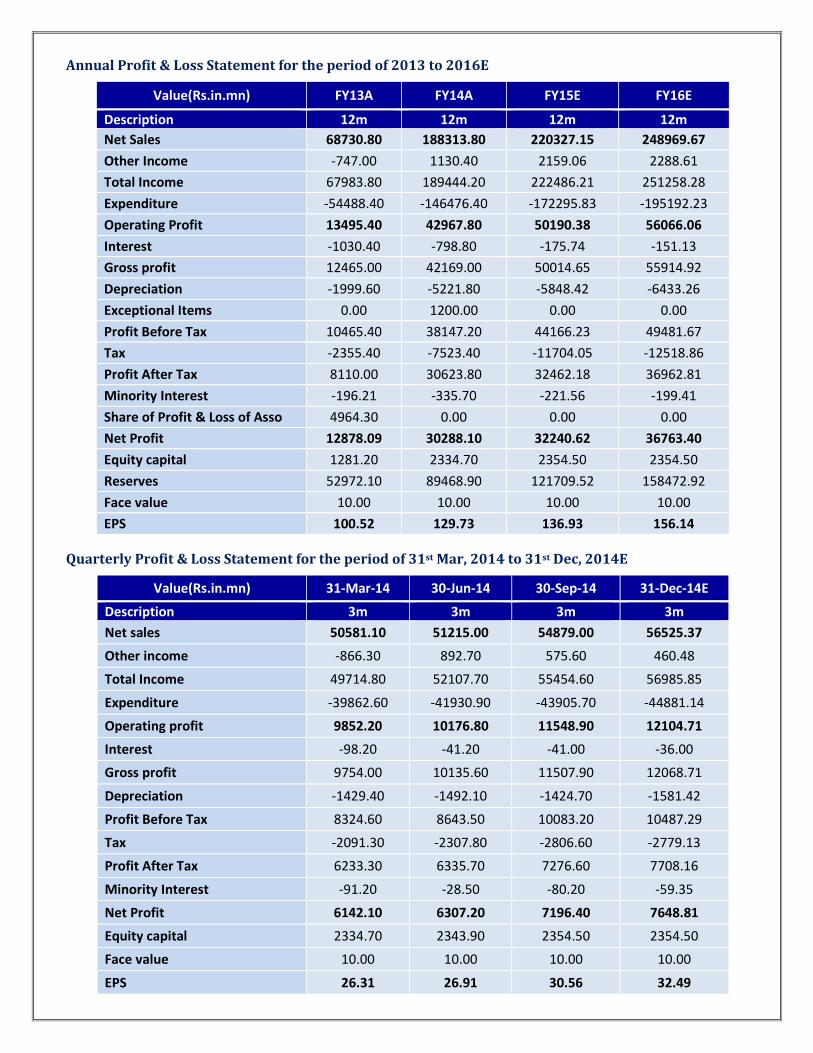
Annual Profit & Loss Statement for the period of 2013 to 2016E
Value(Rs.in.mn) FY13A FY14A FY15E FY16E
Description 12m 12m 12m 12m
Net Sales 68730.80 188313.80 220327.15 248969.67
Other Income -747.00 1130.40 2159.06 2288.61
Total Income 67983.80 189444.20 222486.21 251258.28
Expenditure -54488.40 -146476.40 -172295.83 -195192.23
Operating Profit 13495.40 42967.80 50190.38 56066.06
Interest -1030.40 -798.80 -175.74 -151.13
Gross profit 12465.00 42169.00 50014.65 55914.92
Depreciation -1999.60 -5221.80 -5848.42 -6433.26
Exceptional Items 0.00 1200.00 0.00 0.00
Profit Before Tax 10465.40 38147.20 44166.23 49481.67
Tax -2355.40 -7523.40 -11704.05 -12518.86
Profit After Tax 8110.00 30623.80 32462.18 36962.81
Minority Interest -196.21 -335.70 -221.56 -199.41
Share of Profit & Loss of Asso 4964.30 0.00 0.00 0.00
Net Profit 12878.09 30288.10 32240.62 36763.40
Equity capital 1281.20 2334.70 2354.50 2354.50
Reserves 52972.10 89468.90 121709.52 158472.92
Face value 10.00 10.00 10.00 10.00
EPS 100.52 129.73 136.93 156.14
Quarterly Profit & Loss Statement for the period of 31st Mar, 2014 to 31st Dec, 2014E
Value(Rs.in.mn) 31-Mar-14 30-Jun-14 30-Sep-14 31-Dec-14E
Description 3m 3m 3m 3m
Net sales 50581.10 51215.00 54879.00 56525.37
Other income -866.30 892.70 575.60 460.48
Total Income 49714.80 52107.70 55454.60 56985.85
Expenditure -39862.60 -41930.90 -43905.70 -44881.14
Operating profit 9852.20 10176.80 11548.90 12104.71
Interest -98.20 -41.20 -41.00 -36.00
Gross profit 9754.00 10135.60 11507.90 12068.71
Depreciation -1429.40 -1492.10 -1424.70 -1581.42
Profit Before Tax 8324.60 8643.50 10083.20 10487.29
Tax -2091.30 -2307.80 -2806.60 -2779.13
Profit After Tax 6233.30 6335.70 7276.60 7708.16
Minority Interest -91.20 -28.50 -80.20 -59.35
Net Profit 6142.10 6307.20 7196.40 7648.81
Equity capital 2334.70 2343.90 2354.50 2354.50
Face value 10.00 10.00 10.00 10.00
EPS 26.31 26.91 30.56 32.49
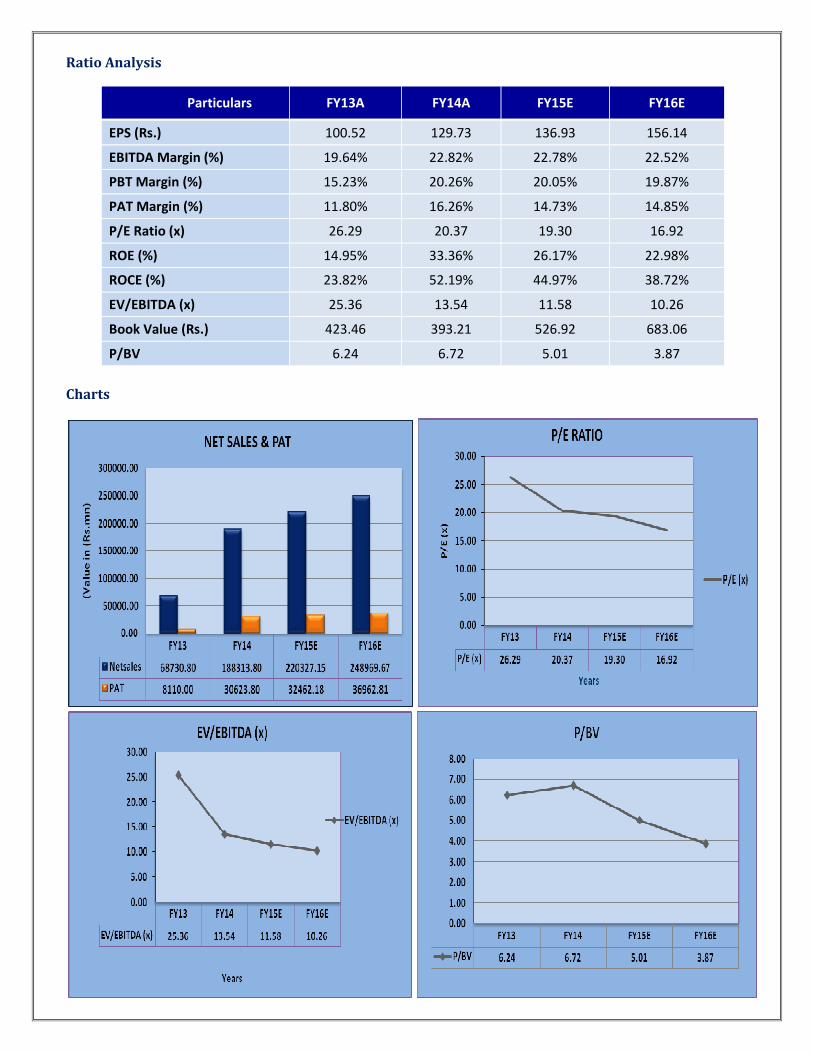
Ratio Analysis
Particulars FY13A FY14A FY15E FY16E
EPS (Rs.) 100.52 129.73 136.93 156.14
EBITDA Margin (%) 19.64% 22.82% 22.78% 22.52%
PBT Margin (%) 15.23% 20.26% 20.05% 19.87%
PAT Margin (%) 11.80% 16.26% 14.73% 14.85%
P/E Ratio (x) 26.29 20.37 19.30 16.92
ROE (%) 14.95% 33.36% 26.17% 22.98%
ROCE (%) 23.82% 52.19% 44.97% 38.72%
EV/EBITDA (x) 25.36 13.54 11.58 10.26
Book Value (Rs.) 423.46 393.21 526.92 683.06
P/BV 6.24 6.72 5.01 3.87
Charts
OUTLOOK AND CONCLUSION
� At the current market price of Rs.2642.35, the stock P/E ratio is at 19.30 x FY15E and 16.92 x FY16E
respectively.
� Earning per share (EPS) of the company for the earnings for FY15E and FY16E is seen at Rs.136.93 and
Rs.156.14 respectively.
� Net Sales and PAT of the company are expected to grow at a CAGR of 54% and 66% over 2013 to 2016E
respectively.
� On the basis of EV/EBITDA, the stock trades at 11.58 x for FY15E and 10.26 x for FY16E.
� Price to Book Value of the stock is expected to be at 5.01 x and 3.87 x respectively for FY15E and FY16E.
� We expect that the company surplus scenario is likely to continue for the next three years, will keep its
growth story in the coming quarters also. We recommend ‘BUY’ in this particular scrip with a target price of
Rs.2900.00 for Medium to Long term investment.
INDUSTRY OVERVIEW
The Information Technology (IT) – Business Process Management (BPM) industry in India is now a US$ 100
Billion + industry with NASSCOM estimating FY14 volume to be around ~US$ 118 Billion. The IT-BPM industry
has not only gained a Global brand identity as a knowledge economy, but also has been the highest impact sector
for the Indian Economy as per the Industry body - The National Association of Software and Services Companies
(NASSCOM)
• The Indian IT Industry has been contributing ~8% to the India’s national Gross Domestic Product (GDP).
• Has added approx 1,60,000 employees in FY 2014, thus emerging as largest private sector employer with
over 3.1 Million direct and ~10 Million indirect employment.
• It has the largest share in the services sector in India viz around 38%
• Has been 4th largest Urban Women employer and
• The sector help’s India offset almost half (45%) of its Oil import bill
According to NASSCOM, the IT–BPM sector in India had generated revenues of US$ 109 Billion in FY 2013.
Exports have dominated the IT–BPM industry, and constituted about 70% of the total industry revenue. Though
the IT–BPM sector is export driven, the domestic market is also significant with a robust revenue growth. The
industry’s share of total Indian exports (merchandise plus services) increased from less than 4% in FY1998 to
about 25% in FY 2012.
Global IT spending recorded a growth of 4.5% in 2013. Packaged software, IT services and BPM continued to lead
accounting for 55% of the total spend. Cloud based delivery models, virtualization and automation are some of
the factors driving growth in the IT services segment. The adoption of SMAC technologies is expected to drive
growth in all the segments.
In India, the IT and BPM sectors has accounted for ~90% of the incremental industrial growth. With its
contribution to the country’s exports, foreign exchange earnings and employment generation the sector has, it is
one of the most significant growth catalysts for India. As a proportion of national GDP, the sector revenues have
grown over to 8.1% in FY 2014. Exports are estimated to cross US$ 86 Billion during FY 2014, indicating a YoY
growth of 13% with signs of recovery from the US and Euro zone and return of discretionary spending. IT
services could record a growth of ~14% while BPM exports could record a growth of ~11.4% in FY15.
Domestic IT spends in India have been impacted upon political uncertainties, decline in manufacturing,
slowdown in GDP growth, inflation, rupee volatility and lower foreign investment and is expected to grow ~10%
in FY 2014. However, a rapidly growing economy, emergence of digital technologies, new business and pricing
models tailored to meet specific needs of customers are driving adoption of IT in India. Technology has
journeyed from hardware to enterprise software to SMAC. Going digital is the top priority to all the enterprises
and India is emerging as one of the fastest growing digital economies. The Indian IT, BPM industry is
transitioning to a different level through the advent of technology and extensive use of digitization. Emerging
technologies are redefining the future of the IT industry. Social media, Mobility, Analytics and Cloud (SMAC) are
redefining the traditional business models and offer the opportunity to shift to new digital ways of working.
India is a home for new breeds of start-up firms focused on high growth areas such as ecommerce and SMAC.
These firms are creating new markets and driving innovation. These changing business models, emergence of
new technologies, buyer segments and solutions for emerging markets will help India retain its position as the
global sourcing leader and an emerging trustworthy innovation hub.
The year can be characterized as the year of rapid transition and transformation leading the industry to
expanding into newer verticals and geographies, attracting new customers and transforming from technology
partners to strategic business partners.
Outlook
Growth of Indian IT-BPM industry has a high correlation with the global economic growth especially with the
developed regions of United States, UK and Europe. Global activity and world trade did see some pick up in the
second half of Calendar Year (CY) 2013. The growth Momentum is expected to improve further in CY 2014
largely on account of recovery of advanced economies. Global growth is now projected to be slightly higher in CY
2014, at around 3.7%, rising to 3.9% in 2015, as predicted by World Economic Forum (WEF). United States is
expected to be 2.8% in 2014, up from 1.9% in 2013. The growth in CY 2014 will be carried by firm domestic
demand, supported in part by a reduction in the fiscal drag due to recent corrective steps of the government. The
euro area is turning the corner from recession to recovery. Growth is projected to strengthen to 1% in 2014 and
1.4% in CY 2015, but the recovery may be uneven. Activity in the United Kingdom has been buoyed by easier
credit conditions and increased confidence. Growth is expected to average 2.25% in 2014-15, but economic slack
may remain high. Emerging markets and developing economies are expected to grow strongly at 5.5% in 2014.
Disclaimer:
This document prepared by our research analysts does not constitute an offer or solicitation for the purchase or sale
of any financial instrument or as an official confirmation of any transaction. The information contained herein is
from publicly available data or other sources believed to be reliable but do not represent that it is accurate or
complete and it should not be relied on as such. Firstcall India Equity Advisors Pvt. Ltd. or any of it’s affiliates shall
not be in any way responsible for any loss or damage that may arise to any person from any inadvertent error in the
information contained in this report. This document is provide for assistance only and is not intended to be and must
not alone be taken as the basis for an investment decision.
Firstcall India Equity Research: Email – [email protected]
C.V.S.L.Kameswari Pharma
U. Janaki Rao Capital Goods
B. Anil Kumar Auto, IT & FMCG
M. Vinayak Rao Diversified
C. Bhagya Lakshmi Diversified
B. Vasanthi Diversified
G. Amarender Diversified
Firstcall India also provides
Firstcall India Equity Advisors Pvt.Ltd focuses on, IPO’s, QIP’s, F.P.O’s,Takeover
Offers, Offer for Sale and Buy Back Offerings.
Corporate Finance Offerings include Foreign Currency Loan Syndications,
Placement of Equity / Debt with multilateral organizations, Short Term Funds
Management Debt & Equity, Working Capital Limits, Equity & Debt
Syndications and Structured Deals.
Corporate Advisory Offerings include Mergers & Acquisitions(domestic and
cross-border), divestitures, spin-offs, valuation of business, corporate
restructuring-Capital and Debt, Turnkey Corporate Revival – Planning &
Execution, Project Financing, Venture capital, Private Equity and Financial
Joint Ventures
Firstcall India also provides Financial Advisory services with respect to raising
of capital through FCCBs, GDRs, ADRs and listing of the same on International
Stock Exchanges namely AIMs, Luxembourg, Singapore Stock Exchanges and
other international stock exchanges.
For Further Details Contact:
3rd Floor,Sankalp,The Bureau,Dr.R.C.Marg,Chembur,Mumbai 400 071
Tel. : 022-2527 2510/2527 6077/25276089 Telefax : 022-25276089
E-mail: [email protected]
www.firstcallindiaequity.com