Embed Size (px)
Citation preview
Tech Exit Transaction Multiples - Europe 2018 Edition© 2018 Avolta Partners // www.avoltapartners.com
Tech Exit Transaction MultiplesEurope 2018 EditionWhat about venture capital liquidity?
with help from
#adtech
#medtech/biotech
#fintech

Tech Exit Transaction Multiples - Europe 2018 Edition© 2018 Avolta Partners // www.avoltapartners.com 2
Avolta PartnersEdito
Over the course of 2017, a day didn’t go by when you don’t hear a prize European Tech company getting snapped up by investors outside of thegeography: Zenly was acquired by Snapchat; Chauffeur Privé was bought out by Daimler; BIM was taken over by Zendesk.
Following this observation, our point here is to unravel the dynamics of the European Tech M&A market, to identify the profile of buyers and to knowmore about the valuation models they are guided by.
The long of the short is that there is (unlike America) very little appetite to go public and/or to explore the LBO avenue in Europe : the vast majority ofentrepreneurs use M&A as exits in Europe. Numbers are 91% trade sales; 4% LBO’s and 5% IPO’s. As the nature of the market cannot be changed inthe short term, the single most important issue impacting transactions are valuation criteria.
Trade sales and M&A are one of the key factors impacting the financing of the European Tech Startup ecosystem, as sales/exit proceeds are oftenreinvested in the very same ecosystem. Corporate acquisitions play a large part in this economy and subsequently in the financing of Innovation anddevelopments in Europe. We have sensed in our capacity as a leading European Tech Investment Bank and advisor to both large corporates andentrepreneurs / startups, that the question of valuations and liquidity is central. Moreover, it has become strategic issue in the conduct of business and inentrepreneurial attitudes.
In our study, we have attempted to give valuable insights to three major questions:
1- What are the profile and typology of acquirers (Lions, Elephants, Whales) ?2- How does the profile and typology of acquirers determine motivation and acquirer dynamics?3- What determines exit valuations and dynamics: sector? business model? maturity? acquirer motivations?
Year over Year, Avolta Partners has sought to provide a fresh and quantitative view to the startup valuations in France and in Europe. This in the form ofour Venture Transaction Multiples (VTM-2017). In this edition, we have sought to jump a step further and to address the issue of valuations motivationsfor Tech M&A in Europe. One of our areas of focus has been to deliver insights to help larger corporations have a fresher and data-driven view of thistopic to help them strategic approaches to European Tech Startups and entrepreneurs.
Avolta Partners team, 01/19/2018
Tech Exit Transaction Multiples - Europe 2018 Edition© 2018 Avolta Partners // www.avoltapartners.com 3
Tech.eu x Bpifrance Le HubOur partners
Tech.eu
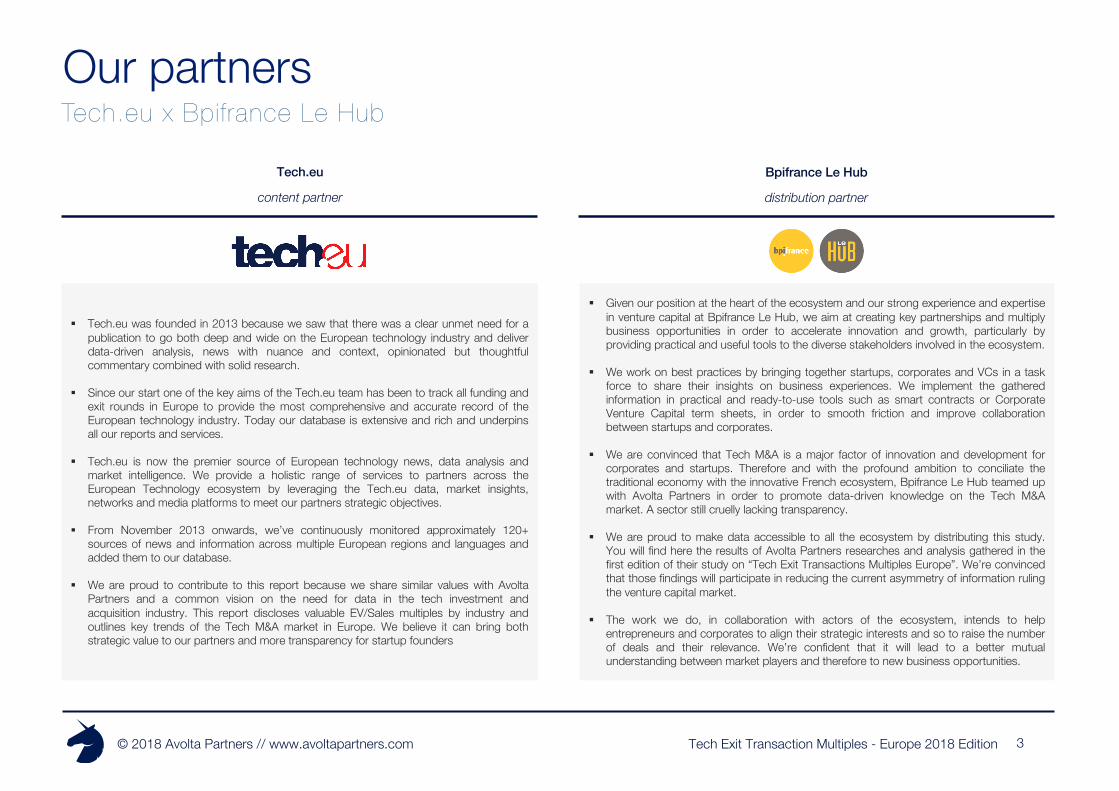
§ Tech.eu was founded in 2013 because we saw that there was a clear unmet need for apublication to go both deep and wide on the European technology industry and deliverdata-driven analysis, news with nuance and context, opinionated but thoughtfulcommentary combined with solid research.
§ Since our start one of the key aims of the Tech.eu team has been to track all funding andexit rounds in Europe to provide the most comprehensive and accurate record of theEuropean technology industry. Today our database is extensive and rich and underpinsall our reports and services.
§ Tech.eu is now the premier source of European technology news, data analysis andmarket intelligence. We provide a holistic range of services to partners across theEuropean Technology ecosystem by leveraging the Tech.eu data, market insights,networks and media platforms to meet our partners strategic objectives.
§ From November 2013 onwards, we’ve continuously monitored approximately 120+sources of news and information across multiple European regions and languages andadded them to our database.
§ We are proud to contribute to this report because we share similar values with AvoltaPartners and a common vision on the need for data in the tech investment andacquisition industry. This report discloses valuable EV/Sales multiples by industry andoutlines key trends of the Tech M&A market in Europe. We believe it can bring bothstrategic value to our partners and more transparency for startup founders
content partner
§ Given our position at the heart of the ecosystem and our strong experience and expertisein venture capital at Bpifrance Le Hub, we aim at creating key partnerships and multiplybusiness opportunities in order to accelerate innovation and growth, particularly byproviding practical and useful tools to the diverse stakeholders involved in the ecosystem.
§ We work on best practices by bringing together startups, corporates and VCs in a taskforce to share their insights on business experiences. We implement the gatheredinformation in practical and ready-to-use tools such as smart contracts or CorporateVenture Capital term sheets, in order to smooth friction and improve collaborationbetween startups and corporates.
§ We are convinced that Tech M&A is a major factor of innovation and development forcorporates and startups. Therefore and with the profound ambition to conciliate thetraditional economy with the innovative French ecosystem, Bpifrance Le Hub teamed upwith Avolta Partners in order to promote data-driven knowledge on the Tech M&Amarket. A sector still cruelly lacking transparency.
§ We are proud to make data accessible to all the ecosystem by distributing this study.You will find here the results of Avolta Partners researches and analysis gathered in thefirst edition of their study on “Tech Exit Transactions Multiples Europe”. We’re convincedthat those findings will participate in reducing the current asymmetry of information rulingthe venture capital market.
§ The work we do, in collaboration with actors of the ecosystem, intends to helpentrepreneurs and corporates to align their strategic interests and so to raise the numberof deals and their relevance. We’re confident that it will lead to a better mutualunderstanding between market players and therefore to new business opportunities.
Bpifrance Le Hub
distribution partner
Tech Exit Transaction Multiples - Europe 2018 Edition© 2018 Avolta Partners // www.avoltapartners.com 4
Building a platform for Tech corporate finance
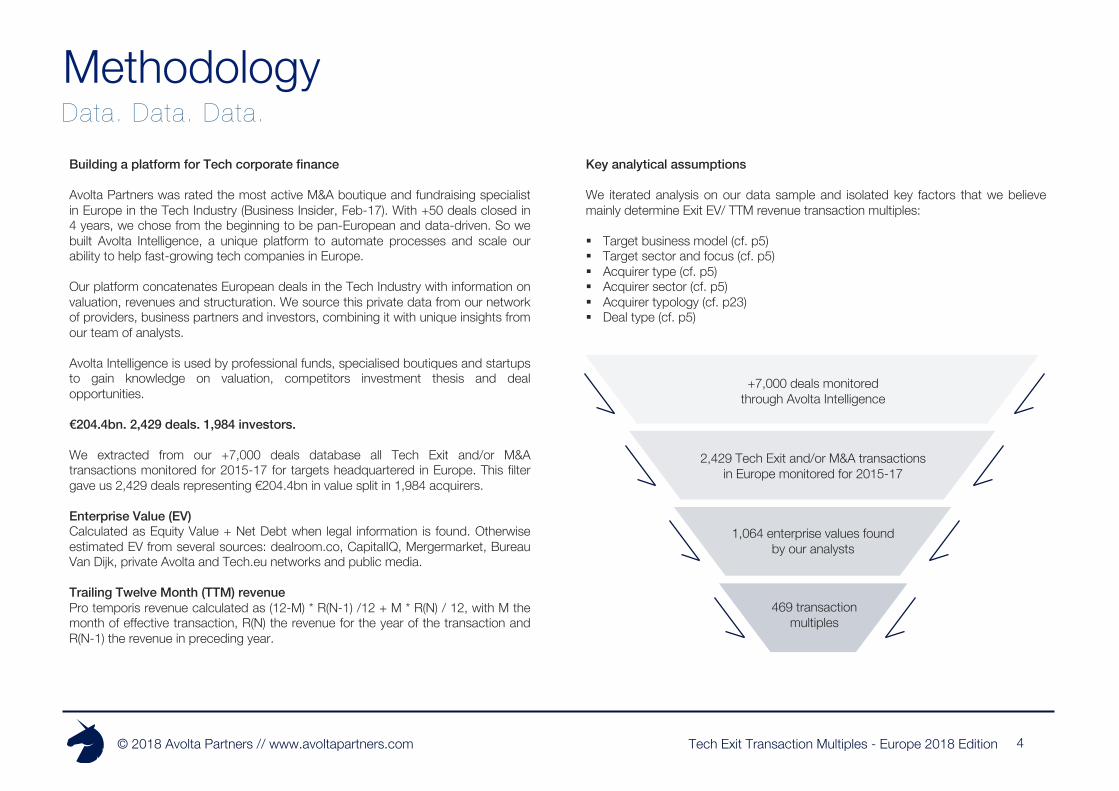
Avolta Partners was rated the most active M&A boutique and fundraising specialistin Europe in the Tech Industry (Business Insider, Feb-17). With +50 deals closed in4 years, we chose from the beginning to be pan-European and data-driven. So webuilt Avolta Intelligence, a unique platform to automate processes and scale ourability to help fast-growing tech companies in Europe.
Our platform concatenates European deals in the Tech Industry with information onvaluation, revenues and structuration. We source this private data from our networkof providers, business partners and investors, combining it with unique insights fromour team of analysts.
Avolta Intelligence is used by professional funds, specialised boutiques and startupsto gain knowledge on valuation, competitors investment thesis and dealopportunities.
€204.4bn. 2,429 deals. 1,984 investors.
We extracted from our +7,000 deals database all Tech Exit and/or M&Atransactions monitored for 2015-17 for targets headquartered in Europe. This filtergave us 2,429 deals representing €204.4bn in value split in 1,984 acquirers.
Enterprise Value (EV)Calculated as Equity Value + Net Debt when legal information is found. Otherwiseestimated EV from several sources: dealroom.co, CapitalIQ, Mergermarket, BureauVan Dijk, private Avolta and Tech.eu networks and public media.
Trailing Twelve Month (TTM) revenuePro temporis revenue calculated as (12-M) * R(N-1) /12 + M * R(N) / 12, with M themonth of effective transaction, R(N) the revenue for the year of the transaction andR(N-1) the revenue in preceding year.
Data. Data. Data.Methodology
+7,000 deals monitoredthrough Avolta Intelligence
2,429 Tech Exit and/or M&A transactionsin Europe monitored for 2015-17
1,064 enterprise values foundby our analysts
469 transaction multiples
Key analytical assumptions
We iterated analysis on our data sample and isolated key factors that we believemainly determine Exit EV/ TTM revenue transaction multiples:
§ Target business model (cf. p5)§ Target sector and focus (cf. p5)§ Acquirer type (cf. p5)§ Acquirer sector (cf. p5)§ Acquirer typology (cf. p23)§ Deal type (cf. p5)
Tech Exit Transaction Multiples - Europe 2018 Edition© 2018 Avolta Partners // www.avoltapartners.com 5
Key analyt ical assumptionsMethodology
Acquirer Sector
Acquirer types
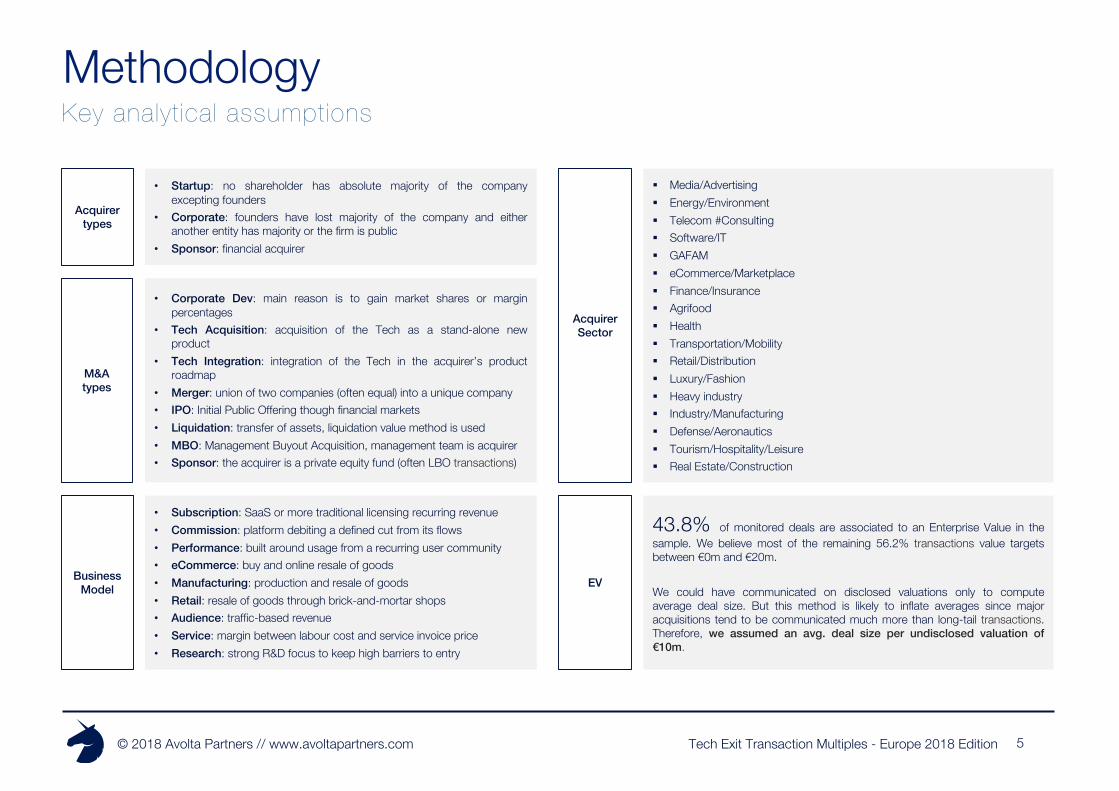
• Startup: no shareholder has absolute majority of the companyexcepting founders
• Corporate: founders have lost majority of the company and eitheranother entity has majority or the firm is public
• Sponsor: financial acquirer
M&A types
• Corporate Dev: main reason is to gain market shares or marginpercentages
• Tech Acquisition: acquisition of the Tech as a stand-alone newproduct
• Tech Integration: integration of the Tech in the acquirer’s productroadmap
• Merger: union of two companies (often equal) into a unique company• IPO: Initial Public Offering though financial markets• Liquidation: transfer of assets, liquidation value method is used• MBO: Management Buyout Acquisition, management team is acquirer• Sponsor: the acquirer is a private equity fund (often LBO transactions)
Business Model
• Subscription: SaaS or more traditional licensing recurring revenue• Commission: platform debiting a defined cut from its flows• Performance: built around usage from a recurring user community• eCommerce: buy and online resale of goods• Manufacturing: production and resale of goods• Retail: resale of goods through brick-and-mortar shops• Audience: traffic-based revenue• Service: margin between labour cost and service invoice price• Research: strong R&D focus to keep high barriers to entry
§ Media/Advertising§ Energy/Environment§ Telecom #Consulting§ Software/IT§ GAFAM§ eCommerce/Marketplace§ Finance/Insurance§ Agrifood§ Health§ Transportation/Mobility§ Retail/Distribution§ Luxury/Fashion§ Heavy industry§ Industry/Manufacturing§ Defense/Aeronautics§ Tourism/Hospitality/Leisure§ Real Estate/Construction
EV
43.8% of monitored deals are associated to an Enterprise Value in thesample. We believe most of the remaining 56.2% transactions value targetsbetween €0m and €20m.
We could have communicated on disclosed valuations only to computeaverage deal size. But this method is likely to inflate averages since majoracquisitions tend to be communicated much more than long-tail transactions.Therefore, we assumed an avg. deal size per undisclosed valuation of€10m.

Tech Exit Transaction Multiples - Europe 2018 Edition© 2018 Avolta Partners // www.avoltapartners.com
European Trends

Tech Exit Transaction Multiples - Europe 2018 Edition© 2018 Avolta Partners // www.avoltapartners.com 7
Tech Exits are steadily increasing in EuropeEuropean Trends
25 917,328 791,2 28 348,5
36 019,838 878,4
46 491,7
0
100
200
300
400
500
600
0,0
5 000,0
10 000,0
15 000,0
20 000,0
25 000,0
30 000,0
35 000,0
40 000,0
45 000,0
50 000,0
55 000,0
2015-S1 2015-S2 2016-S1 2016-S2 2017-S1 2017-S2
Amount (€m) No. of deals
71.6
Avg. deal size (€m)
74.2 79.6 88.5 91.1 95.1

Tech Exit Transaction Multiples - Europe 2018 Edition© 2018 Avolta Partners // www.avoltapartners.com 8
M&A is driving the European Tech Exit marketEuropean Trends
Most Tech majority transactions are M&A ExitsTech M&A Exits are driven by young acquirers and dynamic European PE
§ The median time-to-exit through an M&A transaction is notably short: 6.4 years vs. 9.9years for Sponsor/IPO. The direct consequence is a smaller median TTM (Trailing TwelveMonths) revenue at exit : €2.3m vs. €5.6m for Sponsor/IPO.
§ Despite their youth, Tech companies exiting through M&A show smaller growth (17.5%vs 19.7% for Sponsor/IPO) and yet higher valuation multiples (4.4x vs 4.1x forSponsor/IPO).
§ These two reasons (exiting sooner and with higher relative valuation) explain why M&AExits represent 79.9% of total Tech majority deals in Europe, far beyond Sponsor (5.0%)and IPO (4.1%). This trend is confirmed YoY with the median time-to-exit reaching arecord low 5.5 years in 2017 for a median €2.92m TTM revenue.
§ For the remaining startups going for LBO transactions and IPO, they seem todemonstrate remarkable growth and critical size and are more likely to have beensupported by Private Equity (87.5% vs. 54.4% for M&A Exist) before reaching their Exit.
What does it take to make an M&A Exit?European Tech companies exit sooner YoY
M&A transactions
Exit transactions
Non M&A Exits 7.5%IPOSponsorLiquidationMBO
M&A Exits79.9%
Secondary M&A11.0%
Secondary Sponsor1.6%
3,12 3,11
2,92
0,01,02,03,04,05,06,07,08,0
2,8
2,9
2,9
3,0
3,0
3,1
3,1
3,2
2015 2016 2017
Target median TTM revenue (€m) Target median age (years)Non M&A Exits M&A Exits Secondary M&A
Annual growth 19,7% 17,5% 6,8%
Med. TTM revenue (€m) 5,6 2,3 21,9
Med. age (years) 9,9 6,4 13,5
EV/TTM Revenue 4,1x 4,4x 1,4x
% PE-backed 87,5% 54,4% 41,9%
Tech Exit Transaction Multiples - Europe 2018 Edition© 2018 Avolta Partners // www.avoltapartners.com 9
Sponsor acquisition dealsResearch note
If a company is acquired for its Tech, it is likely to have been PE-backed
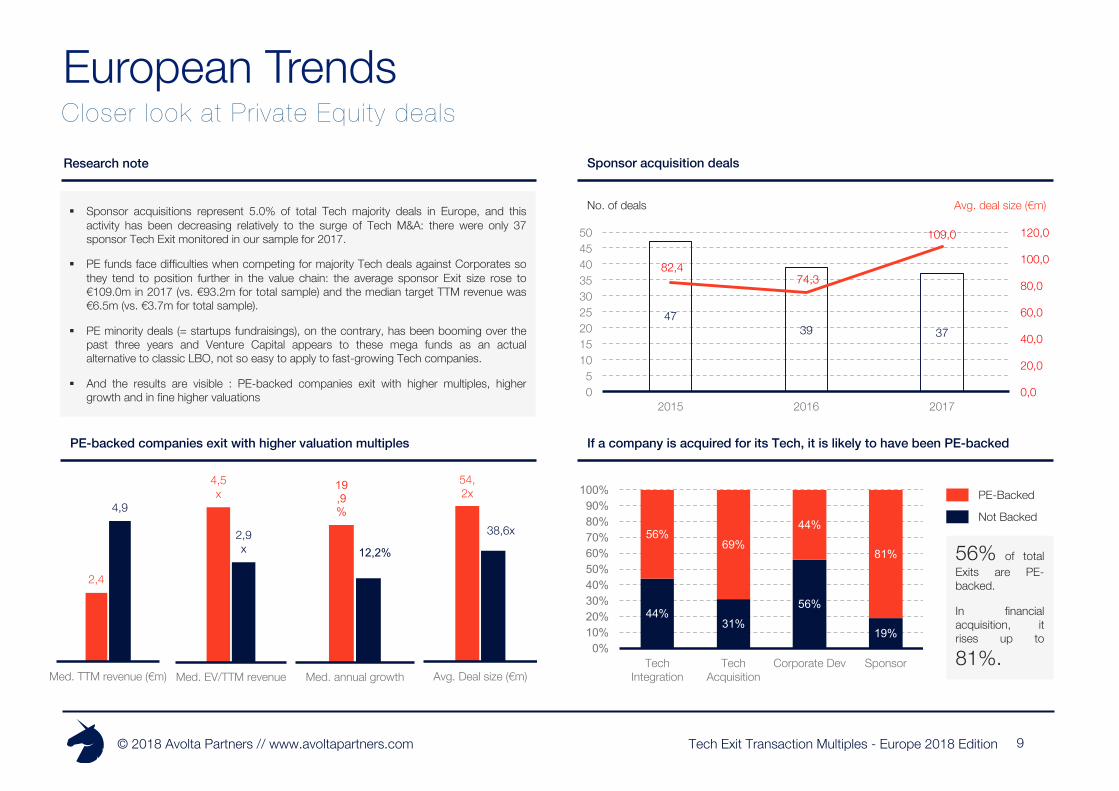
§ Sponsor acquisitions represent 5.0% of total Tech majority deals in Europe, and thisactivity has been decreasing relatively to the surge of Tech M&A: there were only 37sponsor Tech Exit monitored in our sample for 2017.
§ PE funds face difficulties when competing for majority Tech deals against Corporates sothey tend to position further in the value chain: the average sponsor Exit size rose to€109.0m in 2017 (vs. €93.2m for total sample) and the median target TTM revenue was€6.5m (vs. €3.7m for total sample).
§ PE minority deals (= startups fundraisings), on the contrary, has been booming over thepast three years and Venture Capital appears to these mega funds as an actualalternative to classic LBO, not so easy to apply to fast-growing Tech companies.
§ And the results are visible : PE-backed companies exit with higher multiples, highergrowth and in fine higher valuations
PE-backed companies exit with higher valuation multiples
Closer look at Private Equity dealsEuropean Trends
4739 37
82,474,3
109,0
0,0
20,0
40,0
60,0
80,0
100,0
120,0
05
101520253035404550
2015 2016 2017
No. of deals Avg. deal size (€m)
44%31%
56%
19%
56%69%
44%
81%
0%10%20%30%40%50%60%70%80%90%100%
Tech Integration
Tech Acquisition
Corporate Dev Sponsor
Not Backed
PE-Backed
2,4
4,9
Med. TTM revenue (€m)
4,5x
2,9x
Med. EV/TTM revenue
19,9%
12,2%
Med. annual growth
54,2x
38,6x
Avg. Deal size (€m)
56% of totalExits are PE-backed.
In financialacquisition, itrises up to
81%.
Tech Exit Transaction Multiples - Europe 2018 Edition© 2018 Avolta Partners // www.avoltapartners.com
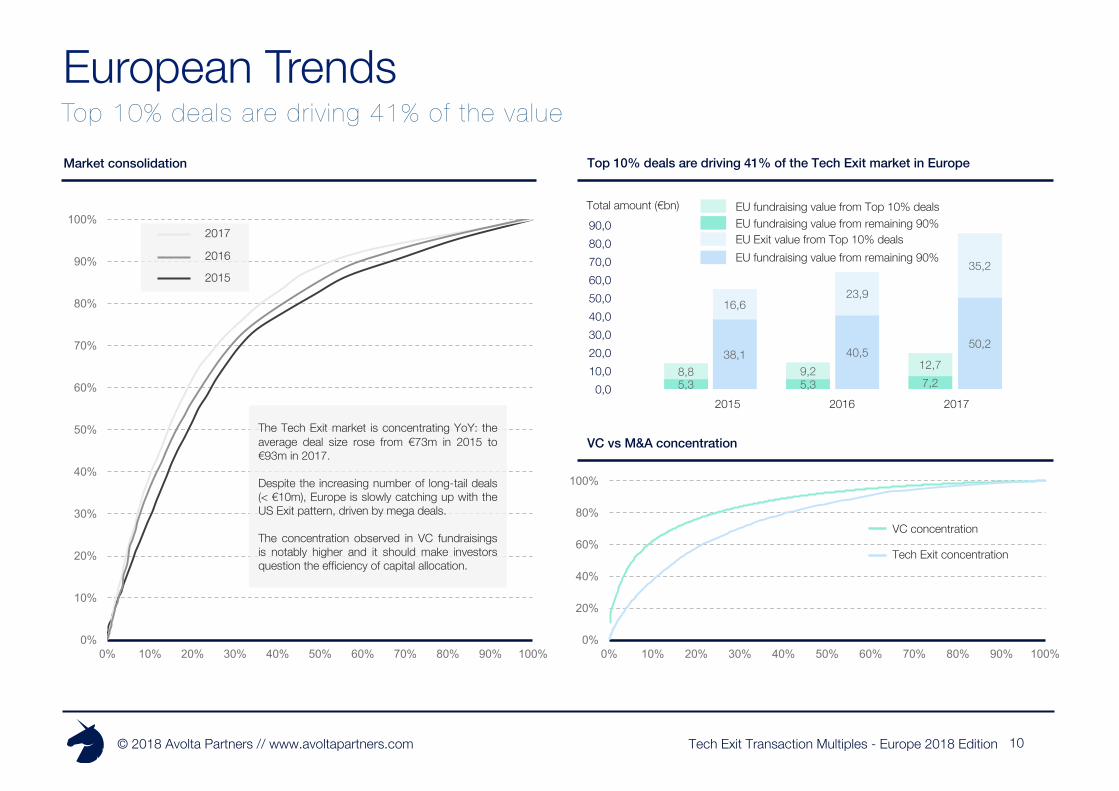
5,3 5,3 7,2 8,8 9,2 12,7
0,0 10,0 20,0 30,0 40,0 50,0 60,0 70,0 80,0 90,0
10
European TrendsTop 10% deals are driving 41% of the value
0%
10%
20%
30%
40%
50%
60%
70%
80%
90%
100%
0% 10% 20% 30% 40% 50% 60% 70% 80% 90% 100%
2016
2017
2015
0%
20%
40%
60%
80%
100%
0% 10% 20% 30% 40% 50% 60% 70% 80% 90% 100%
Top 10% deals are driving 41% of the Tech Exit market in Europe Market consolidation
VC vs M&A concentration
38,1 40,5 50,2
16,6 23,9
35,2
Total amount (€bn)
2015 2016 2017
EU fundraising value from Top 10% dealsEU fundraising value from remaining 90%EU Exit value from Top 10% dealsEU fundraising value from remaining 90%
VC concentration
Tech Exit concentration
The Tech Exit market is concentrating YoY: theaverage deal size rose from €73m in 2015 to€93m in 2017.
Despite the increasing number of long-tail deals(< €10m), Europe is slowly catching up with theUS Exit pattern, driven by mega deals.
The concentration observed in VC fundraisingsis notably higher and it should make investorsquestion the efficiency of capital allocation.
Tech Exit Transaction Multiples - Europe 2018 Edition© 2018 Avolta Partners // www.avoltapartners.com 11
% annual deals
No. of deals (relative)No. of deals (absolute)
Invested amount (absolute)Invested amount (absolute)
No. of deals
Sum of Deal amount (€bn) % respective sum amount over total B2B/B2C deals
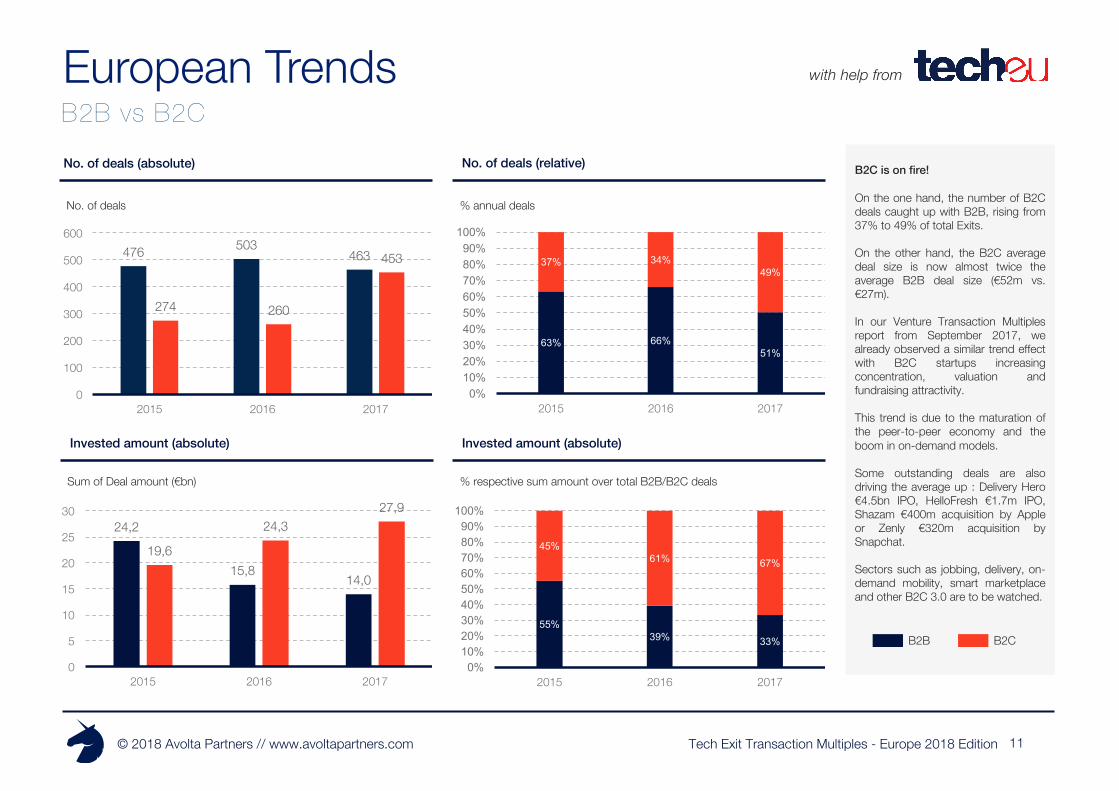
63% 66%51%
37% 34%49%
0%10%20%30%40%50%60%70%80%90%100%
2015 2016 2017
55%39% 33%
45%61% 67%
0%10%20%30%40%50%60%70%80%90%100%
2015 2016 2017
B2B vs B2CEuropean Trends
B2C is on fire!
On the one hand, the number of B2Cdeals caught up with B2B, rising from37% to 49% of total Exits.
On the other hand, the B2C averagedeal size is now almost twice theaverage B2B deal size (€52m vs.€27m).
In our Venture Transaction Multiplesreport from September 2017, wealready observed a similar trend effectwith B2C startups increasingconcentration, valuation andfundraising attractivity.
This trend is due to the maturation ofthe peer-to-peer economy and theboom in on-demand models.
Some outstanding deals are alsodriving the average up : Delivery Hero€4.5bn IPO, HelloFresh €1.7m IPO,Shazam €400m acquisition by Appleor Zenly €320m acquisition bySnapchat.
Sectors such as jobbing, delivery, on-demand mobility, smart marketplaceand other B2C 3.0 are to be watched.
B2CB2B
24,2
15,814,0
19,6
24,327,9
0
5
10
15
20
25
30
2015 2016 2017
476 503463
274 260
453
0
100
200
300
400
500
600
2015 2016 2017
with help from
Tech Exit Transaction Multiples - Europe 2018 Edition© 2018 Avolta Partners // www.avoltapartners.com
Ranking Hub name Number of deals % cluster
1 London 488 51,8%2 Paris 154 62,6%3 Stockholm 88 27,2%4 Dublin 76 8,0%5 Berlin 70 18,0%6 Zurich 51 25,4%7 Munich 45 12.0%8 Amsterdam 42 24,2%9 Milan 14 11,1%10 Barcelone 13 10,5%
Research note
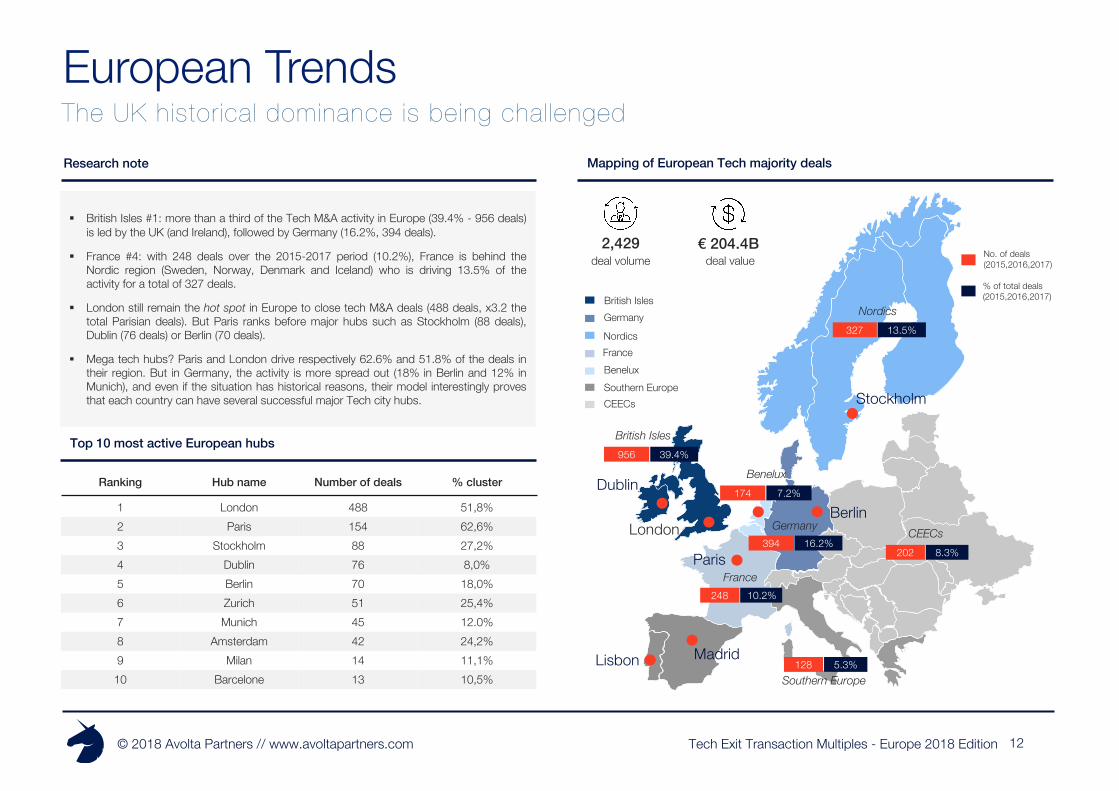
§ British Isles #1: more than a third of the Tech M&A activity in Europe (39.4% - 956 deals)is led by the UK (and Ireland), followed by Germany (16.2%, 394 deals).
§ France #4: with 248 deals over the 2015-2017 period (10.2%), France is behind theNordic region (Sweden, Norway, Denmark and Iceland) who is driving 13.5% of theactivity for a total of 327 deals.
§ London still remain the hot spot in Europe to close tech M&A deals (488 deals, x3.2 thetotal Parisian deals). But Paris ranks before major hubs such as Stockholm (88 deals),Dublin (76 deals) or Berlin (70 deals).
§ Mega tech hubs? Paris and London drive respectively 62.6% and 51.8% of the deals intheir region. But in Germany, the activity is more spread out (18% in Berlin and 12% inMunich), and even if the situation has historical reasons, their model interestingly provesthat each country can have several successful major Tech city hubs.
Top 10 most active European hubs
Mapping of European Tech majority deals
European TrendsThe UK historical dominance is being chal lenged
Paris
Lisbon Madrid
Stockholm
London
Dublin
Berlin
248France
10.2%
8.3%202
CEECs
5.3%128Southern Europe
13.5%327
Nordics
39.4%956
British Isles
16.2%394Germany
7.2%174
Benelux
2,429deal volume
€ 204.4Bdeal value
British IslesGermany
NordicsFranceBeneluxSouthern EuropeCEECs
No. of deals (2015,2016,2017)
% of total deals (2015,2016,2017)
12
Tech Exit Transaction Multiples - Europe 2018 Edition© 2018 Avolta Partners // www.avoltapartners.com
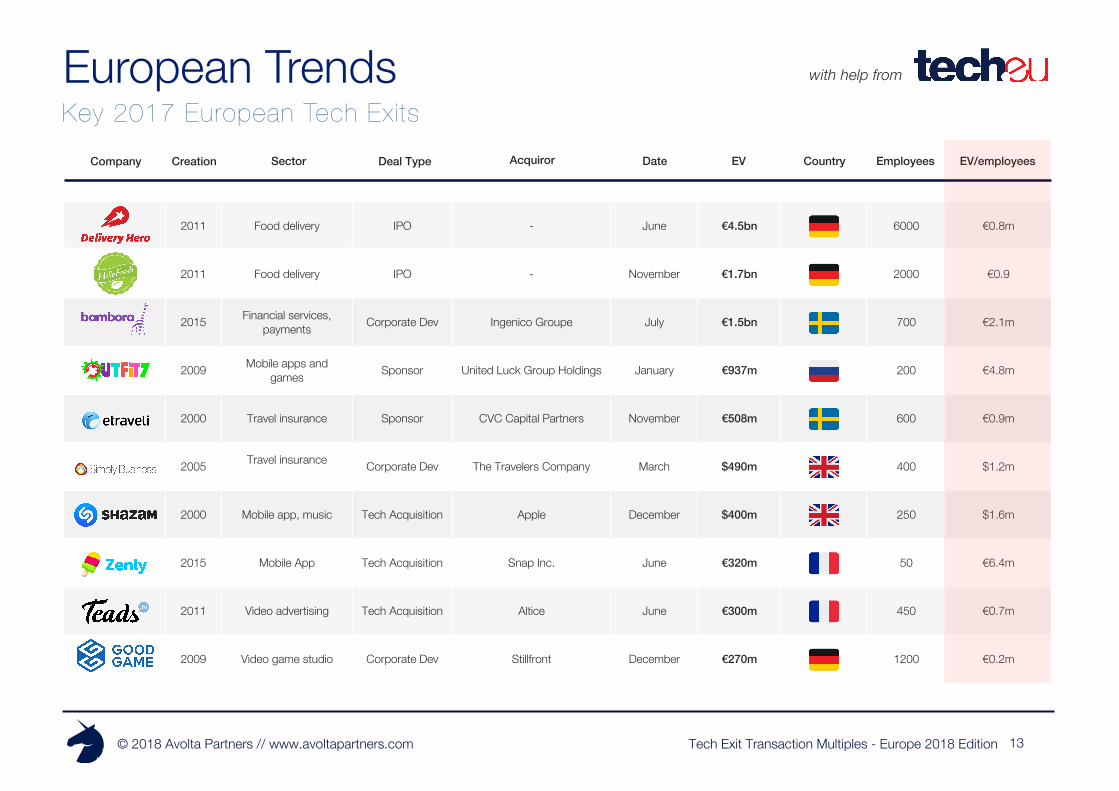
2011 Food delivery IPO - June €4.5bn 6000 €0.8m
2011 Food delivery IPO - November €1.7bn 2000 €0.9
2015 Financial services, payments Corporate Dev Ingenico Groupe July €1.5bn 700 €2.1m
2009 Mobile apps and games Sponsor United Luck Group Holdings January €937m 200 €4.8m
2000 Travel insurance Sponsor CVC Capital Partners November €508m 600 €0.9m
2005 Travel insurance Corporate Dev The Travelers Company March $490m 400 $1.2m
2000 Mobile app, music Tech Acquisition Apple December $400m 250 $1.6m
2015 Mobile App Tech Acquisition Snap Inc. June €320m 50 €6.4m
2011 Video advertising Tech Acquisition Altice June €300m 450 €0.7m
2009 Video game studio Corporate Dev Stillfront December €270m 1200 €0.2m
Company Creation Sector Deal Type Acquiror Date EV Country EV/employeesEmployees
European TrendsKey 2017 European Tech Exits
with help from
13

Tech Exit Transaction Multiples - Europe 2018 Edition© 2018 Avolta Partners // www.avoltapartners.com
102.5
funding efficiencyEV/Total funding
man efficiencyrevenue/employees
0
€3.0m
€0.3m
1 5605405 7.5
€1.0m
€0.1m
€1.5m
€0.5m
European TrendsThe Tech Exits eff iciency matrix
with help from
14
Tech Exit Transaction Multiples - Europe 2018 Edition© 2018 Avolta Partners // www.avoltapartners.com
Who invests and why?
Tech Exit Transaction Multiples - Europe 2018 Edition© 2018 Avolta Partners // www.avoltapartners.com
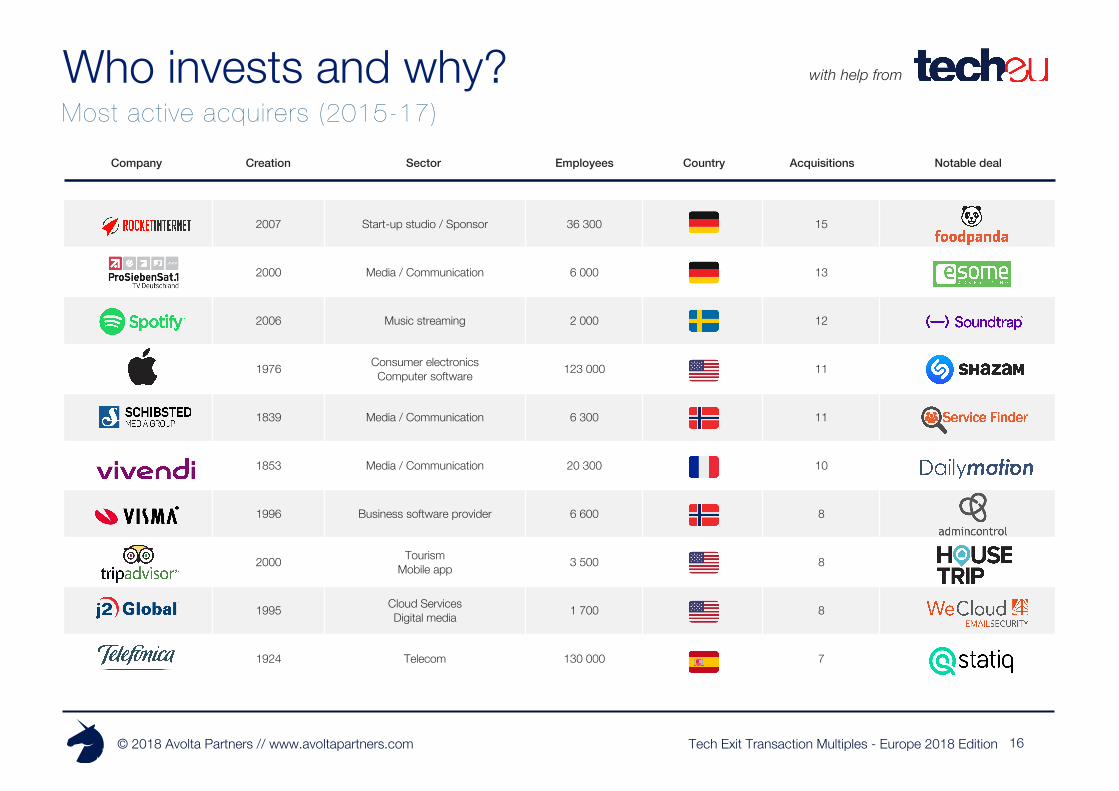
2007 Start-up studio / Sponsor 36 300 15
2000 Media / Communication 6 000 13
2006 Music streaming 2 000 12
1976 Consumer electronicsComputer software 123 000 11
1839 Media / Communication 6 300 11
1853 Media / Communication 20 300 10
1996 Business software provider 6 600 8
2000 TourismMobile app 3 500 8
1995 Cloud ServicesDigital media 1 700 8
1924 Telecom 130 000 7
Company Creation Sector Country AcquisitionsEmployees Notable deal
Most active acquirers (2015-17)Who invests and why? with help from
16

Tech Exit Transaction Multiples - Europe 2018 Edition© 2018 Avolta Partners // www.avoltapartners.com
UK France Germany Nordics Spain Other
UK 55.7% 8.3% 10.1% 3.8% 4.4% 17.7%
France 9.0% 53.3% 9.6% 2.4% 6.6% 19.1%
Germany 5.6% 5.3% 67.3% 1.5% 1.9% 18.4%
Nordics 6.9% 1.6% 6.9% 56.2% 5.7% 22.7%
Spain 8.9% 3.6% 8.9% 0.6% 69.6% 8.7%
USA & Canada 30.2% 11.3% 14.3% 9.3% 6.0% 28.9%
Asia 18.4% 16.0% 21.5% 9.8% 3.7% 30.6%
AcquirersTargets
Europe USA & Canada Asia Other
69.7%
5.8%
24.1%
0.4%
73.4%
4.2%
21.9%
0.5%
74.2%
4.1%
21.1%
0.6%
201720162015
Acquirers geography breakdown
Cross-border analysis
§ The majority of domestic acquisitions (European companies acquired by Europeanplayers) were also domestic deals.
§ Spanish acquirers are leading the trend as their domestic deals accounted for almost70% of their acquisitions. Germany closely follows, with 67.3% of German-Germanacquisitions, then comes the Nordics (56.2%).
§ French acquirers, though, are leading more cross-border deals: 9.6% targets wereGerman, 9% were from the UK, while almost ¼ of their acquisitions aimed startups fromthe CEECs, Southern Europe or Benelux.
§ Finally, the US and Asia have their own preferences in Europe: North-American acquirerschose 30.2% of their European targets in the UK while Asian acquirers are notablyinvesting in Germany (21.5% of their European acquisitions).
§ The proportion of Tech Exits driven by European players rose from 69.7% in 2015 to74.2% in 2017. This goes against the common theory about Europe needing MarshallPlan to guarantee liquidity to its Tech VC investments. This is good news for the OldContinent even if figures are based on deals volume and not value here.
§ Transatlantic deals (European target acquired by a North American acquirer) represent anaverage 22.4% of the European-based acquisition over the 2015-2017 period. However,the trend seems to decrease slowly due to the growing proportion of European–centricacquisitions. With no surprise, the US drives more than 96% of those deals.
§ Asia represented 4.1% of 2017 total European deals, up from 5.8% in 2015. AmongAsian countries, Japan shows a great appetite for European startups (34%), before China(29%) or Hong-Kong (14%).
Cross-border deals and funds originWho invests and why?
17
Tech Exit Transaction Multiples - Europe 2018 Edition© 2018 Avolta Partners // www.avoltapartners.com
4,0 8,0 16,0
18
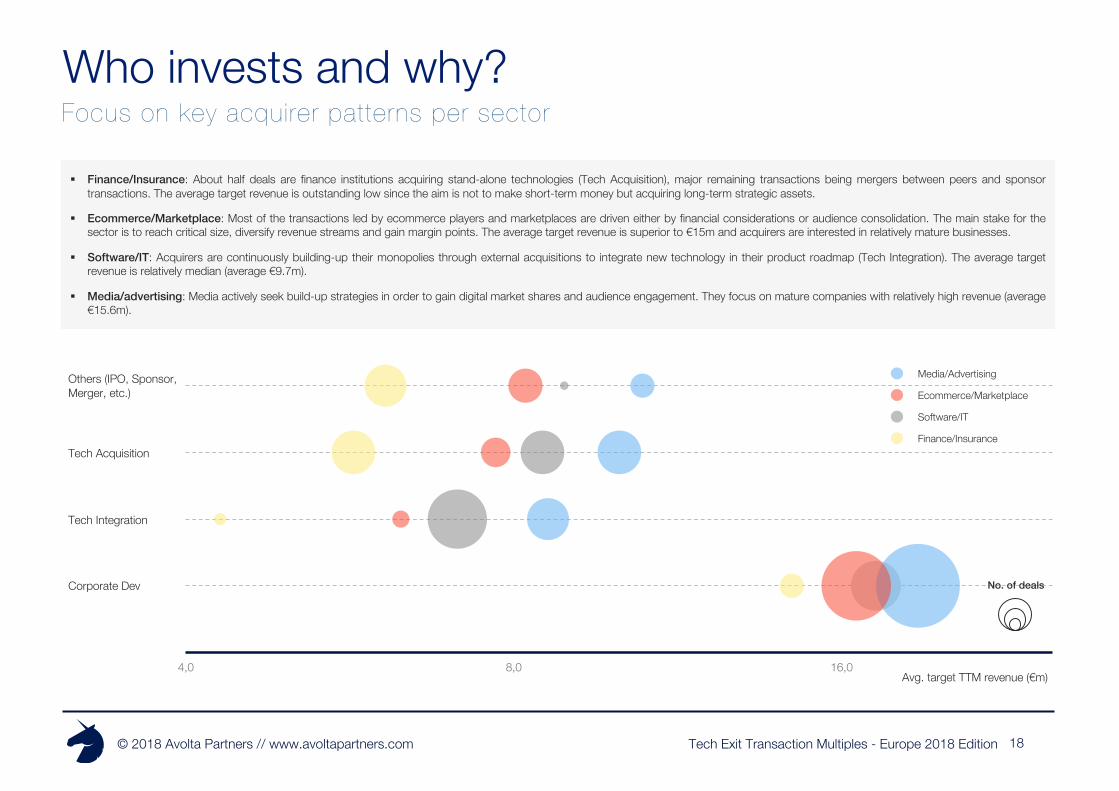
Focus on key acquirer patterns per sectorWho invests and why?
Others (IPO, Sponsor, Merger, etc.)
Tech Acquisition
Tech Integration
Corporate Dev
Avg. target TTM revenue (€m)
No. of deals
Media/Advertising
Ecommerce/Marketplace
Software/IT
Finance/Insurance
§ Finance/Insurance: About half deals are finance institutions acquiring stand-alone technologies (Tech Acquisition), major remaining transactions being mergers between peers and sponsortransactions. The average target revenue is outstanding low since the aim is not to make short-term money but acquiring long-term strategic assets.
§ Ecommerce/Marketplace: Most of the transactions led by ecommerce players and marketplaces are driven either by financial considerations or audience consolidation. The main stake for thesector is to reach critical size, diversify revenue streams and gain margin points. The average target revenue is superior to €15m and acquirers are interested in relatively mature businesses.
§ Software/IT: Acquirers are continuously building-up their monopolies through external acquisitions to integrate new technology in their product roadmap (Tech Integration). The average targetrevenue is relatively median (average €9.7m).
§ Media/advertising: Media actively seek build-up strategies in order to gain digital market shares and audience engagement. They focus on mature companies with relatively high revenue (average€15.6m).

Tech Exit Transaction Multiples - Europe 2018 Edition© 2018 Avolta Partners // www.avoltapartners.com 19
Who invests and why?
Corporate Dev. transactionsrepresent more than two third oftotal deals in Exits.
The invested amount in TechAcquisitions deals has been multipliedby 4 over the past 3 years, driving theoverall growth of the Exit market.
2017 losers
Facing this strong rise in TechAcquisitions, both IPO and TechIntegration deals have lost ground. In2017, IPO only accounted for 13% oftotal Exit value and Tech Integrationfor 11%.
Though, with an EV/Sales ratio 3 to 10times higher than its counterparts, theIPO Exits are particularly well-valued.
Sponsor and Liquidation take time
On average, Sponsor deals need 182months before Exit and Liquidation160; whereas less than 100 monthsare required to seduce Corp. Devacquirers.
Tech Integration remains a mannafrom heaven
Those deals take only 105 months toExit with a relatively high multiple(more than 30x EV/Sales!).0,5%
6,4%
4,5%
12,5%
7,8%
68,5%
1,0%
22,8%
2,0%
17,5%
15,0%
45,8%
Liquidation
IPO
Sponsor
Tech Acquisition
Tech Integration
Corporate Dev
0,0
4,0
8,0
12,0
16,0
20,0
24,0
85 105 125 145 165 185
Avg. TTM revenue (€m)
Time to Exit (in months)
Invested amount (€m) % annual invested amount
33%49% 55%
22%12% 11%
11%14% 28%
33%22%
13%
0%10%20%30%40%50%60%70%80%90%100%
2015 2016 2017
16,6 29,5
45,0 11,1 7,3
8,9
5,5 8,4
22,4
16,813,2
10,6
0,010,020,030,040,050,060,070,080,090,0
2015 2016 2017
% of total deals% of total TTM revenue
Corporate Dev
Sponsor
EV/Sales
Invested amount per deals
Time to Exit and Size per Deal typeRevenue concentration per deal type
Tech Acquisition
Tech Integration Liquidation
IPO
Tech Integration
Corporate Dev
Sponsor
Tech Acquisition
IPO
Liquidation
Deals Typology
Tech Exit Transaction Multiples - Europe 2018 Edition© 2018 Avolta Partners // www.avoltapartners.com
0% 5% 10% 15% 20% 25% 30% 35%
Before 1917
1917-1927
1927-1937
1937-1947
1947-1957
1957-1967
1967-1977
1977-1987
1987-1997
1997-2007
2007-2017
1985
1986
1987
1988
1989
1990
1991
1992
20
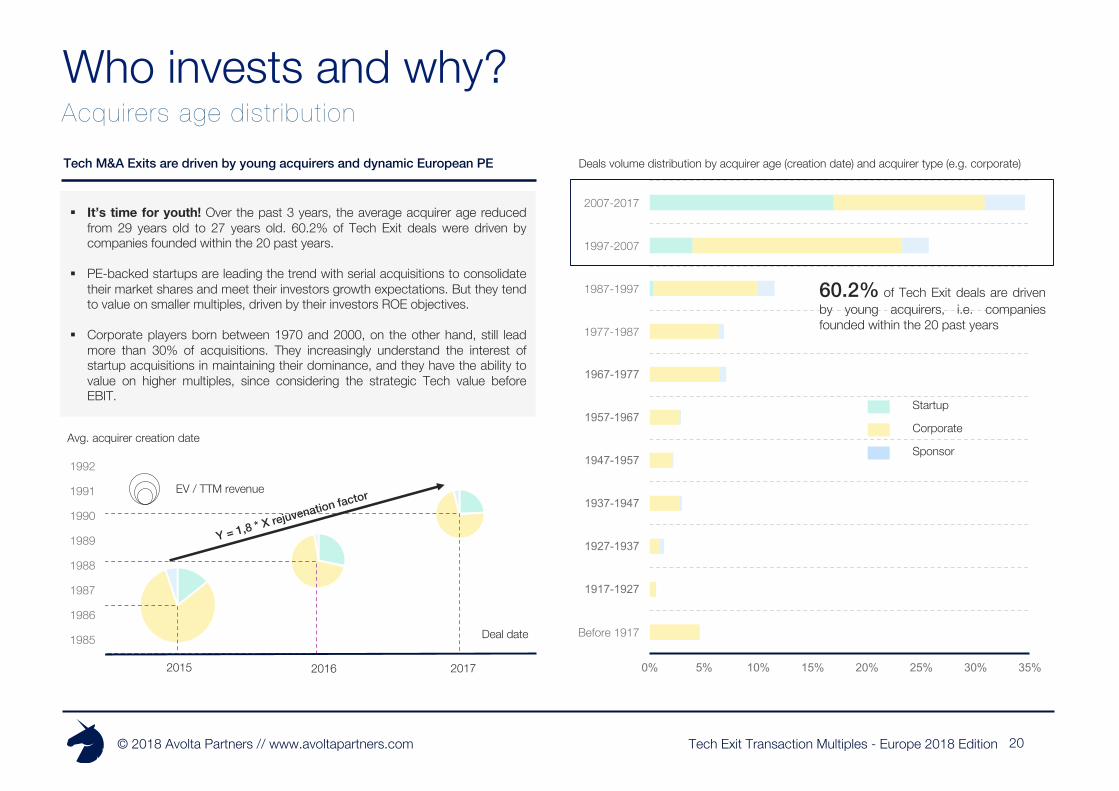
Acquirers age distributionDeals volume distribution by acquirer age (creation date) and acquirer type (e.g. corporate)
60.2% of Tech Exit deals are drivenby young acquirers, i.e. companiesfounded within the 20 past years
Tech M&A Exits are driven by young acquirers and dynamic European PE
§ It’s time for youth! Over the past 3 years, the average acquirer age reducedfrom 29 years old to 27 years old. 60.2% of Tech Exit deals were driven bycompanies founded within the 20 past years.
§ PE-backed startups are leading the trend with serial acquisitions to consolidatetheir market shares and meet their investors growth expectations. But they tendto value on smaller multiples, driven by their investors ROE objectives.
§ Corporate players born between 1970 and 2000, on the other hand, still leadmore than 30% of acquisitions. They increasingly understand the interest ofstartup acquisitions in maintaining their dominance, and they have the ability tovalue on higher multiples, since considering the strategic Tech value beforeEBIT.
Deal date
EV / TTM revenue
2015 2016 2017
Avg. acquirer creation date
Startup
Corporate
Sponsor
Who invests and why?
Tech Exit Transaction Multiples - Europe 2018 Edition© 2018 Avolta Partners // www.avoltapartners.com
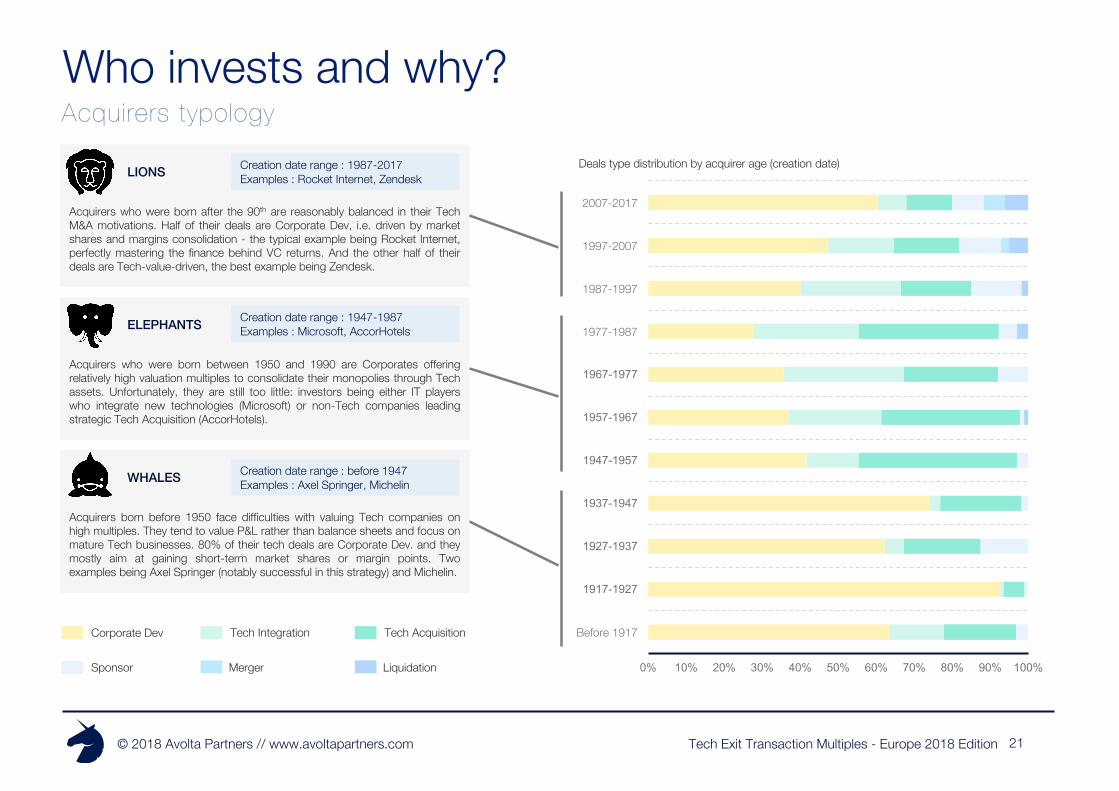
Acquirers who were born after the 90th are reasonably balanced in their TechM&A motivations. Half of their deals are Corporate Dev, i.e. driven by marketshares and margins consolidation - the typical example being Rocket Internet,perfectly mastering the finance behind VC returns. And the other half of theirdeals are Tech-value-driven, the best example being Zendesk.
Acquirers who were born between 1950 and 1990 are Corporates offeringrelatively high valuation multiples to consolidate their monopolies through Techassets. Unfortunately, they are still too little: investors being either IT playerswho integrate new technologies (Microsoft) or non-Tech companies leadingstrategic Tech Acquisition (AccorHotels).
Acquirers born before 1950 face difficulties with valuing Tech companies onhigh multiples. They tend to value P&L rather than balance sheets and focus onmature Tech businesses. 80% of their tech deals are Corporate Dev. and theymostly aim at gaining short-term market shares or margin points. Twoexamples being Axel Springer (notably successful in this strategy) and Michelin.
0% 10% 20% 30% 40% 50% 60% 70% 80% 90% 100%
Before 1917
1917-1927
1927-1937
1937-1947
1947-1957
1957-1967
1967-1977
1977-1987
1987-1997
1997-2007
2007-2017
21
Acquirers typologyDeals type distribution by acquirer age (creation date)LIONS
ELEPHANTS
WHALES
Creation date range : 1987-2017Examples : Rocket Internet, Zendesk
Creation date range : 1947-1987Examples : Microsoft, AccorHotels
Creation date range : before 1947Examples : Axel Springer, Michelin
Who invests and why?
Tech IntegrationCorporate Dev
Sponsor
Tech Acquisition
Merger Liquidation
Tech Exit Transaction Multiples - Europe 2018 Edition© 2018 Avolta Partners // www.avoltapartners.com
Transaction Multiples
Tech Exit Transaction Multiples - Europe 2018 Edition© 2018 Avolta Partners // www.avoltapartners.com 23
Q1 Q3Med.
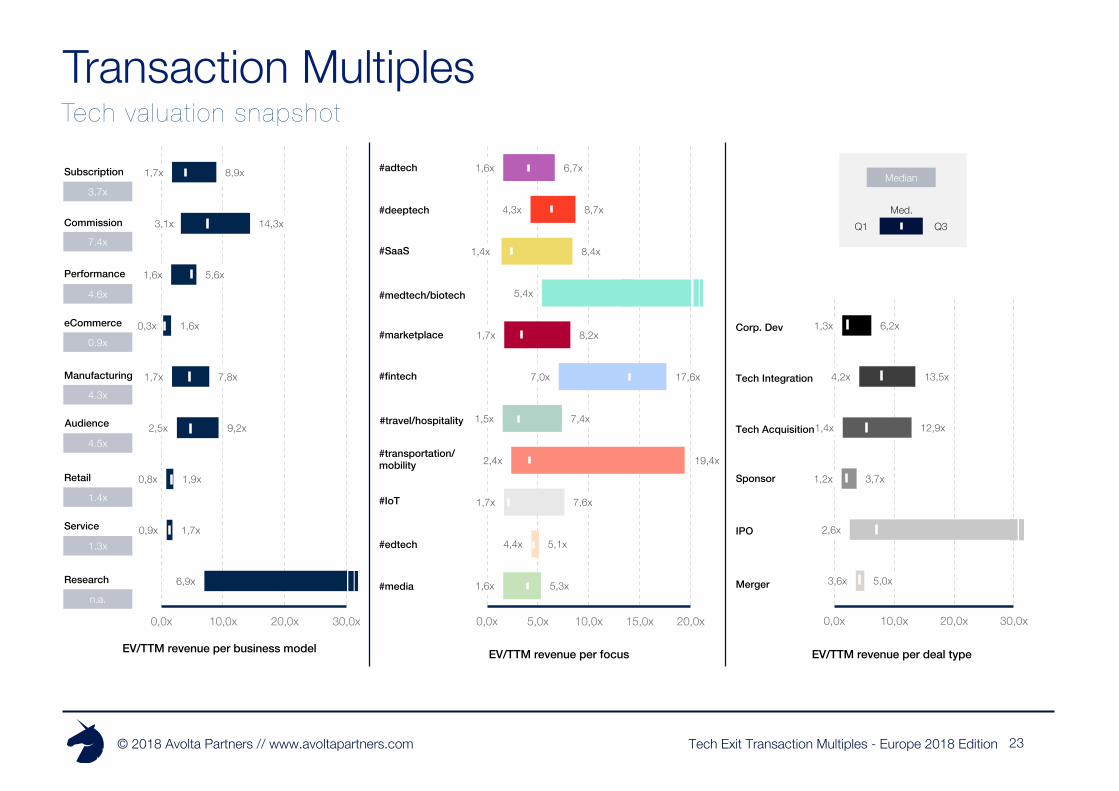
EV/TTM revenue per business model
1,6x
4,4x
1,7x
2,4x
1,5x
7,0x
1,7x
5,4x
1,4x
4,3x
1,6x
5,3x
5,1x
7,6x
19,4x
7,4x
17,6x
8,2x
8,4x
8,7x
6,7x
0,0x 5,0x 10,0x 15,0x 20,0x
#adtech
#medtech/biotech
#marketplace
#fintech
#travel/hospitality
#IoT
#transportation/mobility
#deeptech
#SaaS
#edtech
#media6,9x
0,9x
0,8x
2,5x
1,7x
0,3x
1,6x
3,1x
1,7x
1,7x
1,9x
9,2x
7,8x
1,6x
5,6x
14,3x
8,9x
0,0x 10,0x 20,0x 30,0x
Subscription
Commission
Performance
eCommerce
Manufacturing
Audience
Research
Retail
Service
EV/TTM revenue per focus
3.7x
7.4x
4.6x
0.9x
4.3x
4.5x
1.4x
1.3x
n.a.
Median
Tech valuation snapshotTransaction Multiples
EV/TTM revenue per deal type
3,6x
2,6x
1,2x
1,4x
4,2x
1,3x
5,0x
3,7x
12,9x
13,5x
6,2x
0,0x 10,0x 20,0x 30,0x
Corp. Dev
Tech Integration
Tech Acquisition
Sponsor
IPO
Merger

Tech Exit Transaction Multiples - Europe 2018 Edition© 2018 Avolta Partners // www.avoltapartners.com
0,0
1,0
2,0
3,0
4,0
5,0
6,0
7,0
8,0
9,0
10,0
45,0 55,0 65,0 75,0 85,0 95,0 105,0 115,0
24
EV/Sales
All roads lead to acquisition
Assessing the median time-to-exit and TTMrevenue shows subsectors can be split into fourcategories:
- The small rabbits : business sectors wherecompanies usually accumulate little income butare acquired early
- The big rabbits : business sectors wherecompanies tend to grow quite fast in terms ofrevenues and are quickly acquired
- The small turtles : business sectors whichshow little revenue and wait quite a long timefor an acquirer
- The big turtles : business sectors able to recordpretty high sales but acquired only at a latestage
Among our different focuses, #biotech/medtechare the archetypal of small turtles as researchbusiness model is by nature not so revenue-generating at first and requires time. In contrast,#hardware models can be described as big turtles:they are acquired quite late but manage to reach ahigh revenue level.
On the other hand, #fintech models are acquiredvery early with little revenue, which is typical from asmall rabbit. #box subscription-based lucrativebusiness are conversely big rabbits.
Transaction MultiplesTech companies race for Exit
#fintech
#ecommerce
#biotech/medtech
#socialmedia
#hardware
#deeptech
#media
#SaaS
#box
#travel/hospitality
#adtech
#marketplace
#transportation/mobility
Big rabbits
Big turtles
Small rabbits
Small turtles
85.0
3.7
Median time-to-exit (in months)
Median TTM revenue (in €m)
Tech Exit Transaction Multiples - Europe 2018 Edition© 2018 Avolta Partners // www.avoltapartners.com
68%
8%
8%
5%5%
6%
#adtechTransaction trendResearch note
Three deals standing out
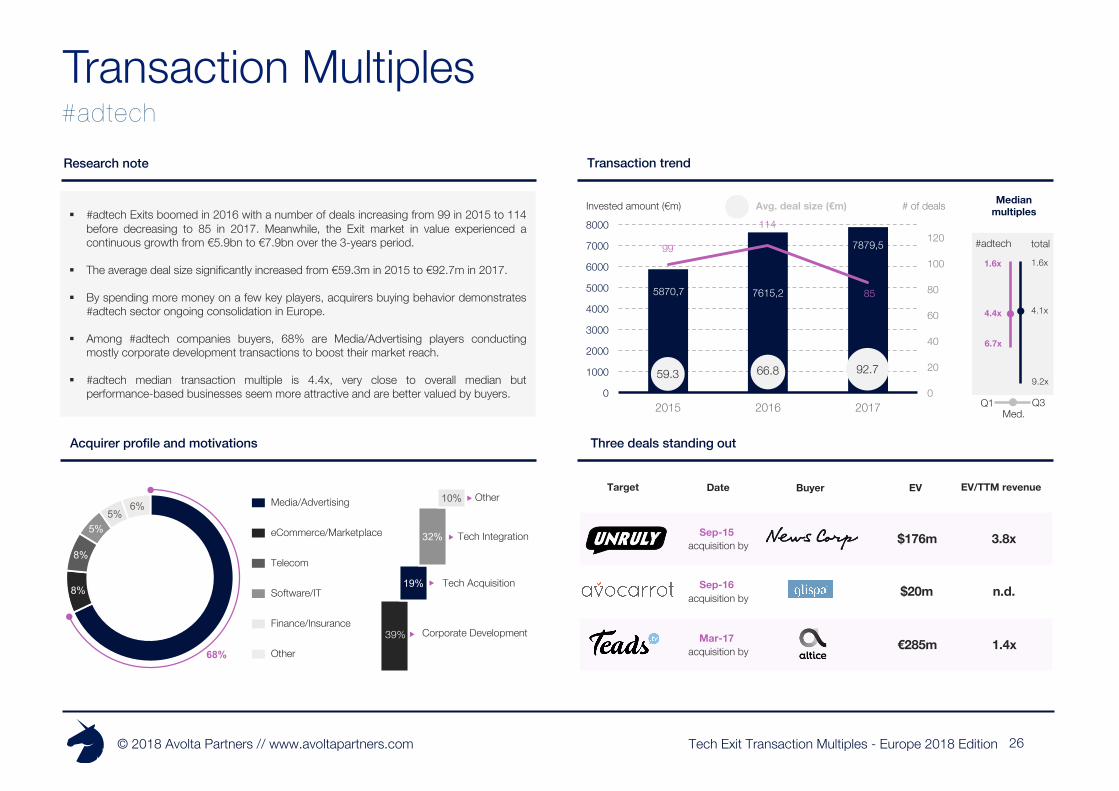
§ #adtech Exits boomed in 2016 with a number of deals increasing from 99 in 2015 to 114before decreasing to 85 in 2017. Meanwhile, the Exit market in value experienced acontinuous growth from €5.9bn to €7.9bn over the 3-years period.
§ The average deal size significantly increased from €59.3m in 2015 to €92.7m in 2017.
§ By spending more money on a few key players, acquirers buying behavior demonstrates#adtech sector ongoing consolidation in Europe.
§ Among #adtech companies buyers, 68% are Media/Advertising players conductingmostly corporate development transactions to boost their market reach.
§ #adtech median transaction multiple is 4.4x, very close to overall median butperformance-based businesses seem more attractive and are better valued by buyers.
Acquirer profile and motivations
19%
32%
10%
39%
$176m
€285m
$20m
acquisition bySep-15
acquisition bySep-16
acquisition byMar-17
EV EV/TTM revenue
1.4x
n.d.
3.8x
Corporate Development
Tech Acquisition
Tech Integration
Other
Telecom
eCommerce/Marketplace
Media/Advertising
Software/IT
Other
Finance/Insurance
9.2x
1.6x
Median multiples
6.7x
1.6x
4.1x4.4x
total#adtech
Med.Q1 Q3
Target Date Buyer
5870,7 7615,2
7879,599
114
85
0
20
40
60
80
100
120
0
1000
2000
3000
4000
5000
6000
7000
8000
2015 2016 2017
59.3 66.8 92.7
Invested amount (€m) Avg. deal size (€m) # of deals
Transaction Multiples
26
Tech Exit Transaction Multiples - Europe 2018 Edition© 2018 Avolta Partners // www.avoltapartners.com
19%
17%
14%12%
7%
31%
#deeptechTransaction trendResearch note
Three deals standing out
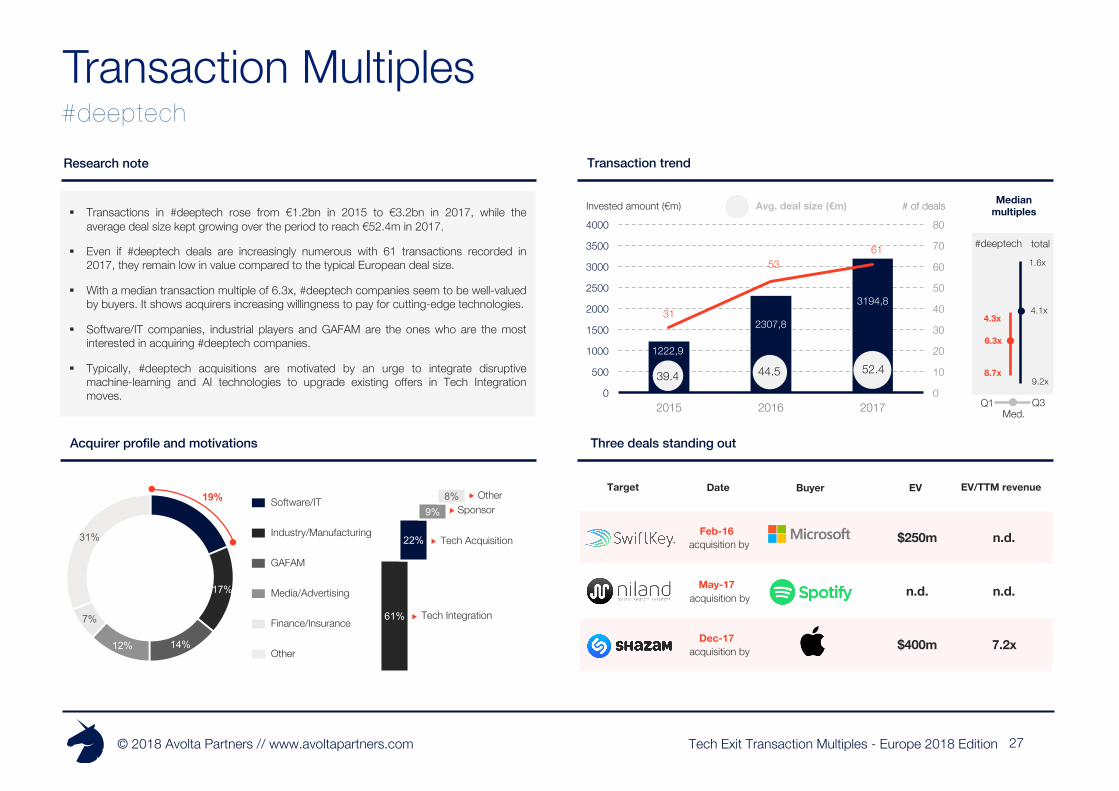
§ Transactions in #deeptech rose from €1.2bn in 2015 to €3.2bn in 2017, while theaverage deal size kept growing over the period to reach €52.4m in 2017.
§ Even if #deeptech deals are increasingly numerous with 61 transactions recorded in2017, they remain low in value compared to the typical European deal size.
§ With a median transaction multiple of 6.3x, #deeptech companies seem to be well-valuedby buyers. It shows acquirers increasing willingness to pay for cutting-edge technologies.
§ Software/IT companies, industrial players and GAFAM are the ones who are the mostinterested in acquiring #deeptech companies.
§ Typically, #deeptech acquisitions are motivated by an urge to integrate disruptivemachine-learning and AI technologies to upgrade existing offers in Tech Integrationmoves.
Acquirer profile and motivations
61%
22%
9%8%
$250m
$400m
n.d.
acquisition byFeb-16
acquisition byMay-17
acquisition byDec-17 7.2x
n.d.
n.d.
Tech Integration
Tech Acquisition
Sponsor
GAFAM
Industry/Manufacturing
Software/IT
Media/Advertising
Other
Finance/Insurance
9.2x
1.6x
6.3x
8.7x
4.1x4.3x
total#deeptech
Other
1222,9
2307,8
3194,831
5361
0
10
20
30
40
50
60
70
80
0
500
1000
1500
2000
2500
3000
3500
4000
2015 2016 2017
39.4 44.5 52.4
Median multiplesInvested amount (€m) Avg. deal size (€m) # of deals
Med.Q1 Q3
EV EV/TTM revenueTarget Date Buyer
Transaction Multiples
27
Tech Exit Transaction Multiples - Europe 2018 Edition© 2018 Avolta Partners // www.avoltapartners.com
23%
18%
11%7%7%
34%
27
#SaaSTransaction trendResearch note
Three deals standing out
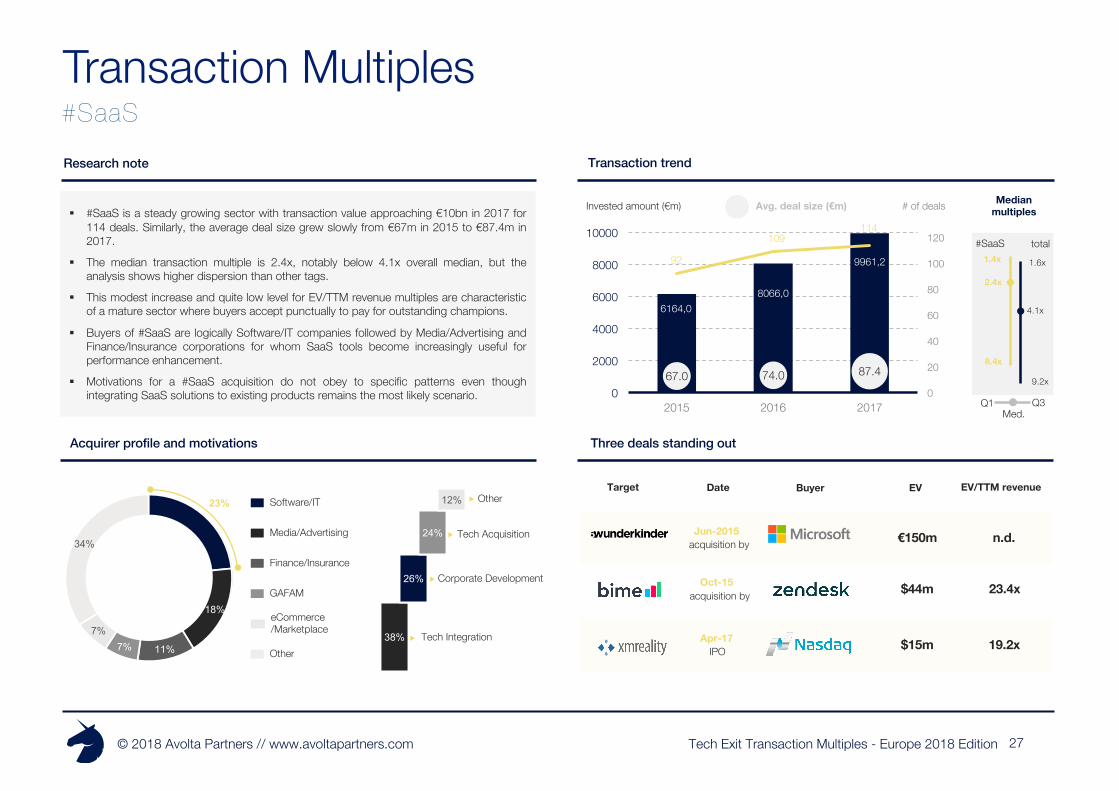
§ #SaaS is a steady growing sector with transaction value approaching €10bn in 2017 for114 deals. Similarly, the average deal size grew slowly from €67m in 2015 to €87.4m in2017.
§ The median transaction multiple is 2.4x, notably below 4.1x overall median, but theanalysis shows higher dispersion than other tags.
§ This modest increase and quite low level for EV/TTM revenue multiples are characteristicof a mature sector where buyers accept punctually to pay for outstanding champions.
§ Buyers of #SaaS are logically Software/IT companies followed by Media/Advertising andFinance/Insurance corporations for whom SaaS tools become increasingly useful forperformance enhancement.
§ Motivations for a #SaaS acquisition do not obey to specific patterns even thoughintegrating SaaS solutions to existing products remains the most likely scenario.
Acquirer profile and motivations
38%
26%
24%
12%
€150m
$15m
$44m
acquisition byJun-2015
acquisition byOct-15
IPOApr-17 19.2x
23.4x
n.d.
Tech Integration
Tech Acquisition
Corporate DevelopmentFinance/Insurance
Media/Advertising
Software/IT
GAFAM
Other
eCommerce/Marketplace
9.2x
1.6x
2.4x
8.4x
4.1x
1.4xtotal#SaaS
Other
6164,08066,0
9961,292
109114
0
20
40
60
80
100
120
0
2000
4000
6000
8000
10000
2015 2016 2017
67.0 74.0 87.4
Median multiplesInvested amount (€m) Avg. deal size (€m) # of deals
Med.Q1 Q3
EV EV/TTM revenueTarget Date Buyer
Transaction Multiples
Tech Exit Transaction Multiples - Europe 2018 Edition© 2018 Avolta Partners // www.avoltapartners.com
34%
20%17%
14%
9%6%
28
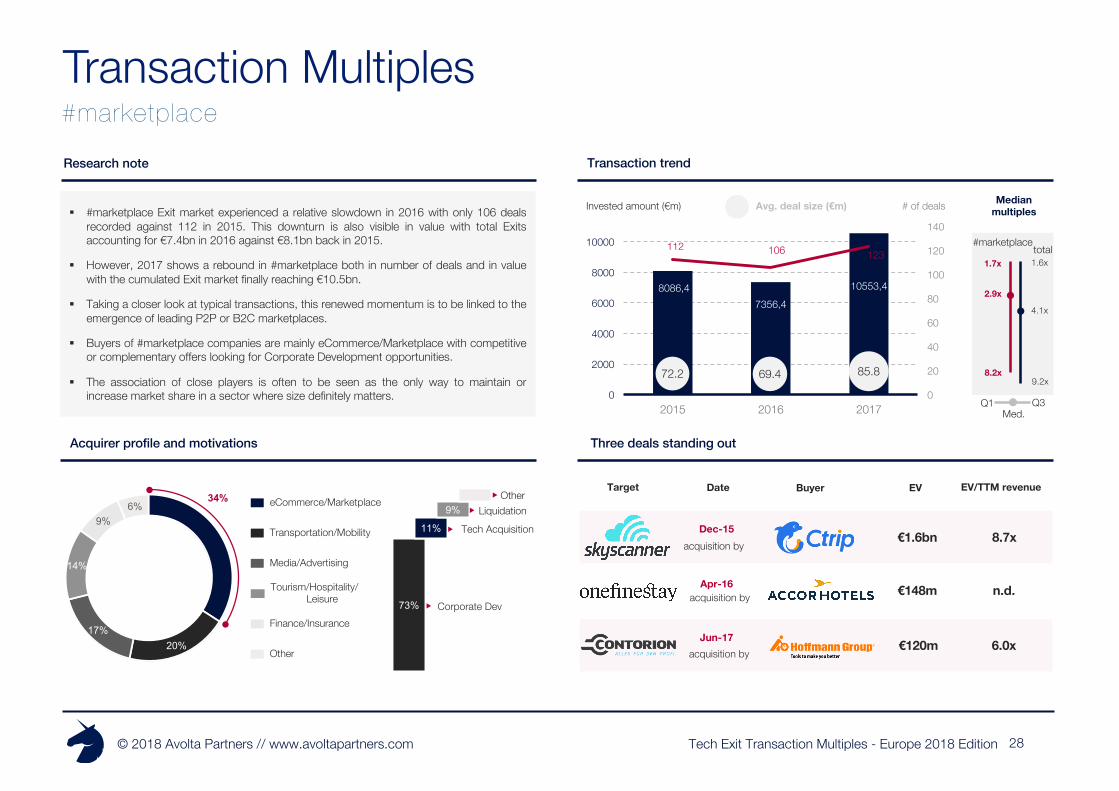
#marketplaceTransaction trendResearch note
Three deals standing out
§ #marketplace Exit market experienced a relative slowdown in 2016 with only 106 dealsrecorded against 112 in 2015. This downturn is also visible in value with total Exitsaccounting for €7.4bn in 2016 against €8.1bn back in 2015.
§ However, 2017 shows a rebound in #marketplace both in number of deals and in valuewith the cumulated Exit market finally reaching €10.5bn.
§ Taking a closer look at typical transactions, this renewed momentum is to be linked to theemergence of leading P2P or B2C marketplaces.
§ Buyers of #marketplace companies are mainly eCommerce/Marketplace with competitiveor complementary offers looking for Corporate Development opportunities.
§ The association of close players is often to be seen as the only way to maintain orincrease market share in a sector where size definitely matters.
Acquirer profile and motivations
73%
11%
9%
€120m
€1.6bn
€148m
acquisition byJun-17
acquisition byApr-16
acquisition byDec-15
8.7x
n.d.
6.0x
Corporate Dev
Tech AcquisitionLiquidation
Other
Media/Advertising
Transportation/Mobility
eCommerce/Marketplace
Tourism/Hospitality/Leisure
Other
Finance/Insurance
9.2x
1.6x
4.1x
8.2x
1.7x
2.9x
total#marketplace
8086,47356,4
10553,4
112 106 123
0
20
40
60
80
100
120
140
0
2000
4000
6000
8000
10000
2015 2016 2017
72.2 69.4 85.8
Median multiplesInvested amount (€m) Avg. deal size (€m) # of deals
Med.Q1 Q3
EV EV/TTM revenueTarget Date Buyer
Transaction Multiples
Tech Exit Transaction Multiples - Europe 2018 Edition© 2018 Avolta Partners // www.avoltapartners.com
74%
14%
6%3%3%
29
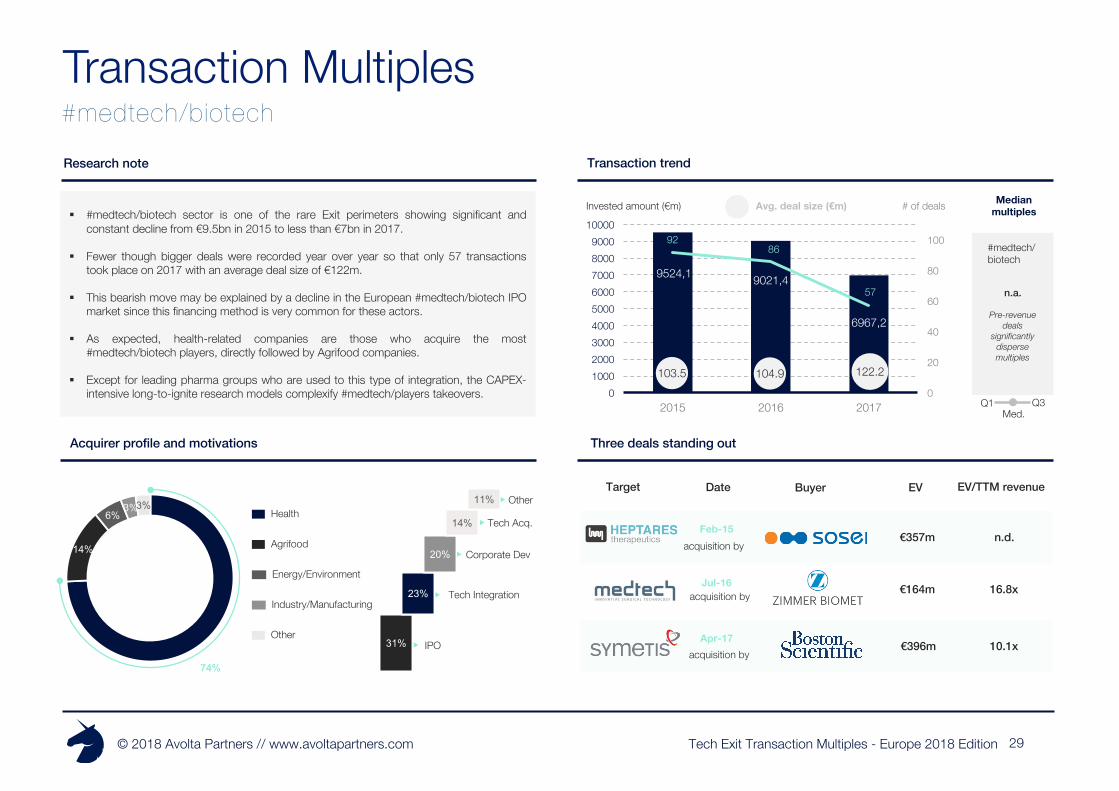
#medtech/biotechTransaction trendResearch note
Three deals standing out
§ #medtech/biotech sector is one of the rare Exit perimeters showing significant andconstant decline from €9.5bn in 2015 to less than €7bn in 2017.
§ Fewer though bigger deals were recorded year over year so that only 57 transactionstook place on 2017 with an average deal size of €122m.
§ This bearish move may be explained by a decline in the European #medtech/biotech IPOmarket since this financing method is very common for these actors.
§ As expected, health-related companies are those who acquire the most#medtech/biotech players, directly followed by Agrifood companies.
§ Except for leading pharma groups who are used to this type of integration, the CAPEX-intensive long-to-ignite research models complexify #medtech/players takeovers.
Acquirer profile and motivations
31%
23%
20%
14%
11%
€396m
€357m
€164m
acquisition byApr-17
acquisition byJul-16
acquisition byFeb-15
n.d.
16.8x
10.1xIPO
Tech Integration
Corporate Dev
Tech Acq.
Energy/Environment
Agrifood
Health
Industry/Manufacturing
Other
Other
#medtech/biotech
n.a.
Pre-revenue deals
significantly disperse multiples
9524,1 9021,4
6967,2
9286
57
0
20
40
60
80
100
0100020003000400050006000700080009000
10000
2015 2016 2017
103.5 122.2104.9
Median multiplesInvested amount (€m) Avg. deal size (€m) # of deals
Med.Q1 Q3
EV EV/TTM revenueTarget Date Buyer
Transaction Multiples
Tech Exit Transaction Multiples - Europe 2018 Edition© 2018 Avolta Partners // www.avoltapartners.com
78%
11%
6%3%2%
30
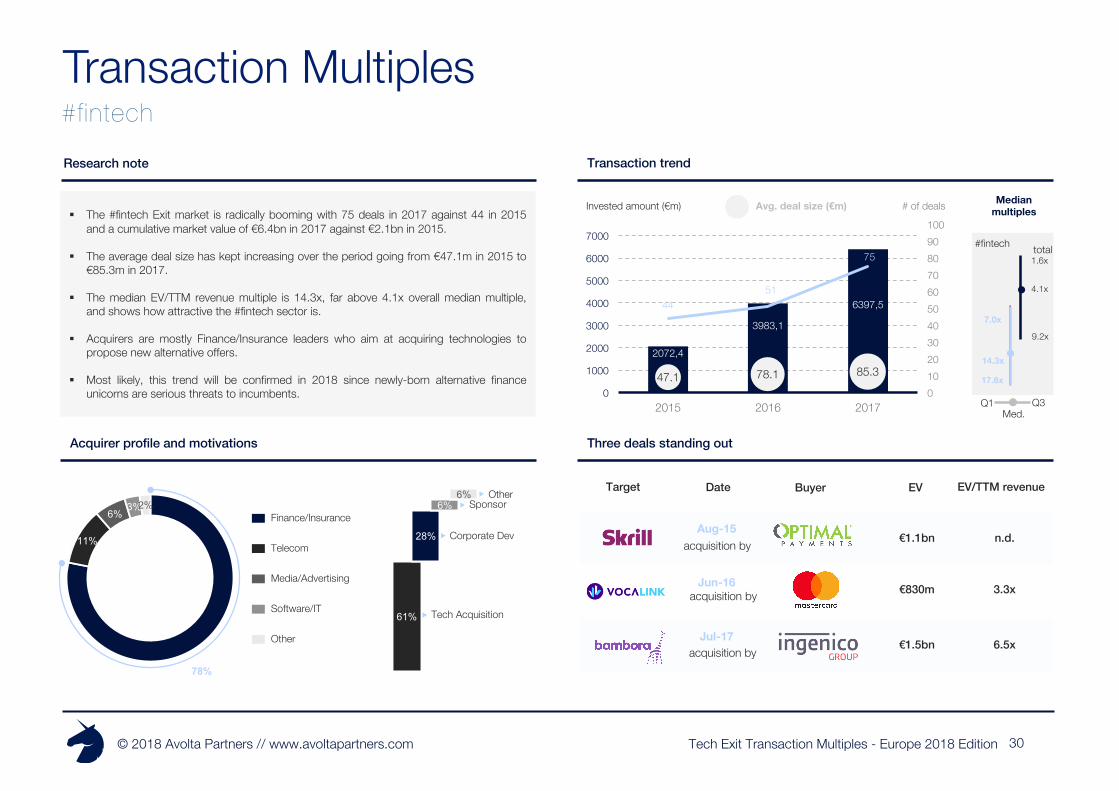
#fintechTransaction trendResearch note
Three deals standing out
§ The #fintech Exit market is radically booming with 75 deals in 2017 against 44 in 2015and a cumulative market value of €6.4bn in 2017 against €2.1bn in 2015.
§ The average deal size has kept increasing over the period going from €47.1m in 2015 to€85.3m in 2017.
§ The median EV/TTM revenue multiple is 14.3x, far above 4.1x overall median multiple,and shows how attractive the #fintech sector is.
§ Acquirers are mostly Finance/Insurance leaders who aim at acquiring technologies topropose new alternative offers.
§ Most likely, this trend will be confirmed in 2018 since newly-born alternative financeunicorns are serious threats to incumbents.
Acquirer profile and motivations
€1.1bn
€1.5bn
€830m 3.3x
n.d.
6.5x
61%
28%
6%6%
Tech Acquisition
Corporate Dev
SponsorOther
Media/Advertising
Telecom
Finance/Insurance
Software/IT
Other
9.2x
1.6x
4.1x
17.6x
7.0x
14.3x
total#fintech
2072,4
3983,1
6397,54451
75
0102030405060708090100
0
1000
2000
3000
4000
5000
6000
7000
2015 2016 2017
47.1 78.1 85.3
Median multiplesInvested amount (€m) Avg. deal size (€m) # of deals
Med.Q1 Q3
EV EV/TTM revenueTarget Date Buyer
acquisition byJul-17
acquisition byJun-16
acquisition byAug-15
Transaction Multiples

Tech Exit Transaction Multiples - Europe 2018 Edition© 2018 Avolta Partners // www.avoltapartners.com
Tech Exit Transaction Multiples - Europe 2018 Edition© 2018 Avolta Partners // www.avoltapartners.com 32
Research teamContact us
Sally NaamaniAnalyst
Jean RoninAnalyst
Charles GombertAnalyst
Arthur PorréCo-founder & Managing Partner
Pascal FarrugiaAssociate
Marianne BeaufilsAnalyst
Evan ProuxHead of Research
Thomas ReygagneHead of Data
Romain MombertAnalyst
Tech Exit Transaction Multiples - Europe 2018 Edition© 2018 Avolta Partners // www.avoltapartners.com 33
External sourcesLeveraging quality data providers

Tech Exit Transaction Multiples - Europe 2018 Edition© 2018 Avolta Partners // www.avoltapartners.com
Disclaimer
The information contained in this report has been produced by Avolta Partners, based on Diane+ data,BODACC legal data and third party information. While Avolta Partners has made every effort to ensure thereliability of the data included in this report, Avolta Partners cannot guarantee the accuracy of the informationcollected and presented. Therefore, the Avolta Partners cannot accept responsibility for any decision made oraction taken based upon this report or the information provided herein.This presentation is for the exclusive use of the people to whom it is addressed and is intended for generalinformation purposes only. It is not intended to constitute legal or other professional advice and should not betreated as such.Appropriate legal advice must be sought before making any decision, taking any action or refraining fromtaking any action in reliance on the information contained in this presentation. does not assume anyresponsibility for any person’s reliance upon the information contained herein.
© Copyright Avolta Partners January 2018
Avolta PartnersWith +50 deals closed in 4 years, Avolta Partners has proven to be the most active M&A boutique inEurope in the Tech Industry. As a result, our team has learned how to maximise the value of a deal –both valuation and legal conditions – thanks to a proven methodology and hard-nosed negotiations.
Tech.euTech.eu is the premier source of European technology news, data analysis and market intelligence. Thecompany keeps track of innovative technologies and interesting startups emerging from Europe, with aparticular focus on monitoring deal activity (funding, M&A transactions, IPOs). Through reports and aweekly subscription newsletter, we share our data and insights with the European technology industry.
Bpifrance Le HubBpifrance Le Hub aims at boosting French innovation by multiplying deals between corporates andstartups (partnerships, investments or M&A) in the tech industry. Since our launch in Apr-15, we haveaccelerated 64 startups, accompanied 60 corporates and intermediated 35+ commercial partnerships.
with help from


![FF-120, Pipe Flange Face Tool - Buffalo Hydraulic...with flange OD facing range 25,4 - 304,8 mm [1 - 12 inch] • Interchangeable collets for ID mounting range 25,4 - 152,4 mm [1-6](https://img.pdfslide.us/doc/110x75/5f1eb9b9fc4524361f37bcca/ff-120-pipe-flange-face-tool-buffalo-hydraulic-with-flange-od-facing-range.jpg)