Embed Size (px)
Citation preview

TECH DATA PARTNER SUMMIT 2015
FEDERAL TECH TRENDS AND OPPORTUNITIES
Jesse Holler Quantitative Analyst Bloomberg Government May 13, 2015

Source: Bloomberg Government proprietary federal procurement database; ITDashboard, President’s FY 2016 budget request
WHAT DOES THE FEDERAL TECH MARKET LOOK LIKE
$62B in IT obligations for fiscal 2014
40% of IT dollars awarded through MACs in fiscal 2014
of proposed IT spending growth from 2015 enacted budget to 2016 request$1.4B
$21B of small-business IT dollars in fiscal 2014

WHAT’STHE BUDGETOUTLOOK?

FY 2013actual
FY 2014actual
FY 2015enacted
FY 2016request
$41$44
$48 $49
FY 2013actual
FY 2014actual
FY 2015enacted
FY 2016request
$32 $31 $30 $31
$5 $6 $6 $7
CIVILIAN AGENCIES WOULD DRIVE GROWTH, WHILE DOD CLASSIFIED WOULD REBOUND
Source: President’s FY 2016 budget request
Civilian fiscal 2016 IT budget request Defense fiscal 2016 IT budget requestUnclassified spending, current dollars in billions Current dollars in billions
5.9% CAGR
0.6% CAGR
ClassifiedUnclassified
$36 $37 $36 $37

MORE I.T. MONEY REQUESTED FOR MOST CIVILIAN AGENCIES
Fiscal 2016 IT budget requestFiscal 2016 IT budget request biggest winners and losers
Current dollars in millions Fiscal 2016 request versus fiscal 2015 enacted
HHS
DHS
Treasury
VA
Transportation
Agriculture
Justice
Commerce
SSA
State
Energy
NASA
Interior
Labor
Education
$11,351
$6,201
$4,503
$4,403
$3,326
$2,789
$2,732
$2,333
$1,694
$1,632
$1,496
$1,390
$1,099
$821
$683
HHS
DHS
Treasury
VA
Transportation
Agriculture
Justice
Commerce
SSA
State
Energy
NASA
Interior
Labor
Education
-10%
4%
19%
5%
6%
3%
4%
8%
7%
15%
-1%
-2%
23%
Note: DHS – Department of Homeland Security, DOL – Department of Labor, DOC – Department of Commerce, SSA – Social Security AdministrationSource: ITDashboard – President’s FY 2016 budget request
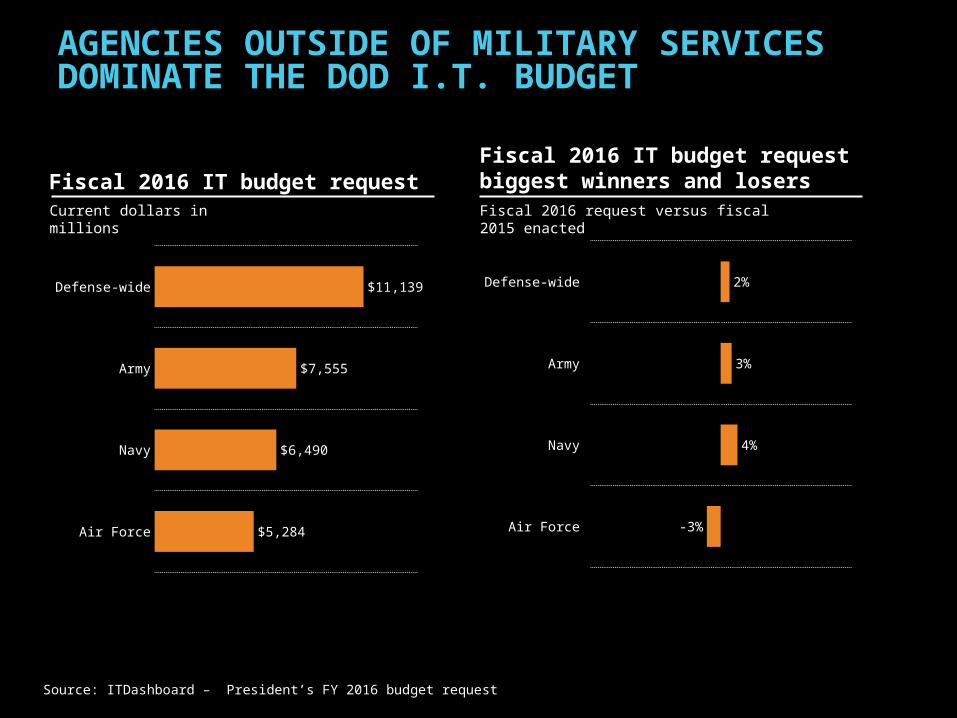
AGENCIES OUTSIDE OF MILITARY SERVICES DOMINATE THE DOD I.T. BUDGET
Fiscal 2016 IT budget requestFiscal 2016 IT budget request biggest winners and losers
Current dollars in millions Fiscal 2016 request versus fiscal 2015 enacted
Defense-wide
Army
Navy
Air Force
$11,139
$7,555
$6,490
$5,284
Defense-wide
Army
Navy
Air Force
2%
3%
4%
-3%
Source: ITDashboard – President’s FY 2016 budget request
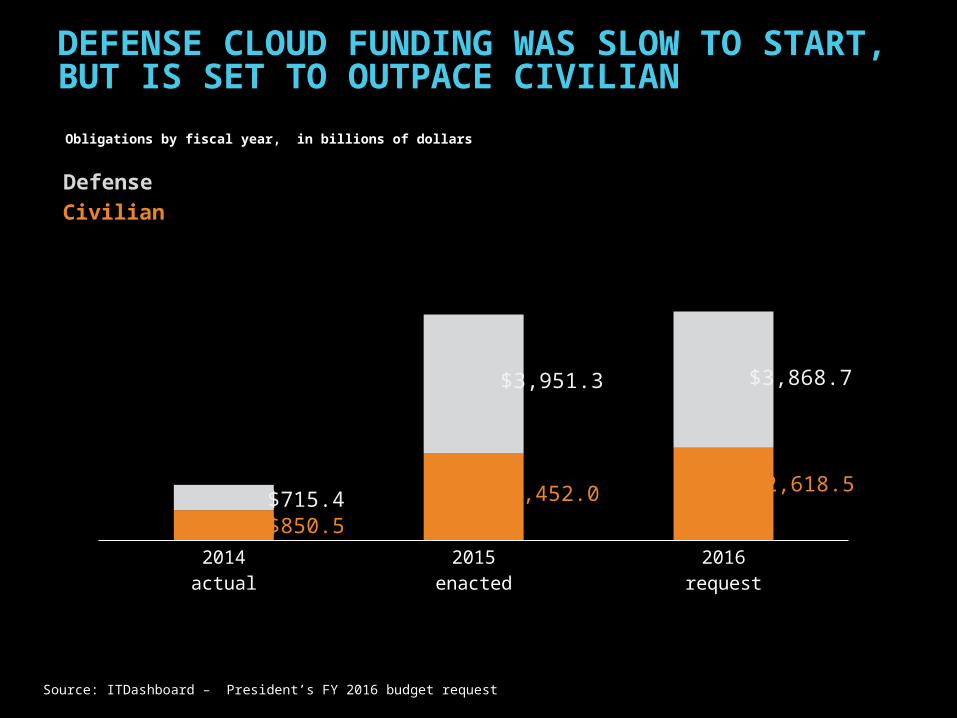
Obligations by fiscal year, in billions of dollars
2014actual
2015enacted
2016request
$850.5
$2,452.0 $2,618.5$715.4
$3,951.3 $3,868.7
Source: ITDashboard – President’s FY 2016 budget request
Defense
Civilian
DEFENSE CLOUD FUNDING WAS SLOW TO START, BUT IS SET TO OUTPACE CIVILIAN
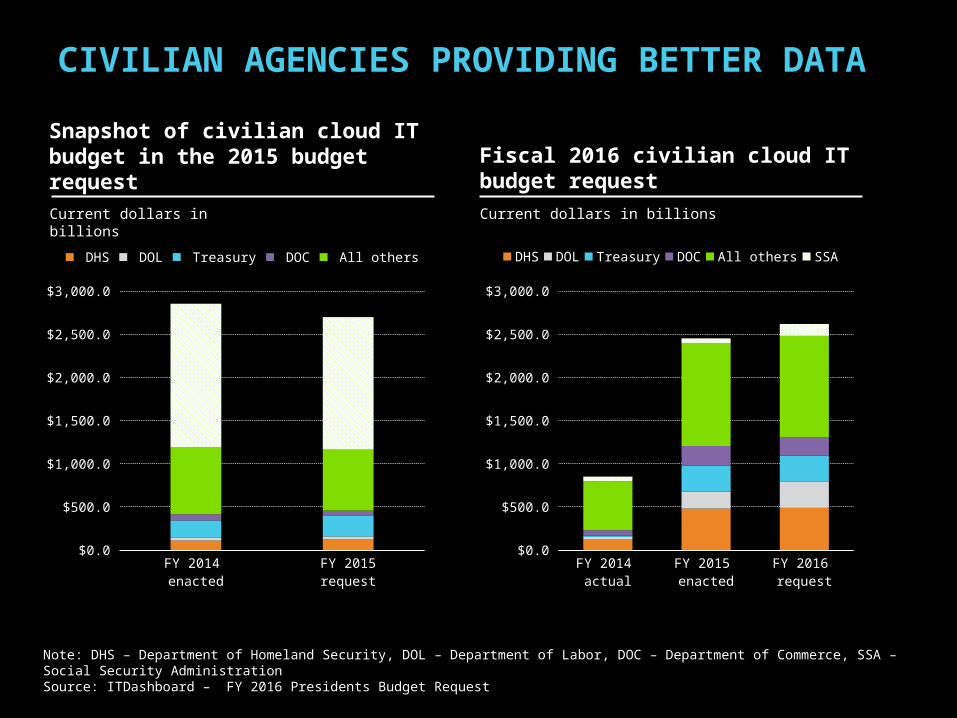
CIVILIAN AGENCIES PROVIDING BETTER DATA
Snapshot of civilian cloud IT budget in the 2015 budget request
Fiscal 2016 civilian cloud IT budget request
FY 2014 actual
FY 2015 enacted
FY 2016 request
$0.0
$500.0
$1,000.0
$1,500.0
$2,000.0
$2,500.0
$3,000.0
DHS DOL Treasury DOC All others SSA
FY 2014 enacted
FY 2015request
$0.0
$500.0
$1,000.0
$1,500.0
$2,000.0
$2,500.0
$3,000.0
DHS DOL Treasury DOC All others SSA
Current dollars in billions Current dollars in billions
Note: DHS – Department of Homeland Security, DOL – Department of Labor, DOC – Department of Commerce, SSA – Social Security AdministrationSource: ITDashboard – FY 2016 Presidents Budget Request

MARKET TRENDS

ALL FEDERAL SPENDING IS BROADLY DOWN
2010 2011 2012 2013 2014
$535,831,637,014
$535,452,513,562 $514,332,91
3,615 $459,855,562,933 $440,227,79
0,389
18 percent decline
Obligations by fiscal year, in billions of dollars
Source: Bloomberg Government proprietary federal procurement database

2010 2011 2012 2013 2014
$369$358
$341$308 $305
$166 $177 $174$152 $135
69 PERCENT OF ALL FEDERAL SPENDING WAS COMPETED IN FISCAL 2014
Not competitive
Competitive
Source: Bloomberg Government proprietary federal procurement database
Obligations by fiscal year, in billions of dollars

Source: Bloomberg Government proprietary federal procurement database
THE TECHNOLOGY MARKET BOTH CONTRASTS AND MIRRORS THE WIDER FEDERAL MARKET
$2B increase in IT obligations from fiscal 2013 to 2014
75% of IT dollars awarded competitively in fiscal 2014
more is spent on defense IT than civilian IT$10B
Note: Technology obligations are defined as the BGOV Markets “Technology Services” and “Technology Equipment” Source: Bloomberg Government proprietary federal procurement database
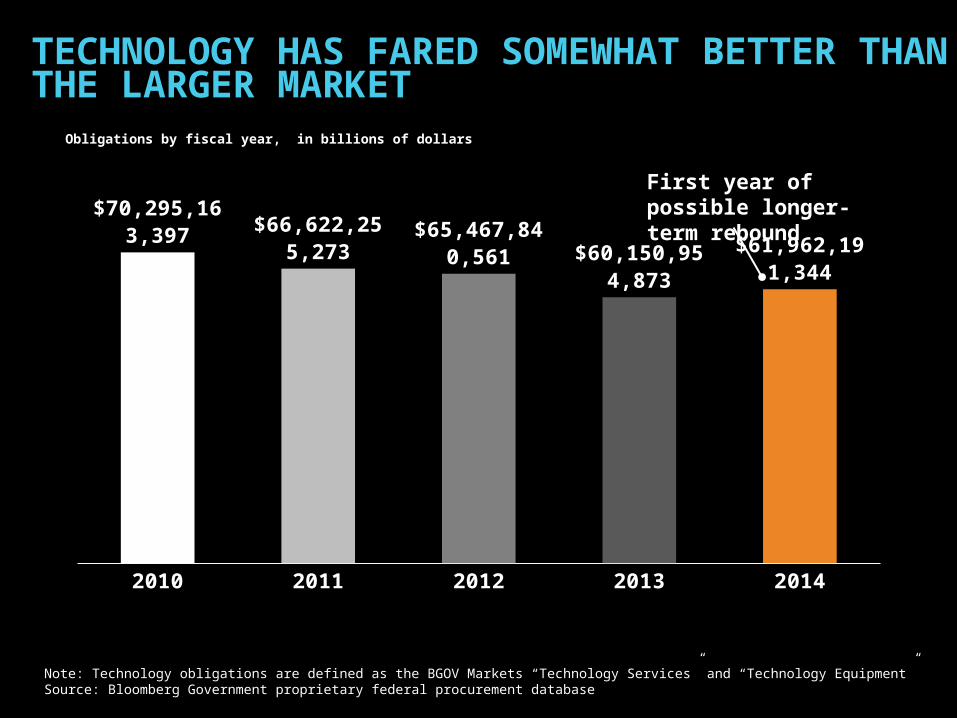
TECHNOLOGY HAS FARED SOMEWHAT BETTER THAN THE LARGER MARKET
First year of possible longer-term rebound
2010 2011 2012 2013 2014
$70,295,163,397 $66,622,255,
273$65,467,840,
561 $60,150,954,873
$61,962,191,344
Obligations by fiscal year, in billions of dollars

2010 2011 2012 2013 2014
$49 $47 $47$44 $46
$21$19 $18 $17 $16
Note: Technology obligations are defined as the BGOV Markets “Technology Services” and “Technology Equipment” Source: Bloomberg Government proprietary federal procurement database
COMPETITIVE SPENDING EXPERIENCEDTHE ONLY INCREASE
Not competitive
Competitive
Obligations by fiscal year, in billions of dollars

2010 2011 2012 2013 2014
$46,181,721,
206
$36,256,461,381
$24,109,873,
875
$25,701,711,
604
Source: Bloomberg Government proprietary federal procurement database
DEFENSE AND CIVILIAN TECHNOLOGY SPENDING ARE CONVERGING
Defense
Civilian
Obligations by fiscal year, in billions of dollars

ARMY REDUCTION PUSHES DEFENSE LOWER;WIDESPREAD INCREASE IN CIVILIAN SPENDING
Note: DISA – Defense Information Systems Agency, HHS – Health and Human Services, DHS – Department of Homeland Security, VA – Veterans AffairsSource: Bloomberg Government proprietary federal procurement database
Defense top spenders Civilian top spenders
2010 2011 2012 2013 2014$0
$10,000,000,000
$20,000,000,000
$30,000,000,000
$40,000,000,000
$50,000,000,000Navy Army Air Force DISA Other
2010 2011 2012 2013 2014$0
$10,000,000,000
$20,000,000,000
$30,000,000,000
$40,000,000,000
$50,000,000,000
HHS DHS VA Treasury Other
Obligations by fiscal year, in billions Obligations by fiscal year, in billions

MULTIPLE- AWARDCONTRACTS
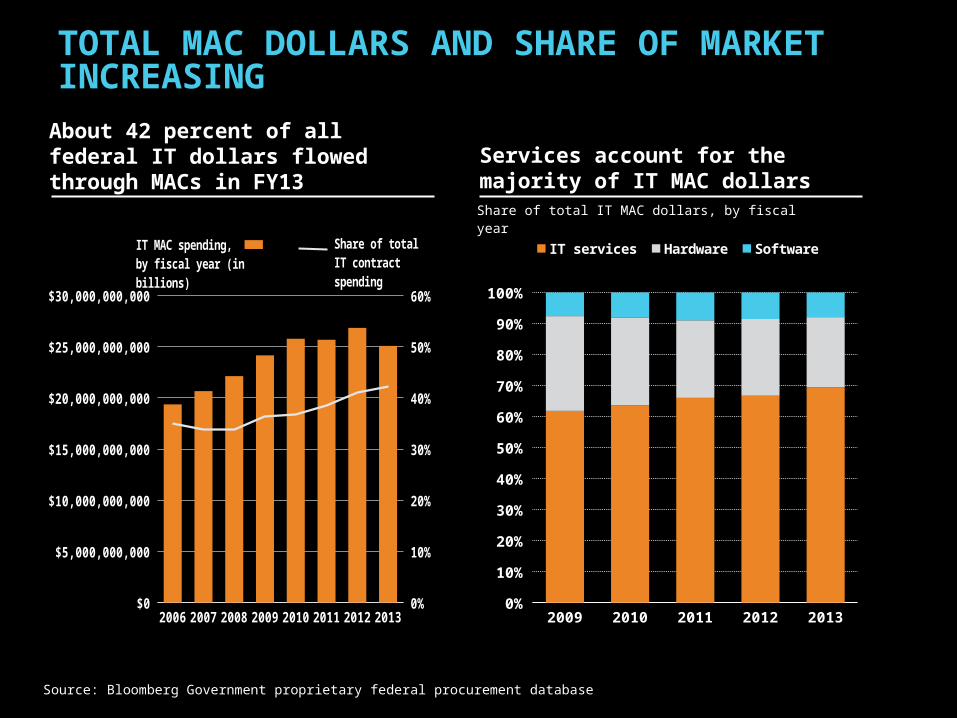
TOTAL MAC DOLLARS AND SHARE OF MARKET INCREASING
Source: Bloomberg Government proprietary federal procurement database
About 42 percent of all federal IT dollars flowed through MACs in FY13
Services account for the majority of IT MAC dollars
2009 2010 2011 2012 2013 2014-YTD
0%
10%
20%
30%
40%
50%
60%
70%
80%
90%
100%
IT services Hardware Software
Share of total IT MAC dollars, by fiscal year
2006 2007 2008 2009 2010 2011 2012 2013$0
$5,000,000,000
$10,000,000,000
$15,000,000,000
$20,000,000,000
$25,000,000,000
$30,000,000,000
0%
10%
20%
30%
40%
50%
60%
IT MAC spending, by fiscal year (in bil-lions)
Share of total IT contract spend-ing

SPECIFIC CATEGORIES AND AGENCIES DOMINATE MACS, OUTSIDE OF THE TOP TWO
Top 15 IT MACs by IT category in fiscal 2013
Top 15 IT MACs by contracting agency in fiscal 2013
GSA Schedule 70
NASA SEWP IV
Army ITES-2S
GSA Alliant
DHS EAGLE I
DISA ENCORE II
VA T4
HHS ESD
Air Force NETCENTS
GSA Alliant SB
GSA 8(a) STARS II
Navy SeaPort-e
Army ITES-2H
Treasury TIPSS-4
HHS CIO-SP2i
$0 $4,0
00,0
00,0
00
IT services Hardware Software
Dollars in billions
GSA Schedule 70
NASA SEWP IV
Army ITES-2S
GSA Alliant
DHS EAGLE I
DISA ENCORE II
VA T4
HHS ESD
Air Force NETCENTS
GSA Alliant SB
GSA 8(a) STARS II
Navy SeaPort-e
Army ITES-2H
Treasury TIPSS-4
HHS CIO-SP2i
$0 $4,0
00,0
00,0
00
DOD HHS DHS VA All other agencies
Dollars in billions
Source: Bloomberg Government proprietary federal procurement database

THE TOP AGENCIES ARE PRIMARILY PROCURING SERVICES THROUGH NON-SCHEDULE MACS
Army led all agencies in IT services spending on MACs in fiscal 2013
Top agencies procured IT primarily through agency-specific MACs
Army
HHS
Navy
DHS
DISA
VA
GSA
Air Force
Treasury
Justice
State
Interior
SSA
USSOC
Commerce
IT services Hardware Software
Dollars in billions
Army
HHS
Navy
DHS
DISA
VA
GSA
Air Force
Treasury
Justice
State
Interior
SSA
USSOC
Commerce
Non-schedule MACs Federal Supply Schedules GWACs
Dollars in billions
Source: Bloomberg Government proprietary federal procurement database

HOW SMALL BUSINESSIS FARING
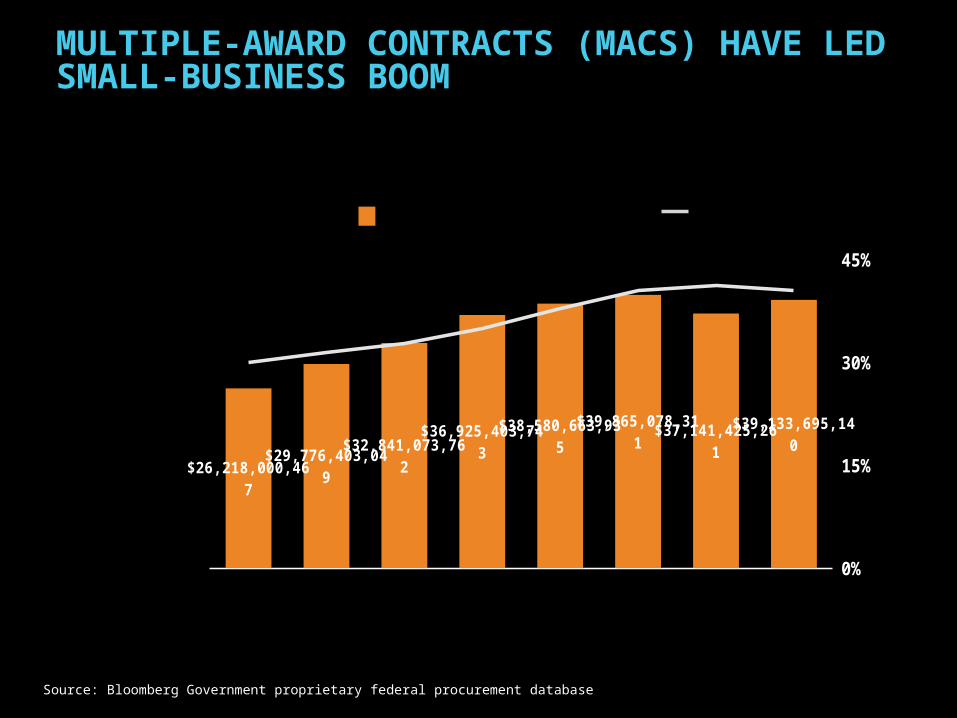
MULTIPLE-AWARD CONTRACTS (MACS) HAVE LED SMALL-BUSINESS BOOM
2007 2008 2009 2010 2011 2012 2013 2014$0
$15,000,000,000
$30,000,000,000
$45,000,000,000
0%
15%
30%
45%
$26,218,000,467$29,776,403,049
$32,841,073,762$36,925,403,743$38,580,663,935$39,865,078,311
$37,141,425,261$39,133,695,140
SB MAC obligations, by fiscal year (in billions)
SB share of total MAC spending
Source: Bloomberg Government proprietary federal procurement database

SET-ASIDES HAVE PLAYED A CRITICAL ROLE IN ENSURING SMALL-BUSINESS SUCCESS
2007 2008 2009 2010 2011 2012 2013 2014
43% 44% 48% 53% 51% 52% 55% 58%
Set-asides No set-asides
Source: Bloomberg Government proprietary federal procurement database
Share of small-business prime contract spending, FY 2007-FY 2014
Source: Small Business Administration and Bloomberg Government proprietary federal procurement database

SMALL-BUSINESSES HAVE FARED BETTER THAN THE OVERALL MARKET IN RECENT YEARS
Source: SBA and Bloomberg Government proprietary federal procurement database
The small-business market has been shrinking in dollar terms…
…but the annual SB percentage decline was less than that of the overall market in FY 2012 and FY 2013
2005 2006 2007 2008 2009 2010 2011 2012 2013
$75,000,227,064
$77,670,193,958
$83,274,871,888
$92,147,729,163
$96,833,802,400
$97,946,784,761$91,467,620,2
09$89,923,198,4
57$83,142,807,958
SB prime contract spending
Obligations by fiscal year, in billions of dollars
2006 2007 2008 2009 2010 2011 2012 2013-15%
-10%
-5%
0%
5%
10%
15%
Small business Overall market
Percentage change in annual spending, by fiscal year

0% 10% 20% 30% 40% 50% 60% 70% 80% 90% 100%
29%
27%
33%
34%
37%
14%
47%
15%
13%
63%
71%
73%
67%
66%
63%
86%
53%
85%
87%
37%
Small business Other than small business
Percentage of total contract spending, fiscal 2014
TECHNOLOGY SERVICES AND EQUIPMENT HAVE MORE THAN $20 BILLION IN 2014 SPENDING
Knowledge-based services
Facility-related services
Technology services
Technology equipment
Construction services
Research and development
Facilities supplies
Engines and power
Equipment-related services
Materials
$19,999,802,429
$17,330,899,025
$11,972,002,912
$8,857,551,176
$6,881,401,941
$5,657,468,096
$4,629,606,041
$2,887,379,237
$2,337,619,409
$2,311,841,079
▲10%
▲14%
▲15%
▲11%
▲11%
▲3%
▲8%
▲1%
▲1%
▼ 39%
Source: Bloomberg Government proprietary federal procurement database
Top 10 categories by SB contract spending in fiscal 2014
Contract spending distribution of top categories in fiscal 2014
Obligations in billions in FY 2014 (and percentage change from FY 2013)

TRENDS ININFORMATIONTECHNOLOGY

INFORMATION TECHNOLOGY MARKET BECOMING A GOVERNMENT FOCUS
New IT supercategory has a preliminary definition
IT outsourcing and consulting services dominate the landscape
contracts continue their takeoverFixed-Price

IT Outsourcing
IT Consulting
Transport Services
Software
Hardware
Secure Identity Services
2010 2011 2012 2013 2014
IT obligations in billions, by fiscal year
OUTSOURCING AND CONSULTING ARE THE LARGEST SUBCATEGORIES WITHIN I.T.
Notes: PSC – product service code. The following PSCs are included in multiple IT subcategories: D301: IT and Telecom - Facility Operation and Maintenance; D316: IT and Telecom – Telecommunications Network Management; D318: IT and Telecom – Integrated Hardware/Software/Services Solutions; D321: IT and Telecom – Help Desk; D399: IT and Telecom – Other IT and Telecom; J070: Maintenance/Repair/Rebuilding Equipment/ADP Equipment/Software/Supplies/Support Equipment. Source: Bloomberg Government proprietary federal procurement database.
FY14 obligations (in billions)
Percentage change,
FY13-FY14
Number of contracts,
FY14
Top PSC by sales,
FY14
$24.68 ▲5% 938D399:
Other IT and Telecom
$21.46 ▼2% 718R425:
Support Professional - Engineering/Technical
$16.51 ▲6% 696D399:
Other IT and Telecom
$17.23 ▲9% 361D399:
Other IT and Telecom
$10.04 ▼3% 5005895: Miscellaneous
Communication Equipment
$1.52 ▲73% 1325810: Communications
Security Equipment and Components
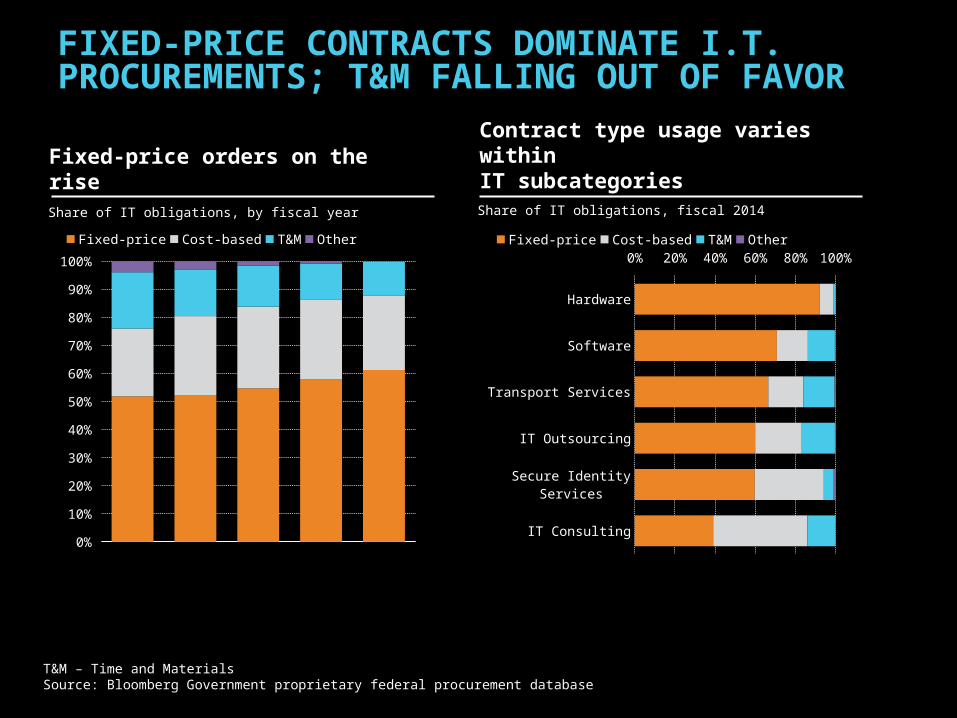
FIXED-PRICE CONTRACTS DOMINATE I.T. PROCUREMENTS; T&M FALLING OUT OF FAVOR
T&M – Time and MaterialsSource: Bloomberg Government proprietary federal procurement database
Fixed-price orders on the riseContract type usage varies within IT subcategories
Hardware
Software
Transport Services
IT Outsourcing
Secure Identity Services
IT Consulting
0% 20% 40% 60% 80% 100%
Fixed-price Cost-based T&M Other
Share of IT obligations, fiscal 2014
2010 2011 2012 2013 20140%
10%
20%
30%
40%
50%
60%
70%
80%
90%
100%
Fixed-price Cost-based T&M Other
Share of IT obligations, by fiscal year

I.T. SPENDING HAS TRENDED AWAY FROM NON-SCHEDULE MACS
Source: Bloomberg Government proprietary federal procurement database
2010 2011 2012 2013 20140%
20%
40%
60%
80%
100%
Non-schedule MACs Schedule MACs GWACs
Share of IT MAC obligations, by fiscal year
and competition are trending upwardSpending
THE BOTTOM LINE
IT Budget set to rebound in fiscal 2016
MACs are increasing their share of IT obligations
ABOUT THE PRESENTER
Jesse Holler is an IT quantitative analyst with Bloomberg Government. Previously, he was a corporate finance and banking analyst at Lockheed Martin. He focused on treasury matters ranging from bank-assisted financing of large deals, to market and firm analysis. Other previous roles included financial strategy, cost and pricing. Jesse has a bachelor's degree in economics and political science from the UCF.
[email protected] +1 202 416 3530
LinkedIn: Jesse Holler@JesseHoller

ABOUT BLOOMBERG GOVERNMENT
Bloomberg Government is the single most comprehensive web-based information service for professionals who interact with or are affected by the federal government
+1 202 416 3450@BGOV
DISCLAIMER Copyright 2015 Bloomberg Finance, L.P.Not for redistribution except by an authorized BGOV user, and only as expressly permitted in the Bloomberg Government terms of service. All permitted uses shall cite BGOV as a source.
www.BGOV.com