Embed Size (px)
Citation preview

Technology Literacy
2005-2006
Process and PlanStandards & Benchmarks
Assessment DataAssessment Instruments
Tech Cadre Packet
Johnston Community School District 1
Table of Contents
Technology Literacy Overview ........................................................................... 2Goal, Components, Process, Definition, Standards, Skills, Strategies
Assessment Process............................................................................................. 4Grades K-5, 6-9, 10-12, Baseline Percentage, Literacy 2006 Percentage,Review of Data and Actions
8th Grade Standards & Benchmarks ..................................................................... 6
Technology Literacy Remediation Plan 2006-2007.............................................. 8
Alternate Assessment .......................................................................................... 9
Technology Assessment Overall Proficiency May 2006 .................................... 10Elementary Chart .........................................................................................................14Secondary Chart...........................................................................................................15Alternate Assessment Chart ........................................................................................16
High School Technology Survey Synopsis 2006................................................ 17
District Contact:Ann WileyInstructional Technology [email protected]
The front cover photo is of 5th grade Beaver Creek, Lawson and Wallace studentsand Summit students. The students presented their technology projects at theHeartland AEA Technology Fair on April 18, 2006. All 7 entries were all blueribbon winners and many were purple Judge's choice winners.

Johnston Community School District 2
Johnston Community School District
Technology Literacy Overview
The Goal - NCLB Title II, Part D, Goal 2(a)• "every student is technologically literate by the time the student finishes the eighth grade"• By 2013, all 8th grade students are to reach 100% proficiency.
Components• A definition of technology literacy• An assessment process for 8th grade technology literacy• A baseline percentage of 8th grade students who are proficient• A plan for all students meeting proficiency (remediation plan)
The ProcessJohnston Technology Standards and Benchmarks were created in 1997. Beginning with four standard, the benchmarksarticulate in ability from Kindergarten through twelfth grade. Each year the benchmarks were revised, as well as theassessments for all of the benchmarks per grade level. Assessments began as part of a performance task linked to acontent area or a self assessment
In June 2004, a subset of building Tech Cadre members reviewed possible definitions of Technology Literacy andcreated what our district will use as our definition of being technology literate. Our standards were re-aligned with theISTE (International Society of Technology in Education) standards and our benchmarks were re-aligned and revised. Toarticulate skills better from grade to grade, the benchmark skills are tagged with a skill category- Introduce, Develop,Assess, or Reinforce.
Beginning in the Fall of 2004, these new set of Standards and Benchmarks were used. Assessments were re-aligned tofit our standards and benchmarks and articulate the assessed skills vertically. In the Spring of 2005, the assessment toolswere used and data was collected and recorded electronically to achieve baseline data.
In the Spring of 2006, a remediation plan was created to be implemented in the 2006-2007 school year.
DefinitionTechnology Literacy is the ability of individuals to responsibly use appropriate technology tools to: access and integrateinformation; and construct and communicate knowledge to improve learning and support lifelong learning.
Standards (aligned with ISTE’s standards)1. Basic operations and concepts2. Social, ethical, and human issues3. Productivity tools4. Communication tools5. Research tools6. Problem-solving and decision-making tools

Johnston Community School District 3
SkillsIntroduce - These skills are those that may be new to the student in an educational setting. Those skills introducedshould also be practiced throughout the year so the students are developing those skills.Develop - These skills are those that students most likely already have been introduced to and should be practicedthroughout the year.Assess - These skills are the benchmarks that students will be assessed in the spring for their progress. All students(regardless of beginning ability or length of time in district) will be given opportunities to gain and practice these skills.Reinforce - These skills are benchmarks that students have previously been assessed on, but need to be practiced andreinforced in their activities.
Strategies* Technology Standards and Benchmarks K-12* All teachers are responsible for using technology within their curriculum* Curriculum Maps document technology infusion in instruction, curriculum activities and projects* Technology Assessment in grades K-9, Technology Survey in grades 10-12* Remediation Plan/Boot Camp for assisting students in learning and practicing skills with the goal of proficiency* Building Technology Action Plans have an Integration of Technology Goal, which addresses student skills

Johnston Community School District 4
Technology Assessment Process
NCLB requires that districts define “technology literate”, create standards and benchmarks to correlate to the definitionand assessments that measure students’ progress. By 8th grade, students are to be “technology literate” as measured ontechnology skill assessments. NCLB also requires that we have a process for new students entering our district to learnour technology benchmark skills. All students (regardless of beginning ability or length of time in district) will be givenopportunities to gain and practice these skills. These opportunities may be given by the classroom teacher and/or theMedia Specialist or designated staff.
Grades K-5Teachers will complete the Standards and Benchmark sheet and check the skills that have been introduced, developed,assessed and reinforced during the school year within the classroom curriculum.
Teachers will assess only those skills in the assess column on each student within their classroom. An assessment sheetwith only the assessed skills will be submitted. The report card rubric will be used in scoring the students – notation isgiven to assist in scoring.Codes4 = Exceeds year-end grade level benchmark (completes skill independently)3 = Meets year-end grade level benchmark (completes skill with little assistance)2 = Progressing toward year-end grade level benchmark1 = Beginning to work on year-end grade level benchmarkN = Not assessed during current trimester
Special Education students will also be assessed, but some may use the alternate assessment for special needs students(ex. severe and profound).
Grades 6-9Teachers will complete the Standards and Benchmark sheet and check the skills that have been introduced, developed,assessed and reinforced during the school year within the classroom curriculum.
Teachers will assess only those skills in the assess column on each student within their classroom. An assessment sheetwith only the assessed skills will be submitted. Performance tasks will be used to assess the skills within a classroomactivity/project. The tasks are as follows:TasksGrade 6 – research word processing documentGrade 7 – research slide show presentationGrade 8 – concept map documentGrade 9 – research word processing document
The tasks will be scored as follows:Codes4 = Exceeds year-end grade level benchmark (90% of skills completed independently)3 = Meets year-end grade level benchmark (70% of skills completed independently)2 = Progressing toward year-end grade level benchmark (60% of skills completed independently)1 = Beginning to work on year-end grade level benchmark (0-59% of skills completed)
Special Education students will also be assessed, but some may use the alternate assessment for special needs students(ex. severe and profound).
Johnston Community School District 5
Grades 10-12Students in grades 10 and 11 will be given an online technology standards self-assessment survey. This survey tracksstudent technology usage in classroom activities and projects. The survey aligns to the grades 10-12 Standards andBenchmarks.
Baseline PercentageMay 2005 8th grade proficiency is 88.4%.301 students were assessed with performance task5 students took alternate assessment; 60% proficient
Literacy 2006 PercentageMay 2006 8th grade proficiency is 90.8%.381 Students were assessed with performance task6 students took alternate assessment; 83% proficient
Review of Data and ActionsAll Tech Cadres will review the assessment data and reflect actions in their building Technology Action Plans.

Johnston Community School District 6
Eighth Grade Technology Standards and Benchmarks
Technology Literacy is the ability of individuals to responsibly use appropriate technology tools to: access and integrateinformation; and construct and communicate knowledge to improve learning and support lifelong learning.
Standard Benchmark Skill Introduce Develop Assess Reinforce
I. Basic operations andconcepts
•Demonstrate proper posture, correct fingerpositions, and keyboarding skills.
•Demonstrate editing skills:word/sentence/indent/double spacing,formatting (font, styles, justification), spellchecking.
•Reset desktop to appropriate settings (quitprograms).
•Select specific printer. •Save to a specific folder (local or server).
II. Social, ethical, andhuman issues
•Practice responsible use of equipment andsoftware.
•Demonstrate positive social and ethicalbehaviors when using technology.
•Cite source(s) used in projects, followingcitation format.
•Understand basic issues related to technologyand information ethics and the consequences ofinappropriate use.
III. Productivity tools •Create a document that includes graphics(CDs, web, scanner, camera), and/orcharts/graphs.•Use a spreadsheet to organize data for a chartor graph.•Use a spreadsheet for functions (AVG, SUM).•Create a diagram/outline to organizeinformation.•Use technology tools (scanner, digitalcameras, multimedia authoring, web tools) forwriting, communication and publishing.•Create a slide show, including background,text, graphics, and special effectscomplimentary to the content.
IV. Communication tools •Communicate with others using electronictelecommunications, with support fromteachers, student partners.•Present a technology created project.
V. Research tools •Use technology resources (online data bases,resources, CDROMs) to gather information.•Use effective searching strategies (Boolean,keyword and phrase).•Evaluate electronic information sources foraccuracy and relevancy.

Johnston Community School District 7
VI. Problem-solving anddecision-making tools
•Use technology resources (educationalsoftware, calculators) for problem solving, self-directed learning, and extended learningactivities.
Standards are aligned with the ISTE (International Society of Technology in Education).Introduce skills are those that may be new to the student in an educational setting. Those skills introduced should alsobe practiced throughout the year so the students are developing those skills. Develop skills are those that students mostlikely already have been introduced to and should be practiced throughout the year. Assess skills are the benchmarksthat students will be assessed in the spring for their progress. Reinforce skills are benchmarks that students havepreviously been assessed on, but need to be practiced and reinforced in their activities. All students (regardless ofbeginning ability or length of time in district) will be given opportunities to gain and practice these skills.

Johnston Community School District 8
Technology Literacy Remediation Plan 2006-2007Definition: Technology Literacy is the ability of individuals to responsibly use appropriate technology tools to: accessand integrate information; and construct and communicate knowledge to improve learning and support lifelong learning.
Baseline Data• May 2005 8th Grade Proficiency is 88.4%• 301 students assessed with performance task• 5 Students took alternate assessment; 60% Proficient
Literacy 2006 Percentage• May 2006 8th grade proficiency is 90.8%.• 381 Students were assessed with performance task• 6 students took alternate assessment; 83% proficient
Remediation PlanPhase 1 - Assess 8th graders by February 16, 2007; Students not reaching proficient in grade 8, attend a TechnologyBoot Camp during homeroom, before or after school. Boot Camp will begin the week of March 19th. Re-assess in May2007 or at the conclusion of the Boot Camp. Boot Camp will also be scheduled for non-proficient 9th graders and beheld during Seminar time.
Phase 2 - Assess 7th graders in April/May 2007; 7th grade students not reaching proficient attend Technology BootCamp in September and October of 8th grade year (Fall 2007).
Phase 3 - Assess 6th graders in April/May 2007 and in April/May 2008 to determine remediation needs; 6th gradestudents not reaching proficient attend Technology Boot Camp in September and October of 7th grade year (Fall 2008).
Technology Boot Camp• Building Tech Cadre (with assistance from Ann Wiley/Instructional Technology Coordinator) leads skill-buildingsessions for students to learn technology benchmark skills.• Skill-building activities focus on the benchmark skills.• Students are given a technology performance task to determine successful completion of camp and assessment scoreof proficiency.
Strategies for Technology Literacy Proficiency• Technology Standards & Benchmarks K-12• All teachers are responsible for using technology within their curriculum• Curriculum Maps document technology infusion in instruction, curriculum activities and projects• Technology Assessment in grades K-9, technology survey in grades 10-12• Remediation Plan/Boot Camp for assisting students in practicing skills with the goal of proficiency (beginning ingrade 8, then developing in grade 7 and 6, respectively)• Building Technology Action Plans have an Integration of Technology Goal, which addresses student skills

Johnston Community School District 9
Johnston CSDTechnology Alternate Assessment Teacher: _______________________
Technology Literacy is the ability of individuals to responsibly use appropriate technology tools to: access and integrateinformation; and construct and communicate knowledge to improve learning and support lifelong learning.
Standards are aligned with the ISTE (International Society of Technology in Education). This alternate assessment isused with special needs students. Teachers select the benchmark/s that accommodate the skills used by studentsindividually. Teachers assess students on these selected benchmarks using the following rubric.
4 = Exceeds year-end grade level benchmark (completes skill independently)3 = Meets year-end grade level benchmark (completes skill with little assistance)2 = Progressing toward year-end grade level benchmark1 = Beginning to work on year-end grade level benchmark
I. Basic operations and concepts1.1 Manipulate a device to activate a program (switch, paddle, roller ball, . . . ).1.2 Activate a device to get a response in a program.1.3 Open and quit applications.1.4 Demonstrate use of keys to type name.1.5 Demonstrate use of editing features.
II. Social, ethical, and human issues2.1 Practice responsible use of equipment and software (handles and uses appropriately).2.2 Acknowledge names of programs (sources of information).2.3 Work cooperatively and collaboratively with peers and others when using technology.
III. Productivity tools3.1 Make choices within a program to advance program’s content.3.2 Create a picture using a draw program to illustrate a thought, idea or story.
IV. Communication tools4.1 Communicate with a program by inputting responses.
V. Research tools
VI. Problem-solving and decision-making tools6.1 Use puzzles, logical thinking programs, writing tools, drawing tools, content programs andinteractive storybooks.
Student Name Grade Benchmark/sAssessed
Level/Score Notes

Johnston Community School District 10
2006Assessment Data
Johnston Community School District 11
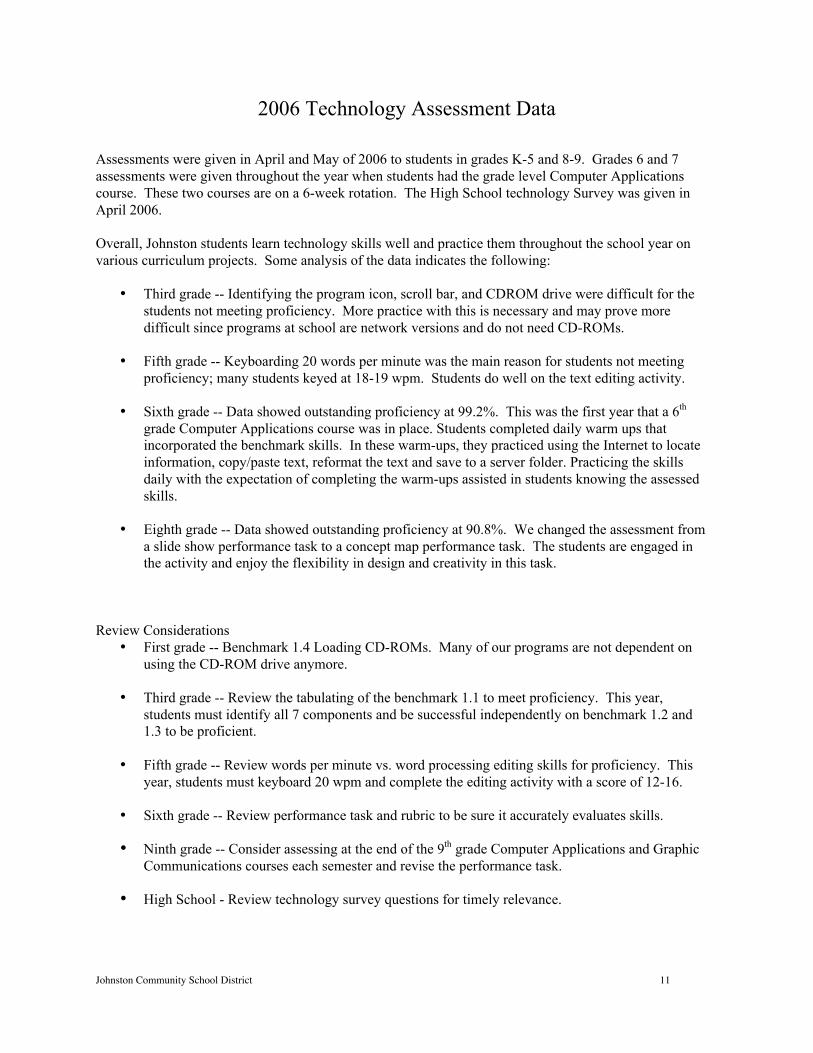
2006 Technology Assessment Data
Assessments were given in April and May of 2006 to students in grades K-5 and 8-9. Grades 6 and 7assessments were given throughout the year when students had the grade level Computer Applicationscourse. These two courses are on a 6-week rotation. The High School technology Survey was given inApril 2006.
Overall, Johnston students learn technology skills well and practice them throughout the school year onvarious curriculum projects. Some analysis of the data indicates the following:
• Third grade -- Identifying the program icon, scroll bar, and CDROM drive were difficult for thestudents not meeting proficiency. More practice with this is necessary and may prove moredifficult since programs at school are network versions and do not need CD-ROMs.
• Fifth grade -- Keyboarding 20 words per minute was the main reason for students not meetingproficiency; many students keyed at 18-19 wpm. Students do well on the text editing activity.
• Sixth grade -- Data showed outstanding proficiency at 99.2%. This was the first year that a 6th
grade Computer Applications course was in place. Students completed daily warm ups thatincorporated the benchmark skills. In these warm-ups, they practiced using the Internet to locateinformation, copy/paste text, reformat the text and save to a server folder. Practicing the skillsdaily with the expectation of completing the warm-ups assisted in students knowing the assessedskills.
• Eighth grade -- Data showed outstanding proficiency at 90.8%. We changed the assessment froma slide show performance task to a concept map performance task. The students are engaged inthe activity and enjoy the flexibility in design and creativity in this task.
Review Considerations• First grade -- Benchmark 1.4 Loading CD-ROMs. Many of our programs are not dependent on
using the CD-ROM drive anymore.
• Third grade -- Review the tabulating of the benchmark 1.1 to meet proficiency. This year,students must identify all 7 components and be successful independently on benchmark 1.2 and1.3 to be proficient.
• Fifth grade -- Review words per minute vs. word processing editing skills for proficiency. Thisyear, students must keyboard 20 wpm and complete the editing activity with a score of 12-16.
• Sixth grade -- Review performance task and rubric to be sure it accurately evaluates skills.
• Ninth grade -- Consider assessing at the end of the 9th grade Computer Applications and GraphicCommunications courses each semester and revise the performance task.
• High School - Review technology survey questions for timely relevance.
Johnston Community School District 12
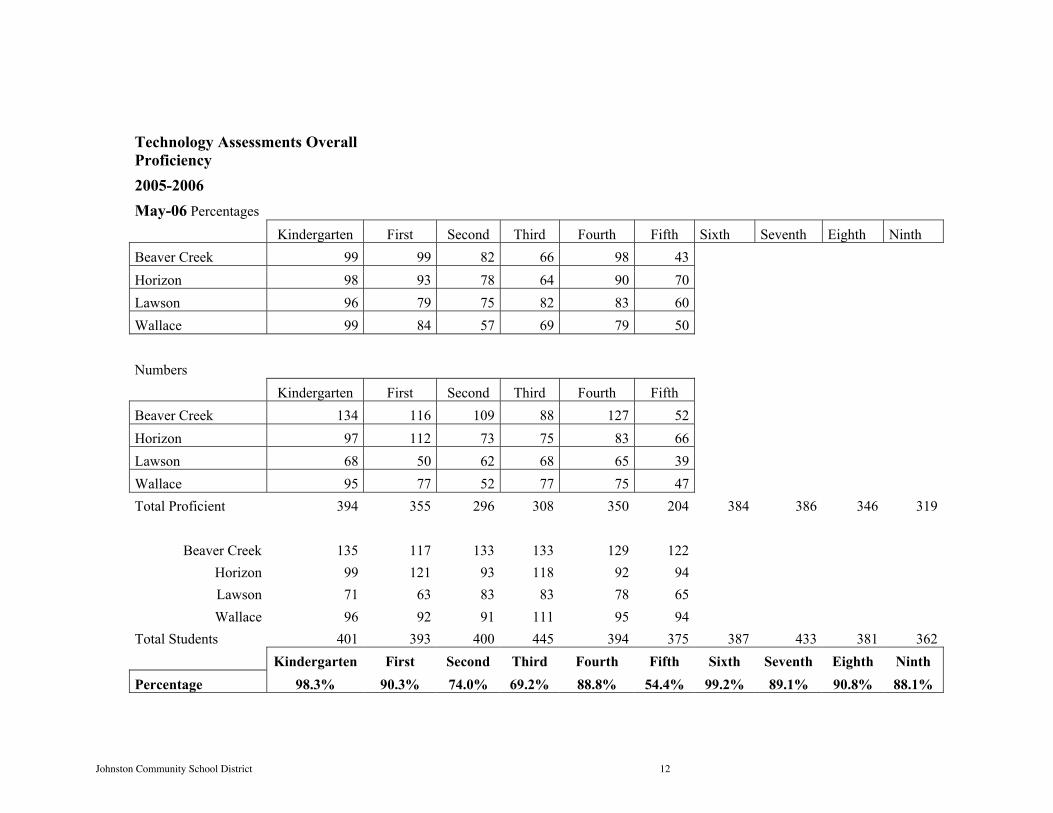
Technology Assessments OverallProficiency2005-2006May-06 Percentages
Kindergarten First Second Third Fourth Fifth Sixth Seventh Eighth NinthBeaver Creek 99 99 82 66 98 43Horizon 98 93 78 64 90 70Lawson 96 79 75 82 83 60Wallace 99 84 57 69 79 50
NumbersKindergarten First Second Third Fourth Fifth
Beaver Creek 134 116 109 88 127 52Horizon 97 112 73 75 83 66Lawson 68 50 62 68 65 39Wallace 95 77 52 77 75 47Total Proficient 394 355 296 308 350 204 384 386 346 319
Beaver Creek 135 117 133 133 129 122Horizon 99 121 93 118 92 94Lawson 71 63 83 83 78 65Wallace 96 92 91 111 95 94
Total Students 401 393 400 445 394 375 387 433 381 362Kindergarten First Second Third Fourth Fifth Sixth Seventh Eighth Ninth
Percentage 98.3% 90.3% 74.0% 69.2% 88.8% 54.4% 99.2% 89.1% 90.8% 88.1%

Johnston Community School District 13
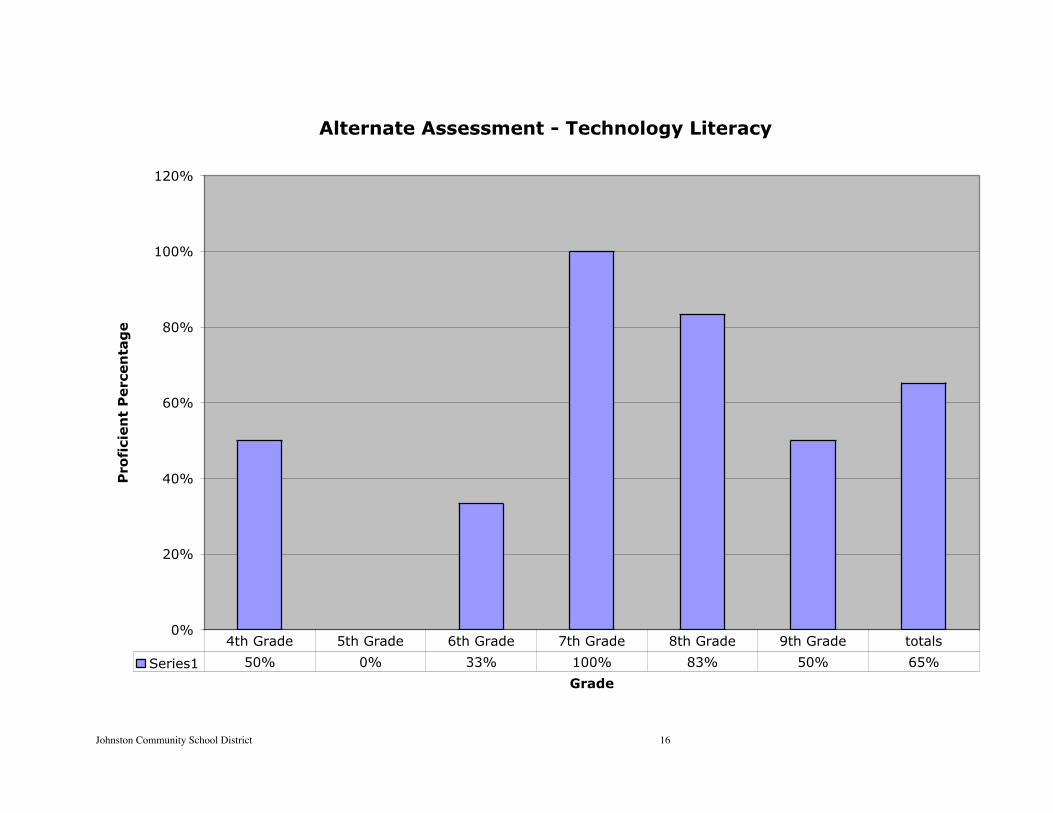
Alternate Assessment Y-Home AssessmentPercentage Proficient total Proficient 28/36 77.7%
4th Grade 50% 1 25th Grade 0% 0 16th Grade 33% 1 37th Grade 100% 5 58th Grade 83% 5 69th Grade 50% 3 6totals 65% 15 23
Johnston Community School District 14
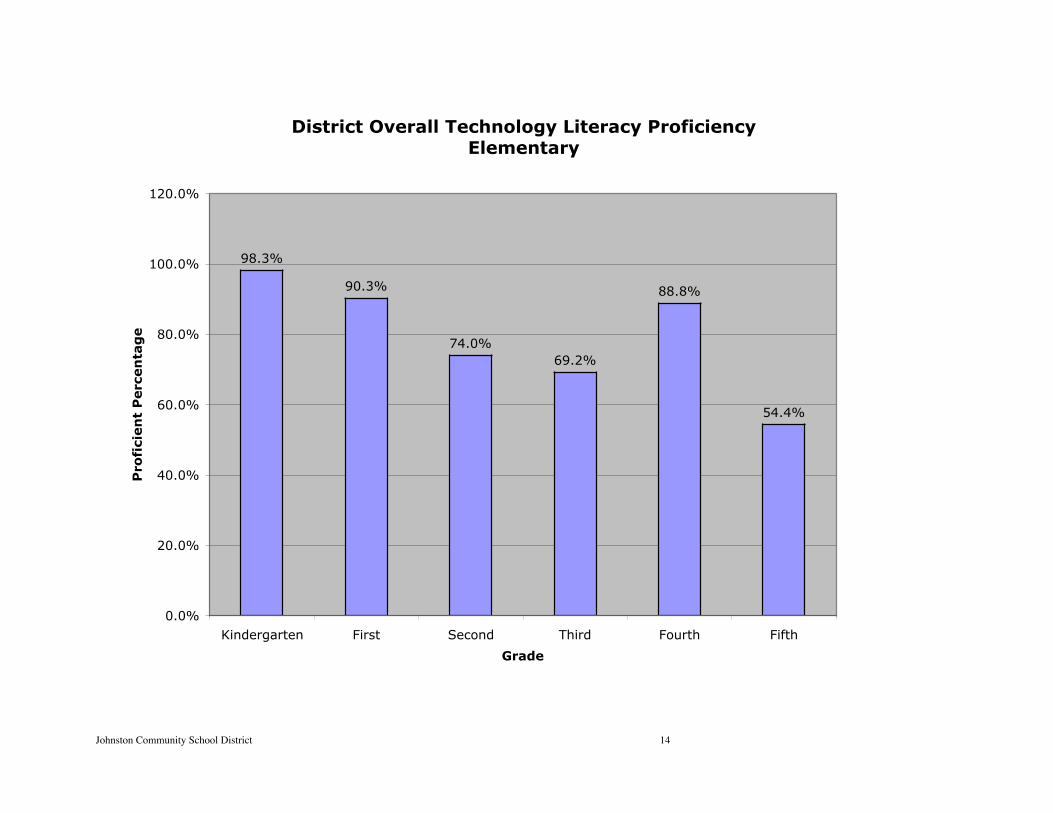
District Overall Technology Literacy ProficiencyElementary
98.3%
90.3%
74.0%69.2%
88.8%
54.4%
0.0%
20.0%
40.0%
60.0%
80.0%
100.0%
120.0%
Kindergarten First Second Third Fourth Fifth
Grade
Pro
fici
en
t P
erc
en
tag
e

Johnston Community School District 15
District Overall Technology Literacy ProficiencySecondary
99.2%
89.1%
90.8%
88.1%
82.0%
84.0%
86.0%
88.0%
90.0%
92.0%
94.0%
96.0%
98.0%
100.0%
102.0%
Sixth Seventh Eighth Ninth
Grade
Pro
fici
en
t P
erc
en
tag
e
Johnston Community School District 16
Alternate Assessment - Technology Literacy
0%
20%
40%
60%
80%
100%
120%
Grade
Pro
fici
en
t P
erc
en
tag
e
Series1 50% 0% 33% 100% 83% 50% 65%
4th Grade 5th Grade 6th Grade 7th Grade 8th Grade 9th Grade totals

Johnston Community School District 17
Johnston High School Technology Survey Synopsis 2006
The JHS Technology Survey was given in May of 2006 during homeroom time. Students weretaken to a lab or the LMC to complete the online survey.Due to a survey data error, approximately 200 students took the 2005 survey. Of the 200students, 194 of them were 10th graders. When that was discovered, the previous year’s surveywas made inactive. A total of 668 students completed the online survey.
2005 Action Item Questions and Result Comparison #8/8: (2.2) How important is it to you that people show positive and ethical behaviors when usingtechnology?200577.8% Very/Somewhat Important22.2% Little/No Importance
200678.8% Very/Somewhat Important21.2% Little/No Importance
Goal: Want the importance % to increaseAction Item: Provide instruction to students on the technology expectations and guidelines.
Provide instruction to students on Internet use expectations and skills in using the Internet.Provide instruction on legal and ethical behaviors in the use of technology and information.
#12/12: (2.3) Do you abide by guidelines of copyright and plagiarism?200586% Yes14% No
200686.7% Yes13.3% No
Goal: Want the ‘no’ answers to decreaseAction Item: Students will improve in citing electronic resources used in projects; bibliographies, sourcecitation.
#30/*: (2.3) Have you created a bibliography of resources used in a research project?200524.4% Yes68.3% No7.3% Don’t Know
200630.5% Yes57.5% No11% Don’t Know *Based on 200 students
Goal: Want the ‘yes’ to increaseAction Item: Students will improve in citing technology online sources used in projects; bibliographies,source citation.
Provide staff with common building citation format sheet to be used with students.
#33/29: (5.3) Have you verified Internet information through multiple sources?200537.7% Yes49.5% No12.8% Don’t Know
200663.8% Yes30.1% No6.1% Don’t Know
Goal: Want the ‘yes’ to increaseAction Item: Students will improve in checking electronic sources for relevancy and accuracy.

Johnston Community School District 18
#41/*: (5.3) Were you taught to evaluate electronic information sources for accuracy and relevancy?200543.0% Yes25.8% No31.2% Don’t Know
200648.5% Yes17.0% No33.5% Don’t Know *Based on 200 students
Goal: Want the ‘yes’ to increaseAction Item: Students will improve in checking electronic sources for relevancy and accuracy.
Other Survey Points of InterestPositives
• 93.7% of students have a computer in their home• An increase of 7% over last year to responses that teachers provided instruction on copyright
issues (item #13)• The percentage decreased for the use of technology tools questions with an answer of NONE;
scanners, cameras, data tables, graphs, outlines, concept mapping• Percentage of students presenting a technology project increased from 67% in 2005 to 75.2% in
2006• Percentage of students using Internet search engines to locate information increased from 14.2%
in 2005 to 65.5% in 2006; don’t know answers decreased as well.• Percentage of students using graphic applications increased by 14%
Items to look at• Percentage of students using LMC Alexandria catalog to find resources (was 93.8% in 2005,
56.6% in 2006)• Percentage of students using Heartland’s COMCAT to find resources from other libraries (was
72.4% in 2005, 43.9% in 2006)
SuggestionsReview Technology Survey questions to determine need and value of individual and project differentiatedquestions.Review administration of survey to see if changing the protocol would gain more accurate results (due tostudents not understanding the question, rushing through survey, etc.).