Embed Size (px)
Citation preview

High-Throughput Cell Engineering as a Tool in Research and Drug Development
Tecan Symposium 2008
Herbert Müller-HartmannDirector R&Damaxa AG, a Lonza company

slide 2
Cells
Transfection Silencing RNAsGene expression arraysCellular imaging and analysis
Dedicated culture mediaSerum Free MediaCell culture matricesInnovative cell culture support
Normal human cellsAdult and embryonic stem cellsDisease cells « Cloned cells » SFM media ready
Assaysin cell
Ease of use
EnablingTechnology
Cell handling Cell analysisCell based assays
Cell based HTS/HCS assayIn Vitro ADMET assaysCell Health assaysCell function assays
Lonza Strategy Focus on Cell Discovery

slide 3
AgendaHigh-Throughput Applications Based on Cell EngineeringFunctional siRNA Screening
Kinome/Cell Cycle siRNA Screening in Human Umbilical Vein Endothelial Cells
Functional Fas-apoptosis Screen in Jurkat T Lymphocytes
Cell Engineering with Non-Nucleic Acid Molecules
Cell Engineering in High Throughput

slide 4
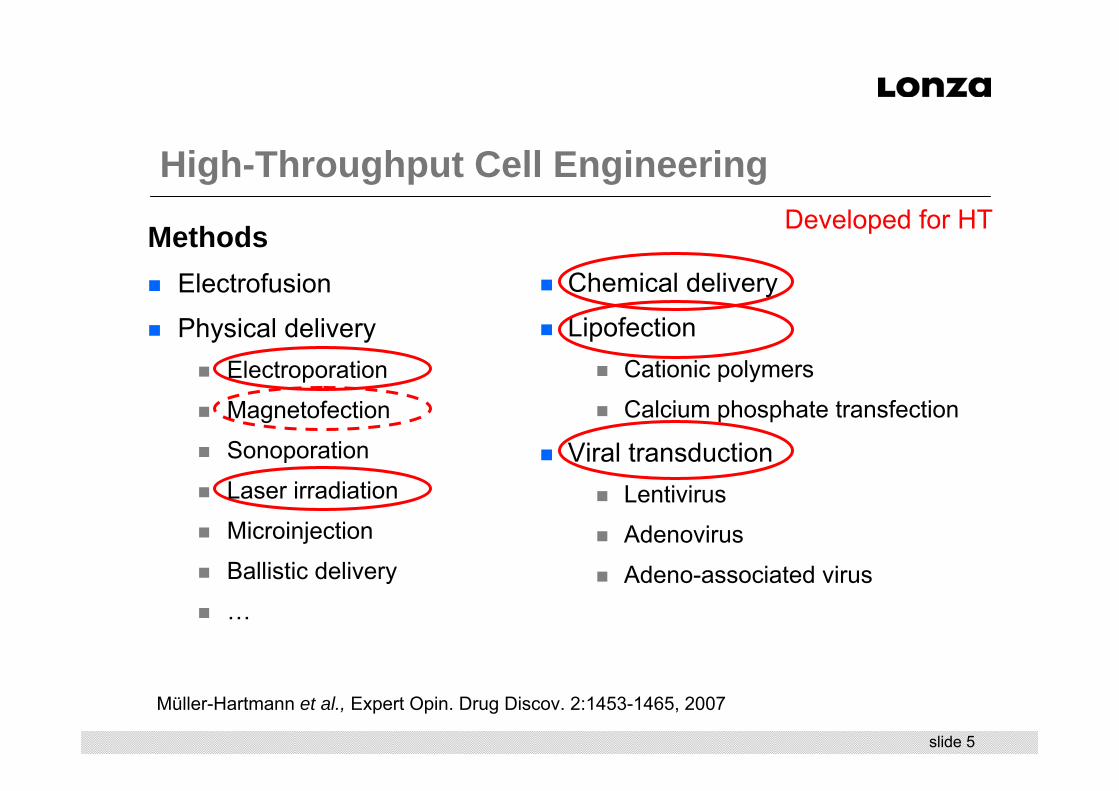
High-Throughput Transfection and Engineering of Cells by Chemical, Viral and Physical Methods
Müller-Hartmann et al., Expert Opin. Drug Discov. 2:1453-1465, 2007
Leading to more efficientTarget researchLead identification and valuationProtein productionOptimization of vectors and methods
Primary human hepatocytes
slide 5
MethodsElectrofusion
Physical deliveryElectroporation
Magnetofection
Sonoporation
Laser irradiation
Microinjection
Ballistic delivery
…
Chemical delivery
LipofectionCationic polymers
Calcium phosphate transfection
Viral transductionLentivirus
Adenovirus
Adeno-associated virus
Developed for HT
Müller-Hartmann et al., Expert Opin. Drug Discov. 2:1453-1465, 2007
High-Throughput Cell Engineering

slide 6
Increasing utilization of cell-based-assays, supplementing and even replacing biochemical assays
Recent trends in cell engineeringBiologically relevant cells, in particular primary cells
“Biologically inert” manipulation methods (e.g. “endosome-free” delivery)
“Cells as reagents”
High-Throughput Cell Engineering
slide 7
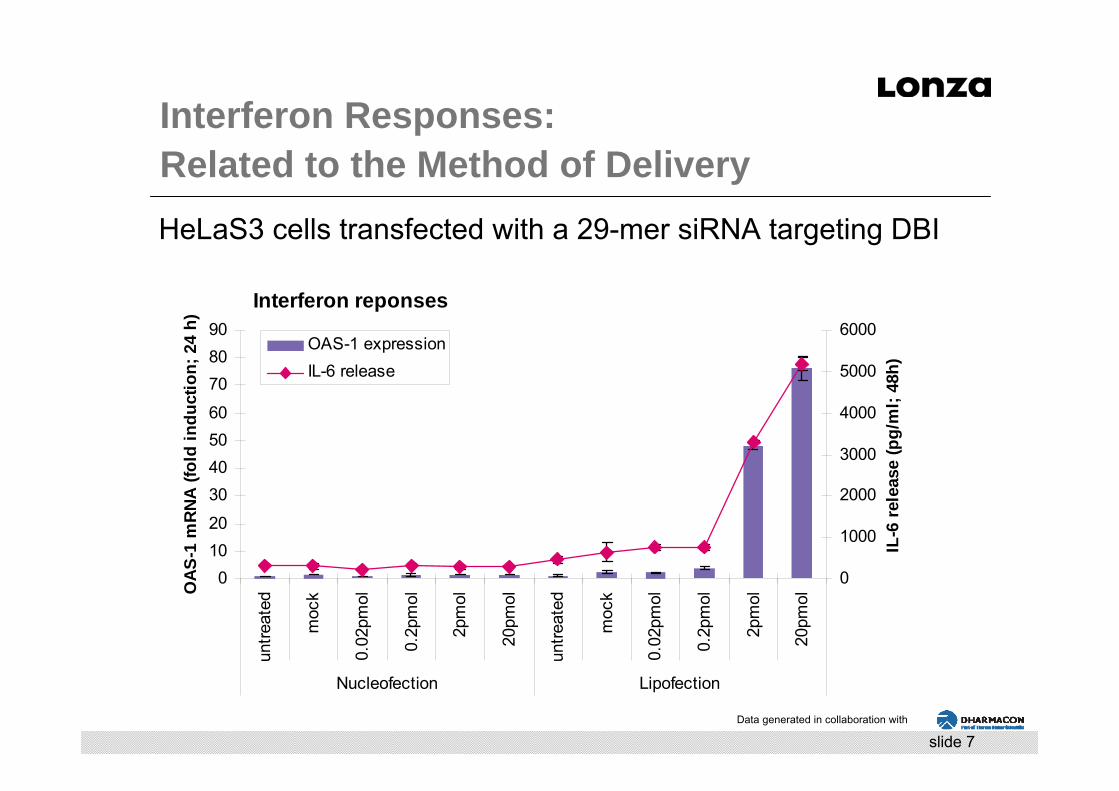
Interferon reponses
01020
30405060
708090
untre
ated
moc
k
0.02
pmol
0.2p
mol
2pm
ol
20pm
ol
untre
ated
moc
k
0.02
pmol
0.2p
mol
2pm
ol
20pm
ol
Nucleofection Lipofection
OA
S-1
mR
NA
(fol
d in
duct
ion;
24
h)
0
1000
2000
3000
4000
5000
6000
IL-6
rele
ase
(pg/
ml;
48h)
OAS-1 expressionIL-6 release
Data generated in collaboration with
Interferon Responses:Related to the Method of DeliveryHeLaS3 cells transfected with a 29-mer siRNA targeting DBI

slide 8
Cells show good growth and morphology on GEM™ beads
Proof-of-principle transfection of cells growing on alginate beads
“Cells as reagents”
AoSMC
24 h growth 48 h growth 96 h growth
CHO-K1

slide 9
AgendaHigh-Throughput Applications Based on Cell Engineering
Functional siRNA ScreeningKinome/Cell Cycle siRNA Screening in Human Umbilical Vein Endothelial Cells
Functional Fas-apoptosis Screen in Jurkat T Lymphocytes
Cell Engineering with Non-Nucleic Acid Molecules
Cell Engineering in High Throughput

slide 10
Loss/Gain of function screensKD of target by RNAi induces phenotype (e.g. Proliferation / cell death)
Modifier / sensitizer screensKD of target by RNAi induces phenotype only in combination withcell treatment (e.g. Pathway induction, cell stress)
Synthetic lethality screensKD of target by RNAi induces phenotype only in certain genetic background (e.g. Comparison of isogenic cell model with wt-Ras vs. Ras-mutated)
Pathway-specific screens using reporter geneKD of target modulates signaling measured by pathway-specific reporter gene (stable reporter cell lines)
RNAi Screening Strategies

slide 11
Workflow & opportunities for Amaxa® Nucleofection®
Nucleofection®
for assay development and generation of stable cell lines
Sam
ple
num
ber
Large libraries
focused libraries
Selected hits
Top hits
Ass
ay
com
plex
ity
96-well Shuttle®
for transfectablesubstrates
Cell-based Screening Approaches

slide 12
simple
ViabilityProliferationApoptosis
Calcium AssaysELISAFlash-LuminescenceReporter Gene assays
complex
High Content Analysis (HCA)Protein-Protein-interaction (e.g. FRET)Pathway specific assays
Standard assaysCommercially availableEasy to optimizeEasy to automate Standard instrumentation
High optimization effortSpecial Instrumentation
Assay Types

slide 13
Workflow considerationsDepending on number of samples, cells have to be stored in Nucleofector® solution for hours
Available automation friendly OPs
If no automation OP available: check for stability in solution, contact Amaxa
Cell typesJurkatHeLa/HeLa-S3Neuro2AHUVEChuman T-cells new OPhuman T-cells old OPstim. human T-cells
More to come …
Conditionsmodified protocolmodified protocolmodified protocolStandard OPStandard OPStandard OPStandard OP
Automation Solutions
slide 14
AgendaHigh-Throughput Applications Based on Cell Engineering
Functional siRNA ScreeningKinome/Cell Cycle siRNA Screening in Human Umbilical Vein Endothelial CellsFunctional Fas-apoptosis Screen in Jurkat T Lymphocytes
Cell Engineering with Non-Nucleic Acid Molecules
Cell Engineering in High Throughput

slide 15
Human siARRAY® - Protein Kinases (Dharmacon):SMARTpool® siRNA targeting 779 genesHuman siARRAY® - Cell Cycle Regulation (Dharmacon):SMARTpool® siRNA targeting 111 genes
siRNA libraries
Untreated cells (in 96-well Solution only)Negative control: siCONTROL® non-targeting siRNA #1 (Dharmacon)Positive control: SMARTpool® targeting PLK-1 (Dharmacon) and CHEK1 (Dharmacon)
Controls
Cell viability using CellTiter-Blue® assay (Promega) 72 h post transfectionData analysis:Z’ factor of controls (quality of experiment)Robust Z-score (hit identification)
Analysis
siRNA Screen in Primary HUVEC Cells

slide 16
siRNA library: 2 nmolLyophilized (-20°C)
Add 100 µlresusp. buffer
siRNA library stock: 20 µM (-20°C)
Transfer1.2 µl/well
Add 4.8 µl/well
2.4x10⁴ cells/18 µl= 2x10⁴ cells/15 µl
Cultured cells(25 flasks)
Add x ml for n wells = 18 µl/well*
Add18 µl/well
Transfer20 µl/well
Add80 µl/well Culture
medium
CTB reagent
siRNA library stock:24 pmol/6 µl (4µM)
Solution: 24 µlsiRNA: 24 pmolCells: 2.4 x 10⁴
Solution: 20 µlsiRNA: 20 pmolCells: 2 x 10⁴
Solution: 4.8 µl
Empty plate
Transfected cellSuspension 20 µl
Transfected cell Suspension 100 µl
3 x 10³ cells/well
Analysis Fluoroscan3 x 103 cells/well
Add20 µl/well
3 h incub.
Transfer15 µl/well
96-well Nucleo-fector Solution
Add 85 µl/well
Culturemedium
96-well PCR plate96-well Nucleocuvette® plate96-well culture plate96-well microtiter plate (round)
3 d incubation
* ≈ 3 µl void volume/well
Screening Workflow

slide 17
||33
1'negativepositive
negativepositive
meanmeanSDSD
Z−
+−=
SeparationBand
Data variabilityBand
Data variabilityBand
μs μc
Freq
uenc
y
Assay Signal
3σs 3σc
Robustness and Screening Window

slide 18
Z‘-factor = 0.2
Z‘-factor = 0.5
0%10%20%30%40%50%60%70%80%90%
100%
0 10 20 30 40 50 60
sample #
rel V
iabi
lity
[% o
f unt
reat
ed]
siControl#1 CHEK#1
0%10%20%30%40%50%60%70%80%90%
100%
0 10 20 30 40 50 60
rel V
iabi
lity
[% o
f unt
reat
ed]
siControl#1 PLK
screening screening windowwindow
screening screening windowwindow
Dat
a ge
nera
ted
in c
olla
bora
tion
with
siRNA Screen in Primary HUVEC CellsAssay setup: Robustness – Screening Window

slide 19
HUVEC cell readout shows position/edge effects!
siControl#1
0%10%20%30%40%50%60%70%80%90%
100%
0 8 16 24 32 40 48 56 64 72 80 88 96
sample #
rel V
iabi
lity
[% o
f unt
reat
ed]
Assay setup: Plate uniformity?
siRNA Screen in Primary HUVEC Cells
Data generated in collaboration with

slide 20
0
50
100
150
1 2 3 4 5 6 7 8 9 10 11 12
Column
RFU
0
50
100
150
1 2 3 4 5 6 7 8 9 10 11 12
Column
RFU
1 Nucleofection® sample was plated onto 2 culture plates in different orientations.
ABCDEFGH
1 2 3 4 5 6 7 8 9 10 11 12
Nucleocuvette® Plate
Data generated in collaboration with
Position / Edge Effects are Nucleofection® Independent

slide 21
A
B
C
D
E
F
G
H
1 2 3 4 5 6 7 8 9 10 11 12
Medium only
Performing the Screen While Omitting the Outer Wells Requires Reformatting of Library
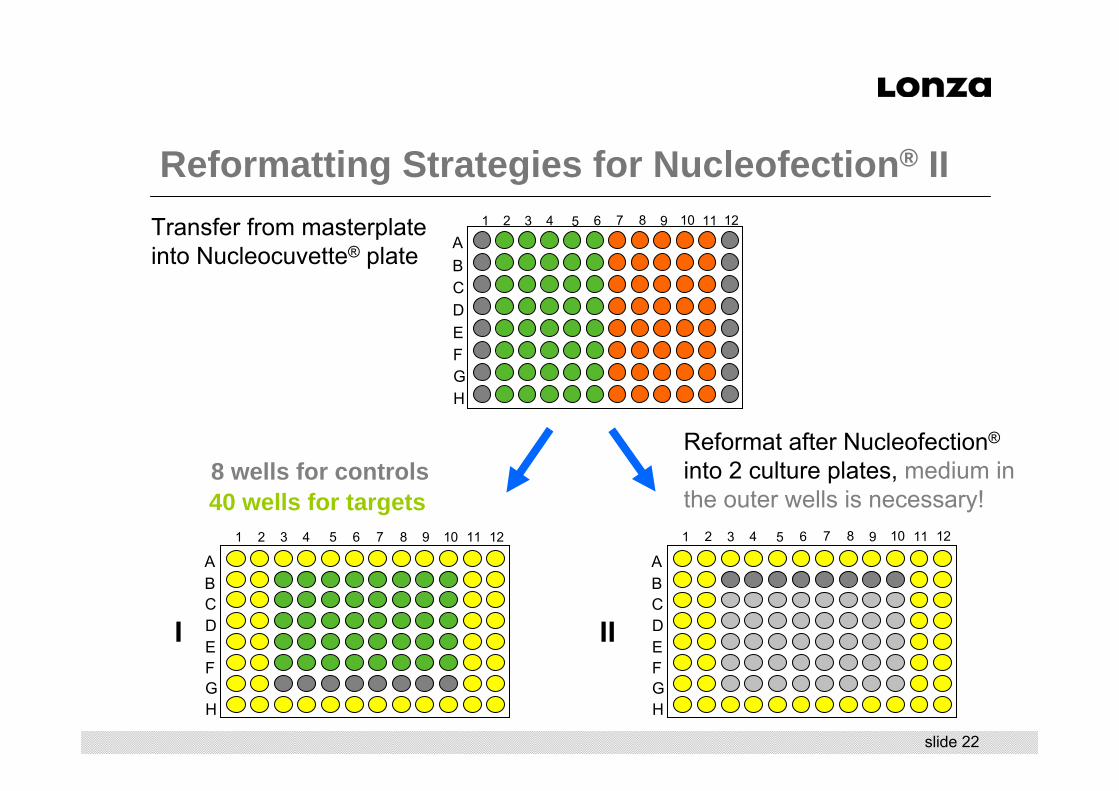
slide 22
Transfer from masterplateinto Nucleocuvette® plate
ABCDEFGH
1 2 3 4 5 6 7 8 9 10 11 12 1 2 3 4 5 6 7 8 9 10 11 12
ABCDEFGH
Reformat after Nucleofection®
into 2 culture plates, medium in the outer wells is necessary!
I II
8 wells for controls40 wells for targets
ABCDEFGH
1 2 3 4 5 6 7 8 9 10 11 12
Reformatting Strategies for Nucleofection® II

slide 23
020406080
100120140160180
B02 F02 G05 G09 E11 Avg C02 G02 G06 G10 D11 Avg D02 G03 G07 G11 C11 Avg E02 G04 G08 F11 B11 Avg
untreated siControl PLK1 CHEK1
RFU
Z‘ =0.43
plate positions
Z‘ =0.55
siRNA Screen in Primary HUVEC CellsPrimary Screen: Reproducibility of controls example plate
High reproducibility of controls (untreated cells, siCONTROL®, PLK-1, CHEK1) independent of plate position
Data generated in collaboration with

slide 24
020406080
100120140160180
1 2 3 4 5 6 7 8 9 10 11 12 13 14 15 16 17 18 19 20 21 22 23 24
plate #
RFU
no program siControl PLK1 CHEK1
Primary Screen: Reproducibility of controls over all plates
Data generated in collaboration with
siRNA Screen in Primary HUVEC Cells
slide 25
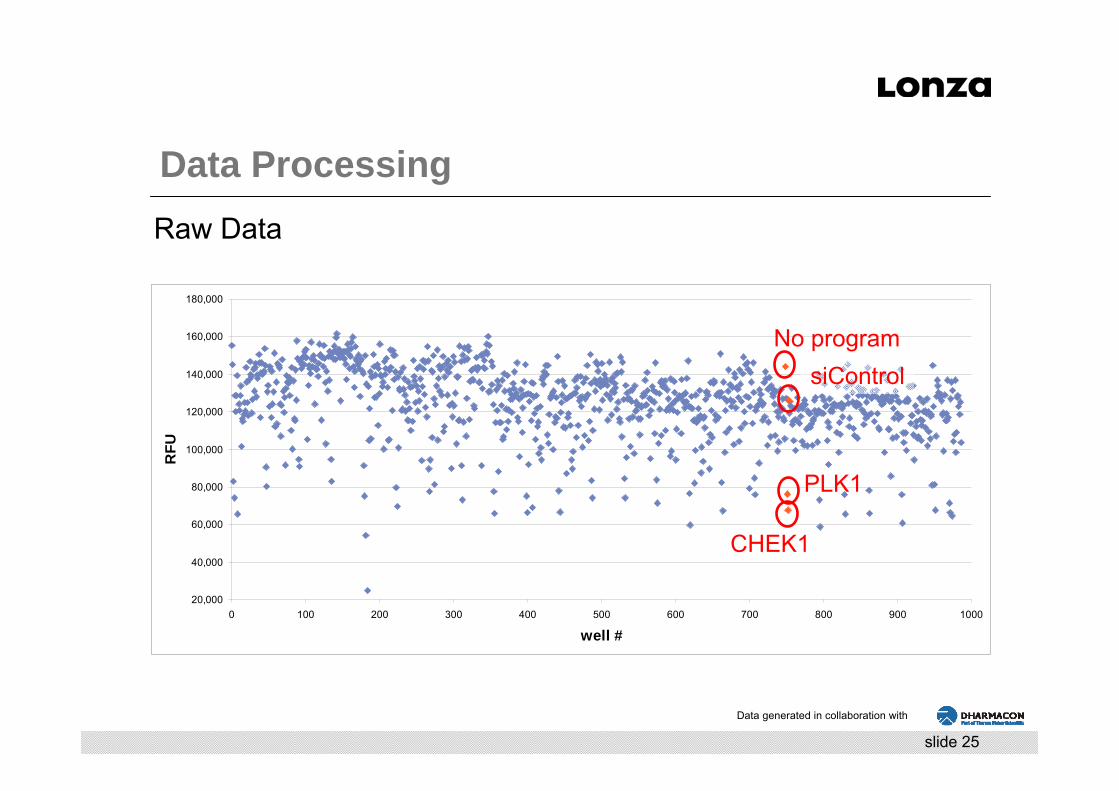
20,000
40,000
60,000
80,000
100,000
120,000
140,000
160,000
180,000
0 100 200 300 400 500 600 700 800 900 1000
well #
RFU
No programsiControl
CHEK1
PLK1
Raw Data
Data generated in collaboration with
Data Processing

slide 26
robust Z-score
-16
-14
-12
-10
-8
-6
-4
-2
0
2
4
6
0 100 200 300 400 500 600 700 800 900
PLK-1
CHEK-1CHEK-1
PLK-1
Data generated in collaboration with
Data normalization robust Z-Score
Data Processing
In total > 40 primary hits showing reproducible effects >2x MAD of the plate mean
robust Z-Score

slide 27
-14-12-10
-8-6-4-2024
CO
PB2
CN
KSR1
RAPG
EF3
CD
K4
CH
EK1
PYCS
IRAK3
PFKFB3
NLK
MYC
RPS6KL1
EDN
2
PKM2
MST1R
RIO
K1
MAR
K3
PLK2
PIK3C2A
CEN
PE
PLK1
DYR
K4
CKM
T1
CAR
KL
FGFR
1
MAPK11
IKBKB
FLJ13052
FGFR
3
RPS6KC
1
LMTK3
PRKAG
3
PRKC
B1
STK24
NR
BP
FN3KR
P
NEK6
LIM
TESK1
TGFBR
1
r-Z-S
core
Screen 1Screen 2Screen 3
Data generated in collaboration with
Hits sorted by rZ-Scores
Primary Screen: Comparison of three Screens
siRNA Screen in Primary HUVEC Cells
Good correlation between individual screens

slide 28
robust Z score correlation plot
-15-12
-9-6-303
-15 -12 -9 -6 -3 0 3 6
Screen 2
Scre
en 3
COPB2
CNKSR1
RAPGEFCDK4
MYCPYCS
CHEK1
TGFBR1
Primary Screen: Correlation of two Screens
siRNA Screen in Primary HUVEC Cells
Data generated in collaboration with
Good correlation between individual screens

slide 29
ConfirmationRetest identified Hits with same substrate with higher n’s
Redundancy De-convolution of siGENOME™ SMARTpool® (Dharmacon)
Test of 4 different single siRNAsOTP SMARTpool®
Different substrate, contains siRNA sequences different from thesiGENOME™ SMARTpool®
Dose Response
siRNA Screen in Primary HUVEC Cells Validation Strategy

slide 30
2-4 single siRNAs show same phenotype as the poolOTP pools also confirm phenotype (different sequences!)
0%
20%
40%
60%
80%
100%
siC
CH
EK
1si
G p
ool
siG
#1
siG
#2
siG
#3
siG
#4
OTP
poo
lsi
CC
HE
K1
siG
poo
lsi
G #
1si
G #
2si
G #
3si
G #
4O
TP p
ool
siC
CH
EK
1si
G p
ool
siG
#1
siG
#2
siG
#3
siG
#4
OTP
poo
lsi
CC
HE
K1
siG
poo
lsi
G #
1si
G #
2si
G #
3si
G #
4O
TP p
ool
C CDK4 C COPB2 C MYC C PYCS
rel.
viab
ility
[% o
f siC
ontro
l]
Dat
a ge
nera
ted
in c
olla
bora
tion
with
siRNA Screen in Primary HUVEC Cells Validation of TOP Hits

slide 31
Strong correlation of phenotype and knockdown CDK4
OTP and 4 of 4 single siRNAs show phenotype, as well as, KD COPB2
KD above 80% at 24h required for phenotype
OTP and 2 of 4 single siRNAs show phenotype, as well as, KD
0%
20%
40%
60%
80%
100%
120%si
C
CHEK1
siG
poo
l 1µM
siG
poo
l 0,5
µM
siG
poo
l 0,2
5µM
siG
#1
siG
#2
siG
#3
siG
#4
OTP
poo
l
siC
CHEK1
siG
poo
l
siG
poo
l 0,2
5µM
siG
poo
l 0,1
µM
siG
#1
siG
#2
siG
#3
siG
#4
OTP
poo
l
C CDK4 C COPB2
0%
20%
40%
60%
80%
100%
120%
siC
siG
poo
l 1µM
siG p
ool 0
,5µM
siG p
ool 0
,25µ
M
siG #
1
siG #
2
siG #
3
siG #
4
OTP
poo
l
siC
siG
poo
l 1µM
siG p
ool 0
,25µ
M
siG p
ool 0
,1µM
siG #
1
siG #
2
siG #
3
siG #
4
OTP
poo
l
C CDK4 C COPB2
0%
20%
40%
60%
80%
100%
120%
siC
siG
poo
l 1µM
siG p
ool 0
,5µM
siG
poo
l 0,2
5µM
siG #
1
siG #
2
siG #
3
siG #
4
OTP
poo
l
siC
siG
poo
l 1µM
siG
poo
l 0,2
5µM
siG p
ool 0
,1µM
siG #
1
siG #
2
siG #
3
siG #
4
OTP
poo
l
C CDK4 C COPB2
Cel
l tite
r72
h72
h
mR
NA
24h
Validation of TOP HitsDeconvolution of pools, phenotype vs KD
Data generated in collaboration with

slide 32
Summary
Sam
ple
num
ber
Large libraries
focused libraries
Selected hits
Top hits
Ass
ay
com
plex
ity
siRNA Screen in Primary HUVEC Cells
890 targetsin SMARTpool®
~40 Hitsselected by statistics
16 Hits selected for validation
6 Targets confirmed with independent substrates(incl. controls)

slide 33
AgendaHigh-Throughput Applications Based on Cell Engineering
Functional siRNA ScreeningKinome/Cell Cycle siRNA Screening in Human Umbilical Vein Endothelial Cells
Functional Fas-apoptosis Screen in Jurkat T Lymphocytes
Cell Engineering with Non-Nucleic Acid Molecules
Cell Engineering in High Throughput

slide 34
Human siARRAY® ON-TARGETplus™ Apoptosis (Dharmacon):SMARTpool® siRNA targeting 558 genes
siRNA libraries
Untreated cells (in 96-well Solution only)Negative control: siCONTROL® non-targeting siRNA #1 (Dharmacon)Positive controls: SMARTpool® ON-TARGETplus™targeting FAS or Casp 3 (both Dharmacon)
Controls
Induction of apoptosis with Fas-ligand 48h post transfectionCell viability using CellTiter-Glo® assay (Promega) Casp 3/7 using Apo-One® assay (Promega)Data analysis:Z’ factor of controls (quality of experiment)robust Z-score (hit identification)
Analysis
siRNA Screen in Jurkat T Lymphocytes

slide 35
FAS-L caspase 3
apoptosis
FAS
Contributes to peripheral depletion of lymphoid cells Maintenance of self-toleranceDown-regulation of the immune response and homeostasis of the immune system
FAS-Mediated Apoptosis

slide 36
0
50000
100000
150000
200000
250000
300000
Fas siRNA siCONTROL
1 pmol (50 nM)
RLU
Caspase Activity (Caspase-GloTM Assay, Promega corp.)
020000400006000080000
100000120000140000
Fas siRNA siCONTROL
1pmol (50 nM)
RLU
Cell Viability Assay(CellTiter-Glo® Assay, Promega corp.)
Before inductionAfter induction
Phenotypic Knockdown of FAS-Mediated Apoptosis
Data generated in collaboration with

slide 37
First screen assays established only with FAS as positive control
Only FAS detected in screenResponses from other pathway members too weak for consistent results
Conditions were “tweaked” using different positive controlsFAS apoptosis screen repeated
siRNA Screen in Jurkat T Lymphocytes First Results

slide 38
siRNA Screen in Jurkat T Lymphocytes
Optimization of assay parameterssiRNA concentrationsiRNA type (siGENOME®, ON-TARGETplus®, Dharmacon)Cell number during Nucleofection®
Cell plating densityCulture volumeTime point of apoptosis inductionInducer concentrationInduction time before analysisChoice of assays (Cell titer, caspase activity)
FAS-mediated apoptosis – assay setupcaspase3
apoptosis
FASFAS-L
caspase3
apoptosis
FASFAS

slide 39
Data generated in collaboration with
Jurkat FAS screen, CTG
-10
-5
0
5
10
15
20
25
30
35
40
0 80 160 240 320 400 480 560
robu
st Z
-sco
re
BAK1
APAF1CASP8 CASP3
DFFB
FADD
PARP1
FAS
SPATA3
False positive
n=3
Primary Screen Data, Cell Titer Glo Assay
Hits sorted by mean of rZ-Scores of three screensVery good correlation between the three screensOne apparent false positive (identified by screen repetition)
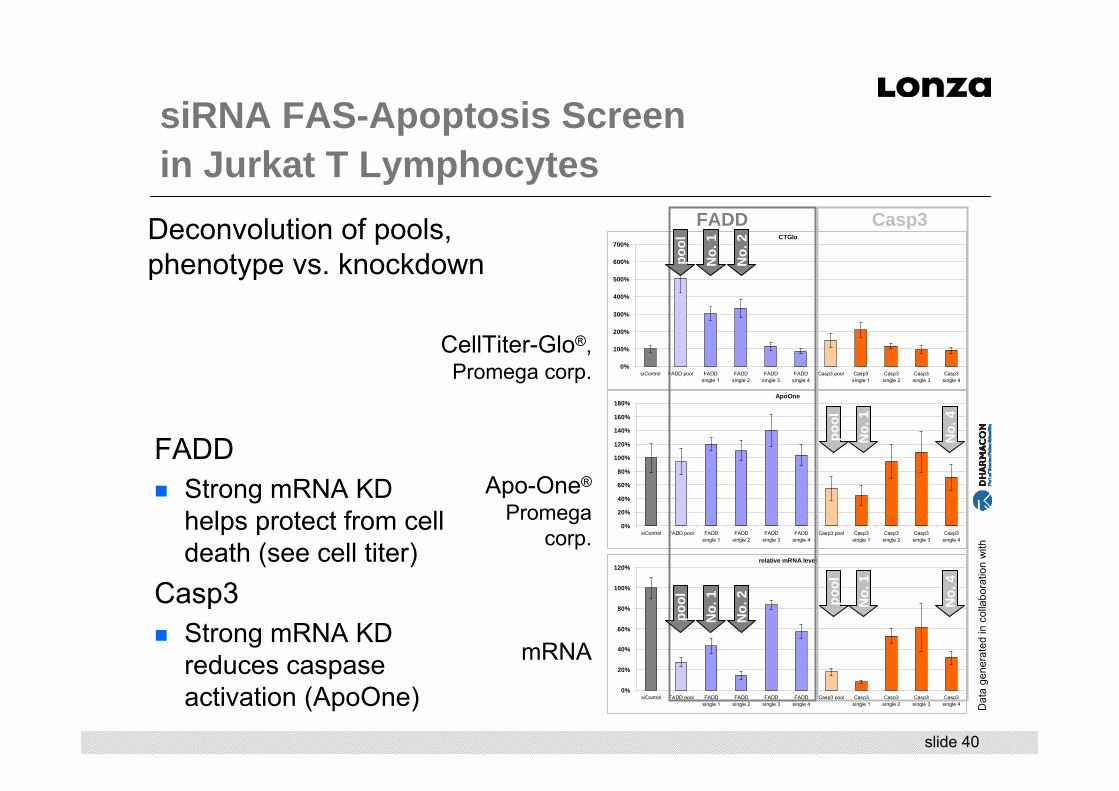
slide 40
FADDStrong mRNA KD helps protect from cell death (see cell titer)
Casp3Strong mRNA KD reduces caspase activation (ApoOne)
CellTiter-Glo®, Promega corp.
Apo-One®
Promegacorp.
mRNA
Dat
a ge
nera
ted
in c
olla
bora
tion
with
CTGlo
0%
100%
200%
300%
400%
500%
600%
700%
siControl FADD pool FADDsingle 1
FADDsingle 2
FADDsingle 3
FADDsingle 4
Casp3 pool Casp3single 1
Casp3single 2
Casp3single 3
Casp3single 4
ApoOne
0%
20%
40%
60%
80%
100%
120%
140%
160%
180%
siControl FADD pool FADDsingle 1
FADDsingle 2
FADDsingle 3
FADDsingle 4
Casp3 pool Casp3single 1
Casp3single 2
Casp3single 3
Casp3single 4
relative mRNA level
0%
20%
40%
60%
80%
100%
120%
siControl FADD pool FADDsingle 1
FADDsingle 2
FADDsingle 3
FADDsingle 4
Casp3 pool Casp3single 1
Casp3single 2
Casp3single 3
Casp3single 4
FADD Casp3
pool
No.
1
No.
2
pool
No.
1
No.
4
pool
No.
1
No.
4
pool
No.
1
No.
2
siRNA FAS-Apoptosis Screen in Jurkat T Lymphocytes
Deconvolution of pools,phenotype vs. knockdown

slide 41
Hit list indicates that FAS apoptosis in Jurkat might primarily use the mitochondrial route
BAK1
Cell titerFAS
FADDBAK1DFFB
PARP1APAF1CASP3
TNFRSF1ATRIM35CASP8
ApoOne/cell titer
BAK1FAS
CASP3APAF1FADD
ALOX12ITGB2LY86LTBR
TP53INP1
siRNA FAS-Apoptosis Screen in Jurkat T Lymphocytes
Dat
a ge
nera
ted
in c
olla
bora
tion
with

slide 42
AgendaHigh-Throughput Applications Based on Cell Engineering
Functional siRNA ScreeningKinome/Cell Cycle siRNA Screening in Human Umbilical Vein Endothelial Cells
Functional Fas-apoptosis Screen in Jurkat T Lymphocytes
Cell Engineering with Non-Nucleic Acid Molecules
Cell Engineering in High Throughput
slide 43
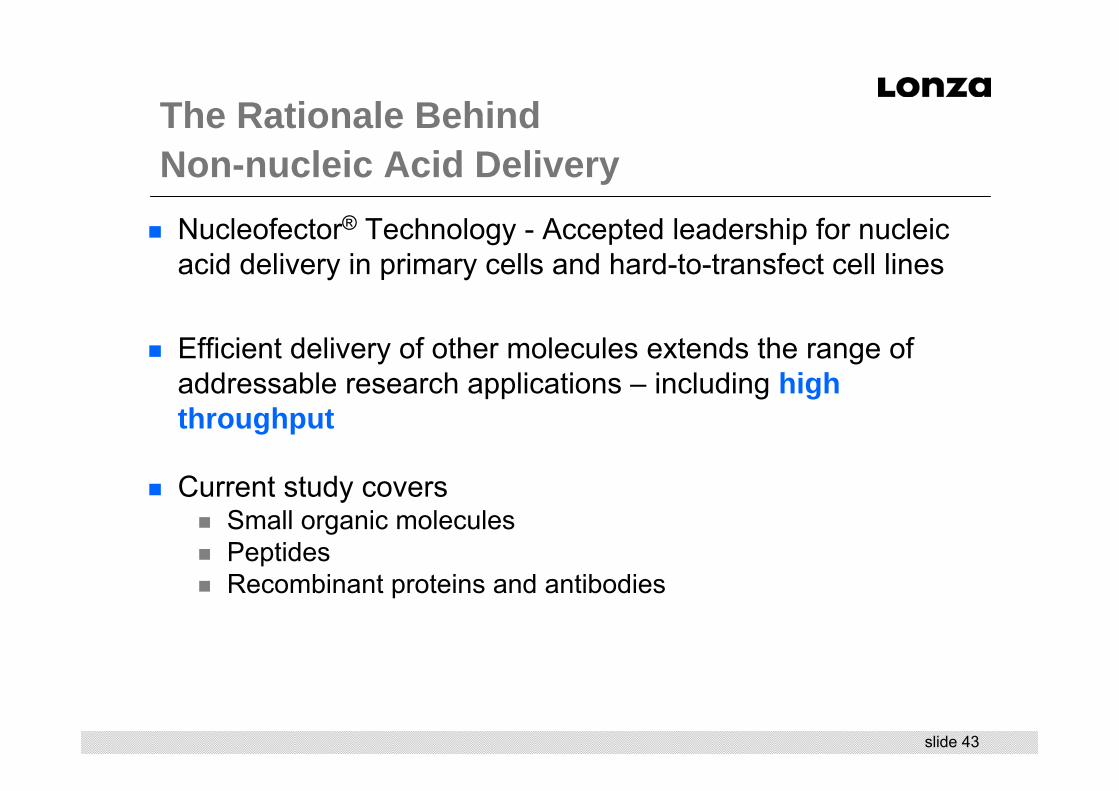
The Rationale Behind Non-nucleic Acid Delivery
Nucleofector® Technology - Accepted leadership for nucleic acid delivery in primary cells and hard-to-transfect cell lines
Efficient delivery of other molecules extends the range of addressable research applications – including high throughput
Current study coversSmall organic moleculesPeptidesRecombinant proteins and antibodies

slide 44
Small organic molecules:Extension / prioritization of lead candidate pipeline by pharma customers by in-vitro validation of compounds transfected by Nucleofection®
Allow customers to screen / validate compounds not permeating membranesExtending available pool of compounds beyond Ro5 (Lipinski)
PeptidesDelivery of peptides for target and pathway validation Enable systems biology approaches by complementing RNAi analysis
Applications

slide 45
Proteins Use as a tool for functional validation of pathways Functional in-vitro validation of recombinant proteins
AntibodiesUse as specific intracellular labels or functional entities (e.g. inhibitory)Intracellular trafficking & pathway validation
Applications
slide 46
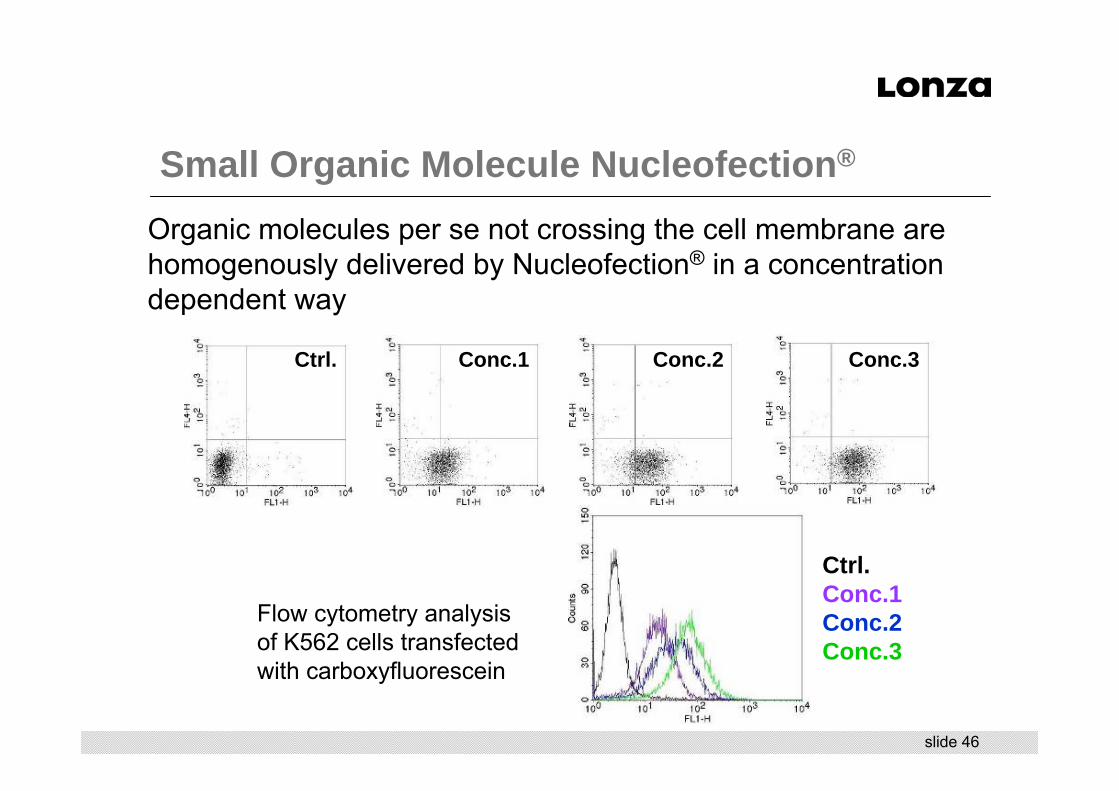
Ctrl. Conc.1 Conc.2 Conc.3
Ctrl.Conc.1Conc.2Conc.3
Small Organic Molecule Nucleofection®
Organic molecules per se not crossing the cell membrane are homogenously delivered by Nucleofection® in a concentration dependent way
Flow cytometry analysis of K562 cells transfected with carboxyfluorescein

slide 47
Effekt der extrazell. Inkubation von Staurosporin (7.5 µM) auf HeLa% Viabilität bezogen auf unbehandelte Kontrolle (=100 %)
100.00
63.51
0
20
40
60
80
100
120
-/-/- + Inh.
o. Puls o. Puls
Effect: - 36 %
Effect of extracellular compound Effekt des Nukleofektions-Pulses auf HeLa% Viabilität bezogen auf unbehandelte Kontrolle (=100 %)
100.00
20.57
0
20
40
60
80
100
120
-/-/- + Inh.
o. Puls Puls 16
Effect: - 79.43 %Effect:
- 79 %
Effect of transfected compound
% v
iabi
lity
% v
iabi
lity
Small Organic Molecule Nucleofection®
Transfected organic molecules exhibit functional in-vitro activity
Viability analysis of Jurkat cells transfected with staurosporin

slide 48
Time course fluorescence intensity analysis of wt MDCK after Nucleofection® with calcein
Efflux kinetics Rhodamine 123Normalized (0 min = 100 %)
0
20
40
60
80
100
120
--- bkg 0 min. 2 min. 5 min. 10 min 30 min. 1h
wt MDCK stable-transfected MDCK
MDCK, Efflux kinetics of Calcein (10 µM)
0
100
200
300
400
500
600
700
800
900
--- bkg 0 min. 30 min. 60 min. 120 min 240 min.
x-m
ean
of c
ells
0
10
20
30
40
50
60
70
RLU
of s
uper
nata
nt
FL1 x-mean (FACS) Supernatant
Efflux kinetic comparison of wt MDCK vs. MDCK over-expressing MDR1 transporter
Small Organic Molecule Nucleofection®
Transfected organic molecules are specifically excreted via drugtransporter proteins

slide 49
SH-SY5Y cells transfected with fluorescently tagged 8 AA-peptide (flow cytometry analysis)
SH-SY5Y cells 2 hours post Nucleofection® with fluorescently tagged 8 AA-peptide (confocal images)
- peptide / - pulse+ peptide / - pulse+ peptide / + pulse
Peptide Nucleofection®
Peptides from 8 to 36 amino acids are efficiently delivered by Nucleofection®

slide 50
NuFe vs. competitor C
0
20
40
60
80
100
120
1 2 3 4 5 6 7
untreated ctrl 25 µM 25 µM 25 µM
inhibitory inhibitory inhibitory
+ pulse - + + competitor + competitor
+ TNF stimulation
Nor
mal
ized
Luc
ifera
se a
ctiv
ity (C
trl =
100
%
CHO-K1 Cells stably transfected with a Luciferase reporter of NF-кBpathway activity. Cells were stimulated using Tumor Necrosis Factor (TNF) and luciferase activity was assessed 30 minutes after peptide delivery.
Peptide Nucleofection®
Transfected peptides exhibit functional activity

slide 51
0
20
40
60
80
100
120
140
160
180
200
Autofluorescence Protein Protein + Program1
Protein + Program2
Jurkat cells transfected with fluorescently tagged ovalbumin
HeLa cells transfected with fluorescently tagged GαMIgG
0
20
40
60
80
100
120
Autofluorescence Antibody Antibody+Pulse
Recombinant proteins are efficiently delivered by Nucleofection®
Full size antibodies are delivered by Nucleofection®
Protein Nucleofection®

slide 52
Summary
Manipulation of eukaryotic cells by introducing nucleic acids and other substrates goes HT
Meaningful screening needs careful optimization and standardization of cell culture workflows and assay conditions
Functional siRNA Nucleofection® screening campaigns in difficult-to-transfect cell types relevant for bio-medical research are feasible while maintaining cellular functions

slide 53
Summary
Reproducible and comfirmable hits were identified for:
Cell proliferation in the HUVEC cell model for angiogenesisFas-mediated apoptosis pathway in the T lymphocyte model Jurkat cells
Upcoming applications for cellular delivery of non-nucleic acids

slide 54
Acknowledgements
Amaxa, a Lonza companyNicole SpottkeSheila OffizierSandra DomzalskiSonja SpickerMarkus ZumbansenLudger Altrogge
Thermo Fisher ScientificDharmacon products, Lafayette, CODevin Leake
Schering AG, BerlinClaudia Merz
Qui VanDaniela LitzenbergerYvonne StrübingMichael Kazinski

Thank you for your attention!
Tecan Symposium 2008
Herbert Müller-HartmannDirector R&Damaxa AG, a Lonza company