Embed Size (px)
DESCRIPTION
Team Valeo. Team Members Stefan Enjem – ISE Joe Van Hofwegen - ISE Young Lee - ISE Joe Pecht - ME Walter Freitag - ME Jason Zion - ME Luis Garcia - EE. Hydraulic Fan Motors. Who uses them? Why are they used? How are they built?. Needs Assessment. QPH (9) - PowerPoint PPT Presentation
Citation preview
Team MembersStefan Enjem – ISE
Joe Van Hofwegen - ISEYoung Lee - ISEJoe Pecht - ME
Walter Freitag - MEJason Zion - MELuis Garcia - EE
IEIE
MEMEEEEE

Hydraulic Fan Motors
Who uses them? Why are they used? How are they built?

Needs Assessment
QPH (9)4 to 6% Increase in Production2 year paybackSafety and Quality

Organization
Scope and Resource DistributionWork Breakdown Structure
SchedulingGantt Chart
CommunicationYahoo Web Group

Deliverables
Standardized Procedures
Preventative Maintenance
Set Production Guidelines
Fix Problematic Stations
End of Line Tester Efficiency
Identify improved system configurations

Organizational Structure
Project ManagerStefan Enjem
ProceduresJason Zion
Problem Stations
Joe Pecht
EOLTWalter Freitag
Simulation Joe VH
Data AnalysisYoung Lee
ControlsLuis Garcia

Data Collection and Analysis
Data Collection
Motor Counters
EOLT Data Sheets
Cycle Time
Historical Data

Bottleneck Identification Histogram shows major sources of backup
0
10
20
30
40
50
60
90 100
110A
110B
120A
120B 13
0
140A
140B
150A
150B 16
0
170A
170B 18
0
190
200A
200B 20
5
210
230A
230B
EO
L
Station
Cy
cle
Tim
e (
se
co
nd
s)
Direction of Assembly
Manual
Automated

Micro-stop
Micro stop = Downtime of less than 5 minutes
0
50
100
150
200
250
300
350
400
450
Station 210 Station 140 Station 230 Station 200 Station 170
Station
Freq
uenc
y of
Mic
rost
op
(app
rox
6 w
eeks
)
Cumulative Sum

Industrial Standards
Clean RoomCertified Class 100,000
QS 9000Quality standard TS 16949
Valeo Union Standard423 minutes per shift
Ergonomic Guidelines

Detailed ProceduresStandard Procedures
Worker Rotation Failure Response Plan

Manual Stations
Current Problems
Concept for Improvements
Expected Improvements
Station 90 Station 160

Preventative Maintenance
Creation of a Preventative Maintenance Schedule

Station 210
• Current ProblemsCamera for Optical Test
Leak Test Connectors

•Concepts for Improvement–Mirror
–PM on Rubber Connectors
•Expected Improvements–Reduction in Downtime
Rubber Connectors
Station 210

End of Line Tester
Function Current Problems Feasibility of
Concepts

Mounting Concept
Linear Slide Mount
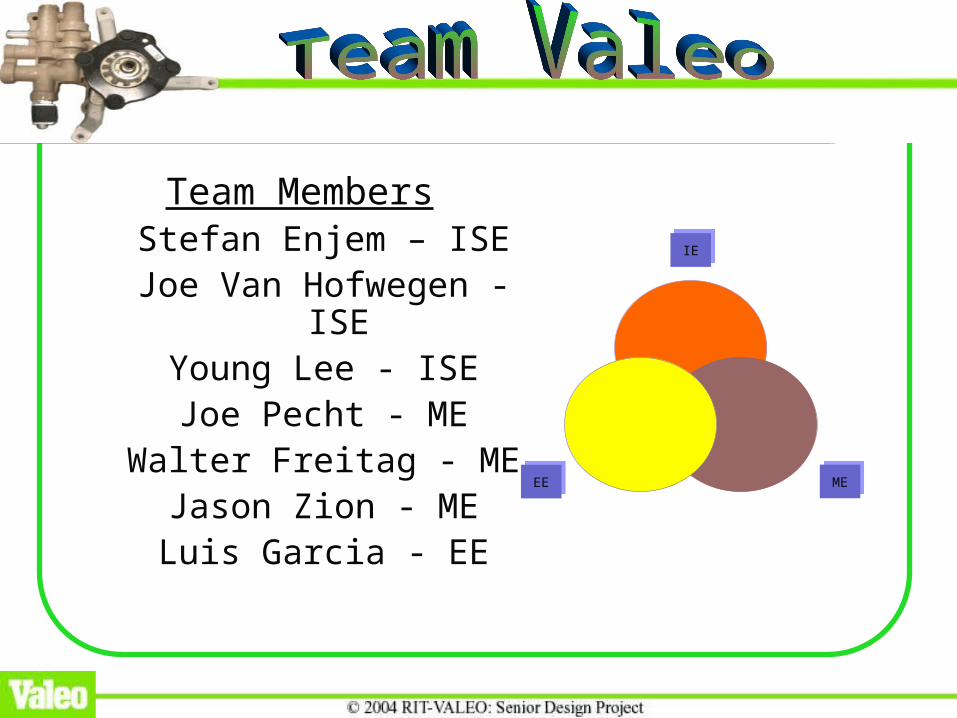
Mating Concept
Modified Assembly Cell Balancer

Technical Analysis
FEA Air Cylinder Sizing Expected
Improvements

Arena Simulation – Our Test Plan
Analyze system as a whole Identify optimal system configuration and
alternatives Using pallets, conveyor speed, queue sizes
Justify Improvements
Qualifier Improvement Winner Improvement4% 8%

Cost Analysis of Total System
Improvement Cost OT Saved (After 2yrs)Total 61,347.00$ 157,831.80$
• Estimated Cost Analysis
Interest Rate 5%
Total Cost ($61,347.00)Return After 1 Year 78,915.90$ Return After 2 Years 157,831.80$
Net Present Value $81,323.85
• Net Present Value

Future of Project Engineering Models Head start
Simulation Stations
Detailed Design Meet the Goal

Backup - Bill of Materials Bill of Materials*
Station Part # Quantity Unit Description Production
Board 518936 1 Each 3' by 5" Dry erase Board
1 Each 1foot of stock aluminum 2 Each Machined steel block to hold marker cap Station 160 3 Each Bracket Hardware to support cap holder
INRD-50 1 Each DVT Doal light source, 50mm
INOO-S12 1 Each DVT Doal light source Power Supply Station 210 1 Each Rubber connector
- - Required Mounting Hardware
EOLT FO-501.500 4 Each Bimba Pnuematic Air Cylinder 2 Each Custom Motor Mounting Plate 2 Each Custom 1/2" Motor Mounting Bracket 2 Each Custom 3/4" Motor Mounting Bracket 2 Each Custom 1" Motor Mounting Bracket
MM-C
6498K266 6 Each Spring-Return Pivot-Mount Cylinder --------- 2 Each Press Fit Connector Assembly 2 Each Custom Connector Base Plate 2 Each Custom Connector Plate - - Required Hydraulic/Pneumatic Plumbing - - Require Mounting Hardware
5 Each EDI Digital counters Timer
5 Each EDI Mounting brackets for timer * Tentative Bill of Material Station 90: Cavalry Automation Systems has been awarded the contract to implement The improvements being made to this system at a cost of $6,910.

Backup - RegressionManpower vs. Motors Out
y = -10.49x2 + 107.09x + 35.586R2 = 0.4265
0
50
100
150
200
250
300
350
400
450
500
1 2 3 4 5 6 7 8
Manpower
Mo
tors
Ou
t
Manpower vs. QPH y = 1.8564x2 - 30.104x + 160.97
R2 = 0.5938
0.00
20.00
40.00
60.00
80.00
100.00
120.00
140.00
160.00
180.00
200.00
0 1 2 3 4 5 6 7 8
Manpower
QP
H

Backup – Bottleneck RankBottleneck Ranks
Rank Station Avg Cycle Time
1 EOL 44.07
2 90 36.93
3 160 35.48
4 100 22.18
5 170A 21.17
6 140A 20.85
7 200B 20.80
8 110B 20.50
9 120B 19.66
10 210 17.71
11 140B 17.20
12 180 16.85
13 205 16.69
14 120A 15.86
15 150B 15.07
16 190 15.01
17 200A 14.94
18 110A 14.88
19 150A 12.95
20 170B 11.65
21 230B 11.48
22 230A 10.78
23 130 6.29

Backup - WBS

Backup –Gantt Chart

Backup – Counter DataMotor Count Log
Date Shift Motors
Out
Motors Back
In Total Manpower QPPH
1/26/03 B 54 4 50 2 3.55 1/27/03 A 237 0 237 7 4.80 1/27/03 B 246 1 245 2 17.38 1/28/03 A 280 2 278 7 5.63 1/28/03 B No Info No Info 1/29/03 A 172 3 169 6 4.00 1/29/03 B 210 2 208 2 14.75 1/30/03 A 310 3 307 5 8.71 1/30/04 B 234 1 233 2 16.52 1/31/04 A 121 1 120 4 4.26 2/1/04 A 94 1 93 4 3.30 2/1/04 B No Info No Info 2/2/04 A 245 3 242 7 4.90 2/2/04 B 90 2 88 1 12.48 2/3/04 A 322 5 317 7 6.42 2/3/04 B 138 5 133 2 9.43 2/4/04 A 400 4 396 7 8.02 2/4/04 B 163 3 160 2 11.35 2/5/04 A 432 3 429 7 8.69 2/5/04 B 151 5 146 2 10.35
Average 216.61 2.67 213.94 4.22 8.59