Embed Size (px)
Citation preview
Team Foundation Server 2013 Boot Camp – version 2.0
Team Foundation Server 2013
Reporting Capabilities
Team Foundation Server 2013 Boot Camp – version 2.0
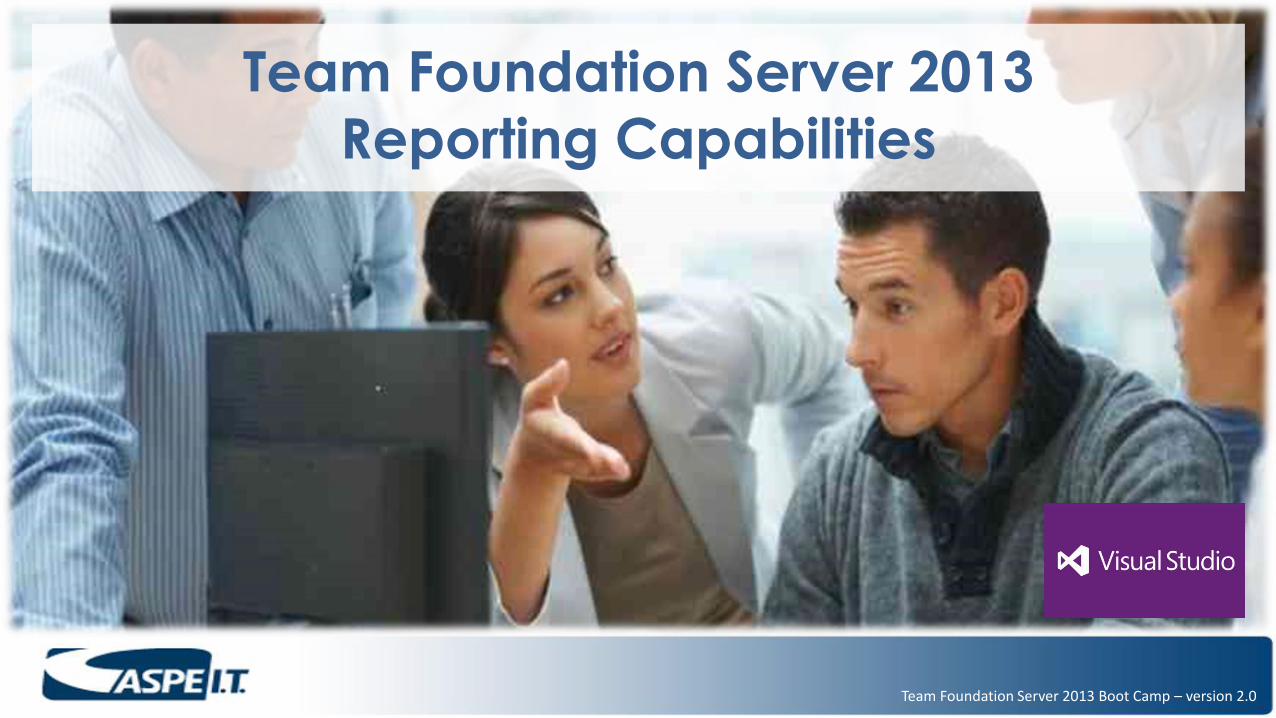
• Average cost overrun: 45%
• Time overrun: 63%
• Functionality delivered on average: 67%
• Software Errors: $59 Billion US Economy – US National Institute of Standards & Technology NIST
Source: Extreme Chaos, The Standish Group International, Inc., 2004, 2006, 2008, 2012
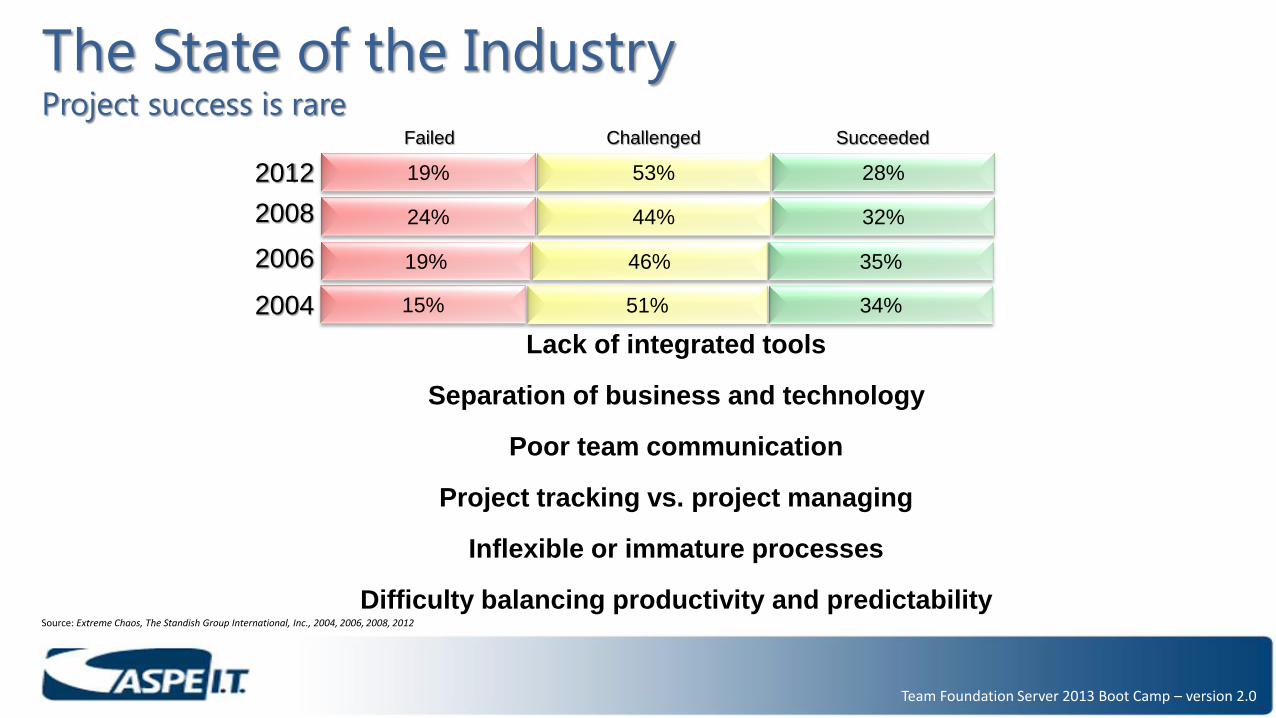
The State of the Industry Project success is rare
Succeeded Challenged Failed
2004 34% 15% 51%
2006 35% 19% 46%
2008 32% 24% 44%
28% 19% 53% 2012
Team Foundation Server 2013 Boot Camp – version 2.0
Lack of integrated tools
Separation of business and technology
Poor team communication
Project tracking vs. project managing
Inflexible or immature processes
Difficulty balancing productivity and predictability Source: Extreme Chaos, The Standish Group International, Inc., 2004, 2006, 2008, 2012
The State of the Industry Project success is rare
Succeeded Challenged Failed
2004 34% 15% 51%
2006 35% 19% 46%
2008 32% 24% 44%
28% 19% 53% 2012
Team Foundation Server 2013 Boot Camp – version 2.0
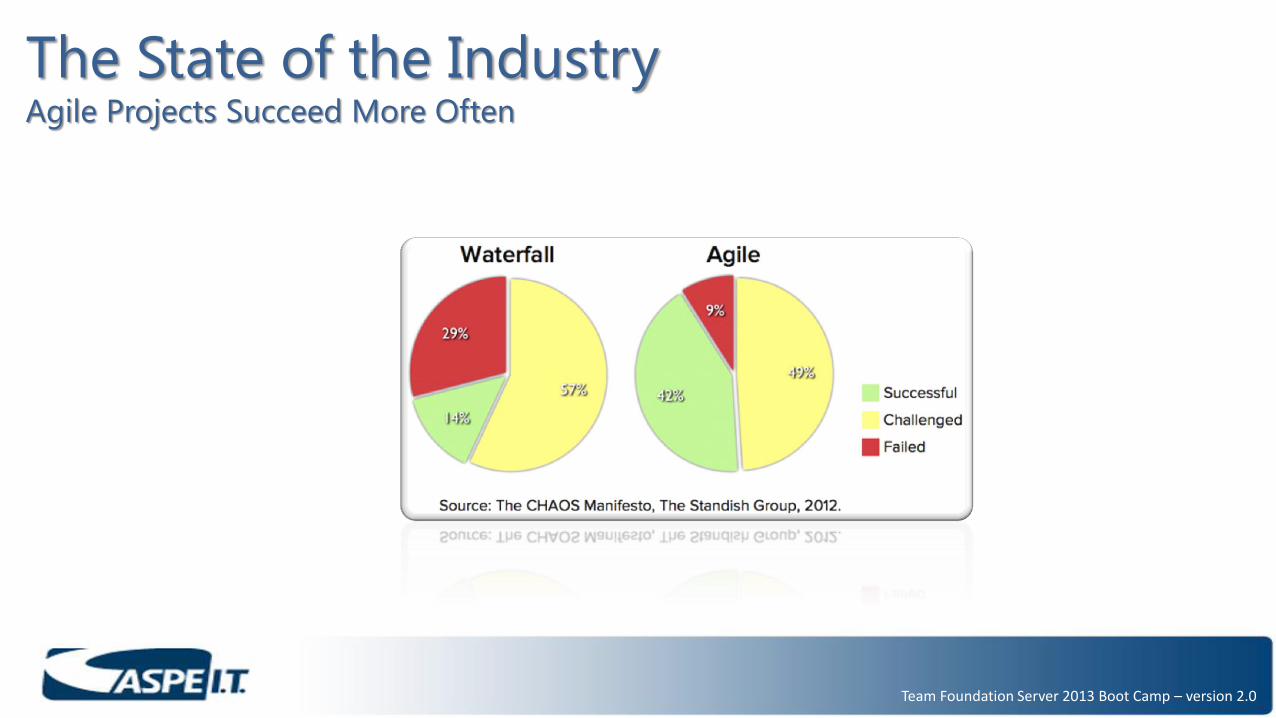
The State of the Industry Agile Projects Succeed More Often
Team Foundation Server 2013 Boot Camp – version 2.0
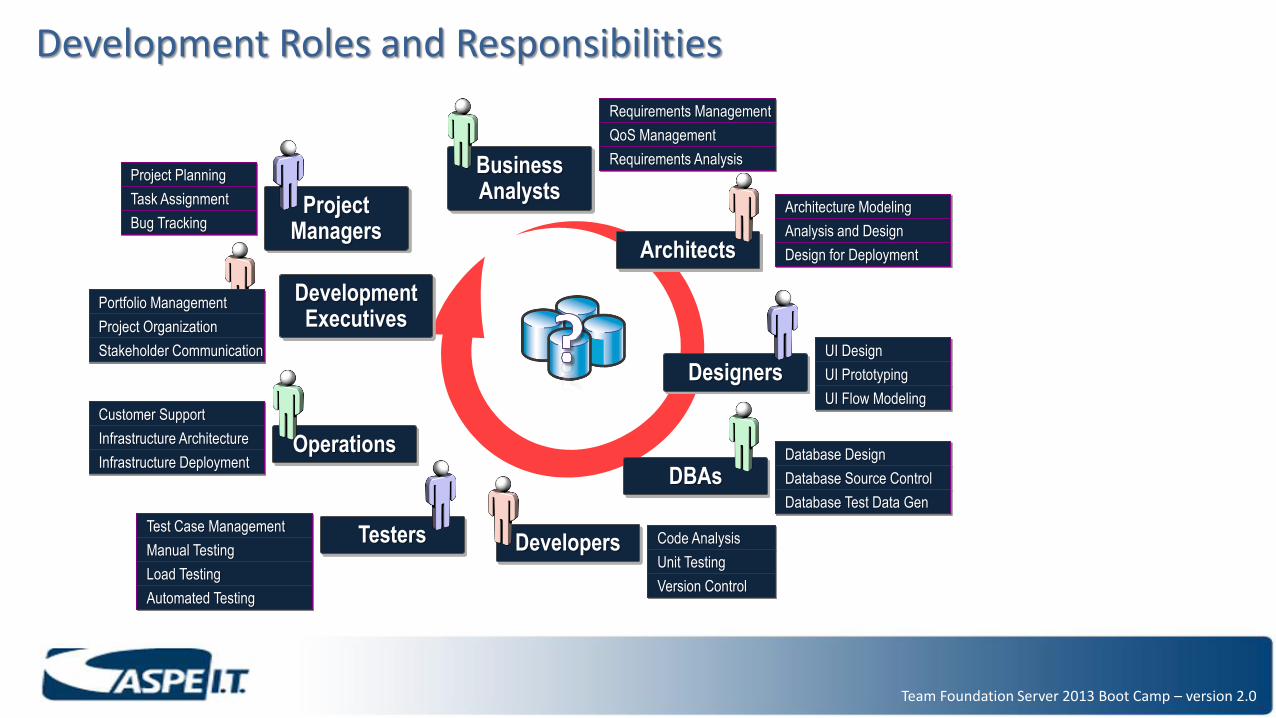
Development Roles and Responsibilities
Project Managers
Business Analysts
Architects
Designers
DBAs
Developers Testers
Operations
Development Executives
Requirements Management
QoS Management
Requirements Analysis
Architecture Modeling
Analysis and Design
Design for Deployment
UI Design
UI Prototyping
UI Flow Modeling
Database Design
Database Source Control
Database Test Data Gen
Code Analysis
Unit Testing
Version Control
Test Case Management
Manual Testing
Load Testing
Automated Testing
Customer Support
Infrastructure Architecture
Infrastructure Deployment
Portfolio Management
Project Organization
Stakeholder Communication
Project Planning
Task Assignment
Bug Tracking

Team Foundation Server 2013 Boot Camp – version 2.0
Build
Automation
What is Team Foundation Server? Integrated Platform for Collaborating on Software Development Projects.
Version
Control
Work Item
Tracking
Project
Management
Reporting
Team Foundation Server 2013 Boot Camp – version 2.0
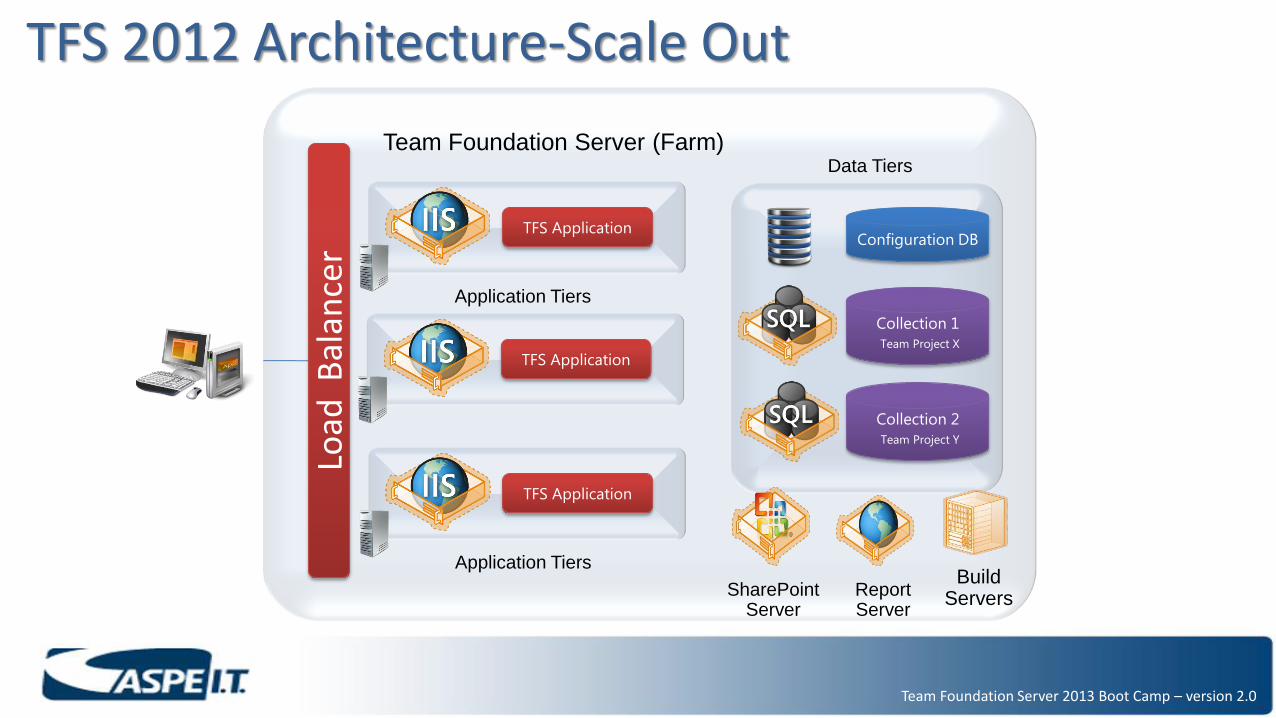
Load
Bal
ance
r
Application Tiers
Data Tiers
Configuration DB
Collection 2
Team Project Y
Collection 1
Team Project X
Application Tiers
TFS Application
Team Foundation Server
TFS Application
TFS Application
(Farm)
TFS 2012 Architecture-Scale Out
SharePoint Server
Report Server
Build Servers
Team Foundation Server 2013 Boot Camp – version 2.0
Reporting – Out of Box
Reporting Options
1) Office Integration
2) SSRS Reports (Out-of-Box)
3) Charts
4) Excel PivotTable / OLAP Reports
Team Foundation Server 2013 Boot Camp – version 2.0
Work Item Integration
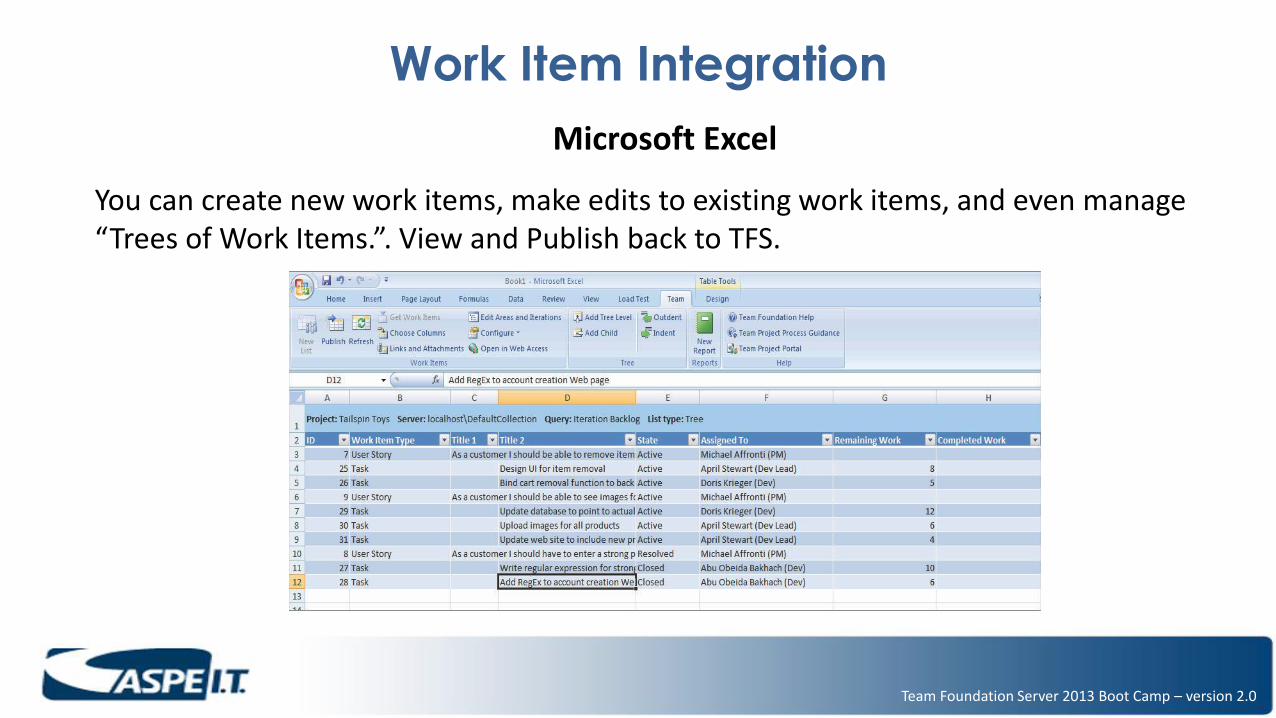
Microsoft Excel
You can create new work items, make edits to existing work items, and even manage “Trees of Work Items.”. View and Publish back to TFS.
Team Foundation Server 2013 Boot Camp – version 2.0
Work Item Integration
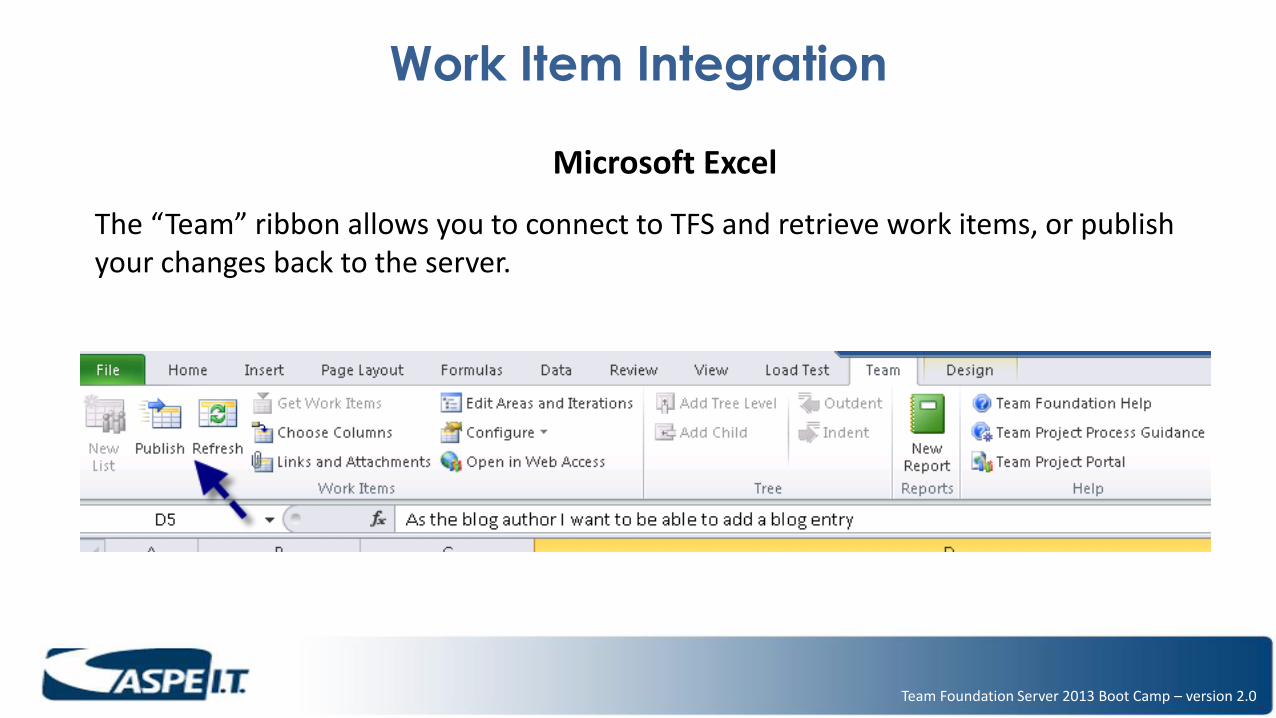
Microsoft Excel
The “Team” ribbon allows you to connect to TFS and retrieve work items, or publish your changes back to the server.
Team Foundation Server 2013 Boot Camp – version 2.0
Work Item Integration
SharePoint 2013
Integration with SharePoint includes: 1) Work Item Web Part – Within any SharePoint page, you may utilize the Work Item Query Web
Part to display a list of work items. • The list is based off an existing query, or you may create a custom query for the web part • Double clicking on a work item opens the work item edit/view screen.
2) Other Web Parts such as Recent Builds, Goto Work Item, Recent Check-ins, etc…

Team Foundation Server 2013 Boot Camp – version 2.0
Work Item Integration
SharePoint 2013 – Web Part
Team Foundation Server 2013 Boot Camp – version 2.0
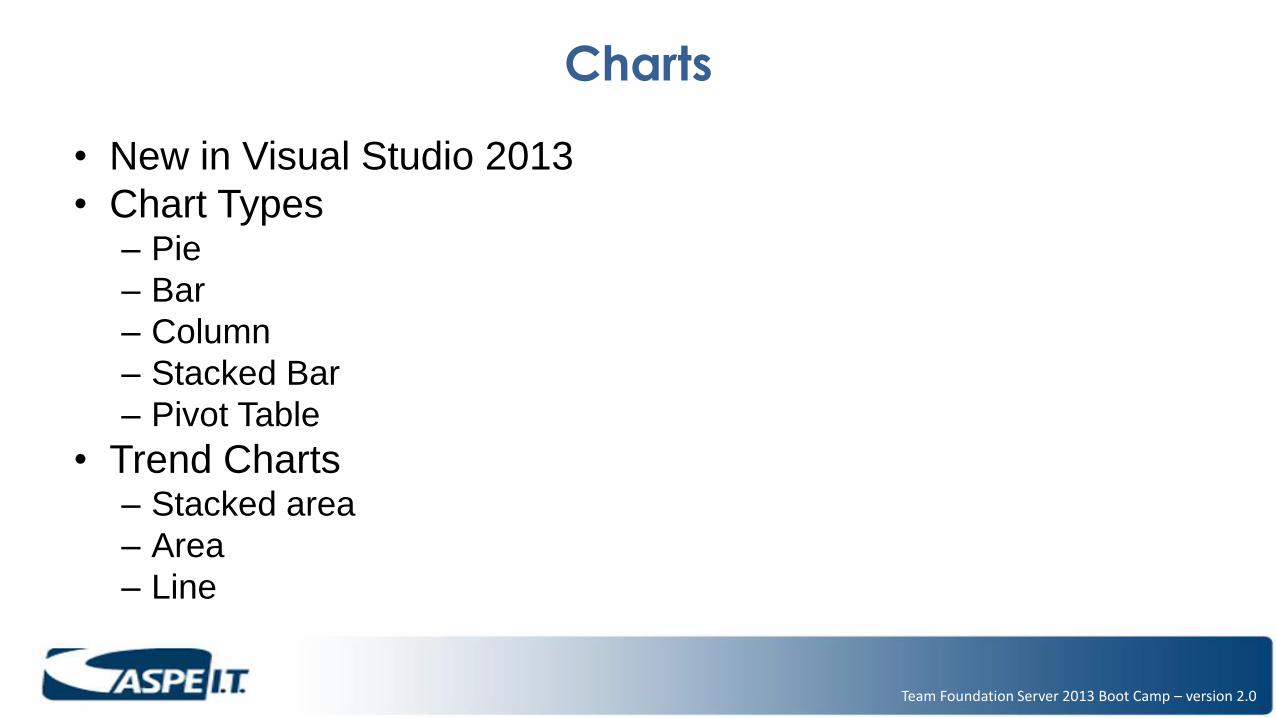
Charts
• New in Visual Studio 2013
• Chart Types – Pie
– Bar
– Column
– Stacked Bar
– Pivot Table
• Trend Charts – Stacked area
– Area
– Line
Team Foundation Server 2013 Boot Camp – version 2.0
Charts
• Charts get data from a Work Item Query
• You can have multiple charts per query
• You must use a flat-list query.
• Charts support viewing a count of work items or a sum of
values for select numeric fields, such as Remaining Work
or Original Estimate.
• All project members can view charts. To create and edit
charts, you need to have a Full Access license.
Team Foundation Server 2013 Boot Camp – version 2.0
Charts
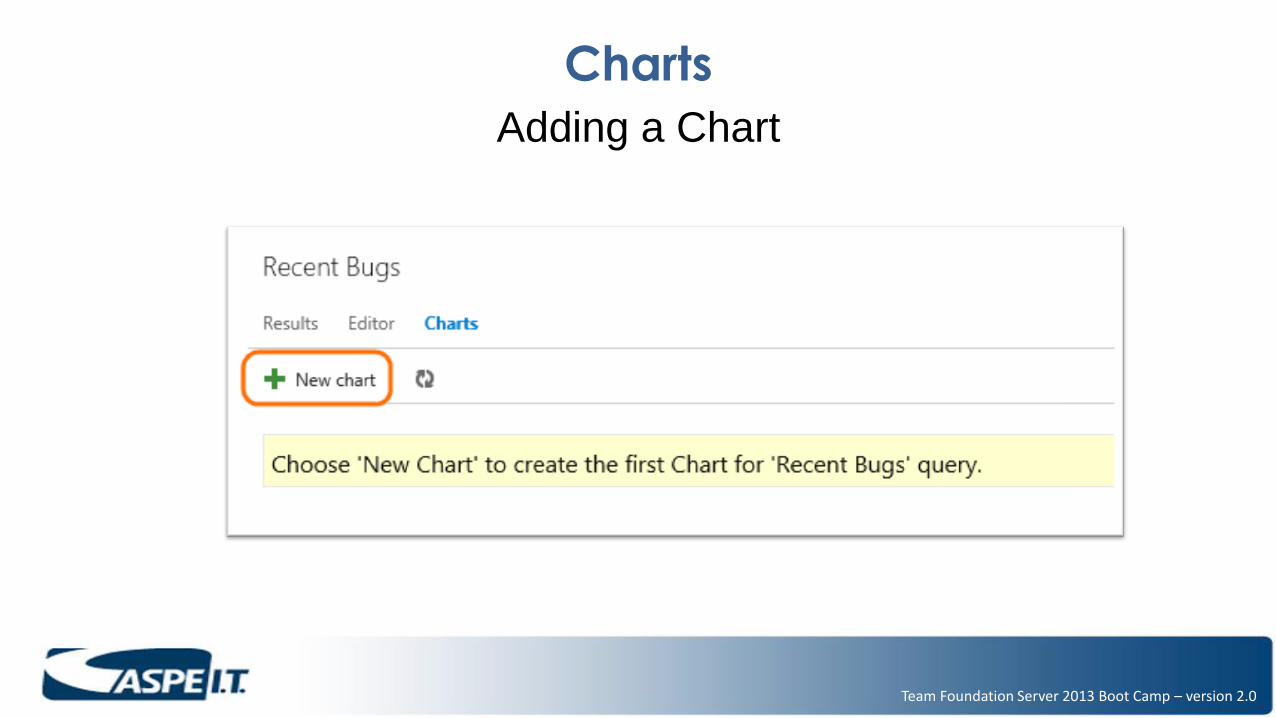
Adding a Chart
Team Foundation Server 2013 Boot Camp – version 2.0
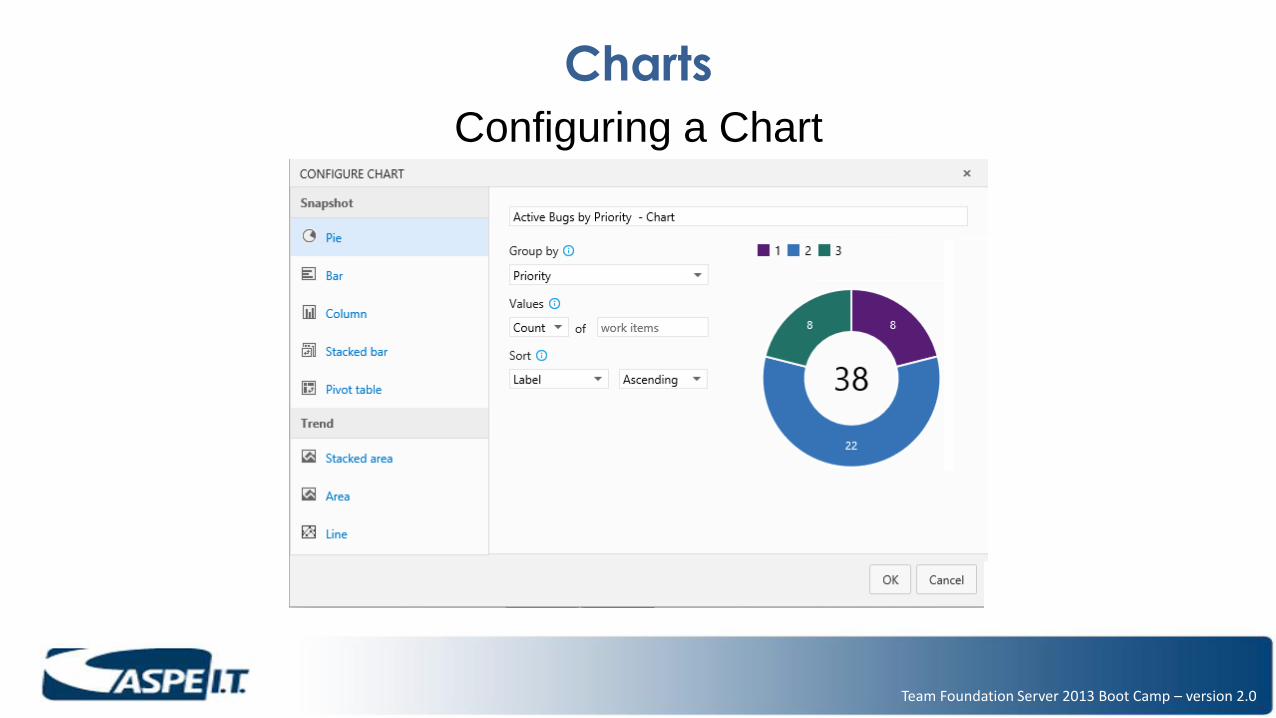
Charts
Configuring a Chart
Team Foundation Server 2013 Boot Camp – version 2.0
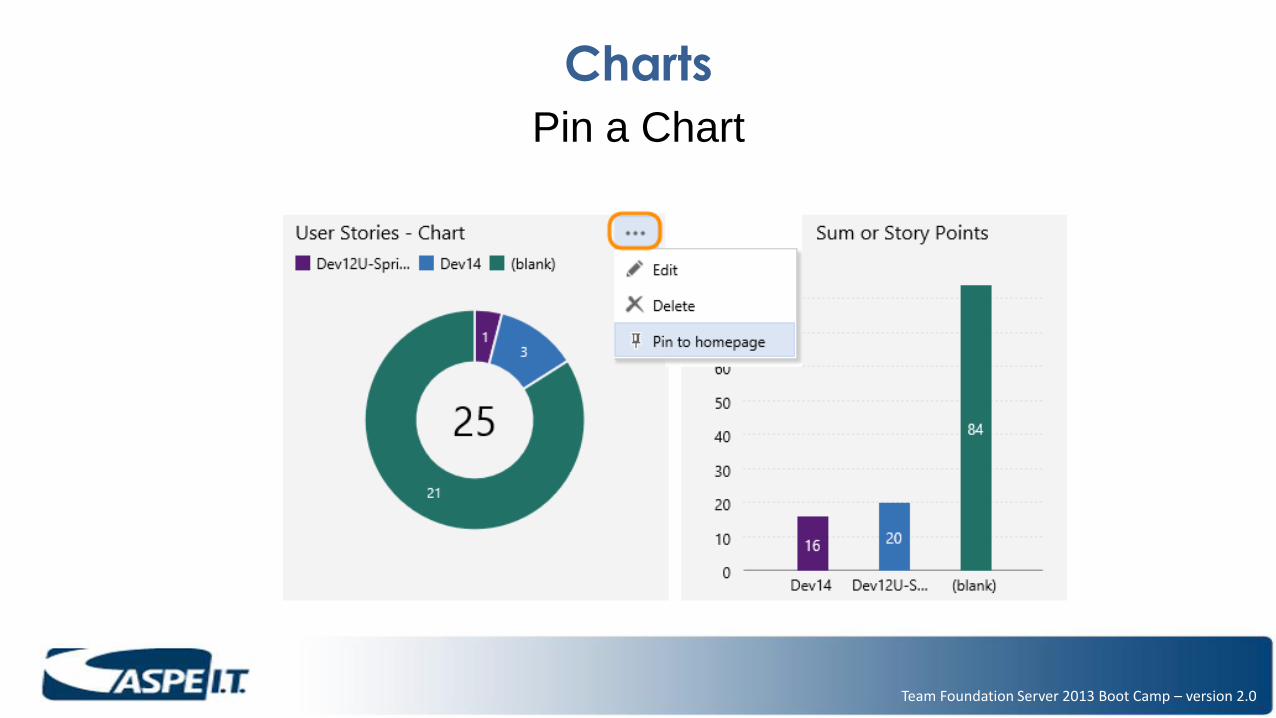
Charts
Pin a Chart
Team Foundation Server 2013 Boot Camp – version 2.0
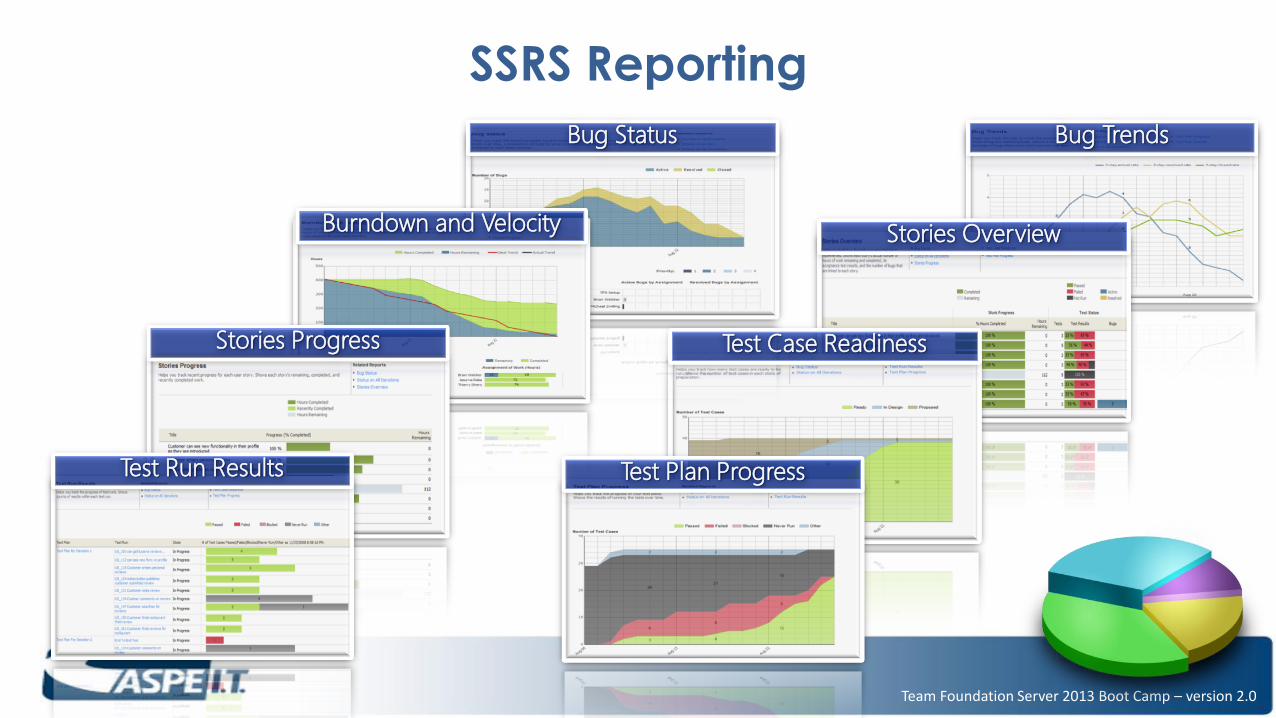
SSRS Reporting
Test Run Results
Stories Progress
Burndown and Velocity
Bug Status
Test Case Readiness
Stories Overview
Bug Trends
Test Plan Progress
Team Foundation Server 2013 Boot Camp – version 2.0
Excel Reports
• The TFS cubes are available via PivotTables and
PivotCharts in Microsoft Excel
• Data Available
– Builds
– Code Churn
– Work Items
– Tests
– Version Control

Team Foundation Server 2013 Boot Camp – version 2.0
Excel Reports
• The cubes are not real-time
• Refreshed hourly or based on schedule you configure
• Extremely fast – pre-aggregated data
• Use SharePoint Excel Web Parts to build real-time
dashboards
Team Foundation Server 2013 Boot Camp – version 2.0
Excel Reports
• The cubes are not real-time
• Refreshed hourly or based on schedule you configure
• Extremely fast – pre-aggregated data
• Use SharePoint Excel Web Parts to build real-time
dashboards