Embed Size (px)
Citation preview

Team 12
Wind Loads on Solar Panels
Fall Final Report Document
Document HistoryDate Author Version Change Reference9 December 2010 Brady, Kate, Chaneel, Arman, Jeff 1.0
Document PropertiesItem DetailsDocument Title Fall Final ReportAuthor Brady, Kate, Chaneel, Arman, JeffCreation Date 9 December 2010Last Updated 9 December 2010
Table of Contents1.0 Project Overview...................................................................................................................................4
1.1 Background and Overall Objectives...................................................................................................4
1.2 Requirements....................................................................................................................................4
1.3 Goals..................................................................................................................................................4
2.0 Design Breakdown.................................................................................................................................5
2.1 Major Project Components................................................................................................................5
2.2 Wind Tunnel Experiment...................................................................................................................5
2.3 Wind Tunnel Apparatus.....................................................................................................................6
2.3.1 Wind Tunnel...............................................................................................................................6
2.3.2 Wind Speed Control....................................................................................................................6
2.3.3 Scale model....................................................................................................................................6
2.3.4 Force Measurement System.......................................................................................................7
2.4 CFD Model.........................................................................................................................................7
2.4.1 Two Dimensional Analysis..........................................................................................................7
2.4.2 Three Dimensional Analysis........................................................................................................7
3.0 Wind Tunnel Scaled Model Designs.......................................................................................................8
3.1 Required Functions............................................................................................................................8
3.2 Design Concepts................................................................................................................................8
3.2.1 Complex MDOF Model................................................................................................................8
3.2.2 Tetrapod Spider Model...............................................................................................................9
3.2.3 Basic Hinge Model......................................................................................................................9
3.2.4 Screw and Bolt MDOF Model....................................................................................................10
3.3 Detailed Component Design............................................................................................................10
3.3.1 PV panel....................................................................................................................................11
3.3.2 Angle Adjustable Horizontal Arm..............................................................................................12
3.3.3 Height Adjustable Vertical Support...........................................................................................13
3.3.4 Vertical Support to Measurement Device.................................................................................13
4.0 Wind Tunnel Force Measurement Method.........................................................................................14
4.1 Component Description...................................................................................................................14
4.2 Concept Development.....................................................................................................................15
4.1.1 ATI multi-axis force/torque sensor...........................................................................................15
1 | P a g e
4.1.2 Drag Plate and Load Cell...........................................................................................................15
4.1.3 Pressure Tap.............................................................................................................................15
4.3 Concept Selection............................................................................................................................16
4.4 Calculations.....................................................................................................................................16
5.0 Computational Fluid Dynamics Subsystems........................................................................................17
5.1 Component Description...................................................................................................................17
5.1.1 Two Dimensional Analysis.........................................................................................................17
5.1.2 Three Dimensional Analysis......................................................................................................18
6.0 Wind Tunnel Testing Plan....................................................................................................................18
6.1 Testing Sequence.............................................................................................................................18
6.2 Analysis............................................................................................................................................19
6.3 Important considerations................................................................................................................19
7.0 CFD Simulation Plan.............................................................................................................................19
8.0 Integration and Verification Plan.........................................................................................................20
9.0 Risk Assessment...................................................................................................................................20
9.1 Wind Tunnel Tests...........................................................................................................................20
9.1.1 Wind Tunnel Not Functional.....................................................................................................20
9.1.2 Wind Tunnel Flow Speed Capabilities Too Low.........................................................................20
9.1.3 Drag Plate Not Functional.........................................................................................................21
9.1.4 Measuring Device Not Correct Range.......................................................................................21
9.1.5 Unable to Control Wind Speed.................................................................................................21
9.2 CFD Simulations...............................................................................................................................22
9.2.1 Number of Nodes or Elements is Exceeded Within Ansys........................................................22
9.2.2 Three Dimensional Solution Fails to Converge..........................................................................22
10.0 Project Management Plan.................................................................................................................22
10.1 Organizational Responsibilities......................................................................................................22
10.2 Work Breakdown Structure...........................................................................................................23
10.3 Schedule........................................................................................................................................24
10.4 Cost Estimates...............................................................................................................................24
10.4.1 3D Printing..............................................................................................................................24
10.5 Specialized Facilities and Resources..............................................................................................24
10.5.1 Environmental Wind Tunnel...................................................................................................24
2 | P a g e

10.5.2 Pressure and Force Measurement..........................................................................................24
10.5.3 CFD Software..........................................................................................................................24
11.0 References.........................................................................................................................................25
Appendix A – Wind Speeds for Calgary From the Alberta Building Code...................................................26
Appendix B – Wind Tunnel Specifications..................................................................................................29
Appendix C – Centennial Solar Polycrystalline Solar Modules Data Sheet.................................................30
Appendix D – Force Measurement Concept Selection Matrix...................................................................32
1 Description of the concepts................................................................................................................32
A. ATI Transducer...........................................................................................................................32
B. Drag Plate and Load Cell............................................................................................................32
C. Pressure Tap..............................................................................................................................32
2 Selection Criteria................................................................................................................................32
I. Determine Moment...................................................................................................................33
II. Cost............................................................................................................................................33
III. Fabrication Time....................................................................................................................33
IV. Daily Setup Time....................................................................................................................33
V. Ease of Measurements..............................................................................................................33
VI. Post-Experiment Analysis.......................................................................................................33
VII. Accuracy................................................................................................................................33
3 Scale...................................................................................................................................................33
4 Selection Matrix..................................................................................................................................33
5 Individual Ratings................................................................................................................................34
6 Group Conclusion...............................................................................................................................35
Appendix E – Schedule Gantt Chart...........................................................................................................36
3 | P a g e
1.0 Project Overview
1.1 Background and Overall ObjectivesDr. David Wood, ENMAX/Schulich Professor of Renewable Energy, has asked mechanical engineering fourth year design team #12 to determine the loads due to wind on solar panels mounted on flat rooftops.
PV panels are most efficient when light hits the glass straight on, so the optimum angle to install them at is the latitude, 51° in Calgary. When the sun is low in the sky during the winter having PV panels at lower angles reduces the power output. In general, higher is better for power generation.
Considerable lift and drag forces are expected on the panel at such high angles. Ballast in the form of concrete blocks is normally used to prevent the panels from tipping over, lifting up, or moving across the roof. The nature and magnitude of the forces on the panels is poorly understood. In the past ENMAX, the indirect sponsor of the project, has asked engineers to design mounting systems for PV panels on pre-existing roofs. Because of the uncertainty, the amount of ballast required is inconsistent. In some cases the estimated weight of ballast required to secure the panel is so large that PV panels cannot be installed.
ENMAX needs to better understand the wind loads on solar panels. Dr. Wood has asked the group to study the wind loads on PV panels so that ENMAX can more easily install PV panels. He requested that the group use wind tunnel experiments and CFD modeling.
1.2 RequirementsENMAX requires engineering data on the loads on PV panels. Team 12 shall determine how much ballast is required to secure a row of six Centennial Solar Polycrystalline Solar Modules on the flat roof of a 30 ft building in 1-in-100 chance per year wind speeds (see Appendix A). The results shall be verified by using both wind tunnel experiments and CFD modelling.
R1. The team shall determine how much ballast is required to secure a row of six Centennial Solar Polycrystalline Solar Modules on the flat roof of a 30 ft building in 1-in-100 chance per year wind speeds.
R2. The team shall verify the results by using both wind tunnel experiments and CFD modelling.
1.3 GoalsIn addition to obtaining the information required by ENMAX, the group would like to study the factors affecting the wind load. They hope to determine a stationary configuration for the PV panel mounting system that would minimize the maximum loads. As such, the project goals are set out in the following list.
4 | P a g e
G1. Design, build and execute accurate and realistic wind tunnel tests of the PV panel system.
G2. Design and build an accurate and realistic CFD model of the PV panel system in wind.G3. Determine the magnitude and direction of forces acting on the PV panel system in once-
in-100-years winds, depending on the wind direction.G4. Determine what controllable factors affect the loading on PV panels on buildings.G5. Determine what environmental factors affect the loading on PV panels on buildings.G6. Determine the configuration of controllable factors that would minimize the loading on
the stationary PV panel system while still maximizing power generated.
2.0 Design Breakdown
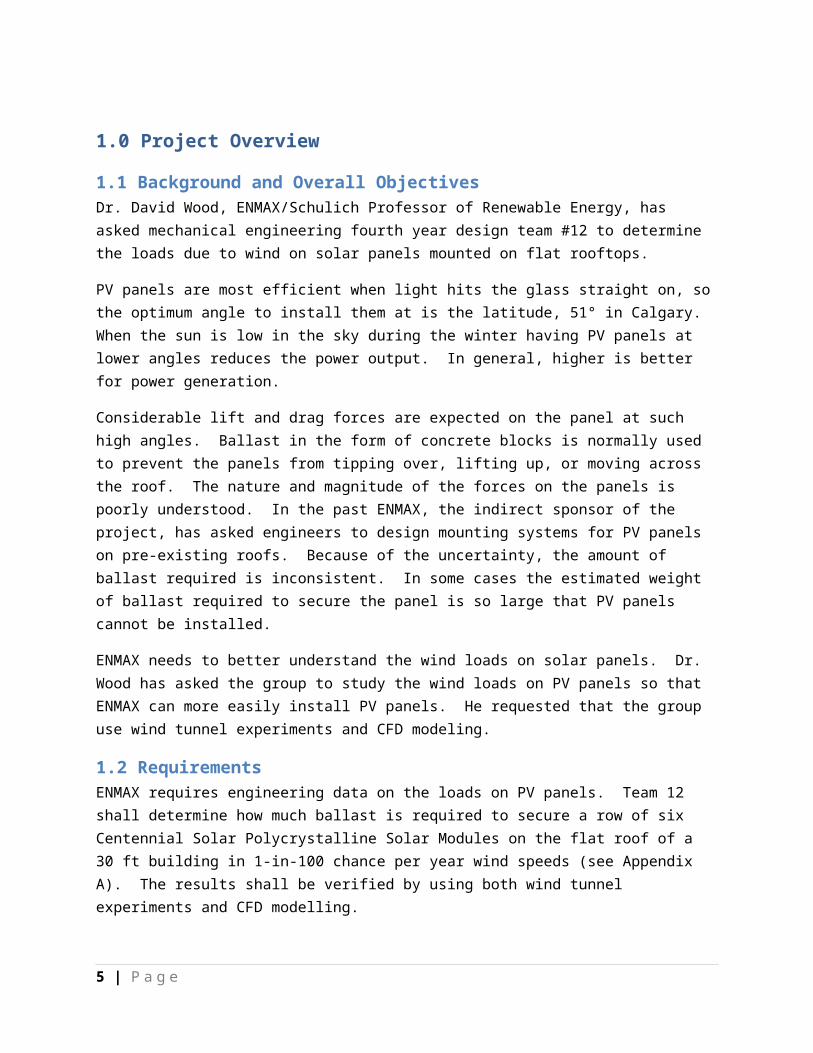
2.1 Major Project ComponentsThe client requires two major project components:
1. Wind Tunnel Experiment2. CFD Model
2.2 Wind Tunnel ExperimentThe wind tunnel experiment requires design of the tests and design of the apparatus. The tests must be designed before the apparatus can be designed. In the wind tunnel tests we wish to determine what the forces acting on the PV panel mounting assembly are, and how various factors affect those forces.
5 | P a g e
CFD Model
2 Dimensional
3 Dimensional
Wind Tunnel Experiment
Wind Tunnel
Wind Speed Control
Scale Model
Force Measurement System
The factors fall into two categories: uncontrollable environmental factors and controllable design choices. The weather is uncontrollable, but by testing for environmental factors, the team may discover that the worst case scenario for loads may be different than expected. By slightly modifying the mounting system, the team hopes to find a configuration that, while still simple and inexpensive for ENMAX to install, will experience reduced loads.
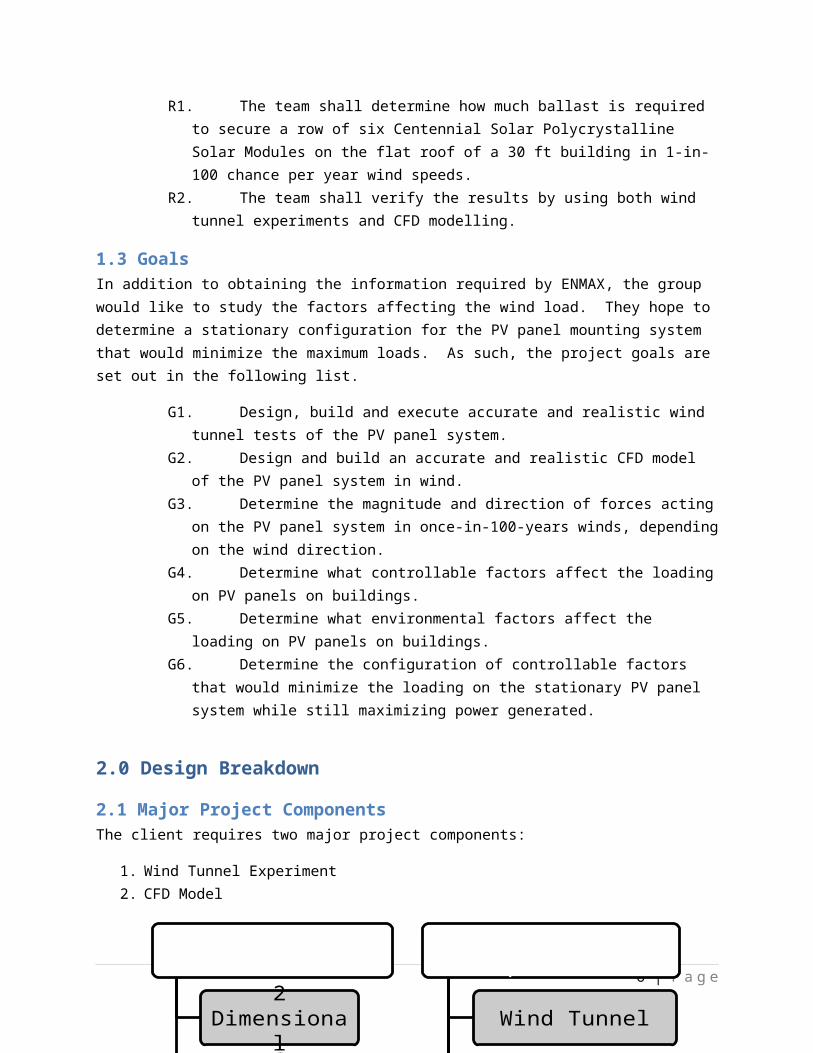
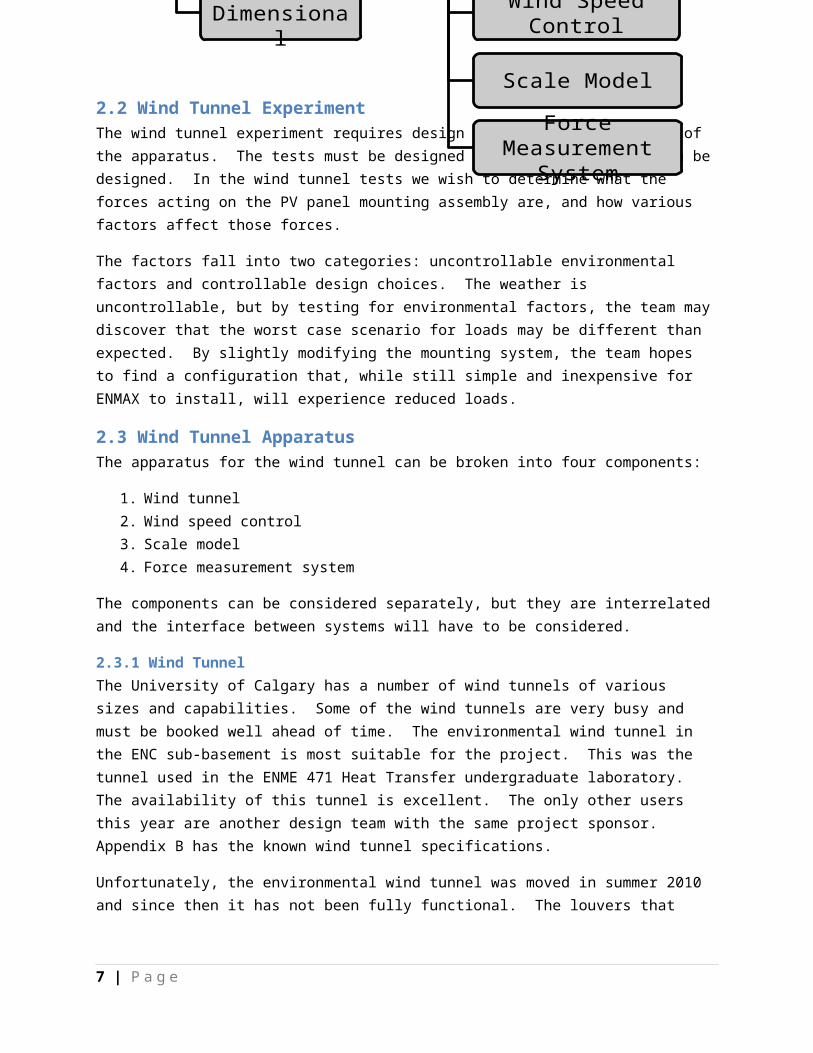
2.3 Wind Tunnel ApparatusThe apparatus for the wind tunnel can be broken into four components:
1. Wind tunnel2. Wind speed control3. Scale model4. Force measurement system
The components can be considered separately, but they are interrelated and the interface between systems will have to be considered.
2.3.1 Wind TunnelThe University of Calgary has a number of wind tunnels of various sizes and capabilities. Some of the wind tunnels are very busy and must be booked well ahead of time. The environmental wind tunnel in the ENC sub-basement is most suitable for the project. This was the tunnel used in the ENME 471 Heat Transfer undergraduate laboratory. The availability of this tunnel is excellent. The only other users this year are another design team with the same project sponsor. Appendix B has the known wind tunnel specifications.
Unfortunately, the environmental wind tunnel was moved in summer 2010 and since then it has not been fully functional. The louvers that control the wind speed are jammed so the wind speed cannot be controlled.
2.3.2 Wind Speed ControlThere are two common ways to control the volume of air moved by a fan. The method that offers the best control is adjusting the speed of the fan using a variable-frequency drive. The alternative is to use a fixed speed fan and partially block the flow to reduce the flow rate. As mentioned in the previous section the environmental wind tunnel uses louvers to control the flow rate. Louvers are like window blinds. The angle of the louvers can be adjusted to allow more or less air through. The airspeed can be very difficult to control with louvers at the best of times since it is difficult to get the louvers to the exact same position as was used for a previous test.
Regardless of the flow rate control, there needs to be a way to monitor the average wind speed. In the past a pitot tube and manometer have been used to monitor the wind speed in this wind tunnel. It is very time consuming to read the manometer and the result depends on the atmospheric pressure and temperature. The group has considered using a different type of anemometer, for instance a cup anemometer, to monitor the wind speed before and after an experimental run. Particularly since wind
6 | P a g e
speed control is expected to be poor, it will be important to monitor the wind speed throughout the experiment.
2.3.3 Scale modelThe group was advised by Jim McNeely that the maximum area of the wind tunnel that the model should take up is approximately 20%. This means that the largest the test model can be is 324 sq. in. or 2090 cm2. Obviously the test model will have to be scaled.
The Conceptual Design Document considered the things that will have to be adjustable on the scale model.
1. Vary tilt of panel: Rotate panel about y-axis2. Vary wind direction: Rotate panel about z-axis3. Vary height of gap between the panel and the ground4. Open or closed sides
Section 3.0 will discuss how the scale model has been designed to meet these functions.
2.3.4 Force Measurement SystemThe force measurement system will sense the forces on the scale model and convert them to an electrical signal which will be received and interpreted by a data acquisition device (DAQ) and then sent to LabVIEW software. Section 4.0 will describe our concept selection process for the force measurement system.
2.4 CFD ModelComputational fluid dynamics will allow us to test a solar panel in a variety of orientations and weather conditions relatively easily.
2.4.1 Two Dimensional AnalysisA two dimensional analysis will assume that the solar panel is infinitely wide and the section analyzed is at the very middle. This will ignore the edge effects of the flow leading to less accurate results. This model will be less computationally demanding and allow for quick force estimates at a variety of orientations. A plot of the pressure distribution over the front and back sides of the panel will allow the force to be determined. Using statics, the tipping moment can be found on the ENMAX frame design for a six panel row.
Items to be considered are the boundary conditions of the control area. The inlet and outlet can be constant volume flow, constant velocity, and so on. The top and bottom can be free surfaces which would allow air to exit and enter but will have no initial flow. This method would simulate our wind tunnel setup. Or they can be closed with no slip conditions which would simulate a duct, if this duct is too small the realism of the analysis is reduced.
2.4.2 Three Dimensional AnalysisA three dimensional analysis will be much more computationally demanding and take more time to run. It also brings up questions on exactly how to model the setup. Should the frame be built to the same
7 | P a g e
dimensions as ENMAX’s current design? If so, then we can record the forces and moments generated. Integrating over the surface as was done in the 2D analysis will disregard the edge effects. It would be possible to determine the force acting on only a row of panels and then through statics the tipping moment can be determined on the frame design.
As with a two dimensional analysis the boundary conditions must be specified except now there are an additional two boundaries.
3.0 Wind Tunnel Scaled Model Designs
3.1 Required FunctionsThe scaled model of a PV panel system must meet the following requirements:
Represent scaled dimensions of the Centennial Solar Polycrystalline Solar Module; Keep PV Panel rigid against a strong wind; Be adjusted easily to allow manipulation of variables (e.g. height and angle of PV panel); Transfer force/pressure to measurement system with minimal losses; Be within the department project budget; and Take no longer than 3 weeks to build.
3.2 Design Concepts
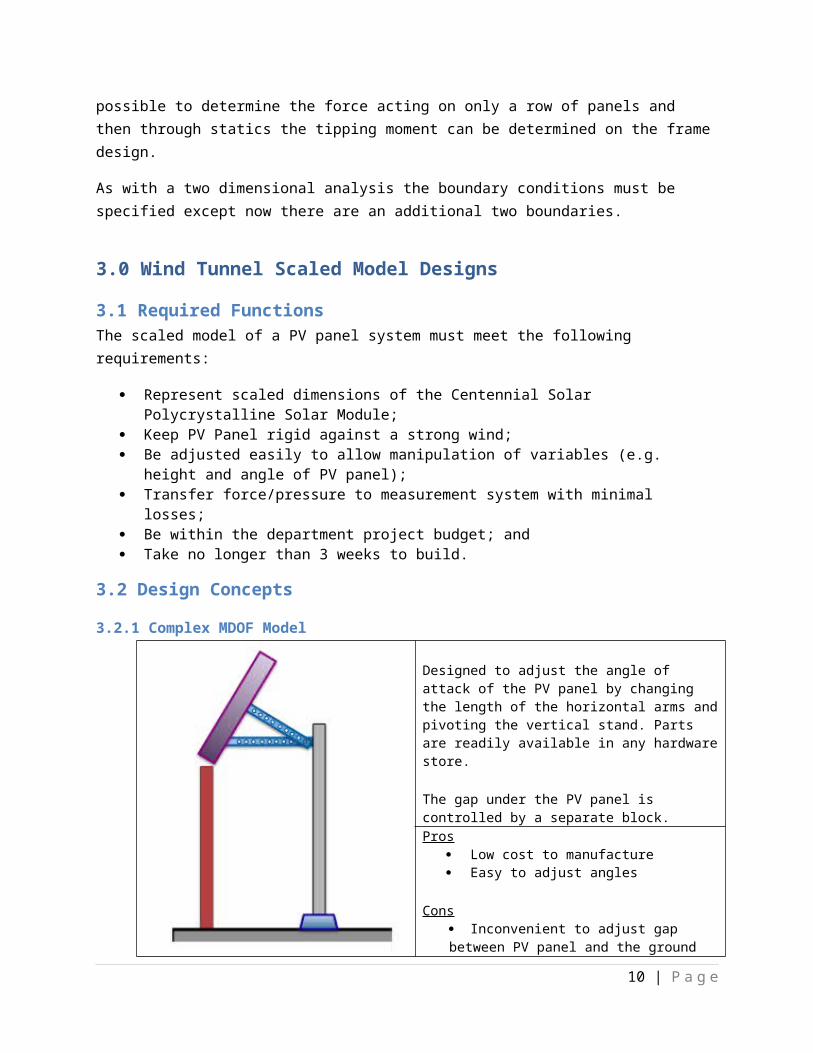
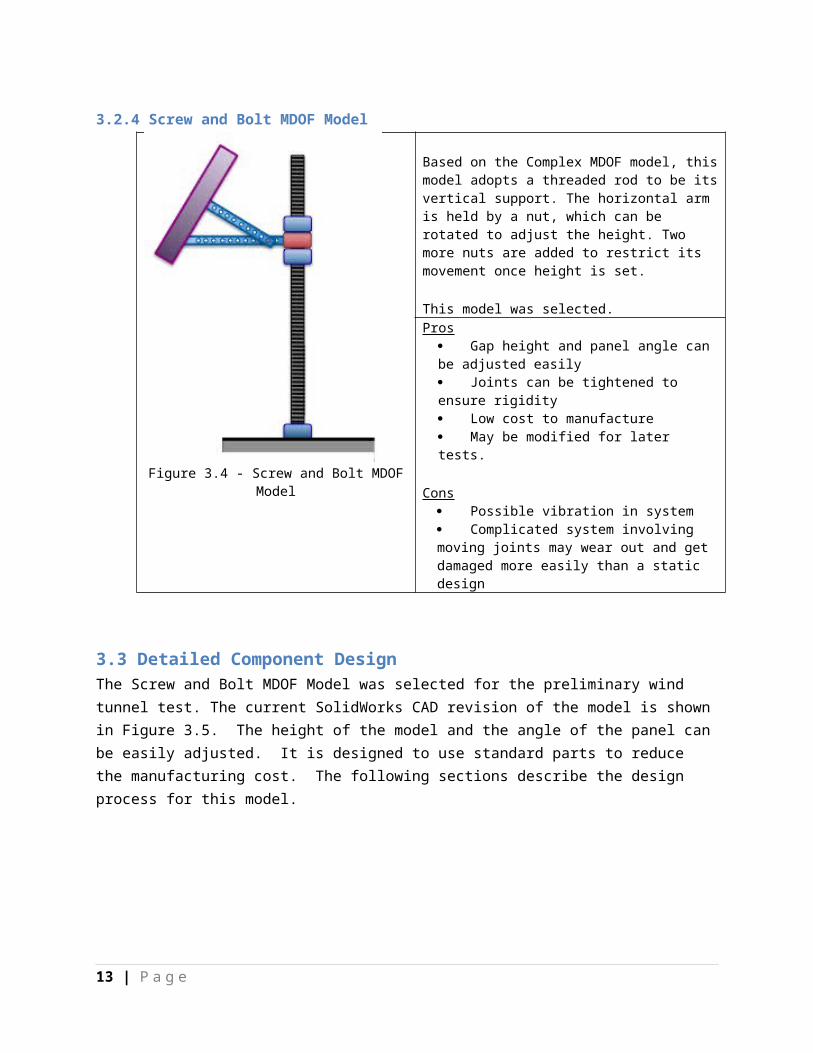
3.2.1 Complex MDOF Model
Figure 3.1 - Complex MDOF Model
Designed to adjust the angle of attack of the PV panel by changing the length of the horizontal arms and pivoting the vertical stand. Parts are readily available in any hardware store.
The gap under the PV panel is controlled by a separate block.
Pros Low cost to manufacture Easy to adjust angles
Cons Inconvenient to adjust gap between PV panel and the ground for every measurement Pivoting vertical stand is not necessary for the objective Possible vibration in system The block, as shown does not allow a boundary layer to develop
8 | P a g e

3.2.2 Tetrapod Spider Model
Figure 3.2 - Tetrapod Spider Model
Designed to be simple. Supported by 4 rigid legs, angle and gap height can be adjusted by cutting down legs for each test.
Pros Easy to build Low manufacturing cost Rigid and robust support
Cons Inaccuracy while adjusting leg height Model cannot be reused; need to build a new model for additional tests Over constrained system, three legs may be better
3.2.3 Basic Hinge Model
Figure 3.3 - Basic Hinge Model
Based on above Tetrapod Spider model, a hinge and length-adjustable support frame is adopted.
Pros Low manufacturing cost Easy to adjust angles Rigid and robust
Cons Unable to adjust gap height
9 | P a g e
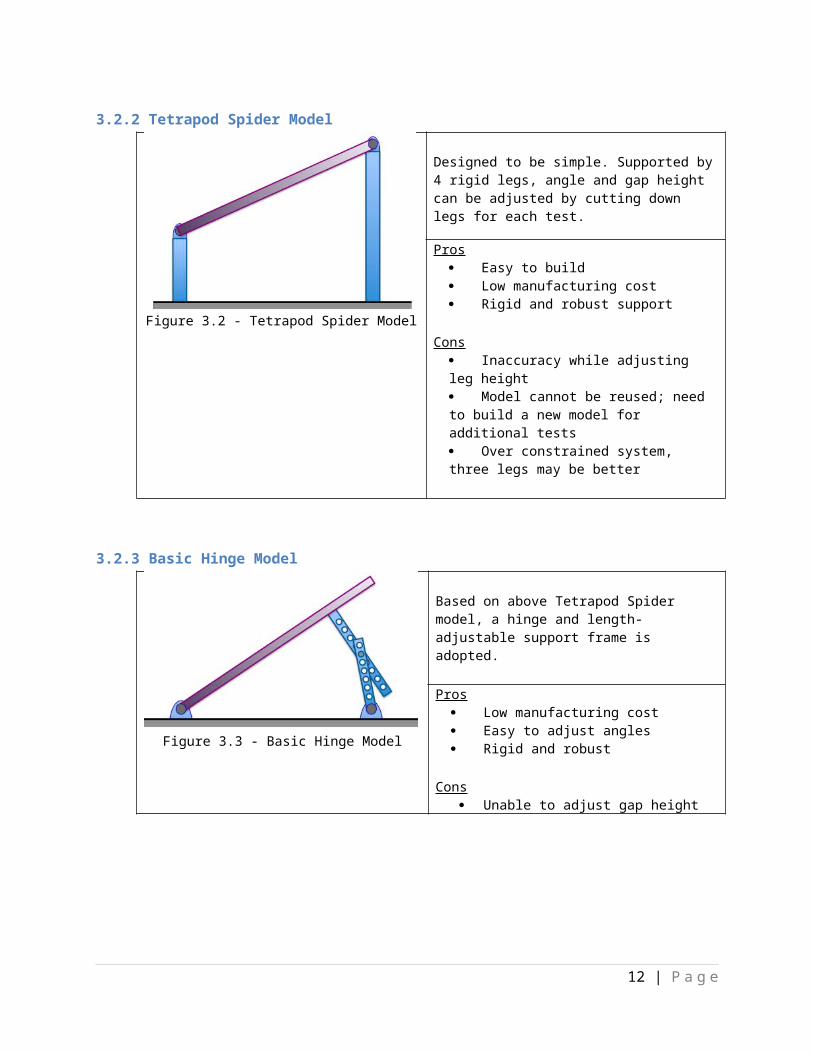
3.2.4 Screw and Bolt MDOF Model
Figure 3.4 - Screw and Bolt MDOF Model
Based on the Complex MDOF model, this model adopts a threaded rod to be its vertical support. The horizontal arm is held by a nut, which can be rotated to adjust the height. Two more nuts are added to restrict its movement once height is set.
This model was selected.
Pros Gap height and panel angle can be adjusted easily Joints can be tightened to ensure rigidity Low cost to manufacture May be modified for later tests.
Cons Possible vibration in system Complicated system involving moving joints may wear out and get damaged more easily than a static design
3.3 Detailed Component Design The Screw and Bolt MDOF Model was selected for the preliminary wind tunnel test. The current SolidWorks CAD revision of the model is shown in Figure 3.5. The height of the model and the angle of the panel can be easily adjusted. It is designed to use standard parts to reduce the manufacturing cost. The following sections describe the design process for this model.
10 | P a g e
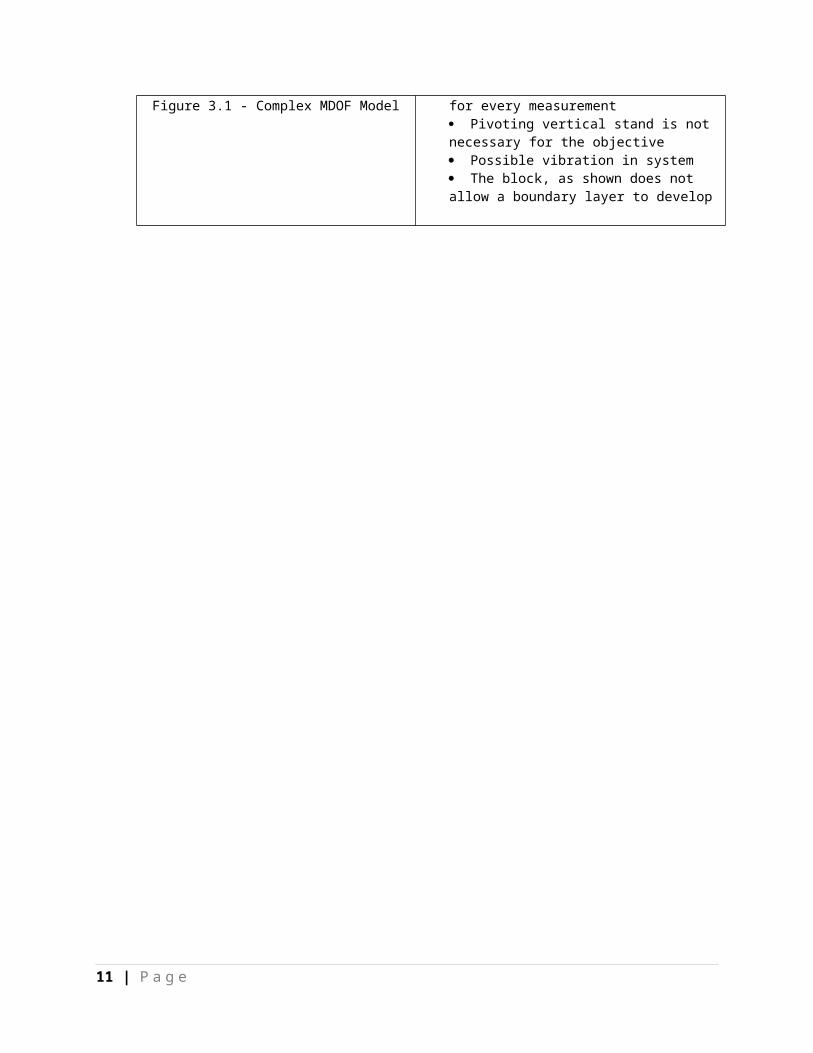
Figure 3.5 - Screw and Bolt MDOF Model CAD Drawing
3.3.1 PV panelA flat plate will represent the solar panel. Although this is simple it is one of the most important parts. This panel will need to be scaled to fit in the wind tunnel, yet we want it to be as large as possible to easier measure the forces.
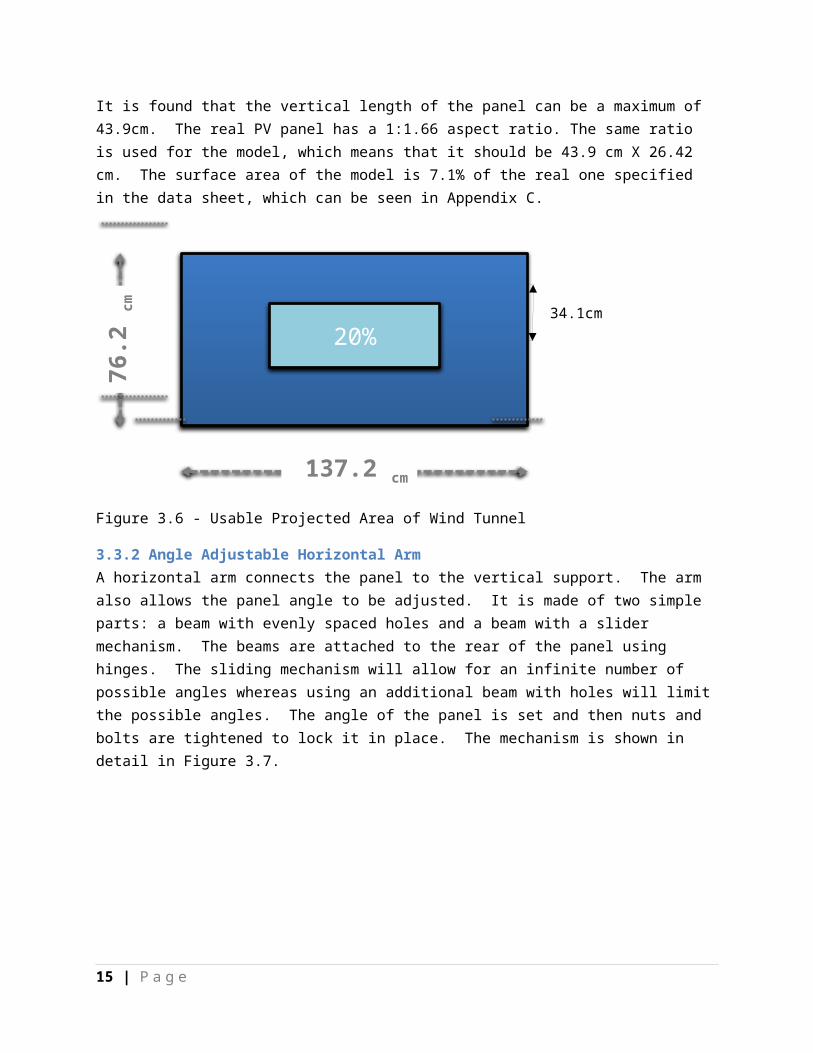
The dimensions of the wind tunnel are the limiting factor. Jim McNeely, the Technical Manager for mechanical engineering, recommended using only 20% of the projected area. This is so that the walls of the tunnel do not interfere with the flow around our test object. The wind tunnel was measured and it was determined that the model panel must have a maximum height of 34.1cm. However, it is important to note that the panel will be placed at 51 degrees tilt. Thus, the height of the actual plate representing the solar panel can be slightly larger according to the formula below.
y= 34.1sin 51
=43.9 cm
It is found that the vertical length of the panel can be a maximum of 43.9cm. The real PV panel has a 1:1.66 aspect ratio. The same ratio is used for the model, which means that it should be 43.9 cm X 26.42 cm. The surface area of the model is 7.1% of the real one specified in the data sheet, which can be seen in Appendix C.
11 | P a g e
34.1cm
Figure 3.6 - Usable Projected Area of Wind Tunnel
3.3.2 Angle Adjustable Horizontal ArmA horizontal arm connects the panel to the vertical support. The arm also allows the panel angle to be adjusted. It is made of two simple parts: a beam with evenly spaced holes and a beam with a slider mechanism. The beams are attached to the rear of the panel using hinges. The sliding mechanism will allow for an infinite number of possible angles whereas using an additional beam with holes will limit the possible angles. The angle of the panel is set and then nuts and bolts are tightened to lock it in place. The mechanism is shown in detail in Figure 3.7.
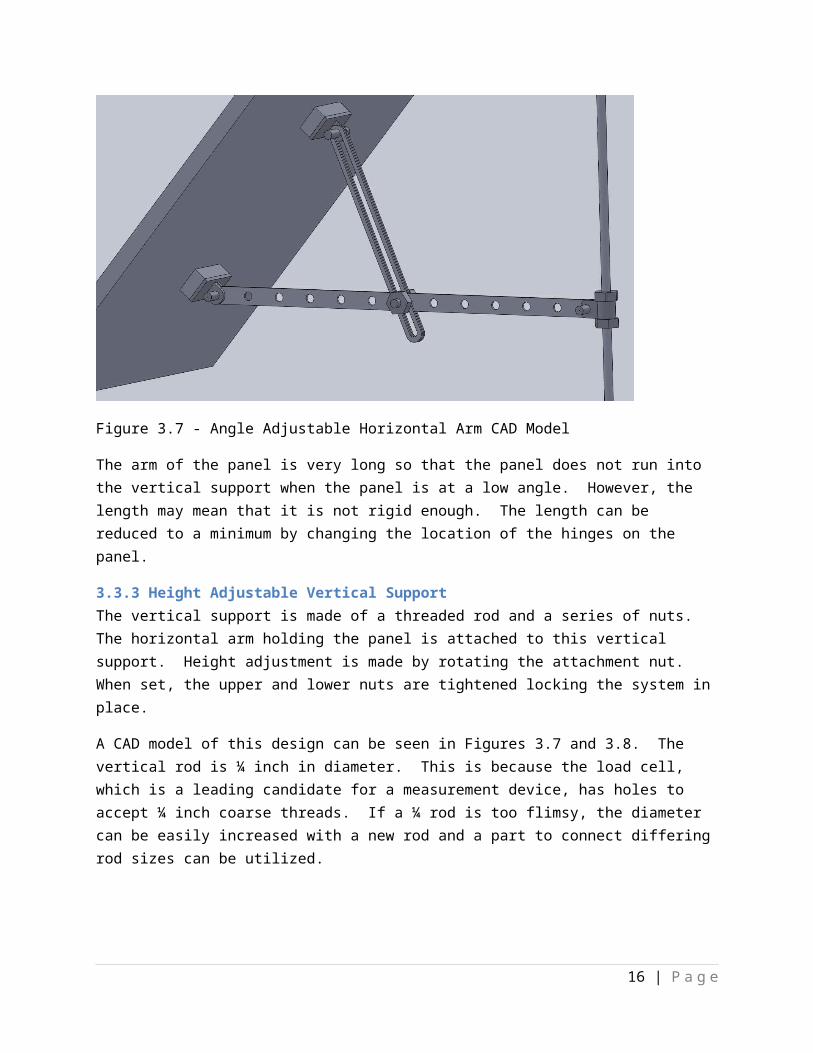
Figure 3.7 - Angle Adjustable Horizontal Arm CAD Model
The arm of the panel is very long so that the panel does not run into the vertical support when the panel is at a low angle. However, the length may mean that it is not rigid enough. The length can be reduced to a minimum by changing the location of the hinges on the panel.
12 | P a g e
20%
137.2 cm
76.2
cm
3.3.3 Height Adjustable Vertical SupportThe vertical support is made of a threaded rod and a series of nuts. The horizontal arm holding the panel is attached to this vertical support. Height adjustment is made by rotating the attachment nut. When set, the upper and lower nuts are tightened locking the system in place.
A CAD model of this design can be seen in Figures 3.7 and 3.8. The vertical rod is ¼ inch in diameter. This is because the load cell, which is a leading candidate for a measurement device, has holes to accept ¼ inch coarse threads. If a ¼ rod is too flimsy, the diameter can be easily increased with a new rod and a part to connect differing rod sizes can be utilized.
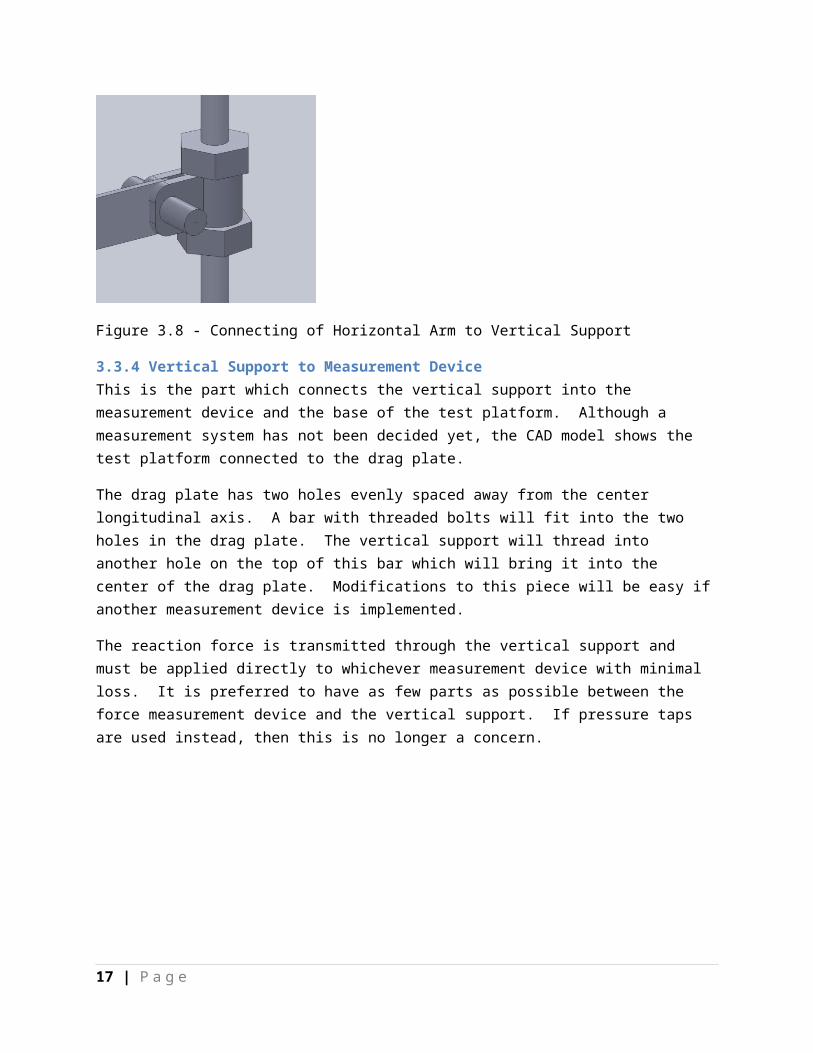
Figure 3.8 - Connecting of Horizontal Arm to Vertical Support
3.3.4 Vertical Support to Measurement DeviceThis is the part which connects the vertical support into the measurement device and the base of the test platform. Although a measurement system has not been decided yet, the CAD model shows the test platform connected to the drag plate.
The drag plate has two holes evenly spaced away from the center longitudinal axis. A bar with threaded bolts will fit into the two holes in the drag plate. The vertical support will thread into another hole on the top of this bar which will bring it into the center of the drag plate. Modifications to this piece will be easy if another measurement device is implemented.
The reaction force is transmitted through the vertical support and must be applied directly to whichever measurement device with minimal loss. It is preferred to have as few parts as possible between the force measurement device and the vertical support. If pressure taps are used instead, then this is no longer a concern.
13 | P a g e
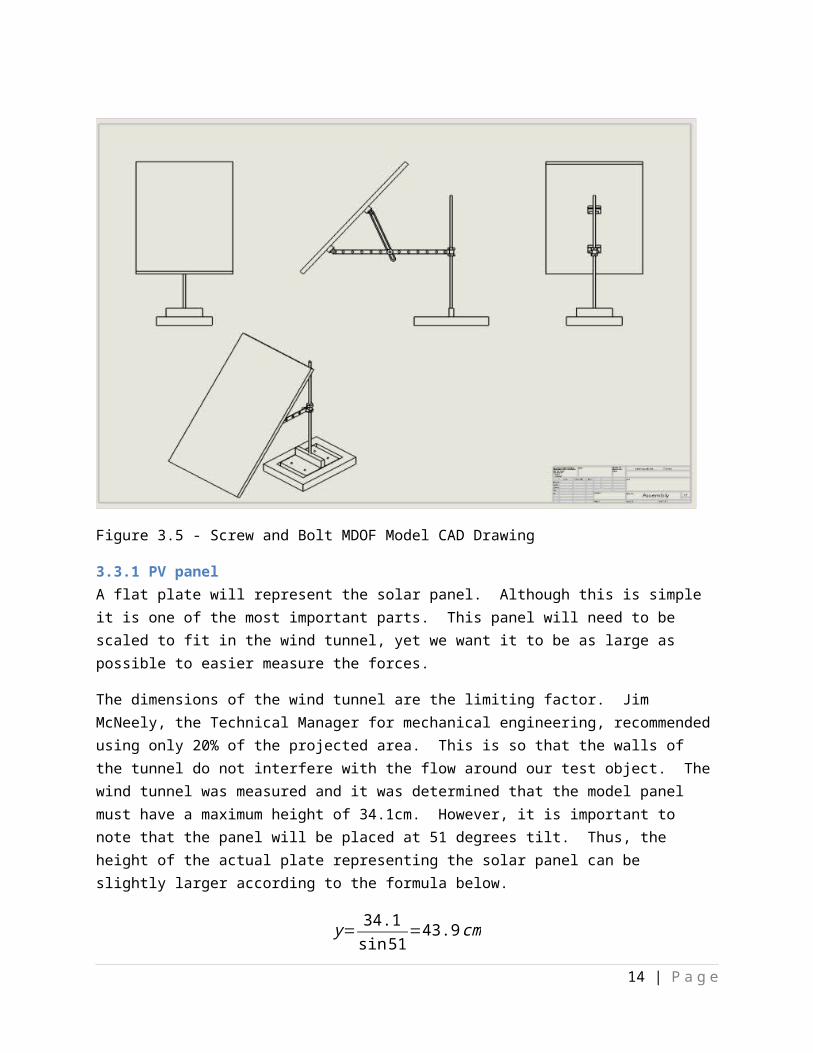
Figure 3.9 - Connecting Vertical Support to Drag Plate
4.0 Wind Tunnel Force Measurement Method
4.1 Component DescriptionThe force measurement system will sense the forces on the scale model and convert them to an electrical signal. The electrical signal will be received and interpreted by a data acquisition device (DAQ) and then sent to LabVIEW software.
It would also be possible to measure and record the forces on the panel manually; however using a DAQ has several advantages. Manually recording the measurements will take more time than using the DAQ, which records the measurements near instantaneously. Manual measurements will be subject to greater error than electronic measurements since every experimenter will add a different bias to the data. Since the electronic measurements are instantaneous, the DAQ will be able to record many readings every second. We will be able to detect if the forces are time dependent, i.e. if the structure is experiencing vibrations.
When measuring the force on the panel there are three pieces of information that need to be obtained:
1. Magnitude of the force2. Direction of the force3. Location of the force
Finding the location of a force with known magnitude and direction achieves the same result as determining the moment about a point on the structure. There are many ways to obtain this information. Some of the methods that we have considered do not give all three pieces of information, but may still be useful.
To determine the magnitude and direction of the force the resultant force may be measured, or the force may be broken into directional components. Determining the location of the force is more difficult. One way to determine the location is to measure the moment about a point. It is more difficult to directly measure the location of the force on the panel.
14 | P a g e
4.2 Concept Development
4.1.1 ATI multi-axis force/torque sensorDr. Wood intends to purchase an ATI multi-axis force/torque sensor for his research within the next 12 months. There would be 6 outputs: three forces (x, y, z) and three moments (x, y, z) – everything the group needs to know. Dr Rival has indicated that all of these measurements would be coupled such that the analysis could be quite complex.
ATI Industrial Automation guarantees 6-8 weeks for delivery. Brady has pointed out that most manufacturers leave a considerable cushion in their delivery time and if pushed, ATI could probably deliver it within four weeks. However, it is up to Dr. Wood to order the sensor. Assuming that the sensor he intends to order will meet our needs, he may not order it until mid-December or even January. Once the sensor arrives it will take additional time to set up. Once set-up and calibrated the sensor should be easy to use and very accurate.
4.1.2 Drag Plate and Load CellWe have access to a drag plate to measure the horizontal force on the panel. We have not verified that it works. Mechanical engineering has a wide selection of load cells designed to measure compression. We may have trouble finding a load cell with the correct range and sensitivity. The model would be bolted to the load cell, which would be bolted to the drag plate.
There would only be two outputs: horizontal force (drag) and vertical force (weight-lift). The largest problem with this concept is that it does not allow us to determine the moment about the base. The centre of force would have to be assumed to be the centre of the plate or determined analytically.
Because all of the equipment is already available this method is not costly and could be quickly assembled. The accuracy of the drag plate is unknown.
4.1.3 Pressure TapPressure taps are a common way to measure the pressure distribution on a surface in a wind tunnel. Instead of measuring the force on the panel, the group would be measuring the pressure difference between the front and back at points on the model. The pressure difference at each point would then be used to numerically integrate to get a single resultant force normal to the panel. The centre of the force would also be known. More pressure taps would increase the accuracy of the experiment.
Mechanical engineering has a pressure transducer that will measure up to 32 pressures simultaneously. This means that the model could get 16 pressure differences at once. To get more data points and improve accuracy we would need to do more runs. The more data points, the more difficult the analysis and set up, however.
The 3D printer could be used to easily fabricate a model with pressure taps and connection points to the transducer, although it could be expensive. A 32-connection DAQ would be required to record the readings.
15 | P a g e
4.3 Concept SelectionThe group used a concept selection matrix to determine the desirability of each concept for measuring the force on the scale model. The desirability of each of the methods is based on:
Ability to measure the location of the force Cost Preparation time Daily setup time Ease of measuring Ease of analysis Expected accuracy
Appendix D describes in detail how the group rated the concepts.
Although the ATI multi-axis force/torque transducer would be easiest to use and analyze, it was eliminated from the selection process because of the amount of time it would take to order and prepare.
The drag plate & load cell combination would be relatively easy to assemble and analyze. Some group members were concerned about the accuracy of the drag plate. The big problem with this concept is that it does not determine the location of the force. It would have to be determined analytically or assumed to be at some point.
The pressure tap model has no big problems, but is not really good, either. Although it gives us all of the information we need, it may not be accurate and could be troublesome to set-up and adjust.
Further consultation with the project advisors is needed before the force measurement method is finalized. The final method may be some combination of the methods already considered.
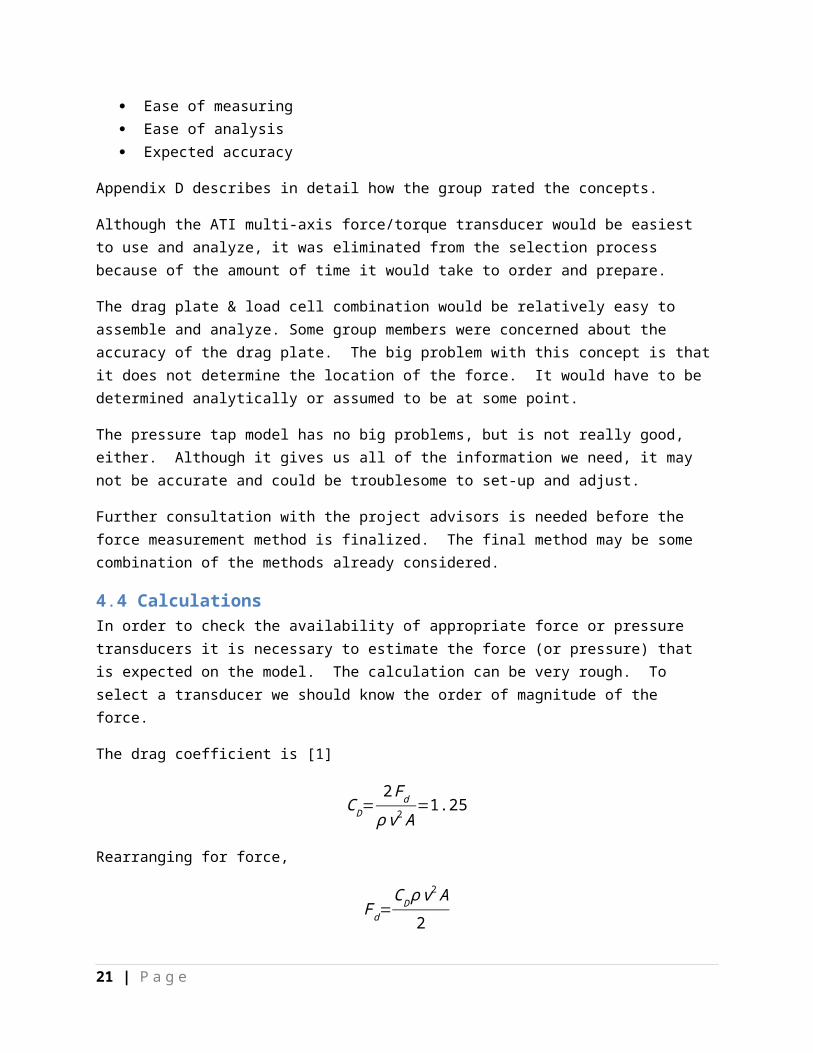
4.4 CalculationsIn order to check the availability of appropriate force or pressure transducers it is necessary to estimate the force (or pressure) that is expected on the model. The calculation can be very rough. To select a transducer we should know the order of magnitude of the force.
The drag coefficient is [1]
CD=2 Fdρ v2 A
=1.25
Rearranging for force,
Fd=CD ρ v
2 A2
16 | P a g e
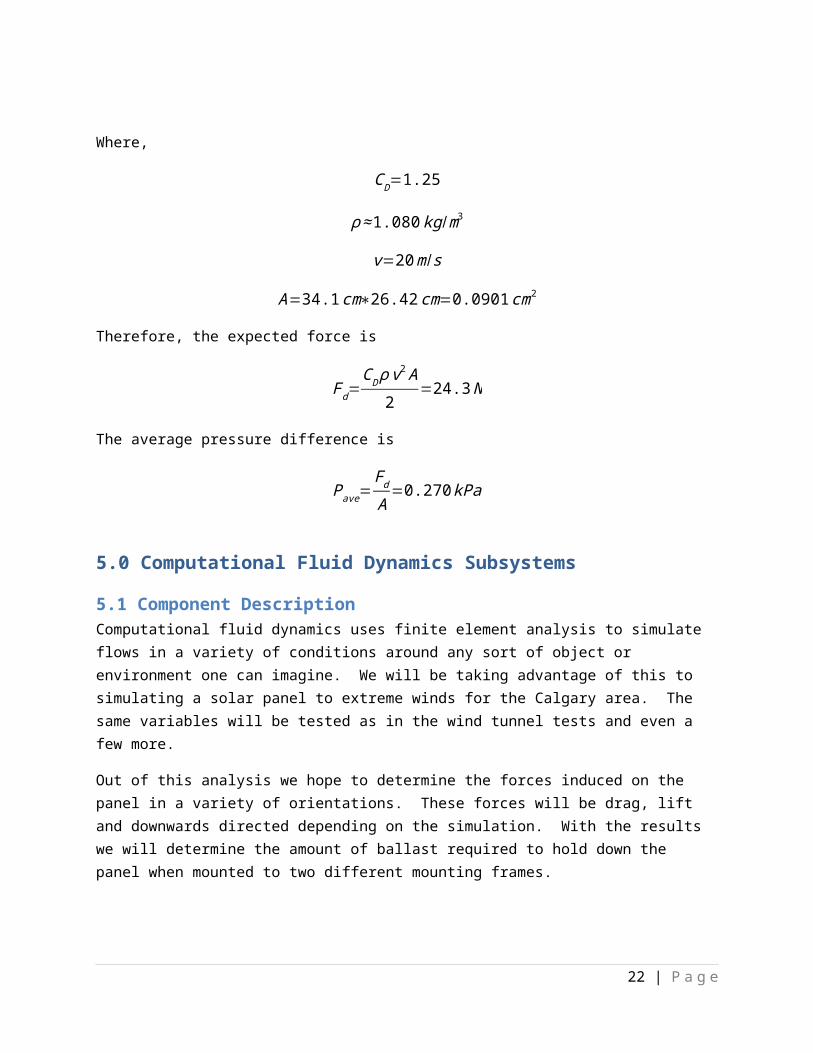
Where,
CD=1.25
ρ≈1.080 kg/m3
v=20m /s
A=34.1 cm∗26.42 cm=0.0901 cm2
Therefore, the expected force is
Fd=CD ρv
2 A2
=24.3N
The average pressure difference is
Pave=FdA
=0.270 kPa
5.0 Computational Fluid Dynamics Subsystems
5.1 Component DescriptionComputational fluid dynamics uses finite element analysis to simulate flows in a variety of conditions around any sort of object or environment one can imagine. We will be taking advantage of this to simulating a solar panel to extreme winds for the Calgary area. The same variables will be tested as in the wind tunnel tests and even a few more.
Out of this analysis we hope to determine the forces induced on the panel in a variety of orientations. These forces will be drag, lift and downwards directed depending on the simulation. With the results we will determine the amount of ballast required to hold down the panel when mounted to two different mounting frames.
5.1.1 Two Dimensional AnalysisTwo dimensional analysis will be useful to get an idea of the magnitude of force on a panel or row of panels and to understand where the force acts on the panel. For example, it could be determined where a single resultant force is to be applied for a static analysis. Two dimensional analysis will quickly give us a rough value and show us what we to expect in more complex simulations.
There are a few drawbacks to a two dimensional analysis. First, the open concept frame, such as the one built by ENMAX, will not be able to be modeled and analysed. The Renusol frame design on the other hand could be modeled in 2D since it has closed sides throughout the length. Next, this method of simulation will not take into account the edge effects of the wind going around the sides of the panel. It is unknown whether these effects will be significant or not. For a row of panels, a 2D approach will not
17 | P a g e

allow us to vary the gap between each panel to determine if it changes the loads. To test a number of variables a 3D model is required.
5.1.2 Three Dimensional AnalysisAnalysis in 3D opens up many more doors. However this comes with a price of longer computation times and more complex models. Three dimensional modeling will allow us to model the ENMAX frame design and directly measure the forces generated at the base of the supports which will eliminate the post simulation analysis. It will also let us adjust variables such as the gap between the panels in a row to see how the loading changes.
6.0 Wind Tunnel Testing PlanOnce the model has been built and the wind tunnel is working the group will be able to start testing. The group hopes to start testing no later than the end of January. Chaneel, Jeff and Kate are responsible for the wind tunnel tests.
6.1 Testing SequenceThere are many factors that the group has considered and it is not feasible to test for all the factors in one test. It would be wise to start out by modeling the test to be as close to the design that ENMAX currently has installed. The only variable that would need to be tested at more than one level is the wind direction, since the group does not know from what direction the highest loads will be experienced. The wind speed will be constant at the 1-in-100 chance per year wind speed. This way we will be able to give the customer, ENMAX, an estimate of the ballast required as quickly as possible. The initial results may be inaccurate, however, because the group will not have had a lot of experience with wind tunnel testing, may have made assumptions to simplify the model, and may find that other factors have a significant effect on the results.
The team’s current efforts have been focused on making a model that will adjust the controllable factors, that is the factors that ENMAX can control by modifying the support assembly. The goal is to identify which factors will influence the load on the panel and see if a small change in the support structure design will greatly reduce the load. For example, the group suspects that by raising the bottom of the panel from the ground they will find a point at which the load is reduced because there is no longer a boundary layer effect between the panel and the ground. The current model design will test a single panel to determine how three variables affect the load.
Height of the panel from the ground, y Inclination angle (tilt of the panel), Ψ Closed or open sides for the mounting system
Although the solar panel will be most efficient at generating power when it is at Ψ = 51°, the group wants to see how the angle is related to load. If the load is considerably less at Ψ = 40°, for instance, then it may be worth it to reduce the inclination angle because more panels will be able to be installed.
18 | P a g e
ENMAX requested that the group consider two types of mounting systems. Most the currently installed panels have open sides, but ENMAX has considered using a mounting system with closed sides.
After testing for those factors the group is also interested in determining how some other factors in the design of an array of PV panels will affect the load. The factors of interest include:
Size of gap between panels in a row Distance between rows Distance from the edge of the building Whether or not the edge of the building has a lip on it Height of the building Dimensions of the panel
There is no plan for how a scale model would test these factors.
Finally, it would be interesting to see how uncontrollable environmental factors affect the loads. Some environmental factors to consider include how snow, wind, rain, temperature, pressure and frequency of wind gusts. None of these factors will be tested for. The only environmental factor to test for would be the wind speed. Although the amount of ballast required depends on the maximum expected wind speed, it would be interesting to know how wind speed affects the load.
6.2 AnalysisFor each stage of testing, the loads will have to be analyzed. Calculations will have to be done to determine the resultant force and moment on the panel. ANOVA (analysis of variance) will be used to figure out how each factor affects the load. It is expected that more tests will be required once the initial analysis is complete.
6.3 Important considerationsAs with any experiment, the tests need to be repeatable. A major concern is how the wind speed will be controlled. If the wind speed is too difficult to control then the group will have to measure it throughout the experiment and include it as a covariate in the analysis. It is also important to pay attention to which group member is running the experiment because they may add error to the results. In order to get the tests done in a reasonable amount of time, the model needs to be easily adjustable.
7.0 CFD Simulation PlanThe CFD team plans to start simulations in the first week of January (refer to Appendix E for the project schedule). Initially they will be familiarizing themselves with the software: the graphical user interface (GUI), the capabilities and the limitations.
Modeling can begin when the CFD team is comfortable with the software. They will start with 2D laminar flow and then move on to the more realistic scenario of 3D turbulent flow. Two weeks have been assigned to this stage and it will wrap up by January 20.
19 | P a g e

The next week will be used to analyze the data collected. This will involve using engineering statics to compute the loads and moments induced on the frame in each scenario. The amount of ballast required will be one of the forces in the statics equations. If all goes according to plan the CFD simulations will be complete by the end of January.
8.0 Integration and Verification PlanOnce analysis is complete for the wind tunnel and the CFD the results will be compared. Ideally the resultant forces and load will be similar. The group’s goal is to have no more than a 20% difference in the amount of ballast required between the methods. This stage will be the last part of the project to be completed, but can begin as soon as preliminary wind tunnel test results are available. According to the project schedule this will be in mid February.
If the results do not agree, further analysis will be required to understand why. Additional testing or modeling may be required.
9.0 Risk AssessmentBelow some major risks are identified in both the wind tunnel tests and the CFD simulations along with an estimated likelihood of occurrence. Possible outcomes are described and suggestions are made to mitigate the negative effects.
9.1 Wind Tunnel Tests
9.1.1 Wind Tunnel Not FunctionalSection 2 mentioned that the louvers in the environmental wind tunnel have been jammed since the tunnel was moved in summer 2010. Initially Steve Crocker estimated that it would take a couple of days to fix the louvers so that the wind tunnel could be used. The repair has taken longer than expected and the group has considered the possibility that the wind tunnel will not work. The louvers are a relatively small problem, since they only control the wind speed. A larger problem would be if the fan motor did not work.
Estimated likelihood: Low
Outcome: Since wind tunnel tests make up a large portion of the project this scenario would be disastrous.
Mitigation: The focus of our project would shift to computational fluid dynamics backed by analytical analysis of fluid dynamics over flat plates. It may also be possible to design an experiment that could be done outside while monitoring wind speed, although this would present analytical difficulties.
20 | P a g e
9.1.2 Wind Tunnel Flow Speed Capabilities Too LowThe actual speed of a 1-in-100 chance per year wind speed for Calgary is 29 m/s, see Appendix A. Without having recently measured, Jim McNeely guess that the maximum speed of the wind tunnel is 15-20 m/s. This may be too low to accurately test the model panel in similar conditions.
Estimated likelihood: Medium
Outcome: The wind tunnel tests will not be representative of the type of conditions that ENMAX is looking for.
Mitigation: Determine if it is possible to apply a correction factor to increase the recorded loading to better approach the required wind speed or collect data at the maximum wind speed possible and cross reference with CFD simulations.
9.1.3 Drag Plate Not FunctionalThe existing drag plate is an old device constructed for previous experiments. It has old connectors and the group is uncertain of whether it functional.
Estimated likelihood: Medium
Outcome: We will be unable to measure the drag force on the model unless a new method or device is designed and built.
Mitigation: Work with the mechanical technicians to come up with an alternative design/device to meet our needs. Electronic connection to a computer would be ideal but if required a manual system could be developed. For example a spring and needle calibrated properly and read directly for each test run.
9.1.4 Measuring Device Not Correct RangeThe anticipated forces and pressures on the model are very small. Whichever force measurement method is chosen, the sensor will have to have the correct range. If the range is to large then the sensitivity will be too low and there will be a large amount of error.
Estimated likelihood: Low
Outcome: We will be unable to measure the forces on the model unless a new method or device is designed and built.
Mitigation: Work with the mechanical technicians to come up with an alternative design/device to meet our needs. Electronic connection to a computer would be ideal but if required a simple system could be developed. For example a spring and needle calibrated properly and read directly for each test run.
9.1.5 Unable to Control Wind SpeedThe wind speed control method in the environmental wind tunnel is very crude and there is some doubt as to how well the group will be able to adjust the wind speed.
21 | P a g e
Estimated likelihood: Medium
Outcome: We will be unable to run tests at exactly the desired speed.
Mitigation: Adjust the wind speed to be as close as possible to the desired level. Monitor the wind speed throughout the experiment and analyze the results with wind speed as an additional variable.
9.2 CFD Simulations
9.2.1 Number of Nodes or Elements is Exceeded Within AnsysThe educational license which the mechanical engineering department owns allows for up to 32000 nodes. It will not allow analysis of models exceeding this limit.
Estimated likelihood: Medium-High
Outcome: Results obtained with a lower mesh density will not be as accurate. The problem may have to be over simplified to be within the node limit leading to inaccuracies.
Mitigation: The first step would be to make use of symmetry in the 3D problem. This will cut the number of nodes in half. The complexity of the model can be reduced, for example instead of modeling the panel and frame we could model just the panel. If this fails to be sufficient, the use of Ansys as part of the CFD simulations may have to be abandoned in favour of Comsol Multiphysics, which Arman Hemmati has access to.
9.2.2 Three Dimensional Solution Fails to ConvergeIt is possible that a solution may not be found using our model or the computational power required for the problem is insufficient which will lead to an unreasonably long solution time.
Estimated likelihood: Medium
Outcome: The problem may need to be simplified to allow for convergence within a reasonable amount of time leading to inaccuracies.
Mitigation: Simplify the problem as much as possible such as removing the frame from the model or model a row of six panels as one long panel. If these measures fail we will be forced to rely on 2D simulations.
10.0 Project Management Plan
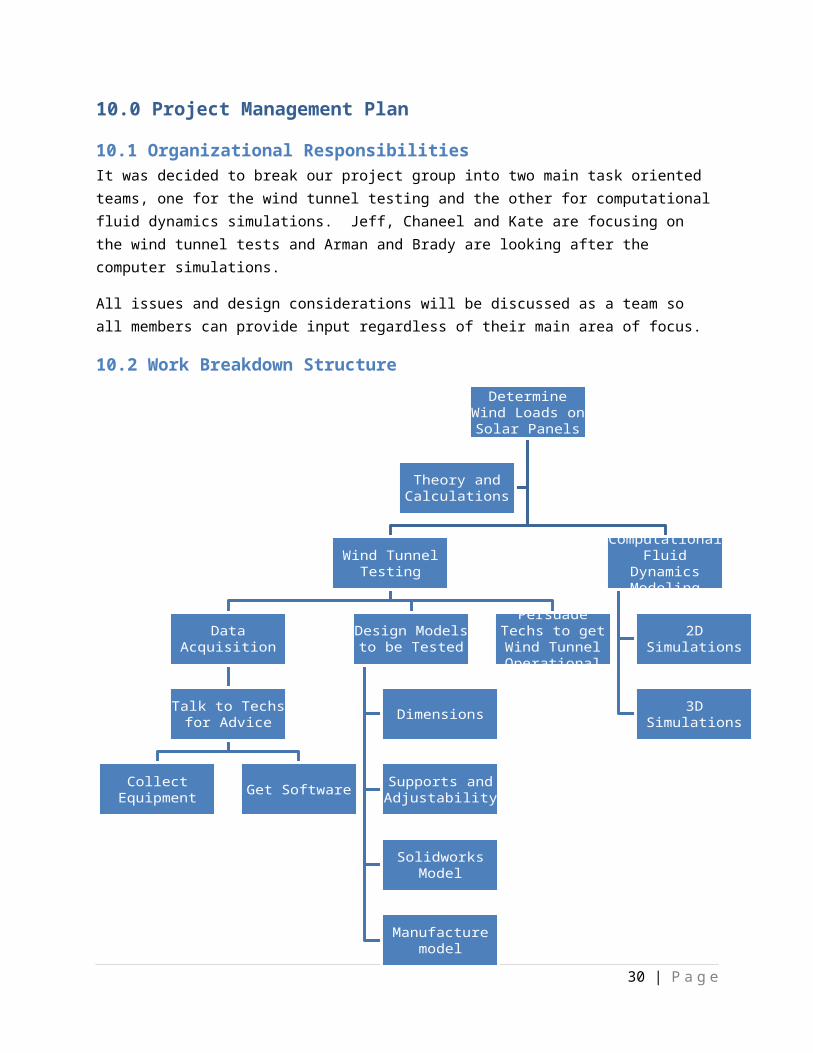
10.1 Organizational ResponsibilitiesIt was decided to break our project group into two main task oriented teams, one for the wind tunnel testing and the other for computational fluid dynamics simulations. Jeff, Chaneel and Kate are focusing on the wind tunnel tests and Arman and Brady are looking after the computer simulations.
22 | P a g e
All issues and design considerations will be discussed as a team so all members can provide input regardless of their main area of focus.
10.2 Work Breakdown Structure
23 | P a g e
Determine Wind Loads on Solar
Panels
Wind Tunnel Testing
Data Acquisition
Talk to Techs for Advice
Collect Equipment Get Software
Design Models to be Tested
Dimensions
Supports and Adjustability
Solidworks Model
Manufacture model
Persuade Techs to get Wind Tunnel
Operational
Computational Fluid Dynamics
Modeling
2D Simulations
3D Simulations
Theory and Calculations

10.3 ScheduleA schedule has been prepared which commences on January 3, 2010. This is the first day of block week and should allow for much to be accomplished before the beginning of class on January 10.
This schedule assumes that the wind tunnel will not be functional until February 1. Hopefully, the wind tunnel will be operational by January 3 so that testing can begin as soon as the model is built and the force measurement device is acquired on January 12. If it takes until February 1, the wind tunnel testing will not be completed until early March. This schedule does not take into account sharing of the facility with other groups so a few days will need to be added.
The Gantt chart can be seen in Appendix E.
10.4 Cost Estimates
10.4.1 3D PrintingVolume of Pressure Tap Panel to be printed: 0.48” X 17.08” X 10.39” = 85.18”2
Using the Titan printer at $13.50/cubic inch gives: 85.18 X 13.50 = $1150.93
Using the Z-Printer at $6.50/cubic inch gives: 85.18 X 6.50 = $553.67
Being in the design program gives us $100 of free printing. Brandon Ferguson and Dr. Wood will need to be consulted to determine whether it is worthwhile to go forward with this.
10.5 Specialized Facilities and Resources
10.5.1 Environmental Wind TunnelThe Environmental Wind Tunnel at the Schulich School of Engineering will be used for this project. Other project groups will also be using this facility. We must work with them to schedule its use.
10.5.2 Pressure and Force MeasurementPressure or force transducers are required for the wind tunnel experiments. Data acquisition devices are also required to collect the information into a computer. LabVIEW software will be required along with a program created to work with the DAQ system.
10.5.3 CFD SoftwareComputational Fluid Dynamics software is required. Brady will be using Ansys on a University of Calgary license whereas Arman will be using Comsol on a Shell Canada license.
24 | P a g e
11.0 References
[1] D. H. Wood. “Aerofoils: Lift, Drag, and Circulation,” in Small Wind Turbines. Calgary, AB: Springer, 2011.
[2] Alberta Building Code 2006 Volume B, National Research Council Canada, Ottawa, ON, 2006, pp. C8-C11.
[3] Centennial Solar Technical Staff, Large Crystalline Module Data Sheet, Centennial Solar Inc., St. Laurent, QC.
[4] Wikipedia contributors, “100-Year Flood.” Available: http://en.wikipedia.org/wiki/100_year_flood, November 1, 2010 [December 6, 2010].
25 | P a g e
Appendix A – Wind Speeds for Calgary from the Alberta Building Code
The Alberta Building Code was referenced to determine the wind speed to use in our testing. The code gives wind velocity pressures which were calculated using data collected over the past 10-22 years and the following formula [2]:
q=12ρV 2
Where, q=Wind Velocity Pressure; ρ=density of dry air at 0°C (1.2929 kgm3
); V= wind velocity.
This formula can be used to convert the wind velocity pressure back to wind velocity.
For Calgary, the Code gives wind velocity pressures for 1 chance in 10 and 1 chance in 50 of being exceeded in any one year. Table A1 gives the results of using the above formula to convert velocity pressure into velocity.
Table A1 - Converting Wind Velocity Pressure to Velocity
Yearly Probability 1 in 10 1 in 50Wind Velocity Pressure (kPa) 0.40 0.50Wind Speed (m/s) 24.9 27.8Wind Speed (km/hr) 89.6 100.1
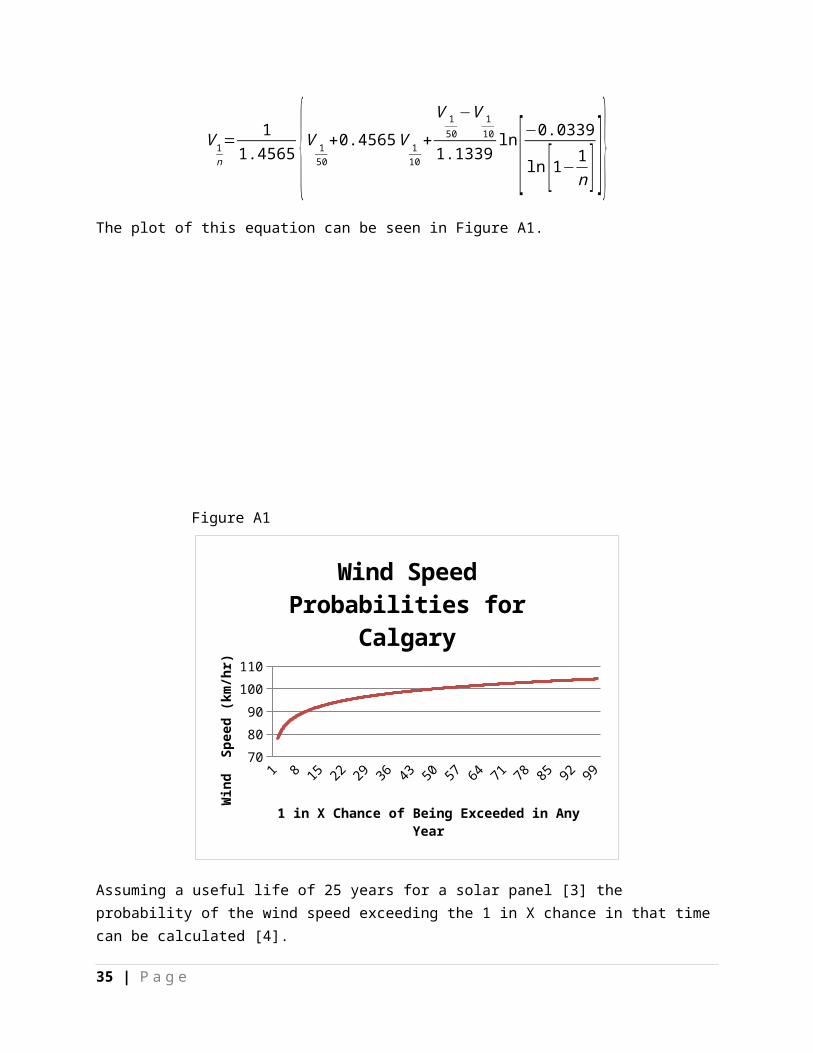
Our project demands that the wind speed to be tested must be greater than 1 in 50. The Code gives a formula for determining wind speeds for 1 in n chance of being exceeded in any one year [2].
V 1n= 11.4565 {V 1
50+0.4565V 1
10+V 150
−V 110
1.1339ln [ −0.0339ln [1−1n ] ]}
The plot of this equation can be seen in Figure A1.
26 | P a g e

Figure A1
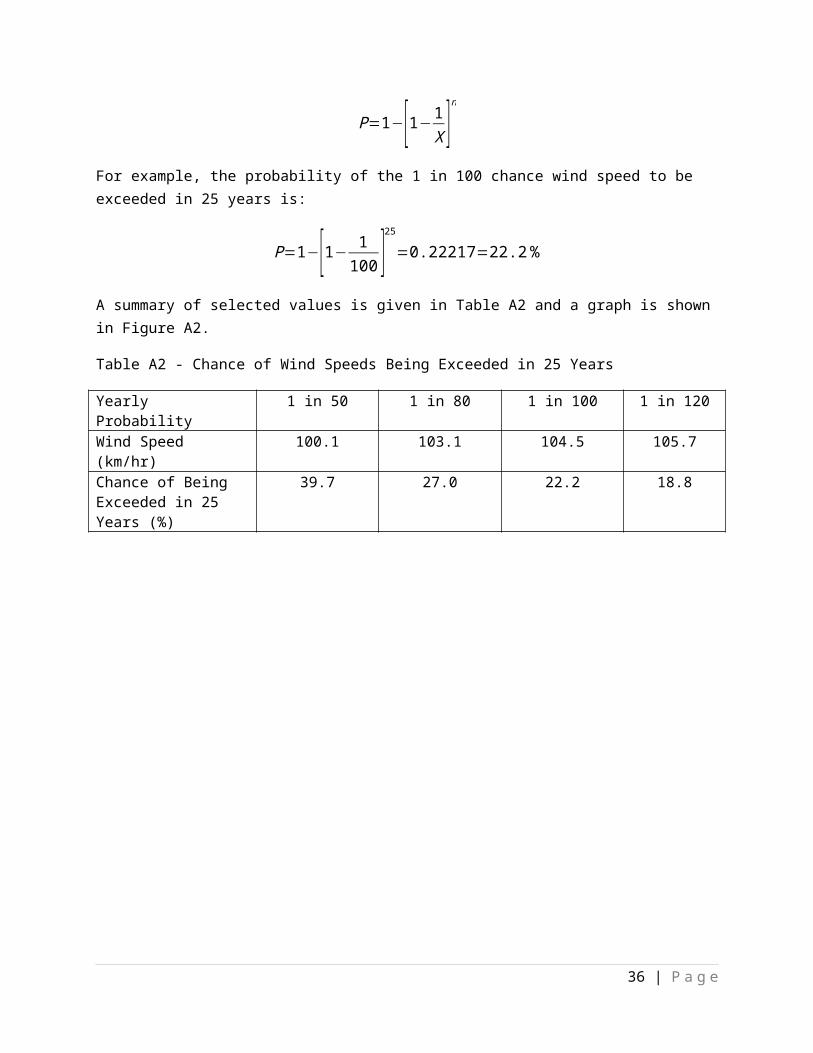
Assuming a useful life of 25 years for a solar panel [3] the probability of the wind speed exceeding the 1 in X chance in that time can be calculated [4].
P=1−[1− 1X ]
n
For example, the probability of the 1 in 100 chance wind speed to be exceeded in 25 years is:
P=1−[1− 1100 ]
25
=0.22217=22.2%
A summary of selected values is given in Table A2 and a graph is shown in Figure A2.
Table A2 - Chance of Wind Speeds Being Exceeded in 25 Years
Yearly Probability 1 in 50 1 in 80 1 in 100 1 in 120Wind Speed (km/hr) 100.1 103.1 104.5 105.7Chance of Being Exceeded in 25 Years (%)
39.7 27.0 22.2 18.8
27 | P a g e
1 7 13 19 25 31 37 43 49 55 61 67 73 79 85 91 9770
75
80
85
90
95
100
105
110
Wind Speed Probabilities for Calgary
1 in X Chance of Being Exceeded in Any Year
Win
d S
peed
(km
/hr)

Figure A2
28 | P a g e
1 13 25 37 49 61 73 85 97 1091211331451571691811930
20
40
60
80
100
120
Wind Speed Probabilities for Calgary Over 25 Years
1 in X Chance of Being Exceeded in Any Year
Prob
abili
ty o
f Bei
ng E
xcee
ded
in 2
5 Ye
ars

76.2 cm
20%
137.2 cm
61.4 cm
34.1 cm
55.15 cm
Appendix B – Wind Tunnel Specifications
Maximum Wind Speed: Uncertain but told 15-20 m/s
Flow Area Dimensions:
Figure B1 – Cross Section of Wind Tunnel With 20% Area Centered
Total Area: 10454.64 cm2
20% of Total Area: 2090.93 cm2
Figure B2 – Useable Area
Total Useable Area: 3386.21 cm2
29 | P a g e
Appendix C – Centennial Solar Polycrystalline Solar Modules Data SheetCopy of the manufacturer’s data sheet for the PV panels ENMAX uses [3].
30 | P a g e

31 | P a g e

Appendix D – Force Measurement Concept Selection MatrixThis was completed by the team members on 1 December 2010.
1 Description of the concepts
A. ATI TransducerDr. Wood intends to purchase an ATI multi-axis force/torque sensor for his research within the next 12 months. There would be 6 outputs: three forces (x, y, z) and three moments (x, y, z). Dr Rival has indicated that all of these measurements would be coupled such that the analysis could be quite complex.
ATI Industrial Automation guarantees 6-8 weeks for delivery. Brady has pointed out that most manufacturers leave a considerable cushion in their delivery time and if pushed, ATI could probably deliver it within four weeks. However, it is up to Dr. Wood to order the sensor. Assuming that the sensor he intends to order will meet our needs, he may not order it until mid-December or even January.
B. Drag Plate and Load CellWe have access to a drag plate to measure the horizontal force on the panel. We have not verified that it works. Mechanical engineering has a wide selection of load cells designed to measure compression. We may have trouble finding a load cell with the correct range and sensitivity. The model would be bolted to the load cell, which would be bolted to the drag plate.
There would only be two outputs: horizontal force (drag) and vertical force (weight – lift). The largest problem with this concept is that it does not allow us to determine the moment about the base. The centre of force would have to be assumed to be the centre of the plate or determined analytically.
We need to talk to a faculty advisor to see if this is a requirement or just desirable.
C. Pressure TapMechanical engineering has a pressure transducer that will measure up to 32 pressures simultaneously. The 3D printer could be used to easily fabricate a model with pressure taps and connection points to the transducer. A 32-connection DAQ would be required to record the readings.
By numerically integrating the pressure differentials on model, a single resultant force normal to the panel can be calculated. The moment about the base can be determined from the pressure distribution.
Thirty-two or more bits of information could be difficult to deal with. Error propagation could be a concern.
2 Selection CriteriaAll of the concepts meet the requirement that they shall quantify the total force on the panel, and the direction they are in. The selection criteria used here are desirable characteristics for the force measurement system.
32 | P a g e

I. Determine MomentAn important part of our analysis will be to determine the tipping moment of the solar panel. It is not enough to only determine the magnitude and direction of the forces. We need to know the location of the force so that the moment about the base can be determined.
***This may be a requirement. Need to check with Faculty Advisor/Sponsor.***
II. CostWe have been given a budget for the project. Existing equipment will have a lower cost than equipment that has to be purchased. Although Dr. Wood has offered to purchase equipment for us, we should be aware of the cost.
III. Fabrication TimeThe time that we will have to wait to start using the system after we select it. We hope to do testing before the end of January.
IV. Daily Setup TimeHow much time we will have to spend setting up the system every time we start doing tests, including time to recalibrate the sensors.
V. Ease of MeasurementsIncludes time to set up each run, time required to record each data point. Automated computer capture is preferred.
VI. Post-Experiment AnalysisHow easy it will be to interpret the measurements after the experiment.
VII. AccuracyThis is important, but not enough is known about the relative accuracy of each concept.
3 Scale1 Poor - will not meet expectations2 Fair - will barely meet expectations3 Good - will work as expected4 Excellent - will work with ease
4 Selection MatrixThis is the form that each of the group members filled out to assess the force measurement methods.
Concepts A B CCriterion
Brief Description
I Determines MomentII Cost
33 | P a g e

III Fabrication timeIV Daily setup timeV Ease of measuringVI Post-experiment analysis VII AccuracyVIIIIXXΣ Desirability
5 Individual RatingsThe following figures show how each group member rated each category for each measurement method, based on their understanding of the method.
A. ATI Transducer BZ KO AH CP JS TotalMoment 3 4 4 3 4 18Cost 1 1 1 1 1 5Fabrication 2 1 1.5 1 1 6.5Daily setup 2 2 1 2 2 9Measuring 4 3 4 2 2 15Analysis 2 3 3 4 3 15Accuracy 4 4 4 4 4 20Σ 18 18 18.5 17 17 88.5
B. Drag Plate & Load Cell BZ KO AH CP JS TotalMoment 2 1 1 1 1 6Cost 3 4 4 4 4 19Fabrication 3 4 3 4 3 17Daily setup 3 3 3 4 4 17Measuring 4 3 2 4 4 17Analysis 3 4 2 4 1 14Accuracy 2 2 1 3 2 10Σ 20 21 16 24 19 100
34 | P a g e
C. Pressure Taps BZ KO AH CP JS TotalMoment 3 3 3 3 3 15Cost 3 3 3 3 4 16Fabrication 2 3 2.5 2 3 12.5Daily setup 3 2 3 2 3 13Measuring 3 2 4 4 3 16Analysis 3 3 3 1 3 13Accuracy 3 3 3.5 4 3 16.5Σ 20 19 22 19 22 102
6 Group ConclusionThis figure shows the totalled results from the group when the exercise was done on 1 December 2010. Each box contains the score out of 20. The desirability is out of 140. A red circle indicates a high risk element. The drag plate & load cell and the pressure tap are both still under serious consideration. The ATI transducer has been eliminated because of time constraints.
Criterion Brief Description
ATI transducer
Drag plate & load cell
Pressure tap
I Determines Moment 18 6 15II Cost 5 19 16III Fabrication time 6.5 17 12.5IV Daily setup time 9 17 13V Ease of measuring 15 17 16
VIPost-experiment analysis 15 14 13
VII Accuracy 20 10 16.5Σ Desirability 88.5 100 102
35 | P a g e
Appendix E – Schedule Gantt Chart
36 | P a g e