Embed Size (px)
Citation preview

Teagasc National Farm Survey
2018 Results
Emma Dillon, Brian Moran, John Lennon &Trevor Donnellan
Agricultural Economics and Farm Surveys Department,
Rural Economy Development Programme
ISBN 978-1-84170-653-5

Teagasc National Farm Survey 20182
ACKNOWLEDGEMENTS
The authors wish to thank all who contributed to the Teagasc National Farm Survey
2018 - the farmers who participate voluntarily, the Central Statistics Office who
select the sample and provide the population weights. Grateful acknowledgement
is due to the Teagasc research staff involved in the collection and validation of the
farm data: J. Colgan, A Curley, L. Deane, L. Delaney, P. Harnett, P. Healy, P.
Madden, J. McConnon, E. McGrath, K. McNamara, M. Nicholson, J. Robinson, J.
Teehan and to M. Moloney for the administration of the survey.

Teagasc National Farm Survey 20183
TABLE OF CONTENTS
SUMMARY 2018 5
Weather woes in 2018 6
Family Farm Income 2018 8
FFI Distribution 10
Direct Payments 12
Investment and Borrowings 13
Dairy 2018 15
Regional Dairy Analysis 17
Dairy Structural Change 18
Cattle Rearing 2018 19
Cattle Other 2018 21
Regional Cattle Analysis 23
Sheep 2018 24
Tillage 2018 25
Regional Overview & Off-farm Employment 26
Viability Analysis 27
APPENDIX 1 List of tables Teagasc NFS 2018 29
APPENDIX 2 Background notes 82
APPENDIX 3 Classification of farm systems 84
APPENDIX 4 Glossary of terms 86
APPENDIX 5 Teagasc NFS 2017 revised tables 91
Teagasc National Farm Survey 20184
Classification of farms in the Teagasc National Farm Survey
The results of the Teagasc National Farm Survey (NFS) can be decomposed in various ways. One of themost common ways in which the results are presented is on a system basis. By system, the NFS farmsare categorised into one of six farm types: Dairy, Cattle Rearing, Cattle Other, Sheep, Tillage and MixedLivestock. Given that individual farms typically have more than one farm enterprise, a rigorous basis forcategorising farms into each system is required.
The method of classifying farms into farming systems, is based on the EU farm typology as set out inCommission Decision 78/463 and its subsequent amendments. The approach is utilised by all members ofthe EU Farm Accountancy Data Network. The methodology assigns a standard output (SO) to eachtype of animal and each hectare of crop on the farm. Farms are then classified into groups,according to the proportion of total SO which comes from each enterprise. System titles refer tothe dominant enterprise in each group. For example, the cattle rearing system refers to thosefarms where the greater proportion of the farm’s activity relates to suckler beef production. Thereare many other farms (including those in the dairy, sheep and tillage systems) that have a cattleenterprise. The mixed nature of Irish farms is reflected in the individual contribution of livestock andcrop categories to gross output. This is reflected in Table 8C in appendix 1.

Teagasc National Farm Survey 20185

Teagasc National Farm Survey 20186
Very challenging weather conditions wereexperienced on Irish farms during the spring andsummer of 2018. As a result grass growth was wellbelow normal, giving rise to a general foddershortage and a dramatic escalation in concentratefeed use on many farms. Storm and snow conditionsduring spring were swiftly followed by droughtconditions across Ireland and this is reflected inFigure 1 below.
Fig. 1: National Grass Growth 2016 - 2018
Source: Teagasc PastureBase Ireland
Although the farm-level impact of these severeweather conditions was broadly felt, the relativeeffect was farm specific and varied across regionsand systems. Generally, intensively stockedgrassland farms, in particular Dairy farms felt most ofthe brunt, with feed volume and expenditureincreasing dramatically in 2018 compared with theprevious year. On the average Dairy farm,concentrate feed expenditure rose by 43 percent(€12,765) to €42,289, although the particularcircumstances of the individual farm (i.e. stockingrate, pre-existing fodder stocks and farm location)generally dictated the additional feed requirement.Likewise, Dairy farm expenditure on purchased bulkyfeed was up 84 percent to €5,938 on average.
Although much lower in volume terms, purchasedconcentrate costs increased by 39 percent on Tillagefarms, many of whom have a significant cattleenterprise. On average, concentrate feedexpenditure on Tillage farms was €4,661 in 2018.The equivalent figure on Sheep farms was €8,475 (up31 percent). Likewise, Cattle Other farms reportedan average increase of 29 percent in concentratefeed spending to €7,801 with Cattle Rearing farmsless impacted, with average expenditure increasingby 12 percent to €3,973.
Figure 2 illustrates the year-on-year change inconcentrate feed use (kg per dairy cow) from 2017to 2018 across the three NUTS II regions. Thedramatic increase across all areas is evident.Interestingly, poorer weather conditionsexperienced first in the Northern and Westernregion in winter 2017, and the fact that cows tend tobe housed longer there is reflected in the generallyhigher concentrate usage in both years. In 2018, thewide variation in feed use on individual farms in theEastern and Midland and Southern regions isapparent, confirming the context specific nature ofthe fodder deficit and how it was dealt with.
Fig. 2: Change in Avg. Concentrate Feed Use (kg percow) on Dairy farms by NUTS II region 2017 & 2018
Increased expenditure on feed was the main driver inpushing up production costs on farms in 2018, withhigher fertiliser expenditure, contracting charges andfuel prices also a factor. Fertiliser related spendingrose by between 11 and 19 percent on most farms,with expenditure on Cattle Other systems rising by 24
Weather Woes in 2018
Interpreting the boxplots
Boxplots help provide a more in-depthdescription of the data. Here, the greenshaded boxes are representative of between25% and 75% of the population. The linewithin the box represents the median (middle)data point, i.e. half of all farms lie below thiswith half above. The tails at either endcorrespond to the minimum and maximumdata points with extreme outliers removed.

Teagasc National Farm Survey 2018
7
percent. The average spend on fertiliser on Dairyfarms was €13,759. Increased fertiliser usage isindicative of the need to increase fodder stocks laterin 2018, which is also reflected in a rise in spendingon contracting, which rose by 17 percent acrosssystems. Expenditure on contracting charges hasincreased in recent years with more farmers tendingto contract out work to cope with the increasedworkload, in particular on Dairy farms which areexpanding.
Despite unfavourable weather conditions, Irish milkproduction increased by a further 4 percent in 2018due to a strong recovery in the back end of the year.However, a lower milk price combined with thedramatic increase in feed and other costs resulted ina decline in average Dairy farm income of 31 percentto €61,446. This followed on from a record Dairyfarm income in 2017 of €88,829.
Drystock farms were also negatively affected byadverse weather in 2018, the picture varyingsomewhat across individual systems. Althoughaverage costs increased marginally on Cattle Rearingfarms, a reduction in output was the main driver inincome declining by 22 percent to €8,311. Thedecline in Cattle Other farm income was smaller,falling 10 percent to €14,560. Average Sheep farmincomes fell by 23 percent year-on-year, due mainlyto increased production costs. The average farmincome on Sheep farms in 2018 was €13,297.
Only Tillage farms saw a year-on-year increase infarm income in 2018, on average. However, thesituation was highly farm specific with crop mix onindividual farms a factor, as spring crops (especiallybarley) were impacted most by the adverse weather.On average, Tillage farm income rose by 13 percentto €40,650. Although cereal yields for major cropswere down about 23 percent on the 2017 level,harvest prices were up considerably.
The difficult production conditions encountered byfarmers in 2018 took its toll in terms of farmerwellbeing. Data from the Teagasc NFS found thatalmost three-quarters of Dairy farmers reportedelevated stress levels in 2018. The figure was loweron Cattle and Tillage farms at 57 percent and loweston Sheep farms at 37 percent. Unsurprisingly,weather was a major factor with 83 percent of allfarmers citing this. Three-quarters of Dairy andSheep farmers cited workload as a major stressor.Close to half of all farmers felt that financial pressurewas causing them stress in 2018, the figure higheston Sheep farms.
Issues such as security, isolation and succession werenot generally found to be a factor in terms of farmerwellbeing or anxiety. Interestingly, Sheep farmers(37 percent) were most likely to cite compliance as a
stressor, the higher level of participation in Pillar IIschemes by those farmers may be a factor.

Teagasc National Farm Survey 20188
Family Farm Income (FFI), the return from farmingfor farm family labour, land and capital, is theprincipal measure used in the Teagasc National FarmSurvey. FFI varies considerably by farm system, withDairy farms consistently being the most profitable(Figure 3). That said, Dairy farm incomes were worsthit in 2018, falling by almost one-third on average to€61,446. This followed a record income year in 2017and is reflective of the inherent volatility in the dairysystem; unfavourable weather conditions and asubsequent increase in production costs were thekey factor in 2018. The dramatic decline in Dairy FFIwas driven mainly by a 43 percent increase inconcentrate feed expenditure.
Cattle Rearing farms were next worst hit in 2018 withan average reduction in income of 22 percent. Thisresulted in an average FFI of €8,311, the lowest inrecent years. Despite a marginal increase in feedexpenditure on these farms (12 percent on purchasedconcentrates, on average) a decline in output and aslight increase in costs were the key drivers. Averageconcentrate feed expenditure increased by 29 per centon Cattle Other farms in 2018, with total direct ncostsincreasing by 16 percent and FFI declining by 10percent to €14,560.
An average reduction in Sheep farm income of 23percent was experienced, falling to €13,297. Again,this is explained by an increase in concentrate feedexpenditure of close to one-third and an 11 percentrise in overall costs, on average. Conversely, Tillagefarms experienced an increase in average income in2018, up 13 per cent year-on-year to €40,650. Despitea 10 percent increase in overall production costs, grossoutput rose by a slightly larger magnitude. Thesituation on individual Tillage farms varied greatly. Itwas a year of two halves with spring crops particularlynegatively affected, due to late planting and very dryweather conditions over the summer.
Figure 4 reflects system FFI over time, highlighting thegap between Dairy and Drystock farm performance inparticular. The divergence in average income levels onCattle Rearing farms is especially stark. Of note also isthe volatility of Dairy FFI post-milk quota abolition in2015 which highlights the need for resilience to shocksbe they milk price or weather induced. Theimprovement in Tillage farm income over the past twoyears is also noteworthy. Across all systems, averageFFI in 2018 was €23,333, however given the widevariation between systems this figure is not aparticularly useful measure of farm performance.
-
20
40
60
80
100
Dairy CattleRearing
CattleOther
Sheep Tillage
€'0
00
per
farm
Fig. 3: Average FFI by System 2016 - 2018
2016 2017 2018
-
20
40
60
80
100
2012 2013 2014 2015 2016 2017 2018
€'0
00
Fig. 4: Trends in System Average FFI 2012 -2018
Dairy Cattle RearingCattle Other SheepTillage All
Family Farm Income 2018

Teagasc National Farm Survey 20189
The large variation in average farm income acrossfarm systems is related to differences in both farmsize and profitability per hectare (Table 1).
Overall, the average farm size in 2018 was 43hectares and the average income level per hectarewas €541 (down from €692 in 2017). The averagesized Dairy farm in 2018 was 59 hectares. Anaverage FFI of €1,047 per hectare was earned onDairy farms in 2018; this reflects a year-on-yearreduction of €459. The economic return on a perhectare basis was next highest on Tillage farms, at€675, an increase of €75 year-on-year.
The Drystock sector, Cattle and Sheep farms, istypically characterised by lower profitability andsmaller holdings. In 2018, the average income perhectare was lowest on Cattle Rearing farms, wherethe figure fell to €270, compared to €322 in 2017.This average income per hectare was just onequarter of that of their Dairy farm counterparts.Average FFI per hectare on Cattle Other farms was€391 in 2018, falling from €460 the previous year.The equivalent figure on Sheep farms was €276,down from €369 in 2017.
The variation in individual FFI per hectare acrossfarms systems is illustrated in Figure 5, with half ofall farms reporting a figure within the green box.Those farms at the lower and higher ends of thedistribution are represented by the tails. Themedian Dairy FFI per hectare was €990 in 2018 withaverage Drystock FFI per hectare (particularly onCattle farms) falling well below this.
Unpaid farm family labour should be considered inan evaluation of FFI across systems, particularly asDrystock farmers are more likely to work off-farm.Figure 6 adjusts average system FFI to take accountof unpaid family labour which is measured in annualwork units (AWU). Each unit is equivalent to 1,800hours.
Proportionately, hours worked (both family andhired) are highest on Dairy farms and when FFI isadjusted for same, a median FFI of below €41,329 isreported, with half of all Dairy farms (the greenshaded box) earning between €23,000 and €62,434approximately.
Fig. 5: System Avg. FFI per hectare 2018
Fig. 6: System Avg. FFI per Annual Work Unit 2018
Family labour input on Tillage farms tends to belower, leaving the unpaid labour adjusted FFIrelatively similar (although more varied). OnDrystock farms, Sheep farms tend to be more labourintensive with a higher proportion of Cattle farmersworking off-farm which is reflected in these figures.
Table 1: Average Farm Size & FFI per ha 2018
Size (ha) Income per ha
Dairy 59 €1,047
Cattle Rearing 31 €270
Cattle Other 37 €391
Sheep 48 €276
Tillage 60 €675
All 43 €541

Teagasc National Farm Survey 201810
29 percent of farms across systems had a farmincome of less than €5,000 in 2018 (Figure 7). Afurther 15 percent earned between €5,000 and€10,000, with an additional 31 percent reporting aFFI of between €10,000 and €30,000. Thereforethree-quarters of Irish farms earned less than€30,000 in 2018, with the remaining 25 percentearning in excess of this.
11 percent of farms earned between €30,000 and€50,000 in 2018, with a further 6 percent falling intothe €50,000 to €70,000 category. Of the remainingfarms, 4 percent earned between €70,000 and€100,000, with a further 4 percent earning in excessof this.
Compared to 2017, a higher proportion of farms fellinto the lower income category in 2018 (i.e. thoseearning less than €5,000 increased 8 percentagepoints). Likewise, 29 percent of farms earned morethan €30,000 in 2017, with the figure declining 4percentage points to 25 percent in 2018. This isreflective of the dramatic decline in farm incomes onDairy farms in particular.
Figure 8 reflects aggregate FFI by system in 2018.Although Dairy farms account for only 17 percent ofthe total farm population, 46 percent of totalnational farm income (€992m) was generated onthose farms in 2018. The equivalent figure on Cattlefarms was 29 percent (€625m) although they arerepresentative of 58 percent of the farm population.Sheep farms account for 15 percent of total farmsand 9 percent of aggregate income (€190m) in 2018.Tillage farms are the smallest grouping accountingfor 7 percent of farms and 13 percent of total FFI(€279m) in 2018.
Across the various systems, the contrasting story interms of farm income distribution is evident (Figure9). It is worth noting that 53 percent of Dairy farmsreported a FFI of more than €50,000 in 2018 (downfrom 72 percent in 2017), with 16 percent of theseearning more than €100,000. On the other hand,almost two-thirds of Cattle Rearing farms earned afarm income of €10,000 or less in 2018 (up 6percentage points compared to 2017).
Approximately half of all other Drystock farms fellinto this category in 2018, the proportion being 49percent on Cattle Other farms and 55 percent onSheep farms. The year-on-year volatility in farmincomes is reflected in the change in FFI distributionacross farms each year.
As previously mentioned, it is important to takeaccount of unpaid family labour on farms. Onaverage, there was one unpaid family labour unit (orannual work unit) employed on farms in 2018.
0%
5%
10%
15%
20%
25%
30%
35%
< €5K €5 -€10K
€10 -€30K
€30 -€50K
€50 -€70K
€70 -€100K
>€100K
Fig. 7: Avg. System FFI Distribution 2018
46%
10%
19%
9%
13%
3%Fig. 8: Aggregated FFI by System 2018
Dairy Cattle RearingCattle Other SheepTillage Mixed Livestock
8
6549 55
2218
32
38 27
3121
9 14
19
53
27
0%
10%
20%
30%
40%
50%
60%
70%
80%
90%
100%
Dairy CattleRearing
CattleOther
Sheep Tillage
Fig. 9: Avg. System FFI Distribution 2018
<10,000 10-30,000 30-50,000 >50,000
FFI Distribution 2018

Teagasc National Farm Survey 201811
The amount of unpaid labour supplied was higheston Dairy farms at 1.4 labour units and lowest onCattle Other farms at 0.90. Tillage farms reported afigure of 1 in 2018, with the comparative figures onCattle Rearing and Sheep farms 0.93 and 1.06respectively.
Figure 10 reports average FFI per labour unit in 2018.In adjusting for the additional unpaid labour utilisedon Dairy farms, average FFI was estimated to be€47,815. The equivalent figure on Tillage farms was€43,059. Relatively more hired labour is also utilisedon these systems (0.26 and 0.12 of a labour unitrespectively).
-
10
20
30
40
50
60
70
Dairy CattleRearing
CattleOther
Sheep Tillage
€'0
00
s
Fig. 10: Avg. System FFI per Labour unit 2018
FFI FFI per labour unit

Teagasc National Farm Survey 201812
In general, farm income continues to be highlyreliant on direct payments, the value of whichincreased by 3 percent in aggregate terms in 2018.On average, the total direct payment received perfarm was €17,244. The actual figure and overallcontribution to FFI varies greatly across system asis evident from Table 2 below. The data indicatesthat market income (before direct payments) isless than zero on Drystock farms, indicating that onaverage these farms do not make a profit fromproduction and are heavily dependent on support.
Although average direct payments are lowest onCattle Rearing farms at €13,098, the reliance onsame and their overall contribution to farm incomewas 158 percent in 2018, the highest on record. Thisindicates that the average suckler farm with a FFI of€8,311, lost over €4,700 of direct payments over thecourse of the year. The picture is similar on otherDrystock farms.
The average payment on Sheep farms in 2018 was€18,980, 143 percent of total FFI. Cattle Other farmsfared slightly better, reporting an average directpayment of €16,226 at 111% of farm income. Due totheir size, Dairy and Tillage farms receive the highestdirect payments overall; however, they are leastreliant on them. The average direct paymentreceived on Dairy farms in 2018 was €21,022,representative of one-third of total FFI. Directpayments on Tillage farms comprised over half of FFIin 2018, at €22,451 on average. It should be notedthat in addition to crop area, many Tillage farmswould also have a large on-farm cattle enterprise.
In terms of individual schemes, payments under theGLAS Agri-Environmental Scheme increased by 12percent year-on-year, reflecting both a rise inparticipants and a higher advance payment rate.Proportionately, Cattle Rearing farms saw the largestaverage increase from GLAS, up 30 percent to €1,957on the average farm.
That said, Sheep farms received the highest GLASpayment on average, at €2,269. Cattle Other andTillage farms received average GLAS payments ofapproximately €1,500 and €1,300 respectively, withthe average Dairy farm receiving €555 in 2018.Average payments received across systems isreflective of the proportion of participant farmswithin the system. More than one-third of all farmsparticipated in GLAS in 2018, the highest proportionon Sheep farms (53 percent). Additional monieswere also allocated under the Areas of NaturalConstraints Scheme (ANC) in 2018. This benefittedall farm systems with the average payment received€1,860. Again, Sheep farms tended to receive mostthrough this scheme at €2,486 on average with Dairyand other Drystock farms receiving approx. €1,800.
The average composition of direct payments acrossfarm systems is contained in Figure 11. The BasicPayment accounted for 79 percent of all paymentsreceived on the average Dairy farm in 2018. Theequivalent figure on Tillage farms was 84 percentwith the proportion on Cattle Rearing farms 57percent and Cattle Other 70 percent. The BasicPayment accounted for 62 percent of payments onthe average Sheep farm in 2018.
Agri-environmental scheme payments wererelatively more important on Drystock farms than ontheir Dairy and Tillage counterparts, accounting forbetween 10 and 15 percent of total payments.Payments received under the ANC scheme were alsoof relatively more importance on those farms.System specific payments such as the Beef DataGenomics Programme and the Sheep WelfareScheme, were of particular importance to CattleRearing and Sheep farms, accounting for over €1,000on the average farm.
-
5
10
15
20
25
Dairy CattleRearing
CattleOther
Sheep Tillage
€'0
00
Fig. 11: Avg. Direct Payments Compositionby System 2018
Single_Farm_Payment Agri-Envt.Areas Nat. Const. BDGPForestry Knowledge TransferDairy payts Organics SchemeMisc. TB compBTAP Sheep Welfare
Table 2: Average value of Direct Payments &Contribution to FFI 2018
DPs FFI contribution
Dairy €21,022 34%
Cattle Rearing €13,098 158%
Cattle Other €16,226 111%
Sheep €18,980 143%
Tillage €22,451 55%
All €17,244 74%
Direct Payments 2018

Teagasc National Farm Survey 201813
Despite difficult conditions, gross new investmenton Irish farms increased by 8 percent in 2018. Onaggregate, this totalled almost €941 millionnationally. Investment on Dairy farms was highest atan average of €31,714 per farm, accounting for morethan half of total investment in 2018. This figure isup 19 percent on 2017, a year in which more than adoubling in investment occurred.
Similarly, investment on Tillage farms increasedstrongly in 2018, increasing by over 34 per cent onaverage to €11,499. Although lower in value terms,investment on the average Cattle Other farmincreased significantly also, up 21 percent to €5,774.On the other hand, lower incomes on Cattle Rearingand Sheep farms were observed and wereassociated with a reduction in investment on thosefarms, the former down 19 percent to €3,913 andthe latter down 32 percent to €4,270.
In terms of financing investment, given the decline ingeneral farm incomes, it is not surprising that overalldebt on Irish farms increased somewhat in 2018.The increase was modest however, up 5 percentoverall. That said, across farm systems, almost two-thirds of farms have no farm business related debt.This figure varies considerably by farm type, six outof ten Dairy farms had borrowings in 2018,compared to only two out of ten on Sheep farms andthree out of ten on Cattle and Tillage farms (Table 3).
Where much of the investment on Dairy farms wasfinanced internally in 2017, average farm debtincreased by 12 percent in 2018 to €121,453.Despite reduced investment on Cattle Rearing andSheep farms, debt increased on average, presumablyto help mitigate the cost-price squeeze.
The average debt on Cattle Rearing farms was up 20percent to €24,882, with the equivalent figure onCattle Other and Sheep farms €36,842 (down 6percent) and €38,657 (up 18 percent). Average debton Tillage farms declined year-on-year (down 16percent) to €55,142.
The majority of farm debt (75 percent) was classifiedas long-term (more than ten years) in 2018 with 81percent of average Dairy farm debt categorised assuch. The comparative figure on Cattle Rearing andOther farms was 73 percent on average with theproportion on Sheep farms a little higher at 77percent. Conversely, only 31 percent of averageTillage farm debt was classified as long-term withanother 35 percent short-term (including overdrafts)and the remaining 34 percent related to leasing orhired purchase.
Figure 12 presents the debt to income ratio for allfarms by system (including those without debt)alongside those with farm related borrowings.Although less than one-third of Cattle farmsreported having debt in 2018, the debt to incomeratio of those with borrowings is relatively high at2.3.
Dairy farms were more likely to have debt than otherfarm types, and were also more likely to have higherlevels of debt, but given their comparatively higherincome levels the average debt to income ratio wasmuch lower at 1.8. The figure on Sheep and Tillagefarms was 1.8 and 0.95 respectively.
0.0
0.5
1.0
1.5
2.0
2.5
Dairy CattleRearing
CattleOther
Sheep Tillage
Fig. 12: Debt to Income Ratios for allFarms & those with Debt in 2018
All Farms Farms with Debt
Table 3: Average Farm Debt by System 2018
Farms withborrowings
Average debt(farms with debt)
Dairy 61% €121,453
Cattle Rearing 30% €24,882
Cattle Other 34% €36,842
Sheep 23% €38,657
Tillage 34% €55,142
All 36% €61,546
Investment 2018

Teagasc National Farm Survey 201814
In terms of the composition of investment acrossfarm systems, Figure 13 illustrates that over half ofthe funds invested on the average Dairy farm in 2018(€16,190) related to buildings, with a further 42percent (€13,384) invested in machinery and theremaining 7 percent (€2,140) allocated to landimprovement. Across the other farm systems,machinery related investment was proportionatelyhigher, accounting for 92 percent of investmentexpenditure on Tillage farms (€10,553 on average)and between 57 percent and 64 percent on Drystockfarms; all spending in the region of €2,500 to €3,300on average in 2018.
The Targeted Agricultural Modernisation Scheme(TAMS) and the Young Farmer Capital InvestmentScheme have assisted on-farm investment in recentyears. Of those Dairy farms participating in TAMS in2018, the average payment received was €20,793.
In terms of future on-farm investment, within the2018 Teagasc NFS, farmers were asked to assesstheir facilities with most reporting that they wereadequate or more than adequate overall.Interestingly, 39 percent of respondents highlightedthe need to further invest in drafting facilities with30 percent reporting that further investment onroadways was required. Furthermore, close to one-quarter of respondents believed an upgrading oftheir cow housing and milking facilities werenecessary.
51
2333
247
42
6458
57 92
7 12 919
0
20
40
60
80
100
Dairy CattleRearing
CattleOther
Sheep Tillage
%
Fig. 13: Avg. Composition of FarmInvestment by System 2018
Buildings Machinery Land improvement

Teagasc National Farm Survey 201815
There were approximately 16,146 Dairy farms, withan average income of €61,446 in 2018, a 31 percentdrop year-on-year. Given very difficult weatherconditions and a subsequent increase in productioncosts, the fact that the milk price held up better thanexpected (down 4 percent) and productionrecovered later in the year (Figure 14) helped toinsulate from a further decline in Dairy FFI in 2018.
The components of dairy FFI on the average farm in2018 are contained in Table 4. Gross output typicallydeclined by 2 percent year-on-year.
There was a 17% increase in total production costs onDairy farms in 2018 compared to 2017. Input costsincreased by 23 percent, with a dramatic increase infeed use volume in particular. Purchased concentratecosts increased by 43 percent, with feed volumereaching an average of 1,353kg per cow. Actual feeduse on individual farms was context specific andrelated to particular farm characteristics such asregion, stocking rate and other farm specific factors.
On an average Dairy farm with a herd of 79 cows,purchased concentrate expenditure totalled €42,289in 2018. Although much lower in value terms,expenditure on purchased bulky feed also increasedstrongly, (up 84 per cent) to €5,938 on average.
Figure 15 demonstrates the variation in concentratefeed use per cow across stocking rate band for 2017and 2018. This confirms the wide variation acrossfarms and clearly shows the large year-on-yearincrease. Feed use per cow on the median farm acrossstocking rates was broadly similar in 2017, with somemore variation at higher levels. The range increasedin 2018, with more heavily stocked farms requiringmarginally more concentrate feed per cow, onaverage.
Fig. 15: Avg. Concentrate Feed Use per Cow byStocking Rate 2018
Fertiliser expenditure also increased in 2018, up 14percent to €13,759 on average. This was due to bothincreased usage to build and replace fodder stocks,and a general increase in price. Likewise, machineryhire expenditure, which relates to contracting chargesalso rose, up 20 per cent to €11,141. Other livestockand veterinary costs remained stable on average,accounting for €10,684 on the average dairy herd.
0
200
400
600
800
1,000
Jan
Feb
Mar
Ap
r
May Jun
Jul
Au
g
Sep
Oct
No
v
De
c
M.l
itre
s
Fig. 14: Irish milk production 2016 - 2018
2016 2017 2018
Table 4: Components of Average Dairy FFI 2018
2018 2018/2017change
Gross Output €213,782 -2%
of which Direct Payts €21,022 +5%
Total Costs €152,336 +17%
of which direct costs €93,493 +23%
of which overheads €58,843 +9%
Family Farm Income €61,446 -31%
Dairy 2018

Teagasc National Farm Survey 201816
Overhead costs also increased on Dairy farms in 2018,although not to the same degree as direct costs, rising9 percent year-on-year. This was due for the mostpart to depreciation costs for buildings, machinery andland, where increases ranged from 18 to 24 percent.Land improvement costs (e.g. roadways, drainage andreseeding) also rose in 2018, up 18 percent from 2017.Hired labour costs continued to increase on Dairyfarms in 2018, on foot of a significant rise the previousyear. On average, expenditure increased by 6 percentto €5,341. Conacre rental charges remained relativelystable in 2018, spending totalling €5,897 on average.Interest paid on loans also increased, up 8 per cent onaverage.
Taking account of farm and herd size, average Dairy FFIin 2018 equated to €1,047 per hectare and €778 percow. Table 5 presents key indicators for Dairy farms in2018. On a per hectare basis, milk productionincreased 1 percent year-on-year to 11,293 litres.Average gross output per hectare declined by 4percent to €4,125, with gross margin declining by 18percent to €2,350.
Just over half of dairy farms reported a farm incomeabove €50,000 in 2018, compared to almost three-quarters in 2017. Of these, 16% earned more than€100,000. This was half of the proportion in thatincome category the previous year. Dairy FFIdistribution is presented in Figure 16 with themovement across income categories apparent,particularly at the lower and higher ends. In 2018, 26per cent of dairy farms earned an income of less than€30,000, a 14 percentage point increase on 2017.Similarly, the proportion of farms earning between€30,000 and €50,000 increased from 15 to 21 percent,with those earning between €50,000 and €70,000going from 15 to 23 per cent. Conversely, thoseearning between €70,000 and €100,000 declined by 9percentage points to 15 per cent.
Taking account of farm scale and intensity, Figure 17illustrates average Dairy FFI in 2018 by farm size class,highlighting the wide variation in return for largerfarms. Approximately 40 percent of Dairy farmsbelong to the 50 to 100 hectares size category, with afurther 35 percent in the 30 to 50 hectare bracket.Smaller farms represent 18 percent of the Dairy farmpopulation, with the remaining 7 percent above 100hectares.
Fig. 17: Avg. Dairy FFI by UAA size 2018
0
5
10
15
20
25
30
35
<30,000 30-50,000 50-70,000 70-100,000 >100,000
%o
ffa
rms
Fig. 16: Dairy FFI distribution 2016-2018
2016 2017 2018
Table 5: Average Dairy Farm Indicators 2018
2018 2018/2017change
Production (litres/ha) 11,293 +1%
Milk price (cent/litre) 36 -4%
Gross Output (€/ha) 4,125 -4%
Direct Costs (€/ha) 1,775 +25%
Gross Margin (€/ha) 2,350 -18%

Teagasc National Farm Survey 201817
Dairy farm structures vary by region. These generallydictate the circumstances and constraints under whichfarms operate. Teagasc NFS data for 2018 isdisaggregated here to NUTS II regions to examineinherent differences. The counties corresponding to theregions referred to are illustrated in Figure 18.
Fig. 18: Irish NUTS II regions
In terms of the proportion of Dairy farms located in eachregion, the vast majority, 11,708 (72 percent) arelocated in the South, which would be considered atraditional dairy area. A further 2,352 are located in theNorthern and Western region, with 2,014 in the Easternand Midlands region, where more recent dairyexpansion has been occurring since the abolition of EUmilk quota.
Table 6 provides an overview of farm structures orcharacteristics by region. On average, Dairy farms in theEastern and Midland region are larger, both in terms ofland area and herd size. The proportion of Dairy farmsoperating on very good soils is much lower in theNorthern and Western region, at 34 percent, comparedto over 60 percent in the other regions. Both hiredlabour costs and farm debt are substantially higher onDairy farms in the Eastern and Midland region withaverage investment also twice as high. There is a higherhired labour component on those farms.
The average Dairy farm in the South invested close to€28,000 in 2018. Both Dairy FFI and that adjusted forunpaid family labour were lowest in the Northern andWestern region in 2018, the latter being €31,793. Theequivalent figures in the Eastern and Midland and theSouthern region were €59,093 and €46,048.
On a per hectare basis, in 2018, FFI was highest in theSouthern region at €1,099. The comparative figures forthe Eastern and Midland and Northern and Westernregions were €988 and €884 respectively. Direct costsper cow were higher in the Northern and Westernregion with higher levels of concentrate feedexpenditure providing a partial explanation of the costdifferential. Overhead costs were substantially higheron farms in the Eastern and Midland region at €84,827on average, compared to €50,759 in the Northern andWestern region, and €54,446 in the South. Conacrerental costs on the average Dairy farm in the Eastern andMidland region were highest, at over €9,000 in 2018.When FFI per cow in 2018 is compared, farms in theSouth performed best at €843, a differential of approx.€150 compared to the other two regions.
Figure 19 reports Dairy on-farm investment across theregions in 2018 and reflects the relatively higher figurein the Eastern and Midland region. Proportionately,relatively more (about half) of total investment in theEastern and Midland and Southern regions relates tobuildings compared to the Northern and Western regionwhere the figure is 38 percent. Relatively more is spenton machinery in the Northern and Western.
-
10
20
30
40
50
60
Eastern &Midland
Northern &Western
Southern
€'0
00
Fig. 19: Composition of Dairy FarmInvestment by Region 2018
Buildings Machinery Land improvement
Table 6: Regional Dairy Farm Structures 2018
Nth/West East/Mid South
UAA (ha) 50 71 58
Herd size 62 101 76
Hired labour cost €3,468 €12,266 €3,976
Farm debt €50,096 €148,498 €60,487
Investment €21,360 €56,020 €27,727
FFI €44,266 €69,817 €64,242
FFI per unpaid LU €31,793 €59,093 €46,048
Table 7: Selected Regional Costs and Dairy FFI2018
Nth/West East/Mid South
Direct costs/cow €1,262 €1,232 €1,181
Gross Margin/ha €1,897 €2,189 €2,031
FFI/ha €884 €988 €1,099
FFI/cow €715 €691 €843
Regional Dairy Analysis

Teagasc National Farm Survey 201818
Dramatic structural change has taken place on IrishDairy farms in preparation for, and since the abolitionof EU milk quota in 2015. Overall milk production hasincreased and production efficiency has improved.Figure 20 illustrates the dramatic increase in theaverage volume of milk produced and sold perhectare over the period 2010 to 2018. Apart from adecrease in 2012 due to adverse weather conditionsand the subsequent fodder crisis, and a slowdown in2015 as a result of a lower milk price, production hasincreased strongly over the period. Average milkproduced per hectare in 2018 was 11,293 litres. Thedifference between milk produced and sold is that fedto calves, which tends to be lower when milk price ishigher.
In expanding production and improving productivity(milk yield per cow), Dairy stocking rate has alsoincreased, and this is reflected in Figure 21. In 2010the average Dairy stocking rate was 1.9, this rose to2.06 by 2018.
An increase in average Dairy farm UAA and Forage areais also evident (Figure 22), the former going from 55 to58 hectares over the period. Of that, Dairy forage areaincreased from 34 to 38, on average.
Figure 23 illustrates the growth in average Dairy herdsize, the figure increasing from 65 to 79 since 2010.Regional data indicates much growth in the Eastern andMidland region in particular, where Dairy farms seem tohave more capacity to expand. A concurrent rise in totallivestock units is evident with increased replacementsand retention of other cattle on the farm.
8
9
10
11
12
2010 2012 2014 2016 2018
'00
0lit
res
Figure 20: Avg. Milk Produced & Sold per ha2010 - 2018
Milk produced per ha Milk sold per ha
1.70
1.80
1.90
2.00
2.10
2.20
2010 2012 2014 2016 2018
Figure 21: Avg. Dairy Stocking Rate -Cows per ha 2010 -2018
0
20
40
60
80
2010 2012 2014 2016 2018
Figure 22: Average Dairy UAA & ForageArea 2010 -2018
Dairy Forage Area UAA
0
50
100
150
2010 2012 2014 2016 2018
No
.per
farm
Figure 23: Avg. Dairy Herd Size& Livestock Units 2010 - 2018
Dairy Cows Total Livestock Units
Dairy Farm Structural Change

Teagasc National Farm Survey 201819
In 2018 there were approximately 25,781 Cattle
Rearing farms, with an average income of €8,311.
Suckler cow production is the dominant enterprise on
these farms. A reduction in both area and livestock
units was evident in 2018. Table 8 outlines the key
components of average FFI on Cattle Rearing farms in
2018. Gross output typically declined by 4 percent
year-on-year to €35,990. Direct Payments remained
unchanged, at €13,098 on the average farm.
Total production costs increased in 2018, albeit to a
lesser extent than on other farm systems, up 3
percent compared to the previous year. The main
driver was the 6 percent increase in direct costs,
which equated to €13,440 on the average farm.
Spending on concentrate feed increased by 12 per
cent on average to €3,973, with purchased bulky feed
expenditure also up. Fertiliser expenditure rose by 11
per cent, due to both an increase in usage and price,
the average farm spending €2,502 in 2018. As on
other systems in 2018, spending on contracting
charges also increased on Cattle Rearing farms, up 15
percent to €3,029 on average. In aggregate,
overhead costs increased by 1 percent on Cattle
Rearing farms in 2018, with increases in energy and
fuel (up 5 and 6 percent) and increased depreciation
costs for machinery and land (11 and 8 percent
respectively). Spending on land improvement also
rose slightly in 2018 (up 5 percent).
Table 9 indicates that there was a 5 percent reduction
in farm size to 31 hectares on the average Cattle
Rearing farm in 2018, with the proportion of rented
land declining.
Total livestock units also declined, down 4 percent
compared to 2017, to 35 on average. The average gross
margin on a per hectare basis was €732 in 2018. This
included a Basic Payment of €243.
Figure 24 presents the distribution of income on Cattle
Rearing farms from 2016 to 2018. A dramatic increase in
the proportion of farms reporting an average FFI of less
than €5,000 in 2018 is evident; up 13 percentage points
to 44 per cent. The data indicates that almost two-thirds
of Cattle Rearing farms earned less than €10,000 in 2018.
A further 22 per cent earned between €10,000 and
€20,000, with 11 per cent in the €20,000 to €50,000
category. Only 1% of Cattle Rearing farms earned more
than €50,000 in 2018.
0
10
20
30
40
50
<5,000 5-10,000 10-20,000 20-50,000 >50,000
%o
ffa
rms
Fig. 24: Avg. Cattle Rearing FFI Distribution2016-2018
2016 2017 2018
Table 8: Components of Average Cattle RearingFFI 2018
2018 2018/2017change
Gross Output €35,990 -4%
of which Direct Payts €13,098 -
Total Costs €27,680 +3%
of which direct costs €13,440 +6%
of which overheads €14,240 +1%
Family Farm Income €8,310 -22%
Table 9: Cattle Rearing Average Indicators 2018
2018 2018/2017change
Farm Size (ha) 31 -5%
Livestock Units 35 -4%
Livestock Units per ha 1.14 -
Basic Payment (€/ha) 243 -
Gross Margin (€/ha) 732 -4%
Cattle Rearing 2018

Teagasc National Farm Survey 201820
In disaggregating the data further, Figure 22illustrates the variation in FFI on Cattle Rearing farmsacross size categories, with a broad range reportedfor those farms in the largest size classes in particular.In terms of the overall population, approximately 4percent had a UAA above 100 hectares, with 13percent between 50 and 100 and 38 percent in the 30to 50 hectares bracket. 29 percent of Cattle Rearingfarms were sized between 20 and 30 hectares, withthe remaining 16 percent less than this. The lowprofitability of many Cattle farms is reflected in theviability analysis presented later in the report.
Fig. 25: Avg. Cattle Rearing FFI by Farm Size 2018

Teagasc National Farm Survey 201821
There were approximately 28,239 Cattle Other farms,with an average income of €14,560 in 2018, an 11 percent decline on 2017. Cattle finishing is the dominantenterprise on these farms. In 2018 finished cattleprices increased only marginally due to volatilityacross price categories.
Overall, output value increased by 6 percent in 2018,with an additional 5 percent rise in direct payments.The latter was mainly due to an increase in averagepayments received through the Basic Payment, GLASand the Areas of Natural Constraint scheme.
Table 10 outlines the components of average CattleOther income in 2018. The value of Gross Output was€52,352, with Direct Payments totalling over €16,226on average.
Total costs increased by 14 percent on Cattle Otherfarms year-on-year. In general, direct productioncosts increased by 16 percent, with expenditure onpurchased concentrates up 29 percent to €7,801 onaverage. Expenditure on purchased bulky feed roseby a similar magnitude to €934 on average. As onother systems, expenditure on fertiliser andcontracting charges increased in 2018. Expenditureon fertiliser rose by 24 percent to €3,500 on average,with contracting charges increasing by 14 percent to€3,567. Expenditure relating to livestock andveterinary declined by 1 percent compared to 2017.
On average, overhead costs increased by 12 per centin 2018. Of those, conacre rental expenditure rose by10 percent to €1,327. Depreciation costs alsoincreased strongly, with higher expenditure relatingto machinery operating and energy and fuel alsoevident.
Average concentrate feed use on Cattle Other farms bystocking rate is depicted in Figure 26. This appears tovary most on farms with relatively lower and higherstocking rates.
Fig. 26: Avg. Concentrate Feed use per LivestockUnit on Cattle Other Farms 2018
Table 11 indicates that average UAA on Cattle Otherfarms rose by 6 per cent in 2018 to 37 hectares. Totallivestock units also increased to 50 from 47. Theaverage gross margin per hectare on Cattle Other farmswas €882 in 2018, down from €927 in 2017. Thisincluded a Basic Payment of €305 per hectare.
Figure 27 presents the distribution of average incomeon Cattle Other farms in 2018. The proportion offarms in the lowest income category has increasedsteadily since 2016, accounting for one-third of farmsin 2018.
Table 10: Components of Average Cattle Other FFI2018
2018 2018/2017change
Gross Output €52,352 +6%
of which Direct Payts €16,226 +5%
Total Costs €37,792 +14%
of which direct costs €19,509 +16%
of which overheads €18,283 +12%
Family Farm Income €14,560 -10%
Table 11: Cattle Other Average Indicators 2018
2018 2018/2017change
Farm Size (ha) 37 +6%
Livestock Units 50 +6%
Livestock Units per ha 1.35 -
Basic Payment (€/ha) 305 -1
Gross Margin (€/ha) 882 -5%
Cattle Other 2018

Teagasc National Farm Survey 201822
A further 16 percent earned between €5,000 and€10,000, meaning that just under half of all CattleOther farms earned less than €10,000 in 2018.
A further 23 percent earned between €10,000 and€20,000, indicating that average income on almostthree-quarters of Cattle Other farms fell below€20,000 in 2018. An additional 24 percent earnedbetween €20,000 and €50,000 with only 4 percentearning an FFI above this. It should be noted that 42percent of Cattle Other farm-holders also worked off-farm in 2018.
Figure 28 reflects the variation in average FFI by farmsize with a broad range reported for those farms inthe largest size class in particular. In terms of theoverall population, approximately 5 percent of farmsfall into this size category with 18 percent in the 50 to100 hectares bracket and 29 percent in the 30 to 50hectares category. 25 percent of Cattle Other farmsare sized between 20 and 30 hectares with theremaining 23 percent less than this.
Fig. 28: Avg. Cattle Other FFI by Farm Size 2018
0
5
10
15
20
25
30
35
<5,000 5-10,000 10-20,000 20-50,000 >50,000
%o
ffa
rms
Fig. 27: Cattle Other FFI Distribution2016-2018
2016 2017 2018

Teagasc National Farm Survey 201823
Regional differences in terms of various farm
characteristics, costs and income have already been
outlined for Dairy farms in 2018. Similarly, regional
differences are important on Cattle farms and these
are discussed here across the NUTS II regions
described in Figure 29.
Fig. 29: Irish NUTS II regions
Table 12 provides some information on regionalfarm structures and economic indicators on CattleRearing farms in 2018. Over half of all CattleRearing farms (14,000) are located in the Northernand Western region with over 8,500 located in theSouth and 3,500 in the Eastern and Midland region.Cattle Rearing farms in the Northern and Westernregion tend to be smaller and less intensivelystocked. Only 16 percent operate on very goodsoils, compared to half of the farms across the otherregions.
In 2018 direct costs per hectare were €100 higheron farms in the South at €478, with expenditure onpurchased concentrate feed a factor. Overall, FFIwas higher on average in the Southern region. On aper hectare basis the figure was €293, with thecomparative figures in the Northern and Westernregion and Eastern and Midland regions €271 and€230 respectively. Direct payments per hectarewere also highest in the Northern and Westernregion at €437 per hectare.
The corresponding figures for the Cattle Othersystem (predominantly finishing) are contained inTable 13. The majority of these farms, 11,500 (41percent) are based in the Southern region, withanother 33 percent (over 9,000) based in theNorthern and Western region and the remaining 25percent (7,000) based in the Eastern and Midlandregion.
Cattle Other farms in the Eastern and Midland andSouthern regions were more intensively stocked thanthose farms located in the Northern and Western region.On average, FFI was highest on those farms located in theSouth, at €16,125, in 2018. Gross Output per hectare wasbroadly similar across the three regions in 2018. Grossmargin was on average higher in the South, at €900 perhectare.
On average, costs were higher on Cattle Other farmsbased in the Eastern and Midland region in 2018.Elevated spending on purchased concentrates was themain factor in this, with higher expenditure oncontracting charges, veterinary expenses etc. alsoevident. Overhead costs were substantially lower in theNorthern and Western region, where average spendingon hired labour was much lower. Overall, moreintensively stocked, higher cost farms in the Eastern andMidland region did comparatively worse in 2018. FFI inthe region was €315 on a per hectare basis, with thehighest figure reported on Northern and Western farmsat €453. Direct payments were also highest in this regionat €484 per hectare.
Table 12: Selected Regional Farm Structures onCattle Rearing Farms 2018
Nth/West East/Mid South
UAA (ha) 30 32 33
Livestock units 32 40 38
FFI €7,995 €7,398 €9,557
Gross Output /ha €1,111 €1,203 €1,222
Gross Margin/ha €695 €799 €744
Direct Payts/ha €437 €409 €417
FFI/ha €271 €230 €293
Table 13: Selected Regional Farm Structures onAvg. Cattle Other Farms 2018
Nth/West East/Mid South
UAA (ha) 31 41 40
Livestock units 40 59 51
FFI €13,940 €12,858 €16,125
Gross Output /ha €1,325 €1,434 €1,399
Gross Margin/ha €872 €844 €900
Direct Payts/ha €484 €401 €433
FFI/ha €453 €315 €407
Regional CattleAnalysis

Teagasc National Farm Survey 201824
There were approximately 14,322 Sheep farms withan average income of €13,297 in 2018, a 23 percentreduction on 2017 (Table 12). Despite a slightimprovement in prices early in the year, overall grossoutput on the average Sheep farm declinedmarginally to €50,085. Direct payments were upslightly year-on-year to almost €19,000 on average.This was mainly due to increased payments under theAreas of Natural Constraints Scheme (up 10 percent)and to a lesser extent GLAS (up 5 percent). The SheepWelfare Scheme continued in 2018, providing anaverage payment of €1,000 to participants.
As on most other systems, the main factor in reducedFFI on Sheep farms in 2018 related to increasedproduction costs. Direct costs increased by 15percent on average with purchased concentrate costsincreasing by almost one-third to close to €8,500 (thelargest increase across Drystock systems and morethan twice that of their Cattle Rearing counterparts).The fact that lambing season coincided with most ofthe difficult weather was a real issue in terms ofincreased feeding costs on Sheep farms. Fertiliserexpenditure also increased, up 19 percent to over€3,000 on average. As with the other systems, astrong increase in fodder production costs is evident,with spending on contracting charges up 19 percenton average to €2,338. Overhead costs increased by 7percent to €17,473 in 2018, with some increases inenergy and fuel and depreciation in particular.
On a per hectare basis, the average gross margin onSheep farms was €640 in 2018. This included a BasicPayment of €244. The average sized Sheep farm was48 hectares, with a flock size of 127 ewes.
Figure 30 presents the distribution of income onSheep farms since 2016. What is evident is therelatively large proportion of farms in the lowerincome categories, with one-third of farms earningbelow €5,000 in 2018. The proportion of farmsearning between €10,000 and €20,000 also increased7 percentage points to 22 percent. Conversely, thoseearning between €20,000 and €50,000 declined by 7percentage points to 22 percent. Only 3 per cent ofSheep farms earned above €50,000 in 2018. Thevariation in average Sheep FFI is illustrated in Figure30.
0
5
10
15
20
25
30
35
<5,000 5-10,000 10-20,000 20-50,000 >50,000
%o
ffa
rms
Fig. 30: Average Sheep FFI Distribution2016-2018
2016 2017 2018
Table 12: Components of Average Sheep FFI 2018
2018 2018/2017change
Gross Output €50,085 -1%
of which Direct Payts €18,980 +2%
Total Costs €36,788 +11%
of which direct costs €19,315 +15%
of which overheads €17,473 +7%
Family Farm Income €13,297 -23%
Table 13: Sheep Farm Indicators 2018
2018 2018/2017change
Farm Size (ha) 48 +2%
Number of Ewes 127 -4%
Livestock Units per ha 1.10 -6%
Basic Payment (€/ha) 244 -2%
Gross Margin (€/ha) 640 -11%
Sheep 2018

Teagasc National Farm Survey 201825
On average, Tillage farms were the only ones toreport an annual increase in FFI in 2018.Approximately 6,879 Tillage farms earned anaverage income of €40,650 in 2018. Although,harvest yields were down substantially due to thechallenging weather conditions, prices increased andoverall, the general improvement was sufficient toincrease average margins. This was not the case forall crops however with spring crops especiallyaffected by late planting and adverse summerweather. Table 14 reports the components ofaverage Tillage FFI in 2018. Average gross outputincreased by 11 percent to €116,163. This was dueto a combination of factors, with increased outputvalue for wheat and straw in particular. Some farmsalso benefitted from the growth of forage crops.
In line with the other farm systems, costs increasedon Tillage farms in 2018, increasing by 10 percentoverall to €75,529. This was due to both to increasesin individual cost items and a slight increase inoverall Tillage area on NFS farms which was up 2percent to 37 hectares. Direct costs increased by 12percent year-on-year, with fertiliser the maincomponent, up 19 per cent to €11,763 on theaverage Tillage farm. Expenditure on purchasedseed and crop protection totalled a similar amount,with the former rising by 7 percent and the latter upby 1 percent compared to the previous year. As onother farms, expenditure on contracting chargesrose strongly year-on-year, up 13 percent to €7,596on average. As most Tillage farms also have asignificant cattle enterprise, expenditure onpurchased concentrates also increased in 2018, up39 percent to €4,661 on average.
As on other systems in 2018, overhead costs alsoincreased, rising by 8 percent year-on-year. Withregard to individual cost items, conacre rental costswere up by 12 percent to €5,041 on average. Costsrelating to fuel and electricity also increased, as didthose relating to land improvement anddepreciation.
Data from the Teagasc NFS 2018 indicates that onthe average Tillage farm 33 hectares (over half of allland area) was dedicated to cereals. The averagefarm gross margin was €1,285 per hectare and thisincluded a Basic Payment of €314 (Table 15).
Figure 31 presents the distribution of income ontillage farms from 2016-2018. Of note is the fact that27 percent earned a FFI of more than €50,000. Ofthese, 19 percent earned more than €100,000. Theproportion of Tillage farms earning below €5,000was up 2 percentage points in 2018, at 14 percent,with 9 percent earning between €5,000 and €10,000(up 4 percentage points). One fifth of Tillage farmsearned between €10,000 and €20,000 in 2018, with30 per cent earning between €20,000 and €50,000.
0
10
20
30
40
<5,000 5-10,000 10-20,000 20-50,000 >50,000
%o
ffa
rms
Fig. 31: Avg. Tillage FFI Distribution2016-2018
2016 2017 2018
Table 14: Components of Average Tillage FFI 2018
2018 2018/2017change
Gross Output €116,163 +11%
of which Direct Payts €22,451 -2%
Total Costs €75,529 +10%
of which direct costs €38,824 +12%
of which overheads €36,688 +8%
Family Farm Income €40,650 +13%
Table 15: Avg. Tillage Enterprise Indicators 2018
2018 2018/2017change
Farm Size (ha) 60 -
Hectares of Cereals 33 +3%
Cereal output (€/ha) 1,850 +18%
Basic Payment (€/ha) 314 -4%
Gross Margin (€/ha) 1,285 +10%
Tillage 2018

Teagasc National Farm Survey 201826
Farm income varies widely by region, driven by farmsystem, scale, profitability and direct payments.Those regions where dairying is more prevalent aregenerally more profitable and have a lower relianceon direct payments (Figure 32).
Average family farm income in 2018 was highest inthe South-East at €35,622 and lowest in the Borderregion, where average farm incomes was 2.5 timesless at just over €13,292. This is of course reflectiveof farm composition in those areas, with a higherprevalence of drystock farms in areas where incomesare lower. The relative importance of directpayments is highest in that region, accounting formore than total FFI in 2018 (117 per cent). A similarsituation is evident in the West where the averageFFI was just under €14,000 (with direct paymentscomprising 108%). The equivalent figure for farms inthe Midlands region was 93 per cent. Although muchlower in percentage terms, direct payments accountfor a significant proportion of farm income acrossthe other regions also, ranging between 57 and 67per cent. The relative contribution of directpayments to FFI increased across all regions in 2018.This was due to reduced profitability across systemsand the fact that 2017 was a record year for DairyFFI.
Just over half (51.5 percent) of farm households hadan off-farm income employment source in 2018, aslight increase on 2017. Dairy farm households wereslightly more likely to have an off-farm income,within the household, with the proportion of farmspouses employed off-farm generally higher. Thisreflects the younger demography of these
households. The higher age profile of non-dairy farmhouseholds is reflected in the fact that they weremore than twice as likely to be in receipt of pensionson average.
The proportion of farm households where thespouse was employed off-farm remained static at 33percent, with the same proportion of farmersemployed off-farm (again unchanged at 33 percent)(Figure 33).
The off-farm employment situation differs bysystem, with Cattle farmers more likely to work off-farm. 42 percent of Cattle Other farmers had an off-farm job in 2018; the equivalent figure on CattleRearing farms was 39 percent. A lower proportion ofSheep and Tillage farmers worked off farm (32 and33 percent), whereas only 12 percent of Dairyfarmers were employed off-farm.
The incidence of off-farm employment varies acrossregions and reflects the dominant type of farmingthere (Figure 34). More than 40 percent of farmersin the West worked off-farm in 2018, compared toabout 25 percent in the Southern regions, wherefarmers were less likely to be employed off farm dueto the predominance of dairy farming there.
0
20
40
60
80
100
120
140
0
5
10
15
20
25
30
35
40
B E M SW SE S W
%
€'0
00
Fig. 32: Average FFI & DPs as a % of FFI byRegion 2018
FFI Direct Payts as a % of FFI
0
10
20
30
40
50
60
2008 2010 2012 2014 2016 2018
Fig. 33: Off-Farm Employment2008-2018
Farmer Farmer & Spouse
05
1015202530354045
Border East M'lds S'West S'East South West
%
Fig. 34: Proportion of Farmers EmployedOff-Farm by Region 2018
Regional FFI andOff-farm Employment

Teagasc National Farm Survey 201827
It follows that farms with relatively modest incomescan be viable if the labour input and capitalinvestment is low, and similarly farms with seeminglylarge incomes may not be viable if there is asubstantial labour input and/or significant capitalinvested in machinery and livestock. Farms that arefound not to be economically viable, but have an off-farm income source (either from a job, pension orsocial welfare) within the household, earned by eitherthe farmer or the spouse, are considered to beeconomically sustainable. Farm households areconsidered to be economically vulnerable if they areoperating non-viable farm businesses and neitherthe farmer or spouse works off-farm.
The data indicates that 32 percent of the farmpopulation represented by the Teagasc NFS in 2018were classed as being economically viable (Figure35). This figure varies from year to year dependingon FFI performance across systems. As 2018 saw anaverage decline in FFI across most farms, it is notsurprising that this viability figure declined from 40percent in 2017. The proportion of householdsdefined as sustainable increased slightly to 34percent. This is due to the presence of an off- farmincome source, in which there was a small increase.The remaining 34 percent of farm households weredeemed to be economically vulnerable, having noalternative income source within the household. Thisincreased 3 percentage points year-on-year.
The viability of Irish farms varies across system.Figure 36 indicates the wide differential between theviability of dairy and tillage farms, on average,compared to their drystock counterparts. In 2018,72 percent of Dairy farms were found to be viable(down from 85 per cent in 2017). As a result, therewas an increase in those farm households furthersustained by an off-farm income source (up from 7to 14 percent). The proportion of viable Tillagefarms was 63 percent in 2018. The proportion ofviable Cattle Rearing farms fell a further 7percentage points in 2018 to 11 percent.
Although FFI on other Drystock farms was lessimpacted in 2018, only 26 per cent of Cattle Otherfarms (down 5 percentage points) and 20 per centof Sheep farms were classed as viable (down 8percentage points). As a result, the proportion ofvulnerable Cattle Rearing farms increased 3percentage points in 2018, with the comparativefigure on Cattle Other farms remaining stable andSheep up 3 percentage points on average. Similarly,a 4 percentage point increase in the proportion ofCattle Rearing farms deemed to be sustainable isevident, with this category also increasing similarlyon other Drystock farms.
32%
34%
34%
Fig. 35: Viability of Irish Farming 2018
Viable Sustainable Vulnerable
72
1126 20
63
14
46
3736
19
13
43 3744
18
0
10
20
30
40
50
60
70
80
90
100
Dairy CattleRearing
CattleOther
Sheep Tillage
%
Fig. 36: Viability of Farming by System 2018
Viable Sustainable Vulnerable
A farm business is defined as being economicallyviable if Family Farm Income is sufficient toremunerate family labour at the minimum wage(which is assumed here to be €19,616 per labourunit), and provide a 5 percent return on the capitalinvested in non-land assets, i.e. machinery andlivestock.
Viability 2018

Teagasc National Farm Survey 201828
To put these results in context, the data indicatesthat there were just under 12,000 viable Dairy farmbusinesses in Ireland in 2018, with almost 3,000Cattle Rearing farms and 7,500 Cattle Other farmsconsidered as such.
The number of viable Tillage and Sheep farms wereapproximately 4,500 and 3,000 respectively. Thedata indicates that there were over 21,000 vulnerableCattle farms in 2018 and this does not take accountof those smaller farms with a standard output of lessthan €8,000. Data is collected on those farms everyfive years, most recently in 2015, when half of thesesmall farms were found to be vulnerable, a furtherone-third were considered sustainable and theremainder viable.
The regional figures are stark, with 44 per cent offarms in the South classified as viable compared toonly 16 per cent in the Northern and Western region.The equivalent figure in the Eastern and Midland areais 34 per cent. These figures are reflective of thecomposition of agriculture and the sustainability ofsame across regions. 41 percent of farms in theNorthern and Western region in 2018 werevulnerable, compared to 27 per cent in the South and35 per cent in the Eastern and Midland region. Withregard to those farm households deemed sustainabledue to the presence of an off-farm income source,the proportion in the Southern region and Easternand Midland regions were similar at 29 and 30percent, with the comparative figure in the Northernand Western region higher at 43 percent. Thisreflects the importance of off-farm employment andthe incidence of part-time farming in that region.

Teagasc National Farm Survey 201829
Appendix 1: List of tables Teagasc NFS 2018
TABLE - 01a Farm Financial Results by Size (UAA - Ha) - Dairying SystemTABLE - 01b Resources per Farm by Size (UAA - Ha) - Dairying SystemTABLE - 01c Gross Output and Direct Payments by Size (UAA - Ha) - Dairying SystemTABLE - 01d Direct and Overhead Costs by Size (UAA - Ha) - Dairying SystemTABLE - 01e Demographic Data by Size (UAA - Ha) - Dairying System
TABLE - 02a Farm Financial Results by Size (UAA - Ha) - Cattle Rearing SystemTABLE - 02b Resources per Farm by Size (UAA - Ha) - Cattle Rearing SystemTABLE - 02c Gross Output and Direct Payments by Size (UAA - Ha) - Cattle Rearing SystemTABLE - 02d Direct and Overhead Costs by Size (UAA - Ha) - Cattle Rearing SystemTABLE - 02e Demographic Data by Size (UAA - Ha) - Cattle Rearing System
TABLE - 03a Farm Financial Results by Size (UAA - Ha) - Cattle Other SystemTABLE - 03b Resources per Farm by Size (UAA - Ha) - Cattle Other SystemTABLE - 03c Gross Output and Direct Payments by Size (UAA - Ha) - Cattle Other SystemTABLE - 03d Direct and Overhead Costs by Size (UAA - Ha) - Cattle Other SystemTABLE - 03e Demographic Data by Size (UAA - Ha) - Cattle Other System
TABLE - 04a Farm Financial Results by Size (UAA - Ha) - Sheep SystemTABLE - 04b Resources per Farm by Size (UAA - Ha) - Sheep SystemTABLE - 04c Gross Output and Direct Payments by Size (UAA - Ha) - Sheep SystemTABLE - 04d Direct and Overhead Costs by Size (UAA - Ha) - Sheep SystemTABLE - 04e Demographic Data by Size (UAA - Ha) - Sheep System
TABLE - 05a Farm Financial Results by Size (UAA - Ha) - Tillage SystemTABLE - 05b Resources per Farm by Size (UAA - Ha) - Tillage SystemTABLE - 05c Gross Output and Direct Payments by Size (UAA - Ha) - Tillage SystemTABLE - 05d Direct and Overhead Costs by Size (UAA - Ha) - Tillage SystemTABLE - 05e Demographic Data by Size (UAA - Ha) - Tillage System
TABLE - 07a Farm Financial Results by Size (UAA - Ha) - All SystemsTABLE - 07b Resources per Farm by Size (UAA - Ha) - All SystemsTABLE - 07c Gross Output and Direct Payments by Size (UAA - Ha) - All SystemsTABLE - 07d Direct and Overhead Costs by Size (UAA - Ha) - All SystemsTABLE - 07e Demographic Data by Size (UAA - Ha) - All Systems
TABLE - 08a Farm Financial Results by System of Farming - All FarmsTABLE - 08b Resources per Farm by System of Farming - All FarmsTABLE - 08c Gross Output and Direct Payments by System of Farming - All FarmsTABLE - 08d Direct and Overhead Costs by System of Farming - All FarmsTABLE - 08e Demographic Data by System of Farming - All Farms
TABLE - 10b Resources per Farm by System of Farming - Full-Time FarmsTABLE - 10c Gross Output and Direct Payments by System of Farming - Full-Time FarmsTABLE - 10d Direct and Overhead Costs by System of Farming - Full-Time FarmsTABLE - 10e Demographic Data by System of Farming - Full-Time Farms

Teagasc National Farm Survey 201830
TABLE - 11a Farm Financial Results by System of Farming - Part-Time FarmsTABLE - 11b Resources per Farm by System of Farming - Part-Time FarmsTABLE - 11c Gross Output and Direct Payments by System of Farming - Part-Time FarmsTABLE - 11d Direct and Overhead Costs by System of Farming - Part-Time FarmsTABLE - 11e Demographic Data by System of Farming - Part-Time Farms
TABLE - 14a Farm Financial Results -- By Region - All FarmsTABLE - 14b Resources per Farm -- By Region - All FarmsTABLE - 14c Gross Output and Direct Payments -- By Region - All FarmsTABLE - 14d Direct and Overhead Costs -- By Region - All FarmsTABLE - 14e Demographic Data -- By Region - All Farms
TABLE - 15a Farm Financial Results by System of Farming - All FarmsTABLE - 15b Resources per Farm by System of Farming - All FarmsTABLE - 15c Gross Output & Direct Payments by System of Farming - All FarmsTABLE - 15d Direct and Overhead Costs by System of Farming - All FarmsTABLE - 15e Demographic Data by System of Farming - All Farms

Teagasc National Farm Survey 201831
Table - 01A (2018) Farm Financial Results by Size (UAA - Ha) - Dairying System
Size (UAA-Ha)2 -
< 2020 -< 30
30 -< 50
50 -< 100
>= 100Hill
FarmsAll
Sizes
No. of Farms in Sample 11 15 76 140 55 14 311
Per Cent of Population 0.7 1.6 5.3 7.0 1.6 0.8 17.4
Overall Results (€)
Gross Output 53599 91814 148735 248048 507779 155247 213782
of which Land / Quota Let 0 0 18 327 404 0 176
Subsidies and DirectPayments
6154 7860 14796 25773 42998 17707 21022
- Direct Costs 26374 42341 62820 106959 228449 74720 93493
=Gross Margin 27225 49472 85915 141089 279330 80526 120289
- Overhead Costs 16231 24697 38970 68227 147201 40814 58843
= Family Farm Income 10994 24776 46944 72861 132130 39712 61446
Net Sales & Receipts 55110 91134 150922 248953 494073 160789 213797
-Current Cash Expenditure 38651 61054 89843 154867 338607 105960 135659
=Cash Income (Approx) 16459 30079 61079 94086 155466 54829 78138
- Net New Investment 9735 8814 17605 29465 85385 29603 28294
=Cash Flow 6724 21266 43474 64621 70081 25226 49845
Asset Values (€)
Machinery 17783 27236 47797 83684 144667 47514 68223
Livestock: Breeding 26959 44708 64378 109977 227061 76401 95399
Trading 4025 10823 17961 38190 86347 18760 31403
Land & Buildings 270509 417771 738838 1242987 2311543 759835 1042119
Gross New Investment 10815 9324 18916 33094 100141 30399 31714
Loans Closing Balance 0 0 35159 73878 316948 36088 74146
Total Standard Output(TSO)
50965.1 82302.1 122542.0 197922.0 382122.5 142192.7 171737.4
Distribution - % of Farms
Soil Group :- (1) 0.0 0.0 57.9 60.7 67.3 0.0 56.0
(2) 0.0 0.0 42.1 39.3 32.7 0.0 38.9
(3) 0.0 0.0 0.0 0.0 0.0 100.0 5.1
=Total 100.0 100.0 100.0 100.0 100.0 100.0 100.0

Teagasc National Farm Survey 201832
Table - 01 B (2018) Resources per Farm by Size (UAA - Ha) - Dairying System
Size (UAA-Ha) 2 - 20 - 30 - 50 - >= 100 Hill All< 20 < 30 < 50 < 100 Farms Sizes
No. of Farms in Sample 11 15 76 140 55 14 311
Per Cent of Population 0.7 1.6 5.3 7.0 1.6 0.8 17.4
LAND (ha)
Area Owned 12.7 21.3 34.8 55.2 94.0 40.1 46.7
Total Area 15.0 26.5 41.7 72.4 135.7 50.1 60.8
Tillage 0.0 0.0 0.5 0.9 6.0 0.0 1.1
of which Total Cereals 0.0 0.0 0.0 0.0 0.0 0.0 0.6
" Potatoes 0.0 0.0 0.0 0.0 0.0 0.0 0.0
Grassland Silage 5.1 8.1 14.5 24.9 44.8 16.6 20.7
Hay 0.4 0.8 0.5 1.0 1.5 0.1 0.8
Pasture 9.0 15.2 24.0 40.4 74.9 28.8 34.2
Rough Grazing 0.0 0.7 1.7 1.2 1.5 3.4 1.4
U.A.A 14.5 24.8 40.4 69.9 130.0 49.2 58.7
Remainder of Farm 0.5 1.7 1.3 2.4 5.7 0.9 2.2
Forage & Crop Acreage 14.5 24.5 39.9 67.8 127.8 46.9 57.3
LIVESTOCK
Cattle
Dairy Cows 24.5 38.6 57.0 90.1 171.7 66.3 78.6
Other Cows 0.1 1.0 0.5 2.5 4.2 0.9 1.7
Heifers-in-Calf 2.7 4.7 6.4 10.6 26.2 7.2 9.7
< 1 Year Old 7.7 17.3 28.8 56.3 110.7 35.0 46.0
1 - 2 Year Old Male 0.4 2.9 3.6 10.5 20.7 5.8 7.9
1 - 2 Year Old Female 2.8 4.9 9.0 19.2 38.0 7.8 15.2
=> 2 Year Old Male 0.0 0.7 0.6 1.2 1.9 0.3 0.9
=> 2 Year Old Female 0.8 0.2 0.7 1.5 2.2 1.7 1.1
Bulls 0.5 0.6 0.6 1.3 1.9 0.7 1.0
Total Cattle 39.0 70.3 106.6 192.0 376.1 125.0 161.3
Sheep (avg. no)
Ewes 0.0 3.3 3.0 1.8 3.5 2.0 2.4
Other Sheep 0.0 2.3 1.9 1.6 4.7 1.2 1.9
Total Sheep 0.0 5.6 4.9 3.4 8.2 3.2 4.3
Grazing Livestock Units
Dairy Cows 24.5 38.6 57.0 90.1 171.7 66.3 78.6
Other Cattle 7.3 15.6 23.5 49.8 100.1 27.5 40.1
Sheep 0.0 0.8 0.6 0.5 1.0 0.3 0.6
Horses 0.2 0.0 0.0 0.2 0.4 0.0 0.1
Total Livestock Units 32.0 54.9 81.1 140.5 273.3 94.1 119.4
LABOUR UNITS
Family 1.05 1.22 1.31 1.38 1.75 1.36 1.36
Total 1.06 1.27 1.37 1.71 2.71 1.55 1.62

Teagasc National Farm Survey 201833
Table - 01C (2018) Gross Output and Direct Payments by Size (UAA - Ha) - Dairying System
Size (UAA-Ha)2 -
< 2020 -< 30
30 -< 50
50 -< 100
>= 100Hill
FarmsAll
Sizes
No. of Farms in Sample 11 15 76 140 55 14 311
Per Cent of Population 0.7 1.6 5.3 7.0 1.6 0.8 17.4
(€) GROSSOUTPUT
LIVESTOCK
Dairying 43953 70799 116546 183683 381042 118768 161419
of which milk 42465 67645 113329 180813 375142 115462 158166
Cattle 3670 12799 19007 43569 91406 21484 34695
of which Beef Data / BeefGenomics
0 0 0 54 0 39 24
Sheep & Wool 0 473 283 335 522 104 323
of which Sheep CoupledPayments
0 0 0 0 0 0 0
Pigs 0 0 0 0 0 0 0
Poultry 0 0 0 0 0 0 0
Horses 0 13 0 581 236 0 259
Other 0 0 0 0 0 0 0
Sub-Total Livestock 47623 84084 135836 228168 473206 140356 196696
of which DiseaseCompensation
667 0 526 1937 3134 0 1275
CROPS
Wheat 0 0 0 0 0 0 49
Barley - Feeding 0 0 0 0 0 0 466
Barley - Malting 0 0 0 0 0 0 225
Oats 0 0 0 0 0 0 36
Potatoes 0 0 0 0 0 0 0
Other 800 110 336 1023 1375 54 698
of which Forestry Premium 0 0 113 497 247 0 260
Sub-Total Crops 800 110 907 1823 4259 54 1473
TOTAL LIVESTOCK &CROPS
48423 84194 136743 229991 477465 140410 198169
Machinery Hire Revenue 273 1333 59 139 178 0 231
Other Current Receipts 639 15 1058 640 1596 233 780
+ Decoupled DirectPayments / Sub
5487 7808 14020 22910 39444 17667 19249
of which Single FarmPayment
4062 6178 11486 19890 36442 13153 16510
" REPS/GLAS 454 125 360 697 527 1568 555
" DAS 961 1500 1748 1981 1951 2694 1850
" Other Subsidies 9 56 563 718 697 253 549
" AEOS 0 0 46 26 0 0 25
+ Income from Land Let 0 0 18 327 404 0 176
+ Income from Quota Let 0 0 0 0 0 0 0
- Inter-EnterpriseTransfers
1223 1587 3603 6360 11517 3092 5147
TOTAL GROSS OUTPUT 53599 91814 148735 248048 507779 155247 213782

Teagasc National Farm Survey 201834
Table - 01 D (2018) Direct and Overhead Costs by Size (UAA - Ha) - Dairying System
Size (UAA-Ha) 2 - 20 - 30 - 50 - >= 100 Hill All< 20 < 30 < 50 < 100 Farms Sizes
No. of Farms in Sample 11 15 76 140 55 14 311
Per Cent of Population 0.7 1.6 5.3 7.0 1.6 0.8 17.4
DIRECT COSTS (€)
Purchased Concentrates 12782 19151 26572 49477 105273 31837 42289
Purchased Bulky Feed 2199 3439 3920 6378 13457 8568 5938
Fertiliser 2979 5205 9602 15569 34111 12001 13759
Crop Protection 72 45 280 522 1863 351 501
Purchased Seed 5 101 254 382 2035 334 454
Hire of Machinery 3674 5521 8601 12256 24684 9450 11141
Transport 40 156 169 253 563 218 236
Livestock (A.I. Vet etc.) 2944 4783 7350 11841 27397 8283 10684
Casual Labour 0 23 276 1029 2777 510 795
Other 2242 4498 6441 10149 19565 5662 8779
Sub-Total 26936 42921 63465 107856 231726 77214 94576
Fodder Crop Adjustment -563 -580 -645 -898 -3270 -2494 -1082
TOTAL DIRECT COSTS 26374 42341 62820 106959 228449 74720 93493
OVERHEAD COSTS (€)
Rent of Conacre 803 1663 2603 7295 18521 3527 5897
Car, Electricity, Phone 3984 4128 5751 7781 13492 5781 7078
Current Hired Labour 268 910 1013 6509 22035 3758 5341
Interest Charges 754 450 2259 3346 11591 1068 3289
Machinery Depreciation 2181 3491 6267 10823 19511 6337 8927
Machinery Operating 3212 4992 6513 10218 22991 5968 9263
of which Fuel & Lub 1251 1653 2267 4084 8946 2748 3560
Buildings Depreciation 1591 2328 5256 8727 17543 4730 7361
Buildings Maintenance 812 1485 2240 2728 3745 1710 2417
Land ImprovementDepreciation
24 386 820 1391 3046 793 1184
Land ImprovementMaintenance
493 975 1661 2436 3856 1448 2055
Other 2109 3889 4588 6974 10870 5695 6030
OVERHEAD COSTS 16231 24697 38970 68227 147201 40814 58843
TOTAL NET EXPENSES 42605 67038 101791 175185 375656 115534 152336
Distribution - % of farms
Costs % Output 81.5 74.0 68.9 70.3 73.4 72.8 71.2

Teagasc National Farm Survey 201835
Table - 01 E (2018) Demographic Data by Size (UAA - Ha) - Dairying System
Size (UAA-Ha)2 -
< 2020 -< 30
30 -< 50
50 -< 100
>= 100Hill
FarmsAll
Sizes
No. of Farms in Sample 11 15 76 140 55 14 311
Per Cent of Population 0.7 1.6 5.3 7.0 1.6 0.8 17.4
Holder
Age of Holder 54.5 52.7 53.1 52.8 53.1 52.9 53.0
Marital Status - Married % 0.0 73.3 90.8 82.9 76.4 80.7 82.8
Widowed % 0.0 0.0 0.0 0.0 0.0 13.6 2.4
Single % 0.0 0.0 0.0 14.3 0.0 5.7 14.5
Separated % 0.0 0.0 0.0 0.0 0.0 0.0 0.2
=Total 100.0 100.0 100.0 100.0 100.0 100.0 100.0
Household
Household Size (no.) 2.82 3.00 3.32 3.39 3.64 3.76 3.35
< 24 (no.) 0.00 0.00 1.07 1.26 1.27 1.61 1.15
< 24 % HH 0.0 0.0 50.0 57.9 52.7 62.5 52.5
25 - 44 (no.) 0.00 0.00 0.62 0.52 0.82 0.56 0.56
25 - 44 % HH 0.0 0.0 42.1 36.4 50.9 42.0 39.4
Demograph. Viable % HH 0.0 66.7 78.9 78.6 85.5 100.0 79.0
Off-farm sourcesof income --Holder and/orSpouse
Off-farm Job % HH 0.0 0.0 60.5 49.3 36.4 69.4 53.6
Off-farm Job Holder % HH 0.0 0.0 0.0 0.0 0.0 9.1 12.0
Off-farm Job Spouse %HH
0.0 0.0 56.6 44.3 36.4 69.4 47.0
Pensioners (no.) 0.00 0.00 0.25 0.19 0.29 0.19 0.23
Pensioners % HH 0.0 0.0 17.1 14.3 18.2 19.3 15.5
Unemployment Etc. (no.) 0.00 0.00 0.00 0.00 0.00 0.00 0.01
Unemployment Etc. % HH 0.0 0.0 0.0 0.0 0.0 0.0 0.6

Teagasc National Farm Survey 201836
Table - 02A (2018) Farm Financial Results by Size (UAA - Ha) - Cattle Rearing System
Size (UAA-Ha)2 -
< 2020 -< 30
30 -< 50
50 -< 100
>= 100Hill
FarmsAll
Sizes
No. of Farms in Sample 21 37 60 28 4 14 164
Per Cent of Population 8.0 6.8 7.8 2.2 0.1 2.6 27.8
Overall Results (€)
Gross Output 21541 31497 44863 65529 0 31094 35990
of which Land / Quota Let 521 0 37 1486 0 0 282
Subsidies and DirectPayments
6981 11719 16111 27343 0 11805 13098
- Direct Costs 8475 11763 17163 20371 0 12435 13440
=Gross Margin 13066 19734 27699 45158 0 18659 22550
- Overhead Costs 9913 10933 18201 22481 0 13808 14240
= Family Farm Income 3153 8801 9499 22677 0 4851 8311
Net Sales & Receipts 22676 33424 44497 67402 0 31683 36923
-Current Cash Expenditure 16034 19753 30175 35982 0 22013 23714
=Cash Income (Approx) 6642 13671 14322 31419 0 9669 13209
-Net New Investment 2994 2124 3944 6398 0 1408 3461
=Cash Flow 3648 11547 10378 25022 0 8262 9748
Asset Values (€)
Machinery 12425 13048 22894 27867 0 13948 17532
Livestock: Breeding 16380 22384 33769 44219 0 18666 25840
Trading 8865 13569 22756 32362 0 13747 16966
Land & Buildings 313834 394778 553508 934518 0 339735 463548
Gross New Investment 3851 2124 4538 6841 0 1408 3913
Loans Closing Balance 0 2950 9812 13907 0 5564 7394
Total Standard Output(TSO)
13460.1 19098.0 28295.4 37746.9 0.0 16545.0 21860.6
Distribution - % of Farms
Soil Group :- (1) 0.0 35.1 28.3 50.0 0.0 0.0 31.9
(2) 61.9 64.9 71.7 50.0 0.0 0.0 58.7
(3) 0.0 0.0 0.0 0.0 0.0 100.0 9.4
=Total 100.0 100.0 100.0 100.0 100.0 100.0 100.0

Teagasc National Farm Survey 201837
Table - 02B (2018) Resources per Farm by Size (UAA - Ha) - Cattle Rearing System
Size (UAA-Ha)2 -
< 2020 -< 30
30 -< 50 <
50 -100
>= 100Hill
FarmsAll
Sizes
No. of Farms in Sample 21 37 60 28 4 14 164
Per Cent of Population 8.0 6.8 7.8 2.2 0.1 2.6 27.8
LAND (ha)
Area Owned 16.7 23.2 33.0 65.7 0.0 31.4 28.7
Total Area 17.2 26.4 40.0 70.2 0.0 34.7 32.7
Tillage 0.0 0.1 0.1 0.0 0.0 0.1 0.0
of which Total Cereals 0.0 0.0 0.0 0.0 0.0 0.1 0.0
" Potatoes 0.0 0.0 0.0 0.0 0.0 0.0 0.0
Grassland Silage 5.6 7.1 10.9 11.5 0.0 6.5 8.2
Hay 1.2 0.9 1.7 2.1 0.0 0.3 1.2
Pasture 8.8 16.0 23.1 43.1 0.0 19.6 18.9
Rough Grazing 0.2 0.7 1.7 6.4 0.0 1.2 1.5
U.A.A 15.9 25.2 38.5 66.8 0.0 29.6 30.8
Remainder of Farm 1.3 1.2 1.6 3.4 0.0 5.0 1.9
Forage & Crop Acreage 15.7 24.5 36.4 58.7 0.0 27.3 29.0
LIVESTOCK
Cattle
Dairy Cows 0.0 0.0 0.0 0.0 0.0 0.0 0.0
Other Cows 14.4 20.0 29.1 37.4 0.0 16.8 22.6
Heifers-in-Calf 0.8 1.1 1.7 2.3 0.0 1.4 1.3
< 1 Year Old 12.8 16.3 26.2 32.6 0.0 14.9 19.7
1 - 2 Year Old Male 2.0 2.5 3.8 4.2 0.0 1.0 2.9
1 - 2 Year Old Female 2.8 3.8 7.1 11.0 0.0 2.9 5.2
=> 2 Year Old Male 0.0 0.2 0.3 0.4 0.0 0.0 0.2
=> 2 Year Old Female 0.3 1.0 1.6 2.1 0.0 0.6 1.1
Bulls 0.5 0.5 1.0 1.4 0.0 0.4 0.7
Total Cattle 33.6 45.5 70.6 91.4 0.0 38.1 53.7
Sheep (avg. no)
Ewes 0.6 0.8 1.8 2.3 0.0 0.0 1.1
Other Sheep 0.7 1.0 2.0 6.2 0.0 0.0 1.5
Total Sheep 1.3 1.8 3.8 8.5 0.0 0.0 2.6
Grazing Livestock Units
Dairy Cows 0.0 0.0 0.0 0.0 0.0 0.0 0.0
Other Cattle 21.4 29.7 45.3 59.2 0.0 24.3 34.5
Sheep 0.2 0.3 0.5 1.1 0.0 0.0 0.4
Horses 0.0 0.1 0.6 0.2 0.0 0.8 0.3
Total Livestock Units 21.5 30.0 46.4 60.5 0.0 25.1 35.2
LABOUR UNITS
Family 0.71 0.98 0.99 1.13 0.00 1.08 0.93
Total 0.72 0.98 1.01 1.14 0.00 1.09 0.94
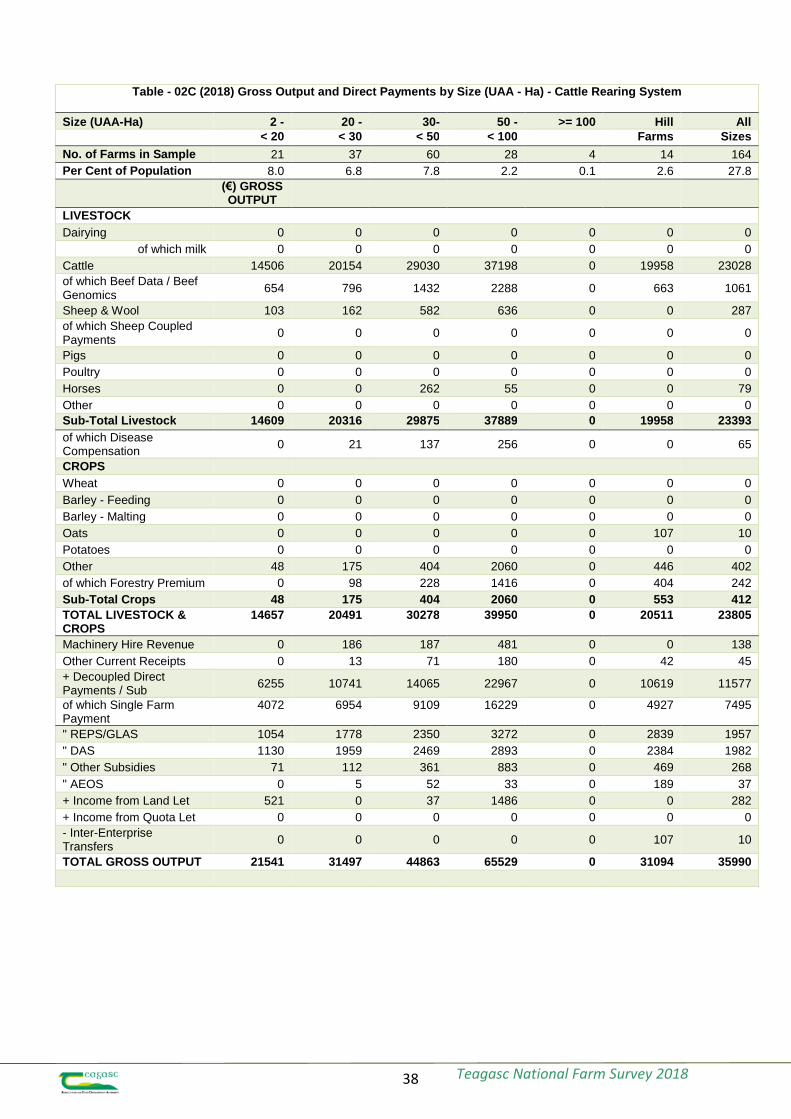
Teagasc National Farm Survey 201838
Table - 02C (2018) Gross Output and Direct Payments by Size (UAA - Ha) - Cattle Rearing System
Size (UAA-Ha) 2 - 20 - 30- 50 - >= 100 Hill All< 20 < 30 < 50 < 100 Farms Sizes
No. of Farms in Sample 21 37 60 28 4 14 164
Per Cent of Population 8.0 6.8 7.8 2.2 0.1 2.6 27.8
(€) GROSSOUTPUT
LIVESTOCK
Dairying 0 0 0 0 0 0 0
of which milk 0 0 0 0 0 0 0
Cattle 14506 20154 29030 37198 0 19958 23028
of which Beef Data / BeefGenomics
654 796 1432 2288 0 663 1061
Sheep & Wool 103 162 582 636 0 0 287
of which Sheep CoupledPayments
0 0 0 0 0 0 0
Pigs 0 0 0 0 0 0 0
Poultry 0 0 0 0 0 0 0
Horses 0 0 262 55 0 0 79
Other 0 0 0 0 0 0 0
Sub-Total Livestock 14609 20316 29875 37889 0 19958 23393
of which DiseaseCompensation
0 21 137 256 0 0 65
CROPS
Wheat 0 0 0 0 0 0 0
Barley - Feeding 0 0 0 0 0 0 0
Barley - Malting 0 0 0 0 0 0 0
Oats 0 0 0 0 0 107 10
Potatoes 0 0 0 0 0 0 0
Other 48 175 404 2060 0 446 402
of which Forestry Premium 0 98 228 1416 0 404 242
Sub-Total Crops 48 175 404 2060 0 553 412
TOTAL LIVESTOCK &CROPS
14657 20491 30278 39950 0 20511 23805
Machinery Hire Revenue 0 186 187 481 0 0 138
Other Current Receipts 0 13 71 180 0 42 45
+ Decoupled DirectPayments / Sub
6255 10741 14065 22967 0 10619 11577
of which Single FarmPayment
4072 6954 9109 16229 0 4927 7495
" REPS/GLAS 1054 1778 2350 3272 0 2839 1957
" DAS 1130 1959 2469 2893 0 2384 1982
" Other Subsidies 71 112 361 883 0 469 268
" AEOS 0 5 52 33 0 189 37
+ Income from Land Let 521 0 37 1486 0 0 282
+ Income from Quota Let 0 0 0 0 0 0 0
- Inter-EnterpriseTransfers
0 0 0 0 0 107 10
TOTAL GROSS OUTPUT 21541 31497 44863 65529 0 31094 35990

Teagasc National Farm Survey 201839
Table - 02D (2018) Direct and Overhead Costs by Size (UAA - Ha) - Cattle Rearing System
Size (UAA-Ha) 2 - 20 - 30 - 50 - >= 100 Hill All< 20 < 30 < 50 < 100 Farms Sizes
No. of Farms in Sample 21 37 60 28 4 14 164
Per Cent of Population 8.0 6.8 7.8 2.2 0.1 2.6 27.8
DIRECT COSTS (€)
Purchased Concentrates 2130 3495 5412 5856 0 3213 3973
Purchased Bulky Feed 544 868 723 1306 0 1139 841
Fertiliser 1601 2152 3281 3557 0 2617 2502
Crop Protection 36 94 100 217 0 60 89
Purchased Seed 20 37 114 167 0 12 63
Hire of Machinery 2117 2769 3628 4787 0 2764 3029
Transport 6 53 60 79 0 30 45
Livestock (A.I. Vet etc.) 1472 1489 2694 3037 0 1753 2074
Casual Labour 8 0 1 0 0 29 7
Other 1220 914 1618 1755 0 810 1289
Sub-Total 9153 12172 17632 20762 0 12427 13911
Fodder Crop Adjustment -678 -409 -469 -391 0 8 -472
TOTAL DIRECT COSTS 8475 11763 17163 20371 0 12435 13440
OVERHEAD COSTS (€)
Rent of Conacre 441 546 1615 1690 0 729 1006
Car, Electricity, Phone 1852 1932 2566 4149 0 2720 2364
Current Hired Labour 186 107 233 228 0 191 202
Interest Charges 608 201 512 759 0 189 462
Machinery Depreciation 1677 1902 2951 3692 0 1838 2347
Machinery Operating 1717 2020 3430 3744 0 2269 2532
of which Fuel & Lub 763 868 1652 1727 0 822 1148
Buildings Depreciation 1050 1171 2201 2735 0 2157 1693
Buildings Maintenance 435 553 922 582 0 425 627
Land ImprovementDepreciation
104 181 312 536 0 115 224
Land ImprovementMaintenance
359 606 896 1347 0 1215 741
Other 1484 1714 2565 3020 0 1960 2041
OVERHEAD COSTS 9913 10933 18201 22481 0 13808 14240
TOTAL NET EXPENSES 18388 22697 35364 42852 0 26243 27679
Distribution - % of farms
Costs % Output 88.5 73.5 81.3 69. 0.0 111. 83.

Teagasc National Farm Survey 201840
Table - 02E (2018) Demographic Data by Size (UAA - Ha) - Cattle Rearing System
Size (UAA-Ha)2 -
< 2020 -< 30
30 -< 50
50 -< 100
>= 100Hill
FarmsAll
Sizes
No. of Farms in Sample 21 37 60 28 4 14 164
Per Cent of Population 8.0 6.8 7.8 2.2 0.1 2.6 27.8
Holder
Age of Holder 60.3 60.3 58.8 52.0 0.0 55.9 58.8
Marital Status - Married % 61.9 62.2 70.0 78.6 0.0 54.2 64.8
Widowed % 0.0 0.0 0.0 0.0 0.0 0.0 5.0
Single % 0.0 32.4 21.7 0.0 0.0 45.8 28.6
Separated % 0.0 0.0 0.0 0.0 0.0 0.0 1.6
=Total 100.0 100.0 100.0 100.0 100.0 100.0 100.0
Household
Household Size (no.) 2.6 2.4 2.6 3.4 0.0 2.4 2.6
< 24 (no.) 0.0 0.0 0.6 1.4 0.0 0.4 0.5
< 24 % HH 0.0 0.0 23.3 53.6 0.0 31.9 25.7
25 - 44 (no.) 0.00 0.00 0.42 0.54 0.00 0.24 0.39
25 - 44 % HH 0.0 0.0 30.0 39.3 0.0 17.3 27.6
Demograph. Viable % HH 0.0 45.9 56.7 75.0 0.0 70.1 52.8
Off-farm sourcesof income --Holder and/orSpouse
Off-farm Job % HH 0.0 48.6 63.3 67.9 0.0 56.7 52.1
Off-farm Job Holder % HH 0.0 35.1 38.3 35.7 0.0 56.7 38.9
Off-farm Job Spouse %HH
0.0 0.0 45.0 50.0 0.0 31.9 31.5
Pensioners (no.) 0.76 0.68 0.48 0.00 0.00 0.05 0.53
Pensioners % HH 47.6 40.5 35.0 0.0 0.0 5.0 34.7
Unemployment Etc. (no.) 0.00 0.00 0.00 0.00 0.00 0.00 0.04
Unemployment Etc. % HH 0.0 0.0 0.0 0.0 0.0 0.0 3.4

Teagasc National Farm Survey 201841
Table - 03A (2018) Farm Financial Results by Size (UAA - Ha) - Cattle Other System
Size (UAA-Ha)2 -
< 2020 -< 30
30 -< 50
50 -< 100
>= 100Hill
FarmsAll
Sizes
No. of Farms in Sample 20 39 61 61 22 11 214
Per Cent of Population 7.6 7.2 8.0 4.9 0.9 1.7 30.4
Overall Results (€)
Gross Output 22578 34657 53073 98161 221675 33204 52352
of which Land / Quota Let 1186 1128 1063 512 301 102 943
Subsidies and DirectPayments
7954 11004 17664 27552 56855 13891 16226
- Direct Costs 7859 13177 18661 37750 91445 10846 19509
=Gross Margin 14718 21480 34413 60411 130230 22359 32843
- Overhead Costs 8526 13186 18915 35246 58946 9477 18283
= Family Farm Income 6192 8294 15497 25165 71284 12882 14560
Net Sales & Receipts 22831 37909 53018 97045 228181 31424 53088
-Current Cash Expenditure 14284 22715 32553 64036 131499 16696 32848
= Cash Income (Approx) 8547 15194 20466 33008 96682 14728 20240
- Net New Investment 1466 3254 3869 9484 33233 2677 4851
=Cash Flow 7081 11940 16597 23524 63449 12051 15389
Asset Values (€)
Machinery 7964 15033 18887 41809 76443 11163 20261
Livestock: Breeding 4609 8037 9043 29492 69350 12303 13016
Trading 22015 26174 43267 83461 159719 23454 42814
Land & Buildings 346125 511254 711356 1266733 2261406 528923 699060
Gross New Investment 2041 4155 4131 11332 39175 2983 5774
Loans Closing Balance 0 4078 15288 26303 60549 9166 12601
Total Standard Output(TSO)
15087.9 19708.3 30071.5 58016.7 124357.6 20823.5 30720.5
Distribution - % of Farms
Soil Group :- (1) 0.0 69.2 59.0 67.2 77.3 0.0 56.5
(2) 55.0 30.8 41.0 32.8 0.0 0.0 37.9
(3) 0.0 0.0 0.0 0.0 0.0 100.0 5.6
=Total 100.0 100.0 100.0 100.0 100.0 100.0 100.0
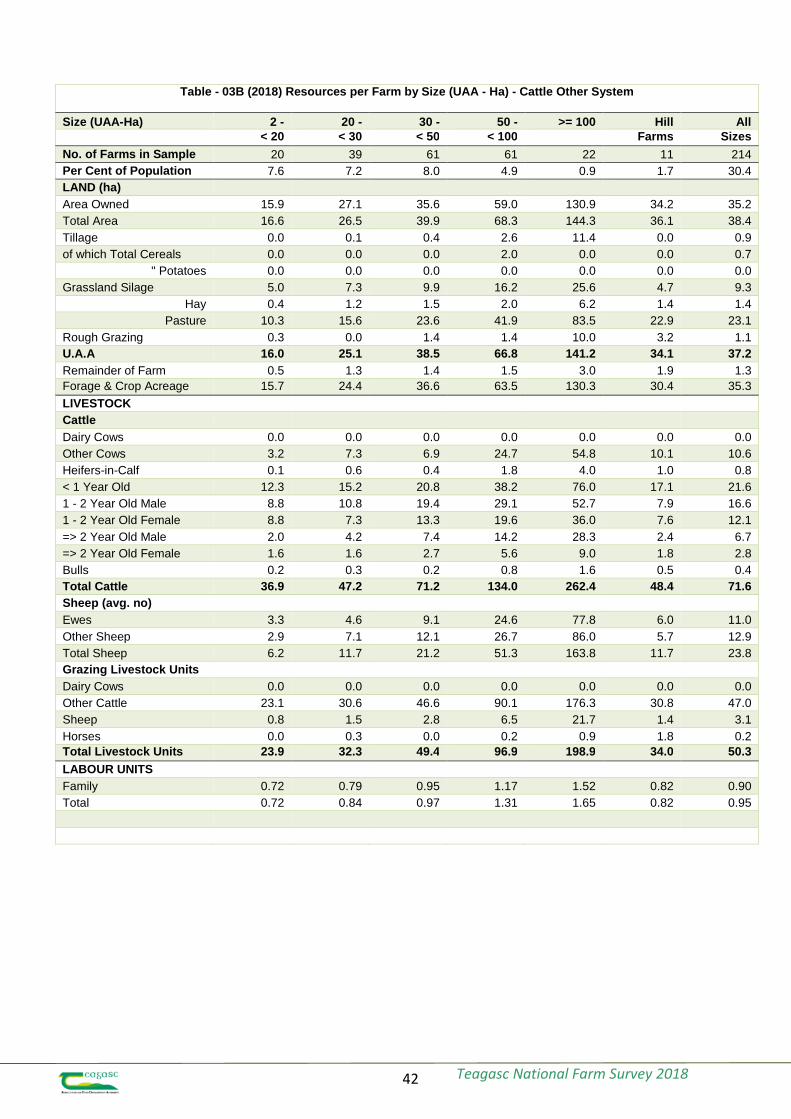
Teagasc National Farm Survey 201842
Table - 03B (2018) Resources per Farm by Size (UAA - Ha) - Cattle Other System
Size (UAA-Ha) 2 - 20 - 30 - 50 - >= 100 Hill All< 20 < 30 < 50 < 100 Farms Sizes
No. of Farms in Sample 20 39 61 61 22 11 214
Per Cent of Population 7.6 7.2 8.0 4.9 0.9 1.7 30.4
LAND (ha)
Area Owned 15.9 27.1 35.6 59.0 130.9 34.2 35.2
Total Area 16.6 26.5 39.9 68.3 144.3 36.1 38.4
Tillage 0.0 0.1 0.4 2.6 11.4 0.0 0.9
of which Total Cereals 0.0 0.0 0.0 2.0 0.0 0.0 0.7
" Potatoes 0.0 0.0 0.0 0.0 0.0 0.0 0.0
Grassland Silage 5.0 7.3 9.9 16.2 25.6 4.7 9.3
Hay 0.4 1.2 1.5 2.0 6.2 1.4 1.4
Pasture 10.3 15.6 23.6 41.9 83.5 22.9 23.1
Rough Grazing 0.3 0.0 1.4 1.4 10.0 3.2 1.1
U.A.A 16.0 25.1 38.5 66.8 141.2 34.1 37.2
Remainder of Farm 0.5 1.3 1.4 1.5 3.0 1.9 1.3
Forage & Crop Acreage 15.7 24.4 36.6 63.5 130.3 30.4 35.3
LIVESTOCK
Cattle
Dairy Cows 0.0 0.0 0.0 0.0 0.0 0.0 0.0
Other Cows 3.2 7.3 6.9 24.7 54.8 10.1 10.6
Heifers-in-Calf 0.1 0.6 0.4 1.8 4.0 1.0 0.8
< 1 Year Old 12.3 15.2 20.8 38.2 76.0 17.1 21.6
1 - 2 Year Old Male 8.8 10.8 19.4 29.1 52.7 7.9 16.6
1 - 2 Year Old Female 8.8 7.3 13.3 19.6 36.0 7.6 12.1
=> 2 Year Old Male 2.0 4.2 7.4 14.2 28.3 2.4 6.7
=> 2 Year Old Female 1.6 1.6 2.7 5.6 9.0 1.8 2.8
Bulls 0.2 0.3 0.2 0.8 1.6 0.5 0.4
Total Cattle 36.9 47.2 71.2 134.0 262.4 48.4 71.6
Sheep (avg. no)
Ewes 3.3 4.6 9.1 24.6 77.8 6.0 11.0
Other Sheep 2.9 7.1 12.1 26.7 86.0 5.7 12.9
Total Sheep 6.2 11.7 21.2 51.3 163.8 11.7 23.8
Grazing Livestock Units
Dairy Cows 0.0 0.0 0.0 0.0 0.0 0.0 0.0
Other Cattle 23.1 30.6 46.6 90.1 176.3 30.8 47.0
Sheep 0.8 1.5 2.8 6.5 21.7 1.4 3.1
Horses 0.0 0.3 0.0 0.2 0.9 1.8 0.2
Total Livestock Units 23.9 32.3 49.4 96.9 198.9 34.0 50.3
LABOUR UNITS
Family 0.72 0.79 0.95 1.17 1.52 0.82 0.90
Total 0.72 0.84 0.97 1.31 1.65 0.82 0.95

Teagasc National Farm Survey 201843
Table - 03C (2018) Gross Output and Direct Payments by Size (UAA - Ha) - Cattle Other System
Size (UAA-Ha)2 -
< 2020 -< 30
30 -< 50
50 -< 100
>= 100Hill
FarmsAll
Sizes
No. of Farms in Sample 20 39 61 61 22 11 214
Per Cent of Population 7.6 7.2 8.0 4.9 0.9 1.7 30.4
(€) GROSSOUTPUT
LIVESTOCK
Dairying 0 0 0 0 0 0 0
of which milk 0 0 0 0 0 0 0
Cattle 13784 18992 30155 62744 142723 17970 31407
of which Beef Data / BeefGenomics
381 319 215 908 2596 649 490
Sheep & Wool 307 989 1662 4105 12988 1359 1884
of which Sheep CoupledPayments
0 0 0 0 0 0 0
Pigs 0 0 0 0 0 0 0
Poultry 0 0 0 0 0 0 0
Horses 0 0 0 795 962 -123 151
Other 0 0 0 0 0 0 0
Sub-Total Livestock 14091 19981 31817 67644 156673 19205 33443
of which DiseaseCompensation
427 0 27 73 275 35 136
CROPS
Wheat 0 0 0 0 0 0 42
Barley - Feeding 0 0 0 2243 0 0 714
Barley - Malting 0 0 0 0 0 0 0
Oats 0 0 0 0 0 0 118
Potatoes 0 0 0 0 0 0 0
Other 196 1666 2830 1647 5422 590 1653
of which Forestry Premium 0 347 483 521 1865 755 393
Sub-Total Crops 196 1704 3128 4255 17422 590 2526
TOTAL LIVESTOCK &CROPS
14286 21686 34945 71899 174095 19795 35969
Machinery Hire Revenue 0 1363 202 211 0 0 411
Other Current Receipts 0 43 59 359 1788 892 188
+ Decoupled DirectPayments / Sub
6993 10268 16670 24971 50869 12416 14866
of which Single FarmPayment
5024 7352 12101 20716 43915 8100 11335
" REPS/GLAS 499 1469 2066 2067 3008 1908 1551
" DAS 1182 1430 2175 1947 3051 2240 1742
" Other Subsidies 423 88 585 1266 2147 168 561
" AEOS 270 0 95 62 0 0 103
+ Income from Land Let 1186 1128 1063 512 301 102 943
+ Income from Quota Let 0 0 0 0 0 0 0
- Inter-EnterpriseTransfers
0 0 81 946 6111 0 359
TOTAL GROSS OUTPUT 22578 34657 53073 98161 221675 33204 52352

Teagasc National Farm Survey 201844
Table - 03D (2018) Direct and Overhead Costs by Size (UAA - Ha) - Cattle Other System
Size (UAA-Ha)2 -
< 2020 -< 30
30 -< 50
50 -< 100
>= 100Hill
FarmsAll
Sizes
No. of Farms in Sample 20 39 61 61 22 11 214
Per Cent of Population 7.6 7.2 8.0 4.9 0.9 1.7 30.4
DIRECT COSTS (€)
Purchased Concentrates 3214 5101 7687 15645 34684 3088 7801
Purchased Bulky Feed 401 438 685 1818 6611 970 934
Fertiliser 1212 2357 3529 6750 16348 2108 3500
Crop Protection 68 115 143 604 2144 58 248
Purchased Seed 3 74 146 514 1669 80 195
Hire of Machinery 1794 2402 3735 6140 14049 2545 3567
Transport 79 68 239 433 1370 112 217
Livestock (A.I. Vet etc.) 757 1236 1678 3684 9276 871 1852
Casual Labour 3 333 96 118 268 0 132
Other 514 1024 1091 2959 4692 840 1329
Sub-Total 8046 13149 19029 38665 91110 10674 19775
Fodder Crop Adjustment -187 27 -368 -915 273 172 -268
TOTAL DIRECT COSTS 7859 13177 18661 37750 91445 10846 19509
OVERHEAD COSTS (€)
Rent of Conacre 698 381 1508 3129 4729 233 1327
Car, Electricity, Phone 1616 1946 2840 4629 6551 1368 2641
Current Hired Labour 89 475 258 2779 2181 19 722
Interest Charges 305 245 730 1390 3686 55 667
Machinery Depreciation 1180 1937 2705 5623 8992 1405 2731
Machinery Operating 1185 2959 3737 6601 11636 1489 3490
of which Fuel & Lub 523 1185 1533 2971 5314 827 1505
Buildings Depreciation 858 1305 2237 3536 8155 1825 2036
Buildings Maintenance 559 627 692 1533 2533 465 823
Land ImprovementDepreciation
108 241 304 569 1378 190 309
Land ImprovementMaintenance
522 1070 1075 1601 2484 534 1033
Other 1407 2000 2828 3858 6621 1892 2505
OVERHEAD COSTS 8526 13186 18915 35246 58946 9477 18283
TOTAL NET EXPENSES 16385 26363 37576 72996 150330 20322 37790
Distribution - % of farms
Costs % Output 76.4 78.4 74.4 72.6 66.4 68.3 75.0

Teagasc National Farm Survey 201845
Table - 03E (2018) Demographic Data by Size (UAA - Ha) - Cattle Other System
Size (UAA-Ha)2 -
< 2020 -< 30
30 -< 50
50 -< 100
>= 100Hill
FarmsAll
Sizes
No. of Farms in Sample 20 39 61 61 22 11 214
Per Cent of Population 7.6 7.2 8.0 4.9 0.9 1.7 30.4
Holder
Age of Holder 59.5 59.7 57.9 60.3 56.5 60.4 59.2
Marital Status - Married % 70.0 61.5 73.8 67.2 72.7 41.9 67.0
Widowed % 0.0 0.0 0.0 0.0 0.0 7.7 2.9
Single % 0.0 30.8 21.3 19.7 0.0 50.4 24.4
Separated % 0.0 0.0 0.0 0.0 0.0 0.0 5.7
=Total 100.0 100.0 100.0 100.0 100.0 100.0 100.0
Household
Household Size (no.) 2.4 2.0 2.7 2.9 3.4 1.8 2.5
< 24 (no.) 0.0 0.0 0.8 0.7 1.1 0.3 0.6
< 24 % HH 0.0 0.0 32.8 36.1 45.5 23.3 25.8
25 - 44 (no.) 0.0 0.0 0.4 0.4 0.0 0.2 0.3
25 - 44 % HH 0.0 0.0 26.2 31.1 0.0 7.7 20.6
Demograph. Viable % HH 0.0 43.6 54.1 65.6 59.1 31.0 50.0
Off-farm sourcesof income --Holder and/orSpouse
Off-farm Job % HH 55.0 56.4 57.4 47.5 45.5 41.9 53.7
Off-farm Job Holder % HH 55.0 41.0 47.5 19.7 0.0 37.1 41.9
Off-farm Job Spouse %HH
0.0 35.9 37.7 37.7 0.0 31.0 30.1
Pensioners (no.) 0.00 0.41 0.56 0.49 0.00 0.59 0.50
Pensioners % HH 0.0 28.2 41.0 42.6 0.0 48.6 35.5
Unemployment Etc. (no.) 0.00 0.00 0.00 0.00 0.00 0.00 0.05
Unemployment Etc. % HH 0.0 0.0 0.0 0.0 0.0 0.0 5.2

Teagasc National Farm Survey 201846
Table - 04A (2018) Farm Financial Results by Size (UAA - Ha) - Sheep System
Size (UAA-Ha)2 -
< 2020 -< 30
30 -< 50
50 -< 100
>= 100Hill
FarmsAll
Sizes
No. of Farms in Sample 7 21 33 30 5 29 125
Per Cent of Population 3.6 2.7 3.3 2.4 0.3 2.9 15.4
Overall Results (€)
Gross Output 0 29220 57154 97294 0 37478 50085
of which Land / Quota Let 0 1118 499 454 0 5 413
Subsidies and DirectPayments
0 12172 21886 31953 0 20309 18980
- Direct Costs 0 9547 22008 35719 0 12912 19315
=Gross Margin 0 19673 35146 61575 0 24566 30770
- Overhead Costs 0 12435 18970 36272 0 11282 17473
= Family Farm Income 0 7238 16176 25303 0 13284 13297
Net Sales & Receipts 0 31324 58950 94586 0 37132 50924
-Current Cash Expenditure 0 19587 36518 62275 0 21172 32303
=Cash Income (Approx) 0 11737 22432 32311 0 15960 18621
- Net New Investment 0 1422 3532 11025 0 3200 3802
=Cash Flow 0 10315 18900 21286 0 12759 14819
Asset Values (€)
Machinery 0 8841 20159 42741 0 11076 18424
Livestock: Breeding 0 13849 25724 48659 0 20307 22665
Trading 0 13150 19986 54793 0 9338 22114
Land & Buildings 0 347140 679697 1120667 0 432596 578657
Gross New Investment 0 1728 3984 12825 0 3200 4270
Loans Closing Balance 0 5466 7372 36770 0 2326 9049
Total Standard Output(TSO)
0.0 22052.2 39727.7 71491.8 0.0 32153.6 36581.8
Distribution - % of Farms
Soil Group :- (1) 0.0 0.0 51.5 40.0 0.0 0.0 38.1
(2) 0.0 66.7 48.5 60.0 0.0 0.0 42.9
(3) 0.0 0.0 0.0 0.0 0.0 100.0 19.0
=Total 100.0 100.0 100.0 100.0 100.0 100.0 100.0

Teagasc National Farm Survey 201847
Table - 04B (2018) Resources per Farm by Size (UAA - Ha) - Sheep System
Size (UAA-Ha)2 -
< 2020 -< 30
30 -< 50
50 -< 100
>= 100Hill
FarmsAll
Sizes
No. of Farms in Sample 7 21 33 30 5 29 125
Per Cent of Population 3.6 2.7 3.3 2.4 0.3 2.9 15.4
LAND (ha)
Area Owned 0.0 21.5 39.3 63.7 0.0 74.0 42.6
Total Area 0.0 25.9 42.5 74.4 0.0 94.7 50.5
Tillage 0.0 0.1 1.2 1.7 0.0 0.0 0.8
of which Total Cereals 0.0 0.0 0.0 0.0 0.0 0.0 0.5
" Potatoes 0.0 0.0 0.0 0.0 0.0 0.0 0.0
Grassland Silage 0.0 3.5 9.4 14.8 0.0 3.9 6.9
Hay 0.0 1.1 1.1 2.5 0.0 0.8 1.3
Pasture 0.0 18.2 25.9 44.7 0.0 51.6 30.0
Rough Grazing 0.0 1.1 1.3 6.2 0.0 33.1 8.2
U.A.A 0.0 24.8 39.2 71.1 0.0 92.2 48.1
Remainder of Farm 0.0 1.1 3.3 3.4 0.0 2.5 2.4
Forage & Crop Acreage 0.0 23.7 38.6 66.3 0.0 65.1 41.5
LIVESTOCK
Cattle
Dairy Cows 0.0 0.0 0.0 0.0 0.0 0.0 0.0
Other Cows 0.0 5.3 12.1 21.6 0.0 8.7 9.5
Heifers-in-Calf 0.0 0.2 0.6 1.1 0.0 0.6 0.5
< 1 Year Old 0.0 6.3 12.2 22.6 0.0 8.4 10.8
1 - 2 Year Old Male 0.0 3.5 2.9 11.5 0.0 1.4 4.3
1 - 2 Year Old Female 0.0 3.5 5.4 9.3 0.0 1.8 3.8
=> 2 Year Old Male 0.0 0.5 1.0 4.6 0.0 0.3 1.4
=> 2 Year Old Female 0.0 0.6 1.1 3.3 0.0 0.5 1.0
Bulls 0.0 0.3 0.4 0.8 0.0 0.2 0.3
Total Cattle 0.0 20.2 35.8 74.9 0.0 21.8 31.7
Sheep (avg. no)
Ewes 0.0 78.5 134.9 231.7 0.0 118.0 126.7
Other Sheep 0.0 76.0 135.3 223.5 0.0 97.9 125.4
Total Sheep 0.0 154.5 270.2 455.2 0.0 215.9 252.1
Grazing Livestock Units
Dairy Cows 0.0 0.0 0.0 0.0 0.0 0.0 0.0
Other Cattle 0.0 13.2 23.4 50.4 0.0 13.9 20.6
Sheep 0.0 19.3 35.4 60.6 0.0 24.6 32.1
Horses 0.0 0.7 0.3 0.3 0.0 0.7 0.4
Total Livestock Units 0.0 33.1 59.0 111.3 0.0 39.2 53.1
LABOUR UNITS
Family 0.00 0.88 1.20 1.40 0.00 0.99 1.06
Total 0.00 0.89 1.23 1.49 0.00 1.00 1.09

Teagasc National Farm Survey 201848
Table - 04C (2018) Gross Output and Direct Payments by Size (UAA - Ha) - Sheep System
Size (UAA-Ha) 2 - 20 - 30 - 50 - >= 100 Hill All< 20 < 30 < 50 < 100 Farms Sizes
No. of Farms in Sample 7 21 33 30 5 29 125
Per Cent of Population 3.6 2.7 3.3 2.4 0.3 2.9 15.4
(€) GROSSOUTPUT
LIVESTOCK
Dairying 0 0 0 0 0 3 1
of which milk 0 0 0 0 0 0 0
Cattle 0 6514 14962 32725 0 8096 13636
of which Beef Data / BeefGenomics
0 150 659 1488 0 289 497
Sheep & Wool 0 9783 18858 33185 0 9964 16805
of which Sheep CoupledPayments
0 0 0 0 0 0 0
Pigs 0 0 0 93 0 0 15
Poultry 0 0 0 0 0 0 0
Horses 0 -30 112 117 0 301 95
Other 0 0 0 0 0 0 0
Sub-Total Livestock 0 16266 33932 66120 0 18364 30550
of which DiseaseCompensation
0 40 12 182 0 18 42
CROPS
Wheat 0 0 0 0 0 0 8
Barley - Feeding 0 0 0 0 0 0 498
Barley - Malting 0 0 0 0 0 0 0
Oats 0 0 0 0 0 0 178
Potatoes 0 0 0 0 0 0 0
Other 0 218 964 795 0 245 925
of which Forestry Premium 0 159 0 222 0 362 133
Sub-Total Crops 0 218 2368 2208 0 245 1609
TOTAL LIVESTOCK &CROPS
0 16484 36300 68327 0 18609 32159
Machinery Hire Revenue 0 0 241 241 0 0 91
Other Current Receipts 0 372 295 1249 0 170 400
+ Decoupled DirectPayments / Sub
0 11138 19313 27273 0 18312 16894
of which Single FarmPayment
0 6355 12545 22239 0 11602 11744
" REPS/GLAS 0 1881 3375 2212 0 3089 2269
" DAS 0 2719 2792 2765 0 2714 2486
" Other Subsidies 0 868 2451 2837 0 2237 1797
" AEOS 0 40 221 0 0 167 86
+ Income from Land Let 0 1118 499 454 0 5 413
+ Income from Quota Let 0 0 0 0 0 0 0
- Inter-EnterpriseTransfers
0 0 65 1194 0 0 244
TOTAL GROSS OUTPUT 0 29220 57154 97294 0 37478 50085

Teagasc National Farm Survey 201849
Table - 04D (2018) Direct and Overhead Costs by Size (UAA - Ha) - Sheep System
Size (UAA-Ha) 2 - 20 - 30 - 50 - >= 100 Hill All< 20 < 30 < 50 < 100 Farms Sizes
No. of Farms in Sample 7 21 33 30 5 29 125
Per Cent of Population 3.6 2.7 3.3 2.4 0.3 2.9 15.4
DIRECT COSTS (€)
Purchased Concentrates 0 3777 8182 14782 0 6047 8475
Purchased Bulky Feed 0 517 799 1372 0 1228 765
Fertiliser 0 1369 4201 6229 0 1536 3048
Crop Protection 0 71 332 273 0 75 193
Purchased Seed 0 76 349 465 0 69 243
Hire of Machinery 0 1449 3112 3926 0 1227 2338
Transport 0 24 55 41 0 55 61
Livestock (A.I. Vet etc.) 0 1656 3391 5910 0 2243 2922
Casual Labour 0 16 42 105 0 12 47
Other 0 817 2055 2879 0 678 1514
Sub-Total 0 9774 22518 35981 0 13171 19607
Fodder Crop Adjustment 0 -227 -509 -246 0 -259 -289
TOTAL DIRECT COSTS 0 9547 22008 35719 0 12912 19315
OVERHEAD COSTS (€)
Rent of Conacre 0 1679 1151 3445 0 439 1390
Car, Electricity, Phone 0 2751 3440 5582 0 2262 3074
Current Hired Labour 0 199 458 1129 0 75 435
Interest Charges 0 393 425 1604 0 170 466
Machinery Depreciation 0 1257 2646 5439 0 1591 2462
Machinery Operating 0 2032 3652 6765 0 1701 3097
of which Fuel & Lub 0 833 1658 2737 0 692 1303
Buildings Depreciation 0 1136 1743 3842 0 1241 1861
Buildings Maintenance 0 443 912 1698 0 332 818
Land ImprovementDepreciation
0 140 451 569 0 337 315
Land ImprovementMaintenance
0 541 993 1371 0 664 840
Other 0 1865 3098 4828 0 2468 2715
OVERHEAD COSTS 0 12435 18970 36272 0 11282 17473
TOTAL NET EXPENSES 0 21982 40978 72008 0 24194 36791
Distribution - % of farms
Costs % Output 0.0 78.8 72.4 75.6 0.0 83.3 81.7

Teagasc National Farm Survey 201850
Table - 04E (2018) Demographic Data by Size (UAA - Ha) - Sheep System
Size (UAA-Ha)2 -
< 2020 -< 30
30 -< 50
50 -< 100
>= 100Hill
FarmsAll
Sizes
No. of Farms in Sample 7 21 33 30 5 29 125
Per Cent of Population 3.6 2.7 3.3 2.4 0.3 2.9 15.4
Holder
Age of Holder 0.0 58.5 59.5 53.4 0.0 58.0 59.5
Marital Status - Married % 0.0 76.2 78.8 76.7 0.0 73.7 74.9
Widowed % 0.0 0.0 0.0 0.0 0.0 3.4 7.4
Single % 0.0 0.0 0.0 0.0 0.0 19.4 15.1
Separated % 0.0 0.0 0.0 0.0 0.0 0.0 1.9
=Total 100.0 100.0 100.0 100.0 100.0 100.0 100.0
Household
Household Size (no.) 0.00 2.57 2.88 2.90 0.00 2.54 2.45
< 24 (no.) 0.00 0.00 0.64 0.67 0.00 0.63 0.48
< 24 % HH 0.00 0.00 36.40 36.70 0.00 17.70 23.00
25 - 44 (no.) 0.00 0.00 0.00 0.73 0.00 0.21 0.30
25 - 44 % HH 0.00 0.00 0.00 46.70 0.00 15.00 20.60
Demograph. Viable % HH 0.00 66.70 60.60 73.30 0.00 39.30 45.40
Off-farm sourcesof income --Holder and/orSpouse
Off-farm Job % HH 0.0 57.1 54.5 53.3 0.0 46.6 47.3
Off-farm Job Holder % HH 0.0 0.0 33.3 0.0 0.0 38.2 31.8
Off-farm Job Spouse %HH
0.0 0.0 36.4 46.7 0.0 32.4 31.2
Pensioners (no.) 0.00 0.00 0.61 0.00 0.00 0.65 0.60
Pensioners % HH 0.0 0.0 45.5 0.0 0.0 41.4 39.7
Unemployment Etc. (no.) 0.00 0.00 0.00 0.00 0.00 0.03 0.06
Unemployment Etc. % HH 0.0 0.0 0.0 0.0 0.0 2.8 6.1

Teagasc National Farm Survey 201851
Table - 05A (2018) Farm Financial Results by Size (UAA - Ha) - Tillage System
Size (UAA-Ha)2 -
< 2020 -< 30
30 -< 50
50 -< 100
>= 100Hill
FarmsAll
Sizes
No. of Farms in Sample 4 8 12 29 14 67
Per Cent of Population 1.2 1.1 1.7 2.1 1.1 7.4
Overall Results (€)
Gross Output 0 0 76680 130574 320519 116163
of which Land / Quota Let 0 0 1638 688 0 1128
Subsidies and DirectPayments
0 0 15971 26621 56776 22451
- Direct Costs 0 0 22209 41593 110993 38824
=Gross Margin 0 0 54471 88982 209526 77339
- Overhead Costs 0 0 20198 40676 106806 36688
= Family Farm Income 0 0 34274 48306 102720 40650
Net Sales & Receipts 0 0 75914 131813 320636 116602
- Current CashExpenditure
0 0 34578 69326 190880 64466
= Cash Income (Approx) 0 0 41336 62486 129755 52135
- Net New Investment 0 0 2539 17900 22411 9502
=Cash Flow 0 0 38797 44586 107344 42633
Asset Values (€)
Machinery 0 0 31998 73518 179453 63576
Livestock: Breeding 0 0 1896 7381 16251 5508
Trading 0 0 20650 39916 115661 37692
Land & Buildings 0 0 889981 1374631 2289857 1105209
Gross New Investment 0 0 2539 22112 27416 11499
Loans Closing Balance 0 0 0 19445 76986 18681
Total Standard Output(TSO)
0.0 0.0 39987.1 70374.4 189073.7 66012.4
Distribution - % of Farms
Soil Group :- (1) 0.0 0.0 83.3 82.8 78.6 85.8
(2) 0.0 0.0 0.0 0.0 0.0 14.2
(3) 0.0 0.0 0.0 0.0 0.0 0.0
=Total 100.0 100.0 100.0 100.0 100.0 100.0

Teagasc National Farm Survey 201852
Table - 05B (2018) Resources per Farm by Size (UAA - Ha) - Tillage System
Size (UAA-Ha)2 -
< 2020 -< 30
30 -< 50
50 -< 100
>= 100Hill
FarmsAll
Sizes
No. of Farms in Sample 4 8 12 29 14 0 67
Per Cent of Population 1.2 1.1 1.7 2.1 1.1 0.0 7.4
LAND (ha)
Area Owned 0.0 0.0 38.5 62.6 107.1 49.6
Total Area 0.0 0.0 39.9 72.9 161.9 62.2
Tillage 0.0 0.0 23.8 39.2 105.1 37.0
of which Total Cereals 0.0 0.0 22.6 34.5 88.7 32.7
" Potatoes 0.0 0.0 0.0 0.0 0.0 0.0
Grassland Silage 0.0 0.0 3.0 6.7 12.2 5.1
Hay 0.0 0.0 1.9 4.0 3.4 2.6
Pasture 0.0 0.0 7.2 15.7 32.9 12.8
Rough Grazing 0.0 0.0 0.0 0.6 1.2 0.4
U.A.A 0.0 0.0 38.0 70.0 158.9 60.2
Remainder of Farm 0.0 0.0 1.9 2.9 2.9 2.0
Forage & Crop Acreage 0.0 0.0 36.3 67.9 155.3 0.0 58.5
LIVESTOCK
Cattle
Dairy Cows 0.0 0.0 0.0 0.0 0.0 0.0
Other Cows 0.0 0.0 0.7 5.5 13.6 4.1
Heifers-in-Calf 0.0 0.0 0.2 0.2 0.4 0.2
< 1 Year Old 0.0 0.0 3.2 7.8 27.6 7.7
1 - 2 Year Old Male 0.0 0.0 8.3 11.3 41.4 13.9
1 - 2 Year Old Female 0.0 0.0 0.1 9.8 19.8 6.5
=> 2 Year Old Male 0.0 0.0 5.2 8.2 7.5 5.2
=> 2 Year Old Female 0.0 0.0 0.0 3.2 5.1 1.9
Bulls 0.0 0.0 0.0 0.2 0.4 0.1
Total Cattle 0.0 0.0 17.7 46.2 115.8 39.5
Sheep (avg. no)
Ewes 0.0 0.0 12.6 13.7 36.4 14.6
Other Sheep 0.0 0.0 10.8 12.9 46.3 14.9
Total Sheep 0.0 0.0 23.4 26.7 82.6 29.6
Grazing Livestock Units
Dairy Cows 0.0 0.0 0.0 0.0 0.0 0.0
Other Cattle 0.0 0.0 13.0 33.9 77.7 27.9
Sheep 0.0 0.0 3.2 3.7 11.2 4.1
Horses 0.0 0.0 0.0 0.2 1.1 0.3
Total Livestock Units 0.0 0.0 16.2 37.8 90.0 0.0 32.2
LABOUR UNITS
Family 0.00 0.00 0.91 1.01 1.55 0.99
Total 0.00 0.00 0.92 1.08 2.22 1.11

Teagasc National Farm Survey 201853
Table - 05C (2018) Gross Output and Direct Payments by Size (UAA - Ha) - Tillage System
Size (UAA-Ha)2 -
< 2020 -< 30
30 -< 50
50 -< 100
>= 100Hill
FarmsAll
Sizes
No. of Farms in Sample 4 8 12 29 14 67
Per Cent of Population 1.2 1.1 1.7 2.1 1.1 7.4
(€) GROSSOUTPUT
LIVESTOCK
Dairying 0 0 0 0 0 0
of which milk 0 0 0 0 0 0
Cattle 0 0 10258 22475 67448 21101
of which Beef Data / BeefGenomics
0 0 0 201 552 145
Sheep & Wool 0 0 2226 2213 6282 2462
of which Sheep CoupledPayments
0 0 0 0 0 0
Pigs 0 0 0 0 0 0
Poultry 0 0 0 0 0 0
Horses 0 0 0 24 164 40
Other 0 0 0 0 0 0
Sub-Total Livestock 0 0 12484 24712 73894 23603
of which DiseaseCompensation
0 0 0 67 168 46
CROPS
Wheat 0 0 0 12059 57271 13797
Barley - Feeding 0 0 25724 32358 65947 28254
Barley - Malting 0 0 0 0 0 3693
Oats 0 0 0 4307 0 3784
Potatoes 0 0 0 0 0 251
Other 0 0 10939 23166 53449 18667
of which Forestry Premium 0 0 378 445 1626 475
Sub-Total Crops 0 0 47889 76338 189708 68446
TOTAL LIVESTOCK &CROPS
0 0 60372 101050 263602 92049
Machinery Hire Revenue 0 0 0 4475 7142 2597
Other Current Receipts 0 0 122 678 619 326
+ Decoupled DirectPayments / Sub
0 0 15406 24579 54011 21276
of which Single FarmPayment
0 0 13679 21018 50953 18888
" REPS/GLAS 0 0 830 2389 1341 1304
" DAS 0 0 285 662 610 423
" Other Subsidies 0 0 799 1838 1528 1170
" AEOS 0 0 0 0 0 0
+ Income from Land Let 0 0 1638 688 0 1128
+ Income from Quota Let 0 0 0 0 0 0
- Inter-EnterpriseTransfers
0 0 921 2137 5041 1713
TOTAL GROSS OUTPUT 0 0 76680 130574 320519 116163

Teagasc National Farm Survey 201854
Table - 05D (2018) Direct and Overhead Costs by Size (UAA - Ha) - Tillage System
Size (UAA-Ha)2 -
< 2020 -< 30
30 -< 50
50 -< 100
>= 100Hill
FarmsAll
Sizes
No. of Farms in Sample 4 8 12 29 14 67
Per Cent of Population 1.2 1.1 1.7 2.1 1.1 7.4
DIRECT COSTS (€)
Purchased Concentrates 0 0 1685 5385 15518 4661
Purchased Bulky Feed 0 0 29 686 46 245
Fertiliser 0 0 7607 12061 33188 11763
Crop Protection 0 0 4310 7903 24756 8019
Purchased Seed 0 0 2297 4682 10851 3940
Hire of Machinery 0 0 5082 7457 19975 7596
Transport 0 0 17 236 514 162
Livestock (A.I. Vet etc.) 0 0 507 1335 2653 1027
Casual Labour 0 0 0 0 507 80
Other 0 0 386 1485 3432 1161
Sub-Total 0 0 21920 41229 111440 38655
Fodder Crop Adjustment 0 0 287 352 -456 186
TOTAL DIRECT COSTS 0 0 22209 41593 110993 38824
OVERHEAD COSTS (€)
Rent of Conacre 0 0 1075 4081 20206 5041
Car, Electricity, Phone 0 0 2359 3345 5477 2768
Current Hired Labour 0 0 78 1450 13611 2583
Interest Charges 0 0 517 1138 3100 952
Machinery Depreciation 0 0 5779 9458 22843 8607
Machinery Operating 0 0 4274 11115 23580 8541
of which Fuel & Lub 0 0 2228 4791 11871 4030
Buildings Depreciation 0 0 1355 2367 3858 1796
Buildings Maintenance 0 0 537 833 2444 806
Land ImprovementDepreciation
0 0 205 535 516 295
Land ImprovementMaintenance
0 0 827 1731 2860 1253
Other 0 0 3193 4623 8311 4045
OVERHEAD COSTS 0 0 20198 40676 106806 36688
TOTAL NET EXPENSES 0 0 42404 82257 217790 75529
Distribution - % of farms
Costs % Output 0.0 0.0 58.1 64.2 68.2 66.9

Teagasc National Farm Survey 201855
Table - 05E (2018) Demographic Data by Size (UAA - Ha) - Tillage System
Size (UAA-Ha)2 -
< 2020 -< 30
30 -< 50
50 -< 100
>= 100Hill
FarmsAll
Sizes
No. of Farms in Sample 4 8 12 29 14 67
Per Cent of Population 1.2 1.1 1.7 2.1 1.1 7.4
Holder
Age of Holder 0.0 0.0 62.5 58.3 55.5 60.3
Marital Status - Married % 0.0 0.0 0.0 58.6 100.0 68.5
Widowed % 0.0 0.0 0.0 0.0 0.0 6.8
Single % 0.0 0.0 0.0 0.0 0.0 23.7
Separated % 0.0 0.0 0.0 0.0 0.0 1.0
=Total 100.0 100.0 100.0 100.0 100.0 100.0
Household
Household Size (no.) 0.0 0.0 2.3 2.5 3.9 2.6
< 24 (no.) 0.0 0.0 0.0 0.7 0.0 0.5
< 24 % HH 0.0 0.0 0.0 34.5 0.0 24.8
25 - 44 (no.) 0.0 0.0 0.0 0.0 0.0 0.3
25 - 44 % HH 0.0 0.0 0.0 0.0 0.0 22.4
Demograph. Viable % HH 0.0 0.0 0.0 55.2 78.6 48.2
Off-farm sourcesof income --Holder and/orSpouse
Off-farm Job % HH 0.0 0.0 0.0 44.8 0.0 46.5
Off-farm Job Holder % HH 0.0 0.0 0.0 0.0 0.0 33.3
Off-farm Job Spouse %HH
0.0 0.0 0.0 34.5 0.0 24.2
Pensioners (no.) 0.0 0.0 0.0 0.5 0.0 0.6
Pensioners % HH 0.0 0.0 0.0 34.5 0.0 38.4
Unemployment Etc. (no.) 0.0 0.0 0.0 0.0 0.0 0.1
Unemployment Etc. % HH 0.0 0.0 0.0 0.0 0.0 6.0

Teagasc National Farm Survey 201856
Table - 07A (2018) Farm Financial Results by Size (UAA - Ha) - All Systems
Size (UAA-Ha)2 -
< 2020 -< 30
30 -< 50
50 -< 100
>= 100Hill
FarmsAll
Sizes
No. of Farms in Sample 63 121 242 293 109 69 897
Per Cent of Population 21.3 19.8 26.3 19.7 4.5 8.1 100.0
Overall Results (€)
Gross Output 24322 38059 72197 157308 355167 47449 82822
of which Land / Quota Let 756 622 512 546 320 23 544
Subsidies and DirectPayments
7398 11070 17033 27201 50782 15944 17244
- Direct Costs 10079 14734 27858 64259 149788 19137 33463
=Gross Margin 14243 23325 44339 93050 205379 28312 49359
- Overhead Costs 9403 13522 22875 47121 105406 14953 26026
= Family Farm Income 4841 9803 21464 45929 99973 13359 23333
Net Sales & Receipts 25237 40265 72690 157151 352588 47741 83461
-Current Cash Expenditure 17131 24666 44132 97858 227205 29824 52246
=Cash Income (Approx) 8106 15599 28558 59293 125384 17918 31214
-Net New Investment 2238 2964 6553 17444 48861 5649 8913
=Cash Flow 5868 12635 22005 41849 76523 12269 22301
Asset Values (€)
Machinery 10176 15945 27017 58648 130315 15945 31251
Livestock: Breeding 9936 16540 29302 62876 119264 24236 32935
Trading 14637 17942 27521 51900 110471 14711 30399
Land & Buildings 312438 450993 677935 1202975 2237875 459314 711517
Gross New Investment 2807 3378 7133 19928 57208 5800 10150
Loans Closing Balance 4382 4040 15921 42758 157721 8626 22223
Total Standard Output(TSO)
16207. 25928. 50240. 114723. 245110. 36944. 58638.0
Distribution - % of Farms
Gross Output0 - 10000 0.0 0.0 0.0 0.0 0.0 4.7 0.6
10000 - 20000 46.4 10.3 0.0 0.0 0.0 20.1 14.3
20000 - 40000 45.6 58.3 22.8 6.5 0.0 40.8 31.9
40000 - 60000 0.0 16.2 29.6 9.8 0.0 16.6 15.3
60000 - 100000 0.0 12.0 26.9 21.8 0.0 4.9 15.0
> 100000 0.0 0.0 17.9 61.9 94.9 12.9 22.8
=Total 100.0 100.0 100.0 100.0 100.0 100.0 100.0
Soil Group :- (1) 47.6 51.3 50.3 59.9 70.8 0.0 48.7
(2) 52.4 48.7 49.7 40.1 29.2 0.0 43.2
(3) 0.0 0.0 0.0 0.0 0.0 100.0 8.2
=Total 100.0 100.0 100.0 100.0 100.0 100.0 100.0

Teagasc National Farm Survey 201857
Table - 07B (2018) Resources per Farm by Size (UAA - Ha) - All Systems
Size (UAA-Ha)2 -
< 2020 -< 30
30 -< 50
50 -< 100
>= 100Hill
FarmsAll
Sizes
No. of Farms in Sample 63 121 242 293 109 69 897
Per Cent of Population 21.3 19.8 26.3 19.7 4.5 8.1 100.0
LAND (ha)
Area Owned 15.4 24.5 35.3 59.5 106.9 48.6 38.0
Total Area 16.7 26.4 40.6 71.5 144.6 58.6 45.0
Tillage 0.5 0.8 2.0 5.5 32.9 0.0 3.4
of which Total Cereals 0.0 0.0 1.8 4.6 26.3 0.0 2.8
" Potatoes 0.0 0.0 0.0 0.0 0.0 0.0 0.0
Grassland Silage 4.6 6.5 10.6 18.2 29.5 6.3 10.5
Hay 0.9 1.0 1.3 1.8 2.9 0.7 1.3
Pasture 9.4 15.6 22.7 38.8 67.0 33.2 24.5
Rough Grazing 0.2 0.5 1.4 2.4 5.1 13.3 2.3
U.A.A 15.8 25.1 38.9 69.1 140.1 55.6 43.1
Remainder of Farm 0.9 1.3 1.7 2.5 4.5 3.0 1.8
Forage & Crop Acreage 15.6 24.4 37.4 65.6 134.3 44.0 40.7
LIVESTOCK
Cattle
Dairy Cows 0.9 3.2 11.6 34.7 68.3 7.3 14.4
Other Cows 6.8 10.5 12.5 15.8 22.4 10.7 11.8
Heifers-in-Calf 0.4 1.0 2.0 4.9 11.6 1.7 2.5
< 1 Year Old 10.5 13.9 21.8 39.4 73.7 15.2 23.1
1 - 2 Year Old Male 4.8 6.0 8.7 14.9 33.9 3.1 9.2
1 - 2 Year Old Female 4.3 5.2 8.7 16.3 29.9 4.0 9.1
=> 2 Year Old Male 1.0 1.7 2.9 5.5 9.5 0.6 2.9
=> 2 Year Old Female 0.7 1.1 1.6 3.1 4.5 0.9 1.7
Bulls 0.3 0.4 0.5 1.0 1.4 0.4 0.6
Total Cattle 29.8 43.0 70.1 135.2 254.6 43.9 75.2
Sheep (avg. no)
Ewes 11.5 13.9 21.7 37.6 72.6 44.4 25.3
Other Sheep 15.9 14.2 22.4 37.4 69.0 36.8 25.6
Total Sheep 27.4 28.1 44.2 75.0 141.6 81.2 50.9
Grazing Livestock Units
Dairy Cows 0.9 3.2 11.6 34.7 68.3 7.3 14.4
Other Cattle 18.1 25.4 36.3 60.4 109.9 22.2 37.2
Sheep 3.5 3.6 5.8 9.9 18.3 9.3 6.5
Horses 0.0 0.2 0.2 0.2 0.6 0.9 0.3
Total Livestock Units 22.5 32.5 53.9 105.3 197.2 39.6 58.4
LABOUR UNITS
Family 0.75 0.90 1.06 1.27 1.61 1.03 1.03
Total 0.76 0.93 1.09 1.45 2.23 1.05 1.11
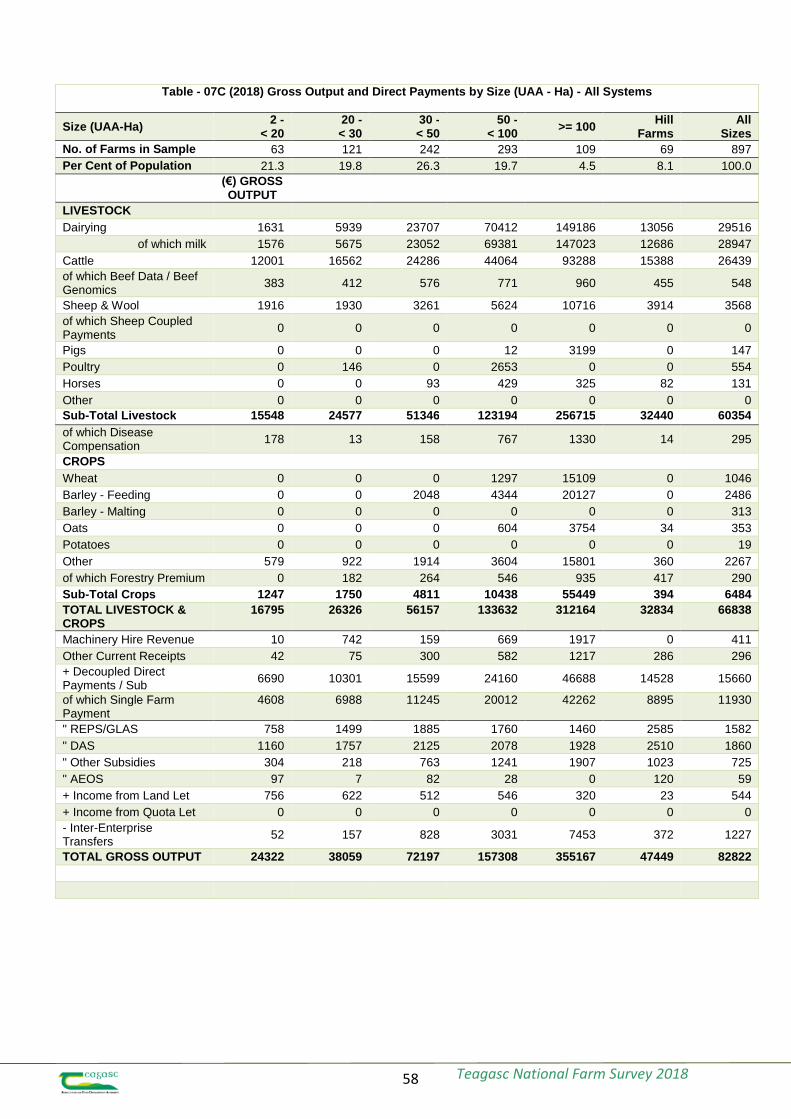
Teagasc National Farm Survey 201858
Table - 07C (2018) Gross Output and Direct Payments by Size (UAA - Ha) - All Systems
Size (UAA-Ha)2 -
< 2020 -< 30
30 -< 50
50 -< 100
>= 100Hill
FarmsAll
Sizes
No. of Farms in Sample 63 121 242 293 109 69 897
Per Cent of Population 21.3 19.8 26.3 19.7 4.5 8.1 100.0
(€) GROSSOUTPUT
LIVESTOCK
Dairying 1631 5939 23707 70412 149186 13056 29516
of which milk 1576 5675 23052 69381 147023 12686 28947
Cattle 12001 16562 24286 44064 93288 15388 26439
of which Beef Data / BeefGenomics
383 412 576 771 960 455 548
Sheep & Wool 1916 1930 3261 5624 10716 3914 3568
of which Sheep CoupledPayments
0 0 0 0 0 0 0
Pigs 0 0 0 12 3199 0 147
Poultry 0 146 0 2653 0 0 554
Horses 0 0 93 429 325 82 131
Other 0 0 0 0 0 0 0
Sub-Total Livestock 15548 24577 51346 123194 256715 32440 60354
of which DiseaseCompensation
178 13 158 767 1330 14 295
CROPS
Wheat 0 0 0 1297 15109 0 1046
Barley - Feeding 0 0 2048 4344 20127 0 2486
Barley - Malting 0 0 0 0 0 0 313
Oats 0 0 0 604 3754 34 353
Potatoes 0 0 0 0 0 0 19
Other 579 922 1914 3604 15801 360 2267
of which Forestry Premium 0 182 264 546 935 417 290
Sub-Total Crops 1247 1750 4811 10438 55449 394 6484
TOTAL LIVESTOCK &CROPS
16795 26326 56157 133632 312164 32834 66838
Machinery Hire Revenue 10 742 159 669 1917 0 411
Other Current Receipts 42 75 300 582 1217 286 296
+ Decoupled DirectPayments / Sub
6690 10301 15599 24160 46688 14528 15660
of which Single FarmPayment
4608 6988 11245 20012 42262 8895 11930
" REPS/GLAS 758 1499 1885 1760 1460 2585 1582
" DAS 1160 1757 2125 2078 1928 2510 1860
" Other Subsidies 304 218 763 1241 1907 1023 725
" AEOS 97 7 82 28 0 120 59
+ Income from Land Let 756 622 512 546 320 23 544
+ Income from Quota Let 0 0 0 0 0 0 0
- Inter-EnterpriseTransfers
52 157 828 3031 7453 372 1227
TOTAL GROSS OUTPUT 24322 38059 72197 157308 355167 47449 82822

Teagasc National Farm Survey 201859
Table - 07D (2018) Direct and Overhead Costs by Size (UAA - Ha) - All Systems
Size (UAA-Ha)2 -
< 2020 -< 30
30 -< 50
50 -< 100
>= 100Hill
FarmsAll
Sizes
No. of Farms in Sample 63 121 242 293 109 69 897
Per Cent of Population 21.3 19.8 26.3 19.7 4.5 8.1 100.0
DIRECT COSTS (€)
Purchased Concentrates 3916 5343 10503 27479 59298 7371 13382
Purchased Bulky Feed 469 831 1324 3239 6976 1938 1728
Fertiliser 1555 2518 5052 10368 26915 3156 5689
Crop Protection 211 221 465 1264 7782 98 821
Purchased Seed 81 137 330 892 4074 82 499
Hire of Machinery 2025 2752 4706 8297 18955 2900 4954
Transport 48 63 133 239 676 76 142
Livestock (A.I. Vet etc.) 1209 1736 3271 6774 14397 2464 3657
Casual Labour 4 126 91 601 1640 69 248
Other 930 1260 2410 5732 10418 1305 2795
Sub-Total 10449 14988 28286 64884 151130 19459 33915
Fodder Crop Adjustment -370 -245 -428 -625 -1355 -322 -451
TOTAL DIRECT COSTS 10079 14734 27858 64259 149788 19137 33463
OVERHEAD COSTS (€)
Rent of Conacre 688 725 1688 4678 14655 822 2390
Car, Electricity, Phone 1743 2229 3393 5921 9145 2609 3507
Current Hired Labour 178 315 417 3367 12674 500 1490
Interest Charges 370 268 923 2056 6217 256 1084
Machinery Depreciation 1415 2163 3705 7652 16925 2143 4162
Machinery Operating 1485 2727 4236 8240 18851 2297 4644
of which Fuel & Lub 652 1078 1781 3462 8288 984 1962
Buildings Depreciation 1022 1333 2718 5387 10515 2049 2908
Buildings Maintenance 533 629 1093 1937 2835 540 1082
Land ImprovementDepreciation
90 208 423 897 1740 289 452
Land ImprovementMaintenance
441 807 1113 1828 3152 906 1126
Other 1437 2119 3166 5157 8697 2540 3182
OVERHEAD COSTS 9403 13522 22875 47121 105406 14953 26026
TOTAL NET EXPENSES 19481 28264 50733 111380 255181 34090 59490
Distribution - % of farms
Costs % Output 84.1 76.5 74.0 70.9 70.1 87.8 77.0

Teagasc National Farm Survey 201860
Table - 07E (2018) Demographic Data by Size (UAA - Ha) - All Systems
Size (UAA-Ha)2 -
< 2020 -< 30
30 -< 50
50 -< 100
>= 100Hill
FarmsAll
Sizes
No. of Farms in Sample 63 121 242 293 109 69 897
Per Cent of Population 21.3 19.8 26.3 19.7 4.5 8.1 100.0
Holder
Age of Holder 61.1 59.0 57.7 55.4 54.7 57.3 58.1
Marital Status - Married % 67.2 64.6 76.3 74.0 79.0 61.7 70.5
Widowed % 0.0 0.0 0.0 6.9 0.0 4.3 4.7
Single % 23.1 28.1 18.8 16.7 13.9 32.8 22.1
Separated % 0.0 0.0 0.0 0.0 0.0 0.0 2.6
=Total 100.0 100.0 100.0 100.0 100.0 100.0 100.0
Household
Household Size (no.) 2.33 2.32 2.80 3.08 3.53 2.45 2.66
< 24 (no.) 0.36 0.37 0.74 0.95 1.15 0.61 0.64
< 24 % HH 17.5 21.3 32.8 45.0 49.3 28.2 30.0
25 - 44 (no.) 0.26 0.26 0.45 0.52 0.64 0.25 0.38
25 - 44 % HH 18.6 20.7 30.3 36.3 39.8 17.5 26.5
Demograph. Viable % HH 36.4 49.2 60.5 71.8 75.5 54.2 55.5
Off-farm sourcesof income --Holder and/orSpouse
Off-farm Job % HH 45.6 53.0 58.4 49.7 40.7 51.5 51.5
Off-farm Job Holder % HH 44.9 39.6 33.7 15.2 14.3 40.6 33.3
Off-farm Job Spouse %HH
16.3 30.2 42.7 41.4 29.8 36.2 33.2
Pensioners (no.) 0.72 0.49 0.49 0.31 0.39 0.39 0.49
Pensioners % HH 41.6 30.8 35.5 25.1 25.9 28.8 32.8
Unemployment Etc. (no.) 0.00 0.09 0.00 0.00 0.00 0.01 0.04
Unemployment Etc. % HH 0.0 9.2 0.0 0.0 0.0 1.0 4.0
Distribution - % of farms
System (1) Dairying 3.7 8.4 20.3 35.6 36.9 10.9 17.4
(2) Cattle Rearing 37.6 34.5 29.9 11.5 0.0 31.9 27.8
(4)Cattle Other 35.8 36.4 30.4 25.0 20.3 20.9 30.5
(5)Sheep 0.0 13.9 12.6 12.6 0.0 35.9 15.4
(6)Tillage 0.0 0.0 6.8 10.8 25.9 0.0 7.4
(7)Mixed Livestock 0.0 0.0 0.0 0.0 0.0 0.4 1.5

Teagasc National Farm Survey 201861
Table - 08A (2018) Farm Financial Results by System of Farming - All Farms
System DairyingCattle
RearingCattleOther Sheep Tillage
MixedLivestock All Sizes
No. of Farms inSample
311 164 214 125 67 16 897
Per Cent of Population 17.4 27.8 30.4 15.4 7.4 1.4 100
Overall Results (€)
Gross Output 213,782 35,990 52,352 50,085 116,163 225,317 82,822
of which Land / QuotaLet
176 282 943 413 1,128 0 544
Direct Payments / Subs 21,022 13,098 16,226 18,980 22,451 27,556 17,244
- Direct Costs 93,493 13,440 19,509 19,315 38,824 112,338 33,463
=Gross Margin 120289 22,550 32,843 30,770 77,339 112,979 49,359
- Overhead Costs 58,843 14,240 18,283 17,473 36,688 56,950 26,026
= Family Farm Income 61,446 8,311 14,560 13,297 40,650 56,029 23,333
Net Sales & Receipts 213,797 36,923 53,088 50,924 116,602 224,690 83,461
- Current CashExpenditure
135,659 23,714 32,848 32,303 64,466 154,358 52,246
=Cash Income (Approx) 78,138 13,209 20,240 18,621 52,135 70,332 31,214
-Net New Investment 28,294 3,461 4,851 3,802 9,502 17,422 8,913
=Cash Flow 49,845 9,748 15,389 14,819 42,633 52,910 22,301
Asset Values (€)
Machinery 68,223 17,532 20,261 18,424 63,576 52,274 31,251
Livestock: Breeding 95,399 25,840 13,016 22,665 5,508 86,623 32,935
Trading 31,403 16,966 42,814 22,114 37,692 65,883 30,399
Land & Buildings 1,042,119 463,548 699,060 578,657 1,105,209 1,155,991 711,517
Gross New Investment 31,714 3,913 5,774 4,270 11,499 18,383 10,150
Loans ClosingBalance
74,146 7,394 12,601 9,049 18,681 43,426 22,223
Total Standard Output(TSO)
171,737 21,861 30,721 36,582 66,012 188,405 58,638
Distribution - % of Farms
Gross Output0 – 10,000 0.0 0.0 0.0 0.0 0.0 0.0 0.6
10,000 – 20,000 0.0 22.0 14.1 19.0 0.0 0.0 14.3
20,000 – 40,000 0.0 45.7 40.2 34.8 0.0 0.0 31.9
40,000 – 60,000 0.0 18.7 19.2 16.1 0.0 0.0 15.3
60,000 – 100,000 12.4 9.8 16.6 20.6 22.8 0.0 15.0
> 100,000 81.3 0.0 9.9 9.5 38.6 57.1 22.8
=Total 100 100 100 100 100 100 100
Soil Group :- (1) 56.0 31.9 56.5 38.1 85.8 0.0 48.7
(2) 38.9 58.7 37.9 42.9 14.2 0.0 43.2
(3) 5.1 9.4 5.6 19.0 0.0 0.0 8.2
=Total 100 100 100 100 100 100 100

Teagasc National Farm Survey 201862
Table - 08B (2018) Resources per Farm by System of Farming - All Farms
System DairyingCattle
RearingCattleOther Sheep Tillage
MixedLivestock All Sizes
No. of Farms in Sample 311 164 214 125 67 16 897
Per Cent of Population 17.4 27.8 30.4 15.4 7.4 1.4 100
LAND (ha)
Area Owned 46.7 28.7 35.2 42.6 49.6 63.9 38.0
Total Area 60.8 32.7 38.4 50.5 62.2 80.3 45.0
Tillage 1.1 0.0 0.9 0.8 37.0 2.1 3.4
of which Total Cereals 0.6 0.0 0.7 0.0 32.7 0.0 2.8
" Potatoes 0.0 0.0 0.0 0.0 0.0 0.0 0.0
Grassland Silage 20.7 8.2 9.3 6.9 5.1 26.5 10.5
Hay 0.8 1.2 1.4 1.3 2.6 0.5 1.3
Pasture 34.2 18.9 23.1 30.0 12.8 46.4 24.5
Rough Grazing 1.4 1.5 1.1 8.2 0.4 0.8 2.3
U.A.A 58.7 30.8 37.2 48.1 60.2 77.6 43.1
Remainder of Farm 2.2 1.9 1.3 2.4 2.0 2.7 1.8
Forage & Crop Acreage 57.3 29.0 35.3 41.5 58.5 76.0 40.7
LIVESTOCK
Cattle
Dairy Cows 78.6 0.0 0.0 0.0 0.0 52.6 14.4
Other Cows 1.7 22.6 10.6 9.5 4.1 18.6 11.8
Heifers-in-Calf 9.7 1.3 0.8 0.5 0.2 6.2 2.5
< 1 Year Old 46.0 19.7 21.6 10.8 7.7 52.9 23.1
1 - 2 Year Old Male 7.9 2.9 16.6 4.3 13.9 21.2 9.2
1 - 2 Year Old Female 15.2 5.2 12.1 3.8 6.5 20.8 9.1
=> 2 Year Old Male 0.9 0.2 6.7 1.4 5.2 2.9 2.9
=> 2 Year Old Female 1.1 1.1 2.8 1.0 1.9 2.3 1.7
Bulls 1.0 0.7 0.4 0.3 0.1 1.2 0.6
Total Cattle 161.3 53.7 71.6 31.7 39.5 177.9 75.2
Sheep (avg. no)
Ewes 2.4 1.1 11.0 126.7 14.6 38.8 25.3
Other Sheep 1.9 1.5 12.9 125.4 14.9 33.6 25.6
Total Sheep 4.3 2.6 23.8 252.1 29.6 72.5 50.9
Grazing Livestock Units
Dairy Cows 78.6 0.0 0.0 0.0 0.0 52.6 14.4
Other Cattle 40.1 34.5 47.0 20.6 27.9 71.6 37.2
Sheep 0.6 0.4 3.1 32.1 4.1 9.4 6.5
Horses 0.1 0.3 0.2 0.4 0.3 0.0 0.3
Total Livestock Units 119.4 35.2 50.3 53.1 32.2 133.6 58.4
LABOUR UNITS
Family 1.36 0.93 0.90 1.06 0.99 1.47 1.03
Total 1.62 0.94 0.95 1.09 1.11 1.75 1.11

Teagasc National Farm Survey 201863
Table - 08C (2018) Gross Output and Direct Payments by System of Farming - All Farms
System DairyingCattle
RearingCattleOther Sheep Tillage
MixedLivestock All Sizes
No. of Farms in Sample 311 164 214 125 67 16 897
Per Cent of Population 17.4 27.8 30.4 15.4 7.4 1.4 100
(€) GROSSOUTPUT
LIVESTOCK
Dairying 161,419 0 0 1 0 96,394 29,516
of which milk 158,166 0 0 0 0 96,237 28,947
Cattle 34,695 23,028 31,407 13,636 21,101 51,891 26,439
of which Beef Data / BeefGenomics
24 1,061 490 497 145 860 548
Sheep & Wool 323 287 1,884 16,805 2,462 5,448 3,568
of which Sheep CoupledPayments
0 0 0 0 0 0 0
Pigs 0 0 0 15 0 9,900 147
Poultry 0 0 0 0 0 37,959 554
Horses 259 79 151 95 40 0 131
Other 0 0 0 0 0 0 0
Sub-Total Livestock 196,696 23,393 33,443 30,550 23,603 201,593 60,354
of which DiseaseCompensation
1,275 65 136 42 46 232 295
CROPS
Wheat 0 0 0 0 13797 0 1046
Barley - Feeding 466 0 714 0 28254 0 2486
Barley - Malting 0 0 0 0 3693 0 313
Oats 0 0 0 0 3784 0 353
Potatoes 0 0 0 0 0 0 19
Other 698 402 1653 925 18667 185 2267
of which Forestry Premium 260 242 393 133 475 136 290
Sub-Total Crops 1,473 412 2,526 1,609 68,446 1,150 6,484
TOTAL LIVESTOCK &CROPS
198,169 23,805 35,969 32,159 92,049 202,743 66,838
Machinery Hire Revenue 231 138 411 91 2,597 3 411
Other Current Receipts 780 45 188 400 326 336 296
+ Decoupled DirectPayments / Sub
19,249 11,577 14,866 16,894 21,276 25,596 15,660
of which Single FarmPayment
16,510 7,495 11,335 11,744 18,888 20,793 11,930
" REPS/GLAS 555 1,957 1,551 2,269 1,304 1,440 1,582
" DAS 1,850 1,982 1,742 2,486 423 2,757 1,860
" Other Subsidies 549 268 561 1,797 1,170 1,339 725
" AEOS 25 37 103 86 0 0 59
+ Income from Land Let 176 282 943 413 1,128 0 544
+ Income from Quota Let 0 0 0 0 0 0 0
- Inter-EnterpriseTransfers
5,147 10 359 244 1,713 3,704 1,227
TOTAL GROSS OUTPUT 213,782 35,990 52,352 50,085 116,163 225,317 82,822

Teagasc National Farm Survey 201864
Table - 08D (2018) Direct and Overhead Costs by System of Farming - All Farms
System DairyingCattle
RearingCattleOther Sheep Tillage
MixedLivestock All Sizes
No. of Farms in Sample 311 164 214 125 67 16 897
Per Cent of Population 17.4 27.8 30.4 15.4 7.4 1.4 100
DIRECT COSTS (€)
Purchased Concentrates 42,289 3,973 7,801 8,475 4,661 60,495 13,382
Purchased Bulky Feed 5,938 841 934 765 245 2,731 1,728
Fertiliser 13,759 2,502 3,500 3,048 11,763 12,848 5,689
Crop Protection 501 89 248 193 8,019 598 821
Purchased Seed 454 63 195 243 3,940 878 499
Hire of Machinery 11,141 3,029 3,567 2,338 7,596 10,989 4,954
Transport 236 45 217 61 162 40 142
Livestock (A.I. Vet etc.) 10,684 2,074 1,852 2,922 1,027 8,773 3,657
Casual Labour 795 7 132 47 80 3,738 248
Other 8,779 1,289 1,329 1,514 1,161 12,574 2,795
Sub-Total 94,576 13,911 19,775 19,607 38,655 113,663 33,915
Fodder Crop Adjustment -1082 -472 -268 -289 186 -1325 -451
TOTAL DIRECT COSTS 93,493 13,440 19,509 19,315 38,824 112,338 33,463
OVERHEAD COSTS (€)
Rent of Conacre 5,897 1,006 1,327 1,390 5,041 6,232 2,390
Car, Electricity, Phone 7,078 2,364 2,641 3,074 2,768 9,056 3,507
Current Hired Labour 5,341 202 722 435 2,583 1,704 1,490
Interest Charges 3,289 462 667 466 952 2,545 1,084
Machinery Depreciation 8,927 2,347 2,731 2,462 8,607 7,110 4,162
Machinery Operating 9,263 2,532 3,490 3,097 8,541 10,442 4,644
of which Fuel & Lub 3,560 1,148 1,505 1,303 4,030 4,417 1,962
Buildings Depreciation 7,361 1,693 2,036 1,861 1,796 7,812 2,908
Buildings Maintenance 2,417 627 823 818 806 3,434 1,082
Land ImprovementDepreciation
1,184 224 309 315 295 1,269 452
Land ImprovementMaintenance
2,055 741 1,033 840 1,253 1,684 1,126
Other 6,030 2,041 2,505 2,715 4,045 5,662 3,182
OVERHEAD COSTS 58,843 14,240 18,283 17,473 36,688 56,950 26,026
TOTAL NET EXPENSES 152,336 27,679 37,790 36,791 75529 169,288 59,490
Distribution - % of farms
Costs % Output< 50 0.0 7.1 14.9 9.9 16.9 0.0 9.7
50 -< 60 17.9 8.3 16.3 11.2 21.1 0.0 13.8
60 -< 70 27.5 18.3 15.1 15.9 28.0 0.0 19.6
70 -< 80 29.6 23.8 18.6 20.6 16.4 0.0 22.3
80 -< 90 15.7 13.6 14.3 14.9 0.0 0.0 13.9
90 + 7.1 28.8 20.8 27.4 0.0 0.0 20.7
=Total 100 100 100 100 100 100 100
Avg % 71.2 83.2 75.0 81.7 66.9 72.0 77.0

Teagasc National Farm Survey 201865
Table - 08E (2018) Demographic Data by System of Farming - All Farms
SystemDairying
CattleRearing
CattleOther Sheep Tillage
MixedLivestock All Sizes
No. of Farms in Sample 311 164 214 125 67 16 897
Per Cent of Population 17.4 27.8 30.4 15.4 7.4 1.4 100
Holder
Age of Holder 53.0 58.8 59.2 59.5 60.3 54.7 58.1
Marital Status - Married % 82.8 64.8 67.0 74.9 68.5 68.5 70.5
Widowed % 0.0 0.0 2.9 0.0 0.0 0.0 4.7
Single % 14.5 28.6 24.4 15.1 23.7 0.0 22.1
Separated % 0.0 0.0 5.7 0.0 0.0 0.0 2.6
=Total 100 100 100 100 100 100 100
Household
Household Size (no.) 3.35 2.57 2.45 2.45 2.60 3.19 2.66
< 24 (no.) 1.15 0.52 0.56 0.48 0.51 0.00 0.64
< 24 % HH 52.5 25.7 25.8 23.0 24.8 0.0 30.0
25 - 44 (no.) 0.56 0.39 0.28 0.30 0.30 0.00 0.38
25 - 44 % HH 39.4 27.6 20.6 20.6 22.4 0.0 26.5
Demograph. Viable % HH 79.0 52.8 50.0 45.4 48.2 85.3 55.5
Off-farm sourcesof income --Holder and/orSpouse
Off-farm Job % HH 53.6 52.1 53.7 47.3 46.5 0.0 51.5
Off-farm Job Holder % HH 12.0 38.9 41.9 31.8 33.3 0.0 33.3
Off-farm Job Spouse %HH
47.0 31.5 30.1 31.2 24.2 0.0 33.2
Pensioners (no.) 0.23 0.53 0.50 0.60 0.60 0.00 0.49
Pensioners % HH 15.5 34.7 35.5 39.7 38.4 0.0 32.8
Unemployment Etc. (no.) 0.00 0.00 0.00 0.00 0.00 0.00 0.04
Unemployment Etc. % HH 0.0 0.0 0.0 0.0 0.0 0.0 4.0
Distribution - % of farms
F.F.I. (€) < 5,000 4 44 33 33 14 0 29
FFI 5,000 - 10000 4 21 16 22 9 2 15
FFI 10,000 - 20000 9 22 23 22 20 28 20
FFI 20,000 - 30000 10 10 15 5 11 2 11
FFI 30,000 - 50000 21 2 9 14 19 15 11
FFI 50,000 - 70000 23 0 2 3 6 29 6
FFI70TO100,000 15 1 2 0 10 4 4
>100,000 16 0 1 0 12 19 4

Teagasc National Farm Survey 201867
Table - 10A (2018) Farm Financial Results by System of Farming - Full-Time Farms
System DairyingCattle
RearingCattleOther Sheep Tillage
MixedLivestock All Sizes
No. of Farms in Sample 281 26 69 53 33 15 477
Per Cent of Population 15.2 2.4 5.4 4.5 2.6 1.2 31.7
Overall Results (€)
Gross Output 231686 84932 120764 91322 227783 257828 181406
of which Land / Quota Let 201 1470 170 381 1005 0 380
Subsidies and DirectPayments
22344 26045 30500 31361 39985 30798 27143
- Direct Costs 101388 32796 50107 34348 75610 130840 76451
=Gross Margin 130298 52137 70656 56973 152173 126989 104955
- Overhead Costs 64068 31037 39985 30424 72939 64199 53197
= Family Farm Income 66230 21100 30671 26550 79234 62790 51759
Net Sales & Receipts 231625 85863 118541 90816 229017 257121 181068
- Current CashExpenditure
147071 53332 79636 56924 128012 177455 114625
= Cash Income (Approx) 84554 32531 38906 33892 101005 79666 66443
-Net New Investment 30285 11190 13284 8513 22449 20249 21661
=Cash Flow 54268 21341 25622 25378 78556 59416 44782
Asset Values (€)
Machinery 74561 47908 48072 34509 129223 59397 66072
Livestock: Breeding 103640 59578 40286 46807 12497 101761 73361
Trading 34568 45168 95743 40579 75126 71654 51655
Land & Buildings 1122702 948857 1296352 953826 1799406 1308453 1178220
Gross New Investment 34121 12707 15577 9790 26672 21390 24606
Loans Closing Balance 82017 22357 36168 20297 46592 47002 56185
Total Standard Output(TSO)
185329.3 48803.4 74661.8 68438.7 129134.8 211765.9 134941.6
Distribution - % of Farms
Gross Output0 - 10000 0.0 0.0 0.0 0.0 0.0 0.0 0.0
10000 - 20000 0.0 0.0 0.0 0.0 0.0 0.0 0.0
20000 - 40000 0.0 0.0 0.0 0.0 0.0 0.0 1.8
40000 - 60000 0.0 0.0 0.0 0.0 0.0 0.0 7.3
60000 - 100000 10.8 62.9 34.1 50.1 0.0 0.0 24.4
> 100000 87.7 0.0 47.0 30.3 94.4 67.8 66.5
=Total 100.0 100.0 100.0 100.0 100.0 100.0 100.0
Soil Group :- (1) 57.7 60.6 70.2 48.1 82.2 0.0 60.4
(2) 37.8 39.4 25.9 37.5 0.0 0.0 34.6
(3) 4.5 0.0 0.0 0.0 0.0 0.0 5.0
=Total 100.0 100.0 100.0 100.0 100.0 100.0 100.0

Teagasc National Farm Survey 201868
Table - 10B (2018) Resources per Farm by System of Farming - Full-Time Farms
SystemDairying
CattleRearing
CattleOther
Sheep TillageMixed
LivestockAll Sizes
No. of Farms in Sample 281 26 69 53 33 15 477
Per Cent of Population 15.2 2.4 5.4 4.5 2.6 1.2 31.7
LAND (ha)
Area Owned 49.5 54.0 63.2 63.7 82.9 72.5 57.9
Total Area 64.8 60.5 74.1 77.2 113.0 90.3 72.9
Tillage 1.2 0.1 4.0 2.4 71.0 2.5 7.6
of which Total Cereals 0.6 0.0 3.1 0.0 61.9 0.0 6.3
" Potatoes 0.0 0.0 0.0 0.0 0.0 0.0 0.0
Grassland Silage 22.1 14.0 17.3 13.3 8.9 30.1 18.6
Hay 0.8 3.0 2.5 1.8 4.2 0.6 1.7
Pasture 36.3 36.9 44.6 36.8 22.9 51.8 37.4
Rough Grazing 1.0 2.4 2.4 18.1 0.5 0.9 3.8
U.A.A 62.4 57.9 72.3 73.2 110.5 87.4 70.3
Remainder of Farm 2.4 2.6 1.9 4.0 2.6 2.9 2.6
Forage & Crop Acreage 61.0 54.9 69.3 59.5 108.3 85.5 66.6
LIVESTOCK
Cattle
Dairy Cows 84.7 0.0 0.0 0.0 0.0 62.4 43.3
Other Cows 1.9 50.2 32.8 21.4 9.8 21.5 15.3
Heifers-in-Calf 10.7 3.4 2.5 0.9 0.4 7.4 6.3
< 1 Year Old 50.1 47.2 55.6 21.0 17.7 58.5 44.3
1 - 2 Year Old Male 8.6 7.3 33.6 6.3 24.1 24.1 14.4
1 - 2 Year Old Female 16.4 14.5 27.9 8.4 16.2 21.9 17.3
=> 2 Year Old Male 1.0 0.3 11.8 2.0 7.7 3.4 3.6
=> 2 Year Old Female 1.3 2.3 6.0 2.5 4.6 2.6 2.7
Bulls 1.1 1.7 1.1 0.7 0.3 1.4 1.0
Total Cattle 174.9 126.8 171.3 63.4 80.7 202.1 147.6
Sheep (avg. no)
Ewes 2.6 5.4 36.1 239.6 27.2 46.1 46.5
Other Sheep 2.1 6.4 37.3 226.9 30.9 39.9 44.8
Total Sheep 4.7 11.8 73.4 466.5 58.1 86.0 91.4
Grazing Livestock Units
Dairy Cows 84.7 0.0 0.0 0.0 0.0 62.4 43.3
Other Cattle 43.8 80.7 110.6 41.8 55.7 80.3 60.4
Sheep 0.6 1.6 9.5 60.2 8.0 11.1 11.9
Horses 0.2 1.1 0.8 0.5 0.6 0.0 0.4
Total Livestock Units 129.3 83.5 121.0 102.4 64.3 153.9 115.9
LABOUR UNITS
Family 1.40 1.06 1.28 1.38 1.28 1.58 1.34
Total 1.69 1.14 1.43 1.45 1.62 1.91 1.57

Teagasc National Farm Survey 201869
Table - 10C (2018) Gross Output and Direct Payments by System of Farming - Full-Time Farms
SystemDairying
CattleRearing
CattleOther
Sheep TillageMixed
LivestockAll Sizes
No. of Farms in Sample 281 26 69 53 33 15 477
Per Cent of Population 15.2 2.4 5.4 4.5 2.6 1.2 31.7
(€) GROSSOUTPUT
LIVESTOCK
Dairying 174992 0 0 2 0 114405 88809
of which milk 171859 0 0 0 0 114218 87290
Cattle 38305 55930 78875 26889 44086 56267 46231
of which Beef Data / BeefGenomics
0.00 2799 1335 1300 362 1021 720
Sheep & Wool 351 1687 6118 32515 4567 6466 6683
of which Sheep CoupledPayments
0 0 0 0 0 0 0
Pigs 0 0 0 50 0 11750 463
Poultry 0 0 0 0 0 42690 1656
Horses 295 384 752 293 92 0 352
Other 0 0 0 0 0 0 0
Sub-Total Livestock 213943 58002 85745 59749 48745 231578 144194
of which DiseaseCompensation
1417 50 76 112 74 275 733
CROPS
Wheat 0 0 0 0 34533 0 2919
Barley - Feeding 468 0 3615 0 53290 0 5568
Barley - Malting 0 0 0 0 0 0 393
Oats 0 0 0 0 7103 0 769
Potatoes 0 0 0 0 0 0 0
Other 728 1344 3054 1033 38524 219 4351
of which Forestry Premium 265 465 484 37 931 161 337
Sub-Total Crops 1549 1344 7146 3282 136682 1365 13999
TOTAL LIVESTOCK &CROPS
215492 59346 92891 63031 185427 232942 158193
Machinery Hire Revenue 249 1030 222 207 5962 4 766
Other Current Receipts 609 393 605 755 724 399 614
+ Decoupled DirectPayments / Sub
20400 22166 28025 27064 37999 28612 24602
of which Single FarmPayment
17667 16772 23586 20983 34519 23401 20724
" REPS/GLAS 533 2956 2206 2877 2120 1709 1529
" DAS 1877 2235 2034 2842 570 2783 1998
" Other Subsidies 560 657 746 3170 1409 1449 1082
" AEOS 0 194 0 106 0 0 31
+ Income from Land Let 201 1470 170 381 1005 0 380
+ Income from Quota Let 0 0 0 0 0 0 0
- Inter-EnterpriseTransfers
5626 0 1773 825 3759 4396 3622
TOTAL GROSS OUTPUT 231686 84932 120764 91322 227783 257828 181406
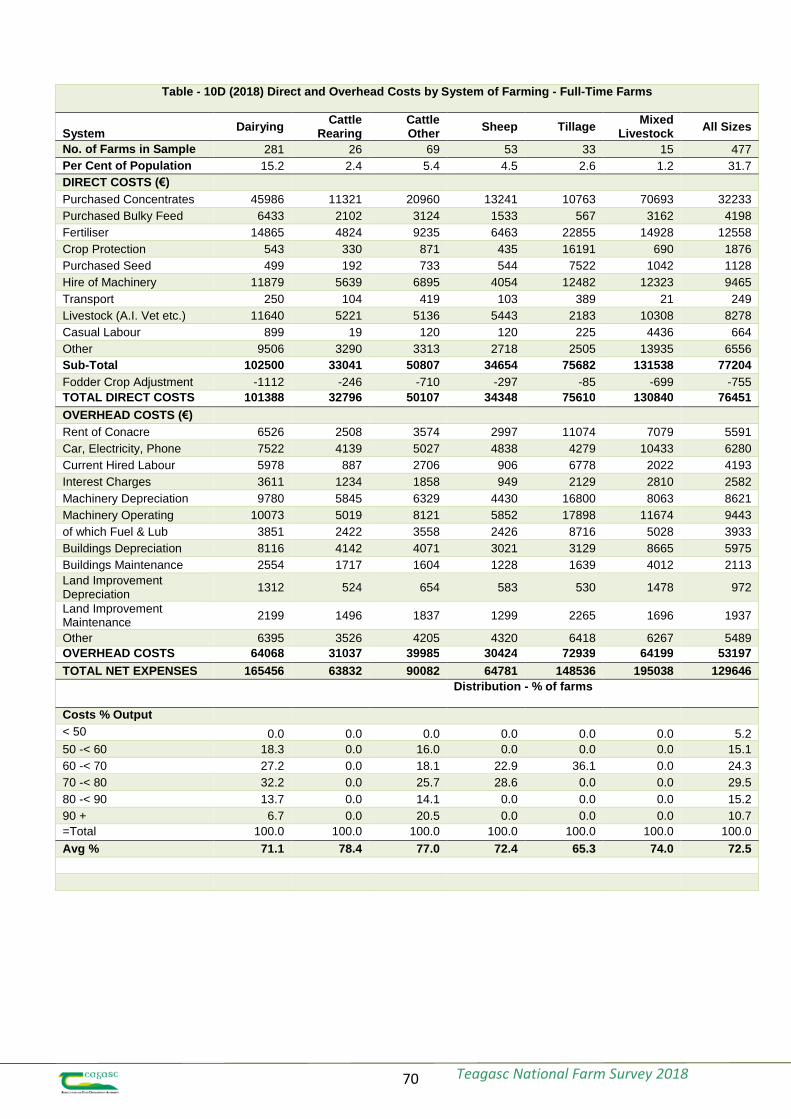
Teagasc National Farm Survey 201870
Table - 10D (2018) Direct and Overhead Costs by System of Farming - Full-Time Farms
SystemDairying
CattleRearing
CattleOther
Sheep TillageMixed
LivestockAll Sizes
No. of Farms in Sample 281 26 69 53 33 15 477
Per Cent of Population 15.2 2.4 5.4 4.5 2.6 1.2 31.7
DIRECT COSTS (€)
Purchased Concentrates 45986 11321 20960 13241 10763 70693 32233
Purchased Bulky Feed 6433 2102 3124 1533 567 3162 4198
Fertiliser 14865 4824 9235 6463 22855 14928 12558
Crop Protection 543 330 871 435 16191 690 1876
Purchased Seed 499 192 733 544 7522 1042 1128
Hire of Machinery 11879 5639 6895 4054 12482 12323 9465
Transport 250 104 419 103 389 21 249
Livestock (A.I. Vet etc.) 11640 5221 5136 5443 2183 10308 8278
Casual Labour 899 19 120 120 225 4436 664
Other 9506 3290 3313 2718 2505 13935 6556
Sub-Total 102500 33041 50807 34654 75682 131538 77204
Fodder Crop Adjustment -1112 -246 -710 -297 -85 -699 -755
TOTAL DIRECT COSTS 101388 32796 50107 34348 75610 130840 76451
OVERHEAD COSTS (€)
Rent of Conacre 6526 2508 3574 2997 11074 7079 5591
Car, Electricity, Phone 7522 4139 5027 4838 4279 10433 6280
Current Hired Labour 5978 887 2706 906 6778 2022 4193
Interest Charges 3611 1234 1858 949 2129 2810 2582
Machinery Depreciation 9780 5845 6329 4430 16800 8063 8621
Machinery Operating 10073 5019 8121 5852 17898 11674 9443
of which Fuel & Lub 3851 2422 3558 2426 8716 5028 3933
Buildings Depreciation 8116 4142 4071 3021 3129 8665 5975
Buildings Maintenance 2554 1717 1604 1228 1639 4012 2113
Land ImprovementDepreciation
1312 524 654 583 530 1478 972
Land ImprovementMaintenance
2199 1496 1837 1299 2265 1696 1937
Other 6395 3526 4205 4320 6418 6267 5489
OVERHEAD COSTS 64068 31037 39985 30424 72939 64199 53197
TOTAL NET EXPENSES 165456 63832 90082 64781 148536 195038 129646
Distribution - % of farms
Costs % Output
< 50 0.0 0.0 0.0 0.0 0.0 0.0 5.2
50 -< 60 18.3 0.0 16.0 0.0 0.0 0.0 15.1
60 -< 70 27.2 0.0 18.1 22.9 36.1 0.0 24.3
70 -< 80 32.2 0.0 25.7 28.6 0.0 0.0 29.5
80 -< 90 13.7 0.0 14.1 0.0 0.0 0.0 15.2
90 + 6.7 0.0 20.5 0.0 0.0 0.0 10.7
=Total 100.0 100.0 100.0 100.0 100.0 100.0 100.0
Avg % 71.1 78.4 77.0 72.4 65.3 74.0 72.5

Teagasc National Farm Survey 201871
Table - 10E (2018) Demographic Data by System of Farming - Full-Time Farms
System DairyingCattle
RearingCattleOther
Sheep TillageMixed
LivestockAll Sizes
No. of Farms in Sample 281 26 69 53 33 15 477
Per Cent of Population 15.2 2.4 5.4 4.5 2.6 1.2 31.7
Holder
Age of Holder 52.9 54.5 57.9 54.1 55.2 57.6 54.5
Marital Status - Married % 83.9 74.3 72.6 85.4 83.3 62.6 80.5
Widowed % 0.0 0.0 0.0 0.0 0.0 0.0 4.1
Single % 13.1 0.0 15.3 0.0 0.0 0.0 13.2
Separated % 0.0 0.0 0.0 0.0 0.0 0.0 2.0
=Total 100.0 100.0 100.0 100.0 100.0 100.0 100.0
Household
Household Size (no.) 3.4 3.0 3.0 3.0 3.2 3.0 3.2
< 24 (no.) 1.18 0.85 0.77 0.81 0.99 0.00 0.98
< 24 % HH 54.2 37.0 37.8 39.5 44.8 0.0 45.9
25 - 44 (no.) 0.60 0.50 0.45 0.56 0.00 0.00 0.55
25 - 44 % HH 41.7 38.6 30.1 34.6 0.0 0.0 37.3
Demograph. Viable % HH 80.5 78.0 66.7 71.0 65.4 82.6 75.4
Off-farm sourcesof income --Holder and/orSpouse
Off-farm Job % HH 51.9 55.7 48.6 50.2 46.5 0.0 50.0
Off-farm Job Holder % HH 8.4 0.0 21.2 0.0 0.0 0.0 13.2
Off-farm Job Spouse %HH
46.7 48.8 41.9 38.4 34.2 0.0 43.0
Pensioners (no.) 0.23 0.00 0.57 0.36 0.00 0.00 0.34
Pensioners % HH 15.8 0.0 43.8 28.0 0.0 0.0 25.3
Unemployment Etc. (no.) 0.00 0.00 0.00 0.00 0.00 0.00 0.02
Unemployment Etc. % HH 0.0 0.0 0.0 0.0 0.0 0.0 1.8

Teagasc National Farm Survey 201872
Table - 11A (2018) Farm Financial Results by System of Farming - Part-Time Farms
System DairyingCattle
RearingCattleOther
Sheep TillageMixed
LivestockAll Sizes
No. of Farms in Sample 30 138 145 72 34 1 420
Per Cent of Population 2.1 25.3 24.9 10.8 4.7 0.2 68.3
Overall Results (€)
Gross Output 85356 31166 37356 32733 54485 0 37069
of which Land / Quota Let 0 165 1112 427 1196 0 620
Subsidies and DirectPayments
11545 11822 13097 13770 12762 0 12650
- Direct Costs 36866 11532 12802 12990 18498 0 13512
=Gross Margin 48489 19634 24555 19743 35987 0 23557
- Overhead Costs 21359 12584 13526 12023 16657 0 13417
= Family Farm Income 27130 7050 11029 7721 19330 0 10141
Net Sales & Receipts 85916 32100 38740 34138 54484 0 38161
- Current CashExpenditure
53795 20795 22592 21943 29352 0 23296
=Cash Income (Approx) 32120 11305 16148 12195 25131 0 14865
- Net New Investment 14007 2699 3002 1820 2348 0 2997
=Cash Flow 18113 8606 13145 10375 22783 0 11868
Asset Values (€)
Machinery 22761 14538 14165 11656 27302 0 15091
Livestock: Breeding 36281 22515 7039 12507 1647 0 14174
Trading 8697 14187 31212 14344 17008 0 20535
Land & Buildings 464086 415715 568132 420785 721616 0 494923
Gross New Investment 14449 3046 3626 1948 3116 0 3441
Loans Closing Balance 17682 5920 7435 4316 3258 0 6461
Total Standard Output(TSO)
74240.6 19205.1 21088.5 23176.4 31132.7 0.0 23225.9
Distribution - % of Farms
Gross Output0 - 10000 0.0 0.0 0.0 0.0 0.0 0.0 0.8
10000 - 20000 0.0 24.2 17.2 27.0 0.0 0.0 21.0
20000 - 40000 0.0 50.2 47.7 47.0 0.0 0.0 45.9
40000 - 60000 0.0 18.3 20.6 17.1 0.0 0.0 19.1
60000 - 100000 0.0 0.0 12.8 0.0 32.3 0.0 10.7
> 100000 35.0 0.0 0.0 0.0 0.0 0.0 2.6
=Total 100.0 100.0 100.0 100.0 100.0 100.0 100.0
Soil Group :- (1) 43.8 29.1 53.5 33.9 87.8 0.0 43.3
(2) 47.2 60.6 40.5 45.1 0.0 0.0 47.1
(3) 0.0 10.3 0.0 20.9 0.0 0.0 9.6
=Total 100.0 100.0 100.0 100.0 100.0 100.0 100.0

Teagasc National Farm Survey 201873
Table - 11B (2018) Resources per Farm by System of Farming - Part-Time Farms
System DairyingCattle
RearingCattleOther
SheepTillage
MixedLivestock
All Sizes
No. of Farms in Sample 30 138 145 72 34 1 420
Per Cent of Population 2.1 25.3 24.9 10.8 4.7 0.2 68.3
LAND (ha)
Area Owned 27.0 26.2 29.1 33.6 31.2 0.0 28.8
Total Area 32.5 30.0 30.6 39.3 34.1 0.0 32.0
Tillage 0.3 0.0 0.2 0.1 18.2 0.0 1.4
of which Total Cereals 0.0 0.0 0.0 0.0 16.5 0.0 1.2
" Potatoes 0.0 0.0 0.0 0.0 0.0 0.0 0.0
Grassland Silage 10.1 7.7 7.5 4.2 3.0 0.0 6.8
Hay 0.5 1.1 1.1 1.1 1.7 0.0 1.1
Pasture 19.2 17.1 18.4 27.1 7.2 0.0 18.6
Rough Grazing 4.1 1.4 0.9 4.0 0.3 0.0 1.6
U.A.A 31.8 28.1 29.5 37.6 32.4 0.0 30.5
Remainder of Farm 0.7 1.8 1.1 1.7 1.7 0.0 1.5
Forage & Crop Acreage 30.9 26.5 27.8 33.9 31.0 0.0 28.6
LIVESTOCK
Cattle
Dairy Cows 34.5 0.0 0.0 0.0 0.0 0.0 1.1
Other Cows 0.4 19.8 5.7 4.6 0.9 0.0 10.2
Heifers-in-Calf 2.6 1.1 0.4 0.3 0.1 0.0 0.7
< 1 Year Old 16.5 17.0 14.2 6.6 2.2 0.0 13.3
1 - 2 Year Old Male 2.7 2.5 12.9 3.4 8.2 0.0 6.9
1 - 2 Year Old Female 6.0 4.3 8.7 1.9 1.1 0.0 5.4
=> 2 Year Old Male 0.4 0.2 5.6 1.1 3.9 0.0 2.6
=> 2 Year Old Female 0.3 0.9 2.1 0.4 0.4 0.0 1.2
Bulls 0.5 0.6 0.2 0.2 0.0 0.0 0.4
Total Cattle 63.4 46.5 49.7 18.3 16.8 0.0 41.6
Sheep (avg. no)
Ewes 1.1 0.7 5.5 79.1 7.7 0.0 15.4
Other Sheep 0.6 1.0 7.5 82.7 6.1 0.0 16.7
Total Sheep 1.7 1.7 13.0 161.9 13.8 0.0 32.2
Grazing Livestock Units
Dairy Cows 34.5 0.0 0.0 0.0 0.0 0.0 1.1
Other Cattle 13.8 30.0 33.0 11.7 12.5 0.0 26.4
Sheep 0.3 0.2 1.7 20.3 1.9 0.0 4.1
Horses 0.1 0.2 0.1 0.3 0.1 0.0 0.2
Total Livestock Units 48.7 30.4 34.8 32.3 14.5 0.0 31.8
LABOUR UNITS
Family 1.11 0.91 0.81 0.93 0.82 0.00 0.88
Total 1.16 0.92 0.84 0.94 0.83 0.00 0.89

Teagasc National Farm Survey 201874
Table - 11C (2018) Gross Output and Direct Payments by System of Farming - Part-Time Farms
System DairyingCattle
RearingCattleOther
Sheep TillageMixed
LivestockAll Sizes
No. of Farms in Sample 30 138 145 72 34 1 420
Per Cent of Population 2.1 25.3 24.9 10.8 4.7 0.2 68.3
(€) GROSSOUTPUT
LIVESTOCK
Dairying 64061 0 0 0 0 0 1998
of which milk 59944 0 0 0 0 0 1870
Cattle 8799 19785 21002 8059 8400 0 17253
of which Beef Data / BeefGenomics
0 889 304 159 25 0 469
Sheep & Wool 119 149 956 10194 1299 0 2122
of which Sheep CoupledPayments
0 0 0 0 0 0 0
Pigs 0 0 0 0 0 0 0
Poultry 0 0 0 0 0 0 43
Horses 0 49 20 11 12 0 28
Other 0 0 0 0 0 0 0
Sub-Total Livestock 72979 19982 21978 18263 9711 0 21444
of which DiseaseCompensation
257 67 150 13 30 0 92
CROPS
Wheat 0 0 0 0 0 0 177
Barley - Feeding 0 0 0 0 14421 0 1055
Barley - Malting 0 0 0 0 0 0 276
Oats 0 0 0 0 0 0 160
Potatoes 0 0 0 0 0 0 27
Other 481 309 1346 880 7694 0 1300
of which Forestry Premium 218 220 372 173 224 0 268
Sub-Total Crops 932 320 1514 905 30740 0 2996
TOTAL LIVESTOCK &CROPS
73911 20302 23492 19168 40451 0 24440
Machinery Hire Revenue 101 50 452 42 737 0 245
Other Current Receipts 2003 10 97 250 107 0 149
+ Decoupled DirectPayments / Sub
10994 10533 11981 12615 12035 0 11510
of which Single FarmPayment
8207 6581 8649 7856 10251 0 7849
" REPS/GLAS 715 1859 1407 2013 854 0 1606
" DAS 1660 1958 1678 2337 342 0 1796
" Other Subsidies 471 230 520 1219 1037 0 559
" AEOS 203 21 125 78 0 0 72
+ Income from Land Let 0 165 1112 427 1196 0 620
+ Income from Quota Let 0 0 0 0 0 0 0
- Inter-EnterpriseTransfers
1711 11 49 0 582 0 116
TOTAL GROSS OUTPUT 85356 31166 37356 32733 54485 0 37069
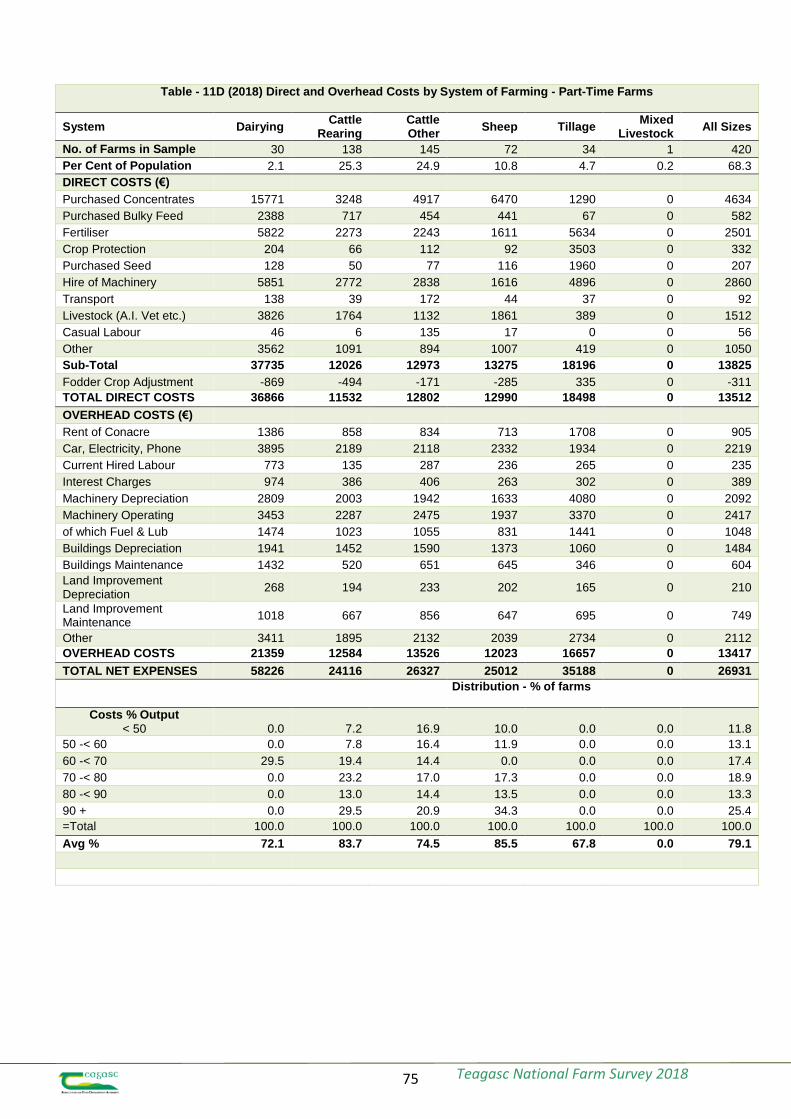
Teagasc National Farm Survey 201875
Table - 11D (2018) Direct and Overhead Costs by System of Farming - Part-Time Farms
System DairyingCattle
RearingCattleOther
Sheep TillageMixed
LivestockAll Sizes
No. of Farms in Sample 30 138 145 72 34 1 420
Per Cent of Population 2.1 25.3 24.9 10.8 4.7 0.2 68.3
DIRECT COSTS (€)
Purchased Concentrates 15771 3248 4917 6470 1290 0 4634
Purchased Bulky Feed 2388 717 454 441 67 0 582
Fertiliser 5822 2273 2243 1611 5634 0 2501
Crop Protection 204 66 112 92 3503 0 332
Purchased Seed 128 50 77 116 1960 0 207
Hire of Machinery 5851 2772 2838 1616 4896 0 2860
Transport 138 39 172 44 37 0 92
Livestock (A.I. Vet etc.) 3826 1764 1132 1861 389 0 1512
Casual Labour 46 6 135 17 0 0 56
Other 3562 1091 894 1007 419 0 1050
Sub-Total 37735 12026 12973 13275 18196 0 13825
Fodder Crop Adjustment -869 -494 -171 -285 335 0 -311
TOTAL DIRECT COSTS 36866 11532 12802 12990 18498 0 13512
OVERHEAD COSTS (€)
Rent of Conacre 1386 858 834 713 1708 0 905
Car, Electricity, Phone 3895 2189 2118 2332 1934 0 2219
Current Hired Labour 773 135 287 236 265 0 235
Interest Charges 974 386 406 263 302 0 389
Machinery Depreciation 2809 2003 1942 1633 4080 0 2092
Machinery Operating 3453 2287 2475 1937 3370 0 2417
of which Fuel & Lub 1474 1023 1055 831 1441 0 1048
Buildings Depreciation 1941 1452 1590 1373 1060 0 1484
Buildings Maintenance 1432 520 651 645 346 0 604
Land ImprovementDepreciation
268 194 233 202 165 0 210
Land ImprovementMaintenance
1018 667 856 647 695 0 749
Other 3411 1895 2132 2039 2734 0 2112
OVERHEAD COSTS 21359 12584 13526 12023 16657 0 13417
TOTAL NET EXPENSES 58226 24116 26327 25012 35188 0 26931
Distribution - % of farms
Costs % Output< 50 0.0 7.2 16.9 10.0 0.0 0.0 11.8
50 -< 60 0.0 7.8 16.4 11.9 0.0 0.0 13.1
60 -< 70 29.5 19.4 14.4 0.0 0.0 0.0 17.4
70 -< 80 0.0 23.2 17.0 17.3 0.0 0.0 18.9
80 -< 90 0.0 13.0 14.4 13.5 0.0 0.0 13.3
90 + 0.0 29.5 20.9 34.3 0.0 0.0 25.4
=Total 100.0 100.0 100.0 100.0 100.0 100.0 100.0
Avg % 72.1 83.7 74.5 85.5 67.8 0.0 79.1

Teagasc National Farm Survey 201876
Table - 11E (2018) Demographic Data by System of Farming - Part-Time Farms
System DairyingCattle
RearingCattleOther
Sheep TillageMixed
LivestockAll Sizes
No. of Farms in Sample 30 138 145 72 34 1 420
Per Cent of Population 2.1 25.3 24.9 10.8 4.7 0.2 68.3
Holder
Age of Holder 53.2 59.2 59.5 61.8 63.0 0.0 59.7
Marital Status - Married % 75.2 63.9 65.8 70.5 60.3 0.0 65.9
Widowed % 0.0 0.0 0.0 0.0 0.0 0.0 5.0
Single % 0.0 29.0 26.4 18.0 30.6 0.0 26.2
Separated % 0.0 0.0 0.0 0.0 0.0 0.0 2.8
=Total 100.0 100.0 100.0 100.0 100.0 100.0 100.0
Household
Household Size (no.) 3.02 2.53 2.34 2.21 2.30 0.00 2.41
< 24 (no.) 0.97 0.49 0.51 0.34 0.00 0.00 0.48
< 24 % HH 40.4 24.5 23.2 16.0 0.0 0.0 22.7
25 - 44 (no.) 0.00 0.38 0.25 0.20 0.00 0.00 0.29
25 - 44 % HH 0.0 26.5 18.6 14.7 0.0 0.0 21.4
Demograph. Viable % HH 68.6 50.3 46.4 34.6 38.6 0.0 46.3
Off-farm sourcesof income --Holder and/orSpouse
Off-farm Job % HH 65.8 51.8 54.9 46.1 46.5 0.0 52.2
Off-farm Job Holder % HH 37.2 41.1 46.4 37.8 41.8 0.0 42.6
Off-farm Job Spouse %HH
48.6 29.8 27.5 28.2 0.0 0.0 28.7
Pensioners (no.) 0.00 0.57 0.49 0.71 0.68 0.00 0.56
Pensioners % HH 0.0 36.1 33.6 44.6 45.0 0.0 36.3
Unemployment Etc. (no.) 0.00 0.00 0.00 0.00 0.00 0.00 0.05
Unemployment Etc. % HH 0.0 0.0 0.0 0.0 0.0 0.0 5.1

Teagasc National Farm Survey 201877
Table - 14A (2018) Farm Financial Results by Region - All Farms
Region BorderReg(1)
Dublin &Mid-East
Reg(3)
MidlandsReg(4)
Mid-WestReg(5)
South-EastReg(6)
South-West
Reg(7)
WestReg(8)
No. of Farms in Sample 136 139 119 116 133 151 103
Per Cent of Population 16.4 9.1 9.5 14.8 9.8 16.0 20.0
Overall Results (€)
Gross Output 53,933 100,836 87,116 92,517 117,307 101,893 46,417
of which Land / Quota Let 191 1,526 485 245 1,068 99 39
Subsidies and DirectPayments
15,514 18,844 18,616 17,683 21,111 17,714 15,026
- Direct Costs 21,409 39,330 36,158 36,824 46,668 42891 18,707
=Gross Margin 32,524 61,506 50,958 55,694 70,639 59002 27,709
- Overhead Costs 19,232 33,461 30,908 29,390 35,017 27880 13,768
= Family Farm Income 13,292 28,045 20,049 26,303 35,622 31122 13,941
Net Sales & Receipts 53,932 102,545 87,071 92,331 119,653 101448 47,952
- Current CashExpenditure
36,206 63,656 58,158 58,269 71,224 62307 28,358
=Cash Income (Approx) 17,726 38,889 28,914 34,062 48,429 39141 19,595
-Net New Investment 4,854 12,159 11,325 13,107 13,684 8841 2,808
=Cash Flow 12,871 26,730 17,589 20,955 34,745 30300 16,787
Asset Values (€)
Machinery 21,789 42,736 39,075 34,507 42,318 31244 16,469
Livestock: Breeding 26,462 31,450 31,981 41,714 43,858 39269 23,994
Trading 22,542 36,013 48,669 33,972 39,886 18630 24,988
Land & Buildings 450,451 879,064 922,471 797,313 1,185,098 616602 395,837
Gross New Investment 5,187 14,072 13,440 15,686 15,556 9098 3,798
Loans Closing Balance 14,518 29,275 31,287 35,669 25,181 21046 4,577
Total Standard Output(TSO)
37,396.3 70,935.7 58,678.5 66,015.2 83,278.3 77,804.8 30,076.4
Distribution - % of Farms
Gross Output0 – 10,000 0.0 0.0 0.0 0.0 0.0 0.0 4.0
10,000 – 20,000 18.6 22.5 0.0 0.0 0.0 0.0 16.0
20,000 – 40,000 45.4 21.6 21.6 27.7 28.1 34.6 35.3
40,000 – 60,000 11.7 9.7 16.4 17.7 13.6 15.4 19.0
60,000 – 100,000 12.6 18.0 19.2 17.1 12.0 12.6 20.9
> 100,000 11.7 28.2 22.0 28.4 41.2 33.3 4.8
=Total 100 100 100 100 100 100 100
Soil Group :- (1) 17.7 63.3 64.1 42.9 75.1 48.0 40.2
(2) 75.6 32.6 33.4 49.7 23.6 29.1 42.8
(3) 0.0 0.0 0.0 7.4 0.0 22.9 17.0
=Total 100 100 100 100 100 100 100
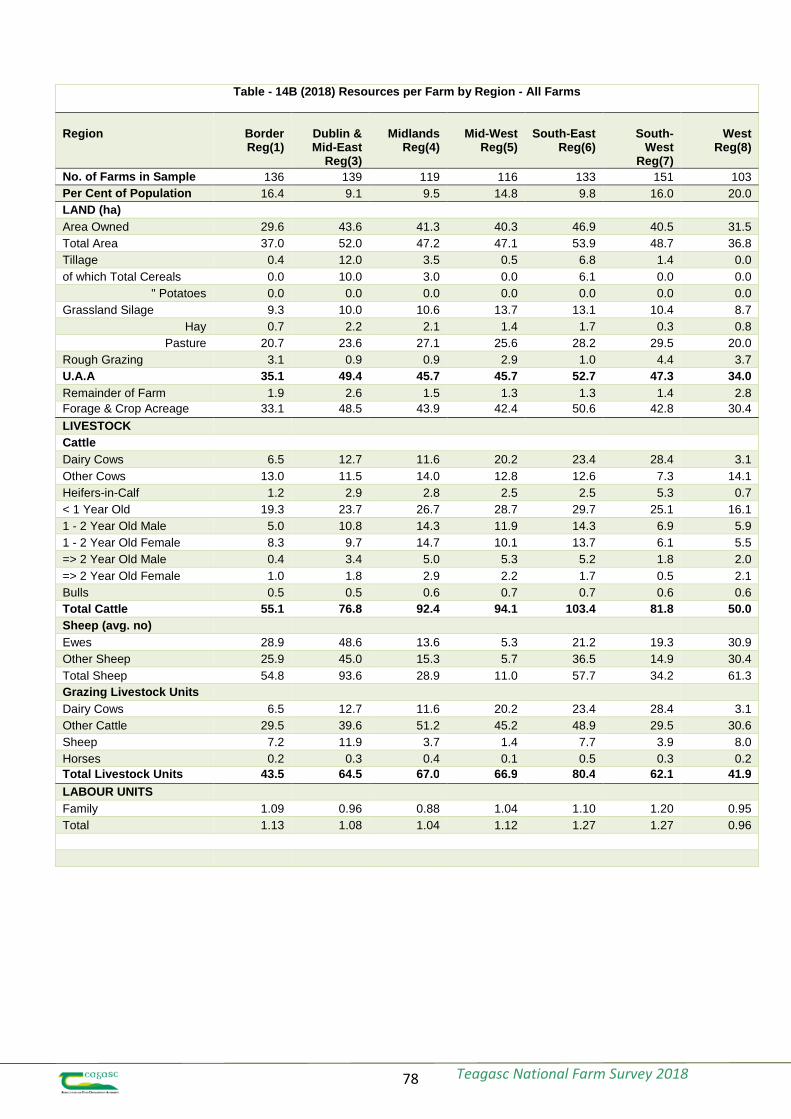
Teagasc National Farm Survey 201878
Table - 14B (2018) Resources per Farm by Region - All Farms
Region BorderReg(1)
Dublin &Mid-East
Reg(3)
MidlandsReg(4)
Mid-WestReg(5)
South-EastReg(6)
South-West
Reg(7)
WestReg(8)
No. of Farms in Sample 136 139 119 116 133 151 103
Per Cent of Population 16.4 9.1 9.5 14.8 9.8 16.0 20.0
LAND (ha)
Area Owned 29.6 43.6 41.3 40.3 46.9 40.5 31.5
Total Area 37.0 52.0 47.2 47.1 53.9 48.7 36.8
Tillage 0.4 12.0 3.5 0.5 6.8 1.4 0.0
of which Total Cereals 0.0 10.0 3.0 0.0 6.1 0.0 0.0
" Potatoes 0.0 0.0 0.0 0.0 0.0 0.0 0.0
Grassland Silage 9.3 10.0 10.6 13.7 13.1 10.4 8.7
Hay 0.7 2.2 2.1 1.4 1.7 0.3 0.8
Pasture 20.7 23.6 27.1 25.6 28.2 29.5 20.0
Rough Grazing 3.1 0.9 0.9 2.9 1.0 4.4 3.7
U.A.A 35.1 49.4 45.7 45.7 52.7 47.3 34.0
Remainder of Farm 1.9 2.6 1.5 1.3 1.3 1.4 2.8
Forage & Crop Acreage 33.1 48.5 43.9 42.4 50.6 42.8 30.4
LIVESTOCK
Cattle
Dairy Cows 6.5 12.7 11.6 20.2 23.4 28.4 3.1
Other Cows 13.0 11.5 14.0 12.8 12.6 7.3 14.1
Heifers-in-Calf 1.2 2.9 2.8 2.5 2.5 5.3 0.7
< 1 Year Old 19.3 23.7 26.7 28.7 29.7 25.1 16.1
1 - 2 Year Old Male 5.0 10.8 14.3 11.9 14.3 6.9 5.9
1 - 2 Year Old Female 8.3 9.7 14.7 10.1 13.7 6.1 5.5
=> 2 Year Old Male 0.4 3.4 5.0 5.3 5.2 1.8 2.0
=> 2 Year Old Female 1.0 1.8 2.9 2.2 1.7 0.5 2.1
Bulls 0.5 0.5 0.6 0.7 0.7 0.6 0.6
Total Cattle 55.1 76.8 92.4 94.1 103.4 81.8 50.0
Sheep (avg. no)
Ewes 28.9 48.6 13.6 5.3 21.2 19.3 30.9
Other Sheep 25.9 45.0 15.3 5.7 36.5 14.9 30.4
Total Sheep 54.8 93.6 28.9 11.0 57.7 34.2 61.3
Grazing Livestock Units
Dairy Cows 6.5 12.7 11.6 20.2 23.4 28.4 3.1
Other Cattle 29.5 39.6 51.2 45.2 48.9 29.5 30.6
Sheep 7.2 11.9 3.7 1.4 7.7 3.9 8.0
Horses 0.2 0.3 0.4 0.1 0.5 0.3 0.2
Total Livestock Units 43.5 64.5 67.0 66.9 80.4 62.1 41.9
LABOUR UNITS
Family 1.09 0.96 0.88 1.04 1.10 1.20 0.95
Total 1.13 1.08 1.04 1.12 1.27 1.27 0.96

Teagasc National Farm Survey 201879
Table - 14C (2018) Gross Output and Direct Payments by Region - All Farms
Region BorderReg(1)
Dublin &Mid-East
Reg(3)
MidlandsReg(4)
Mid-WestReg(5)
South-EastReg(6)
South-West
Reg(7)
WestReg(8)
No. of Farms in Sample 136 139 119 116 133 151 103
Per Cent of Population 16.4 9.1 9.5 14.8 9.8 16.0 20.0
(€) GROSSOUTPUT
LIVESTOCK
Dairying 13,235 26,832 23,271 40,297 47,708 58,266 6,097
of which milk 13,032 26,586 23,121 38,740 47,066 56,818 5,932
Cattle 20,658 26,479 36,245 32,234 34,971 23,663 20,946
of which Beef Data / BeefGenomics
668 468 553 833 578 230 673
Sheep & Wool 3,632 6,868 2,357 865 4,271 1,758 4,630
of which Sheep CoupledPayments
0 0 0 0 0 0 0
Pigs 0 0 1,515 0 0 0 0
Poultry 1,020 0 0 0 0 0 0
Horses 104 52 390 101 32 280 4
Other 0 0 0 0 0 0 0
Sub-Total Livestock 38,648 60,232 63,778 73,497 86,982 83,967 31,677
of which DiseaseCompensation
329 242 284 43 167 833 5
CROPS
Wheat 0 5,445 0 0 0 0 0
Barley - Feeding 0 7,953 2,859 0 5,125 0 0
Barley - Malting 0 0 0 0 0 0 0
Oats 0 1,747 0 0 0 0 20
Potatoes 0 0 0 0 0 0 0
Other 1,009 6,486 2,283 1,809 2,411 1,030 792
of which Forestry Premium 267 59 571 410 251 574 157
Sub-Total Crops 1,390 22,011 6,227 2,279 10,650 2,635 812
TOTAL LIVESTOCK &CROPS
40,038 82,243 70,005 75,776 97,632 86,602 32,489
Machinery Hire Revenue 9 723 729 877 202 212 0
Other Current Receipts 135 211 329 539 731 493 98
+ Decoupled DirectPayments / Sub
13,800 17,299 16,680 16,148 19,699 15,769 13,777
of which Single FarmPayment
9,069 14,865 13,134 12,582 16,980 11,680 8,767
" REPS/GLAS 1,826 1,323 1,442 1,639 1,438 1,237 2,338
" DAS 2,779 963 1,896 1,582 1,129 1,824 2,500
" Other Subsidies 544 924 716 562 568 1,306 587
" AEOS 65 4 18 132 36 35 102
+ Income from Land Let 191 1,526 485 245 1,068 99 39
+ Income from Quota Let 0 0 0 0 0 0 0
- Inter-EnterpriseTransfers
519 1,562 1,631 1,410 2,325 1,445 152
TOTAL GROSS OUTPUT 53,933 100,836 87,116 92,517 117,307 101,893 46,417

Teagasc National Farm Survey 201880
Table - 14D (2018) Direct and Overhead Costs by Region - All Farms
Region BorderReg(1)
Dublin &Mid-East
Reg(3)
MidlandsReg(4)
Mid-WestReg(5)
South-EastReg(6)
South-West
Reg(7)
WestReg(8)
No. of Farms in Sample 136 139 119 116 133 151 103
Per Cent of Population 16.4 9.1 9.5 14.8 9.8 16.0 20.0
DIRECT COSTS (€)
Purchased Concentrates 9,422 11,751 15,240 15362 18,034 18,496 8,437
Purchased Bulky Feed 751 2,509 1,885 2,294 1,783 2,638 753
Fertiliser 3,513 7,682 6,030 5,898 8,635 6,570 2,833
Crop Protection 157 2,701 802 297 1,459 396 97
Purchased Seed 184 1,421 518 210 995 257 62
Hire of Machinery 3,705 6,033 4,629 5,125 6,528 6,235 3,132
Transport 65 225 217 203 128 128 43
Livestock (A.I. Vet etc.) 2,651 3,698 3,991 4,050 5,079 4,768 2,213
Casual Labour 96 582 251 407 111 152 139
Other 1,759 3,069 3,028 3,178 4,009 3,565 1,316
Sub-Total 22,304 39,671 36,591 37,023 46,762 43,205 19,026
Fodder Crop Adjustment -896 -341 -434 -199 -86 -313 -319
TOTAL DIRECT COSTS 21,409 39,330 36,158 36,824 46,668 42,891 18,707
OVERHEAD COSTS (€)
Rent of Conacre 1,628 3,884 2,357 2,697 2,982 2,608 1,185
Car, Electricity, Phone 2,889 3,505 4,326 3,996 4,006 3,792 2,482
Current Hired Labour 583 2,572 2,726 1,127 3,481 1,456 74
Interest Charges 726 1,298 1,422 2,120 1,270 1,027 227
Machinery Depreciation 2,923 5,700 5,348 4,254 5,653 4,528 2,096
Machinery Operating 3,620 6,315 5,365 4,667 5,962 5,227 2,324
of which Fuel & Lub 1,591 2,727 2,397 2,119 2,551 1,649 1,126
Buildings Depreciation 2,013 3,176 3,285 3,294 4,011 3,444 1,890
Buildings Maintenance 795 1,294 911 1,749 1,624 995 533
Land ImprovementDepreciation
284 533 533 455 630 602 184
Land ImprovementMaintenance
1,133 1,398 1,300 1,452 1,438 691 708
Other 2,639 3,788 3,336 3,580 3,959 3,509 2,066
OVERHEAD COSTS 19,232 33,461 30,908 29,390 35,017 27,880 13,768
TOTAL NET EXPENSES 40,640 72,791 67,065 66,215 81,693 70,771 32,475
Distribution - % of farms
Costs % Output
< 50 0.0 0.0 0.0 11.5 0.0 23.2 11.2
50 -< 60 0.0 16.8 12.1 14.8 14.8 17.7 15.0
60 -< 70 15.6 19.1 15.8 16.7 32.0 14.3 26.3
70 -< 80 22.6 12.7 32.3 22.1 23.6 18.3 26.2
80 -< 90 21.8 16.0 15.4 7.9 13.5 5.6 10.7
90 + 25.2 29.0 19.6 27.1 12.1 20.8 10.6
=Total 100 100 100 100 100 100 100
Avg % 80.6 82.2 78.3 78.5 73.8 71.2 75.9

Teagasc National Farm Survey 201881
Table - 14E (2018) Demographic Data by Region - All Farms
RegionBorderReg(1)
Dublin &Mid-East
Reg(3)
MidlandsReg(4)
Mid-WestReg(5)
South-EastReg(6)
South-West
Reg(7)
WestReg(8)
No. of Farms in Sample 136 139 119 116 133 151 103
Per Cent of Population 16.4 9.1 9.5 14.8 9.8 16.0 20.0
Holder
Age of Holder 54.9 58.7 61.0 59.8 58.5 55.5 59.9
Marital Status - Married % 66.0 78.0 64.9 76.6 71.3 73.4 66.5
Widowed % 0.0 0.0 0.0 0.0 0.0 0.0 2.5
Single % 26.3 11.5 31.6 17.7 20.4 23.7 23.0
Separated % 0.0 0.0 0.0 0.0 0.0 0.0 8.0
=Total 100 100 100 100 100 100 100
Household
Household Size (no.) 2.84 2.78 2.67 2.62 2.81 2.66 2.34
< 24 (no.) 0.75 0.69 0.70 0.61 0.79 0.58 0.54
< 24 % HH 32.1 32.4 31.2 28.5 38.9 30.4 23.6
25 - 44 (no.) 0.51 0.39 0.35 0.39 0.39 0.35 0.19
25 - 44 % HH 32.6 24.8 27.7 30.1 27.5 24.8 14.7
Demograph. Viable % HH 60.9 52.3 51.6 50.5 61.0 65.6 43.3
Off-farm sourcesof income --Holder and/orSpouse
Off-farm Job % HH 51.5 48.5 44.8 57.8 48.5 50.1 54.1
Off-farm Job Holder % HH 39.6 31.3 30.8 30.9 25.4 26.6 40.7
Off-farm Job Spouse %HH
27.8 28.5 25.5 47.7 38.6 37.3 26.7
Pensioners (no.) 0.47 0.52 0.55 0.42 0.48 0.46 0.55
Pensioners % HH 28.3 34.3 42.3 30.8 33.5 28.8 34.4
Unemployment Etc. (no.) 0.00 0.00 0.00 0.00 0.00 0.00 0.02
Unemployment Etc. % HH 0.0 0.0 0.0 0.0 0.0 0.0 2.0
Teagasc National Farm Survey 201882
Appendix 2: Background notes
The Teagasc National Farm Survey (NFS) has been conducted on an annual basis since 1972. The survey isoperated as part of the Farm Accountancy Data Network (FADN) of the EU and fulfils Ireland’s statutoryobligation to provide data on farm output, costs and income to the European Commission. A random,nationally representative sample is selected annually in conjunction with the Central Statistics Office (CSO)to represent those farms with greater than €8,000 of Standard Output. Each farm is assigned a weightingfactor so that the results of the survey are representative of the national population of farms. Thesepreliminary results are based on a sample of 827 farms which represents 92,720 farms nationally.
Farms are assigned to six farm systems on the basis of farm gross output, as calculated on a standard outputbasis. Standard output measures are applied to each animal and crop output on the farm and only farmswith a standard output of €8,000 or more, the equivalent of 4 dairy cows, 5 hectares of wheat or 11 sucklercows, are included in the sample. Farms are then classified as one of the six farm systems on the basis ofthe main outputs of the farm. Farms falling into the Pigs and Poultry System are not included in the survey,due to the inability to obtain a representative sample of these systems. Due to the small number of farmsfalling into the Mixed Livestock system these farms are not reported here. Farms below the €8,000 standardoutput threshold are not included in the annual survey sampling frame but data is collected on thosethrough the Teagasc Small Farms Survey, the most recent of which was conducted in 2015.
Methodological Note: Updated 2017 Population Weights and Standard Output Values
The CSO conducts a Census of Agriculture every 10 years to record the population of farms and thestructure of farming in Ireland. Farm Structure Surveys (FSS) are conducted, in the intervening periods,to produce estimates of the total farm population. The 2016 FSS estimated the farming populationfalling within the sampling frame of the Teagasc NFS to be 92,720. As a result of the structural changeon farms since the previous FSS (2013) we have reweighted the 2017 Teagasc NFS data to take accountof this.
Additionally, output price inflation has also led to an increase in the number of farms represented bythe Teagasc NFS, with a larger share of the total farm population meeting the €8,000 standard outputthreshold for coverage within the survey. The additional farms covered are by definition small farmsand the majority are Cattle Rearing farms. As a result of these changes, the 2017 income estimates havebeen revised. These revisions have the largest absolute impact on the average income estimate forCattle Rearing (reducing the previously published income estimate for 2017 by about €1,900) and forthe average income estimate for Dairy (increasing the previously published income estimate for 2017by about €2,700). Revised 2017 tables are contained in Appendix 6.

Teagasc National Farm Survey 201883
Table A: Estimated 2018 Farm Population Distribution
Size (ha) 2 – 20 20 - 30 30 - 50 50 - 100 > 100 ALL
Dairy 1% 2% 6% 7% 2% 17%
Cattle Rearing 9% 8% 8% 3% 0% 28%
Cattle Other 8% 8% 9% 5% 1% 30%
Sheep 4% 3% 4% 3% 1% 15%
Tillage 1% 1% 2% 2% 1% 7%
Mixed Livestock 0% 0% 0% 1% 0% 1%
All 23% 22% 29% 21% 5% 100%
Source: Central Statistics Office
The distribution of the sample numbers on which the 2018 Teagasc NFS results are based is shown in Table B
together with the rate of representation for each system/size cell. The 897 farms in the NFS sample represent a
farming population of 92,720.
Table B: Number of Sampled Farms by Farm Size and Farm System 2018
Farm System2 - 20 20 - 30 30 - 50 50 - 100 > 100 ALL
Dairy 11 (67) 17 (103) 80 (65) 147 (47) 56 (28) 311 (52)
Cattle Rearing 24 (354) 41 (172) 63 (122) 32 (75) 4 (39) 164 (157)
Cattle Other 21 (354) 42 (172) 65 (122) 64 (75) 22 (39) 214 (132)
Sheep 8 (482) 24 (122) 43 (93) 34 (77) 16 (57) 125 (115)
Tillage 4 (283) 8 (128) 12 (139) 29 (68) 14 (78) 67 (103)
Mixed Livestock 1 (213) 5 (169) 10 (30) 16 (85)
ALL 68 (318) 133 (152) 263 (101) 311 (63) 122 (40) 897 (103)
Source: Central Statistics Office

Teagasc National Farm Survey 201884
Appendix 3: Classification of Farm Systems
In the European Union, there is a wide diversity of the production structures and systems. To make it easier toanalyse the structural characteristics and economic results of the agricultural holdings, an appropriatecommunity classification of the agricultural holdings per type of farming and economic size class has beendeveloped.
Since 1985, the typology of the agricultural holdings was based on standard gross margins (SGM) calculatedtaking into account the gross output and the subsidies, as well as certain deductible specific costs. In themeantime the common agricultural policy has drastically changed and the majority of the direct paymentshave been decoupled. Due to this decoupling of direct payments since 2005, it was not possible to maintain theprevioustypology(Commissiondecision85/377/EEC)basedonSGM.ASGMwithoutsubsidiescouldbenegativeand therefore cannot be used as classification criteria. Therefore, a new typology has been established.
The Community typology of agricultural holdings is a uniform classification of holdings in the EuropeanUnion. For practical reasons, the classification of farms cannot be based on financial information recordedindividually for each holding. Therefore, the classification is based on a set of economical coefficientscalculated as regional averages, the SO coefficients, and on the structural information (areas and numbersof heads) collected in the Farm Structure Survey (FSS) and in the Farm Accountancy Data Network (FADN).
Classification of holdings is based on their type of farming and economic size. The determining of thesetwo elements is based on the SO of the various types of agricultural production. In addition holdings canbe classified also according to the importance of the OGA of the holding. The typology is arranged in a waythat homogeneous groups of holdings can be assembled in a greater or lesser degree of aggregation. Thedefinitions are as follows:
a) The "standard output" (SO), of an agricultural product (crop or livestock) is the average monetary
valueof theagriculturaloutputatfarm-gateprice. TheSOexcludesdirectpayments,valueaddedtaxandtaxes
on products. The Member States calculate regional SO coefficients for each product as average values over
the reference period.
b) The "economic size of a holding" is the value of its total SO. It is the sum of the individual SO of all
the agricultural products present on the holding, expressed in Euro. Since Commission Regulation (EC) No
1242/2008 of 8 December 2008 there are 14 economic size classes.
c) The "type of farming of a holding" is the production system of a holding which is characterised by the
relative contribution of different enterprises1 to the holding's total SO. Depending on the amount of detail
required, there are three nested levels of type of farming: 9 general types, 21 principal types and 62
particular types.
d) The "importance of the OGA of the holding" is defined as the share of the OGA turnover in the total
turnoverof the holding (including direct payments). Dependingonthisestimated OGAshare, thefarms are
classified according to three percentage bands (from 0 to 10%, from 10% to 50%, more than 50%).
The method of classifying farms into farming systems, as used in this report is based on the EU farmtypology as set out in Commission Decision 78/463 and its subsequent amendments. The methodologyassigns a standard output (SO) to each type of farm animal and each hectare of crop. Farms arethen classified into groups called particular types and principal types, according to the proportion ofthe total SO of the farm which comes from the main enterprises after which the systems are named.For the purposes of adapting the EU typology to suit Irish conditions more closely, a re-grouping of thefarm types has been carried out as set out below (showing the EU description):
The Standard Output methodology only allows for one cattle system – particular type 460 – specialistcattle – rearing and fattening combined. In light of the Irish situation where weanling productioncomprises a large cohort of the farming population are classification of cattle farms has been carriedout. Where more than 50% of the SO is attributable to the Suckler Herd the farm is classified as CattleRearing.

Teagasc National Farm Survey 201885
The system titles refer to the dominant enterprise in each group and their results should not beconfused with those of individual farm enterprises. For example, the two specified cattle systems referto those farms where the greater proportion of their activity is cattle production, but there are manyother farms (including those in the tillage and other systems) that have a cattle enterprise. This can be seenclearly in the main tables section of this report showing the contribution of the enterprises to the grossoutput of farms in the various systems.
Dairying: Particular type 450 (specialist milk production)
Cattle Rearing: Particular types 460 (specialist cattle –rearing and fattening) – Where greater than or equal to50% of the SO is from suckler cows
Cattle Other: Particular types 460 (specialist cattle –rearing and fattening) – where less than 50% of the SOis from suckler cows
Sheep *: Particular types 481 (specialist sheep) and 482 (sheep and cattle* combined)
Tillage: Particular types 151 (Specialist cereals (other than rice), oilseeds and protein crops), 833 (Field cropscombined with non-dairying grazing livestock), 834 (Non-dairying grazing livestock combined with fieldcrops), 161 (Specialist root crops) and 166 (Various field crops combined)
Mixed Livestock *: Particular types 470 (Cattle – dairying, rearing and fattening combined), 484 (Variousgrazing livestock), 731 (Mixed livestock, mainly dairying), 844 (Various mixed crops*and livestock), 832(Dairying*combined with field crops* and 842 (Permanent crops*and grazing livestock combined)

Teagasc National Farm Survey 201886
Appendix 4: Glossary of Terms
AEOS: The Agri-Environment Options Scheme is jointly funded by the European Union and National Exchequer.The objectives of AEOS are to meet the challenges of conserving and promoting biodiversity, encouraging watermanagement and water quality measures and combating climate change.
Asset Values
Livestock: The average of the opening and closing inventories.
Machinery: Closing inventory value based on cost of replacement.
Land and Buildings: Market value of the farm as estimated by the farmer
Loans Closing Balance: The level of outstanding farm borrowing at year end.
Area Owned: The total map area of land owned. It does not include area under commonage rights.
Cash Flow: Cash flow is defined as cash income minus net new investment. It does not include changes inborrowing.
Cash Income: Net sales and receipts minus current cash expenditure. It is the approximate cash element offamily farm income.
Current Cash Expenditure: Expenditure on all current farm inputs, whether direct or overhead; excludesdepreciation.
DAS: Disadvantaged Area Scheme on a land area basis in Disadvantaged Areas only.
Demographically Viable % HH: Percentage of farm households which have at least one member below 45years of age
Depreciation: Calculated at replacement cost declining balance method at 10% for machinery and 5% forbuildings. The Capital Goods Price Index Building and Construction (i.e. Wages and Material), as published bythe CSO, is used in the calculation of building depreciation in 2004 NFS Report. In 2004 the CSOdiscontinued the Agricultural Buildings Price Index (used by the National Farm Survey in calculatingbuilding depreciation since 1985) and replaced it with the Capital Goods Price Index, Buildings andConstruction. This new index was used in calculating building depreciation from 2004 onwards and isupdated annually. Also from 2004 onwards buildings and machinery, exceeding 25 and 20 yearsrespectively, have been written off on an annual basis.Direct Costs: Costs directly incurred in the production of a particular enterprise, e.g., fertilisers, seedsand feeding stuffs; most items are detailed in the main tables. See (d) section of tables for greaterdetail.
Direct Subsidies/Payments: Non capital payments made to farmers under one or more of the CAP Schemes.These are shown in greater detail in the (c) section of the tables.
Economically Sustainable: Farm is not economically viable (refer to definition below) but farmer and/or spousehas an off-farm job.
Economically Viable: Family farm income is sufficient to cover family labour (remunerated at the agricultural wagerate) and provide a 5% return on non-land assets.
Economically Vulnerable: Farm is not viable and neither farmer nor spouse has an off-farm job
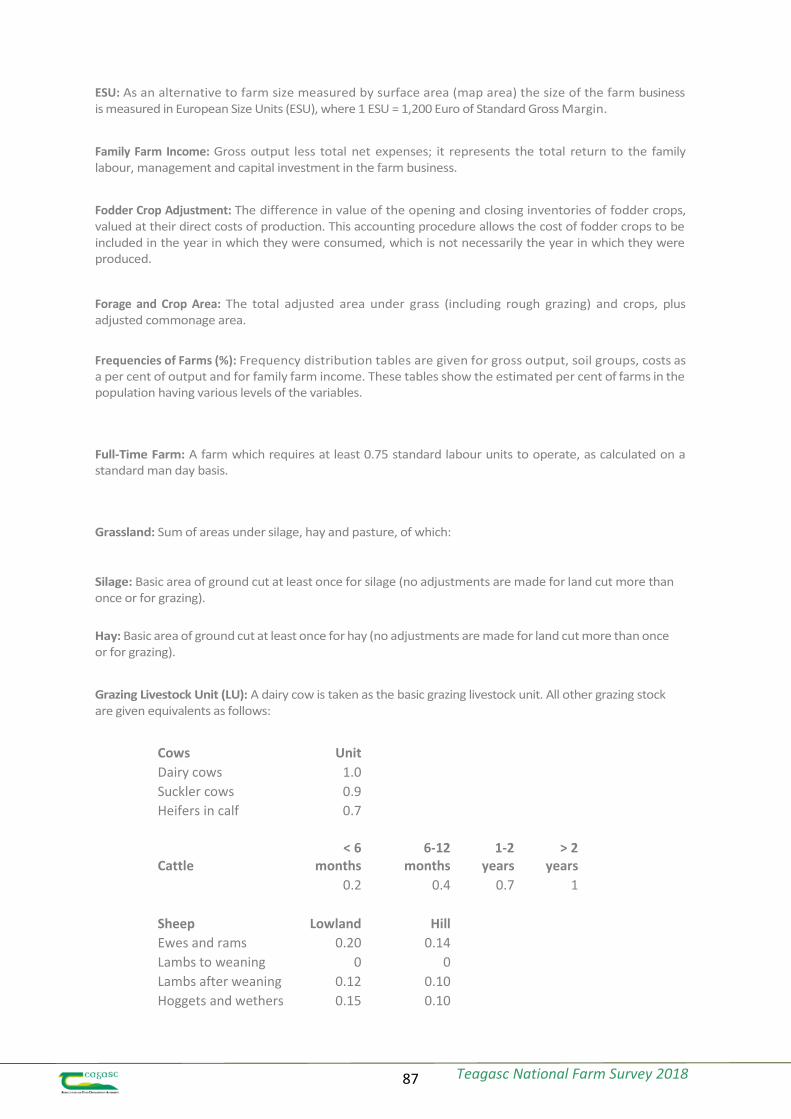
Teagasc National Farm Survey 201887
ESU: As an alternative to farm size measured by surface area (map area) the size of the farm businessis measured in European Size Units (ESU), where 1 ESU = 1,200 Euro of Standard Gross Margin.
Family Farm Income: Gross output less total net expenses; it represents the total return to the familylabour, management and capital investment in the farm business.
Fodder Crop Adjustment: The difference in value of the opening and closing inventories of fodder crops,valued at their direct costs of production. This accounting procedure allows the cost of fodder crops to beincluded in the year in which they were consumed, which is not necessarily the year in which they wereproduced.
Forage and Crop Area: The total adjusted area under grass (including rough grazing) and crops, plusadjusted commonage area.
Frequencies of Farms (%): Frequency distribution tables are given for gross output, soil groups, costs asa per cent of output and for family farm income. These tables show the estimated per cent of farms in thepopulation having various levels of the variables.
Full-Time Farm: A farm which requires at least 0.75 standard labour units to operate, as calculated on astandard man day basis.
Grassland: Sum of areas under silage, hay and pasture, of which:
Silage: Basic area of ground cut at least once for silage (no adjustments are made for land cut more thanonce or for grazing).
Hay: Basic area of ground cut at least once for hay (no adjustments are made for land cut more than onceor for grazing).
Grazing Livestock Unit (LU): A dairy cow is taken as the basic grazing livestock unit. All other grazing stockare given equivalents as follows:
Cows Unit
Dairy cows 1.0
Suckler cows 0.9
Heifers in calf 0.7
Cattle< 6
months6-12
months1-2
years> 2
years
0.2 0.4 0.7 1
Sheep Lowland Hill
Ewes and rams 0.20 0.14
Lambs to weaning 0 0
Lambs after weaning 0.12 0.10
Hoggets and wethers 0.15 0.10
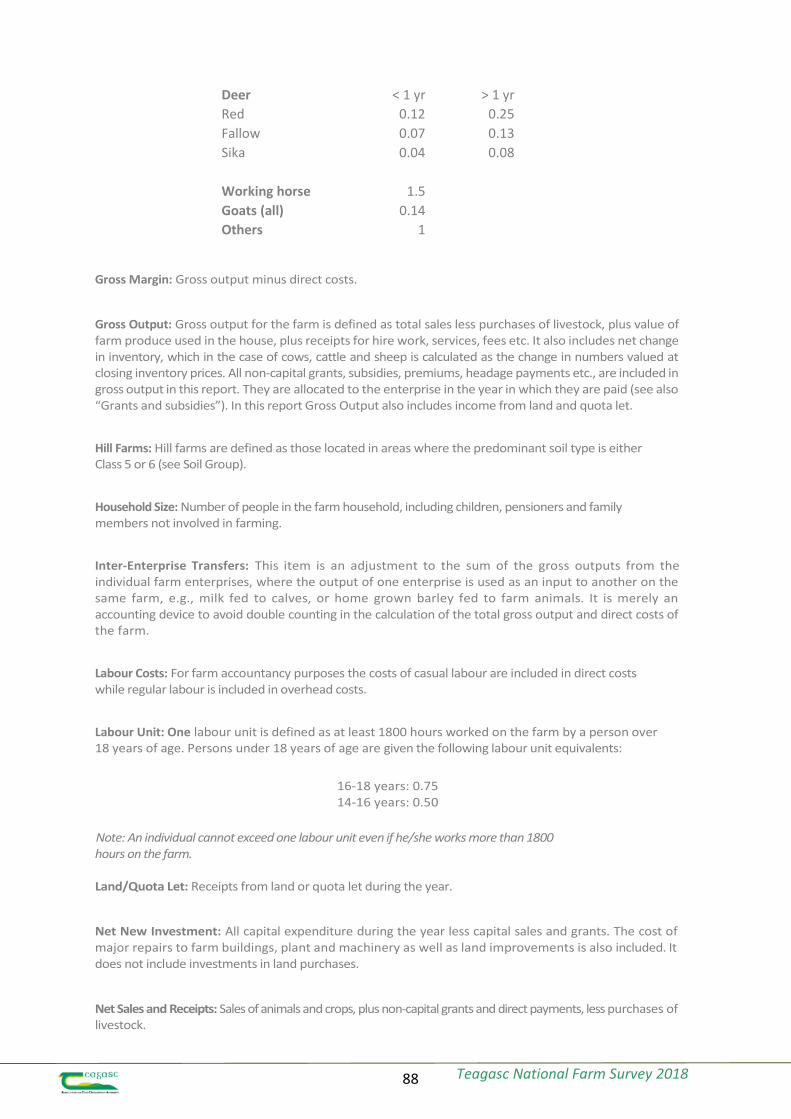
Teagasc National Farm Survey 201888
Deer < 1 yr > 1 yr
Red 0.12 0.25
Fallow 0.07 0.13
Sika 0.04 0.08
Working horse 1.5
Goats (all) 0.14
Others 1
Gross Margin: Gross output minus direct costs.
Gross Output: Gross output for the farm is defined as total sales less purchases of livestock, plus value offarm produce used in the house, plus receipts for hire work, services, fees etc. It also includes net changein inventory, which in the case of cows, cattle and sheep is calculated as the change in numbers valued atclosing inventory prices. All non-capital grants, subsidies, premiums, headage payments etc., are included ingross output in this report. They are allocated to the enterprise in the year in which they are paid (see also“Grants and subsidies”). In this report Gross Output also includes income from land and quota let.
Hill Farms: Hill farms are defined as those located in areas where the predominant soil type is eitherClass 5 or 6 (see Soil Group).
Household Size: Number of people in the farm household, including children, pensioners and familymembers not involved in farming.
Inter-Enterprise Transfers: This item is an adjustment to the sum of the gross outputs from theindividual farm enterprises, where the output of one enterprise is used as an input to another on thesame farm, e.g., milk fed to calves, or home grown barley fed to farm animals. It is merely anaccounting device to avoid double counting in the calculation of the total gross output and direct costs ofthe farm.
Labour Costs: For farm accountancy purposes the costs of casual labour are included in direct costswhile regular labour is included in overhead costs.
Labour Unit: One labour unit is defined as at least 1800 hours worked on the farm by a person over18 years of age. Persons under 18 years of age are given the following labour unit equivalents:
16-18 years: 0.7514-16 years: 0.50
Note: An individual cannot exceed one labour unit even if he/she works more than 1800hours on the farm.
Land/Quota Let: Receipts from land or quota let during the year.
Net New Investment: All capital expenditure during the year less capital sales and grants. The cost ofmajor repairs to farm buildings, plant and machinery as well as land improvements is also included. Itdoes not include investments in land purchases.
Net Sales and Receipts: Sales of animals and crops, plus non-capital grants and direct payments, less purchases oflivestock.

Teagasc National Farm Survey 201889
Off-Farm Job % HH: Percentage of households where the holder and/or spouse have an off-farm job.
Other Direct Costs: These include miscellaneous costs for crops e.g. polythene, baler twine, crop insurance;miscellaneous costs for livestock, e.g., mart commission, straw for bedding, super levy payments, farmingorganisation levies, Irish Dairy Board levy, research levies, disease eradication levies, bulk tank rental,detergents, etc.
Other Overhead Costs: Miscellaneous costs such as purchase of small tools, bank charges,subscriptions, postage, fire insurance, slurry, land annuities, depreciation of permanent crops,accountancy charges, advisory charges, water rates, protective clothing, etc.
Overhead Costs: Costs which cannot be directly allocated to a specific farm enterprise; sometimesreferred to as fixed costs. Most items are detailed in the main tables. See (d) section of tables forgreater detail.
Part-Time Farm: A farm which requires less than 0.75 standard labour units to operate, as calculated on astandard man day basis.Pensioner’s % HH: Percentage of households where the holder and/or spouse are in receipt of a pension ofany kind.
Per Cent of Population: These figures are estimates of the percentage of the population (of farms) that fallinto individual categories. For example in Table 01a 0.6% of the population (of farms) are estimated to beDairying farms with less than 10 UAA (Ha).
Remainder of Farm: Land covered by woods, areas not in agricultural use for economic, social or otherreasons but which could be so used. It also includes ground covered by paths, roads, buildings or land whichcannot be farmed, e.g., quarries, barren land, swamps, areas under water, etc.
Regions: Regional data from the Teagasc NFS are presented for the updated NUTS regions (Commission Regulation2016/2066). In line with EU methodology, territorial units are classified for statistical purposes.
On this basis the NUTS II regions for Ireland are as follows:
Northern and Western: Leitrim, Sligo, Cavan, Donegal, Monaghan, Galway, Mayo, Roscommon
Eastern and Midland: Dublin, Kildare, Meath, Wicklow, Louth, Laois, Longford, Offaly, Westmeath
Southern: Limerick, Tipperary, Clare, Wexford, Kilkenny, Carlow, Waterford, Cork, Kerry
And the NUTS III regions relate to the following counties:
Region 1 – Border: Leitrim, Sligo, Cavan, Donegal, Monaghan
Region 3 – Dublin & Mid-East: Dublin, Louth, Kildare, Meath, Wicklow
Region 4 – Midlands: Laois, Longford, Offaly, Westmeath
Region 5 – Mid-West: Clare, Limerick, Tipperary

Teagasc National Farm Survey 201890
Region 6 – South-East: Carlow, Kilkenny, Wexford, Waterford
Region 7 – South-West: Cork, Kerry
Region 8 – West: Galway, Mayo, Roscommon
The Key changes from the previous NUTS III regions relate to the fact that Dublin is now amalgamated intoRegion 3 (Dublin and Mid-East) which also now includes Louth (previously included in Region 1, Border) andTipperary (North and South) are both now included in Region 5 (Mid-West).
REPS: Rural Environmental Protection Scheme - the REPS 4 which was introduced in August 2007 was closedto new entrants in July 2009 (refer to Agri-Environment Options Scheme (AEOS).
Rough Grazing Grazed unreclaimable bogland, grazed mountain of known area and grazed lowlandpartially covered by scrub, bushes or rock. It does not include land with impeded drainage unless subjectto flooding.
Single Payment Scheme The Single Payment Scheme introduced following decoupling of direct paymentsin 2005 is applicable to farmers who actively farmed during the reference years 2000, 2001 and 2002, whowere paid Livestock Premia and/or Arable Aid in one or more of those years and who will continue to farm inthe current year. The gross Single Payment is based on the average number of animals and/or the averagenumber of hectares (in the case of Arable Aid) on which payments were made in the three reference years.
Soil Group Farms are classified into 3 major groups depending on their use range. Soil group 1 has thewidest use range and soil group 3 contains farms with limited use range.
Standard Man Day (SMD) Eight hours of work supplied by a person over 18 years of age. The numberof SMD required per hectare for the different crops, and per head for various categories of livestock, isused to calculate the total number of SMD required to operate the farm.
System of Farming See Appendices B and C
Total Area Map area of land owned, plus land rented, minus land let. It is equal to UAA plus `remainder offarm'.Total Net Expenses Direct costs plus overhead costs. Grants and discounts which reduce expenditure, ratherthan contribute to gross output, will have been deducted.
Unemployment etc. %HH Percentage of households where the holder and/or spouse are in receipt ofsocial assistance payment (other than pension).Utilised Agricultural Area (UAA) Area under crops and pasture plus the area (unadjusted) of roughgrazing. It is the total area owned, plus area rented, minus area let, minus area under remainder offarm.

Teagasc National Farm Survey 201891
Appendix 5: Revised 2017 Teagasc NFS Tables
Table - 08A (2017) Farm Financial Results by System of Farming - All Farms
System Dairying
Cattle
Rearing
Cattle
Other Sheep Tillage
Mixed
Livestock All Sizes
No. of Farms in Sample 309 152 218 126 72 19 896
Per Cent of Population 17.4 25.3 32.9 15.4 7.4 1.4 100
Overall Results (€)
Gross Output 218,727 37,454 49,261 50,451 104,589 206,294 82,357
of which Land / Quota Let 268 168 758 357 1,446 - 501
Direct Payments / Subs 20,011 13,063 15,414 18,613 22,900 25,324 16,812
- Direct Costs 75,915 12,726 16,799 16,752 34,557 89,168 28,427
=Gross Margin 142,812 24,728 32,462 33,699 70,032 117,126 53,931
- Overhead Costs 53,983 14,087 16,348 16,342 33,984 52,050 24,157
= Family Farm Income 88,829 10,642 16,115 17,357 36,048 65,076 29,774
Net Sales & Receipts 216,853 38,136 48,980 49,020 102,354 203,225 81,680
- Current Cash Expenditure 115,322 22,306 28,743 29,077 59,816 126,817 45,976
= Cash Income (Approx) 101,530 15,830 20,237 19,942 42,539 76,408 35,704
-Net New Investment 24,190 4,257 3,708 5,344 7,849 21,319 8,231
=Cash Flow 77,341 11,574 16,529 14,598 34,689 55,089 27,474
Asset Values (€)
Machinery 64,545 18,845 18,114 17,667 62,078 63,241 30,236
Livestock: Breeding 98,044 28,316 12,547 25,076 6,021 77,020 33,826
Trading 31,933 16,687 40,894 21,281 36,920 64,368 30,213
Land & Buildings 1,044,719 458,802 653,871 578,516 1,204,413 1,165,684 709,139
Gross New Investment 26,607 4,810 4,764 6,282 8,584 23,383 9,369
Loans Closing Balance 68,467 5,562 12,700 8,509 21,770 55,977 21,258
Total Standard Output (TSO) 171,059 23,121 29,380 38,253 65,815 163,543 58,496
Distribution - % of Farms
Gross Output
0 - 100000.4 2.3 0.6 2.7 0.0 0.0 1.3
10,000 - 20,000 0.4 17.4 20.6 12.6 5.2 7.9 13.7
20,000 - 40,000 1.2 48.5 34.2 34.3 23.7 7.9 30.9
40,000 - 60,000 3.8 17.7 22.2 23.8 12.5 0.0 17.1
60,000 - 100,000 13.3 13.2 13.6 18.0 22.7 10.2 14.8
> 100,000 80.8 0.9 8.8 8.6 36.0 74.0 22.3
=Total 100 100 100 100 100 100 100

Teagasc National Farm Survey 201892
Table - 08B (2017) Resources per Farm by System of Farming - All Farms
System Dairying
Cattle
Rearing
Cattle
Other Sheep Tillage
Mixed
Livestock All Sizes
No. of Farms in Sample 309 152 218 126 72 19 896
Per Cent of Population 17.4 25.3 32.9 15.4 7.4 1.4 100
LAND (ha)
Area Owned 47.3 29.3 33.4 41.6 52.1 62.8 37.8
Total Area 61.3 34.0 36.3 49.7 61.6 77.1 44.6
Tillage 1.2 0.0 0.8 0.5 36.5 1.5 3.3
of which Total Cereals 0.7 0.0 0.6 0.3 31.6 1.3 2.7
Potatoes 0.0 0.0 0.0 0.0 0.0 0.0 0.0
Grassland Silage 19.7 8.5 8.7 6.3 4.9 23.8 10.1
Hay 0.4 0.7 0.7 0.8 2.5 0.3 0.8
Pasture 35.9 21.0 22.6 30.4 12.8 47.8 25.4
Rough Grazing 0.9 1.4 1.1 8.2 0.4 0.4 2.2
U.A.A 58.9 32.6 35.0 47.3 59.5 74.0 42.9
Remainder of Farm 2.4 1.4 1.3 2.4 2.1 3.1 1.8
Forage & Crop Acreage 57.6 30.8 33.4 41.1 57.8 73.6 40.6
LIVESTOCK
Cattle
Dairy Cows 77.9 0.0 0.0 0.4 0.0 44.3 14.3
Other Cows 1.9 24.0 10.4 10.2 4.3 13.4 11.9
Heifers-in-Calf 10.6 1.7 0.9 0.8 0.3 5.2 2.8
< 1 Year Old 46.2 20.9 22.0 11.3 8.1 47.9 23.6
1 - 2 Year Old Male 8.5 2.5 16.6 4.1 13.1 19.0 9.4
1 - 2 Year Old Female 15.0 5.1 9.6 4.6 5.7 18.5 8.5
=> 2 Year Old Male 0.9 0.2 6.2 1.2 5.7 4.8 2.9
=> 2 Year Old Female 1.0 0.9 2.5 0.8 1.5 3.3 1.5
Bulls 1.0 0.8 0.4 0.4 0.2 1.2 0.6
Total Cattle 162.1 56.1 68.4 33.8 38.8 156.9 75.4
Sheep (avg. no)
Ewes 2.4 1.5 9.4 133.0 14.6 63.8 26.4
Other Sheep 2.1 2.1 10.6 127.1 15.4 56.9 26.0
Total Sheep 4.4 3.6 20.0 260.1 30.1 120.7 52.4
Grazing Livestock Units
Dairy Cows 77.9 0.0 0.0 0.4 0.0 44.3 14.3
Other Cattle 41.2 36.0 44.3 21.6 27.4 64.6 37.2
Sheep 0.6 0.5 2.6 32.3 4.0 14.6 6.6
Horses 0.2 0.3 0.3 0.3 0.2 0.3 0.3
Total Livestock Units 119.8 36.8 47.2 54.6 31.6 123.8 58.3
LABOUR UNITS
Family 1.4 1.0 0.9 1.1 1.0 1.5 1.0
Total 1.6 1.0 0.9 1.1 1.1 1.8 1.1

Teagasc National Farm Survey 201893
Table - 08C (2017) Gross Output and Direct Payments by System of Farming - All Farms
System Dairying
Cattle
Rearing
Cattle
Other Sheep Tillage
Mixed
Livestock All Sizes
No. of Farms in Sample 309 152 218 126 72 19 896
Per Cent of Population 17.4 25.3 32.9 15.4 7.4 1.4 100
(€) GROSS OUTPUT
LIVESTOCK
Dairying 165,454 - - 638 - 86,705 30,175
of which milk 161,156 - - 651 - 85,969 29,418
Cattle 37,143 23,968 30,298 14,321 19,227 50,021 26,883
of which Beef Data / Beef
Genomics 6 1,024 437 500 161 479 501
Sheep & Wool 291 321 1,626 17,004 2,107 9,981 3,595of which Sheep Coupled
Payments - - - - - - -
Pigs - - - - 43 13,018 193
Poultry - - - - - 24,261 354
Horses 163 79 174 232 116 (67) 149
Other - - - - - - -
Sub-Total Livestock 203,051 24,368 32,098 32,195 21,492 183,919 61,351
of which Disease Compensation 93 26 51 14 5 - 42
CROPS
Wheat 25 - 13 - 12,714 - 952
Barley - Feeding 560 12 600 295 22,483 1,483 2,033
Barley - Malting 214 - 39 - 2,822 - 259
Oats 12 - 45 45 4,247 - 339
Potatoes - - - - 131 - 10
Other 775 585 1,013 268 14,724 113 1,752
of which Forestry Premium 289 250 410 89 408 - 293
Sub-Total Crops 1,586 597 1,710 608 57,120 1,596 5,345
TOTAL LIVESTOCK & CROPS 204,637 24,965 33,808 32,803 78,613 185,515 66,696
Machinery Hire Revenue 321 456 129 93 1,736 12 357
Other Current Receipts 339 138 300 224 1,905 1,146 385+ Decoupled Direct Payments /
Sub 19,162 11,502 14,221 16,886 21,891 24,305 15,520
of which Single Farm Payment16,696 7,957 10,808 11,715 19,505 19,753 12,026
" REPS/GLAS 516 1,500 1,466 2,160 1,634 584 1,416
" DAS 1,613 1,900 1,565 2,262 313 2,635 1,689
" Other Subsidies 800 384 644 1,867 874 1,874 829
" AEOS 48 34 131 151 55 - 88
+ Income from Land Let 268 168 758 357 1,446 - 501
+ Income from Quota Let - - - - - - -
- Inter-Enterprise Transfers 6,305 13 292 135 1,948 4,819 1,433
TOTAL GROSS OUTPUT 218,727 37,454 49,261 50,451 104,589 206,294 82,357

Teagasc National Farm Survey 201894
Table - 08D (2017) Direct and Overhead Costs by System of Farming - All Farms
System Dairying
Cattle
Rearing
Cattle
Other Sheep Tillage
Mixed
Livestock All Sizes
No. of Farms in Sample 309 152 218 126 72 19 896
Per Cent of Population 17.4 25.3 32.9 15.4 7.4 1.4 100
DIRECT COSTS (€)
Purchased Concentrates 29,524 3,545 6,053 6,483 3,348 47,701 9,978
Purchased Bulky Feed 3,221 516 731 719 264 990 1,077
Fertiliser 12,059 2,249 2,831 2,564 10,273 10,882 4,918
Crop Protection 692 104 281 215 8,123 843 887
Purchased Seed 500 55 187 121 3,671 736 464
Hire of Machinery 9,267 2,637 3,117 1,969 6,721 7,835 4,225
Transport 243 42 214 48 169 165 145
Livestock (A.I. Vet etc.) 10,735 2,092 1,876 2,934 1,050 8,766 3,676
Casual Labour 747 5 108 67 22 2,520 216
Other 8,800 1,245 1,122 1,468 1,097 8,703 2,653
Sub-Total 75,787 12,488 16,518 16,589 34,739 89,142 28,240
Fodder Crop Adjustment 130 238 309 177 (200) 26 198
TOTAL DIRECT COSTS75,915 12,726 16,799 16,752 34,557 89,168 28,427
OVERHEAD COSTS (€)
Rent of Conacre 5,794 1,016 1,201 1,391 4,507 5,063 2,285
Car, Electricity, Phone 6,753 2,258 2,582 2,717 2,505 8,049 3,321
Current Hired Labour 5,017 279 498 393 2,512 1,993 1,384
Interest Charges 3,042 282 651 593 1,211 3,376 1,046
Machinery Depreciation 7,196 2,116 2,152 2,015 6,995 7,306 3,435
Machinery Operating 9,047 2,792 3,244 3,303 8,603 9,531 4,639
of which Fuel & Lub 3,118 1,088 1,255 1,333 3,625 4,169 1,767
Buildings Depreciation 5,941 1,780 1,549 1,494 1,482 6,184 2,427
Buildings Maintenance 2,448 549 781 794 698 2,111 1,028
Land Improvement Depreciation 1,004 207 252 245 266 813 380
Land Improvement Maintenance 1,815 706 992 941 1,116 1,269 1,068
Other 5,926 2,099 2,444 2,456 4,089 6,356 3,144
OVERHEAD COSTS 53,983 14,087 16,348 16,342 33,984 52,050 24,157
TOTAL NET EXPENSES129,900 26,813 33,175 33,108 68,523 141,218 52,594
Distribution - % of farms
Costs % Output
< 50 22 10 19 21 13 5 17
50 -< 60 34 13 17 16 31 39 20
60 -< 70 28 22 16 22 22 15 21
70 -< 80 12 21 18 12 20 31 17
80 -< 90 3 11 13 14 9 10 10
90 + 1 23 17 15 5 0 14
=Total100 100 100 100 100 100 100
Avg % 60 76 71 68 65 65 69

Teagasc National Farm Survey 201895
Table - 08E (2017) Demograhic Data by System of Farming - All Farms
System Dairying
Cattle
Rearing
Cattle
Other Sheep Tillage
Mixed
Livestock All Sizes
No. of Farms in Sample 309 152 218 126 72 19 896
Per Cent of Population 17.4 25.3 32.9 15.4 7.4 1.4 100
Holder
Age of Holder 52.2 54.9 56.6 58.4 59.3 56.1 55.9
Marital Status - Married % 82.3 61.2 69.1 77.5 66.4 61.4 70.4
Widowed % 3.0 5.3 3.1 4.9 5.8 7.8 4.2
Single % 14.0 27.1 24.3 13.9 25.9 30.8 21.8
Separated % 0.2 6.4 3.6 3.1 1.9 0.0 3.5
=Total 100 100 100 100 100 100 100
Household
Household Size (no.) 3.3 2.6 2.6 2.7 2.6 3.0 2.8
< 24 (no.) 1.1 0.6 0.7 0.7 0.6 0.6 0.7
< 24 % HH 50.8 26.5 31.5 32.4 28.7 22.9 33.4
25 - 44 (no.) 0.6 0.4 0.4 0.3 0.4 0.7 0.4
25 - 44 % HH 40.3 30.4 25.6 21.7 30.1 35.6 29.2
Demograph. Viable % HH 79.0 62.1 55.5 58.1 55.6 71.6 61.9
Off-farm sources of income --
Holder and/or Spouse
Off-farm Job % HH 55.5 51.2 51.4 48.9 44.1 38.6 51.0
Off-farm Job Holder % HH 11.3 36.6 42.2 33.8 28.7 10.3 32.6
Off-farm Job Spouse % HH 49.3 28.3 29.5 32.4 26.3 28.2 32.8
Pensioners (no.) 0.2 0.4 0.4 0.5 0.4 0.3 0.4
Pensioners % HH 11.1 28.4 30.7 34.8 24.1 22.9 26.7
Unemployment Etc. (no.) 0.0 0.1 0.1 0.1 0.0 0.0 0.1
Unemployment Etc. % HH 2.0 6.1 7.2 6.8 1.0 0.0 5.4
Distribution - % of farms
F.F.I. (€) < 3,500 1 25 23 17 7 0 17
F.F.I. (€) < 5,000 1 31 27 21 12 0 21
FFI 5,000 - 10,000 1 28 22 15 6 16 18
FFI 10,000 - 20,000 3 25 23 31 26 0 21
FFI 20,000 - 30,000 7 8 15 17 12 8 12
FFI 30,000 - 50,000 15 7 8 12 18 26 11
FFI 50,000 - 70,000 15 0 3 2 12 8 5
FFI 70 TO100,000 24 0 1 1 8 13 6
>100,000 33 0 1 0 6 30 7

Teagasc National Farm Survey 201896