Embed Size (px)
Citation preview

TEACHING WRITTEN ANNOUNCEMENT
THROUGH GALLERY WALK TECHNIQUE
(An Experimental Study of Eighth Grade Students at SMP Muhammadiyah 1 Weleri,
Kabupaten Kendal, in the Academic Year of 2013/2014)
a final project
submitted in partial fulfillment of the requirements
for the degree of Sarjana Pendidikan
in English
by
A’IN RATNA MULYANI
2201409058
ENGLISH DEPARTMENT
FACULTY OF LANGUAGES AND ARTS
SEMARANG STATE UNIVERSITY
2014

ii

iii

iv
MOTTO AND DEDICATION
“Verily, along with every hardship is relief.”
(Surah Al-Insyirah: 5)
“Kebodohan Membuat Saya Malu”
To
My parents (Kumiti, Tuparyono)

v
ACKNOWLEDGEMENT
First and foremost, I would like to express my gratitude to Allah SWT, the
Almighty for the endless blessing and mercy given to me in every single of my
seconds, for the health and power so I could finally finish my final project. Peace
and blessing be upon the prophet Muhammad SAW who guides the people to
God’s path. My deepest gratitude goes to my beloved parents, Kumiti and
Tuparyono, for giving me never ending pure love, best pray and extraordinary
spirit.
I would like to express my gratitude to Drs. Ahmad Sofwan, M.A., Ph.D.,
my first advisor, and Galuh Kirana Dwi Areni, S.S., M.Pd. as my second advisor,
for all guidance and suggestions during the completion of this final project. Not to
mention, Prayudias Margawati, S.Pd., M.Hum., the first examiner, for her
supporting advice to this final project. I further wish to extend my special thanks
to all the lecturers of English Department of Semarang State University for the
very valuable lessons during my college.
I also would like to thank to the headmaster of SMP Muhammadiyah 1
Weleri, Suparman, S.Pd. for his permission and assistance to do this research in
his school and surely I would like to thank to the English teacher of SMP
Muhammadiyah 1 Weleri, Widyaningrum, S.Pd. in helping and accompanying me
during the research with her kindness and to the students of VIII-A, VIII-B, and
VIII-C year of 2013/2014 who were willing to cooperate in this research.

vi
Last but not least, my thanks go to my bestfriends (Mar’atush Sholihah
Romadhoni, Isna Pratiwi, Rani Candrakirana Permanasari, Rini Dwijayanti, Dwi
Iswahyuni, Ita Octaviyanti, Rizka Ikhtiari Fajrianingrum and Shinta Arianti Siwi)
and all my friends of English department’09 for their love, cheer and support.
Finally, I realize that this final project is still far from being perfect.
Hence, critics and suggestions are expected for betterment of this final project. I
have a great expectation that my study will be useful for all readers.
The Researcher

vii
ABSTRACT
Mulyani, A’in Ratna. 2014. Teaching Written Announcement through Gallery
Walk Technique (An Experimental Study of Eighth Grade Students at
SMP Muhammadiyah 1 Weleri, Kabupaten Kendal, in the Academic Year
of 2013/2014). Final Project. English Department, Faculty of Languages
and Arts, Semarang State University. Advisor I: Drs. Ahmad Sofwan,
M.A., Ph.D; Advisor II: Galuh Kirana Dwi Areni, S.S., M.Pd.
Keywords: Writing Skill, Announcement Text, Gallery Walk Technique
This study was conducted due to the difficulties the students had in writing
English. According to the curriculum for junior high school, announcement text
was included in short functional text. For the eight graders, announcement text
was given in a form of writing competence.
The objective of this study was to find out whether there was significant
difference in the achievement of writing announcement text between the eighth
grade students of SMP Muhammadiyah 1 Weleri in the academic year of
2013/2014 who were taught by using Gallery Walk technique and those who were
taught by using conventional method.
To meet this objective, an experimental research design called pretest-
posttest control group design was applied. The research was carried out at SMP
Muhammadiyah 1 Weleri. The subjects of the research were two classes. The
experimental group was the students of VIII-A which consisted of 28 students and
was taught by using Gallery Walk technique. The control group was the students
of VIII-B which consisted of 28 students and was taught by using conventional
method. The data of the research were obtained from the writing test on pre-test
and post-test.
Based on the pre-test analysis, the value of tvalue was 0.38, while the value
of ttable was 1.67. Since the value of tvalue was lower than the ttable, it meant that
there was no significant difference in the students’ achievement of writing
announcement text between experimental and control groups on pre-test.
Meanwhile, based on the post-test analysis, the value of tvalue was 1.76.
Compared with the value of ttable, 1.67, the tvalue was higher than the ttable. It meant
that there was significant difference in the students’ achievement of writing
announcement text after the treatment was given where the students’ achievement
in experimental group was higher or better than the control group.
The result above indicates that the use of Gallery Walk technique in
teaching writing announcement text brought about significant improvement. In
addition, Gallery Walk technique also gave some advantages in its application
such as giving chance to move around the classroom, directing students’ focus and
interrupting the lethargy.

viii
TABLE OF CONTENTS
ACKNOWLEDGEMENT .................................................................................. v
ABSTRACT ......................................................................................................... vii
TABLE OF CONTENTS .................................................................................... viii
LIST OF TABLE ................................................................................................ xi
LIST OF FIGURES ............................................................................................ xii
LIST OF APPENDIXES .................................................................................... xiii
CHAPTER
I INTRODUCTION
1.1 Background of the Study ........................................................................ 1
1.2 Reasons for Choosing the Topic ............................................................. 4
1.3 Statement of the Problem ........................................................................ 5
1.4 Objective of the Study ............................................................................ 5
1.5 Hypothesis............................................................................................... 5
1.6 Significance of the Study ........................................................................ 6
1.7 Limitation of the Study .......................................................................... 7
1.8 Definition of Term ................................................................................. 7
1.9 Outline of the Report .............................................................................. 8
II REVIEW OF RELATED LITERATURE
2.2 Review of the Previous Studies .............................................................. 10
2.3 Review of the Theoretical Study............................................................. 12
2.3.1 General Concept of Writing .................................................................... 12

ix
2.2.1.1 Definition of Writing .............................................................................. 12
2.2.1.2 Steps in Writing ...................................................................................... 13
2.2.1.3 Genres of Writing .................................................................................. 15
2.2.1.4 Types of Writing Performance................................................................ 15
2.2.1.5 Micro- and Macroskills of Writing ........................................................ 17
2.2.2 Teaching Techniques .............................................................................. 18
2.2.3 Gallery Walk Technique ......................................................................... 20
2.2.3.1 Definition ............................................................................................... 20
2.2.3.2 Procedure ................................................................................................ 20
2.2.3.3 Gallery Walk Technique in Teaching Writing........................................ 22
2.2.4 Short Functional Text ............................................................................. 23
2.2.5 Announcement ........................................................................................ 25
2.3 Theoretical Framework ........................................................................... 26
III METHODS OF INVESTIGATION
3.1 Research Design...................................................................................... 28
3.2 Population and Sample ........................................................................... 29
3.2.1 Population ............................................................................................... 29
3.2.2 Sample .................................................................................................... 30
3.3 Instrument for Collecting Data ............................................................... 30
3.4 Method of Collecting Data...................................................................... 31
3.5 Method of Analyzing Data...................................................................... 34
3.5.1 Analysis of Early Stage ........................................................................... 34
3.5.2 Analysis of the Final Stage ..................................................................... 37

x
IV DATA ANALYSIS AND DISCUSSION
4.1 Pre-test Analysis .................................................................................... 41
4.1.1 Normality of the Pre-test Scores ............................................................ 43
4.1.2 Homogeneity of the Pre-test Scores ....................................................... 43
4.1.3 T-test for Pre-test .................................................................................... 44
4.2 Treatment Processes ............................................................................... 46
4.2.1 Treatment for Experimental Group ......................................................... 46
4.2.2 Treatment for Control group ................................................................... 49
4.3 Post-test Analysis ................................................................................... 51
4.3.1 Normality of the Post-test Scores .......................................................... 53
4.3.2 Homogeneity of the Post-test Scores ..................................................... 54
4.3.3 T-test for Post-test ................................................................................... 55
4.4 Discussion of the Research Findings ...................................................... 56
4.5 Some Obstacles in Doing the Research .................................................. 57
V CONCLUSION AND SUGGESTIONS
5.1 Conclusion .............................................................................................. 59
5.2 Suggestions ............................................................................................. 60
BIBLIOGRAPHY ............................................................................................... 61
APPENDIXES ..................................................................................................... 63

xi
LIST OF TABLE
Table Page
3.1 Analytic Scale for Rating Composition Task .............................................. 32

xii
LIST OF FIGURES
Figure Page
2.1 Framework to figure out the difference between using Gallery Walk
and conventional method in teaching writing announcement text .............. 27
4.1 The Mean of the Experimental and the Control Groups on Pre-test ........... 42
4.2 The Mean of the Experimental and the Control Groups on Post-test .......... 53
xiii
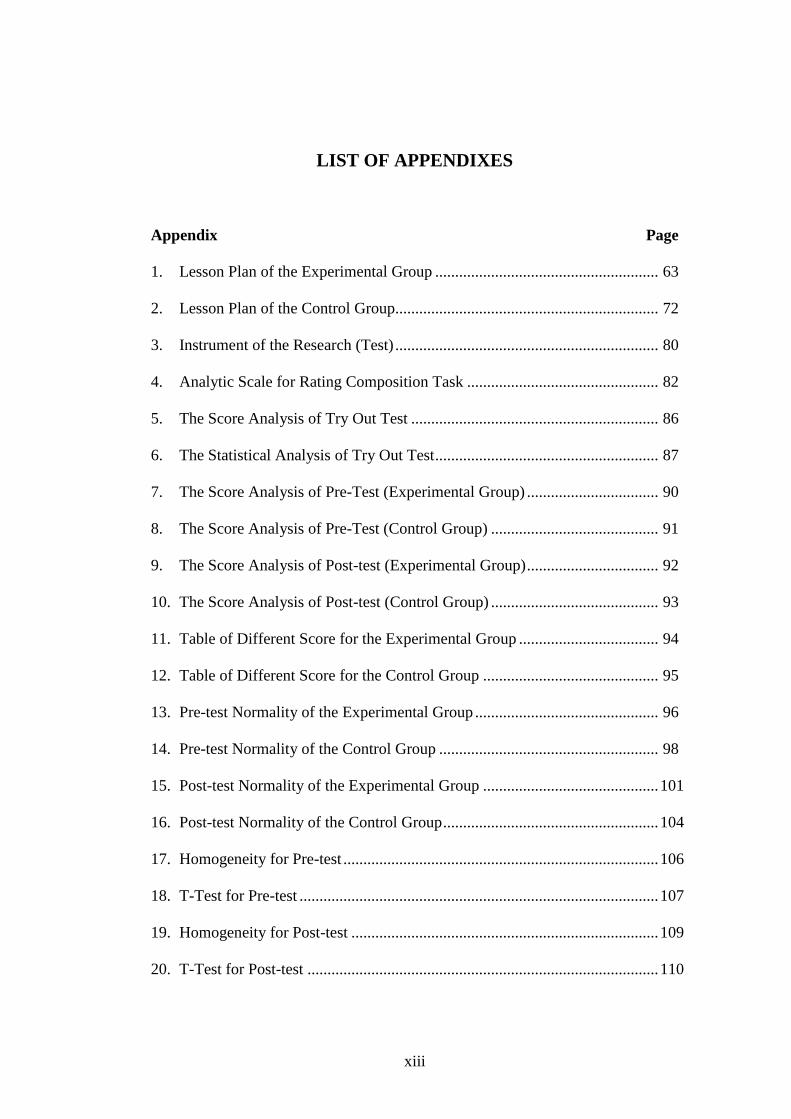
LIST OF APPENDIXES
Appendix Page
1. Lesson Plan of the Experimental Group ........................................................ 63
2. Lesson Plan of the Control Group.................................................................. 72
3. Instrument of the Research (Test) .................................................................. 80
4. Analytic Scale for Rating Composition Task ................................................ 82
5. The Score Analysis of Try Out Test .............................................................. 86
6. The Statistical Analysis of Try Out Test ........................................................ 87
7. The Score Analysis of Pre-Test (Experimental Group) ................................. 90
8. The Score Analysis of Pre-Test (Control Group) .......................................... 91
9. The Score Analysis of Post-test (Experimental Group) ................................. 92
10. The Score Analysis of Post-test (Control Group) .......................................... 93
11. Table of Different Score for the Experimental Group ................................... 94
12. Table of Different Score for the Control Group ............................................ 95
13. Pre-test Normality of the Experimental Group .............................................. 96
14. Pre-test Normality of the Control Group ....................................................... 98
15. Post-test Normality of the Experimental Group ............................................ 101
16. Post-test Normality of the Control Group ...................................................... 104
17. Homogeneity for Pre-test ............................................................................... 106
18. T-Test for Pre-test .......................................................................................... 107
19. Homogeneity for Post-test ............................................................................. 109
20. T-Test for Post-test ........................................................................................ 110

xiv
21. Documentation ............................................................................................... 112
22. SK Pelaksanaan Penelitian Skripsi
23. Example of Experimental Group’s Student Worksheet on Pre-test
24. Example of Experimental Group’s Student Worksheet on Post-test
25. Example of Control Group’s Student Worksheet on Pre-test
26. Example of Control Group’s Student Worksheet on Post-test

1
CHAPTER I
INTRODUCTION
This chapter deals with the background of the study, reasons for choosing the
topic, statement of the problem, objective of the study, hypothesis, significance of
the study, limitation of the study, definition of term, and the outline of the report.
1.1 Background of the Study
English, as an international language, is used in many countries as a means of
communication and it has a great function in many aspect of life such as in
politics, business, trade, and diplomatic relationship. Furthermore, English also
cannot be separated from the development of technology, science, economics, and
education. Considering the importance of English, Indonesian government has
chosen English as the first foreign language and fundamental subject in our
educational system. English is taught as one of the main compulsory subjects in
junior and senior high school.
In educational system in Indonesia, English is included in curriculum for
both junior and senior high school levels. In the Kurikulum Tingkat Satuan
Pendidikan (KTSP) for SMP/MTs which is also called 2006 Competence-Based
Curriculum, the teaching learning of English has the purpose to develop four
language skills: listening, speaking, reading and writing.
Writing is a skill that is required in written communication. It requires
complex thinking. A good writing is not always easy and may be a challenge even
2
for the best students. Palmer, Hafner, and Sharp (1994:7) state that “if the goal of
writing is to communicate meaning to ourselves and others, thinking will occur as
the writer (1) generates ideas, thoughts, and images; (2) creates an order to those
thoughts; and (3) communicates this meaning to others through interesting text
that, ideally, is well written.”
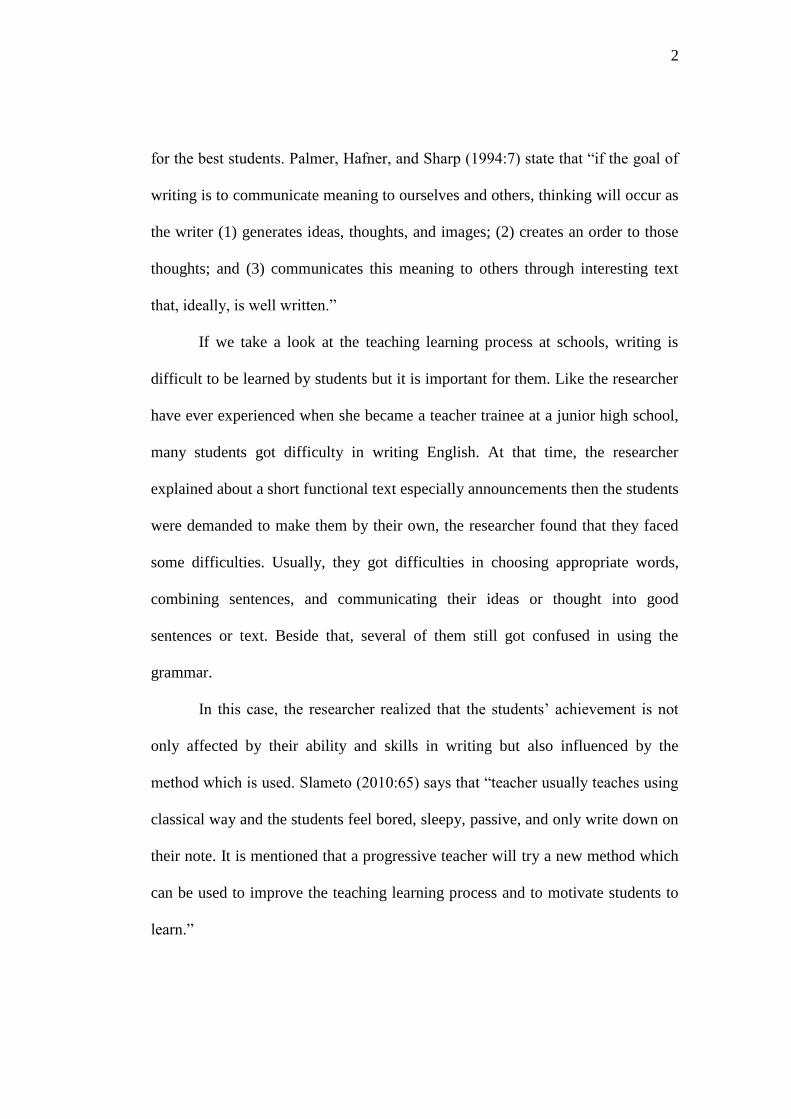
If we take a look at the teaching learning process at schools, writing is
difficult to be learned by students but it is important for them. Like the researcher
have ever experienced when she became a teacher trainee at a junior high school,
many students got difficulty in writing English. At that time, the researcher
explained about a short functional text especially announcements then the students
were demanded to make them by their own, the researcher found that they faced
some difficulties. Usually, they got difficulties in choosing appropriate words,
combining sentences, and communicating their ideas or thought into good
sentences or text. Beside that, several of them still got confused in using the
grammar.
In this case, the researcher realized that the students’ achievement is not
only affected by their ability and skills in writing but also influenced by the
method which is used. Slameto (2010:65) says that “teacher usually teaches using
classical way and the students feel bored, sleepy, passive, and only write down on
their note. It is mentioned that a progressive teacher will try a new method which
can be used to improve the teaching learning process and to motivate students to
learn.”
3
In this study, the researcher would like to use Gallery Walk technique to
teach writing announcement text. Based on the competence standard of the eighth
grade of Junior High School, in the sixth competence standard, it is stated that
“Mengungkapkan makna dalam teks tulis fungsional dan esei pendek sederhana
berbentuk descriptive, dan recount untuk berinteraksi dengan lingkungan
sekitar.” And in the point 6.1 of basic competence, it is stated that
“Mengungkapkan makna dalam bentuk teks tulis fungsional pendek sederhana
dengan menggunakan ragam bahasa tulis secara akurat, lancar, dan berterima
untuk berinteraksi dengan lingkungan sekitar.”
Based on the competence standard and basic competence above, the
students of junior high school should master short functional texts. One kind of
short functional texts that students have to master is announcement text.
Announcement is a statement in spoken or written form that makes something
known publicly. It should be brief and could answer what, when, where, and who.
Often it includes why and how. It seems that it is easy to make announcement, but
most of students always feel difficult when they are asked to make their own. In
order to help students in writing announcement text, the researcher will try to use
Gallery Walk technique.
“Gallery Walk is a discussion technique that gets students out of their
chair and actively involved in synthesizing important science concept, writing,
and public speaking” (Francek, 2006). In this technique, the researcher will divide
the students into five groups. Each group will rotate and answer some questions
based on the announcement given. Here, the group will practice as a small group

4
discussion. After they have finished answering all questions, there will be a class
discussion. By using Gallery Walk, each group also can leave a comment or
feedback to other groups’ works. In this research, the researcher wants to see the
different achievement in writing announcement between the students who are
taught using Gallery Walk technique and those who are taught using conventional
method. It is hoped that using Gallery Walk technique can improve the students’
skill in writing announcement text.
1.2 Reasons for Choosing the Topic
In line with the background of the study, the reasons for choosing the topic are as
follows:
1) Gallery Walk technique is still seldom used in teaching learning.
We know that teaching learning process can not be separated from the
teaching method and technique because the achievement of teaching learning
itself is affected by the method and technique that the teacher use. In this
study, the researcher chooses Gallery Walk technique because recently, the
teaching learning in many schools still uses the conventional method.
2) As stated in the previous background that writing is not easy, there are still a
lot of students who have difficulties in writing English. Furthermore, to
convey our ideas, thought, mind, and feeling into a written form seems still
difficult for junior high school students. They usually get difficulties in
choosing appropriate words, combining sentences, communicating their ideas
or thought into good sentences or text, and using the grammar.
5
1.3 Statement of the Problem
Based on the reasons that have been stated and the background of the study in the
previous part, the research problem in this study is:
Is there any significant difference in the achievement of writing announcement
text between the eighth grade students of SMP Muhammadiyah 1 Weleri in the
academic year of 2013/2014 who are taught using Gallery Walk technique and
those who are taught using conventional method?
1.4 Objective of the Study
Based on the research problem above, the purpose of the study is to find out
whether there is significant difference in the achievement of writing
announcement text between the eighth grade students of SMP Muhammadiyah 1
Weleri in the academic year of 2013/2014 who are taught using Gallery Walk
technique and those who are taught using conventional method.
1.5 Hypothesis
There are two hypotheses in this study. The first hypothesis is the working
hypothesis (H1): there is significant difference in the achievement of writing
announcement text between the eighth grade students of SMP Muhammadiyah 1
Weleri in the academic year of 2013/2014 who are taught using Gallery Walk
technique and those who are taught using conventional method.
The second hypothesis is the null hypothesis (Ho): there is no significant
difference in the achievement of writing announcement text between the eighth

6
grade students of SMP Muhammadiyah 1 Weleri in the academic year of
2013/2014 who are taught using Gallery Walk technique and those who are taught
using conventional method.
1.6 Significance of the Study
This study is expected to give some benefits as follows:
(1) Theoretically
The findings of the study will give information of a new knowledge about the use
of Gallery Walk technique to improve students’ skill in writing announcement
text.
(2) Practically
a) For students: the application of Gallery Walk technique will make students
interested in teaching learning process. Moreover, it helps them improve their
skill in writing announcement.
b) For English teachers: the study is hoped to give information about the
appropriate method to improve the teaching learning.
c) For the researcher: the result of the study will answer the curiosity about the
use of Gallery Walk technique to teach writing announcement text.
(3) Pedagogically
The result of the study will give information of knowledge about an
alternative teaching method that can be used for improving the students’
achievement in writing announcement.

7
1.7 Limitation of the Study
This study focused on the use of Gallery Walk technique in teaching writing
announcement text. As it is mentioned in 2006 Competence-Based Curriculum,
announcement text is included in short functional text. In this research,
announcement text that was taught for the students was in a short form, not in a
complex form. This study was done in SMP Muhammadiyah 1 Weleri, to the
eighth grade students in academic year of 2013/2014.
1.8 Definition of Term
a) Teaching writing
Brown (2000:7) states that “Learning is acquiring or getting of knowledge of a
subject or a skill by study, experience, or instruction.” Furthermore, he mentions
that “Teaching, which is implied in the definition of learning, may be defined as
showing or helping someone to learn how to do something, giving instructions,
guiding in the study of something, providing with knowledge, causing to know or
understand.” Meanwhile, 2006 Competence–Based Curriculum mentions that
there are four skills in teaching English: listening, speaking, reading, and writing.
Based on the Meyers (2005:1), “writing is a way to produce language,
which you do naturally when you speak. You say something, think of more to say,
perhaps correct something you have said, and then move on to the next
statement.” Meanwhile, Harmer (2004:3) states that “although almost all human
beings grow up speaking their first language (and sometimes their second or third)
as a matter of course, writing has to be taught.” From the definition above,

8
teaching writing means that we help students to learn how to write well so that the
students are able to communicate in a written language as well as in a spoken
language.
b) Announcement text
2006 Competence–Based Curriculum for junior high school states that one kind
of short functional texts that the students should learn is announcement text.
Mustriana and Kurniawati (2005:94) mention that “an announcement is
something said, written or printed to make known what has happened or what
will happen. It includes the following points: the title/type of event, date/time,
place, and who to contact.”
c) Gallery Walk technique
Francek (2006) defines Gallery Walk as a discussion technique that gets students
out of their chairs and actively involved in synthesizing important science
concept, writing, and public speaking.
1.9 Outline of the Report
This final project is divided into five chapters. The first chapter discusses about
the introduction that consists of the background of the study, reasons for choosing
the topic, statement of the problem, objective of the study, hypotheses,
significance of the study, limitation of the study, definition of term, and the
outline of the report.

9
The second chapter deals with the review of the related literature which
consists of the review of the previous studies, review of theoretical study, and the
theoretical framework.
The third chapter is about the research methodologies. This chapter
consists of the research design, population and sample, the instruments for
collecting data, the method of collecting data, and the method of analyzing data.
The fourth chapter presents the data analysis and discussion.
The fifth chapter is the last chapter. It deals with the conclusion and some
suggestion related to the topic of the study.

10
CHAPTER II
REVIEW OF RELATED LITERATURE
This chapter deals with the review of underlying theory or literature. It contains of
three main sub-chapters. First of all, it deals with the review of the previous
studies. Second, it is about review of the theoretical study and the last is
theoretical framework.
2.1 Review of the Previous Studies
There were some researches which have been conducted in line with this topic.
Majiasih (2012) conducted a research entitled “The Effectiveness of
Gallery Walk to Teach Speaking Viewed from the Students’ Self-Esteem”. She
used Gallery Walk technique to interest and motivate her senior high school
students at grade eleven in teaching speaking. The results showed that her
research successfully improved the students’ ability in speaking.
Other research was undertaken by Gitaningrum (2011). She conducted a
research entitled “Developing Announcement Multimedia Material to Teach
Written Short Functional Text in Junior High School Level”. This research was
applied for junior high school students grade seven for teaching short functional
text especially announcement text. The media that were used are multimedia
materials which contain announcement. She used these media because they can be
used in two-way communication. The research that she had done showed that

11
multimedia materials could engage students’ attention and helped them in learning
writing announcement text.
Amaliana (2009) conducted a research entitled “The Use of Wall
Magazine as a Medium in Motivating Students’ Writing Skill to the Second Year
Students of SMP N 19 Semarang in the Academic Year of 2008-2009”. In this
research she used wall magazine to teach writing. The result of the research
showed that wall magazine was effective to teach writing. It could be seen from
the conclusion that most of the students (74% of the total students) were
motivated by the wall magazine to make a good writing. Nearly similar to the use
of wall magazine, Gallery Walk technique also uses a paper that is attached on the
wall like a gallery.
Similar to Amaliana (2009), Palupi (2011) also conducted an action
research entitled “Classroom Magazine as a Project Work to Motivate Students to
Improve Their Writing Skill”. The object of the study was the second grade
students of SMA N 11 Semarang. The result of the study showed that there was an
improvement after they were given the treatment. It could be seen from the
comparison between the result of pre-test and the test of cycle II. The result of the
test of cycle II was higher than the result of pre-test. Shortly speaking, the method
of using classroom magazine was effective to improve their writing skill.
The other research was conducted by Ardi (2011). Her action research
entitled “Improving the Students’ Writing Skill through Cooperative Learning”
used small group discussion to teach writing at junior high school grade eight. The
finding of her research showed that using small group discussion could solve

12
writing problems. It could be seen from the average score. Her research consisted
of two cycles. The average score of pre-test was 63 and it was under passing
grade. After it was given the treatment, the mean score of the first post-test was 72
and the mean of the second post-test was 78. It means that using small group
discussion is giving improvement toward the students’ writing.
Gallery Walk is also a discussion technique that gets students out of their
chairs as mentioned by Francek (2006). The difference is that in common small
group discussions, the students stay in their chairs while in Gallery Walk they are
out of their chairs and into a mode of active engagement.
2.2 Review of the Theoretical Study
2.2.1 General Concept of Writing
2.2.1.1 Definition of Writing
Ajuriaguerra and Auzias in Hartley (1980:68) define that “writing is graphic
representation using conventional, systematic, and recognizable signs. It is not
only a permanent method of recording our ideas and memories; in our society it is
also a method of exchange, a medium of communication between ourselves and
others.”
Meyers (2005:1) makes some definition about writing:
Writing is a way to produce language, which you do naturally when you
speak. You say something, think of more to say, perhaps correct
something you have said, and then move on to the next statement.
Writing is not much different, except that you take more time to think
about your subject, the person or people you will be discussing it with,
and the goal you hope to achieve in that discussion. And, if you are
writing in a second language, you also take more time to revise your
work.

13
While Harmer (2004:3) states that “although almost all human beings
grow up speaking their first language (and sometimes their second or third) as a
matter of course, writing has to be taught.”
From some definitions above I can infer that writing is a kind of written
communication. It is used to communicate in the society and it is not easy to do
because we are supposed to make our writing clearly so that the ideas, thoughts,
feelings, and information that we are going to deliver can be understood by other
people or the readers. That is why writing has to be taught because it is important
toward our lives.
2.2.1.2 Steps in Writing
Meyers (2005:3) mentions a series of action in writing is as follows:
1) Explore ideas
Writing first involves discovering our ideas. Before we sit down to write, let
our mind explore freely. Thoughts will occur while travelling to work, eating
dinner, or lying on the couch. We can record those thoughts by writing on
whatever we can-napkins, scraps of paper, or even the back of our hand. In
exploring our ideas, we should pay attention to consider the subject, purpose,
and the audience.
2) Prewrite
The second step of writing process involves writing our thoughts on paper or
on the computer. We can use one or more of these methods: brainstorming,
clustering, freewriting.
14
3) Organize
After we have put our ideas into words, we can begin to organize them. This
process involves selecting, subtracting, and adding ideas, and then outlining
them.
4) Write a first draft
In writing a first draft, we do not need to worry about being perfect. New
ideas will come to us later, and we may discover a better arrangement of
ideas. In this step what we should do is write fast, as if we were speaking to
our readers. If an idea occurs to us that belong earlier in the draft, we can
make a note about it in the margin.
5) Revise the draft
Revising is among the most important steps of writing, especially for people
who write in a second language. It is the part of the writing process that may
take the most time. Here is the procedure for revising: (a) read it aloud, (b)
add or omit material, and move material around.
6) Produce the final copy
After we have finished revising our paragraph, we can begin the final copy.
There are some ways for producing the final copy: (a) edit, (b) copy over, or
print a clean copy, (c) read carefully for errors, and then make another clean
copy.

15
2.2.1.3 Genres of Writing
According to Brown (2004:219), there are three main genres of writing:
1) Academic Writing: papers and general subject report, essays, compositions,
academically focused journal, short-answer test responses, technical reports,
theses, dissertasions.
2) Job-related Writing: messages, letters or e-mails, memos, reports, schedules,
labels, signs, advertisements, anouncements, manuals.
3) Personal Writing: letters, e-mails, greeting cards, invitations, messages, notes,
calendar entries, shopping lists, reminders, financial documents, forms,
questionnaires, medical reports, imigration document, diaries, personal
journals, fiction.
2.2.1.4 Types of Writing Performance
Brown (2004:220) mentions four categories of written performance:
1) Imitative
To produce written language, the learner must attain skills in the fundamental,
basic tasks of writing letters, words, punctuation, and very brief sentences.
This category includes the ability to spell correctly and to perceive phoneme-
grapheme correspondences in the English spelling system. It is a level at
which learners are trying to master the mechanics of writing. At this stage,
form is the primary if not exclusive focus, while context and meaning are of
secondary concern.

16
2) Intensive (controlled)
Beyond the fundamentals of imitative writing are skills in producing
appropriate vocabulary within a context, collocation and idioms, and correct
grammatical features up to the length of a sentence. Meaning and context are
of some importance in determining correctness and appropriateness, but most
assessment tasks are more concerned with a focus on form, and are rather
strictly controlled by the test design.
3) Responsive
Here, assessment tasks require learners to perform at a limited discourse
level, connecting sentences into a paragraph and creating a logically
connected sequence of two or three paragraphs. Tasks respond to pedagogical
directives, lists of criteria, outlines, and other guidelines. Genres of writing
include brief narratives and descriptions, short reports, lab reports,
summaries, brief responses to reading, and interpretations of charts or graphs.
Under specified conditions, the writer begins to exercise some freedom of
choice among alternative forms of expression of ideas. The writer has
mastered the fundamentals of sentence-level grammar and is more focused on
the discourse conventions that will achieve the objectives of the written text.
Form-focused attention is mostly at the discourse level, with a strong
emphasis on context and meaning.
4) Extensive
Extensive writing implies successful management of all the processes and
strategies of writing for all purposes, up to the length of an essay, a term

17
paper, a major research project report, or even a thesis. Writers focus on
achieving a purpose, organizing and developing ideas logically, using details
to support or illustrate ideas, demonstrating syntactic and lexical variety, and
in many cases, engaging in the process of multiple drafts to achieve a final
product. Focus on grammatical form is limited to occasional editing or
proofreading of a draft.
2.2.1.5 Micro- and Macroskills of Writing
Brown (2004:220) mentions about microskills and macroskills. The microskills
are more appropriate to gain the imitative and intensive types of writing tasks,
while the macroskills are essential for the successful mastery of responsive and
extensive writing.
Microskills:
1) Produce graphemes and orthographic patterns of English.
2) Produce writing at an efficientrate of speed to suit the purpose.
3) Produce an acceptable core of words and use appropriate word order patterns.
4) Use an acceptable grammatical systes (e.g., tense, agreement, pluralization),
patterns, and rules.
5) Express a particular meaning in different grammatical forms.
6) Use cohesive devices in written discourse.
Macroskills:
7) Use the rethorical forms and conventions of written discourse.

18
8) Appropriately accomplish the communicative functions of written texts
according to form and purpose.
9) Convey links and connections between events, and communicate such
relations as main idea, supporting idea, new information, given information,
generalization, and exemplification.
10) Distinguish between literal and implied meanings when writing.
11) Correctly convey culturally specific references in the context of the written
text.
12) Develop and use a battery of writing strategies, such as accurately assessing
the audiences interpretation, use prewriting devices, writing with fluency in
the first drafts, using paraphrases and synonyms, soliciting peer and instructor
feedback, and using feedback for revising or editing.
2.2.2 Teaching Techniques
Brown (2001:129) writes in his book that “the language-teaching literature widely
accepted technique as a superordinate term to refer to various activities that either
teachers or learners perform in the classroom.”
There are three types of taxonomy of language-teaching techniques based
on Crookes & Chaudron in Brown (2001:134): controlled, semicontrolled, and
free techniques. In the free techniques, there are some activities that can be used
in the classroom, such as:
1) Discussion: debate or other form of grouped discussion of specified topic,
with or without specified sides/prearranged.

19
2) Role-play: relatively free acting out of specified roles and function.
Distinguished from cued dialogues by the fact that cueing is provided only
minimally at the beginning, and not during the activity.
3) Games: various kinds of language game activity.
4) Report: report of student – prepared exposition on books, experiences, project
work, without immediate stimulus, and elaborated on according to student
interests.
5) Problem solving: activity involving specified problem and limitations of
means to resolve it; requires cooperation on part of participants in small or
large group.
6) Drama: planned dramatic rendition of play, skit, story, etc.
7) Simulation: activity involving complex interaction between groups and
individuals based on simulation of real-life actions and experiences.
8) Interview: a student is directed to get information from another student or
students.
9) Composition: as in report (verbal), written development of ideas, story, or
other exposition.
10) A propos: conversation or other socially oriented interacted/speech by
teacher, students, or even visitors, on general real-life topics. Typically
authentic and genuine.
20
2.2.3 Gallery Walk Technique
2.2.3.1 Definition
Francek (2006) defines Gallery Walk as “a discussion technique that gets students
out of their chairs and actively involved in synthesizing important science
concept, writing, and public speaking.” The technique also cultivates listening and
team-building skills. The advantage of this technique is its flexibility. It can be
organized for a simple 15-minutes ice breaker or a week-long project involving
graded oral or written reports. It can be used with introductory or advanced
material and with a variety of class sizes. Finally, a Gallery Walk gives chance to
move around the classroom, directing their focus and interrupting the lethargy that
sometimes results from being seated for long periods.
2.2.3.2 Procedure
During practicing Gallery Walk, students compose answers to several open-ended
questions posted at stations on classroom walls. The common procedures in
conducting a Gallery Walk are:
1) Create and post questions
The instructor writes questions addressing a central class concept or debatable
issue with no one right answer. The number of questions that need to be
written depends on class size. Write the questions on large sheets of self-
adhering chart paper, self-supporting flip charts, whiteboards, or even on
pieces of loose-leaf paper placed on walls or desks spaced throughout the
classroom.

21
2) Group students, assign roles, and stress team building
After explaining the basics of how to conduct a Gallery Walk, arrange
students into teams of three to six. Each team is provided with a different
colored marker or pen. Each team then selects a recorder who is responsible
for writing group comments. The role of recorder should switch at each
station.
3) Assign stations and begin comments
Direct teams to different discussion stations. To avoid chart clutter and
rumbling comments, encourage the recorder to write in a concise bulleted
format working down from the top of the sheet.
4) Rotation
After three to five minutes, say “Rotate!” The group then moves from the
initial home station, clockwise, to the next station. Here, the team adds new
comments and responds to notes left by the previous group. The instructor
acts as a facilitator, circulating around the classroom, clarifying questions,
and gauging students’ understanding. Beside that, the instructor records any
misconceptions or lapses for later discussion during the groups’ final
presentation.
5) Begin oral presentation
After visiting every station, students return to their original station and take 5-
10 minutes to synthesize all comments on the posted sheet there. The
reporter, selected previously, makes an oral presentation listing and recording
key points either on the blackboard or on an overhead projector. The oral

22
report should not exceed five minutes in length. During the presentation, the
instructor reinforces important concepts and corrects misconceptions and
errors. (Francek, 2006)
2.2.3.3 Gallery Walk Technique in Teaching Writing
Bowman (2005) suggests the general instructions for teaching using Gallery Walk
as follows:
1) Tape a number of large sheets of paper to the wall of the training room. Space
the chart pages so that learners can walk from one chart to another.
2) Label each chart with question, statement, or issue related to the topic.
3) Learners walk around the room writing their responses on the charts.
4) Assign a direction to move or they can move randomly. They can do the
activity as individuals or in groups.
5) After the learners have written on all the charts and jotted down their
observation on a work sheet, learners then spend a short period of time in
small groups discussing their observation.
6) Finally they discuss the activity with the whole group.
Francek (2006) states that “Gallery Walk is a discussion technique that
gets students out of their chairs and actively involved in synthesizing important
science concept, writing, and public speaking.” The advantage of this technique is
its flexibility. In this research, the goal of teaching by using Gallery Walk is to
teach writing announcement text as insisted in the curriculum, so the writer
modifies the teaching instructions or the teaching steps as follows:

23
1) The teacher asks the students some questions related to the Gallery Walk.
2) The teacher and the students discuss how to use the Gallery Walk in writing
activity.
3) The class is divided into five groups.
4) In class there will be five stations, each station will be provided with example
of announcement and question.
5) Each group will rotate from station one to five to answer all questions based
on the example of announcement on the answer sheet in a given time.
6) After all groups have finished rotating and answering all questions, there will
be class discussion.
7) Then, still in groups, students try to make an announcement.
8) After that, they stick their group works on the wall.
9) Nearly similar to the activity they have done before, each group visits the
other groups’ works. However, this time they don’t answer the questions but
they give feed back or comment to the other groups’ works.
10) Then they go back to their desks and do a class discussion.
11) Individually, students try to make their own announcement. Their individual
assignment will be assigned as a post-test of Gallery Walk technique.
2.2.4 Short Functional Text
In 2006 curriculum, which is known as KTSP especially in standar isi, short
functional text (SFT) is intended to be mastered by students of junior high school
and senior high school. In standar isi of the eighth grade of junior high school,

24
short functional text is included in all skills from listening, speaking, reading,
until writing, so that the students are able to make and use it both writtenly and
orally. Then, what is short functional text? To know what short functional text is,
it will be discussed in detail.
Firstly, it is about text. Halliday and Hasan (1985) mention that “text is a
communicated language”, while “functional means that language does a task in
certain context or takes a role in certain context.” A daily language that takes
certain roles in situational context can be also called as text. It can be spoken or
written, or such media we use to convey what we think or everything inside our
mind. Basically, a text is a unit of meaning. Meanwhile, based on the Oxford
dictionary “functional is designed to be practical and useful, having or providing
little or no decoration.” Functional text in standar isi means that the text is useful
in interaction with our surroundings.
From the explanation above, it can be concluded that short functional text
is a short type of text consisting of a word or a clause functioning to achieve
certain purposes and is useful in interaction with our surrounding. The content of
short functional text can be information, command, guidelines, notice or
prohibition. There are many examples of short functional texts which can be used
for our daily communication such as memorandum, advertisement,
announcement, shopping list, and many others. The kind of short functional text
that will be discussed in this research is announcement. The further explanation
about announcement is in the following point.

25
2.2.5 Announcement
One of short functional texts that students should master is announcement text.
Based on the Oxford dictionary, announcement is: (1) a statement in spoken or
written form that makes something known publicly, (2) the action of announcing
something.
Mustriana and Kurniawati (2005:94) state that “an announcement is
something said, written or printed to make known what has happened or what will
happen. In writing an announcement, include the title/type of event, date/time,
place, and who to contact”.
Bailey and Walker (1956:112) mention some important things about a
good announcement. “An announcement should include what, when, where, and
who. Often it includes why and how. An announcement should be brief.”
Meanwhile Shane, Ferris, and Keener (1958:197) state that “every
announcement, whether it is spoken or written, should answer five questions.”
The five questions are as follows:
1) Who is giving the program or exhibit?
2) What kind of program or exhibit is it?
3) When will it be held?
4) Where will it be held?
5) Who is invited to come?
Here is the example of the announcement by Shane, Ferris, and Keener
(1958:197):
The fifth grade is having an exhibit in Room 207 at two o’clock next
Friday afternoon, November 21, 1952. We call it “Traveler’s Show.”

26
Come travel with us by railroad, ship, or bus to several interesting
cities. All pupils are invited to come.
The example of announcement above is a good announcement. It also
answered the five questions.
1) Who is giving the program or exhibit? The fifth grade students.
2) What kind of program or exhibit is it? Traveler’s Show.
3) When will it be held? On November 21, 1952, at two o’clock next Friday
afternoon.
4) Where will it be held? In Room 207.
5) Who is invited to come? All pupils.
From the definition above, I can conclude that announcement is a
statement in spoken or written form that makes something known publicly. It
could be kind of information or news. An announcement should be brief but it is
clear and interesting. A good announcement should answer what, when, where,
and who. Often it includes why and how. The examples of announcement are
announcement about giving the news of a birth, a wedding, or other events.
2.3 Theoretical Framework
From the review of previous studies and review of related literatures above, I can
conclude that Gallery Walk technique is a discussion technique that involves the
students in an active engagement. It can be used to synthesize important science
concept, writing, and public speaking. The advantage of this technique is its
flexibility in the application. In this research the researcher will use Gallery Walk
technique to teach writing an announcement text because there are still many
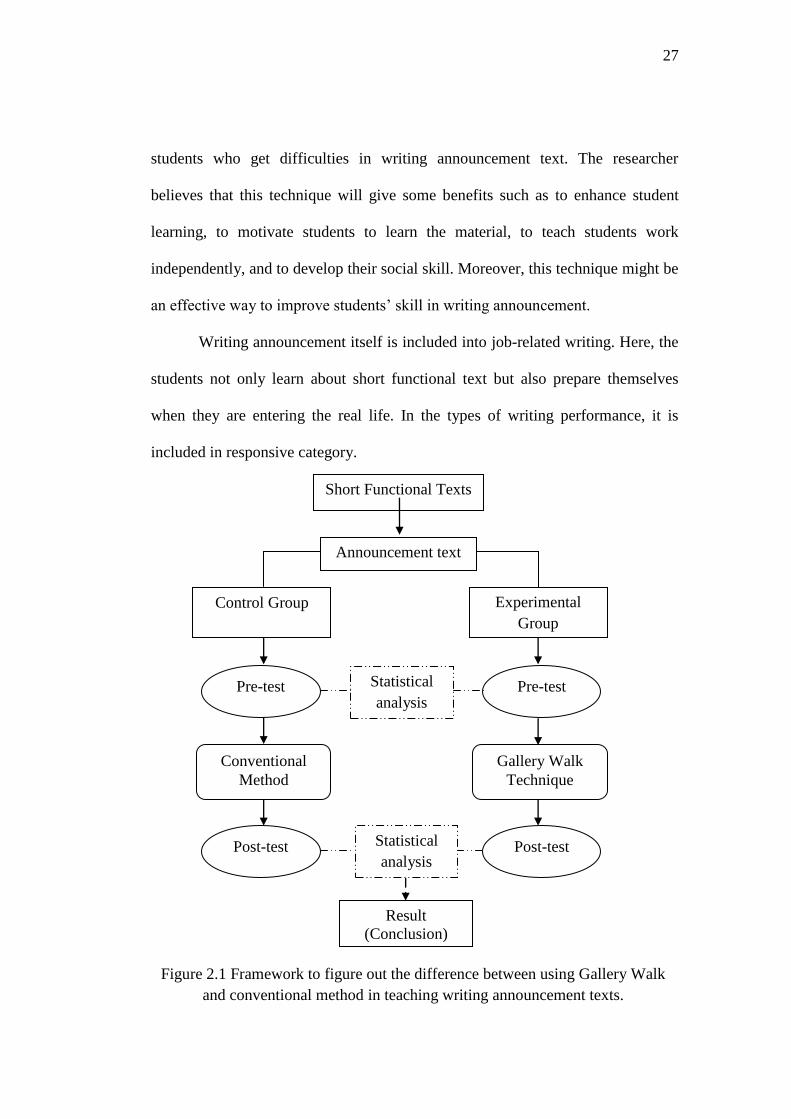
27
students who get difficulties in writing announcement text. The researcher
believes that this technique will give some benefits such as to enhance student
learning, to motivate students to learn the material, to teach students work
independently, and to develop their social skill. Moreover, this technique might be
an effective way to improve students’ skill in writing announcement.
Writing announcement itself is included into job-related writing. Here, the
students not only learn about short functional text but also prepare themselves
when they are entering the real life. In the types of writing performance, it is
included in responsive category.
Short Functional Texts
Announcement text
Experimental
Group
Control Group
Statistical
analysis Pre-test Pre-test
Figure 2.1 Framework to figure out the difference between using Gallery Walk
and conventional method in teaching writing announcement texts.
Result
(Conclusion)
Statistical
analysis Post-test Post-test
Gallery Walk
Technique
Conventional
Method

28
CHAPTER III
METHODS OF INVESTIGATION
This chapter focuses on methods of the study. They are research design,
population and sample, the instruments for collecting data, the method of
collecting data, and the method of analyzing data.
3.1 Research Design
Approach is a way of considering or doing something. Quantitative approach was
used in this study. It used and dealt with statistical analysis. Based on Best
(1981:257), “statistical analysis is the mathematical process of gathering,
organizing, analyzing, and interpreting numerical data, and is one of the basic
phases of the research process.”
In this study, the researcher used pre-test post-test control group design to
know the improvement of students’ skill in writing announcement. It is included
in true experimental design. The design of this study is presented by the following
design:
E O1 X O2
C O3 Y O4
Where:
E : Experimental group
C : Control group

29
O1 : Pre-test for the experimental group
O2 : Post-test for the experimental group
O3 : Pre-test for the control group
O4 : Post-test for the control group
X : Treatment using Gallery Walk technique
Y : Treatment without Gallery Walk technique
(Tuckman in Saleh, 2011)
There were two groups that got different treatments. The first group was
an experimental group which was taught using Gallery Walk technique. The
second group was control group which was taught using conventional method.
After the two groups were given the different treatments, the same writing
announcement tests were given to the experimental and control groups. By
conducting the test of writing for both groups, the researcher could find out that
using Gallery Walk technique was an effective method in teaching the student’s
mastery of writing announcement text.
3.2 Population and Sample
3.2.1 Population
Best (1981:8) says that “population is any group of individuals that have one or
more characteristics in common that are of interest to the researcher.” The
population of this study was the eighth grade students of SMP Muhammadiyah 1
Weleri in the academic year of 2013/2014 which was divided into three classes:
30
VIII-A, VIII-B, and VIII-C. Every class consisted of 28 students, so the total of
those three classes were 84 students.
3.2.2 Sample
According to Best (1981:8), “sample is small proportion of population selected for
observation and analysis.” In this research, the samples of the study were class
VIII-A as the experimental group and class VIII-B as the control group with 28
students of each class. Those two classes were chosen based on the English
teacher’s recommendation because in SMP Muhammadiyah 1 Weleri there is no
stratification in dividing the population. Furthermore, they were chosen in order to
make it easy in labeling the group.
The researcher took those two classes from the eighth grade students of
SMP Muhammadiyah 1 Weleri because announcement text material which is
included in short functional text, as it is insisted in curriculum, is given in the first
semester and is included in writing competence of the eighth grade in junior high
school.
3.3 Instrument for Collecting Data
Based on Saleh (2001:31-33), “instrument is a tool to collect data in research.”
Furthermore, Saleh (2001:31-33) also mentioned some kinds of instrument, such
as: (1) questionnaire, (2) observation sheet, (3) sheet of interview, and (4) test. In
this study, the researcher used writing test as the instrument because this
instrument is the most appropriate instrument to measure the students’ mastery in
writing announcement text.

31
3.4 Method of Collecting Data
In line with research design the researcher used in this study, in collecting data,
the researcher took the students’ scores in writing announcement text through pre-
test and post-test. The following are the steps in collecting the data in this study:
1) Pre-test
Pre-test was undertaken for the first step in a form of writing test. It was given
before the students were given the treatment. The aim of the pre-test was to know
the basic or prior knowledge and students’ skill in writing announcement text.
2) Treatment
Some treatments were given after conducting the pre-test to the experimental and
the control groups. The experimental group was taught by using Gallery Walk
technique while the control group was taught by using conventional method.
3) Post-test
Post-test was conducted after the students were given the treatment. It was in the
same form like pre-test, i.e. in a form of writing test. The aim of the post-test was
to measure the students’ skill in writing announcement text after they got the
treatment.
4) Scoring System
In facilitating the analysis of the students’ test result in writing announcement text
of the two groups, experimental and control groups, the researcher limited only to
the analytic scale as stated by Brown and Bailey (1984):

32
Table 3.1
Analytic Scale for Rating Composition Task (Brown & Bailey 1984:39-41)
Organization:
Introduction,
body and
conclusion
20-18
appropriate title, effective introductory paragraph,
topic is stated, leads to body; arrangement of
material shows plan (could be outlined by readers);
supporting evidence given for generalization;
conclusion logical and complete
17-15
adequate title, introduction and conclusion; body of
essay is acceptable, but some evidences may be
lacking, some ideas are not fully developed;
sequence is logical but transitional expression may
be absent or misused
14-12
mediocre or scant introduction or conclusion;
problems with the order of ideas in body; the
generalization may not be fully supported by the
evidence given; problems of organization interfere
11-6
shaky or minimally recognizable introduction;
organization can barely be seen; severe problems
with ordering of ideas; lack of supporting evidence;
conclusion weak or illogical; inadequate effort at
organization
5-1 absent of introduction and conclusion; no apparent
organization of body; severe lack of supporting
evidence; writer has not made any effort to organize
the composition (could not be outlined by reader)
Logical
development
of ideas:
Content
20-18
essay addresses the assigned topic; the ideas are
concrete and thoroughly developed; no extraneous
material; essay reflect thought
17-15 essay addresses the issues but misses some points;
ideas could be more developed; some extraneous
material is present
14-12 development of ideas not complete or essay is
somewhat out off the topic; paragraphs are not
divided exactly right
11-6 ideas incomplete; essay does not reflect careful
thinking or was hurriedly written; inadequate of
effort in area of content

33
5-1 Numerous serious mistakes, no mastery of sentence
construction, almost intelligible.
Grammar
20-18 native like fluency in English grammar; correct use
of relative clauses, preposition, modals, articles,
verb form and tense sequencing; no fragments or
run on sentence
17-15
advance proficiency in English grammar; some
grammar problems do not influence communication,
although the reader is aware of them; no fragment
of run on sentence
14-12 ideas are getting through to the reader, but grammar
problems are apparent and have negative effect on
communication; run on sentence or fragment
present
11-6
numerous serious grammar problems interfere with
communication of the writer’s ideas; grammar
review of some areas clearly needed; difficult to
read sentences
5-1
severe grammar problems interfere greatly with the
message; reader cannot understand what the writer
was trying to say; unintelligible sentence structure
Punctuation,
spelling and
mechanics
20-18
correct use of English writing conventions: left and
right margins, all needed capitals, paragraph
intended, punctuation and spelling; very neat
17-15 some problems with writing conventions or
punctuation; occasionally spelling errors; left
margin correct; paper is neat legible
14-12 uses general writing conventions but has errors;
spelling problems distract reader; punctuation errors
interfere with ideas
11-6 serious problems with format of paper; part of essay
not legible; errors in sentence punctuation and final
punctuation; unacceptable to educated reader
5-1 complete disregard of English writing convention;
paper illegible; obvious capital missing, no margins;
severe spelling problems
Style and
quality of
20-18 precise vocabulary usage; use of parallel structures;

34
expression concise; register good
17-15
attempts variety; good vocabulary; not wordy,
register OK; style fairly concise
14-12
some vocabulary misused; lack awareness of
register; may be too wordy
11-6 poor expression of ideas; problems in vocabulary;
lack variety of structure
5-1 inappropriate use of vocabulary, no concept of
register or sentence variety
3.5 Method of Analyzing Data
The next step was analyzing the result of the data. This was used to process the
data in order to establish valuable and meaningful information so that further
interpretation could be done. This study was analyzed based on the quantitative
data from the students’ tests result (pre-test and post-test).
First, the pre-test was given to the students to know their scores before the
treatment is given. After that, each group was given the treatment. The
experimental group was taught using Gallery Walk technique, while the control
group was taught using conventional method. Then the post-test was conducted to
take the score after the treatment was given. After we got the students’ scores
from the pre-test and the post-test, the next step was analyzing them by using
statistical method.
3.5.1 Analysis of Early Stage
Analysis of the early stage was conducted to determine whether the two groups
(experimental and control groups) were from the same initial conditions. The data

35
used were the pre-test scores of experimental and control groups from the eighth
grade students in semester 1 of SMP Muhammadiyah 1 Weleri in the academic
year of 2013/2014.
a) Test for normality
The statistical formula used in the normality test is:
(Sudjana, 2005:273)
Where:
Oi = the observed frequencies
Ei = the expected frequencies
k = the number of class intervals
X2 = the X
2 value from calculation
∑ = the sum of
With degrees of freedom (dk) = k - 3 and α = 5%. If X2
data ≤ X2
(1-α)(k-3) , it
means that the data are normally distributed.
b) Testing the equality of two variances
To test the equality of two variances, the formula is as follows:
(Sudjana, 2005:251)

36
Paired hypotheses which were tested are:
Ho: σ12 = σ2
2
Hi : σ12 ≠ σ2
2
The testing criteria are: Ho is rejected if F ≥ Fα (v1, v2) with α = 5%.
Where v1 = n1-1 (dk numerator) and v2= n2-1 (dk denominator).
c) T-test for Pre-test
T-test formula was applied to measure whether there was significant
difference between experimental and control groups on pre-test scores.
The hypotheses which were tested are:
Ho: μ1 = μ2
Hi : μ1 > μ2
To test the truth of the hypotheses, the researcher used one tailed t-test.
It is used in two ways:
1) If the data have the same variances, then the statistic which is used is t-
statistic, which could be written as follows:
Criteria:
Ho is accepted if tvalue < ttable. Meanwhile, Ho is rejected if tvalue has
another value, with α = 5% and dk = n1 + n2 – 2. (Sudjana, 2005:243)
Where:
t : t-test

37
: the mean of the pre-test of the experimental group
: the mean of the pre-test of the control group
: the number of the experimental group
: the number of the control group
: standard deviation
: standard deviation of the experimental group
: standard deviation of the control group
2) If the data do not have the same variances, then the formula which is
used is as follows:
The testing criteria are based on Sudjana (2005:243):
Ho is rejected if , and Ho is accepted if it happens the
otherwise. Where ; t1 = t (1-α).(n1-1) ; t2 = t (1-α).(n2-1).
3.5.2 Analysis of the Final Stage
a) Test for normality
The statistical formula used in the normality test is:

38
(Sudjana, 2005:273)
Where:
Oi = the observed frequencies
Ei = the expected frequencies
k = the number of class intervals
X2 = the X
2 value from calculation
∑ = the sum of
With degrees of freedom (dk) = k - 3 and α = 5%. If X2
data ≤ X2
(1-α)(k-3) , it
means that the data are normally distributed.
b) Testing the equality of two variances
To test the equality of two variances, the formula is as follows:
(Sudjana, 2005:251)
Paired hypotheses which were tested are:
Ho: σ12 = σ2
2
Hi : σ12 > σ2
2
The testing criteria are: Ho is rejected if F ≥ Fα (v1, v2) with α = 5%.
Where v1 = n1-1 (dk numerator) dan v2= n2-1 (dk denominator).
c) T-test for Post-test
T-test formula was applied to measure whether there was significant
difference between experimental and control groups on post-test scores.
39
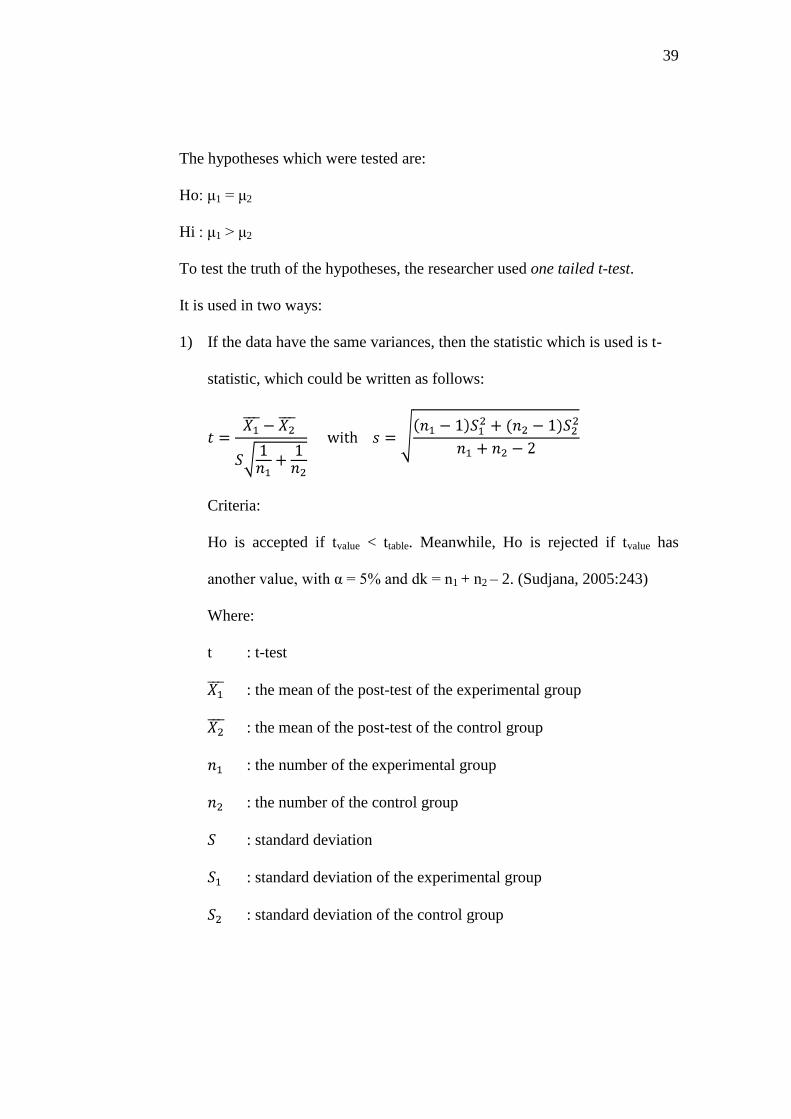
The hypotheses which were tested are:
Ho: μ1 = μ2
Hi : μ1 > μ2
To test the truth of the hypotheses, the researcher used one tailed t-test.
It is used in two ways:
1) If the data have the same variances, then the statistic which is used is t-
statistic, which could be written as follows:
Criteria:
Ho is accepted if tvalue < ttable. Meanwhile, Ho is rejected if tvalue has
another value, with α = 5% and dk = n1 + n2 – 2. (Sudjana, 2005:243)
Where:
t : t-test
: the mean of the post-test of the experimental group
: the mean of the post-test of the control group
: the number of the experimental group
: the number of the control group
: standard deviation
: standard deviation of the experimental group
: standard deviation of the control group

40
2) If the data do not have the same variances, then the formula which is
used is as follows:
The testing criteria are based on Sudjana (2005:243):
Ho is rejected if , and accept Ho if it happens the
otherwise. Where ; t1 = t (1-α).(n1-1) ; t2 = t (1-α).(n2-1).
41
CHAPTER IV
DATA ANALYSIS AND DISCUSSION
This chapter presents the data analysis and the discussion of research findings. It
consists of pre-test analysis, treatment processes, post-test analysis, discussion of
the research findings, and some obstacles in doing a research.
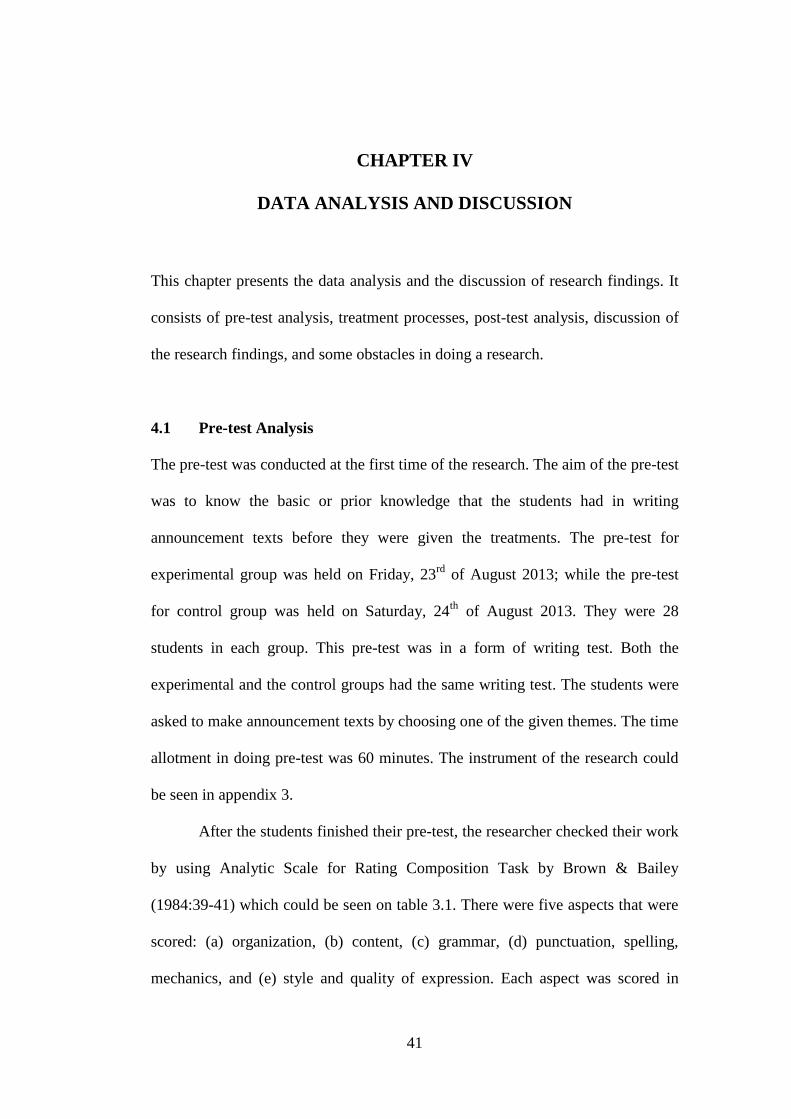
4.1 Pre-test Analysis
The pre-test was conducted at the first time of the research. The aim of the pre-test
was to know the basic or prior knowledge that the students had in writing
announcement texts before they were given the treatments. The pre-test for
experimental group was held on Friday, 23rd
of August 2013; while the pre-test
for control group was held on Saturday, 24th
of August 2013. They were 28
students in each group. This pre-test was in a form of writing test. Both the
experimental and the control groups had the same writing test. The students were
asked to make announcement texts by choosing one of the given themes. The time
allotment in doing pre-test was 60 minutes. The instrument of the research could
be seen in appendix 3.
After the students finished their pre-test, the researcher checked their work
by using Analytic Scale for Rating Composition Task by Brown & Bailey
(1984:39-41) which could be seen on table 3.1. There were five aspects that were
scored: (a) organization, (b) content, (c) grammar, (d) punctuation, spelling,
mechanics, and (e) style and quality of expression. Each aspect was scored in

42
range of 1-20. Then to get the total score, the researcher added those five aspects
one to each other. All results of the pre-test scores could be seen in appendix 7
and 8.
From the calculation of the pre-test scores, the highest score for the
experimental group was 79 and the lowest score was 20. Meanwhile, the highest
score for the control group was 71 and the lowest score was 12.
After that, from the obtained data, the researcher calculated the mean
(average score) of each group as the following:
It could be seen from the calculation above that the mean of the experimental
group was 53.61, while the mean of the control group was 51.75. Below was the
figure of comparison between the mean of the experimental and the control
groups on the pre-test.
Figure 4.1 The Mean of the Experimental and the Control Groups on Pre-test
0
20
40
60
80
100
53.61 51.75
Experimental group Control group

43
The figure above showed that the students’ achievement of both groups
were relatively the same before they were given the treatment. In order to prove
that there were similarities in pre-test data in the experimental and the control
groups, t-test was needed. However, before the t-test was calculated, the normality
and homogeneity of the pre-test scores were analyzed first.
4.1.1 Normality of the Pre-test Scores
This normality test was used to know whether the pre-test scores of the two
groups, the experimental and the control groups, were normally distributed or not
by using Chi Square formula.
From the calculation, the value of X2
data for the experimental group was
2.59, while the value of X2
data for the control group was 6.09. Meanwhile, the
value of X2
table with degrees of freedom (dk) = k – 3 = 6 – 3 = 3 and α = 5% is
7.81. The data are said to have a normal distribution if the value of X2
data were
equal to or lower than the value of X2
table.
Since the value of X2
data for the experimental group (2.59) and the control
group (6.09) were lower than the value of X2
table (7.81), it meant that the pre-test
scores for both of groups were said to be normally distributed. The complete
result of the X2 calculation of pre-test scores could be seen in appendix 13 for the
experimental group and in appendix 14 for the control group.
4.1.2 Homogeneity of the Pre-test Scores
In this research, F test was used in order to see whether the two variances of the

44
pre-test scores in experimental and control groups fulfilled the condition of
homogeneity or not.
First, before the F test was obtained, the variance of each group was
calculated. The variance of the experimental group (Ve) was 430.03, and the
variance of the control group (Vc) was 236.40. Then, to get the Fdata, the higher
variance was divided by the lower variance. The calculation was as follows:
From the calculation, the value of Fdata for the pre-test scores was 1.82.
Meanwhile, the value of Ftable with dk numerator V1 = n1 – 1 = 28 – 1 = 27, dk
denominator V2 = n2 – 1 = 28 – 1 = 27 and α = 5%, squared to V1 = 28 and V2 =
28 is 1.87. The data are said to be homogenous if Fdata < Ftable.
Since the value of Fdata was lower than the value of Ftable, it could be
concluded that the variances of the pre-test scores in experimental and control
groups fulfilled the condition of homogeneity. The complete calculation of the F
test for the pre-test scores could be seen in appendix 17.
4.1.3 T-test for Pre-test
The t-test for pre-test was used to test a null hypothesis (Ho) that there was no
significant difference in the achievement of writing announcement text between
the experimental group and the control group on pre-test. It is said that there was
45
no significant difference in the achievement between the experimental group and
the control group if the value of tvalue was lower than the ttable.
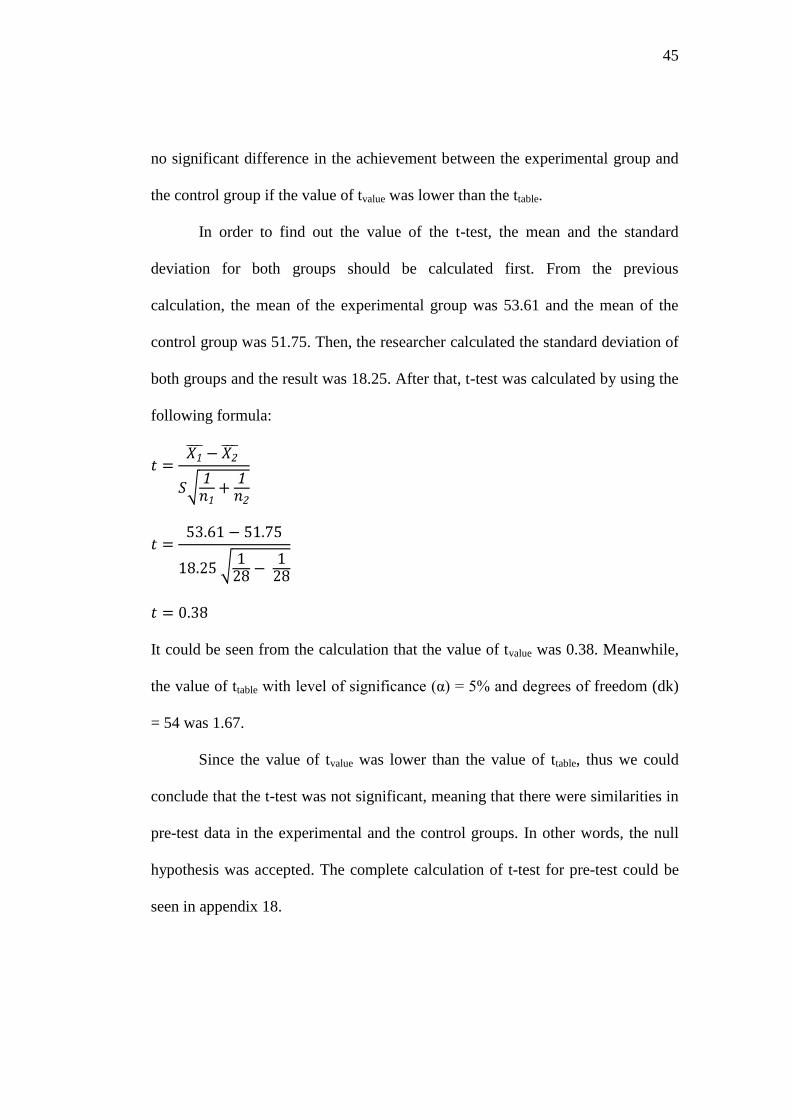
In order to find out the value of the t-test, the mean and the standard
deviation for both groups should be calculated first. From the previous
calculation, the mean of the experimental group was 53.61 and the mean of the
control group was 51.75. Then, the researcher calculated the standard deviation of
both groups and the result was 18.25. After that, t-test was calculated by using the
following formula:
It could be seen from the calculation that the value of tvalue was 0.38. Meanwhile,
the value of ttable with level of significance (α) = 5% and degrees of freedom (dk)
= 54 was 1.67.
Since the value of tvalue was lower than the value of ttable, thus we could
conclude that the t-test was not significant, meaning that there were similarities in
pre-test data in the experimental and the control groups. In other words, the null
hypothesis was accepted. The complete calculation of t-test for pre-test could be
seen in appendix 18.

46
4.2 Treatment Processes
4.2.1 Treatment for Experimental Group
The treatment was given after the students did the pre-test. In this study, the
researcher was applying a Gallery Walk technique as a treatment to teach how to
write announcement texts. The treatment was given to the experimental group,
which consisted of 28 students, in four meetings. Each meeting was done in 2 x
40 minutes. Thus, the students in the experimental group were taught how to
make announcement texts by using Gallery Walk technique. The following were
the learning activities during the treatment for the experimental group:
Opening
1. The class was opened by praying together.
2. Teacher checked the students’ attendance.
Main Activities
(1) Meeting 1 (2x40’)
It was divided into two activities, they were: pre-test and exploration.
Pre-test (60’)
1. Students were told that they would be given a pre-test on that day. The
aim of the pre-test was to measure their ability in writing announcement
texts before they were given the treatment.
2. Students were given a piece of paper containing the instruction, the
themes of announcement text that should be chosen to write, scoring
rubric, and a piece of worksheet.
3. Students submitted their work.

47
Exploration (20’)
4. Students were asked questions about announcement texts and the Gallery
Walk technique that they would practice.
5. Students and teacher discussed about announcement text and how to use
Gallery Walk technique in writing activity.
(2) Meeting 2 (2x40’) – Elaboration
1. Students and teacher reviewed about the previous meeting, that was
about announcement text and how to use the Gallery Walk technique in
writing activity.
2. The class was divided into five groups.
3. In class there were five stations, each station was provided with example
of announcement text and question.
4. Each group was rotated from station one to five to answer all questions
based on the example of announcement on the answer sheet in a given
time.
5. After all groups had finished rotating and answering all questions based
on the example announcements, there was class discussion.
6. The students were told that in the next meeting they would practice to
make announcement texts.
(3) Meeting 3 (2x40’) – Elaboration
1. Students and teacher reviewed about the previous meeting.
2. The students were divided into five groups (the same groups with the
previous meeting).

48
3. In groups, the students tried to make announcement texts.
4. After that, they attached their group work on the wall.
5. The students did Gallery Walk like the previous meeting, each group
rotated visiting the other groups’ work. However, this time they did not
answer the questions but they gave feedback or comment to the other
groups’ work.
6. The students went back to their desks and did a class discussion.
7. The students were asked about difficulties they found.
8. The students were told that they would be given a post-test in the next
meeting.
(4) Meeting 4 (2x40’) – Confirmation
It was divided into two activities, they were: review and post-test.
Review (20’)
The students and teacher reviewed about the all activities they had done
before in the previous meetings.
Post-test (60’)
The students did the post-test (the instrument of the post-test were similar
with those on the pre-test), then they submitted it to the teacher.
Closing
1. Students told the teacher what they had learnt in class, the teacher gave some
feedback.
2. Teacher closed the lesson.

49
4.2.2 Treatment for Control Group
The control group, consisted of 28 students, was taught the same material as the
experimental group. It was about announcement text. However, the way how to
teach it was different from the experimental group. In control group, the
researcher was applying conventional method. This method was the method that
their teacher usually used. The learning activities for the control group were also
conducted in four meetings. Each meeting was done in 2 x 40 minutes. The
following were the learning activities for the control group:
Opening
1. The class was opened by praying together.
2. Teacher checked the students’ attendance.
Main Activities
(1) Meeting 1 (2x40’)
It was divided into two activities, they were: pre-test and exploration.
Pre-test (60’)
1. Students were told that they would be given a pre-test on that day. The
aim of the pre-test was to measure their ability in writing announcement
texts before they were taught using conventional method.
2. Students were given a piece of paper containing the instruction, the
themes of announcement text that should be chosen to write, scoring
rubric, and a piece of worksheet.
3. Students submitted their work.
Exploration (20’)

50
4. Students were asked some questions about announcement texts as an
introduction.
(2) Meeting 2 (2x40’) – Elaboration
1. Teacher asked the students about announcement text as a building
knowledge.
2. Teacher explained about what announcement text was, its social function
and its parts.
3. Teacher gave some examples of announcement text then students tried to
analyze it about its function and its parts.
4. Students learnt new vocabularies, spelling, and punctuation.
5. Students mentioned the content of announcement texts.
6. Teacher explained about the grammar (simple future tense and simple
past tense).
7. Teacher gave some exercises.
8. Students were told that in the next meeting they would practice to make
announcement texts.
(3) Meeting 3 (2x40’) – Elaboration
1. Students and teacher reviewed about the previous meeting.
2. Teacher gave other examples of announcement text and students tried to
mention the content of announcement.
3. Teacher gave some exercises in a form of fill in the blank.
4. Students filled in the blank of some announcement texts.

51
5. Students tried to make announcement texts with the given theme guided
by the teacher.
6. Students were told that they would be given a post-test in the next
meeting.
(4) Meeting 4 (2x40’)
It was divided into two activities, they were: review and post-test.
Review (20’)
The students and teacher reviewed about the all activities they had done
before in the previous meetings.
Post-test (60’)
Students did the post-test (the instrument of the post-test were similar with
those on the pre-test), then they submitted it to the teacher.
Closing
1. Students told the teacher what they had learnt in class, the teacher gave some
feedback.
2. Teacher closed the lesson.
4.3 Post-test Analysis
The post-test was conducted after the students got the treatment. The aim of the
post-test was to measure the students’ skill in writing announcement texts after the
treatment was given. The post-test for experimental group was held on Saturday,
31st of August 2013; while the post-test for control group was held on Monday,
2nd
of September 2013. They were 28 students in each group. The form of the

52
post-test was exactly the same as the pre-test. It was in a form of writing test. The
students were asked to make announcement texts by choosing one of the given
themes. The time allotment in doing post-test was 60 minutes. The instrument of
the research could be seen in appendix 3.
After the students finished their post-tests, the researcher checked and
gave scores to their work by using Analytic Scale for Rating Composition Task by
Brown & Bailey (1984:39-41) which could be seen on table 3.1. There were five
aspects that were scored: (a) organization, (b) content, (c) grammar, (d)
punctuation, spelling, mechanics, and (e) style and quality of expression. Each
aspect was scored in range of 1-20. Then to get the total score, the researcher
added those five aspects one to each other. All results of the post-test scores could
be seen in appendix 9 and 10.
From the calculation of the post-test scores, the highest score for the
experimental group was 96 and the lowest score was 34. Meanwhile, the highest
score for the control group was 88 and the lowest score was 30.
After that, from the obtained data, the researcher calculated the mean
(average score) of each group as the following:
It could be seen from the calculation above that the mean of the experimental
group was 71.32, while the mean of the control group was 63.89. Below was the

53
figure of comparison between the mean of the experimental and the control
groups on the post-test.
Figure 4.2 The Mean of the Experimental and the Control Groups on Post-test
The figure above showed that the students’ achievement in the
experimental group was higher than the students’ achievement in the control
group. However, the t-test was still needed. It was used to check whether the
difference of the students’ data on post-test was significant or not. Before the t-
test was calculated, the normality and homogeneity of the post-test scores were
analyzed first.
4.3.1 Normality of the Post-test Scores
The way to test the normality of the post-test scores was the same as in the pre-
test. It used Chi Square formula. This normality test was used to know whether
the post-test scores of the two groups, the experimental and the control groups,
were normally distributed or not.
0
20
40
60
80
100
71.3263.89
Experimental group Control group
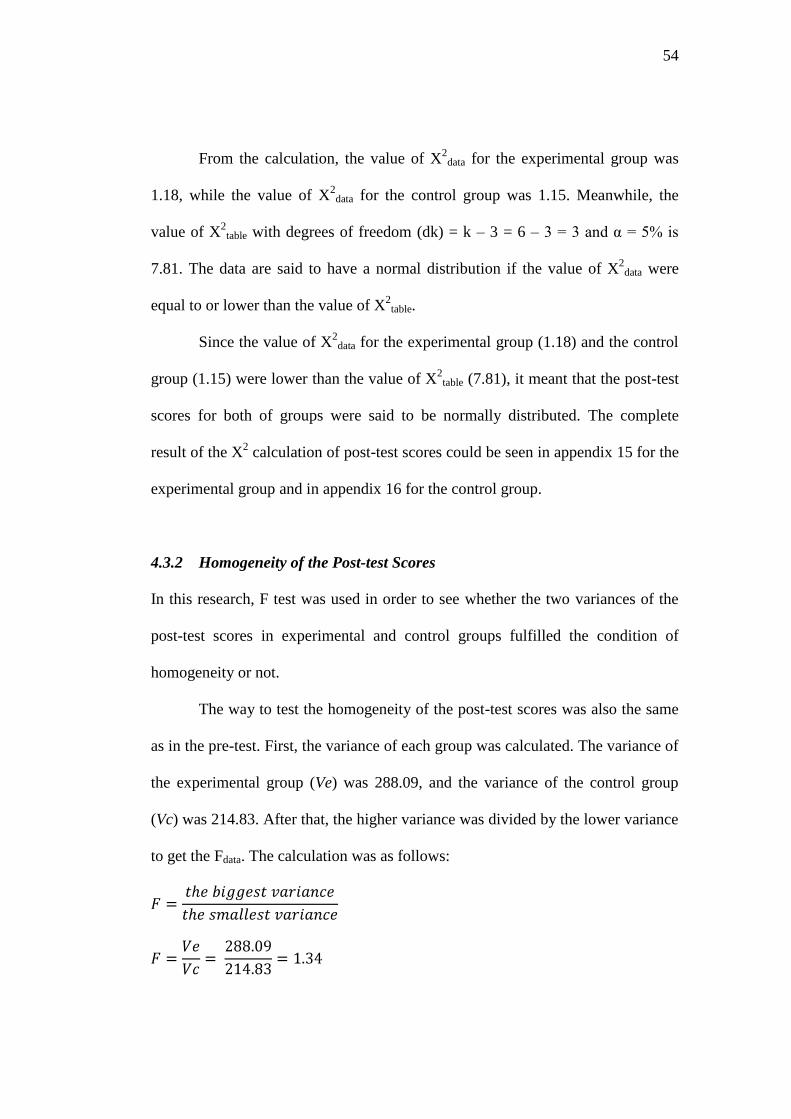
54
From the calculation, the value of X2
data for the experimental group was
1.18, while the value of X2
data for the control group was 1.15. Meanwhile, the
value of X2
table with degrees of freedom (dk) = k – 3 = 6 – 3 = 3 and α = 5% is
7.81. The data are said to have a normal distribution if the value of X2
data were
equal to or lower than the value of X2
table.
Since the value of X2
data for the experimental group (1.18) and the control
group (1.15) were lower than the value of X2
table (7.81), it meant that the post-test
scores for both of groups were said to be normally distributed. The complete
result of the X2 calculation of post-test scores could be seen in appendix 15 for the
experimental group and in appendix 16 for the control group.
4.3.2 Homogeneity of the Post-test Scores
In this research, F test was used in order to see whether the two variances of the
post-test scores in experimental and control groups fulfilled the condition of
homogeneity or not.
The way to test the homogeneity of the post-test scores was also the same
as in the pre-test. First, the variance of each group was calculated. The variance of
the experimental group (Ve) was 288.09, and the variance of the control group
(Vc) was 214.83. After that, the higher variance was divided by the lower variance
to get the Fdata. The calculation was as follows:

55
From the calculation, the value of Fdata for the post-test scores was 1.34.
Meanwhile, the value of Ftable with dk numerator V1 = n1 – 1 = 28 – 1 = 27, dk
denominator V2 = n2 – 1 = 28 – 1 = 27 and α = 5%, squared to V1 = 28 and V2 =
28 is 1.87. The data are said to be homogenous if Fdata < Ftable.
Since the value of Fdata was lower than the value of Ftable, it could be
concluded that the variances of the post-test scores in experimental and control
groups fulfilled the condition of homogeneity. The complete calculation of the F
test for the post-test scores could be seen in appendix 19.
4.3.3 T-test for Post-test
The t-test for post-test was used to test a null hypothesis (Ho) that there was no
significant difference in the achievement of writing announcement text between
the experimental group and the control group on post-test. It is said that there was
no significant difference in the achievement between the experimental group and
the control group if the value of tvalue was lower than the ttable.
In order to find the value of the t-test, the mean and the standard deviation
for both groups should be calculated first. From the previous calculation, the mean
of the experimental group was 71.32 and the mean of the control group was 63.89.
Then, the researcher calculated the standard deviation of both groups and the
result was 15.86. After that, t-test was calculated by using the following formula:

56
It could be seen from the calculation that the value of tvalue was 1.76. Meanwhile,
the value of ttable with level of significance (α) = 5% and degrees of freedom (dk)
= 54 was 1.67.
Since the value of tvalue was higher than the value of ttable, thus we could
conclude that the t-test was significant, meaning that there were differences in
post-test data in the experimental and the control groups. In other words, the null
hypothesis was rejected and the working hypothesis was accepted. The complete
calculation of t-test for post-test could be seen in appendix 20.
4.4 Discussion of the Research Findings
This study was intended to find out whether there was significant difference in the
achievement of writing announcement text between the eighth grade students of
SMP Muhammadiyah 1 Weleri in the academic year of 2013/2014 who were
taught using Gallery Walk technique and those who were taught using
conventional method. The experimental design was used in this study. Therefore,
the obtained data from pre-test and post-test were calculated by using statistical
calculation.
Based on the analysis of the pre-test data, the t-test result was not
significant. It meant that there was no significant difference in the students’
achievement of writing announcement text before the treatment was given. In

57
other words, there was similarity in pre-test data in the experimental and the
control groups. Thus, it was concluded that both of groups had the same initial
condition.
After that, the experimental group was given a treatment in a form of
Gallery Walk technique to teach writing announcement texts. Based on Francek
(2006), Gallery Walk technique was “a discussion technique that gets students out
of their chairs and actively involved in synthesizing important science concept,
writing, and public speaking.”
After the treatments were given, the post-test data were analyzed. Based
on the analysis of the post-test data, the t-test result was significant. It meant that
there was significant difference in post-test data in the experimental and the
control groups where the students’ achievement in experimental group was higher
or better than that in the control group. In other words, the application of Gallery
Walk technique to the experimental group improved the students’ achievement in
writing announcement texts.
In this matter, it meant that the working hypothesis which stated that
“There is significant difference in the achievement of writing announcement text
between the eighth grade students of SMP Muhammadiyah 1 Weleri in the
academic year of 2013/2014 who are taught using Gallery Walk technique and
those who are taught using conventional method” was accepted.
4.5 Some Obstacles in Doing the Research
At the beginning of the research, the students got difficulty in applying Gallery

58
Walk technique in writing announcement texts. They got confused because they
have never had such technique before. However, this difficulty could be solved by
explaining them what Gallery Walk technique was and how to use it in writing
activity. In the first time when they were doing small groups, they did it slowly.
Later on, they were accustomed to do it and did the work faster.
Another problem was the transition process from one station to other
stations. Many students made some noisiness. Besides, they also made some chit
chat in group discussion. Not only that, some students were found to be active and
some to be passive.
The researcher had to find some efforts so that the students could do the
group work well appropriate with the procedure and the time allotment. This
matter was a bit difficult for the researcher because this activity needed an extra
coordination. Shortly speaking, this technique needed an attention in the
management of time, space, and class.

59
CHAPTER V
CONCLUSION AND SUGGESTIONS
This chapter is the last chapter in this study. It consists of conclusion and
suggestions related to the topic of the study.
5.1 Conclusion
Based on the result of the data analysis presented in chapter IV, the results of the
research were:
1) There was significant difference in the achievement of writing announcement
text between the eighth grade students of SMP Muhammadiyah 1 Weleri in
the academic year of 2013/2014 who were taught using Gallery Walk
technique and those who were taught using conventional method.
2) The students’ achievement of writing announcement text who were taught by
using Gallery Walk technique was higher or better than those who were
taught by using conventional method.
Based on those results, it could be concluded that using Gallery Walk technique
improved the students’ achievement in writing announcement texts for the eighth
grade students of SMP Muhammadiyah 1 Weleri in the academic year of
2013/2014.

60
5.2 Suggestions
It is necessary to have other investigation as follow up to the research that had been
done. The same research would reinforce the findings. Some suggestions for the
teachers, students, and future researchers are listed as follows:
1) For the teachers:
For the teachers, Gallery Walk technique might be an alternative method to
teach writing. Not only to teach announcement text material, but also could
be used with other materials. It could be used with introductory or advanced
materials by considering its flexibility. Besides that, this technique also could
be used as a teaching method that breaks the lethargy in the classroom and to
make an active learning.
2) For the students:
The students need to practice writing a lot in order to make their writing
better. They should also consider with the aspect of writing such as the
organization, content, grammar, punctuation, and the mechanics of writing.
3) For the future researchers:
A similar research with different population characteristics is also possible. It
may also useful to have a research with different language skill such as
listening, speaking, or reading.
61
BIBLIOGRAPHY
Amaliana, Ilmatun. 2009. The Use of Wall Magazine as a Medium in Motivating
Students’ Writing Skill to the Second Year Students of SMP N 19
Semarang in the Academic Year of 2008-2009. Final Project English
Department FBS Unnes.
Ardi, Aditia Melani. 2011. Improving the Students’ Writing Skill through
Cooperative Learning. Thesis English Education Department Sebelas
Maret University.
Bailey, Matilda and Lalla Walker. 1956. Our English Language. US: American
Books Company.
Bowman, Sharon L. 2005. The Gallery Walk: An Opening, Closing, and Review
Activity. Available at
http://www.bowperson.com/BOWPERSON/GalleryWalk.pdf [accessed
April 2013]
Brown, H. Douglas. 2001. Teaching by Principles, an Interactive Approach to
Language Pedagogy. New York: Longman.
________________. 2004. Language Assessment. New York: Longman.
Francek, Mark. 2006. Promoting Discussion in the Science Classroom Using
Gallery Walks. Journal of College Science Teaching, September. Page.
27-31. Available at http://blog.stetson.edu/jrseminars/wp-
content/uploads/Gallery-Walk.pdf [accessed May 2013]
Gitaningrum, Fajar. 2011. Developing Announcement Multimedia Material to
Teach Written Short Functional Text in junior High School Level. Final
Project English Department FBS Unnes.
Halliday, M. A. K and Ruqaiya Hasan. 1985. Bahasa, Konteks, dan Teks.
Yogyakarta: Gadjah Mada University Press.
Harmer, Jerremy. 2004. How to Teach Writing. London: Longman.
Hartley, James. 1980. The Psychology of Written Communication. London: Kogan
Page Limited.
Harmer, Jerremy. 2004. How to Teach Writing. London: Longman.

62
Majiasih, Hariyati. 2012. The Effectiveness of Gallery Walk to Teach speaking
Viewed from the Students’ Self-Esteem. Thesis English Education
Department Sebelas Maret University.
Meyers, Alan. 2005. Gateways to Academic Writing: Effective Sentences,
Paragraphs, and Essays. New York: Longman.
Mujiyanto, Yan. 2011. Petunjuk Penulisan Skripsi. Semarang: UNNES Press.
Palmer, C. Barbara, Mary L. Hafner, and Marylin F. Sharp. 1994. Developing
Cultural Literacy through the Writing Process. Massachusetts: Allyn and
Bacon.
Palupi, Fiqih Nindya. 2011. Classroom Magazine as a Project Work to Motivate
Students to Improve Their Writing Skill. Final Project English Department
FBS Unnes.
Saleh, M. 2011. Linguistics and Educational Research. Handout and Assignment
of Semarang State University.
Shane, Harold.G., F.K. Ferris, and E.E. Keener. 1958. Pathways to Good English.
Illinois: Laidlaw Brothers Publishers.
Slameto. 2010. Belajar dan Faktor-faktor yang Mempengaruhinya. Jakarta:
Rineka Cipta.
Sudjana. 2005. Metoda Statistika. Bandung: Tarsito.

63
LESSON PLAN OF THE EXPERIMENTAL GROUP
School : SMP Muhammadiyah 1 Weleri
Subject : English
Class/Semester : VIII/1
Time Allotment : 8 x 40’ (4 meetings)
Competence Standard : Menulis
6. Mengungkapkan makna dalam teks tulis fungsional dan
esei pendek sederhana berbentuk descriptive, dan recount
untuk berinteraksi dengan lingkungan sekitar
Basic Competence : 6.1 Mengungkapkan makna dalam bentuk teks tulis
fungsional pendek sederhana dengan menggunakan
ragam bahasa tulis secara akurat, lancar dan beterima
untuk berinteraksi dengan lingkungan sekitar
Indicators:
1. Students recognize the parts of announcement text.
2. Students mention information found in the given announcement text.
3. Students make an announcement text in group and individually.
Appendix 1

64
A. Learning Objectives
By learning of announcement text, in the end of meeting 75% of students are
able to:
1. Recognize an announcement text.
2. Mention the social function of announcement text.
3. Recognize the parts of an announcement text.
4. Give response the content of announcement text by answering questions
and doing small group and whole class discussion.
5. Analyze the content in announcement text.
6. Enrich their vocabulary sequence with announcement text.
7. Comprehend the grammar used in announcement text, they are simple
future tense and simple past tense.
8. Encourage in learning English by the application of gallery walk
technique as treatment.
9. Write an announcement text in group.
10. Write an announcement text individually.
B. Learning Material
1. Kinds of announcement text and questions
2. Social function and the parts of announcement text
3. Vocabulary
4. Punctuation and spelling
5. Grammar (simple future tense, simple past tense)

65
C. Learning Methods
1. Gallery walk technique
D. Learning Activities
Opening
1. Class is opened by praying together.
2. Teacher checks the students’ attendance.
Main Activities
(1) Meeting 1 (2x40’)
It will be divided into two activities, they are: pre-test and exploration.
Pre-test (60’)
1. Students are told that they will be given a pre-test today. The aim
of the pre-test is to measure their ability in writing announcement
text before they are given the treatment that is taught using
gallery walk technique.
2. Students are given a piece of paper containing the instruction, the
themes of announcement text that will be chosen to write, scoring
rubric, and a piece of worksheet.
3. Students submit their works.
Exploration (20’)
4. Students are asked questions about announcement text and the
gallery walk technique that they will practice.

66
5. Students and teacher discuss about announcement text and how to
use gallery walk technique in writing activity.
(2) Meeting 2 (2x40’) – Elaboration
1. Review about the last meeting, that is about announcement text and
how to use the gallery walk technique in writing activity.
2. The class is divided into five groups.
3. In class there will be five stations, each station will be provided with
example of announcement and question.
4. Each group will rotate from station one to five to answer all
questions based on the example of announcement on the answer
sheet in a given time.
5. After all groups have finished rotating and answering all questions,
there will be class discussion.
6. The students are told that in the next meeting they will practice to
make announcement text.
(3) Meeting 3 (2x40’)
1. Review about the last week meeting.
2. The students are divided into five groups (same group with the
previous meeting).
3. In groups, the students try to make an announcement.
4. After that, they stick their group works on the wall.

67
5. The students do gallery walk like the previous meeting, each group
rotates visiting the other groups’ works. However, this time they
don’t answer the questions but they give feedback or comment to the
other groups’ works.
6. The students back to their desks and do a class discussion.
7. The students ask about difficulties they found.
8. The students are told that they will be given a post-test in the next
meeting.
(4) Meeting 4 (2x40’) – Confirmation
It will be divided into two activities, they are: review and post-test.
Review (20’)
The students and teacher review about the all meeting and the
activities they have done.
Post-test (60’)
The students do the post-test (the instrument of the post-test is
similar with those on the pre-test), then they submit it to the teacher.
Closing
1. Students tell what they have learned in class, the teacher gives some
feedback.
2. Teacher closed the lesson.

68
E. Learning Source
1. English textbook:
Bima M, Bachtiar and Cicik Kurniawati. 2005. Let’s Talk: Grade VIII
for Junior High School. Bandung: Pakar Raya.
2. Articles from internet
3. Relevant material
4. Dictionary
F. Assessment
In this evaluation, the rubric of scoring will use the Analytic Scale for Rating
Composition Task (Brown & Bailey, 1984: 39-41)
Organization:
Introduction,
body and
conclusion
20-18
appropriate title, effective introductory paragraph,
topic is stated, leads to body; arrangement of
material shows plan (could be outlined by readers);
supporting evidence given for generalization;
conclusion logical and complete
17-15
adequate title, introduction and conclusion; body of
essay is acceptable, but some evidences may be
lacking, some ideas are not fully developed;
sequence is logical but transitional expression may
be absent or misused
14-12
mediocre or scant introduction or conclusion;
problems with the order of ideas in body; the
generalization may not be fully supported by the
evidence given; problems of organization interfere
11-6
shaky or minimally recognizable introduction;
organization can barely be seen; severe problems
with ordering of ideas; lack of supporting evidence;
conclusion weak or illogical; inadequate effort at
organization

69
5-1 absent of introduction and conclusion; no apparent
organization of body; severe lack of supporting
evidence; writer has not made any effort to organize
the composition (could not be outlined by reader)
Logical
development
of ideas:
Content
20-18
essay addresses the assigned topic; the ideas are
concrete and thoroughly developed; no extraneous
material; essay reflect thought
17-15 essay addresses the issues but misses some points;
ideas could be more developed; some extraneous
material is present
14-12 development of ideas not complete or essay is
somewhat out off the topic; paragraphs are not
divided exactly right
11-6 ideas incomplete; essay does not reflect careful
thinking or was hurriedly written; inadequate of
effort in area of content
5-1 Numerous serious mistakes, no mastery of sentence
construction, almost intelligible.
Grammar
20-18 native like fluency in English grammar; correct use
of relative clauses, preposition, modals, articles,
verb form and tense sequencing; no fragments or
run on sentence
17-15
advance proficiency in English grammar; some
grammar problems do not influence communication,
although the reader is aware of them; no fragment
of run on sentence
14-12 ideas are getting through to the reader, but grammar
problems are apparent and have negative effect on
communication; run on sentence or fragment
present
11-6
numerous serious grammar problems interfere with
communication of the writer’s ideas; grammar
review of some areas clearly needed; difficult to
read sentences
5-1
severe grammar problems interfere greatly with the
message; reader cannot understand what the writer
was trying to say; unintelligible sentence structure

70
Punctuation,
spelling and
mechanics
20-18
correct use of English writing conventions: left and
right margins, all needed capitals, paragraph
intended, punctuation and spelling; very neat
17-15 some problems with writing conventions or
punctuation; occasionally spelling errors; left
margin correct; paper is neat legible
14-12 uses general writing conventions but has errors;
spelling problems distract reader; punctuation errors
interfere with ideas
11-6 serious problems with format of paper; part of essay
not legible; errors in sentence punctuation and final
punctuation; unacceptable to educated reader
5-1 complete disregard of English writing convention;
paper illegible; obvious capital missing, no margins;
severe spelling problems
Style and
quality of
expression
20-18 precise vocabulary usage; use of parallel structures;
concise; register good
17-15
attempts variety; good vocabulary; not wordy,
register OK; style fairly concise
14-12
some vocabulary misused; lack awareness of
register; may be too wordy
11-6 poor expression of ideas; problems in vocabulary;
lack variety of structure
5-1 inappropriate use of vocabulary, no concept of
register or sentence variety
Maximum score: 100 point
Individual Assignment
To obtain an exact score we add the score of each component to the others.
Maximum score of each component: 20
The formula: Score = 20 + 20 + 20 + 20 + 20 = 100

71
Mastery Level Based on Harris (1969: 134)
Test Score Probable class performance
80-100 Good to excellent
60-70 Average to good
50-59 Poor to average
0-49 Poor

72
LESSON PLAN OF THE CONTROL GROUP
School : SMP Muhammadiyah 1 Weleri
Subject : English
Class/Semester : VIII/1
Time Allotment : 8 x 40’ (4 meetings)
Competence Standard : Menulis
6. Mengungkapkan makna dalam teks tulis fungsional dan
esei pendek sederhana berbentuk descriptive, dan recount
untuk berinteraksi dengan lingkungan sekitar
Basic Competence : 6.1 Mengungkapkan makna dalam bentuk teks tulis
fungsional pendek sederhana dengan menggunakan
ragam bahasa tulis secara akurat, lancar dan beterima
untuk berinteraksi dengan lingkungan sekitar
Indicators:
1. Students recognize the parts of announcement text.
2. Students mention information found in the given announcement text.
3. Students make an announcement text in group and individually.
Appendix 2

73
A. Learning Objectives
By learning of announcement text, in the end of meeting 75% of students are
able to:
1. Recognize an announcement text.
2. Mention the social function of announcement text.
3. Recognize the parts of an announcement text.
4. Give response the content of announcement text by answering questions.
5. Analyze the content in announcement text.
6. Enrich their vocabulary sequence with announcement text.
7. Comprehend the grammar used in announcement text, they are simple
future tense and simple past tense.
8. Write an announcement text in group.
9. Write an announcement text individually.
B. Learning Material
1. Kinds of announcement text and questions
2. Social function and the parts of announcement text
3. Vocabulary
4. Punctuation and spelling
5. Grammar (simple future tense, simple past tense)
C. Learning Methods
1. Conventional method

74
D. Learning Activities
Opening
1. Class is opened by praying together.
2. Teacher checks the students’ attendance.
Main Activities
(1) Meeting 1 (2x40’)
It will be divided into two activities, they are: pre-test and exploration.
Pre-test (60’)
1. Students are told that they will be given a pre-test today. The aim
of the pre-test is to measure their ability in writing announcement
text before they are taught using conventional method.
2. Students are given a piece of paper containing the instruction, the
themes of announcement text that will be chosen to write, scoring
rubric, and a piece of worksheet.
3. Students submit their works.
Exploration (20’)
4. Students are asked questions about announcement text as
introduction.
(2) Meeting 2 (2x40’)
1. Teacher asks the students about announcement as a building
knowledge.

75
2. Teacher explains about what announcement is, its social function and
its parts.
3. Teacher gives some examples of announcements then students try to
analyze it about its function, and its parts.
4. Students learn new vocabularies, spelling, and punctuation.
5. Students mention the content of announcement.
6. Teacher explains about the grammar (simple future tense and simple
past tense).
7. Teacher gives some exercise.
8. Students are told that in the next meeting they will practice to make
announcement text.
(3) Meeting 3 (2x40’)
1. Review about the last week meeting.
2. Teacher gives other examples of announcement and students try to
mention the content of announcement.
3. Students fill in the blank some announcements.
4. Students try to make announcement with the given theme guided by
the teacher.
5. Students are told that they will be given a post-test in the next
meeting.
76
(4) Meeting 4 (2x40’)
It will be divided into two activities, they are: review and post-test.
Review (20’)
The students and teacher review about the all meeting and the
activities they have done.
Post-test (60’)
Students do the post-test (the instrument of the post-test is similar
with those on the pre-test), then they submit it to the teacher.
Closing
1. Students tell what they have learned in class, the teacher gives some
feedback.
2. Teacher closed the lesson.
E. Learning Source
1. English textbook:
Bima M, Bachtiar and Cicik Kurniawati. 2005. Let’s Talk: Grade VIII for
Junior High School. Bandung: Pakar Raya.
2. Articles from internet
3. Relevant material
4. Dictionary

77
F. Assessment
In this evaluation, the rubric of scoring will use the Analytic Scale for Rating
Composition Task (Brown & Bailey, 1984: 39-41)
Organization:
Introduction,
body and
conclusion
20-18
appropriate title, effective introductory paragraph,
topic is stated, leads to body; arrangement of
material shows plan (could be outlined by readers);
supporting evidence given for generalization;
conclusion logical and complete
17-15
adequate title, introduction and conclusion; body of
essay is acceptable, but some evidences may be
lacking, some ideas are not fully developed;
sequence is logical but transitional expression may
be absent or misused
14-12
mediocre or scant introduction or conclusion;
problems with the order of ideas in body; the
generalization may not be fully supported by the
evidence given; problems of organization interfere
11-6
shaky or minimally recognizable introduction;
organization can barely be seen; severe problems
with ordering of ideas; lack of supporting evidence;
conclusion weak or illogical; inadequate effort at
organization
5-1 absent of introduction and conclusion; no apparent
organization of body; severe lack of supporting
evidence; writer has not made any effort to organize
the composition (could not be outlined by reader)
Logical
development
of ideas:
Content
20-18
essay addresses the assigned topic; the ideas are
concrete and thoroughly developed; no extraneous
material; essay reflect thought
17-15 essay addresses the issues but misses some points;
ideas could be more developed; some extraneous
material is present
14-12 development of ideas not complete or essay is
somewhat out off the topic; paragraphs are not
divided exactly right

78
11-6 ideas incomplete; essay does not reflect careful
thinking or was hurriedly written; inadequate of
effort in area of content
5-1 Numerous serious mistakes, no mastery of sentence
construction, almost intelligible.
Grammar
20-18 native like fluency in English grammar; correct use
of relative clauses, preposition, modals, articles,
verb form and tense sequencing; no fragments or
run on sentence
17-15
advance proficiency in English grammar; some
grammar problems do not influence communication,
although the reader is aware of them; no fragment
of run on sentence
14-12 ideas are getting through to the reader, but grammar
problems are apparent and have negative effect on
communication; run on sentence or fragment
present
11-6
numerous serious grammar problems interfere with
communication of the writer’s ideas; grammar
review of some areas clearly needed; difficult to
read sentences
5-1
severe grammar problems interfere greatly with the
message; reader cannot understand what the writer
was trying to say; unintelligible sentence structure
Punctuation,
spelling and
mechanics
20-18
correct use of English writing conventions: left and
right margins, all needed capitals, paragraph
intended, punctuation and spelling; very neat
17-15 some problems with writing conventions or
punctuation; occasionally spelling errors; left
margin correct; paper is neat legible
14-12 uses general writing conventions but has errors;
spelling problems distract reader; punctuation errors
interfere with ideas
11-6 serious problems with format of paper; part of essay
not legible; errors in sentence punctuation and final
punctuation; unacceptable to educated reader

79
5-1 complete disregard of English writing convention;
paper illegible; obvious capital missing, no margins;
severe spelling problems
Style and
quality of
expression
20-18 precise vocabulary usage; use of parallel structures;
concise; register good
17-15
attempts variety; good vocabulary; not wordy,
register OK; style fairly concise
14-12
some vocabulary misused; lack awareness of
register; may be too wordy
11-6 poor expression of ideas; problems in vocabulary;
lack variety of structure
5-1 inappropriate use of vocabulary, no concept of
register or sentence variety
Maximum score: 100 point
Individual Assignment
To obtain an exact score we add the score of each component to the others.
Maximum score of each component: 20
The formula: Score = 20 + 20 + 20 + 20 + 20 = 100
Mastery Level Based on Harris (1969: 134)
Test Score Probable class performance
80-100 Good to excellent
60-79 Average to good
50-59 Poor to average
0-49 Poor

80
INSTRUMENT OF THE RESEARCH (TEST)
(This instrument is used for tryout, pre-test, and post-test)
A. GENERAL DESCRIPTION
The test is used to measure the students’ mastery of writing an announcement
text. The material of announcement text is given in grade VIII of junior high
school in semester 1 and is included in writing skill. Therefore, the test will
be given to the eight grade students. The aim of the test is to find out whether
the students master about the things:
1. The parts of announcement text.
2. How to compose a good announcement text; by considering its
organization, content, grammar, mechanics, and style in writing.
(The student’s understanding of point 1 and 2 can be seen on their written
product.)
B. THE QUESTIONS
There would be a writing section in the test. Students are asked to write an
announcement text by choosing one of the given themes.
C. THE ITEMS OF THE WRITING TEST
Experimental and Control Group
The writing test will be given for both the experimental and the control
groups and will be conducted twice for each group. The first writing test will
be given in pre-test and the other one in post-test. The instrument of writing
test for the experimental and the control groups are the same.
Appendix 3

81
TEST INSTRUMENT
Class : VIII
Subject : English
Text : Short Functional Text (Announcement text)
Time Allotment : 60 minutes
Instruction:
1. Write your name, class, and student number on the top corner of your
answer sheet.
2. Write an announcement text by choosing one of the following given
themes.
3. Remember to include the parts of announcement text.
4. Time allotment is 60 minutes.
5. Your written announcement text will be scored based on these
considerations:
a. Organization: Introduction, Body, and Conclusion
b. Content
c. Grammar
d. Punctuation, spelling, and mechanics
e. Style and quality of expression
6. Key words:
a. Who is giving the event, program or exhibit?
b. What kind of event is it?
c. When will it be held?
d. Where will it be held?
e. Who is invited to come?
7. Themes:
a. Breaking of Fast Together
b. Halal Bihalal
c. Celebration of Indonesian Independence Day
d. School Arts Exhibition
e. School Reunion

82
Analytic Scale for Rating Composition Task (Brown & Bailey
1984:39-41)
Organization:
Introduction,
body and
conclusion
20-18
appropriate title, effective introductory paragraph,
topic is stated, leads to body; arrangement of
material shows plan (could be outlined by readers);
supporting evidence given for generalization;
conclusion logical and complete
17-15
adequate title, introduction and conclusion; body of
essay is acceptable, but some evidences may be
lacking, some ideas are not fully developed;
sequence is logical but transitional expression may
be absent or misused
14-12
mediocre or scant introduction or conclusion;
problems with the order of ideas in body; the
generalization may not be fully supported by the
evidence given; problems of organization interfere
11-6
shaky or minimally recognizable introduction;
organization can barely be seen; severe problems
with ordering of ideas; lack of supporting evidence;
conclusion weak or illogical; inadequate effort at
organization
5-1 absent of introduction and conclusion; no apparent
organization of body; severe lack of supporting
evidence; writer has not made any effort to organize
the composition (could not be outlined by reader)
Logical
development
of ideas:
Content
20-18
essay addresses the assigned topic; the ideas are
concrete and thoroughly developed; no extraneous
material; essay reflect thought
17-15 essay addresses the issues but misses some points;
ideas could be more developed; some extraneous
material is present
14-12 development of ideas not complete or essay is
somewhat out off the topic; paragraphs are not
divided exactly right
11-6 ideas incomplete; essay does not reflect careful
thinking or was hurriedly written; inadequate of
effort in area of content
Appendix 4

83
5-1 Numerous serious mistakes, no mastery of sentence
construction, almost intelligible.
Grammar
20-18 native like fluency in English grammar; correct use
of relative clauses, preposition, modals, articles,
verb form and tense sequencing; no fragments or
run on sentence
17-15
advance proficiency in English grammar; some
grammar problems do not influence communication,
although the reader is aware of them; no fragment
of run on sentence
14-12 ideas are getting through to the reader, but grammar
problems are apparent and have negative effect on
communication; run on sentence or fragment
present
11-6
numerous serious grammar problems interfere with
communication of the writer’s ideas; grammar
review of some areas clearly needed; difficult to
read sentences
5-1
severe grammar problems interfere greatly with the
message; reader cannot understand what the writer
was trying to say; unintelligible sentence structure
Punctuation,
spelling and
mechanics
20-18
correct use of English writing conventions: left and
right margins, all needed capitals, paragraph
intended, punctuation and spelling; very neat
17-15 some problems with writing conventions or
punctuation; occasionally spelling errors; left
margin correct; paper is neat legible
14-12 uses general writing conventions but has errors;
spelling problems distract reader; punctuation errors
interfere with ideas
11-6 serious problems with format of paper; part of essay
not legible; errors in sentence punctuation and final
punctuation; unacceptable to educated reader
5-1 complete disregard of English writing convention;
paper illegible; obvious capital missing, no margins;
severe spelling problems

84
Style and
quality of
expression
20-18 precise vocabulary usage; use of parallel structures;
concise; register good
17-15
attempts variety; good vocabulary; not wordy,
register OK; style fairly concise
14-12
some vocabulary misused; lack awareness of
register; may be too wordy
11-6 poor expression of ideas; problems in vocabulary;
lack variety of structure
5-1 inappropriate use of vocabulary, no concept of
register or sentence variety
Maximum score: 100 point
Individual Assignment
To obtain an exact score we add the score of each component to the others.
Maximum score of each component: 20
The formula: Score = 20 + 20 + 20 + 20 + 20 = 100
Mastery Level Based on Harris (1969: 134)
Test Score Probable class performance
80-100 Good to excellent
60-70 Average to good
50-59 Poor to average
0-49 Poor

85
STUDENT WORKSHEET
Name :
Class :
Student Number :
Theme :
………………………………………………………………………………………
………………………………………………………………………………………
………………………………………………………………………………………
………………………………………………………………………………………
………………………………………………………………………………………
………………………………………………………………………………………
………………………………………………………………………………………
………………………………………………………………………………………
………………………………………………………………………………………
………………………………………………………………………………………
………………………………………………………………………………………
………………………………………………………………………………………
………………………………………………………………………………………
………………………………………………………………………………………
………………………………………………………………………………………
………………………………………………………………………………………
………………………………………………………………………………………
………………………………………………………………………………………
………………………………………………………………………………………
………………………………………………………………………………………
………………………………………………………………………………………
……………………………………………………………………………………....

86
The Score Analysis of Try Out Test
No Code of
Respondent
Score per Item Total
Score O C G P S
1 R-1 10 11 12 13 12 58
2 R-2 10 12 13 14 12 61
3 R-3 8 9 11 12 11 51
4 R-4 15 16 17 14 15 77
5 R-5 8 13 12 11 12 56
6 R-6 13 14 13 14 13 67
7 R-7 12 10 13 12 13 60
8 R-8 16 12 17 14 16 75
9 R-9 9 10 9 11 8 47
10 R-10 19 17 18 15 16 85
11 R-11 14 16 12 12 14 68
12 R-12 15 12 15 13 14 69
13 R-13 15 14 15 13 14 71
14 R-14 13 12 12 13 14 64
15 R-15 15 14 11 13 8 61
16 R-16 14 13 15 9 14 65
17 R-17 15 12 14 15 15 71
18 R-18 12 11 10 13 10 56
19 R-19 14 12 11 10 12 59
20 R-20 8 13 14 8 9 52
21 R-21 10 15 13 10 13 61
22 R-22 13 13 16 14 15 71
23 R-23 18 16 15 15 16 80
24 R-24 2 1 2 2 2 9
25 R-25 10 12 13 11 13 59
26 R-26 12 10 11 13 13 59
27 R-27 14 14 13 11 12 64
28 R-28 17 17 15 14 14 77
Sum 1753
Mean 62.6071
Appendix 5

87
The Statistical Analysis of Try Out Test
No
Code
of
Respondent
Score per Item Total
Score
(Total
Score)2 O (O)2 C (C)2 G (G)2 P (P)2 S (S)2
1 R-1 10 100 11 121 12 144 13 169 12 144 58 3364
2 R-2 10 100 12 144 13 169 14 196 12 144 61 3721
3 R-3 8 64 9 81 11 121 12 144 11 121 51 2601
4 R-4 15 225 16 256 17 289 14 196 15 225 77 5929
5 R-5 8 64 13 169 12 144 11 121 12 144 56 3136
6 R-6 13 169 14 196 13 169 14 196 13 169 67 4489
7 R-7 12 144 10 100 13 169 12 144 13 169 60 3600
8 R-8 16 256 12 144 17 289 14 196 16 256 75 5625
9 R-9 9 81 10 100 9 81 11 121 8 64 47 2209
10 R-10 19 361 17 289 18 324 15 225 16 256 85 7225
11 R-11 14 196 16 256 12 144 12 144 14 196 68 4624
12 R-12 15 225 12 144 15 225 13 169 14 196 69 4761
13 R-13 15 225 14 196 15 225 13 169 14 196 71 5041
14 R-14 13 169 12 144 12 144 13 169 14 196 64 4096
15 R-15 15 225 14 196 11 121 13 169 8 64 61 3721
16 R-16 14 196 13 169 15 225 9 81 14 196 65 4225
17 R-17 15 225 12 144 14 196 15 225 15 225 71 5041
18 R-18 12 144 11 121 10 100 13 169 10 100 56 3136
19 R-19 14 196 12 144 11 121 10 100 12 144 59 3481
20 R-20 8 64 13 169 14 196 8 64 9 81 52 2704
21 R-21 10 100 15 225 13 169 10 100 13 169 61 3721
22 R-22 13 169 13 169 16 256 14 196 15 225 71 5041
23 R-23 18 324 16 256 15 225 15 225 16 256 80 6400
24 R-24 2 4 1 1 2 4 2 4 2 4 9 81
25 R-25 10 100 12 144 13 169 11 121 13 169 59 3481
26 R-26 12 144 10 100 11 121 13 169 13 169 59 3481
27 R-27 14 196 14 196 13 169 11 121 12 144 64 4096
28 R-28 17 289 17 289 15 225 14 196 14 196 77 5929
∑X 351 351 362 339 350 1753 114959
∑X2 4755 4663 4934 4299 4618
Appendix 6

88
The statistical analysis of try out test is used to find out the reliability of the test
instrument. First of all, we have to find the variance of each item by using the
following formula:
After that, we add all those variances as follow:
Then we calculate the total variance as the following:

89
Finally, we find the reliability by using the following formula (Alpha formula):

90
The Score Analysis of Pre-test (Experimental Group)
No Code of
Respondent
Score per item Total
O C G P S
1 E-1 10 12 12 13 14 61
2 E-2 11 9 8 10 7 45
3 E-3 5 7 6 8 10 36
4 E-4 12 13 9 13 12 59
5 E-5 15 15 14 13 13 70
6 E-6 3 5 5 7 6 26
7 E-7 10 14 13 15 14 66
8 E-8 11 13 14 15 15 68
9 E-9 5 4 4 3 4 20
10 E-10 7 10 12 9 12 50
11 E-11 17 16 15 16 15 79
12 E-12 15 13 12 11 12 63
13 E-13 12 9 6 8 10 45
14 E-14 17 15 15 14 15 76
15 E-15 13 14 12 13 14 66
16 E-16 16 14 14 13 14 71
17 E-17 16 14 13 13 14 70
18 E-18 11 12 10 12 12 57
19 E-19 10 7 6 9 12 44
20 E-20 8 12 7 11 12 50
21 E-21 6 8 4 7 7 32
22 E-22 14 14 12 14 13 67
23 E-23 14 13 12 15 12 66
24 E-24 6 4 7 9 10 36
25 E-25 6 8 11 13 12 50
26 E-26 4 4 3 5 4 20
27 E-27 9 10 8 10 11 48
28 E-28 12 13 11 12 12 60
TOTAL 295 302 275 311 318 1501
MEAN 10.54 10.79 9.82 11.11 11.36 53.61
Appendix 7

91
The Score Analysis of Pre-test (Control Group)
No Code of
Respondent
Score per item Total
O C G P S
1 C-1 15 12 13 6 7 53
2 C-2 15 11 14 12 10 62
3 C-3 12 9 12 13 13 59
4 C-4 1 2 4 10 6 23
5 C-5 14 15 13 12 13 67
6 C-6 12 13 11 10 12 58
7 C-7 11 8 7 10 9 45
8 C-8 5 9 11 10 12 47
9 C-9 16 15 14 13 13 71
10 C-10 7 6 6 4 5 28
11 C-11 12 13 11 13 12 61
12 C-12 12 14 10 13 14 63
13 C-13 12 12 8 13 13 58
14 C-14 15 15 12 11 12 65
15 C-15 14 13 13 13 12 65
16 C-16 11 11 8 12 13 55
17 C-17 13 13 11 12 12 61
18 C-18 10 8 6 7 9 40
19 C-19 9 6 7 6 8 36
20 C-20 16 15 12 13 12 68
21 C-21 7 7 6 4 6 30
22 C-22 1 2 2 4 3 12
23 C-23 11 12 13 14 12 62
24 C-24 11 12 10 8 10 51
25 C-25 11 12 10 9 11 53
26 C-26 10 12 9 10 10 51
27 C-27 9 10 9 11 11 50
28 C-28 13 12 9 10 11 55
TOTAL 305 299 271 283 291 1449
MEAN 10.89 10.68 9.68 10.11 10.39 51.75
Appendix 8

92
The Score Analysis of Post-test (Experimental Group)
No Code of
Respondent
Score per item Total
O C G P S
1 E-1 15 14 13 13 13 68
2 E-2 13 12 13 12 11 61
3 E-3 12 16 12 9 11 60
4 E-4 15 17 14 11 11 68
5 E-5 17 19 17 16 16 85
6 E-6 7 11 6 5 5 34
7 E-7 20 20 17 18 17 92
8 E-8 16 17 14 9 12 68
9 E-9 12 13 12 10 11 58
10 E-10 13 12 11 12 11 59
11 E-11 18 20 16 14 17 85
12 E-12 14 15 12 15 16 72
13 E-13 12 8 9 10 9 48
14 E-14 20 20 18 19 19 96
15 E-15 18 19 18 16 18 89
16 E-16 18 18 17 15 17 85
17 E-17 17 17 16 15 14 79
18 E-18 18 17 13 15 15 78
19 E-19 15 14 13 14 16 72
20 E-20 13 12 10 12 8 55
21 E-21 12 15 12 13 12 64
22 E-22 17 18 15 16 17 83
23 E-23 13 17 17 15 16 78
24 E-24 19 17 18 17 18 89
25 E-25 13 11 10 11 9 54
26 E-26 14 17 18 16 16 81
27 E-27 12 13 12 12 11 60
28 E-28 18 16 16 12 14 76
TOTAL 421 435 389 372 380 1997
MEAN 15.04 15.54 13.89 13.29 13.57 71.32
Appendix 9

93
The Score Analysis of Post-test (Control Group)
No Code of
Respondent
Score per item Total
O C G P S
1 C-1 10 13 11 12 12 58
2 C-2 15 15 14 14 14 72
3 C-3 18 18 17 18 17 88
4 C-4 7 6 5 6 6 30
5 C-5 14 15 14 13 13 69
6 C-6 15 15 13 13 14 70
7 C-7 12 12 13 11 12 60
8 C-8 16 15 15 11 12 69
9 C-9 17 17 15 16 15 80
10 C-10 12 12 13 11 12 60
11 C-11 17 16 12 13 12 70
12 C-12 17 16 17 16 16 82
13 C-13 14 13 12 11 12 62
14 C-14 15 13 13 15 13 69
15 C-15 16 14 16 10 12 68
16 C-16 16 15 14 12 13 70
17 C-17 17 17 15 16 14 79
18 C-18 12 9 8 10 8 47
19 C-19 10 11 8 8 10 47
20 C-20 17 17 16 15 16 81
21 C-21 7 8 9 7 8 39
22 C-22 12 13 12 9 10 56
23 C-23 15 16 15 15 16 77
24 C-24 13 12 13 9 12 59
25 C-25 14 12 12 11 12 61
26 C-26 15 11 10 11 11 58
27 C-27 11 11 10 9 8 49
28 C-28 15 13 12 10 9 59
TOTAL 389 375 354 332 339 1789
MEAN 13.89 13.39 12.64 11.86 12.11 63.89
Appendix 10
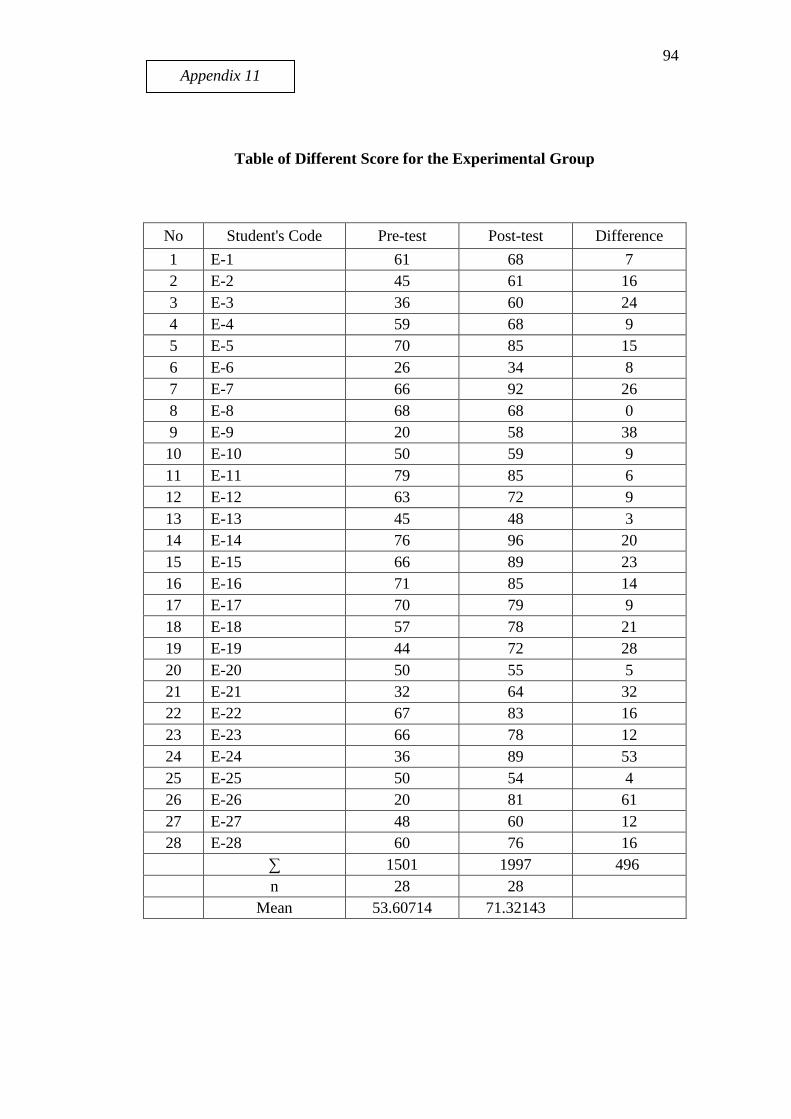
94
Table of Different Score for the Experimental Group
No Student's Code Pre-test Post-test Difference
1 E-1 61 68 7
2 E-2 45 61 16
3 E-3 36 60 24
4 E-4 59 68 9
5 E-5 70 85 15
6 E-6 26 34 8
7 E-7 66 92 26
8 E-8 68 68 0
9 E-9 20 58 38
10 E-10 50 59 9
11 E-11 79 85 6
12 E-12 63 72 9
13 E-13 45 48 3
14 E-14 76 96 20
15 E-15 66 89 23
16 E-16 71 85 14
17 E-17 70 79 9
18 E-18 57 78 21
19 E-19 44 72 28
20 E-20 50 55 5
21 E-21 32 64 32
22 E-22 67 83 16
23 E-23 66 78 12
24 E-24 36 89 53
25 E-25 50 54 4
26 E-26 20 81 61
27 E-27 48 60 12
28 E-28 60 76 16
∑ 1501 1997 496
n 28 28
Mean 53.60714 71.32143
Appendix 11

95
Table of Different Score for the Control Group
No Student's Code Pre-test Post-test Difference
1 C-1 53 58 5
2 C-2 62 72 10
3 C-3 59 88 29
4 C-4 23 30 7
5 C-5 67 69 2
6 C-6 58 70 12
7 C-7 45 60 15
8 C-8 47 69 22
9 C-9 71 80 9
10 C-10 28 60 32
11 C-11 61 70 9
12 C-12 63 82 19
13 C-13 58 62 4
14 C-14 65 69 4
15 C-15 65 68 3
16 C-16 55 70 15
17 C-17 61 79 18
18 C-18 40 47 7
19 C-19 36 47 11
20 C-20 68 81 13
21 C-21 30 39 9
22 C-22 12 56 44
23 C-23 62 77 15
24 C-24 51 59 8
25 C-25 53 61 8
26 C-26 51 58 7
27 C-27 50 49 -1
28 C-28 55 59 4
∑ 1449 1789 340
n 28 28
Mean 51.75 63.89286
Appendix 12

96
PRE-TEST NORMALITY OF THE EXPERIMENTAL GROUP
NO X1 f f.(X1) x1 f.x1 (f.x1)2
1 79 1 79 25.3929 25.3929 644.7972
2 76 1 76 22.3929 22.3929 501.4401
3 71 1 71 17.3929 17.3929 302.5115
4 70 2 140 16.3929 32.7857 1074.9031
5 68 1 68 14.3929 14.3929 207.1543
6 67 1 67 13.3929 13.3929 179.3686
7 66 3 198 12.3929 37.1786 1382.2462
8 63 1 63 9.3929 9.3929 88.2258
9 61 1 61 7.3929 7.3929 54.6543
10 60 1 60 6.3929 6.3929 40.8686
11 59 1 59 5.3929 5.3929 29.0829
12 57 1 57 3.3929 3.3929 11.5115
13 50 3 150 -3.6071 -10.8214 117.1033
14 48 1 48 -5.6071 -5.6071 31.4401
15 45 2 90 -8.6071 -17.2143 296.3316
16 44 1 44 -9.6071 -9.6071 92.2972
17 36 2 72 -17.6071 -35.2143 1240.0459
18 32 1 32 -21.6071 -21.6071 466.8686
19 26 1 26 -27.6071 -27.6071 762.1543
20 20 2 40 -33.6071 -67.2143 4517.7602
Total 28 1501 12040.7653
Mean 53.6071
Variance 430.0273
Standard Deviation 20.7371
Nominal test for pre-test score of the experimental group:
Maximum score = 79
Minimum score = 20
Range = 59
Class Interval = k = 1 + 3.3 log (n)
k = 1 + 3.3 log (28)
k = 1 + 3.3 (1.4471)
Appendix 13

97
k = 5.776 (rounded ~ 6)
Class Width = Range : class interval
= 59 : 5.776
= 10.22 (rounded ~ 10)
Class Interval Frequency
20 - 29 3
30 - 39 3
40 - 49 4
50 - 59 5
60 - 69 8
70 - 79 5
Xmin Zi PZ P Ei Oi (Oi-Ei)
2
Oi
19.5 -1.64474 0.0505
0.0725 2.03 3 0.313633333
29.5 -1.162513 0.123
0.1252 3.5056 3 0.085210453
39.5 -0.680285 0.2482
0.1764 4.9392 4 0.22052416
49.5 -0.198058 0.4246
0.1857 5.1996 5 0.007968032
59.5 0.2841698 0.6103
0.1691 4.7348 8 1.33269138
69.5 0.7663973 0.7794
0.115 3.22 5 0.63368
79.5 1.2486248 0.8944
X12 data 2.593707359
X12data = 2.593707359
dk = sum class interval - 3 = 6 - 3 = 3
X2 (α)(dk) = X
2(5%) (3) = 7.81
Because X12
data (2.593707359) < 7.81 then pre-test score for experimental group is
said to be normally distributed.

98
PRE-TEST NORMALITY OF THE CONTROL GROUP
NO X2 f f.(X2) x2 f.x2 (f.x2)2
1 71 1 71 19.25 19.25 370.5625
2 68 1 68 16.25 16.25 264.0625
3 67 1 67 15.25 15.25 232.5625
4 65 2 130 13.25 26.5 702.25
5 63 1 63 11.25 11.25 126.5625
6 62 2 124 10.25 20.5 420.25
7 61 2 122 9.25 18.5 342.25
8 59 1 59 7.25 7.25 52.5625
9 58 2 116 6.25 12.5 156.25
10 55 2 110 3.25 6.5 42.25
11 53 2 106 1.25 2.5 6.25
12 51 2 102 -0.75 -1.5 2.25
13 50 1 50 -1.75 -1.75 3.0625
14 47 1 47 -4.75 -4.75 22.5625
15 45 1 45 -6.75 -6.75 45.5625
16 40 1 40 -11.75 -11.75 138.0625
17 36 1 36 -15.75 -15.75 248.0625
18 30 1 30 -21.75 -21.75 473.0625
19 28 1 28 -23.75 -23.75 564.0625
20 23 1 23 -28.75 -28.75 826.5625
21 12 1 12 -39.75 -39.75 1580.0625
Total 28 1449 6619.1250
Mean 51.75
Variance 236.3973
Standard
Deviation 15.3752
Nominal test for pre-test score of the control group:
Maximum score = 71
Minimum score = 12
Range = 59
Class Interval = k = 1 + 3.3 log (n)
k = 1 + 3.3 log (28)
Appendix 14

99
k = 1 + 3.3 (1.4471)
k = 5.776 (rounded ~ 6)
Class Width = Range : class interval
= 59 : 5.776
= 10.22 (rounded ~ 10)
Class Interval Frequency
12 - 21 1
22 - 31 3
32 - 41 2
42 - 51 5
52 - 61 9
62 - 71 8
Xmin Zi PZ P Ei Oi (Oi-Ei)
2
Oi
11.5 -2.617849 0.0044
0.02 0.56 1 0.1936
21.5 -1.967452 0.0244
0.069 1.932 3 0.380208
31.5 -1.317055 0.0934
0.158 4.424 2 2.937888
41.5 -0.666657 0.2514
0.2406 6.7368 5 0.603294848
51.5 -0.01626 0.492
0.2437 6.8236 9 0.526301884
61.5 0.6341374 0.7357
0.164 4.592 8 1.451808
71.5 1.2845347 0.8997
X22 data 6.093100732
X22 data = 6.093100732
dk = sum class interval - 3 = 6 - 3 = 3
X2 (α)(dk) = X
2(5%) (3) = 7.81

100
Because X22
data (6.093100732) < 7.81 then pre-test score for control group is said
to be normally distributed.

101
POST-TEST NORMALITY OF THE EXPERIMENTAL GROUP
NO X1 f f.(X1) x1 f.x1 (f.x1)2
1 96 1 96 24.6786 24.6786 609.0319
2 92 1 92 20.6786 20.6786 427.6033
3 89 2 178 17.6786 35.3571 1250.1276
4 85 3 255 13.6786 41.0357 1683.9298
5 83 1 83 11.6786 11.6786 136.3890
6 81 1 81 9.6786 9.6786 93.6747
7 79 1 79 7.6786 7.6786 58.9605
8 78 2 156 6.6786 13.3571 178.4133
9 76 1 76 4.6786 4.6786 21.8890
10 72 2 144 0.6786 1.3571 1.8418
11 68 3 204 -3.3214 -9.9643 99.2870
12 64 1 64 -7.3214 -7.3214 53.6033
13 61 1 61 -10.3214 -10.3214 106.5319
14 60 2 120 -11.3214 -22.6429 512.6990
15 59 1 59 -12.3214 -12.3214 151.8176
16 58 1 58 -13.3214 -13.3214 177.4605
17 55 1 55 -16.3214 -16.3214 266.3890
18 54 1 54 -17.3214 -17.3214 300.0319
19 48 1 48 -23.3214 -23.3214 543.8890
20 34 1 34 -37.3214 -37.3214 1392.8890
Total 28 1997 8066.4592
Mean 71.3214
Variance 288.0878
Standard
Deviation 16.9732
Nominal test for post-test score of the experimental group:
Maximum score = 96
Minimum score = 34
Range = 62
Class Interval = k = 1 + 3.3 log (n)
k = 1 + 3.3 log (28)
Appendix 15

102
k = 1 + 3.3 (1.4471)
k = 5.776 (rounded ~ 6)
Class Width = Range : class interval
= 62 : 5.776
= 10.73 (rounded ~ 11)
Class Interval Frequency
34 - 44 1
45 - 55 3
56 - 66 6
67 - 77 6
78 - 88 8
89 - 99 4
Xmin Zi PZ P Ei Oi (Oi-Ei)
2
Oi
33.5 -2.228309 0.0129
0.0442 1.2376 1 0.05645376
44.5 -1.580227 0.0571
0.1191 3.3348 3 0.03736368
55.5 -0.932144 0.1762
0.2135 5.978 6 0.00008066667
66.5 -0.284062 0.3897
0.2509 7.0252 6 0.175172507
77.5 0.3640203 0.6406
0.2032 5.6896 8 0.66724352
88.5 1.0121027 0.8438
0.1077 3.0156 4 0.24226084
99.5 1.6601851 0.9515
X12
data 1.178574973
X12
data = 1.178574973
dk = sum class interval - 3 = 6 - 3 = 3
X2 (α)(dk) = X
2(5%) (3) = 7.81

103
Because X12 data (1.178574973) < 7.81 then post-test score for experimental group
is said to be normally distributed.

104
POST-TEST NORMALITY OF THE CONTROL GROUP
NO X2 f f.(X2) x2 f.x2 (f.x2)2
1 88 1 88 24.1071 24.1071 581.1543
2 82 1 82 18.1071 18.1071 327.8686
3 81 1 81 17.1071 17.1071 292.6543
4 80 1 80 16.1071 16.1071 259.4401
5 79 1 79 15.1071 15.1071 228.2258
6 77 1 77 13.1071 13.1071 171.7972
7 72 1 72 8.1071 8.1071 65.7258
8 70 3 210 6.1071 18.3214 335.6747
9 69 3 207 5.1071 15.3214 234.7462
10 68 1 68 4.1071 4.1071 16.8686
11 62 1 62 -1.8929 -1.8929 3.5829
12 61 1 61 -2.8929 -2.8929 8.3686
13 60 2 120 -3.8929 -7.7857 60.6173
14 59 2 118 -4.8929 -9.7857 95.7602
15 58 2 116 -5.8929 -11.7857 138.9031
16 56 1 56 -7.8929 -7.8929 62.2972
17 49 1 49 -14.8929 -14.8929 221.7972
18 47 2 94 -16.8929 -33.7857 1141.4745
19 39 1 39 -24.8929 -24.8929 619.6543
20 30 1 30 -33.8929 -33.8929 1148.7258
Total 28 1789 6015.3367
Mean 63.8929
Variance 214.8335
Standard
Deviation 14.6572
Nominal test for pre-test score of the control group:
Maximum score = 88
Minimum score = 30
Range = 58
Class Interval = k = 1 + 3.3 log (n)
k = 1 + 3.3 log (28)
k = 1 + 3.3 (1.4471)
Appendix 16

105
k = 5.776 (rounded ~ 6)
Class Width = Range : class interval
= 58 : 5.776
= 10.0416 (rounded ~ 10)
Class Interval Frequency
30 - 39 2
40 - 49 3
50 - 59 5
60 - 69 8
70 - 79 6
80 - 89 4
Xmin Zi PZ P Ei Oi (Oi-Ei)
2
Oi
29.5 -2.319192 0.0102
0.0403 1.1284 2 0.37984328
39.5 -1.636933 0.0505
0.1206 3.3768 3 0.04732608
49.5 -0.954675 0.1711
0.2225 6.23 5 0.30258
59.5 -0.272416 0.3936
0.2655 7.434 8 0.0400445
69.5 0.4098425 0.6591
0.203 5.684 6 0.016642667
79.5 1.0921012 0.8621
0.0995 2.786 4 0.368449
89.5 1.7743598 0.9616
X22 data 1.154885527
X22 data = 1.154885527
dk = sum class interval - 3 = 6 - 3 = 3
X2 (α)(dk) = X
2(5%) (3) = 7.81
Because X22 data (1.154885527) < 7.81 then post-test score for control group is said
to be normally distributed.

106
HOMOGENEITY FOR PRE-TEST
According to the data we’ve just calculated before, we have:
= 53.61 Variance (Ve) = 430.0273 n1 = 28 (experimental group pre-test)
= 51.75 Variance (Vc) = 236.3973 n2 = 28 (control group pre-test)
The value of F table with dk numerator V1 = n1 – 1 = 28 – 1 = 27, dk denominator
V2 = n2 – 1 = 28 – 1 = 27 and α = 5%, squared to V1 = 28 and V2 = 28 is 1.87.
Because F data (1.82) < 1.87 then we can conclude that the data of both pre-test is
homogeny.
Appendix 17

107
T-TEST FOR PRE-TEST
From the data, we can calculate:
And find out the tvalue by substituting the values into the equation:
0.381341 = 0.38
Appendix 18

108
The value of t-table with dk = 28 + 28 – 2 = 54, squared to 60 and significance
level (α) = 5% is 1.67.
Because tvalue (0.38) < 1.67 thus we can conclude that t is not significant, meaning
that there is similarity in pre-test data in experimental and controlled group.

109
HOMOGENEITY FOR POST-TEST
According to the data we’ve just calculated before, we have:
= 71.32 Variance (Ve) = 288.0878 n1 = 28 (experimental group post-test)
= 63.89 Variance (Vc) = 214.8335 n2 = 28 (control group post-test)
The value of F table with dk numerator V1 = n1 – 1 = 28 – 1 = 27, dk denominator
V2 = n2 – 1 = 28 – 1 = 27 and α = 5%, squared to V1 = 28 and V2 = 28 is 1.87.
Because F data (1.34) < 1.87 then we can conclude that the data of both post-test
is homogeny.
Appendix 19

110
T-TEST FOR POST-TEST
From the data, we can calculate:
And find out the t-value by substituting the values into the equation:
1.75287 = 1.76
Appendix 20

111
The value of t-table with dk = 28 + 28 – 2 = 54, squared to 60 and significance
level (α) = 5% is 1.67.
Because tvalue (1.76) > 1.67 thus we can conclude that t is significant, meaning that
there is difference in post-test data in experimental and controlled group.

112
DOCUMENTATIONS
Picture 1 Picture 2
Picture 3 Picture 4
Picture 5
Appendix 21
Picture 1 – 5: Students did a
gallery walk technique.

113
Picture 6 Picture 7
Picture 8 Picture 9
Picture 6 and 7: Students did group works.
Students were doing small group
discussions during the gallery
walk.
A student came in front of the class
to report the small group
discussion results. I helped her
when she got difficulty.

114
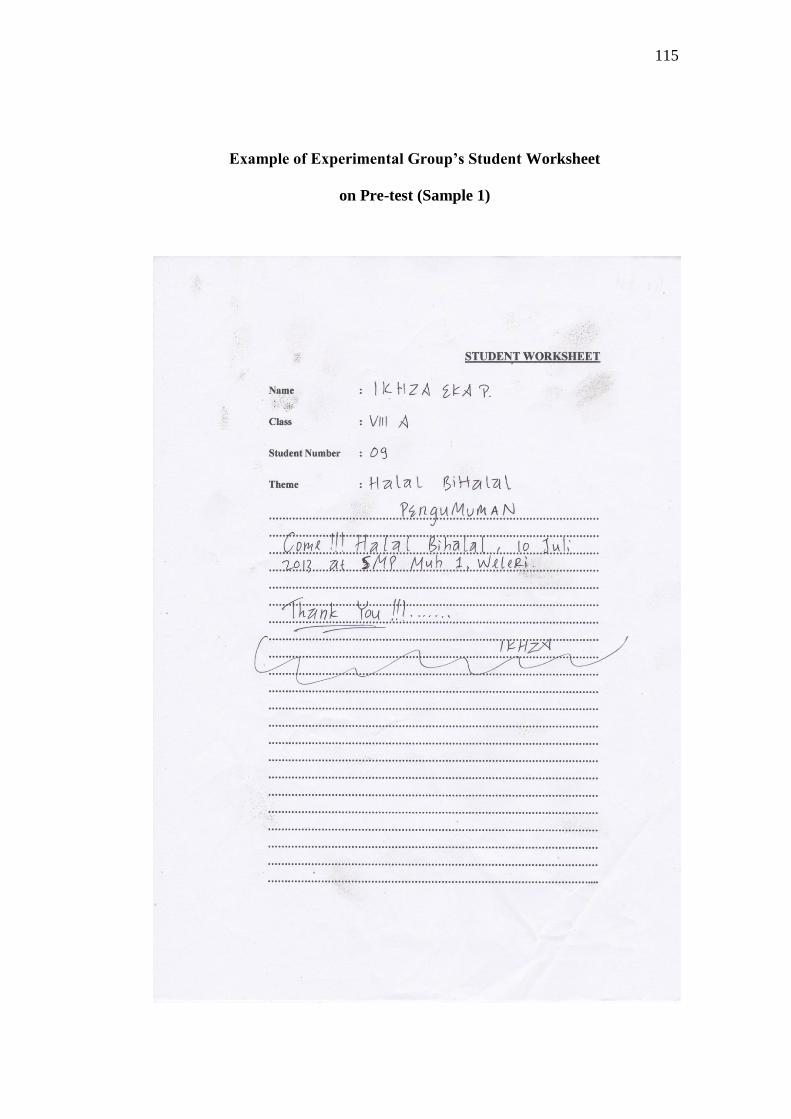
115
Example of Experimental Group’s Student Worksheet
on Pre-test (Sample 1)

116
Example of Experimental Group’s Student Worksheet
on Pre-test (Sample 2)

117
Example of Experimental Group’s Student Worksheet
on Pre-test (Sample 3)

118
Example of Experimental Group’s Student Worksheet
on Post-test (Sample 1)

119
Example of Experimental Group’s Student Worksheet
on Post-test (Sample 2)

120
Example of Experimental Group’s Student Worksheet
on Post-test (Sample 3)

121
Example of Control Group’s Student Worksheet on Pre-test
(Sample 1)

122
Example of Control Group’s Student Worksheet on Pre-test
(Sample 2)

123
Example of Control Group’s Student Worksheet on Pre-test
(Sample 3)

124
Example of Control Group’s Student Worksheet on Post-test
(Sample 1)
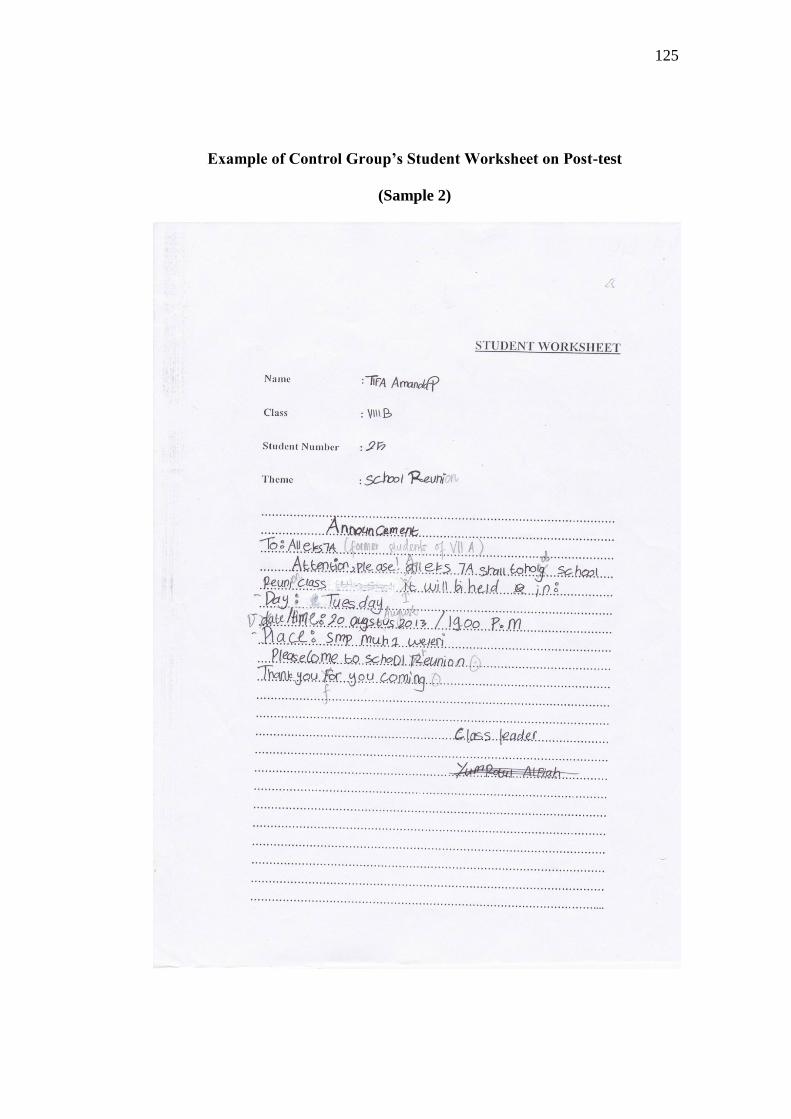
125
Example of Control Group’s Student Worksheet on Post-test
(Sample 2)

126
Example of Control Group’s Student Worksheet on Post-test
(Sample 3)