Embed Size (px)
Citation preview
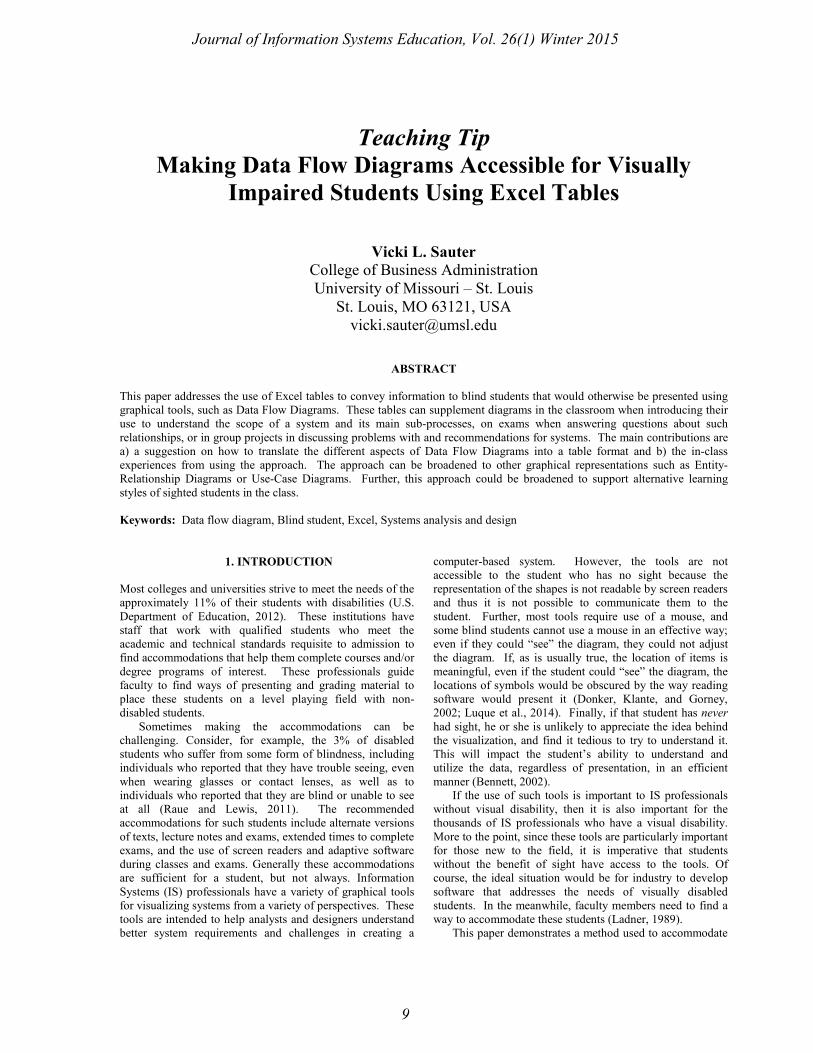
Teaching Tip Making Data Flow Diagrams Accessible for Visually
Impaired Students Using Excel Tables
Vicki L. Sauter College of Business Administration University of Missouri – St. Louis
St. Louis, MO 63121, USA [email protected]
ABSTRACT
This paper addresses the use of Excel tables to convey information to blind students that would otherwise be presented using graphical tools, such as Data Flow Diagrams. These tables can supplement diagrams in the classroom when introducing their use to understand the scope of a system and its main sub-processes, on exams when answering questions about such relationships, or in group projects in discussing problems with and recommendations for systems. The main contributions are a) a suggestion on how to translate the different aspects of Data Flow Diagrams into a table format and b) the in-classexperiences from using the approach. The approach can be broadened to other graphical representations such as Entity-Relationship Diagrams or Use-Case Diagrams. Further, this approach could be broadened to support alternative learning styles of sighted students in the class.
Keywords: Data flow diagram, Blind student, Excel, Systems analysis and design
1. INTRODUCTION
Most colleges and universities strive to meet the needs of the approximately 11% of their students with disabilities (U.S. Department of Education, 2012). These institutions have staff that work with qualified students who meet the academic and technical standards requisite to admission to find accommodations that help them complete courses and/or degree programs of interest. These professionals guide faculty to find ways of presenting and grading material to place these students on a level playing field with non-disabled students.
Sometimes making the accommodations can be challenging. Consider, for example, the 3% of disabled students who suffer from some form of blindness, including individuals who reported that they have trouble seeing, even when wearing glasses or contact lenses, as well as to individuals who reported that they are blind or unable to see at all (Raue and Lewis, 2011). The recommended accommodations for such students include alternate versions of texts, lecture notes and exams, extended times to complete exams, and the use of screen readers and adaptive software during classes and exams. Generally these accommodations are sufficient for a student, but not always. Information Systems (IS) professionals have a variety of graphical tools for visualizing systems from a variety of perspectives. These tools are intended to help analysts and designers understand better system requirements and challenges in creating a
computer-based system. However, the tools are not accessible to the student who has no sight because the representation of the shapes is not readable by screen readers and thus it is not possible to communicate them to the student. Further, most tools require use of a mouse, and some blind students cannot use a mouse in an effective way; even if they could “see” the diagram, they could not adjust the diagram. If, as is usually true, the location of items is meaningful, even if the student could “see” the diagram, the locations of symbols would be obscured by the way reading software would present it (Donker, Klante, and Gorney, 2002; Luque et al., 2014). Finally, if that student has never had sight, he or she is unlikely to appreciate the idea behind the visualization, and find it tedious to try to understand it. This will impact the student’s ability to understand and utilize the data, regardless of presentation, in an efficient manner (Bennett, 2002).
If the use of such tools is important to IS professionals without visual disability, then it is also important for the thousands of IS professionals who have a visual disability. More to the point, since these tools are particularly important for those new to the field, it is imperative that students without the benefit of sight have access to the tools. Of course, the ideal situation would be for industry to develop software that addresses the needs of visually disabled students. In the meanwhile, faculty members need to find a way to accommodate these students (Ladner, 1989).
This paper demonstrates a method used to accommodate
Journal of Information Systems Education, Vol. 26(1) Winter 2015
9
such a student in a Systems Analysis class. The particular diagraming tool discussed is Data Flow Diagrams, which is important both for understanding a computer system and for analysts to communicate changes to the system to a client.
2. DATA FLOW DIAGRAMS
The Data Flow Diagram (DFD) is one of the oldest structured tools available to support systems analysis and design. Gane and Sarson (1979), Yourdon and Constantine (1979), and Hatley and Pirbhai (1987) all recognize the need to provide a graphical representation of the logical path of information through a system. They propose a simple representation that includes the flow of information, the location where information was transformed, the storage of data, and the source and sink of the information. Unlike flow charts that preceded them or the variety of other graphical tools that have come since their development, data flow diagrams do not require the analyst to commit to a physical implementation of any sort. Further, these simple diagrams can be useful to help the analyst understand the system and to communicate about the system to the users. In fact, Gane and Sarson (1979, p.25) identify the diagrams as a “key tool for understanding and working with a system.” More recently, Jeyaraj and Sauter (2007) find that DFDs continue to be an important tool for the analysis of complex systems.
Data Flow Diagrams allow a limited number of symbols to represent the data:
• Square Boxes represent external entities that arethe origins and destinations of the informationoutside of the system
• Circles or Rounded Rectangles represent theactivities, or the transformation of data
• Arcs represent the flow of information fromactivity or sources to another activity or destination
• Rectangles without one side represent the storageof information.
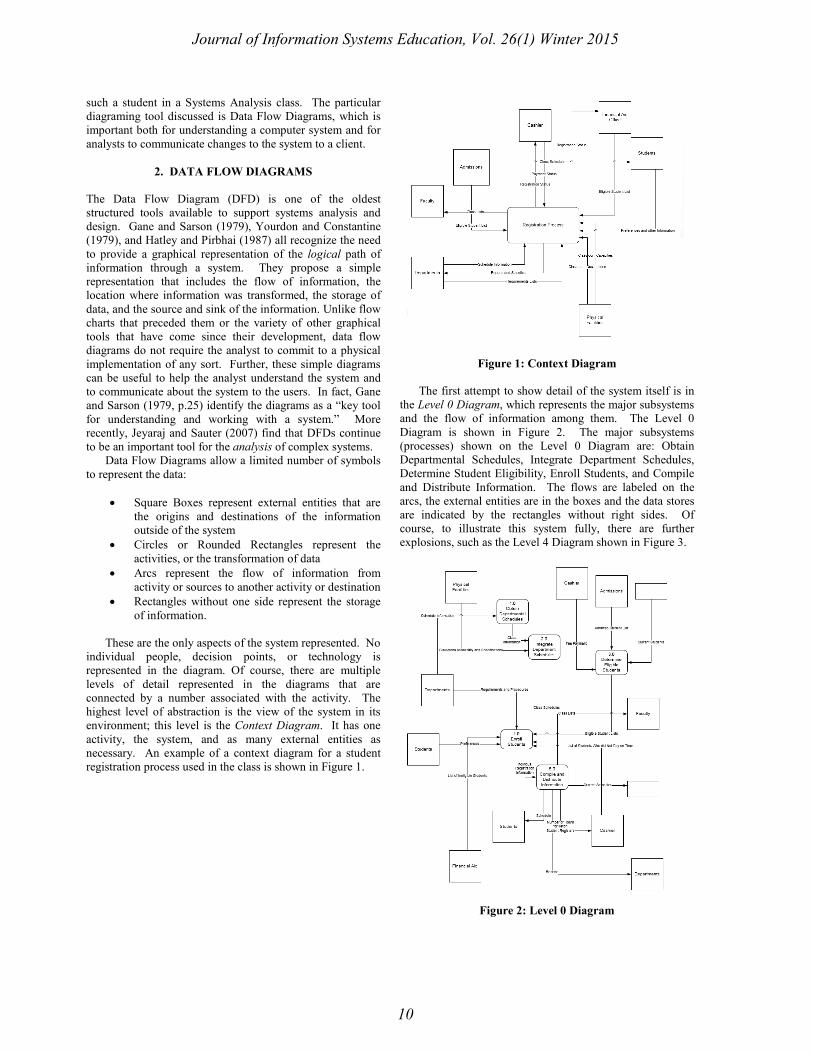
These are the only aspects of the system represented. No individual people, decision points, or technology is represented in the diagram. Of course, there are multiple levels of detail represented in the diagrams that are connected by a number associated with the activity. The highest level of abstraction is the view of the system in its environment; this level is the Context Diagram. It has one activity, the system, and as many external entities as necessary. An example of a context diagram for a student registration process used in the class is shown in Figure 1.
Figure 1: Context Diagram
The first attempt to show detail of the system itself is in the Level 0 Diagram, which represents the major subsystems and the flow of information among them. The Level 0 Diagram is shown in Figure 2. The major subsystems (processes) shown on the Level 0 Diagram are: Obtain Departmental Schedules, Integrate Department Schedules, Determine Student Eligibility, Enroll Students, and Compile and Distribute Information. The flows are labeled on the arcs, the external entities are in the boxes and the data stores are indicated by the rectangles without right sides. Of course, to illustrate this system fully, there are further explosions, such as the Level 4 Diagram shown in Figure 3.
Figure 2: Level 0 Diagram
Journal of Information Systems Education, Vol. 26(1) Winter 2015
10
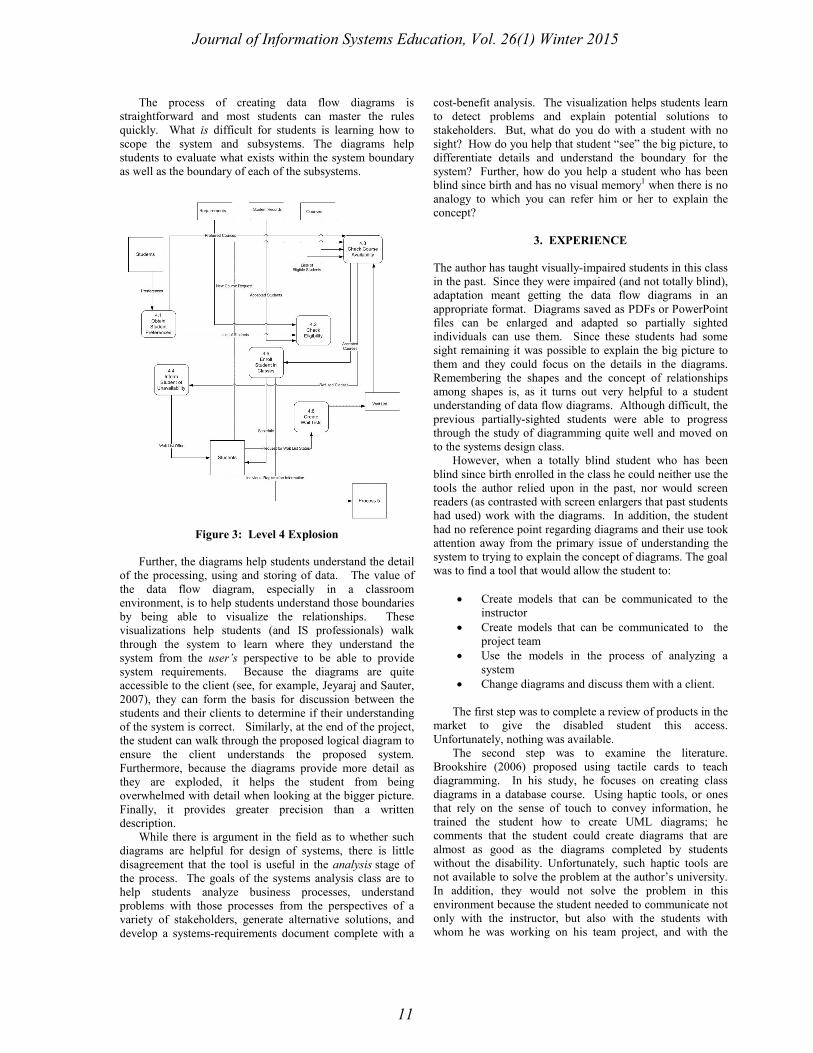
The process of creating data flow diagrams is straightforward and most students can master the rules quickly. What is difficult for students is learning how to scope the system and subsystems. The diagrams help students to evaluate what exists within the system boundary as well as the boundary of each of the subsystems.
Figure 3: Level 4 Explosion
Further, the diagrams help students understand the detail
of the processing, using and storing of data. The value of the data flow diagram, especially in a classroom environment, is to help students understand those boundaries by being able to visualize the relationships. These visualizations help students (and IS professionals) walk through the system to learn where they understand the system from the user’s perspective to be able to provide system requirements. Because the diagrams are quite accessible to the client (see, for example, Jeyaraj and Sauter, 2007), they can form the basis for discussion between the students and their clients to determine if their understanding of the system is correct. Similarly, at the end of the project, the student can walk through the proposed logical diagram to ensure the client understands the proposed system. Furthermore, because the diagrams provide more detail as they are exploded, it helps the student from being overwhelmed with detail when looking at the bigger picture. Finally, it provides greater precision than a written description.
While there is argument in the field as to whether such diagrams are helpful for design of systems, there is little disagreement that the tool is useful in the analysis stage of the process. The goals of the systems analysis class are to help students analyze business processes, understand problems with those processes from the perspectives of a variety of stakeholders, generate alternative solutions, and develop a systems-requirements document complete with a
cost-benefit analysis. The visualization helps students learn to detect problems and explain potential solutions to stakeholders. But, what do you do with a student with no sight? How do you help that student “see” the big picture, to differentiate details and understand the boundary for the system? Further, how do you help a student who has been blind since birth and has no visual memory1 when there is no analogy to which you can refer him or her to explain the concept?
3. EXPERIENCE The author has taught visually-impaired students in this class in the past. Since they were impaired (and not totally blind), adaptation meant getting the data flow diagrams in an appropriate format. Diagrams saved as PDFs or PowerPoint files can be enlarged and adapted so partially sighted individuals can use them. Since these students had some sight remaining it was possible to explain the big picture to them and they could focus on the details in the diagrams. Remembering the shapes and the concept of relationships among shapes is, as it turns out very helpful to a student understanding of data flow diagrams. Although difficult, the previous partially-sighted students were able to progress through the study of diagramming quite well and moved on to the systems design class.
However, when a totally blind student who has been blind since birth enrolled in the class he could neither use the tools the author relied upon in the past, nor would screen readers (as contrasted with screen enlargers that past students had used) work with the diagrams. In addition, the student had no reference point regarding diagrams and their use took attention away from the primary issue of understanding the system to trying to explain the concept of diagrams. The goal was to find a tool that would allow the student to:
• Create models that can be communicated to the
instructor • Create models that can be communicated to the
project team • Use the models in the process of analyzing a
system • Change diagrams and discuss them with a client.
The first step was to complete a review of products in the
market to give the disabled student this access. Unfortunately, nothing was available.
The second step was to examine the literature. Brookshire (2006) proposed using tactile cards to teach diagramming. In his study, he focuses on creating class diagrams in a database course. Using haptic tools, or ones that rely on the sense of touch to convey information, he trained the student how to create UML diagrams; he comments that the student could create diagrams that are almost as good as the diagrams completed by students without the disability. Unfortunately, such haptic tools are not available to solve the problem at the author’s university. In addition, they would not solve the problem in this environment because the student needed to communicate not only with the instructor, but also with the students with whom he was working on his team project, and with the
Journal of Information Systems Education, Vol. 26(1) Winter 2015
11
external client for whom the students completed the project. Haptic tools would not allow easy communication about the diagrams with non-disabled individuals unless they underwent significant training (which seems to be an unreasonable burden). Finally, these tools require Braille reading, and not all visually impaired students master Braille. In fact, this student did not use Braille to read. Finally, this tool seems to rely upon the user to have a visual memory of circles, arcs and squares, and potential juxtaposition of those symbols. If such shapes and relationships do not mean anything to the student, their use is simply another fact that the student needs to memorize. This student indicated that in past experience trying to learn diagrams, “I felt that I spent more time memorizing those diagrams/graphs than focusing on concepts.” This did not seem like a positive step.
Silvia, Pansanato, and Fabri (2010) instead proposes the use of a spreadsheet for creating and reading UML diagrams. In his diagram, he separates the attributes of a use case diagram, including columns for actors, use cases, and relationship types. This approach seems to have potential for the data flow diagrams, especially since the advice of experts from the Missouri Rehabilitation Services for the Blind (a division of the Missouri Department of Social Services) also suggested replacing the diagram with tables. While the concept of using tables is suggested by Silvia, the implementation is unique in this case because the different diagrams convey different information and relationships.
Once the decision was made to use tables, it seemed obvious to implement the tables using Excel. This is a well-
used tool in most business curricula (including this University) that would be easy to coordinate for the disabled student and the students in his group, the instructor and the client. Further, it is a tool that is supported using standard disability software, such as screen readers. Using such a tool would allow the student to understand necessary relationships and the data would be in a form other students, the instructor, and clients could understand, thereby fulfilling the four criteria mentioned earlier.
4. DESIGNING THE TABLES TO REPRESENT DFDs While the concept of a table is an easy one, the question remains how one creates the table to communicate the same information and relationships as the data flow diagram. Clearly there must be ways for enumerating external entities, processes and data stores. In addition, however, there needs to be a way to represent the flows of information between individual pairs of entities, processes and data stores. For example, when examining data flow, the student needs to know both the origin and destination of that flow. That is, he or she needs to understand that a process will use the data after it was transformed by another process.
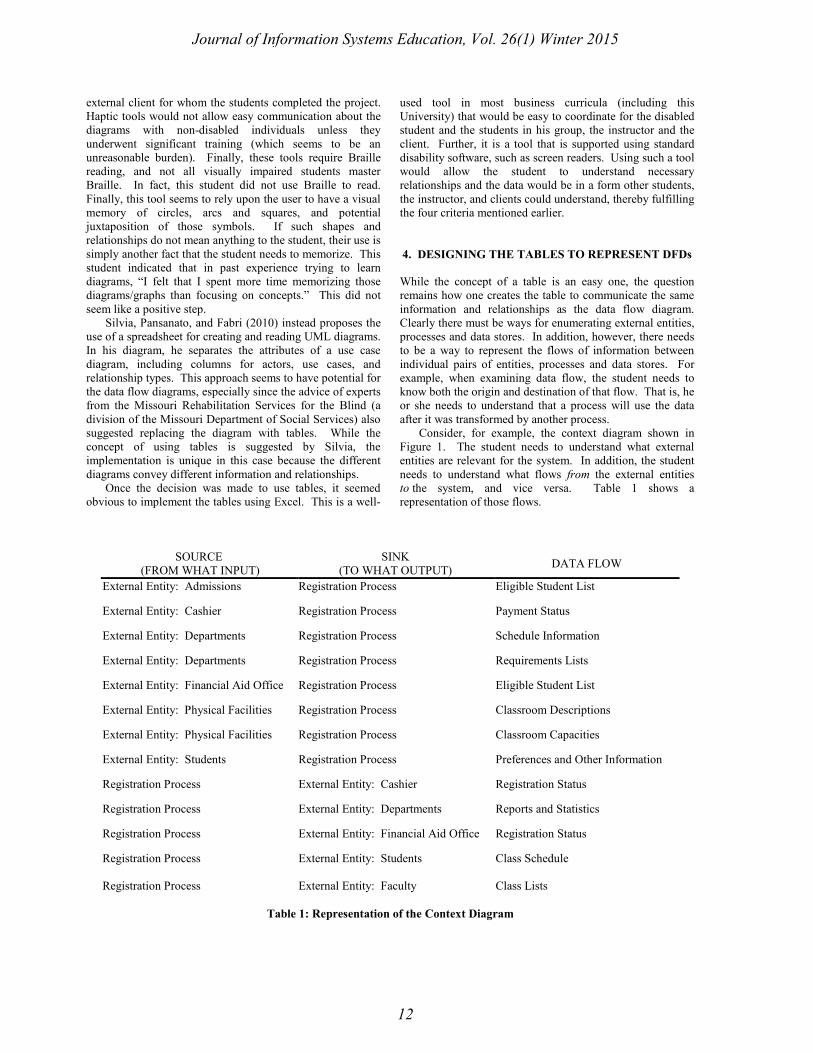
Consider, for example, the context diagram shown in Figure 1. The student needs to understand what external entities are relevant for the system. In addition, the student needs to understand what flows from the external entities to the system, and vice versa. Table 1 shows a representation of those flows.
SOURCE
(FROM WHAT INPUT) SINK
(TO WHAT OUTPUT) DATA FLOW
External Entity: Admissions Registration Process Eligible Student List
External Entity: Cashier Registration Process Payment Status
External Entity: Departments Registration Process Schedule Information
External Entity: Departments Registration Process Requirements Lists
External Entity: Financial Aid Office Registration Process Eligible Student List
External Entity: Physical Facilities Registration Process Classroom Descriptions
External Entity: Physical Facilities Registration Process Classroom Capacities
External Entity: Students Registration Process Preferences and Other Information
Registration Process External Entity: Cashier Registration Status
Registration Process External Entity: Departments Reports and Statistics
Registration Process External Entity: Financial Aid Office Registration Status
Registration Process
External Entity: Students
Class Schedule
Registration Process External Entity: Faculty Class Lists
Table 1: Representation of the Context Diagram
Journal of Information Systems Education, Vol. 26(1) Winter 2015
12
The table represents easily the flow of information from external entities to the registration process and vice versa. Context diagrams exist for the purpose of helping the user understand the system’s environment, so the left-most column of the table is a list of all the external entities; they are listed alphabetically to allow easy access. Each external entity is named and labeled with the term “external entity” to ensure the user understands they are in the environment. Of course, there is only one process in the context diagram, the whole system, so it does not need a label of its purpose. Each flow into or out of the process is a separate row in the table so the user can track specific requirements through the system. Flows out of the system are also listed in alphabetical order for easy reference. The rightmost column describes the type of information that flows between the system and the external entity. Since the table is an Excel table, a user could sort the list by information flow or order the list in any other way to ensure he or she understands the data.
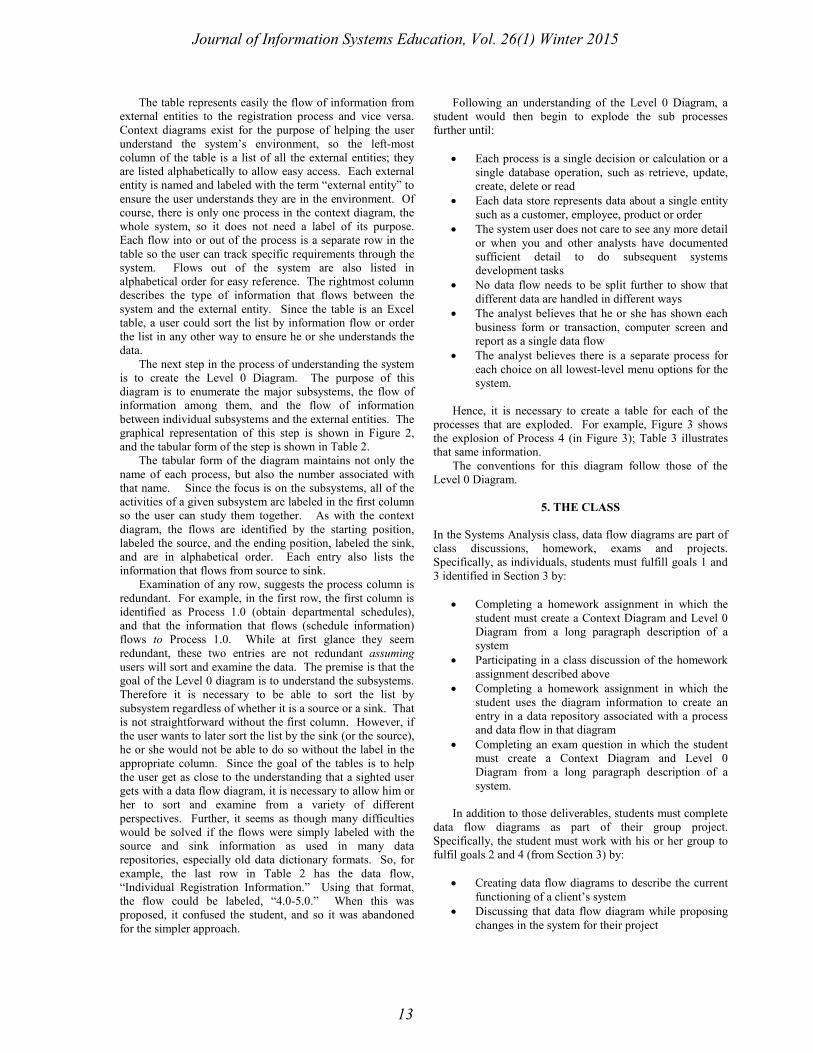
The next step in the process of understanding the system is to create the Level 0 Diagram. The purpose of this diagram is to enumerate the major subsystems, the flow of information among them, and the flow of information between individual subsystems and the external entities. The graphical representation of this step is shown in Figure 2, and the tabular form of the step is shown in Table 2.
The tabular form of the diagram maintains not only the name of each process, but also the number associated with that name. Since the focus is on the subsystems, all of the activities of a given subsystem are labeled in the first column so the user can study them together. As with the context diagram, the flows are identified by the starting position, labeled the source, and the ending position, labeled the sink, and are in alphabetical order. Each entry also lists the information that flows from source to sink.
Examination of any row, suggests the process column is redundant. For example, in the first row, the first column is identified as Process 1.0 (obtain departmental schedules), and that the information that flows (schedule information) flows to Process 1.0. While at first glance they seem redundant, these two entries are not redundant assuming users will sort and examine the data. The premise is that the goal of the Level 0 diagram is to understand the subsystems. Therefore it is necessary to be able to sort the list by subsystem regardless of whether it is a source or a sink. That is not straightforward without the first column. However, if the user wants to later sort the list by the sink (or the source), he or she would not be able to do so without the label in the appropriate column. Since the goal of the tables is to help the user get as close to the understanding that a sighted user gets with a data flow diagram, it is necessary to allow him or her to sort and examine from a variety of different perspectives. Further, it seems as though many difficulties would be solved if the flows were simply labeled with the source and sink information as used in many data repositories, especially old data dictionary formats. So, for example, the last row in Table 2 has the data flow, “Individual Registration Information.” Using that format, the flow could be labeled, “4.0-5.0.” When this was proposed, it confused the student, and so it was abandoned for the simpler approach.
Following an understanding of the Level 0 Diagram, a student would then begin to explode the sub processes further until:
• Each process is a single decision or calculation or a
single database operation, such as retrieve, update, create, delete or read
• Each data store represents data about a single entity such as a customer, employee, product or order
• The system user does not care to see any more detail or when you and other analysts have documented sufficient detail to do subsequent systems development tasks
• No data flow needs to be split further to show that different data are handled in different ways
• The analyst believes that he or she has shown each business form or transaction, computer screen and report as a single data flow
• The analyst believes there is a separate process for each choice on all lowest-level menu options for the system.
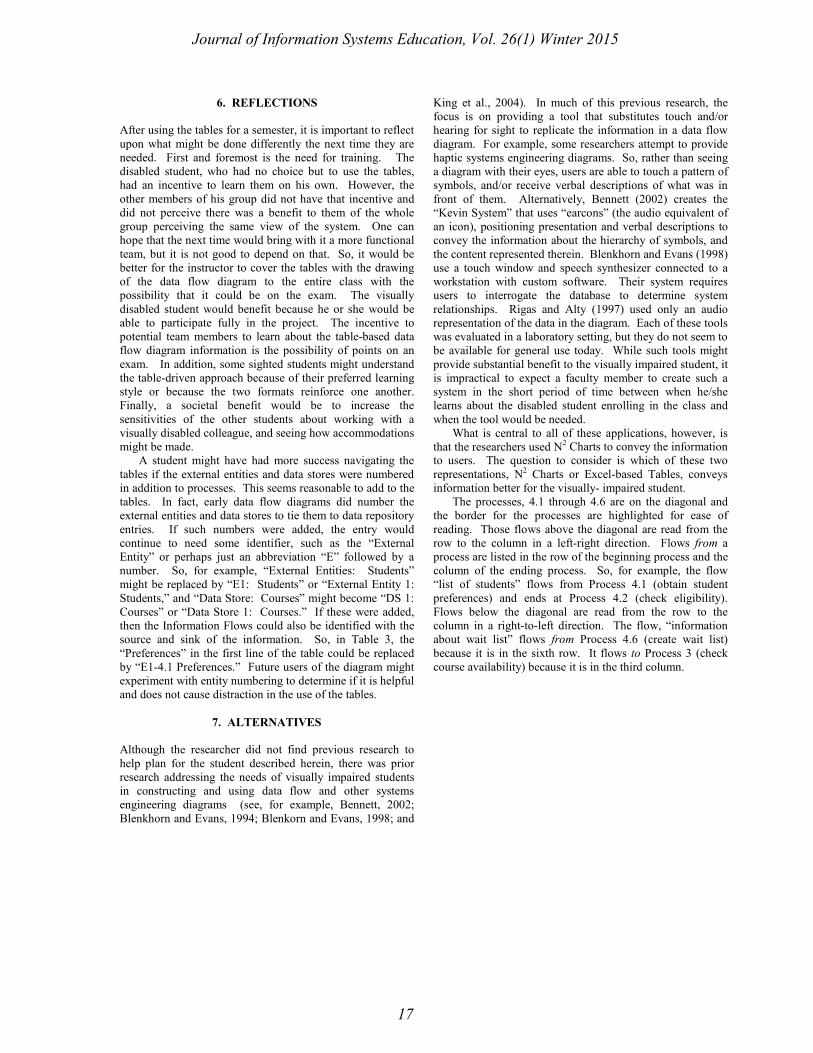
Hence, it is necessary to create a table for each of the processes that are exploded. For example, Figure 3 shows the explosion of Process 4 (in Figure 3); Table 3 illustrates that same information.
The conventions for this diagram follow those of the Level 0 Diagram.
5. THE CLASS
In the Systems Analysis class, data flow diagrams are part of class discussions, homework, exams and projects. Specifically, as individuals, students must fulfill goals 1 and 3 identified in Section 3 by:
• Completing a homework assignment in which the student must create a Context Diagram and Level 0 Diagram from a long paragraph description of a system
• Participating in a class discussion of the homework assignment described above
• Completing a homework assignment in which the student uses the diagram information to create an entry in a data repository associated with a process and data flow in that diagram
• Completing an exam question in which the student must create a Context Diagram and Level 0 Diagram from a long paragraph description of a system.
In addition to those deliverables, students must complete
data flow diagrams as part of their group project. Specifically, the student must work with his or her group to fulfil goals 2 and 4 (from Section 3) by:
• Creating data flow diagrams to describe the current
functioning of a client’s system • Discussing that data flow diagram while proposing
changes in the system for their project
Journal of Information Systems Education, Vol. 26(1) Winter 2015
13

PROCESS SOURCE
(FROM WHAT INPUT OR PROCESS)
INTERMEDIARY SINK (NEXT PROCESS OR EXTERNAL ENTITY)
DATA FLOW
1.0 Obtain Departmental Schedules External Entity: Departments 1.0 Obtain Departmental
Schedules Schedule Information
1.0 Obtain Departmental 1.0 Obtain Departmental Schedules Schedules 2.0 Integrate Departmental
Schedules Class Information
1.0 Integrate Departmental Schedules 1.0 Obtain Departmental 2.0 Integrate Departmental
Schedules Schedules Class Information
2.0 Integrate Departmental Schedules External Entity: Physical Facilities 2.0 Integrate Departmental
Schedules Classroom specifications and capacities
2.0 Integrate Departmental 2.0 Integrate Departmental Schedules Schedules 4.0 Enroll Students Class Schedules
3.0 Determine Eligible Students External Entity: Admissions 3.0 Determine Eligible Students Admitted Student List
3.0 Determine Eligible Students External Entity: Cashier 3.0 Determine Eligible Students Fee Payment Status
3.0 Determine Eligible Students Data Store: Current Students 3.0 Determine Eligible Students
3.0 Determine Eligible Students 3.0 Determine Eligible Students 4.0 Enroll Students Eligible Student Lists
4.0 Enroll Students External Entity: Departments 4.0 Enroll Students Requirements and Procedures
4.0 Enroll Students 2.0 Integrate Departmental Schedules 4.0 Enroll Students Class Schedules
4.0 Enroll Students 3.0 Determine Eligible Students 4.0 Enroll Students Eligible Student Lists
4.0 Enroll Students External Entity: Cashier 4.0 Enroll Students List of Students who did not Pay on time
4.0 Enroll Students External Entity: Financial Aid 4.0 Enroll Students List of Ineligible Students
4.0 Enroll Students External Entity: Students 4.0 Enroll Students Preferences
4.0 Enroll Students 4.0 Enroll Students 5.0 Compile and Distribute Information Individual Registration
Information
5.0 Compile and Distribute 5.0 Compile and Distribute Information Information External Entity: Faculty Class Lists
5.0 Compile and Distribute 5.0 Compile and Distribute Information Information Data Store: Current Semester Current Semester Data
5.0 Compile and Distribute 5.0 Compile and Distribute Information Information External Entity: Cashier Number of hours for each
student
5.0 Compile and Distribute 5.0 Compile and Distribute Information Information External Entity: Departments Reports
5.0 Compile and Distribute 5.0 Compile and Distribute Information Information External Entity: Students Schedule
5.0 Compile and Distribute Information 4.0 Enroll Students 5.0 Compile and Distribute
Information Individual Registration Information
Table 2: Level 0 Representation
Journal of Information Systems Education, Vol. 26(1) Winter 2015
14

PROCESS SOURCE (FROM WHAT INPUT OR
PROCESS)
INTERMEDIARY SINK (NEXT PROCESS OR EXTERNAL ENTITY)
INFORMATION FLOW
4.1 Obtain Student Preferences
External Entity: Students 4.1 Obtain Student Preferences Preferences
4.1 Obtain Student Preferences
4.1 Obtain Student Preferences 4.3 Check Course Availability Preferred Courses
4.1 Obtain Student Preferences
4.1 Obtain Student Preferences 4.2 Check Eligibility List of Students
4.2 Check Eligibility 4.1 Obtain Student Preferences 4.2 Check Eligibility List of Students 4.2 Check Eligibility Data Store: Requirements 4.2 Check Eligibility Requirements 4.2 Check Eligibility Data Store: Student Records 4.2 Check Eligibility Student Records 4.2 Check Eligibility 4.2 Check Eligibility 4.3 Check Course Availability Lists of Eligible
Students 4.3 Check Course Availability
4.1 Obtain Student Preferences 4.3 Check Course Availability Preferred Courses
4.3 Check Course Availability
4.2 Check Eligibility 4.3 Check Course Availability Lists of Eligible Students
4.3 Check Course Availability
External Entity: Students 4.3 Check Course Availability New Course Request
4.3 Check Course Availability
Data Store: Courses 4.3 Check Course Availability Course Schedule
4.3 Check Course Availability
Data Store: Wait List 4.3 Check Course Availability Wait List
4.3 Check Course Availability
4.3 Check Course Availability 4.4 Inform Student of Unavailability Refused Courses
4.3 Check Course Availability
4.3 Check Course Availability 4.5 Enroll Students in Class Accepted Courses
4.4 Inform Student of Unavailability
4.3 Check Course Availability 4.4 Inform Student of Unavailability Refused Courses
4.4 Inform Student of Unavailability
4.4 Inform Student of Unavailability External Entity: Students Wait List Offer
4.5 Enroll Students in Class 4.3 Check Course Availability 4.5 Enroll Students in Class Accepted Courses 4.5 Enroll Students in Class 4.5 Enroll Students in Class External Entity: Students Schedule 4.5 Enroll Students in Class 4.5 Enroll Students in Class External Entity: Process 5 Individual Registration
Information 4.6 Create Wait Lists External Entity: Students 4.6 Create Wait Lists Requests for Wait List
Status 4.6 Create Wait Lists 4.6 Create Wait Lists Data Store: Wait List Wait List
Table 3: Level 4.0 Representation
• Adjusting the data flow diagram to reflect changes,including adding and deleting processes, data flowsand stores
• Discussing the completed diagrams with the clientto help explain proposed changes in the system.
In those activities that were between the student and the professor, the tables worked well. Success measures varied by activity; since there was only one student involved, strict measures would not be germane. The first use of the tables was during the initial lecture when data flow diagrams were introduced to the class. The professor lectured using the diagram and the visually impaired student followed the discussion using the tables. Success was measured by how
easily the student could follow the discussion and understand the goals of the diagram. This measure was reported by the student, and secondarily measured by the number and types of questions asked of the instructor after the class. In this case, the student reported that he could follow the development of the drawing by following the tables he had received earlier. He asked few questions after class, and none associated with the functionality of the tables.
The second measure was the student’s ability to complete the homework assignments successfully. The assignments consisted of a long paragraph description of a system for which students were to create a data flow diagram; the visually impaired student created tables instead of the diagram, but needed to convey the same information as the other students. Success for the experimental student
Journal of Information Systems Education, Vol. 26(1) Winter 2015
15
meant that after reading the description of a system, he could identify the scope of the system successfully by naming the processes, external entities, and data stores of the system, and the flows of information among them. This information needed to be put into the table so that not only were the specific components named, but also their interrelationships were represented. As one might expect he, like many of the other students in the class, had difficulty understanding what was inside and outside of the system for the first homework assignment. This student identified and properly labeled a greater number of processes correctly than did the average student and correctly identified the boundary for the system, as indicated by correctly identifying the external processes. He correctly identified and labeled a greater number of flows than did the average student. The student did have a problem of balancing the level of abstraction of the processes on the Level 0 Diagram, as did approximately half of the class. Said differently, the student had fewer errors in his depiction than the majority of the sighted students in the class. The student seemed able to follow the class discussion of the homework and understand where he had difficulties.
A later assignment required him to read “the data flow diagram” (in his case, actually the table relating to it) and create an appropriate data repository entry that reflected the information in the diagram. The student was able to complete this assignment successfully as well. Further, he did almost perfectly on data flow diagram questions on the exam suggesting that he had mastered the table representation of both the individual components (e.g., processes) and the interrelationships among them.
These measures, considered together, were thought of as instructor-student communication about data flow diagrams. Since there was successful communication of the concepts and the case-specific information, this instructor-student communication was considered successful.
After the class, the student identified the tables as “helpful for systems analysis.” Why did it work? It is hypothesized that the tables provide the student an efficient mechanism for understanding the dynamics of the system. The student explained that the tables provided him with an alternative way to understand and explain the information, not just an effort to explain diagrams, especially since the diagrams themselves did not mean anything to him. In other words, they helped him understand the concept efficiently because he did not need to spend energy trying to understand the concept of the diagram at the same time as understanding the system structure.
As an interesting side note, it should be highlighted that two of the more driven sighted students in the class, upon seeing the tables, decided to create the tables in addition to the diagrams for the homework assignments. They completed both the diagram and the table correctly. When queried, both students reported that using the table representation helped them in understanding the graphical representation. This was not pursued. However, it suggests that in addition to making DFDs accessible to blind students the tables might be a tool that could help students with varied learning styles master the concepts.
The project component, however, which required student-student communication using the tables, was not deemed successful. The overarching goal of the (class)
project is for the students to work together to solve a real business problem. From the perspective of the data flow diagrams that means that the blind student could work with his colleagues to develop data flow diagrams to describe the current functioning of a client’s system and to be able to adjust them to reflect changes associated with the solution proposed by the group. Other students in the group were not willing or able to move back and forth between the table and the graphical representations. The blind student, like the other students in the group, worked alone to create draft data flow diagrams for discussion. However, the other students were not willing to take the time to read his table or to explain their diagrams. Later when there was a proposed system, they simply worked on the data flow diagrams without consulting the blind student. Needless to say, the students interacted with the client using the graphical diagrams, not the table version.
There are three possible explanations for this. First, it is possible that his teammates did not understand the tabular form of the data flow diagram. This seems unlikely since there were two students not involved with the team (and who never received training) who mastered it. Further, the students never said they were confused or asked for help. Second, it is possible that the students did not want to go through the additional work to create both the diagrams and the tables. This seems quite likely since it takes a fair amount of work to create the tables. The third possibility is that communication about the data flow diagrams was dysfunctional in the group. This also seems likely since the group generally did not meld well despite efforts to steer the group in a better direction. Not surprisingly, the disabled student was frustrated by the experience. In fact, after the student completed the class and his degree, he reported:
I am noticing a drastic improvement out in the real world, compared to college. People are actually tolerant of my needs, such as the use of adaptive technology. If and when I run into things that are visual, they are willing to work as a team [emphasis added] to help me resolve the issues. A scenario is described below.
Company A [corporate name excised] uses SQL Developer primarily for executing queries against databases. It turned out that this program was not designed with accessibility in mind, which was revealed after hours of research and struggles with the JAWS for Windows screen reader. I informed my team of the situation, and they contacted the appropriate individuals, as well as taking time out of their busy schedules, to see what was displayed on my screen, as I was having trouble. In courses like analysis and design, my team would have chosen to avoid the situation, because it appeared that they were intolerant of my needs, as mentioned above, which is what may have caused some of my problems, now that I look back.
Journal of Information Systems Education, Vol. 26(1) Winter 2015
16
6. REFLECTIONS After using the tables for a semester, it is important to reflect upon what might be done differently the next time they are needed. First and foremost is the need for training. The disabled student, who had no choice but to use the tables, had an incentive to learn them on his own. However, the other members of his group did not have that incentive and did not perceive there was a benefit to them of the whole group perceiving the same view of the system. One can hope that the next time would bring with it a more functional team, but it is not good to depend on that. So, it would be better for the instructor to cover the tables with the drawing of the data flow diagram to the entire class with the possibility that it could be on the exam. The visually disabled student would benefit because he or she would be able to participate fully in the project. The incentive to potential team members to learn about the table-based data flow diagram information is the possibility of points on an exam. In addition, some sighted students might understand the table-driven approach because of their preferred learning style or because the two formats reinforce one another. Finally, a societal benefit would be to increase the sensitivities of the other students about working with a visually disabled colleague, and seeing how accommodations might be made.
A student might have had more success navigating the tables if the external entities and data stores were numbered in addition to processes. This seems reasonable to add to the tables. In fact, early data flow diagrams did number the external entities and data stores to tie them to data repository entries. If such numbers were added, the entry would continue to need some identifier, such as the “External Entity” or perhaps just an abbreviation “E” followed by a number. So, for example, “External Entities: Students” might be replaced by “E1: Students” or “External Entity 1: Students,” and “Data Store: Courses” might become “DS 1: Courses” or “Data Store 1: Courses.” If these were added, then the Information Flows could also be identified with the source and sink of the information. So, in Table 3, the “Preferences” in the first line of the table could be replaced by “E1-4.1 Preferences.” Future users of the diagram might experiment with entity numbering to determine if it is helpful and does not cause distraction in the use of the tables.
7. ALTERNATIVES
Although the researcher did not find previous research to help plan for the student described herein, there was prior research addressing the needs of visually impaired students in constructing and using data flow and other systems engineering diagrams (see, for example, Bennett, 2002; Blenkhorn and Evans, 1994; Blenkorn and Evans, 1998; and
King et al., 2004). In much of this previous research, the focus is on providing a tool that substitutes touch and/or hearing for sight to replicate the information in a data flow diagram. For example, some researchers attempt to provide haptic systems engineering diagrams. So, rather than seeing a diagram with their eyes, users are able to touch a pattern of symbols, and/or receive verbal descriptions of what was in front of them. Alternatively, Bennett (2002) creates the “Kevin System” that uses “earcons” (the audio equivalent of an icon), positioning presentation and verbal descriptions to convey the information about the hierarchy of symbols, and the content represented therein. Blenkhorn and Evans (1998) use a touch window and speech synthesizer connected to a workstation with custom software. Their system requires users to interrogate the database to determine system relationships. Rigas and Alty (1997) used only an audio representation of the data in the diagram. Each of these tools was evaluated in a laboratory setting, but they do not seem to be available for general use today. While such tools might provide substantial benefit to the visually impaired student, it is impractical to expect a faculty member to create such a system in the short period of time between when he/she learns about the disabled student enrolling in the class and when the tool would be needed.
What is central to all of these applications, however, is that the researchers used N2 Charts to convey the information to users. The question to consider is which of these two representations, N2 Charts or Excel-based Tables, conveys information better for the visually- impaired student.
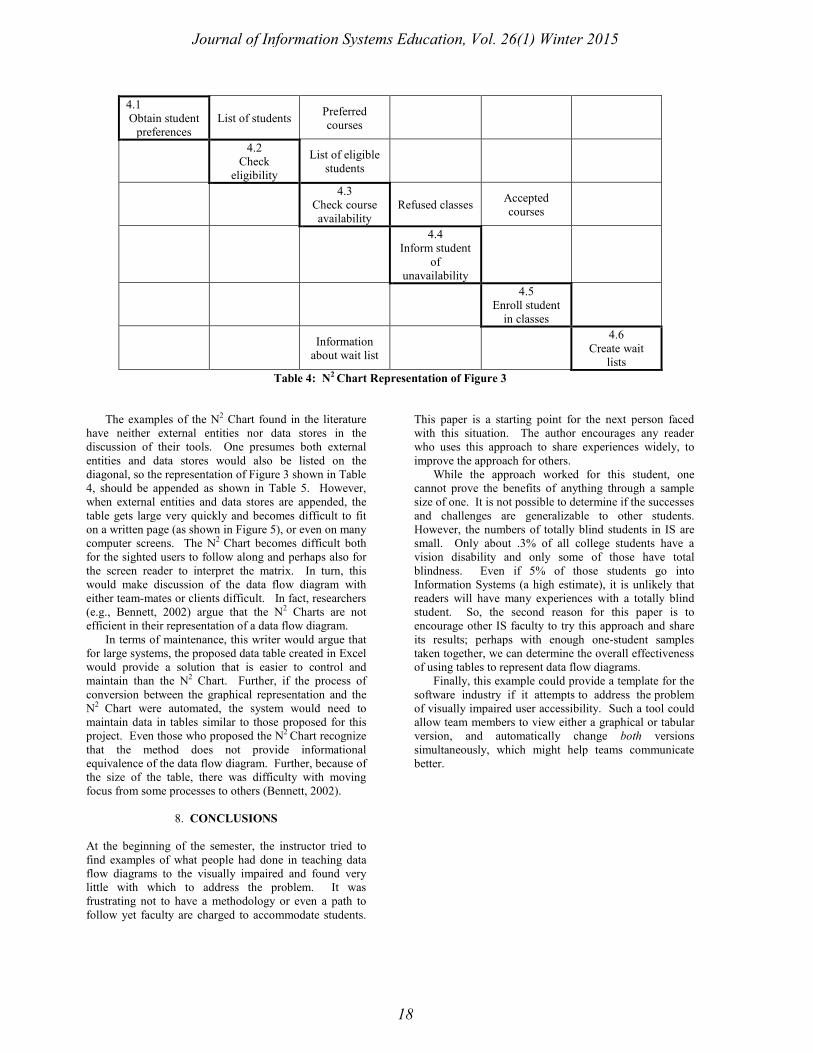
The processes, 4.1 through 4.6 are on the diagonal and the border for the processes are highlighted for ease of reading. Those flows above the diagonal are read from the row to the column in a left-right direction. Flows from a process are listed in the row of the beginning process and the column of the ending process. So, for example, the flow “list of students” flows from Process 4.1 (obtain student preferences) and ends at Process 4.2 (check eligibility). Flows below the diagonal are read from the row to the column in a right-to-left direction. The flow, “information about wait list” flows from Process 4.6 (create wait list) because it is in the sixth row. It flows to Process 3 (check course availability) because it is in the third column.
Journal of Information Systems Education, Vol. 26(1) Winter 2015
17
4.1 Obtain student
preferences List of students Preferred
courses
4.2
Check eligibility
List of eligible students
4.3
Check course availability
Refused classes Accepted courses
4.4 Inform student
of unavailability
4.5
Enroll student in classes
Information about wait list
4.6 Create wait
lists Table 4: N2 Chart Representation of Figure 3
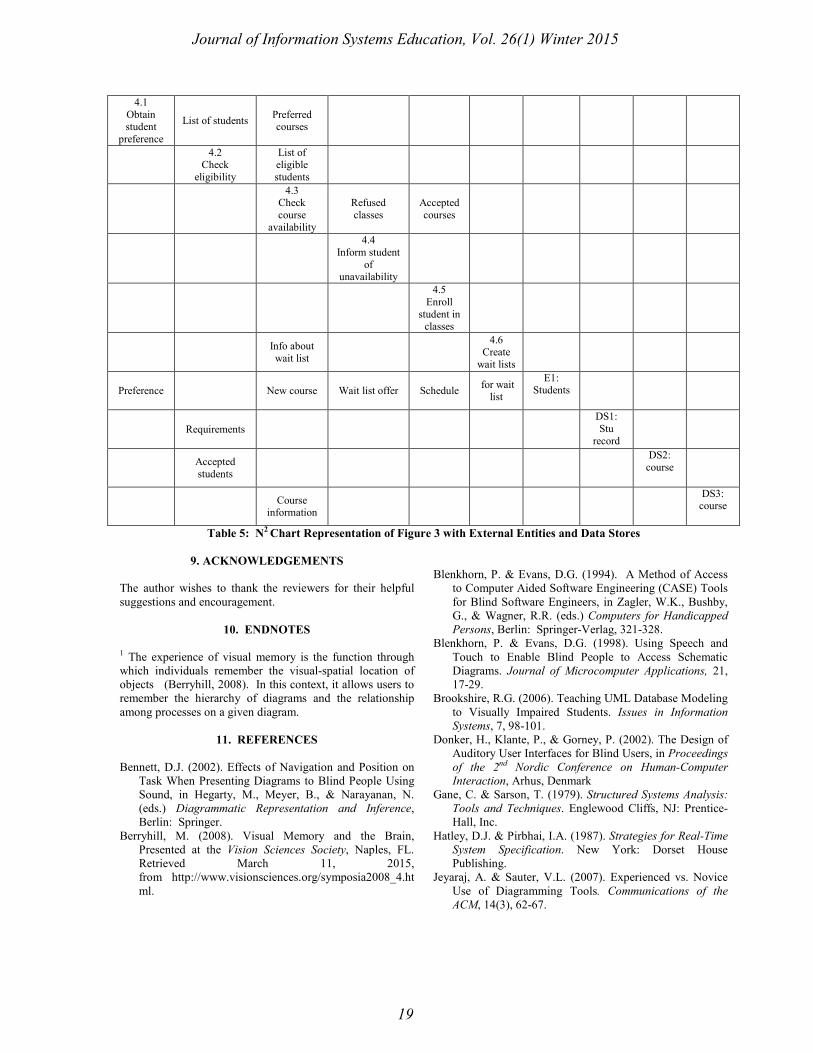
The examples of the N2 Chart found in the literature have neither external entities nor data stores in the discussion of their tools. One presumes both external entities and data stores would also be listed on the diagonal, so the representation of Figure 3 shown in Table 4, should be appended as shown in Table 5. However, when external entities and data stores are appended, the table gets large very quickly and becomes difficult to fit on a written page (as shown in Figure 5), or even on many computer screens. The N2 Chart becomes difficult both for the sighted users to follow along and perhaps also for the screen reader to interpret the matrix. In turn, this would make discussion of the data flow diagram with either team-mates or clients difficult. In fact, researchers (e.g., Bennett, 2002) argue that the N2 Charts are not efficient in their representation of a data flow diagram.
In terms of maintenance, this writer would argue that for large systems, the proposed data table created in Excel would provide a solution that is easier to control and maintain than the N2 Chart. Further, if the process of conversion between the graphical representation and the N2 Chart were automated, the system would need to maintain data in tables similar to those proposed for this project. Even those who proposed the N2 Chart recognize that the method does not provide informational equivalence of the data flow diagram. Further, because of the size of the table, there was difficulty with moving focus from some processes to others (Bennett, 2002).
8. CONCLUSIONS
At the beginning of the semester, the instructor tried to find examples of what people had done in teaching data flow diagrams to the visually impaired and found very little with which to address the problem. It was frustrating not to have a methodology or even a path to follow yet faculty are charged to accommodate students.
This paper is a starting point for the next person faced with this situation. The author encourages any reader who uses this approach to share experiences widely, to improve the approach for others.
While the approach worked for this student, one cannot prove the benefits of anything through a sample size of one. It is not possible to determine if the successes and challenges are generalizable to other students. However, the numbers of totally blind students in IS are small. Only about .3% of all college students have a vision disability and only some of those have total blindness. Even if 5% of those students go into Information Systems (a high estimate), it is unlikely that readers will have many experiences with a totally blind student. So, the second reason for this paper is to encourage other IS faculty to try this approach and share its results; perhaps with enough one-student samples taken together, we can determine the overall effectiveness of using tables to represent data flow diagrams.
Finally, this example could provide a template for the software industry if it attempts to address the problem of visually impaired user accessibility. Such a tool could allow team members to view either a graphical or tabular version, and automatically change both versions simultaneously, which might help teams communicate better.
Journal of Information Systems Education, Vol. 26(1) Winter 2015
18
4.1 Obtain student
preference
List of students Preferred courses
4.2 Check
eligibility
List of eligible students
4.3 Check course
availability
Refused classes
Accepted courses
4.4 Inform student
of unavailability
4.5 Enroll
student in classes
Info about wait list
4.6 Create
wait lists
Preference New course Wait list offer Schedule for wait list
E1: Students
Requirements DS1:
Stu record
Accepted students
DS2: course
Course information
DS3: course
Table 5: N2 Chart Representation of Figure 3 with External Entities and Data Stores
9. ACKNOWLEDGEMENTS The author wishes to thank the reviewers for their helpful suggestions and encouragement.
10. ENDNOTES 1 The experience of visual memory is the function through which individuals remember the visual-spatial location of objects (Berryhill, 2008). In this context, it allows users to remember the hierarchy of diagrams and the relationship among processes on a given diagram.
11. REFERENCES
Bennett, D.J. (2002). Effects of Navigation and Position on
Task When Presenting Diagrams to Blind People Using Sound, in Hegarty, M., Meyer, B., & Narayanan, N. (eds.) Diagrammatic Representation and Inference, Berlin: Springer.
Berryhill, M. (2008). Visual Memory and the Brain, Presented at the Vision Sciences Society, Naples, FL. Retrieved March 11, 2015, from http://www.visionsciences.org/symposia2008_4.html.
Blenkhorn, P. & Evans, D.G. (1994). A Method of Access
to Computer Aided Software Engineering (CASE) Tools for Blind Software Engineers, in Zagler, W.K., Bushby, G., & Wagner, R.R. (eds.) Computers for Handicapped Persons, Berlin: Springer-Verlag, 321-328.
Blenkhorn, P. & Evans, D.G. (1998). Using Speech and Touch to Enable Blind People to Access Schematic Diagrams. Journal of Microcomputer Applications, 21, 17-29.
Brookshire, R.G. (2006). Teaching UML Database Modeling to Visually Impaired Students. Issues in Information Systems, 7, 98-101.
Donker, H., Klante, P., & Gorney, P. (2002). The Design of Auditory User Interfaces for Blind Users, in Proceedings of the 2nd Nordic Conference on Human-Computer Interaction, Arhus, Denmark
Gane, C. & Sarson, T. (1979). Structured Systems Analysis: Tools and Techniques. Englewood Cliffs, NJ: Prentice-Hall, Inc.
Hatley, D.J. & Pirbhai, I.A. (1987). Strategies for Real-Time System Specification. New York: Dorset House Publishing.
Jeyaraj, A. & Sauter, V.L. (2007). Experienced vs. Novice Use of Diagramming Tools. Communications of the ACM, 14(3), 62-67.
Journal of Information Systems Education, Vol. 26(1) Winter 2015
19
King, A., Blenkhorn, P., Crombie, D., Dijkstra, S., Evans, G.
& Woods, J. (2004). Presenting UML Software Engineering Diagrams to Blind People, in K. Miesenberger et al. (eds.), ICCHP 2004, LNCS 3118, 522-529.
Ladner, R.E. (1989). Computer Accessibility for Federal Workers with Disabilities: It’s the Law. Communications of the ACM, 32(8), 952-956.
Luque, L., Veriscimo, E.S., Pereira, G.C., & Filgueiras, L.V.L. (2014). Can We Work Together? On the Inclusion of Blind People in UML Model-Based Tasks, in Langdon, P. M., Lazar, J., Heylighen, A., & Dong, H. (eds.) Inclusive Designing: Joining Usability, Accessibility, and Inclusion, Switzerland: Springer International Publishers, 223-233.
Raue, K. & Lewis, L. (2011). Students with Disabilities at Degree-Granting Postsecondary Institutions (NCES 2011-018). U.S. Department of Education, National Center for Education Statistics. Washington, DC: U.S. Government Printing Office.
Rigas, D.I. & Alty, J.L. (1997). The Use of Music in a Graphical Interface for the Visually Impaired, in Howard, S., Hammond, J., & Lindegaard, E. (eds.) Proceedings of the Interact ’97, The International Conference on Human-Computer Interaction (Sydney), London: Chapman and Hall, 228-235.
Silvia, C.E., Pansanato, L.T., & Fabri, J.A. (2010). Ensinando Diagrammas UML para Estudantes Cegos, in Proceedings of the 26th Latin American Informatics Conference, Asunción, Paraguay.
U.S. Department of Education, National Center for Education Statistics (2012). 2011-12 National Postsecondary Student Aid Study (NPSAS: 12). Retrieved March 9, 2015, from http://nces.ed.gov/programs/digest/d13/tables/dt13_311.60.asp.
Yourdon, E. & Constantine, L.L. (1979). Structured Design. Englewood Cliffs, NJ: Prentice-Hall, Inc.
AUTHOR BIOGRAPHIES
Vicki L. Sauter is Professor of Information Systems at
University of Missouri - St. Louis. She holds a BSIE, MS and PhD in Systems from Northwestern University. Her research is in the areas of decision support / business intelligence, and systems analysis and design. Her current research interests include system development methodologies,
visualization design, and trends of women in computing. She is author of the books, Decision Support Systems for Business Intelligence (John Wiley), and You’re Never Too Old to Surf: A Senior’s Guide to Safe Internet Use, as well as many journal publications. Dr. Sauter regularly teaches systems analysis and business intelligence at the undergraduate and graduate levels.
Journal of Information Systems Education, Vol. 26(1) Winter 2015
20

STATEMENT OF PEER REVIEW INTEGRITY
All papers published in the Journal of Information Systems Education have undergone rigorous peer review. This includes an
initial editor screening and double-blind refereeing by three or more expert referees.
Copyright ©2015 by the Education Special Interest Group (EDSIG) of the Association of Information Technology Professionals.
Permission to make digital or hard copies of all or part of this journal for personal or classroom use is granted without fee
provided that copies are not made or distributed for profit or commercial use. All copies must bear this notice and full citation.
Permission from the Editor is required to post to servers, redistribute to lists, or utilize in a for-profit or commercial use.
Permission requests should be sent to Dr. Lee Freeman, Editor-in-Chief, Journal of Information Systems Education, 19000
Hubbard Drive, College of Business, University of Michigan-Dearborn, Dearborn, MI 48128.
ISSN 1055-3096