Embed Size (px)
Citation preview
Portland State University Portland State University
PDXScholar PDXScholar
Psychology Faculty Publications and Presentations Psychology
6-2013
Teaching through Interactions: Testing a Teaching through Interactions: Testing a
Developmental Framework of Teacher Effectiveness Developmental Framework of Teacher Effectiveness
in over 4,000 Classrooms in over 4,000 Classrooms
Bridget K. Hamre University of Virginia
Robert C. Pianta University of Virginia
Jason T. Downer University of Virginia
Jamie DeCoster University of Virginia
Andrew J. Mashburn Portland State University, [email protected]
See next page for additional authors
Follow this and additional works at: https://pdxscholar.library.pdx.edu/psy_fac
Part of the Educational Methods Commons, and the Educational Psychology Commons
Let us know how access to this document benefits you.
Citation Details Citation Details Teaching through Interactions: Testing a Developmental Framework of Teacher Effectiveness in over 4,000 Classrooms Bridget K. Hamre, Robert C. Pianta, Jason T. Downer, Jamie DeCoster, Andrew J. Mashburn, Stephanie M. Jones, Joshua L. Brown, Elise Cappella, Marc Atkins, Susan E. Rivers, Marc A. Brackett, and Aki Hamagami The Elementary School Journal , Vol. 113, No. 4 (June 2013) , pp. 461-487
This Article is brought to you for free and open access. It has been accepted for inclusion in Psychology Faculty Publications and Presentations by an authorized administrator of PDXScholar. Please contact us if we can make this document more accessible: [email protected].

Authors Authors Bridget K. Hamre; Robert C. Pianta; Jason T. Downer; Jamie DeCoster; Andrew J. Mashburn; Stephanie M. Jones; Joshua L. Brown; Elise Cappella; Marc Atkins; Susan E. Rivers; Marc A, Brackett; and Aki Hamagami
This article is available at PDXScholar: https://pdxscholar.library.pdx.edu/psy_fac/6
TEACHING THROUGH INTERACTIONS
Testing a Developmental Framework of TeacherEffectiveness in over 4,000 Classrooms
Bridget K. HamreRobert C. PiantaJason T. DownerJamie DeCoster
Andrew J. Mashburn
Stephanie M. Jones
Joshua L. Brown
Elise Cappella
Marc Atkins ,
Susan E. RiversMarc A. Brackett
Aki Hamagami
Validating frameworks for understanding classroomprocesses that contribute to student learning and develop-ment is important to advance the scientific study of teach-ing. This article presents one such framework, Teachingthrough Interactions, which posits that teacher-student in-teractions are a central driver for student learning and or-ganizes teacher-student interactions into three major do-mains. Results provide evidence that across 4,341 preschoolto elementary classrooms (1) teacher-student classroominteractions comprise distinct emotional, organiza-tional, and instructional domains; (2) the three-domainlatent structure is a better fit to observational data thanalternative one- and two-domain models of teacher-student classroom interactions; and (3) the three-domainstructure is the best-fitting model across multiple data sets.
, © 2013 by The University of Chicago. All rights reserved. 0013-5984/2013/11304-0001 $10.00
TH R E E converging forces dominate discussion about early childhood andelementary education in the United States, which collectively reflect a newera of accountability: (1) attention to the quality and productivity of Amer-ica’s classrooms and the central role of teachers, (2) the critical role that
these early years play in closing the achievement gap, and (3) innovation in incentivesand preparation structures that are linked to assessments of teachers’ performance inthe classroom. This article’s focus is situated at the intersection of these forces. First,we argue that teachers’ performance and effectiveness is in large part a function oftheir behavior in classrooms as they interact with students and implement curricula.Second, we present a conceptual model that organizes teacher-student interactionsinto three broad latent domains reflecting emotional, organizational, and instruc-tional features of interactions. Finally, we empirically test the fit of the three-domainmodel across the largest sample of standardized observations in preschool and ele-mentary classrooms available to date. Specifically, we test the degree to which theTeaching through Interactions model (Hamre & Pianta, 2007) is consistent withobservational data collected in a large, diverse sample of 4,341 classrooms across theUnited States.
Numerous studies relying on sophisticated multilevel analyses of large-scalestudent achievement test outcomes indicate that a significant portion of variancein student learning is explained at the classroom level (Hanushek, 2002) and thatdeflections in the trajectory of student learning across years can be attributed totheir experiences in specific classrooms (e.g., Sanders & Rivers, 1996). Thesestudies support the conclusion that classroom experiences matter but fall shorton two counts: (1) identifying specific processes that lead to student learning andpositive social adjustment and (2) anchoring classroom effects in verifiably ob-servable indicators (Pianta & Hamre, 2009). This identification and anchoring ofspecific classroom practice is critical to advancing the systematic and effectivetraining of teachers and improving their performance in classrooms. More spe-cifically, neither Hanushek’s (2002) definition of teacher quality, “Good teachersare ones who get large gains in student achievement for their classes; bad teachersare just the opposite” (p. 3), nor the “value-added” paradigm for teacher evalu-ation (Sanders & Rivers, 1996) provide guidance for the systematic developmentof evidenced-based ways to improve classroom teaching or teacher preparation(Cochran-Smith & Zeichner, 2005). The critical unanswered question in thevalue-added definition of teacher effectiveness involves the mechanisms throughwhich classrooms exert their influence on students’ development and how sucheffects can be reliably produced and maximized. That is, if a teacher does or doesnot produce expected levels of value-added performance, what did the teacher doin the classroom that led to these outcomes?
These questions have come to the forefront of educational policy and researchin recent years and provided the impetus for the largest study of teaching inelementary and secondary schools to date—the Measures of Effective Teaching(MET) study (Kane & Staiger, 2012). Results from the first year of the MET studyprovide compelling evidence that effective teaching can be reliably observed andthat these observations are associated in meaningful ways with students’ percep-tions of teachers and with gains on standardized achievement tests. However, theresults of this study also point out a need for more clarity around the components
�

of teaching that produce outcomes and a better understanding of the ways inwhich these components are organized in typical classrooms. This need forclearer articulation of theoretical frameworks for understanding teaching wassuggest by Douglas (2009), who wrote, “Our knowledge of classroom instructionwill be well served by studies that build on a common theoretical framework” (p.519).
The present study tests one such framework of effective teaching. Effectiveteaching is sometimes described quite broadly to include dimensions such asteacher knowledge, teacher practices, teacher beliefs, student beliefs, studentpractices, and student knowledge (Bell, Gitomer, McCaffrey, Hamre, & Pianta,2011). The operational definition of effective teaching used for this article is morecircumscribed and focuses exclusively on interactions between teachers and stu-dents in the classroom. Although we recognize that there are many things thatteachers do that may make them effective (e.g., provide assignments and home-work, assess their students, and collaborate with parents and other teachers), wefocus exclusively on the nature and quality of their interactions with students forseveral reasons. Developmental theory and research provides strong support forthe idea that it is the daily interactions that children and adolescents have withadults and peers that drive learning and development (Bronfenbrenner & Mor-ris, 1998). On a more practical note, current discussions of teacher accountabilitysuggest the need to attend to aspects of teachers’ jobs that can be reliably ob-served and assessed. We argue that the daily interactions teachers have withstudents are among the most feasible to include in this type of system. Thisorientation does not diminish the importance of other aspects of teachers’ workbut rather places an emphasis on the importance of interactions as a major partof their daily lives in the classroom.
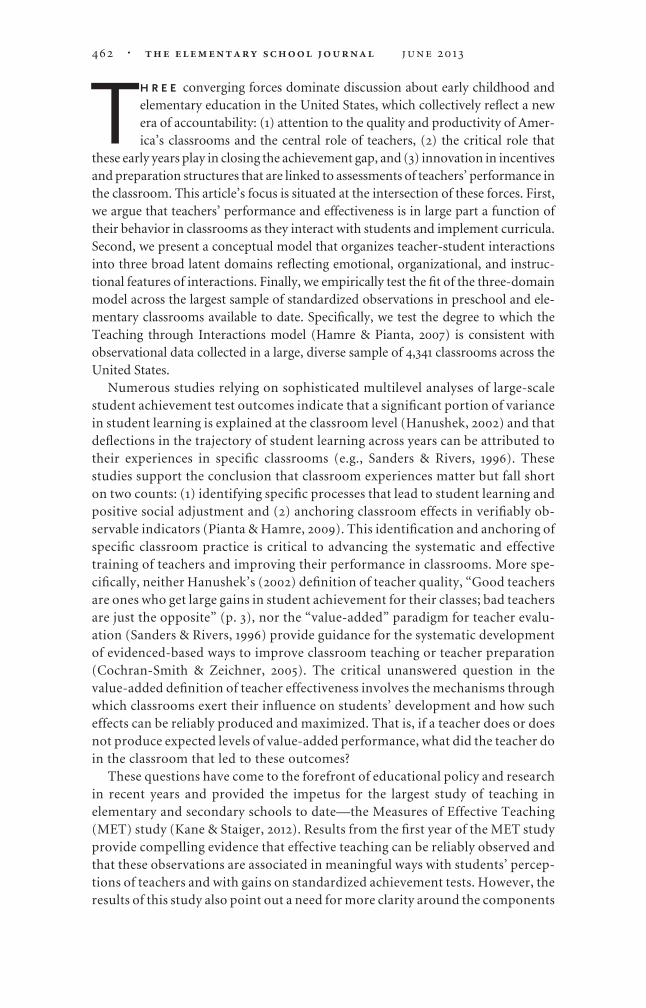
This approach to conceptualizing teacher-student interactions (Hamre & Pi-anta, 2007) draws heavily from earlier theoretical and empirical work in theeducational and psychological literatures (e.g., Brophy, 1999; Eccles & Roeser,1999; Pressley et al., 2003) to describe one theory of classroom practice and thesalience of interactions with adults for promoting developmental gains. Thismodel proposes a multilevel latent structure for organizing teacher-student inter-actions; three broad domains of classroom interactions involving teachers andstudents are hypothesized to be important in promoting student learning andsocial development—Emotional Support, Classroom Organization, and Instruc-tional Support. Each of these domains is quite broad and could include a widearray of interactions. The observational measure developed to assess these inter-actions, the Classroom Assessment Scoring System (CLASS; Pianta, La Paro, &Hamre, 2008),1 describes in detail several specific dimensions of teacher-childinteractions that exist within each broad domain (see Fig. 1). Table 1 provides adescription of each dimension. For example, the domain of Emotional Supportconsists of four dimensions—Positive Climate, Negative Climate, Teacher Sen-sitivity, and Regard for Student Perspectives. Each of these dimensions, in turn,is described by explicit indicators of that dimension. For example, Positive Cli-mate is indicated by the presence of relationships, positive affect, positive com-munications, and respect. Finally, each indicator is further operationalized inspecific behavioral, observable descriptions of classroom interactions, either be-
�
tween teachers and students or among students. Behavioral markers of relation-ships include physical proximity, shared activities, peer assistance, matched af-fect, and social conversation.
In the CLASS, these specific observable, behavioral descriptions are anchored atpoints along a seven-point rating scale to serve as a guide for observers’ judgmentsregarding the quality of teacher-child interaction with regard to that dimension.These specific behavioral descriptions of dimensions and indicators shift acrossgrades so that they are appropriate to that developmental level. The present studyexamines whether this three-domain latent structure of dimensions of teacher-childinteractions applies in samples ranging from preschool through grade 5. The inves-tigated samples are not limited to those that have specifically used CLASS, but in-stead encompass another, similarly scaled observational measure of teacher-childinteractions (the Classroom Observation System [COS] used in the NICHD Study ofEarly Child Care and Youth Development; see NICHD Early Child Care ResearchNetwork, 2002, 2005).
It is important to note that this article does not focus on validating this frame-work against student outcomes. However, as discussed in detail below, there isextensive evidence supporting these links, most recently in the large MET study(Kane & Staiger, 2012). Additionally, although the CLASS measures many typesof teacher-student interactions, it does not measure all of the possible elementsof interactions that could be included within each broad domain described in theTeaching through Interaction framework. For example, Domitrovich et al.(2009) demonstrated that salient elements of the emotional environment, suchas a teacher’s use of emotion words and emotion coaching, were unique elementsof classroom interactions not measured by the CLASS. Thus, although this study,based on the CLASS and COS measures, provides one way of testing the Teachingthrough Interactions framework, it could be tested using other measures andmethods, including the use of other observational tools (Domitrovich et al.,2009) or student report data (Stuhlman, Downer, & DeCoster, 2012).
Figure 1. Teaching through Interactions factors (three-factor model). PC � Positive Climate; NC �
Negative Climate; TS � Teacher Sensitivity; RSP � Regard for Student Perspectives; OC � Over-
control; BM � Behavior Management; ILF � Instructional Learning Formats; PR � Productivity;
CHA � Chaos; CD � Concept Development; QF � Quality of Feedback; LM � Language Mod-
eling; RIM � Richness of Instructional Methods.
�
Theoretical and Empirical Background of the Teaching throughInteractions Framework
Next we briefly describe the literature supporting the domains of teacher-child in-teractions that are the focus of this article. More detailed descriptions of the researchsupporting the specific dimensions of teaching practice are available elsewhere (e.g.,Hamre & Pianta, 2007).
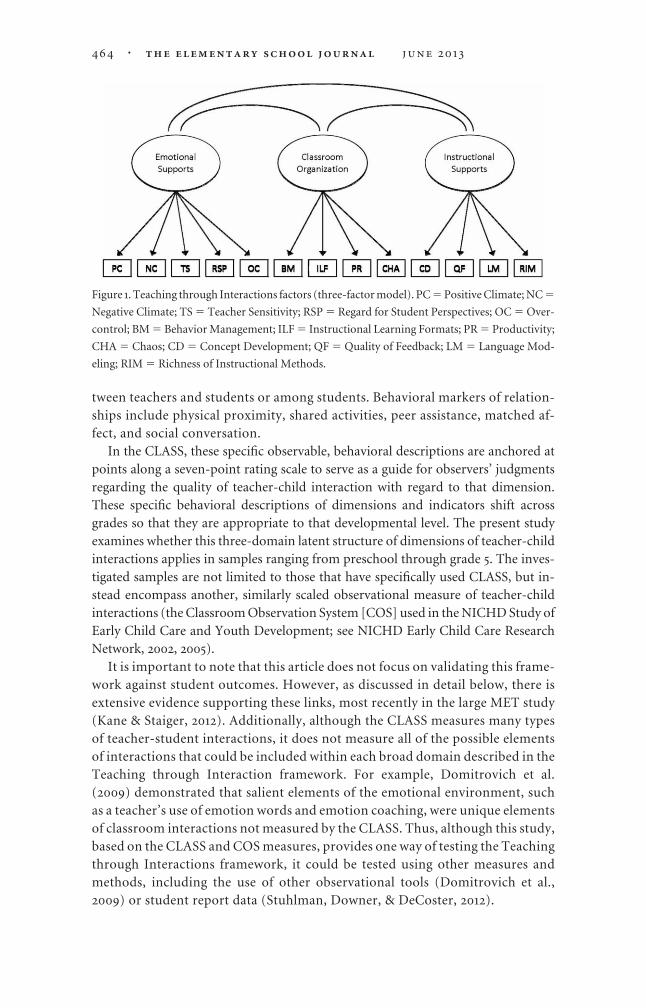
Table 1. Teaching through Interactions Framework: Description of Domains and Dimensions
Domain Dimension Description
Emotional Support Positive Climate Reflects the overall emotional tone of the classroom and theconnection between teachers and students
Negative Climate Reflects overall level of expressed negativity in the classroombetween teachers and students (e.g., anger, aggression,irritability)
Teacher Sensitivity Encompasses teachers’ responsivity to students’ needs andawareness of students’ level of academic and emotionalfunctioning
Regard for StudentPerspectives
The degree to which the teacher’s interactions with studentsand classroom activities place an emphasis on students’interests, motivations, and points of view, rather thanbeing very teacher-driven
Overcontrol Assesses the extent to which the classroom is rigidlystructured or regimented at the expense of children’sinterests and/or needs
ClassroomOrganization
Behavior Management Encompasses teachers’ ability to use effective methods toprevent and redirect misbehavior by presenting clearbehavioral expectations and minimizing time spent onbehavioral issues
Productivity Considers how well teachers manage instructional time androutines so that students have the maximum number ofopportunities to learn
Instructional LearningFormats
The degree to which teachers maximize students’engagement and ability to learn by providing interestingactivities, instruction, centers, and materials
Classroom Chaos The degree to which teachers ineffectively manage childrenin the classroom so that disruption and chaospredominate
InstructionalSupport
Concept Development The degree to which instructional discussions and activitiespromote students’ higher-order thinking skills versusfocus on rote and fact-based learning
Quality of Feedback Considers teachers’ provision of feedback focused onexpanding learning and understanding (formativeevaluation), not correctness or the end product(summative evaluation)
Language Modeling The quality and amount of teachers’ use of language-stimulation and language-facilitation techniques duringindividual, small-group, and large-group interactionswith children
Richness of InstructionalMethods
The extent to which teachers use a variety of strategies topromote children’s thinking and understanding ofmaterial at a deeper and more complex level
�
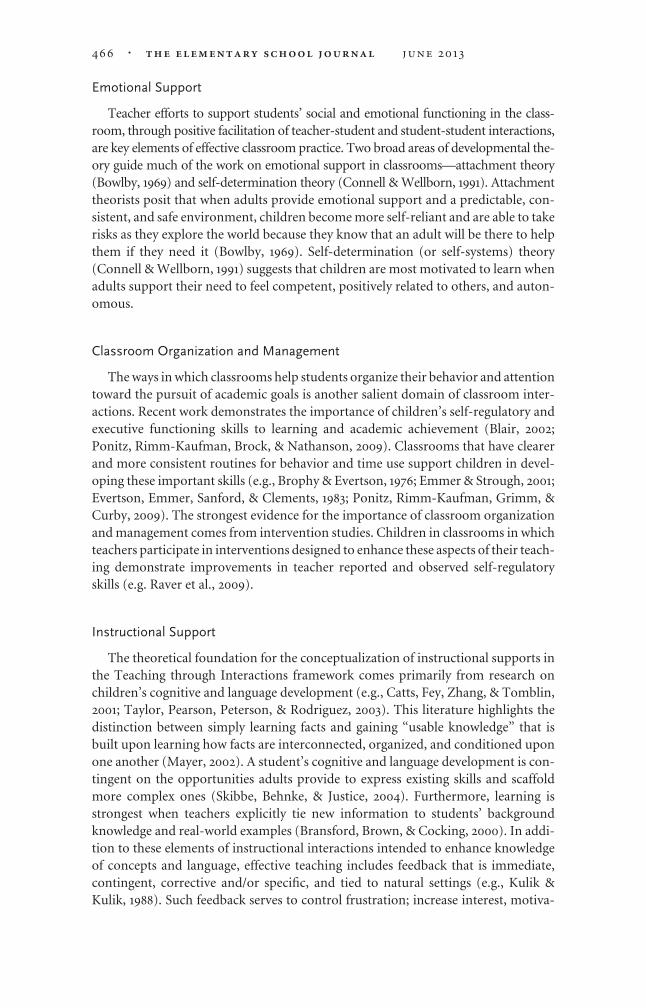
Emotional Support
Teacher efforts to support students’ social and emotional functioning in the class-room, through positive facilitation of teacher-student and student-student interactions,are key elements of effective classroom practice. Two broad areas of developmental the-ory guide much of the work on emotional support in classrooms—attachment theory(Bowlby, 1969) and self-determination theory (Connell & Wellborn, 1991). Attachmenttheorists posit that when adults provide emotional support and a predictable, con-sistent, and safe environment, children become more self-reliant and are able to takerisks as they explore the world because they know that an adult will be there to helpthem if they need it (Bowlby, 1969). Self-determination (or self-systems) theory(Connell & Wellborn, 1991) suggests that children are most motivated to learn whenadults support their need to feel competent, positively related to others, and auton-omous.
Classroom Organization and Management
The ways in which classrooms help students organize their behavior and attentiontoward the pursuit of academic goals is another salient domain of classroom inter-actions. Recent work demonstrates the importance of children’s self-regulatory andexecutive functioning skills to learning and academic achievement (Blair, 2002;Ponitz, Rimm-Kaufman, Brock, & Nathanson, 2009). Classrooms that have clearerand more consistent routines for behavior and time use support children in devel-oping these important skills (e.g., Brophy & Evertson, 1976; Emmer & Strough, 2001;Evertson, Emmer, Sanford, & Clements, 1983; Ponitz, Rimm-Kaufman, Grimm, &Curby, 2009). The strongest evidence for the importance of classroom organizationand management comes from intervention studies. Children in classrooms in whichteachers participate in interventions designed to enhance these aspects of their teach-ing demonstrate improvements in teacher reported and observed self-regulatoryskills (e.g. Raver et al., 2009).
Instructional Support
The theoretical foundation for the conceptualization of instructional supports inthe Teaching through Interactions framework comes primarily from research onchildren’s cognitive and language development (e.g., Catts, Fey, Zhang, & Tomblin,2001; Taylor, Pearson, Peterson, & Rodriguez, 2003). This literature highlights thedistinction between simply learning facts and gaining “usable knowledge” that isbuilt upon learning how facts are interconnected, organized, and conditioned uponone another (Mayer, 2002). A student’s cognitive and language development is con-tingent on the opportunities adults provide to express existing skills and scaffoldmore complex ones (Skibbe, Behnke, & Justice, 2004). Furthermore, learning isstrongest when teachers explicitly tie new information to students’ backgroundknowledge and real-world examples (Bransford, Brown, & Cocking, 2000). In addi-tion to these elements of instructional interactions intended to enhance knowledgeof concepts and language, effective teaching includes feedback that is immediate,contingent, corrective and/or specific, and tied to natural settings (e.g., Kulik &Kulik, 1988). Such feedback serves to control frustration; increase interest, motiva-
�
tion, and effort; and promote learning and higher-order thinking (Butler, 1987; Good& Brophy, 2008; Rogoff, 1990).
The Teaching through Interactions framework further differentiates betweengeneral and content-specific instructional supports. General instructional sup-ports are those that are relevant and observable across content areas. Content-specific instructional supports, in contrast, describe strategies for teaching stu-dents particular skills and knowledge such as reading, math, or science. Thisstudy focuses on general instructional supports because these are the interactionsthat can be assessed most similarly across large numbers of classrooms. Numer-ous studies link these types of instructional interactions to students’ academiclearning (Catts et al., 2001; Hamre & Pianta, 2005; Howes et al., 2008; Taylor et al.,2003). However, we anticipate that many of the elements measured in observational toolssuch as the Mathematical Quality of Instruction (MQI; Hill et al., 2008) or the Protocolfor Language Arts Teaching Observation (PLATO; Grossman et al., 2010), which focuson teachers’ interactions with students around content, may be aligned with the largerTeaching through Interactions framework.
Teacher-Student Interactions Account for Student Learning andDevelopmental Gains
There is strong and consistent evidence that measures of classroom processinformed by the Teaching through Interactions framework do indeed predictstudent performance. For example, observed Emotional Support predicts stu-dent performance in standardized tests of early literacy in preschool and firstgrade (NICHD Early Child Care Research Network, 2003), lower levels of inter-nalizing behaviors reported by mothers in kindergarten and first grade (NICHDEarly Child Care Research Network, 2003), and students’ behavioral engagementwith classrooms across several elementary grades (NICHD Early Child Care Re-search Network, 2002), and appears to help protect children at risk of schoolfailure due to behavioral problems (Buyse, Verschueren, Doumen, Van Damme,& Maes, 2008; Gazelle, 2006). One recent study demonstrates that EmotionalSupport, as measured by CLASS, is associated with gains in standardized achieve-ment and that these associations are mediated by student engagement (Reyes,Brackett, Rivers, White, & Salovey, 2012). Students also learn more in classroomsin which teachers do a better job managing students’ behavior, time, and atten-tion (Ponitz, Rimm-Kaufman, Brock, et al., 2009), partly due to children’s de-velopment of better behavioral and cognitive self-control (Rimm-Kaufman,Curby, Grimm, Nathanson, & Brock, 2009).
Finally, teachers’ instructionally supportive interactions predict students’ aca-demic functioning (Hamre & Pianta, 2005; Howes et al., 2008) and behavioral en-gagement in classroom activities (NICHD Early Child Care Research Network,2003). The MET study demonstrated that the CLASS measures aspects of effectiveteaching that are stable across class sections and that CLASS observations made inone class section were associated with gains in student achievement in other classsections (Kane & Staiger, 2012). Although a few studies have failed to demonstrate theseassociations (Strong, Gargani, & Hacifazlioglu, 2011), the preponderance of evidencesuggests that the Teaching through Interactions framework, as measured by the CLASS
�
and similar measures, describes aspects of the classroom process that contribute tostudent development and learning across assorted settings and grade levels.
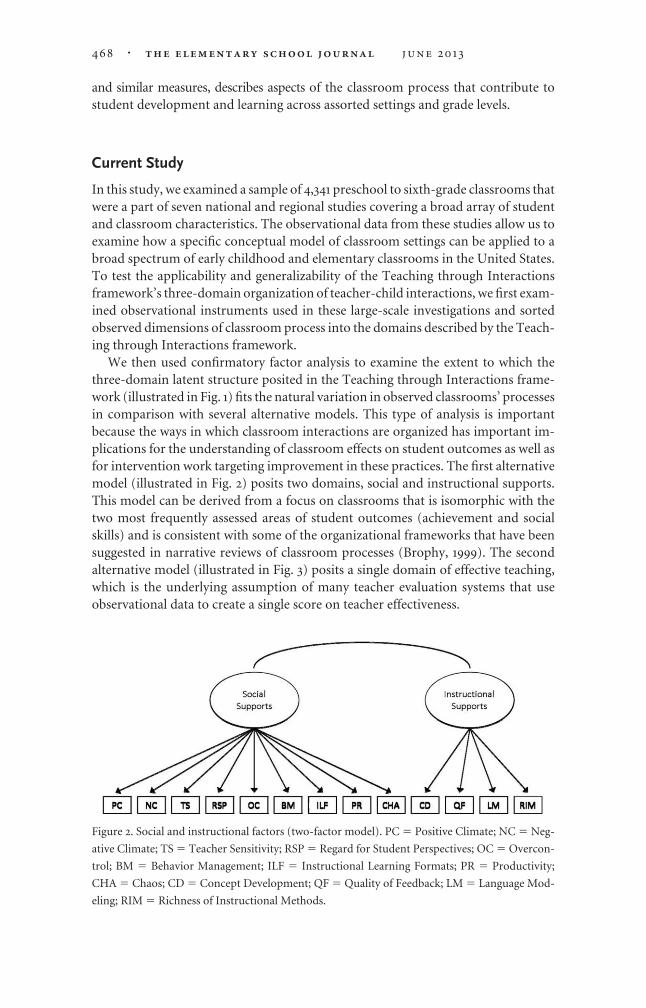
Current Study
In this study, we examined a sample of 4,341 preschool to sixth-grade classrooms thatwere a part of seven national and regional studies covering a broad array of studentand classroom characteristics. The observational data from these studies allow us toexamine how a specific conceptual model of classroom settings can be applied to abroad spectrum of early childhood and elementary classrooms in the United States.To test the applicability and generalizability of the Teaching through Interactionsframework’s three-domain organization of teacher-child interactions, we first exam-ined observational instruments used in these large-scale investigations and sortedobserved dimensions of classroom process into the domains described by the Teach-ing through Interactions framework.
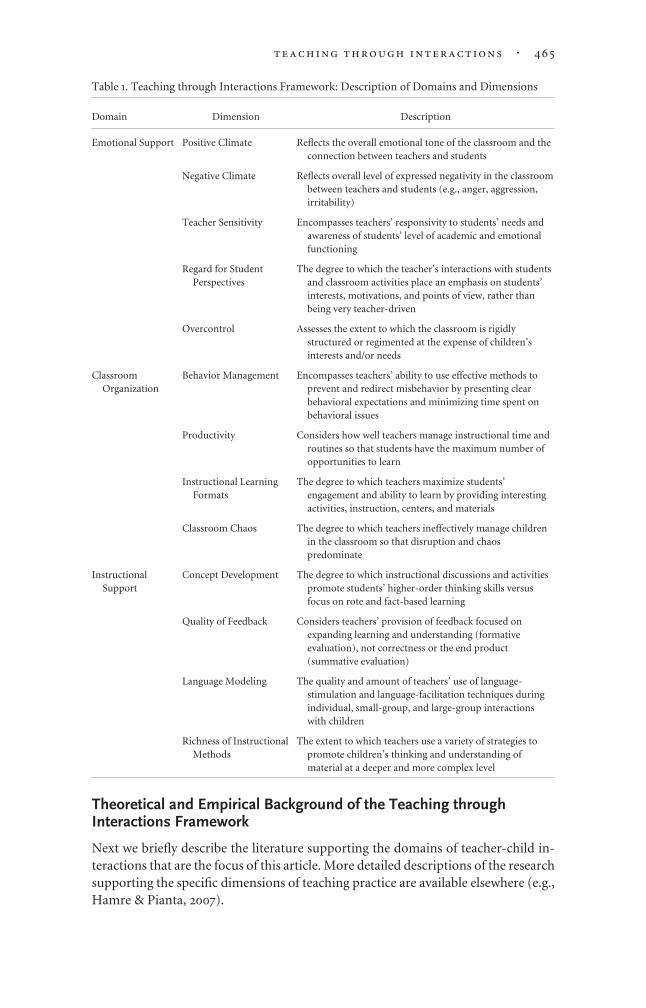
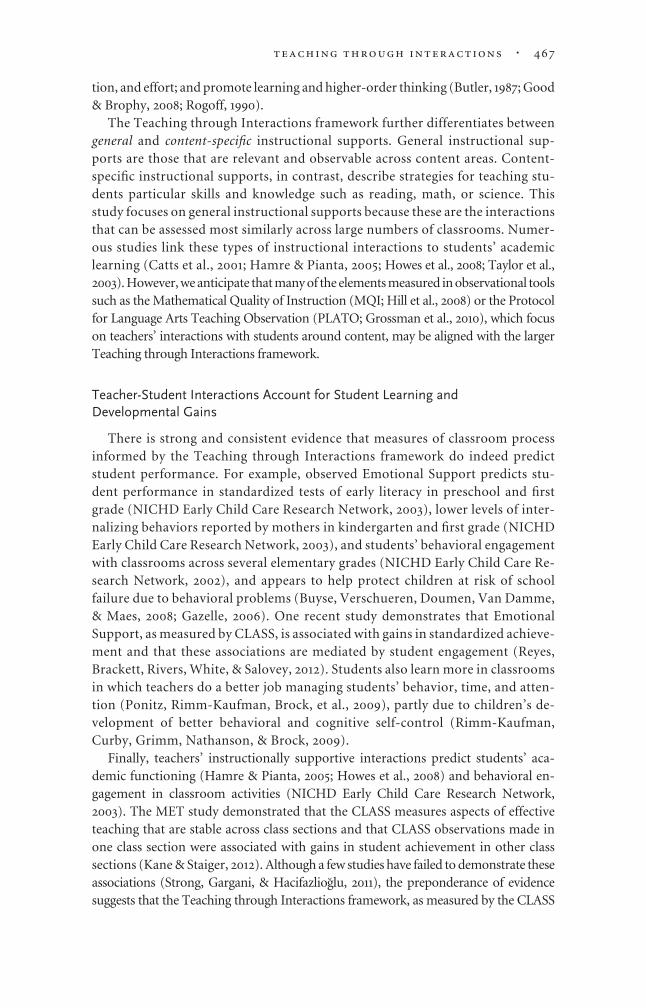
We then used confirmatory factor analysis to examine the extent to which thethree-domain latent structure posited in the Teaching through Interactions frame-work (illustrated in Fig. 1) fits the natural variation in observed classrooms’ processesin comparison with several alternative models. This type of analysis is importantbecause the ways in which classroom interactions are organized has important im-plications for the understanding of classroom effects on student outcomes as well asfor intervention work targeting improvement in these practices. The first alternativemodel (illustrated in Fig. 2) posits two domains, social and instructional supports.This model can be derived from a focus on classrooms that is isomorphic with thetwo most frequently assessed areas of student outcomes (achievement and socialskills) and is consistent with some of the organizational frameworks that have beensuggested in narrative reviews of classroom processes (Brophy, 1999). The secondalternative model (illustrated in Fig. 3) posits a single domain of effective teaching,which is the underlying assumption of many teacher evaluation systems that useobservational data to create a single score on teacher effectiveness.
Figure 2. Social and instructional factors (two-factor model). PC � Positive Climate; NC � Neg-
ative Climate; TS � Teacher Sensitivity; RSP � Regard for Student Perspectives; OC � Overcon-
trol; BM � Behavior Management; ILF � Instructional Learning Formats; PR � Productivity;
CHA � Chaos; CD � Concept Development; QF � Quality of Feedback; LM � Language Mod-
eling; RIM � Richness of Instructional Methods.
�

Finally, we examined the extent to which the three-domain model held true acrossthe 10 observational studies representing classrooms from preschool to sixth grade.Consistent with the theoretical and empirical data cited above, we expected that thethree-domain model, in which dimensions were organized under Emotional, Orga-nizational, and Instructional interactions, would provide a better fit to the data thaneither of the two alternative models.
Method
Studies and Sample
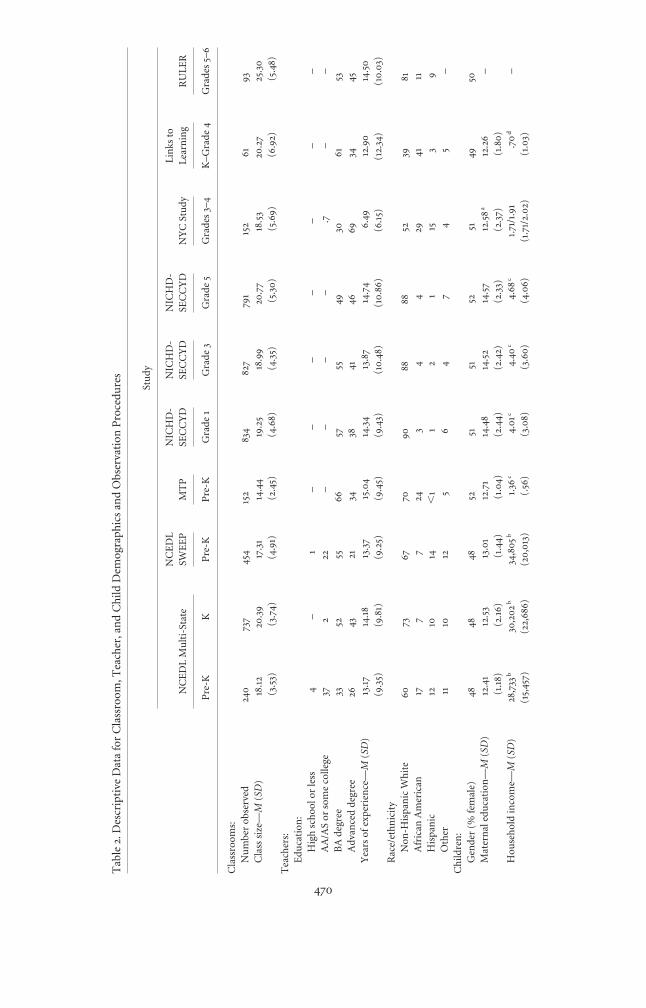
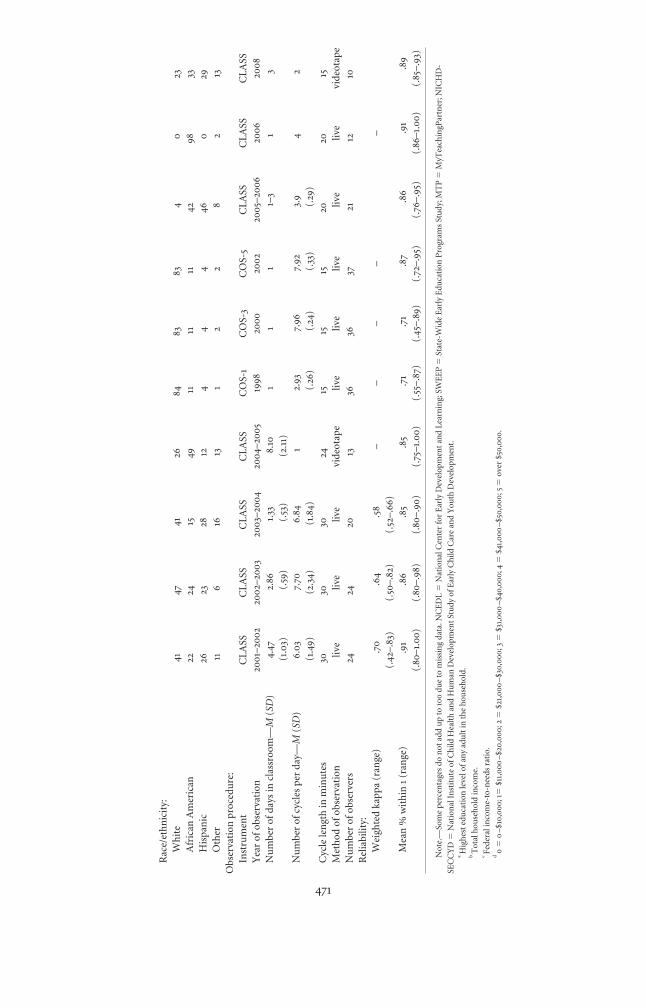
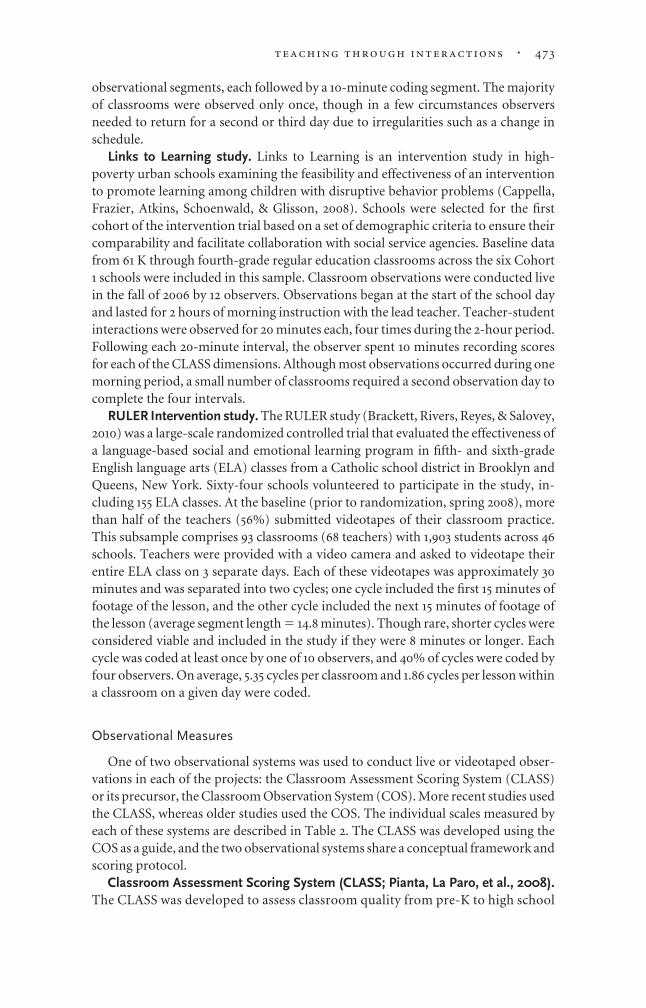
The present study utilizes data from seven large-scale observational research proj-ects conducted from 1998 to 2009 in 4,341 preschool to sixth-grade classrooms acrossthe United States. Basic information for each study’s sample and the classroom ob-servations is included below and in Table 2. A description of each of the samples isprovided below. Readers are referred to individual study citations for more completeinformation on the data-collection procedures and sample.
National Center for Early Development and Learning Multi-State Study of Pre-kindergarten (NCEDL MS). The NCEDL MS (Pianta et al., 2005) was conducted insix states with state-funded preschool programs. In each state (or large metropolitanarea within the state), a stratified random sample of 40 preschool centers or schoolswas selected from a list provided by the state’s department of education. Of the initialsites that were eligible, 78% agreed to participate, resulting in 240 prekindergartenclassrooms enrolled across the 2001–2002 academic year. These children were thenfollowed into 737 kindergarten classrooms, which also were included in these analy-ses. In NCEDL MS pre-K classrooms, 24 observers made two classroom visits in thefall and two in the spring. Observers coded for an entire day in half-day programs anduntil nap time in full-day programs, resulting in an average of 6.03 30-minute cyclesper visit (SD � 1.49). In NCEDL MS kindergarten classrooms, 24 observers madethree classroom visits spaced throughout the year. These observations occurred foran entire school day, except for recess, lunch, and nap, resulting in an average of 7.7030-minute cycles per visit (SD � 2.34).
Figure 3. Effective teaching factor (one-factor model). PC � Positive Climate; NC � Negative
Climate; TS � Teacher Sensitivity; RSP � Regard for Student Perspectives; OC � Overcontrol;
BM � Behavior Management; ILF � Instructional Learning Formats; PR � Productivity; CHA �
Chaos; CD � Concept Development; QF � Quality of Feedback; LM � Language Modeling; RIM �
Richness of Instructional Methods.
�
Tab
le2.
Des
crip
tive
Dat
afo
rC
lass
room
,Tea
cher
,an
dC
hild
Dem
ogra
phic
san
dO
bser
vati
onP
roce
dure
s
Stu
dy
NC
ED
LM
ult
i-St
ate
NC
ED
LSW
EE
PM
TP
NIC
HD
-SE
CC
YD
NIC
HD
-SE
CC
YD
NIC
HD
-SE
CC
YD
NY
CSt
udy
Lin
ksto
Lear
nin
gR
ULE
R
Pre
-KK
Pre
-KP
re-K
Gra
de1
Gra
de3
Gra
de5
Gra
des
3–4
K–G
rade
4G
rade
s5–
6
Cla
ssro
oms:
Nu
mbe
rob
serv
ed24
073
745
415
283
482
779
115
261
93C
lass
size
—M
(SD
)18
.12
20.3
917
.31
14.4
419
.25
18.9
920
.77
18.5
320
.27
25.3
0(3
.53)
(3.7
4)(4
.91)
(2.4
5)(4
.68)
(4.3
5)(5
.30)
(5.6
9)(6
.92)
(5.4
8)T
each
ers:
Edu
cati
on:
Hig
hsc
hoo
lor
less
4–
1–
––
––
––
AA
/AS
orso
me
colle
ge37
222
––
––
.7–
–B
Ade
gree
3352
5566
5755
4930
6153
Adv
ance
dde
gree
2643
2134
3841
4669
3445
Yea
rsof
expe
rien
ce—
M(S
D)
13.1
714
.18
13.3
715
.04
14.3
413
.87
14.7
46.
4912
.90
14.5
0(9
.35)
(9.8
1)(9
.25)
(9.4
5)(9
.43)
(10.
48)
(10.
86)
(6.1
5)(1
2.34
)(1
0.03
)R
ace/
eth
nic
ity
Non
-His
pan
icW
hit
e60
7367
7090
8888
5239
81A
fric
anA
mer
ican
177
724
34
429
4111
His
pan
ic12
1014
�1
12
115
39
Oth
er11
1012
56
47
45
–C
hild
ren
:G
ende
r(%
fem
ale)
4848
4852
5151
5251
4950
Mat
ern
aled
uca
tion
—M
(SD
)12
.41
12.5
313
.01
12.7
114
.48
14.5
214
.57
12.5
8a
12.2
6–
(1.1
8)(2
.16)
(1.4
4)(1
.04)
(2.4
4)(2
.42)
(2.3
3)(2
.37)
(1.8
0)H
ouse
hol
din
com
e—M
(SD
)28
,733
b30
,202
b34
,805
b1.
36c
4.01
c4.
40c
4.68
c1.
71/1
.91
.70
d–
(15,
457)
(22,
686)
(20,
013)
(.56
)(3
.08)
(3.6
0)(4
.06)
(1.7
1/2.
02)
(1.0
3)
Rac
e/et
hn
icit
y:W
hit
e41
4741
2684
8383
40
23A
fric
anA
mer
ican
2224
1549
1111
1142
9833
His
pan
ic26
2328
124
44
460
29O
ther
116
1613
12
28
213
Obs
erva
tion
proc
edu
re:
Inst
rum
ent
CLA
SSC
LASS
CLA
SSC
LASS
CO
S-1
CO
S-3
CO
S-5
CLA
SSC
LASS
CLA
SSY
ear
ofob
serv
atio
n20
01–2
002
2002
–200
320
03–2
004
2004
–200
519
9820
0020
0220
05–2
006
2006
2008
Nu
mbe
rof
days
incl
assr
oom
—M
(SD
)4.
472.
861.
338.
101
11
1–3
13
(1.0
3)(.
59)
(.53
)(2
.11)
Nu
mbe
rof
cycl
espe
rda
y—M
(SD
)6.
037.
706.
841
2.93
7.96
7.92
3.9
42
(1.4
9)(2
.34)
(1.8
4)(.
26)
(.24
)(.
33)
(.29
)C
ycle
len
gth
inm
inu
tes
3030
3024
1515
1520
2015
Met
hod
ofob
serv
atio
nliv
eliv
eliv
evi
deot
ape
live
live
live
live
live
vide
otap
eN
um
ber
ofob
serv
ers
2424
2013
3636
3721
1210
Rel
iabi
lity:
Wei
ghte
dka
ppa
(ran
ge)
.70
.64
.58
––
––
–(.
42–.
83)
(.50
–.82
)(.
52–.
66)
Mea
n%
wit
hin
1(r
ange
).9
1.8
6.8
5.8
5.7
1.7
1.8
7.8
6.9
1.8
9(.
80–1
.00)
(.80
–.98
)(.
80–.
90)
(.75
–1.0
0)(.
55–.
87)
(.45
–.89
)(.
72–.
95)
(.76
–.95
)(.
86–1
.00)
(.85
–.93
)
Not
e.—
Som
epe
rcen
tage
sdo
not
add
up
to10
0du
eto
mis
sin
gda
ta.N
CE
DL
�N
atio
nal
Cen
ter
for
Ear
lyD
evel
opm
ent
and
Lear
nin
g;SW
EE
P�
Stat
e-W
ide
Ear
lyE
duca
tion
Pro
gram
sSt
udy
;MT
P�
MyT
each
ingP
artn
er;N
ICH
D-
SEC
CY
D�
Nat
ion
alIn
stit
ute
ofC
hild
Hea
lth
and
Hu
man
Dev
elop
men
tSt
udy
ofE
arly
Ch
ildC
are
and
You
thD
evel
opm
ent.
aH
igh
est
edu
cati
onle
velo
fan
yad
ult
inth
eh
ouse
hol
d.b
Tot
alh
ouse
hol
din
com
e.cFe
dera
lin
com
e-to
-nee
dsra
tio.
d0
�0
–$10
,000
;1�
$11,
000
–$20
,000
;2�
$21,
000
–$30
,000
;3�
$31,
000
–$40
,000
;4�
$41,
000
–$50
,000
;5�
over
$50,
000.
NCEDL State-Wide Early Education Programs Study (NCEDL SWEEP). TheNCEDL SWEEP study was conducted in five states that were selected to complementthose included in the NCEDL MS sample, mainly to diversify funding and deliverymodels. This study set out to randomly select 100 preschool centers from each state(or regions within states for those states with large metropolitan areas), resulting ina total of 454 classrooms enrolled in the study across the entire 2003–2004 academicyear. During one classroom visit in the spring, 20 observers coded for an entire day inhalf-day programs and until nap time in full-day programs; this resulted in an aver-age of 6.84 30-minute cycles per visit (SD � 1.84).
MyTeachingPartner (MTP). MyTeachingPartner (Pianta, Mashburn, Downer,Hamre, & Justice, 2008) was an NICHD-funded professional development projecttargeting the quality of pre-K teachers’ classroom interactions with students. Fromone state-funded pre-K program, 240 teachers were recruited to participate across 41school districts. Videotapes of classroom interactions were available for 152 of theseteachers during the 2004 –2005 academic year and were included in the currentstudy. Teachers were provided with a video camera and tripod and asked to video-tape themselves for 30 minutes once every 2 weeks. Teachers were asked to tape theirimplementation of either a language/literacy or socioemotional curriculum (58%language/literacy) and were requested to tape 5 minutes prior to the lesson as well asanything after the lesson up to 30 minutes. These videotapes were then coded usingCLASS by a team of 13 observers. A small sample of tapes was double coded forreliability purposes.
National Institute of Child Health and Human Development Study of EarlyChild Care and Youth Development (NICHD SECCYD). The NICHD SECCYD(NICHD Early Child Care Research Network, 2002, 2005; Pianta, Belsky, Houts,Morrison, & NICHD Early Child Care Research Network, 2007) was a longitudinalstudy of key developmental contexts for children from birth through eighth grade.Families were recruited through hospital visits to mothers shortly after the birth of achild in 1991 at 10 locations in the United States. Of the initial pool of eligible motherscontacted for participation, 1,364 completed a home interview when the infant was 1month old and became study participants. The present study included data fromparticipating children in first-grade (N � 834), third-grade (N � 827), and fifth-grade (N � 791) classrooms. Classroom observations took place in winter to earlyspring of first, third, and fifth grades. Within NICHD SECCYD first-grade class-rooms, observations occurred during the morning, began with the official start of theschool day, and lasted approximately 3 hours. Within third- and fifth-grade class-rooms, observations occurred for an entire school day, except for recess and lunch(approximately 6 hours). Observations in all three grades took place on a single dayand consisted of eight 15-minute cycles.
New York City Study of Social and Literacy Development. The New York CityStudy of Social and Literacy Development (Brown, Jones, LaRusso & Aber, 2010;Jones, Brown, & Aber, 2011) was a 3-year longitudinal, experimental evaluation of auniversal, whole-school intervention (the 4Rs Program: Reading, Writing, Respect,and Resolution). The evaluation of 4Rs was conducted in 18 NYC public elementaryschools. Live classroom observations were completed in 152 third-, fourth-, and fifth-grade classrooms by a total of 15 observers in all intervention and control schools.Blind to school intervention status, observers scheduled observations in 2-hourblocks during regular “instructional” time. Observers conducted four 20-minute
�
observational segments, each followed by a 10-minute coding segment. The majorityof classrooms were observed only once, though in a few circumstances observersneeded to return for a second or third day due to irregularities such as a change inschedule.
Links to Learning study. Links to Learning is an intervention study in high-poverty urban schools examining the feasibility and effectiveness of an interventionto promote learning among children with disruptive behavior problems (Cappella,Frazier, Atkins, Schoenwald, & Glisson, 2008). Schools were selected for the firstcohort of the intervention trial based on a set of demographic criteria to ensure theircomparability and facilitate collaboration with social service agencies. Baseline datafrom 61 K through fourth-grade regular education classrooms across the six Cohort1 schools were included in this sample. Classroom observations were conducted livein the fall of 2006 by 12 observers. Observations began at the start of the school dayand lasted for 2 hours of morning instruction with the lead teacher. Teacher-studentinteractions were observed for 20 minutes each, four times during the 2-hour period.Following each 20-minute interval, the observer spent 10 minutes recording scoresfor each of the CLASS dimensions. Although most observations occurred during onemorning period, a small number of classrooms required a second observation day tocomplete the four intervals.
RULER Intervention study. The RULER study (Brackett, Rivers, Reyes, & Salovey,2010) was a large-scale randomized controlled trial that evaluated the effectiveness ofa language-based social and emotional learning program in fifth- and sixth-gradeEnglish language arts (ELA) classes from a Catholic school district in Brooklyn andQueens, New York. Sixty-four schools volunteered to participate in the study, in-cluding 155 ELA classes. At the baseline (prior to randomization, spring 2008), morethan half of the teachers (56%) submitted videotapes of their classroom practice.This subsample comprises 93 classrooms (68 teachers) with 1,903 students across 46schools. Teachers were provided with a video camera and asked to videotape theirentire ELA class on 3 separate days. Each of these videotapes was approximately 30minutes and was separated into two cycles; one cycle included the first 15 minutes offootage of the lesson, and the other cycle included the next 15 minutes of footage ofthe lesson (average segment length � 14.8 minutes). Though rare, shorter cycles wereconsidered viable and included in the study if they were 8 minutes or longer. Eachcycle was coded at least once by one of 10 observers, and 40% of cycles were coded byfour observers. On average, 5.35 cycles per classroom and 1.86 cycles per lesson withina classroom on a given day were coded.
Observational Measures
One of two observational systems was used to conduct live or videotaped obser-vations in each of the projects: the Classroom Assessment Scoring System (CLASS)or its precursor, the Classroom Observation System (COS). More recent studies usedthe CLASS, whereas older studies used the COS. The individual scales measured byeach of these systems are described in Table 2. The CLASS was developed using theCOS as a guide, and the two observational systems share a conceptual framework andscoring protocol.
Classroom Assessment Scoring System (CLASS; Pianta, La Paro, et al., 2008).The CLASS was developed to assess classroom quality from pre-K to high school
�

(see www.classobservation.com); however, the versions of the CLASS used in thisreport focused on pre-K to fifth grade. An early version of the CLASS used in theNCEDL studies contained nine dimensions, whereas the current version used inMTP, RULER, the New York City Study of Social and Literacy Development, andLinks to Learning studies contained 10. In each study, global ratings during eachcycle (ranging from 15 to 30 minutes) were made on a 7-point scale, ranging from“low” to “high,” for the following dimensions of teacher-student interactions:positive climate, negative climate, teacher sensitivity, regard for student perspec-tives, behavior management, instructional learning formats, productivity, con-cept development, quality of feedback, and language modeling. One dimensionfrom the CLASS used in the NCEDL studies, overcontrol, was significantly re-vised due to problems with limited variability and skewness into a new dimen-sion, Regard for Student Perspectives. Observers watched classroom interactionsfor a prescribed period of time (which varied slightly by study, but ranged from 15 to 30minutes) while taking detailed field notes about specific teacher and student behaviorsand interaction patterns. Observers then had 10 minutes to use the behaviorally anchoredset of rating scales in the CLASS manual to determine a final code for each dimension.CLASS scores used in current analyses were aggregated across cycles, observers, andobservation visits to form variables at the classroom level.
COS-1, -3, -5. The first-, third-, and fifth-grade versions of the COS weredeveloped specifically for use in the NICHD SECCYD to track child behaviorsand classroom conditions. The COS uses a multilevel observation format thatincorporates both discrete codes and global ratings, although only the globalratings of classroom quality were used in this study. Ratings during each cyclewere made on a 7-point scale ranging from “uncharacteristic” to “extremelycharacteristic” for the following dimensions of teacher-student interactions: lit-eracy instruction, evaluative feedback, instructional conversation, encourage-ment of child responsibility, positive emotional climate, negative emotionalclimate, classroom management, teacher sensitivity, richness of instructionalmethods, and classroom chaos (see Table 3). Observers watched classroom in-teractions for 5 minutes prior to a 10-minute time-sampling period, as well as10 minutes immediately after the time-sampled period. During this dedicatedobservation time, observers took detailed field notes about specific teacher andstudent behaviors and interaction patterns. Observers then had 10 minutes to usethe behaviorally anchored set of rating scales in the COS manual to determine afinal code for each dimension. COS scores used in current analyses were aggre-gated across cycles to form variables at the classroom level.
Training and reliability. Across studies, all observers attended a centralizedworkshop to attain reliability on the CLASS or COS. Prior to attending theworkshop, observers were asked to read a manual with extensive descriptions ofdimensions and anchor points and to practice coding several videotape clips. Theworkshops consisted of guided practice with coding videotaped classroom foot-age. After the training workshops, observers had to pass a reliability test involv-ing the coding of either five or six cycles of 20 – 44 minutes. Observers’ globalratings had to match the master global ratings (within 1 scale point) on at least80% of the cycles for them to pass the test. During data collection, all studiescompleted further reliability checks through independent live double-coding or
�

independent dual review of videotapes. Assessments of reliability within eachstudy, as available, are reported in Table 2.
Data Analysis Approach
Data organization and analysis involved three steps: content analysis, confirma-tory factor analysis, and multiple group confirmatory factor analysis. First, based onliterature reviewed in the introduction, six members of our research team indepen-dently sorted CLASS and COS dimensions twice. First they were sorted into thehypothesized three domains from the Teaching through Interactions framework.Then they were sorted into two domains: Social Supports and Instructional Sup-ports. In both cases, there was 100% agreement on the domain in which each dimen-sion measured by CLASS or COS best fit. The final model that was tested placed alldimensions into a single factor. Figures 1, 2, and 3 provide a summary of each of thesemodels.
We then conducted a series of confirmatory factor analyses (CFAs) to determinewhether the Teaching through Interactions model (with three factors), the Social andInstructional Supports model (with two factors), or the Effective Teaching model(with one factor) best fit the observed data. These models were examined both in thefull data set including all of the samples, as well as in the data set for each individualsample. Multiple-fit indices were then compared across the three models because thechi-square overall goodness-of-fit test is unfavorably affected by large sample size,model misspecification, or violation of distribution assumptions (Bollen, 1990).Given that our samples all had missing data, we used multiple imputation, a methodthat has been identified as one of the optimal ways to handle missingness in educa-tional research (Peugh & Enders, 2004), when estimating and testing our models.
Table 3. Means, Standard Deviations, and Correlation Matrix among Teacher-StudentInteraction Variables (n � 458 to n � 4,341)
PC NC TS RSP OC BM ILF PR CH CD QF LM RIM
Mean 5.10 1.40 4.75 4.26 2.12 5.26 4.14 4.82 1.57 2.58 2.54 2.81 2.80SD .803 .61 .90 .88 1.09 .91 1.02 .94 .67 1.02 1.13 .93 1.12PC 1.00NC �.56 1.00TS .76 �.56 1.00RSP .53 �.36 .68 1.00OC �.48 .41 �.31 �.46 1.00BM .54 �.51 .61 .41 �.31 1.00ILF .44 �.29 .49 .66 �.21 .51 1.00PR .47 �.44 .53 .33 �.09 .70 .61 1.00CH �.32 .44 �.28 �.02 �.54 1.00CD .21 �.21 .30 .42 �.02 .32 .45 .45 1.00QF .32 �.22 .38 .38 .05 .30 .43 .45 �.23 .78 1.00LM .41 �.28 .65 .65 �.32 .31 .43 .21 .75 .54 1.00RIM .33 �.01 .25 .25 �.37 .29 �.19 .64 1.00
Note.—All correlations above .05 are significant at p � .001. Missing correlations could not be estimated as these variables were
not present in the same data set. PC � Positive Climate; NC � Negative Climate; TS � Teacher Sensitivity; RSP � Regard for
Student Perspectives; OC � Overcontrol; BM � Behavior Management; ILF � Instructional Learning Formats; PR � Productivity;
CH � Chaos; CD � Concept Development; QF � Quality of Feedback; LM � Language Modeling; RIM � Richness of Instructional
Methods.
�
Analyses were conducted and aggregated across 100 imputed data sets to ensure thatour results represented valid, consistent patterns in the data. Bayesian analysis wasused to generate the imputed datasets.
Results
Descriptive Characteristics
Table 3 shows descriptive statistics including means, standard deviations, andcorrelation coefficients among observed classroom interaction variables. The corre-lations presented in Table 3 demonstrate some areas of high convergence (e.g., strongassociation between Positive Climate and Teacher Sensitivity) and divergence (e.g.,low correlations between Overcontrol and Concept Development).
CFA Models
Figures 1–3 depict path diagrams for three alternative structural equation modelsthat would explain the factor structure of our interaction measures. Our main inter-est was in the Teaching through Interactions model (illustrated in Fig. 1), where thedimensions were assigned to emotional supports, classroom organization, and in-structional supports factors. We also tested two additional models providing alter-native organizations of the interaction measures. In the Social/ Emotional Supportsmodel (illustrated in Fig. 2), we collapsed Emotional Support and Classroom Orga-nization factors to form a single latent construct, isolating Instructional Support. Inthe Effective Teaching model (illustrated in Fig. 3), all of the measures loaded on asingle factor. Mplus 6.11 was used to fit all three models using maximum-likelihoodestimation.
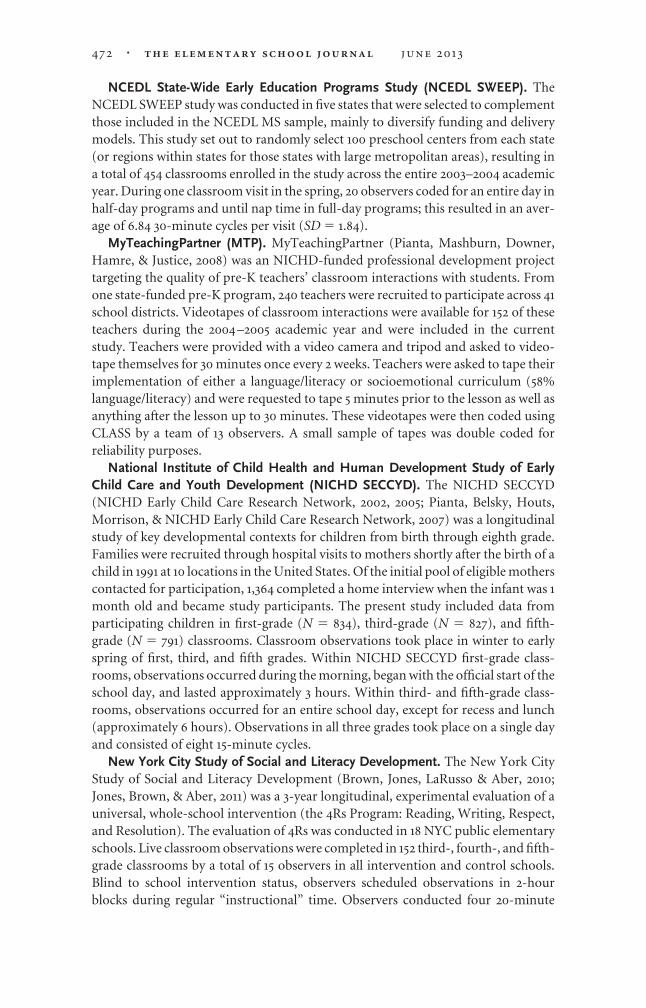
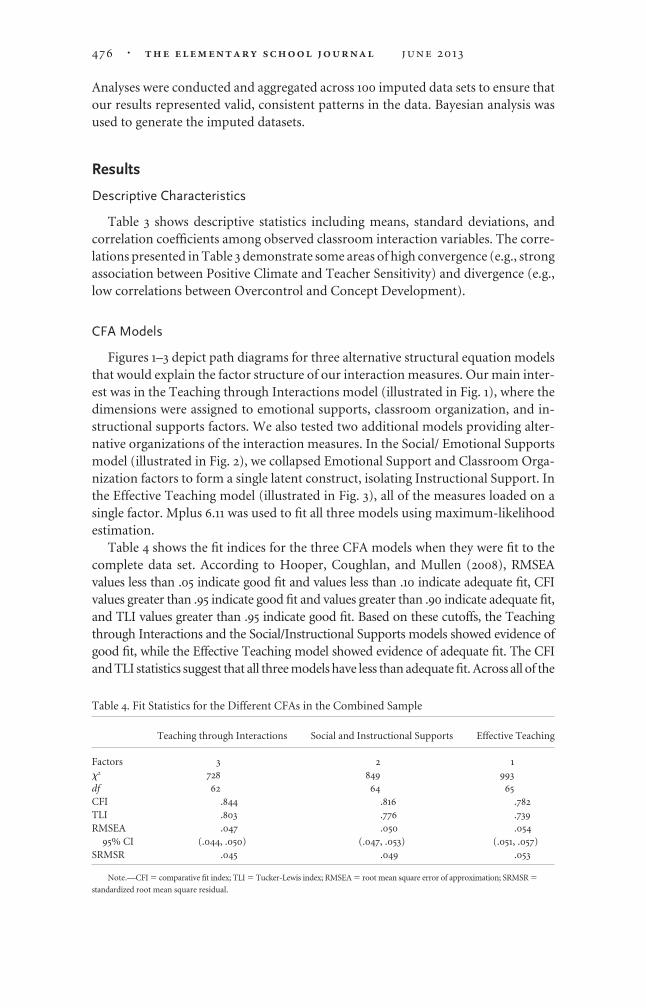
Table 4 shows the fit indices for the three CFA models when they were fit to thecomplete data set. According to Hooper, Coughlan, and Mullen (2008), RMSEAvalues less than .05 indicate good fit and values less than .10 indicate adequate fit, CFIvalues greater than .95 indicate good fit and values greater than .90 indicate adequate fit,and TLI values greater than .95 indicate good fit. Based on these cutoffs, the Teachingthrough Interactions and the Social/Instructional Supports models showed evidence ofgood fit, while the Effective Teaching model showed evidence of adequate fit. The CFIand TLI statistics suggest that all three models have less than adequate fit. Across all of the
Table 4. Fit Statistics for the Different CFAs in the Combined Sample
Teaching through Interactions Social and Instructional Supports Effective Teaching
Factors 3 2 1�2 728 849 993df 62 64 65CFI .844 .816 .782TLI .803 .776 .739RMSEA .047 .050 .054
95% CI (.044, .050) (.047, .053) (.051, .057)SRMSR .045 .049 .053
Note.—CFI � comparative fit index; TLI � Tucker-Lewis index; RMSEA � root mean square error of approximation; SRMSR �
standardized root mean square residual.
�
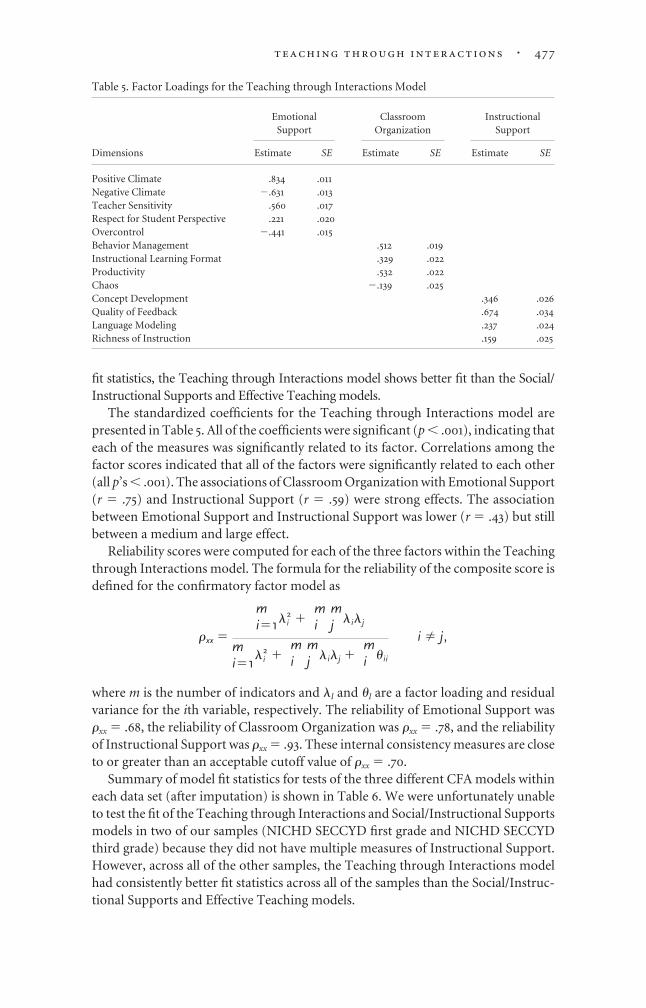
fit statistics, the Teaching through Interactions model shows better fit than the Social/Instructional Supports and Effective Teaching models.
The standardized coefficients for the Teaching through Interactions model arepresented in Table 5. All of the coefficients were significant (p � .001), indicating thateach of the measures was significantly related to its factor. Correlations among thefactor scores indicated that all of the factors were significantly related to each other(all p’s � .001). The associations of Classroom Organization with Emotional Support(r � .75) and Instructional Support (r � .59) were strong effects. The associationbetween Emotional Support and Instructional Support was lower (r � .43) but stillbetween a medium and large effect.
Reliability scores were computed for each of the three factors within the Teachingthrough Interactions model. The formula for the reliability of the composite score isdefined for the confirmatory factor model as
�xx �
mi�1� i
2 �mi
mj � i� j
mi�1
� i2 �
mi
mj � i� j �
mi � ii
i � j,
where m is the number of indicators and �I and �I are a factor loading and residualvariance for the ith variable, respectively. The reliability of Emotional Support was�xx � .68, the reliability of Classroom Organization was �xx � .78, and the reliabilityof Instructional Support was �xx � .93. These internal consistency measures are closeto or greater than an acceptable cutoff value of �xx � .70.
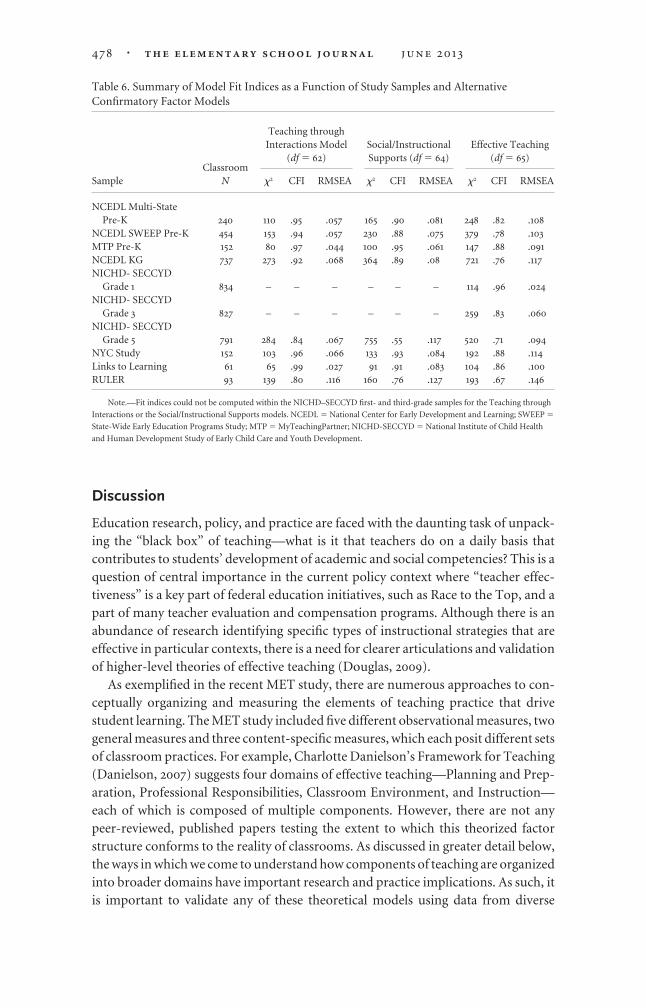
Summary of model fit statistics for tests of the three different CFA models withineach data set (after imputation) is shown in Table 6. We were unfortunately unableto test the fit of the Teaching through Interactions and Social/Instructional Supportsmodels in two of our samples (NICHD SECCYD first grade and NICHD SECCYDthird grade) because they did not have multiple measures of Instructional Support.However, across all of the other samples, the Teaching through Interactions modelhad consistently better fit statistics across all of the samples than the Social/Instruc-tional Supports and Effective Teaching models.
Table 5. Factor Loadings for the Teaching through Interactions Model
EmotionalSupport
ClassroomOrganization
InstructionalSupport
Dimensions Estimate SE Estimate SE Estimate SE
Positive Climate .834 .011Negative Climate �.631 .013Teacher Sensitivity .560 .017Respect for Student Perspective .221 .020Overcontrol �.441 .015Behavior Management .512 .019Instructional Learning Format .329 .022Productivity .532 .022Chaos �.139 .025Concept Development .346 .026Quality of Feedback .674 .034Language Modeling .237 .024Richness of Instruction .159 .025
�
Discussion
Education research, policy, and practice are faced with the daunting task of unpack-ing the “black box” of teaching—what is it that teachers do on a daily basis thatcontributes to students’ development of academic and social competencies? This is aquestion of central importance in the current policy context where “teacher effec-tiveness” is a key part of federal education initiatives, such as Race to the Top, and apart of many teacher evaluation and compensation programs. Although there is anabundance of research identifying specific types of instructional strategies that areeffective in particular contexts, there is a need for clearer articulations and validationof higher-level theories of effective teaching (Douglas, 2009).
As exemplified in the recent MET study, there are numerous approaches to con-ceptually organizing and measuring the elements of teaching practice that drivestudent learning. The MET study included five different observational measures, twogeneral measures and three content-specific measures, which each posit different setsof classroom practices. For example, Charlotte Danielson’s Framework for Teaching(Danielson, 2007) suggests four domains of effective teaching—Planning and Prep-aration, Professional Responsibilities, Classroom Environment, and Instruction—each of which is composed of multiple components. However, there are not anypeer-reviewed, published papers testing the extent to which this theorized factorstructure conforms to the reality of classrooms. As discussed in greater detail below,the ways in which we come to understand how components of teaching are organizedinto broader domains have important research and practice implications. As such, itis important to validate any of these theoretical models using data from diverse
Table 6. Summary of Model Fit Indices as a Function of Study Samples and AlternativeConfirmatory Factor Models
SampleClassroom
N
Teaching throughInteractions Model
(df � 62)Social/InstructionalSupports (df � 64)
Effective Teaching(df � 65)
�2 CFI RMSEA �2 CFI RMSEA �2 CFI RMSEA
NCEDL Multi-StatePre-K 240 110 .95 .057 165 .90 .081 248 .82 .108
NCEDL SWEEP Pre-K 454 153 .94 .057 230 .88 .075 379 .78 .103MTP Pre-K 152 80 .97 .044 100 .95 .061 147 .88 .091NCEDL KG 737 273 .92 .068 364 .89 .08 721 .76 .117NICHD- SECCYD
Grade 1 834 – – – – – – 114 .96 .024NICHD- SECCYD
Grade 3 827 – – – – – – 259 .83 .060NICHD- SECCYD
Grade 5 791 284 .84 .067 755 .55 .117 520 .71 .094NYC Study 152 103 .96 .066 133 .93 .084 192 .88 .114Links to Learning 61 65 .99 .027 91 .91 .083 104 .86 .100RULER 93 139 .80 .116 160 .76 .127 193 .67 .146
Note.—Fit indices could not be computed within the NICHD–SECCYD first- and third-grade samples for the Teaching through
Interactions or the Social/Instructional Supports models. NCEDL � National Center for Early Development and Learning; SWEEP �
State-Wide Early Education Programs Study; MTP � MyTeachingPartner; NICHD-SECCYD � National Institute of Child Health
and Human Development Study of Early Child Care and Youth Development.
�

samples. This study provides initial evidence of the validity of one such approach, theTeaching through Interactions framework.
The Teaching through Interactions framework posits that much of the effect ofteachers and classrooms on student learning is located in the interactions that takeplace between teachers and students. This model suggests that across grade levels,these interactions are organized into three domains—Emotional Support, Class-room Organization, and Instructional Support. A growing body of research docu-ments the connections between these types of interactions and student outcomes inpreschool through sixth grade (Buyse et al., 2008; Gazelle, 2006; Hamre & Pianta,2005; Kane & Staiger, 2012; NICHD ECCRN, 2003; Pianta et al., 2007; Reyes et al.,2012; see Strong et al., 2011, for exception). The present study extends this validitywork by providing evidence that this organization of classroom interactions intothree broad domains of effective teaching “fits” the reality of preschool and elemen-tary classrooms across the country. When tested against models suggesting either anomnibus teacher quality factor or a simpler social and instructional supports model,the three-factor model fit data from 4,341 early childhood and elementary classroomsthe best. This three-factor model fit observational data collected from a range ofstudies, using different measures and observational methodologies (e.g., live vs.video), across a broad range of settings, including urban and rural classrooms, andacross preschool to sixth-grade classrooms.
Below we discuss two broad areas of research on effective teaching that may beenhanced by the use of the more theoretically driven and empirically supportedframeworks for teaching, such as the Teaching through Interactions framework: thedevelopment of effective teaching and understanding associations between teachingand students’ learning.
Understanding the Development of Effective Teaching
One way in which the articulation of three major domains of effective teachingmay be helpful is in guiding research on ways in which teachers develop specific skillsover time. For example, Malmberg, Hagger, Burn, Mutton, and Colls (2011) followedteachers from their last year of teacher education, to a student teaching placement,and then into their first 2 years of teaching. The results showed that, on average,teachers increased their classroom organization and management skills over theseearly years of teaching, with the strongest improvements seen among teachers whostarted off relatively lower in this domain. A different pattern was found for emo-tional support, where initial increases were followed by declines, leading to an in-verted U-shape curve over time. Malmberg and colleagues suggested that this findingmay reflect stress and demands on beginning teachers as they move from teachereducation to their own jobs. This research offers a more nuanced view of the devel-opment of teaching skills than do studies that simply examine changes in teacherperformance over time based on student test scores or teacher report, or those thatexamine one dimension of teaching at a time.
Recent work also suggests that these domains of teaching may be improvedthrough intentionally designed and intensive professional development experiences(e.g., Brown et al., 2010; Domitrovich et al., 2009; Hamre et al., 2012; Pianta, Mash-burn, et al., 2008; Raver et al., 2008). Many of these studies show differential impactsof professional development on particular domains of teaching. For example, Brown
�

and colleagues (2010) demonstrated differences between classrooms implementingthe 4Rs social-emotional and literacy curriculum and control classrooms imple-menting Emotional and Instructional Supports but not Classroom Organization.Similar results were obtained in a study testing the efficacy of a course designed toenhance teacher-student interactions among early childhood teachers (Hamre et al.,2012). An intervention focused on using mental health consultants in classroomsdemonstrated impacts on only Emotional Support (Cappella et al., 2012). In contrast,other studies have provided evidence that Classroom Organization is sensitive tointervention (Domitrovich et al., 2009; Raver et al., 2008). These types of studies canhelp us better understand the specific professional development experiences that aremost likely to impact particular domains of teaching.
A final literature of relevance here examines predictors of effective teaching.Rimm-Kaufman and Hamre (2010) proposed a Comprehensive Model of TeacherQuality that embeds effective teaching in a dynamic model that considers the waysteachers’ personal attributes and professional experiences influence the developmentof their teaching skills, as well as the ways in which these relationships are influencedby contextual factors such as professional development, school climate, and districtpolicies. This model recognizes the complex systems that influence the developmentof teaching skills and can be made more complex—and more precise— by a consid-eration of the ways these systems operate differently in influencing the three broaddomains of teaching. For example, within early childhood literature there are fewindications that teacher degree status influences effectiveness (Early et al., 2007);however, to the extent this evidence exists, it is primarily in the instructional domain(LaParo et al., 2009; Pianta et al., 2005). The lack of an association between teachereducation and classroom organization or emotional support suggests that currentteacher education programs do very little to teach teachers how to develop positiverelationships with students or develop effective management strategies. In contrast,teachers’ psychological characteristics appear to be more closely tied to emotionalrather than instructional supports (Li-Grining et al., 2010), whereas teacher experi-ence is most closely linked to skills in management and organization (La Paro et al.,2009). Again, the point here is that by conceptualizing and measuring multiple do-mains of teaching practice, we are better able to understand the factors that influenceteachers’ development of the complex set of skills that are required to be an effectiveteacher.
Understanding Associations between Teaching and Student Development
Another area of research in which the Teaching through Interactions frameworkmay enhance our knowledge is the effects of teaching on student learning and devel-opment. There is an assumption underlying the theoretical basis for this frameworkof domain specificity: emotional supports promote social development, classroommanagement and organization promote positive behavior and attention, and in-structional supports enhance learning. Although some research supports this do-main specificity (e.g., Howes et al., 2008; Mashburn et al., 2008; Rimm-Kaufman etal., 2009), the developmental theory on which this framework was based suggeststhat these effects are not so simple (Downer, Sabol, & Hamre, 2010). There are someexamples from the literature supporting cross-domain linkages. For example, thereare several studies indicating that emotional support is associated with student learn-
�
ing (Hamre & Pianta, 2005; Rudasill, Gallagher, & White, 2010). This is importantbecause in the current context of accountability for student achievement, there is atendency for schools to focus only on instruction. This research suggests that attend-ing to teachers’ emotional supports may also be important, especially for childrenwith social and behavioral problems (Hamre & Pianta, 2005). Research of this type ismore convincing if it does not focus solely on emotional supports, but rather com-pares effects across these different domains of teaching.
Other Approaches to Understanding Teacher Effectiveness
Although the Teaching through Interactions framework offers one broad, vali-dated approach to understanding teacher effectiveness, there are clearly many othercomponents to effective teaching, both within and outside the broad domain ofteacher-student interactions. An important part of the Teaching through Interac-tions framework, but one that was not measured by either the CLASS or COS, is theidea of content-specific instructional supports. For example, recent observationalwork has focused on the specific instructional strategies used in successful mathe-matics teaching (Hill et al., 2008) and English language arts instruction (Grossman,2011). In the MET study (Kane & Staiger, 2012), these content-specific instrumentswere moderately to highly correlated with more general measures of teaching prac-tice, such as CLASS and the Danielson Framework for Teaching, suggesting there aremany elements of teaching that may be shared across content areas, but also that eachcontent area may have unique elements of instruction. Within the MET study, thegeneral measures of teaching practice predicted gains in student achievement atsimilar levels as did the more content-specific measures. It will be important forfuture work to examine how these types of content-specific instructional supportsmay fit with more general instructional strategies. Do they form a unique componentof effective teaching, as hypothesized, or are they well aligned with other more gen-eral instructional supports offered by teachers?
It is also important to note that although observation offers an important windowinto teaching, it is not the only methodology to do so. As one example, teacher logsprovide a cost-effective method for gathering data about teacher practices across theyear (Rowan & Correnti, 2009). Although much of the initial research using teacherlogs focused primarily on the amount of instruction provided across a variety ofcurricular activities, more recent work has also captured more qualitative compo-nents of teaching, such as the extent to which teachers use strategies that provide ahigher cognitive demand (Rowan & Correnti, 2009). Student reports on teachersoffer another important window on teacher effectiveness. MET study results suggestthat student reports are often more highly correlated with teacher value-added scoresthan are observational data (Kane & Staiger, 2012).
There is also a great deal that teachers do that falls outside of their interactionswith students. For example, they create assignments for students that can be assessedbased on dimensions such as cognitive challenge, clarity of learning goals, clarity ofgrading criteria, and alignment of goals and task (Clare & Aschbacher, 2001). Thereis evidence that the quality of these assignments is related to student learning, aboveand beyond observational measures of teachers’ practice (Matsumura, Garnier, Sla-ter, & Boston, 2008). Assessments of teacher effectiveness should also attend to thesecomponents of teachers’ jobs.
�
The Teaching through Interactions framework offers only one window intoteacher effectiveness. However, we argue that interactions among teachers and stu-dents are among the most important aspects of teachers’ jobs. There is also initialevidence that this model for understanding classroom interactions is consistentacross other cultures (Cadima, Leal, & Burchinal, 2010; Malmberg & Hagger, 2009;Pakarinen et al., 2010) and into secondary settings (Allen, Pianta, Gregory, Mikami,& Lun, 2011; Malmberg & Hagger, 2009). Furthermore, observations can be con-ducted as a part of normative school practice (e.g., principle observations for evalu-ation purposes) and can work across contexts, unlike methods such as student reportthat would be difficult to complete with younger students.
Limitations and Future Directions for Research
There are a few other limitations to note beyond those already discussed. First andforemost, this study tested a conceptual model of teaching using two observationalsystems that were developed, at least in part, on this theory. Theory cannot, however,move forward based on a single measure. There is a need for future work to examinethe extent to which data from other measures, based on different frameworks butalso focusing on teacher-student interactions (e.g., Connor et al., 2009; Matsumuraet al., 2008), may also fit this broad conceptual model for the way teacher-studentinteractions are organized. There are also many elements of interaction neither suf-ficiently covered by this theory nor measured by the CLASS or COS. Beyond thecontent-specific elements of teacher-student interactions discussed above, there is aneed to attend to interactions around cultural sensitivity and social justice (Kaur, inpress). With regard to the measures used in this study, the interrater reliabilities forthe global rating scales used in these studies, while adequate, were not as strong asmight be desirable, reflecting the presence of unexplained influences on the scores.
Additionally, the covariance among the three domains of teacher-student inter-actions are high, suggesting that there are significant elements of effective teachingthat are shared across domains. These results are consistent with the MET study,which suggested a single overall factor for the CLASS (Kane & Staiger, 2012). A highlevel of covariance across domains can lead to analytic challenges when these do-mains are used together to predict outcomes (Downer et al., 2010). One potentialanalytic approach that could be used to address this challenge is the bifactor ap-proach (Chen, Hayes, Carver, Laurenceau, & Zhang, 2012). Bifactor modeling differsfrom traditional factor analysis in that it allows for general qualities between thefactors to be estimated as a general factor as well as estimating specific factors overand beyond the general factor. Once these factors are estimated, they are uncorre-lated and thus represent unique features of a multifaceted construct. Future workwith CLASS may examine the extent to which this approach may offer both analyticand conceptual advantages. Finally, because most of the data here come from studiescovering only one grade, we were not able to directly test assumptions about invar-iance across grades. This will be an important area for future work.
In sum, this study provides support for a theory of classroom interactions and hasimportant implications for educational theory, research, and practice. With thegrowing focus on teacher effectiveness and accountability, it will be important forobservational research on teaching to continue to contribute to the ongoing policyand practice debates.
�
Note
Authors Bridget Hamre and Robert Pianta are authors of the CLASS measure and own a companythat conducts CLASS trainings. The authors gratefully acknowledge the National Institute for ChildHealth and Human Development for support of the Study of Early Child Care and Youth Development,the Interagency Consortium on School Readiness for support of the MyTeachingPartner study, theNational Institute for Early Education Research (NIEER), W. Steven Barnett, the Pew CharitableTrusts, and the Foundation for Child Development for their support of the SWEEP Study, and theU.S. Department of Education for its support of the Multi-State Study of Pre-Kindergarten. Linksto Learning is funded by the National Institute of Mental Health (PI: Atkins; R01 MH073749). TheNew York City Study of Social and Literacy Development is supported by grants from the U.S.Department of Education in collaboration with the Centers for Disease Control (R305L030003)and the William T. Grant Foundation (# 2618) to J. Lawrence Aber (PI), Jones and Brown (co-PIs),and by a grant from the William T. Grant Foundation (#7520) to Jones and Brown (co-PIs). TheRULER intervention study is funded by the William T. Grant Foundation (#8364) to Brackett (PI),and Rivers & Salovey (co-PIs). However, the contents of this study do not necessarily represent thepositions or policies of the funding agencies, and endorsement by these agencies should not beassumed. The authors are grateful for the help of the many children, parents, teachers, adminis-trators, and field staff who participated in these studies. Please address questions or correspon-dence to Bridget K. Hamre, University of Virginia, Center for Advanced Study of Teaching andLearning, 350 Old Ivy Way Suite 100, Charlottesville, VA 22903; phone: 434 –982– 4855; fax: 434 –243–5480; email: [email protected].
References
Allen, J. P., Pianta, R. C., Gregory, A., Mikami, A. Y., & Lun, J. (2011). An interaction-basedapproach to enhancing secondary school instruction and student achievement. Science,333(6045), 1034 –1037.
Bell, C. A., Gitomer, D., McCaffrey, D., Hamre, B., & Pianta, B. (2011). An argument approach toobservation protocols. Paper presented at the annual meeting of the National Council on Mea-surement in Education, New Orleans, LA.
Blair, C. (2002). School readiness: Integrating cognition and emotion in a neurobiological concep-tualization of children’s functioning at school entry. American Psychologist, 57(2), 111–127.
Bollen, K. A. (1990). Structural equations with latent variables. New York: Wiley.Bowlby, J. (1969). Attachment and loss: vol. 1. Attachment. New York: Basic Books.Brackett, M. A., Rivers, S. E., Reyes, M. R., & Salovey, P. (2010, January). Using emotional literacy to
improve classroom social-emotional processes. Paper presented at the William T. Grant and Spen-cer Foundation Grantees Meeting, Washington, DC.
Bransford, J. D., Brown, A. L., & Cocking, R. R. (Eds.). (2000). How people learn: Brain, mind,experience, and school, expanded edition. Washington, DC: National Academies Press.
Bronfenbrenner, U., & Morris, P. A. (1998). The ecology of developmental processes. In W. Damon& R. M. Lerner (Eds.), Handbook of child psychology: Vol. 1. Theoretical models of human devel-opment (5th ed., pp. 993–1029). New York: Wiley.
Brophy, J. (1999). Teaching. Educational Practices Series 1. Paris: International Academy of Edu-cation and International Bureau of Education.
Brophy, J., & Evertson, C. (1976). Learning from teaching: A developmental perspective. Boston: Allyn& Bacon.
Brown, J. L., Jones, S. M., LaRusso, M. D., & Aber, J. L. (2010). Improving classroom quality:Teacher influences and experimental impacts of the 4Rs program. Journal of Educational Psy-chology, 102, 153–167.
Butler, R. (1987). Task-involving and ego-involving properties of evaluation effects of differentfeedback conditions on motivational perceptions, interest, and performance. Journal of Educa-tional Psychology, 79(4), 474 – 482.
�
Buyse, E., Verschueren, K., Doumen, S., Van Damme, J., & Maes, F. (2008). Classroom problembehavior and teacher-child relationships in kindergarten: The moderating role of the classroomclimate. Journal of School Psychology, 46(4), 367–391.
Cadima, J., Leal, T., & Burchinal, M. (2010). The quality of teacher-student interactions: Associa-tions with first graders’ academic and behavioral outcomes. Journal of School Psychology, 48,457– 482.
Cappella, E., Frazier, S., Atkins, M., Schoenwald, S., & Glisson, C. (2008). Enhancing schools’capacity to support children in poverty: An ecological model of school-based mental healthservices. Administration and Policy in Mental Health and Mental Health Services Research, 35,395– 409.
Cappella, E., Hamre, B. K., Kim, H., Henry, D. B., Frazier, S. L., Atkins, M. S., & Schoenwald, S. K.(2012). Teacher consultation and coaching within mental health practice: Classroom and childeffects in urban elementary schools. Journal of Consulting & Clinical Psychology, 80(4), 597– 610.
Catts, H. W., Fey, M. E., Zhang, X., & Tomblin, J. B. (2001). Language basis of reading and readingdisabilities: Evidence from a longitudinal investigation. Scientific Studies of Reading, 3, 331–361.
Chen, F. F., Hayes, A., Carver, C. S., Laurenceau, J.-P., & Zhang, Z. (2012). Modeling general andspecific variance in multifaceted constructs: A comparison of the bifactor model to other ap-proaches. Journal of Personality, 80(1), 219 –251.
Clare, L., & Aschbacher, P. (2001). Exploring the technical quality of using assignments and studentwork as indicators of classroom practice. Educational Assessment, 7(1), 39 –59.
Cochran-Smith, M., & Zeichner, K. (Eds.). (2005). Studying teacher education: The report of theAERA panel on research and teacher education. Mahwah, NJ: Erlbaum.
Connell, J. P., & Wellborn, J. G. (1991). Competence, autonomy, and relatedness: A motivationalanalysis of self-system processes. In M. R. Gunnar & L. A. Sroufe (Eds.), Self process and devel-opment: The Minnesota symposia on child development (Vol. 23, pp. 43–77). Hillsdale, NJ:Erlbaum.
Connor, C. M., Morrison, F. J., Fishman, B., Ponitz, C. C., Glasney, S., Underwood, P., . . .Schatschneider, C. (2009). The ISI classroom observation system: Examining the literacy in-struction provided to individual students. Educational Researcher, 38(2), 85–99.
Danielson, C. (2007). Enhancing professional practice: A framework for teaching (2nd ed.). Alexan-dria, VA: Association for Supervision and Curriculum Development.
Domitrovich, C. E., Gest, S. D., Gill, S., Bierman, K. L., Welsh, J., & Jones, D. (2009). Fosteringhigh-quality teaching with an enriched curriculum and professional development support: TheHead Start REDI program. American Educational Research Journal, 46, 567–597.
Douglas, K. (2009). Sharpening our focus in measuring classroom instruction. Educational Re-searcher, 38, 518 –521.
Downer, J. T., Sabol, T., & Hamre, B. K. (2010). Teacher-child interactions in the classroom:Toward a theory of within- and cross-domain links to children’s developmental outcomes.Early Education and Development, 21, 699 –723.
Early, D., Maxwell, K., Burchinal, M., Alva, S., Bender, R., Bryant, D., . . . Zill, N. (2007). Teachers’education, classroom quality, and young children’s academic skills: Results from seven studiesof preschool programs. Child Development, 78(2), 558 –580.
Eccles, J. S., & Roeser, R. W. (1999). School and community influences on human development. InM. H. Boorstein & M. E. Lamb (Eds.), Developmental psychology: An advanced textbook (4th ed.,pp. 503–554). Hillsdale, NJ: Erlbaum
Emmer, E. T., & Strough, L. (2001). Classroom management: A critical part of educational psy-chology, with implications for teacher education. Educational Psychologist, 36(2),103–112.
Evertson, C., Emmer, E., Sanford, J., & Clements, B. (1983). Improving classroom management: Anexperiment in elementary classrooms. Elementary School Journal, 84, 173–188.
Gazelle, H. (2006). Class climate moderates peer relations and emotional adjustment in childrenwith an early childhood history of anxious solitude: A child-by-environment model. Develop-mental Psychology, 42, 1179 –1192.
Good, T. L., & Brophy, J. E. (2008). Looking in classrooms (10th ed.). Boston: Pearson Allyn &Bacon.
Grossman, P. (2011). Framework for teaching practice: A brief history of an idea. Teachers CollegeRecord, 13(12), 2836 –2843.
�
Grossman, P., Loeb, S., Cohen, J., Hammerness, K., Wyckoff, J., Boyd, D., & Lankford, H. (2010).Measure for measure: The relationship between measures of instructional practice in middle schoolEnglish Language Arts and teachers’ value-added scores. Retrieved from http://www.caldercenter.org/upload/CALDERWorkPaper_45.pdf
Hamre, B. K., & Pianta, R. C. (2005). Can instructional and emotional support in the first gradeclassroom make a difference for children at risk of school failure? Child Development, 76(5),949 –967.
Hamre, B. K., & Pianta, R. C. (2007). Learning opportunities in preschool and early elementaryclassrooms. In R. Pianta, M. Cox, & K. Snow (Eds.), School readiness and the transition tokindergarten in the era of accountability (pp. 49 – 84). Baltimore: Brookes.
Hamre, B. K., Pianta, R. C., Burchinal, M., Field, S., Locasale-Crouch, J. L., Downer, J. T., . . .Scott-Little, C. (2012). A course on effective teacher-child interactions: Effects on teacher be-liefs, knowledge, and observed practice. American Education Research Journal, 49(1), 88 –123.
Hanushek, E. A. (2002). The long-run importance of school quality. NBER Working Paper 9071,National Bureau of Economic Research.
Hill, H. C., Blunk, M. L., Charalambous, C. Y., Lewis, J. M., Phelps, G. C., Sleep, L., & Ball, D. L.(2008). Mathematical knowledge for teaching and the mathematical quality of instruction: Anexploratory study. Cognition and Instruction, 26(4), 430 –511.
Hooper, D., Coughlan, J., & Mullen, M. R. (2008). Structural equation modeling: Guidelines fordetermining model fit. Electronic Journal of Business Research Methods, 6, 53– 60.
Howes, C., Burchinal, M., Pianta, R., Bryant, D., Early, D., Clifford, R., & Barbarin, O. (2008).Ready to learn? Children’s pre-academic achievement in pre-kindergarten programs. EarlyChildhood Research Quarterly, 23(1), 27–50.
Jones, S. M., Brown J. L., & Aber, J. L. (2011). Two year impacts of a universal school-basedsocial-emotional and literacy intervention: An experiment in translational developmental re-search. Child Development, 82(2), 533–554.
Kane, T. J., & Staiger, D. O. (2012). Gathering feedback for teachers: Combining high-quality obser-vations with student surveys and achievement gains. Policy and practice brief prepared for the Billand Melinda Gates Foundation.
Kaur, B. (in press). Equity and social justice in teaching and teacher education. Teaching andTeacher Education.
Kulik, J. A., & Kulik, C.-L. (1988). Timing of feedback and verbal learning. Review of EducationalResearch, 58(1), 79 –97.
LaParo, K. M., Hamre, B. K., Locasale-Crouch, J., Pianta, R. C., Bryant, D. Early, D., . . . Burchinal,M. (2009). Quality in kindergarten classrooms: Observational evidence for the need to increasechildren’s learning opportunities in early education classrooms. Early Education and Develop-ment, 20, 657– 692.
Li-Grining, C., Raver, C. C., Champion, K., Sardin, L., Metzger, M. W., & Jones, S. M. (2010).Understanding and improving classroom emotional climate in the “real world”: The role ofteachers’ psychosocial stressors. Early Education and Development, 21, 65–94.
Malmberg, L.-E., & Hagger, H. (2009). Changes in student teachers’ agency beliefs during a teachereducation year, and relationships with observed classroom quality, and day-to-day experiences.British Journal of Educational Psychology, 79, 677– 694.
Malmberg, L.-E., Hagger, H., Burn, K., Mutton, T., & Colls, H. (2011). Observed classroom qualityduring teacher education and two years of professional practice. Journal of Educational Psychol-ogy, 102, 916 –932.
Mashburn, A. J., Pianta, R. C., Hamre, B. K., Downer, J. T., Barbarin, O., Bryant, D., . . . Howes, C.(2008). Measures of classroom quality in prekindergarten and children’s development of aca-demic, language, and social skills. Child Development, 79(3), 732–749.
Matsumura, L. C., Garnier, H., Slater, S. C., & Boston, M. B. (2008). Measuring instructionalinteractions at-scale. Educational Assessment, 13(4), 267–300.
Mayer, R. E. (2002). Rote versus meaningful learning. Theory into Practice, 41, 226 –233.NICHD Early Child Care Research Network. (2002). The relation of first-grade classroom envi-
ronment to structural classroom features, teacher, and student behaviors. Elementary SchoolJournal, 102, 367–387.
�
NICHD Early Child Care Research Network. (2003). Social functioning in first grade: Predictionfrom home, child care, and concurrent school experience. Child Development, 74, 1639 –1662.
NICHD Early Child Care Research Network. (2005). A day in third grade: A large-scale study ofclassroom quality and teacher and student behavior. Elementary School Journal, 105, 305–323.
Pakarinen, E., Lerkkanen, M.-K., Poikkeus, A.-M., Kiuru, N., Siekkinen, M., Rasku-Puttonen, H.,& Nurmi, J. (2010). A validation of the classroom assessment scoring system in Finnish kinder-gartens. Early Education and Development, 21, 95–124.
Peugh, J. L., & Enders, C. K. (2004). Missing data in educational research: A review of reportingpractices and suggestions for improvement. Review of Educational Research, 74, 525–546.
Pianta, R. C., Belsky, J., Houts, R., Morrison, F., & NICHD Early Child Care Research Network.(2007). Opportunities to learn in America’s elementary classrooms. Science, 315, 1795–1796.
Pianta, R. C., & Hamre, B. K. (2009). Conceptualization, measurement, and improvement ofclassroom processes: Standardized observation can leverage capacity. Educational Researcher,38, 109 –119.
Pianta, R. C., Howes, C., Burchinal, M., Bryant, D., Clifford, R., Early, C., & Barbarin, O. (2005).Features of pre-kindergarten programs, classrooms, and teachers: Do they predict observedclassroom quality and child-teacher interactions? Applied Developmental Science, 9(3), 144 –159.
Pianta, R. C., La Paro, K. M., & Hamre, B. K. (2008). Classroom assessment scoring system (CLASS).Baltimore: Brookes.
Pianta, R. C., Mashburn, A. J., Downer, J. T., Hamre, B. K., & Justice, L. (2008). Effects of web-mediated professional development resources on teacher-child interactions in pre-kindergarten classrooms. Early Childhood Research Quarterly, 23, 431– 451.
Ponitz, C. C., Rimm-Kaufman, S. E., Brock, L. L., & Nathanson, L. (2009). Contributions ofgender, early school adjustment, and classroom organizational climate to first grade outcomes.Elementary School Journal, 110, 143–162.
Ponitz, C. C., Rimm-Kaufman, S. E., Grimm, K. J., & Curby, T. W. (2009). Kindergarten classroomquality, behavioral engagement, and reading achievement. School Psychology Review, 38, 102–120.
Pressley, M., Roehrig, A., Raphael, L., Dolezal, S., Bohn, C., Mohan, L., . . . Hogan, K. (2003).Teaching processes in elementary and secondary education. In W. Reynolds & G. Miller (Eds.),Handbook of psychology: Volume 7. Educational psychology (pp. 153–176). Hoboken, NJ: Wiley.
Raver, C. C., Jones, S. M., Li-Grining, C. P., Metzger, M., Smallwood, K., & Sardin, L. (2008).Improving preschool classroom processes: Preliminary findings from a randomized trial im-plemented in Head Start settings. Early Childhood Research Quarterly, 23(1), 10 –26.
Raver, C. C., Jones, S. M., Li-Grining, C. P., Zhai, F., Metzger, M. W., & Solomon, B. (2009).Targeting children’s behavior problems in preschool classrooms: A cluster-randomized con-trolled trial. Journal of Consulting and Clinical Psychology, 77(2), 302–316.
Reyes, M. R., Brackett, M. A., Rivers, S. E., White, M., & Salovey, P. (2012). Classroom emotionalclimate, student engagement, and academic achievement. Journal of Educational Psychology,104(3), 700 –712.
Rimm-Kaufman, S. E., Curby, T. W., Grimm, K., Nathanson, L., & Brock, L. L. (2009). Thecontribution of children’s self-regulation and classroom quality to children’s adaptive behav-iors in the kindergarten classroom. Developmental Psychology, 45, 958 –972.
Rimm-Kaufman, S. E., & Hamre, B. K. (2010). The role of psychological and developmental sciencein efforts to improve teacher quality. Teachers College Record, 112(12), 2988 –3023.
Rogoff, B. (1990). Apprenticeship in thinking: Cognitive development in social context. New York:Oxford University Press.
Rowan, B., & Correnti, R. (2009). Measuring reading instruction with teacher logs. EducationalResearcher, 38(7), 549 –551.
Rudasill, K. M., Gallagher, K., & White, J. M. (2010). Temperamental attention and activity, class-room emotional support, and academic achievement in third grade. Journal of School Psychol-ogy, 48, 113–134.
Sanders, W., & Rivers, J. (1996). Cumulative and residual effects of teachers on future student aca-demic achievement. Knoxville: University of Tennessee, Value-Added Research and AssessmentCenter.
�

Skibbe, L., Behnke, M., & Justice, L. M. (2004). Parental scaffolding of children’s phonologicalawareness skills: Interactions between mothers and their preschoolers with language difficul-ties. Communication Disorders Quarterly, 25(4), 189 –203.
Strong, M., Gargani, J., & Hacifazlioglu, Ö. (2011). Do we know a successful teacher when we seeone? Experiments in the identification of effective teachers. Journal of Teacher Education, 62(4),367–382.
Stuhlman, M., Downer, J., & DeCoster, J. (2012, April). Developing and validating scalable ap-proaches to assessing effective classroom interactions. Paper presented at the meeting of the Amer-ican Educational Research Association, Vancouver, BC.
Taylor, B. M., Pearson, P. D., Peterson, D. S., & Rodriguez, M. C. (2003). Reading growth inhigh-poverty classrooms: The influence of teacher practices that encourage cognitive engage-ment in literacy learning. Elementary School Journal, 104, 3–28.
�