Embed Size (px)
Citation preview

TEACHING READING NARRATIVE TEXT THROUGH
PQ4R (PREVIEW, QUESTION, READ,
REFLECT,RECITE AND REVIEW) STRATEGY
(An Experimental Research at the Ninth Grade of SMP
Ma’arif NU 02 Jatinegara in the Academic
Year of 2015/2016)
THESIS
Submitted in Partial Fulfillment of the Requirement
For Degree of Bachelor of Education
In English Education
By:
Anizul Fatuni’mah
(113411017)
EDUCATION AND TEACHER TRAINING FACULTY
WALISONGO STATE ISLAMIC UNIVERSITY
SEMARANG
2015

THESIS STATEMENT
I am the student with the following identity:
Name : Anizul Fatuni’mah
Student Number : 113411017
Department : English Language Education
certify that this thesis:
TEACHING READING NARRATIVE TEXT THROUGH
PQ4R (PREVIEW, QUESTION, READ, REFLECT,
RECITE AND REVIEW) STRATEGY
(An Experimental Research at the Ninth Grade of SMP
Ma’arif NU 02 Jatinegara in the Academic
Year of 2015/2016)
is definitely my own work. I am completely responsible for the
content of this thesis. Other writer’s opinions or findings included in
the thesis are quoted or cited in accordance with ethical standards.
Semarang, November 10th 2015
The researcher,
Anizul Fatuni’mah
NIM. 113411017
ii

KEMENTERIAN AGAMA
UNIVERSITAS ISLAM NEGERI WALISONGO
FAKULTAS ILMU TARBIYAH DAN KEGURUAN Jl. Prof. Dr. HamkaKampus II Ngaliyan (024) 7601295
Fax. 7615387 Semarang 50185
RATIFICATION
Thesis with the following identification:
Title : Teaching Reading Narrative Text Through PQ4R
(Preview, Question, Read, Reflect, Recite and
Review) Strategy(An Experimental Research at the
Ninth Grade of SMP Ma’arif NU 02 Jatinegara in
The Academic Year of 2015/2016)
Name of Student : Anizul Fatuni’mah
StudentNumber : 113411017
Department : English Language Education
had been ratified by the board of examiner of and can be received as one of
education and teacher training Faculty Walisongo state islamic university.
any requirement for gaining the Bachelor Degree in English Language
Education.
Semarang, December 1st
2015
THE BOARD OF EXAMINER
Chair Person, Secretary,
Dr. H. Fatah Syukur, M. Ag Dra. Ma’rifatul Fadhilah, M.Ed
NIP. 196812121994031003 NIP. 196208031989032003
Examiner I Examiner II,
Moh. Nafi Annury, M. Pd Sayyidatul Fadlilah, M.Pd
NIP. 197807192005011007 NIP. 198109082007102001
Advisor I, Advisor II,
Dr. Ahwan Fanani Lulut Widyaningrum, M.Pd
NIP.197809302003121001 NIP. 198008032009012010
iii

ADVISOR NOTE
Semarang, November 11th 2015
To
The Dean of Education and Teacher Training
Faculty Walisongo State Islamic University
Assalamu‘alaikum wr.wb.
I inform that I have given guidance, briefing and correction to
whatever extent necessary of the following thesis identification:
Title : “TEACHING READING NARRATIVE
TEXT THROUGH PQ4R (PREVIEW,
QUESTION, READ, REFLECT, RECITE
AND REVIEW) STRATEGY
(An Experimental Research at the Ninth
Grade Of SMP Ma’arif Nu 02 Jatinegara
in the Academic Year of 2015/2016)”
Name of Student : Anizul Fatuni’mah
StudentNumber : 113411017
Department : English Language Education
I state that the thesis is ready to be submitted toEducation and Teacher
Training FacultyWalisongo state islamic university to be examined at
Munaqasyah session.
Wassalamu‘alaikum wr.wb.
The Advisor I,
Dr. AhwanFanani NIP: 197809302003121001
iv

ADVISOR NOTE
Semarang, November 11th 2015
To
The Dean of Education and Teacher Training
Faculty Walisongo State Islamic University
Assalamu‘alaikum wr.wb.
I inform that I have given guidance, briefing and correction to
whatever extent necessary of the following thesis identification:
Title : “TEACHING READING NARRATIVE
TEXT THROUGH PQ4R (PREVIEW,
QUESTION, READ, REFLECT, RECITE
AND REVIEW) STRATEGY
(An Experimental Research at the Ninth
Grade Of SMP Ma’arif Nu 02 Jatinegara
in the Academic Year of 2015/2016)”
Name of Student : Anizul Fatuni’mah
Student Number : 113411017
Department : English Language Education
I state that the thesis is ready to be submitted to Education and
Teacher Training Faculty Walisongo state islamic university to be
examined at Munaqasyah session.
Wassalamu‘alaikum wr.wb.
The Advisor II,
Lulut Widyaningrum, M. Pd.
NIP.198008032009012010
v

ABSTRACT
Title : “TEACHING READING NARRATIVE
THROUGH PQ4R (PREVIEW, QUESTION,
READ, REFLECT, RECITE AND REVIEW)
STRATEGY
(An Experimental Research at the ninth Grade
Of SMP Ma’arif NU 02 Jatinegara in the
Academic Year 2015/2016)”
Writer : Anizul Fatuni’mah
Student Number : 113411017
This final project discusses teaching reading narrative text
through PQ4R Strategy (an experimental research at the ninth grade of
SMP Ma’arif NU 02 Jatinegara in the academic year of 2015/2016).
The statement of problems in this study is how effective is the use of
PQ4R Strategy to improve students’ reading comprehension skill of
narrative text?
. The background of the study is the students of Ninth grade
SMP Ma’arif NU 02 Jatinegara have the problem to understand their
English learning especially inreading. They still lack of vocabulary.
Their comprehension can be recognized through their way of reading.
The population of the research was the ninth grade students of
SMP Ma’arif NU 02Jatinegara. The research method was an
experimental research, which conducted in two classes; the
experimental group (IX A) and control group (IX B) as sample. The
IX A was taught by using PQ4R Strategy, while the IX B was taught
with conventional method. The researcher gave try-out test to try-out
class. The test had been tried out to find out the validity, reliability,
difficulty level, and discriminating power before it was used to gather
the data. The formula that was used to analyze the data was t-test. It
was used to determine whether there was significant difference
between students’ score in experimental and control class or not.
After collecting the data, it was found that the pre-test average
score in experimental class was 47,609 and control class was 43,913.
Meanwhile, the post-test average score of in experimental class was
74,783and control class was65,435 . It was obtained that t-test
was2,768 and the t-table was 2.02for alpha (α) 5%. The t-test was
vi

higher than t-table (2,768>2.02) It means that Ha was accepted and
Ho was rejected. Since t-test score was higher than t-table, PQ4R
Strategy as teaching strategy was effective in teaching reading
narrative text at SMP Ma’arif NU 02 Jatinegara in the Academic year
of 2015/2016.
based on the result, the researcher suggest that PQ4R Strategy
may be used as alternative strategy in teaching reading especially in
teaching reading text type, in order that the students can comprehend
text more easily and more interested in reading activity.
Keyword : Reading, PQ4R Strategy, Narrative
vii

ACKNOWLEDGMENT
bismillahirrohmanirrohiim
First and foremost, thanks to Allah SWT, the Almighty GOD
for his blessing, kindness, and inspiration in lending me to accomplish
the final project.
Second, shalawat and salaam for the Prophet Muhammad
SAW who brings us from the darkness to the brightness.
I realize thatI cannot complete this final project without help
from others. Many people have helped me during the writing this final
project and it would be impossible to mention of all them. I wish,
however, to give my sincerest gratitude and appreciation to:
1. The Dean of Education and Teacher Training Faculty of UIN
Walisongo Semarang Dr. H. Raharjo, M. Ed. St.
2. The Head of English Department Education and Teacher Training
Faculty UIN Walisongo Semarang Dr. H. Muslih, M.A.
3. The first advisor Dr. Ahwan Fanani who had the responsibility for
his patience in providing careful guidance, and helpful corrections
during the consultation.
4. The second advisor Mrs. Lulut Widyaningrum, M. Pd. who
already guided and advised patiently during the arrangement of
this final project.
5. All lecturers in English Department of Education and Teacher
Training Faculty for valuable knowledge, and advice during the
years of my study.
6. The headmaster of SMP Maarif NU 02 Jatinegara Ahmad Fauzi,
S.PdI who has given permission for doing the research.
7. The English teacher Mrs. Evi Kristiani, S.Pd and the curriculum
chairman of SMP Ma’arif NU 02 Jatinegara Mrs. Maftukhah, S.Pd
who has given permission and support to the researcher for doing
this research.
8. My parents (Bpk Tarmuji and Ibu Nur Hikmah) for their love,
support and everything that I cannot tell in words.
viii

9. My beloved Sister and brothers Laila Izah Malqi, Roichan Gibran
Hidayatul Amal and Akhtar Athaya Affandi.
10. My beloved grandparents, my aunts, my uncles who always give
inspiration and motivation to complete this study.
11. My dearest SaefulAflachi who always keep my spirit and always
be there for me.
12. My friends in wisma Iskandariyah especially for dek Rizka
Fitriani, Dewi Zulaeva and Atsni.
13. All of my friends in PBI 2011 especially for PBI A
14. Last but not least, those who cannot be mentioned one by one
have supported, gave motivation and pray to the researcher to
finish this thesis.
Finally, the researcher realizes that this thesis is still far from
being perfect; therefore, the researcher will be happy to accept
constructive criticism in order to make it better. The researcher hopes
that this thesis will be beneficial to everyone especially in developing
English Teaching and Learning process. Amen.
Semarang, November 10th 2015
The researcher,
Anizul Fatuni’mah NIM. 113411017
ix

TABLE OF CONTENT
TITTLE...................................................................................... i
THESIS STATEMENT ............................................................ ii
RATIFICATION ....................................................................... iii
ADVISOR NOTE ...................................................................... iv
ABSTRACT ............................................................................... vi
ACKNOWLEDGEMENT ........................................................ viii
TABLE OF CONTENT ............................................................ x
LIST OF TABLE ...................................................................... xii
LIST OF APPENDIX................................................................ xiii
CHAPTER I INTRODUCTION
A. Background of Research .......................... 1
B. Research Question .................................... 6
C. Objective of the Research ......................... 7
D. Benefits of the Research ........................... 7
CHAPTER II LITERATURE REVIEW
A. Theoretical Review
1. Reading .............................................. 8
2. Text .................................................... 14
3. Narrative ............................................. 17
4. Teaching Reading ............................... 21
5. Teaching Reading Narrative text
through PQ4R Strategy ....................... 25
B. Previous Research ..................................... 28
C. Hypothesis ................................................ 31
x

CHAPTER III RESEARCH METHOD
A. Research Design ....................................... 32
B. Subject and Setting of The Research ........ 33
C. Variables and Indicators ........................... 36
D. Method of Data Collection ........................ 38
E. Method of Data Analysis ......................... 45
CHAPTER IV RESEARCH FINDING AND ANALYSIS
A. Description of Research ............................ 49
B. Data Analysis ............................................ 51
C. Observation Interpretation ........................ 64
D. Discussion of the Research Findings ........ 65
E. Limitation of the Research ........................ 67
CHAPTER V CONCLUSION AND SUGGESTION
A. Conclusions .............................................. 69
B. Suggestions ............................................... 70
C. Closing ...................................................... 71
BIBLIOGRAPHY
APPENDIX
CURRICULUM VITAE
xi

LIST OF TABLE
Table 2.1 The steps of Learning modeling by the application of
PQ4R Strategy
Table 4.1 The Validity of Each item
Table 4.2 The Degree of Difficulty Each item
Table 4.3 The Discriminating Power of Number 1
Table 4.4 TheDiscriminating Power Each Item
Table 4.5 Pre-test Score of The Experimental Class and the
Control Class
Table 4.6 The Normality Result of Pre-Test in Experimental
Class and Control Class.
Table 4.7 The Homogeneity Result of Pre-Test in Experimental
and Control Class
Table 4.8 The Average Similarity Test of Reading Skill Pretest
in Experimental and Control Class
Table 4.9 TheResult of Normality Test of Post-Test of The
Experimental and Control Class
Table 4.10 TheResult of Homogeneity Test of Post-Test of The
Experimental and Control Class
Table 4.11 The Result of Computation T-Test
Table 4.12 Statistic of Variants Pre-Test and Post-Test
xii

LIST OF APPENDICES
Appendix 1 List of Students of Try-out Class
Appendix 2 List of Students of IX A (Experimental Class)
Appendix 3 List of Students of IX B ( Control Class)
Appendix 4 The Schedule of The Research
Appendix 5 The Computation of The Validity, Reliability,
Difficulty Level and Discriminating Power of The
Try-out Test
Appendix 6 Pre-Test Score in Experimental and Control Class
Appendix 7 Post Test Score in Experimental and Control Class
Appendix 8 The Result of Normality Test of Pre-Test of Control
Class
Appendix 9 The Result of Normality Test of Pre-Test of
Experimental Class
Appendix 10 The Result of Homogeneity Test Between Control
and Experimental Class
Appendix 11 T-Test
Appendix 12 The Result of Normality Test of Post-Test of Control
Class
Appendix 13 The Result of Normality Test of Post-Test of
Experimental Class
Appendix 14 The Result of Homogeneity Test Between Control
and Experimental Class
Appendix 15 T-Test
xiii

Appendix 16 Syllabus
Appendix 17 Lesson Plan for Control Class and Experimental Class
Appendix 18 Instrument of Pre-Test and Post Test
Appendix 19 The Answer Key of Pre-Test and Post-Test
Appendix 20 Observation Checklist
Appendix 21 Documentation of Research
xiv

1
CHAPTER I
INTRODUCTION
A. Background of The Research
Language is primarily a means of communicating thought
from one person to another. With the language, people can express
their feelings and thought. People use language as a means of
international communication among the nations all over the world.
It is important for us to learn language especially English since it
is used as a means of communication among nation in the world.
Although English is not the largest number of native or 'first'
language speakers, it is widely used by many people all over the
world as their 'second' language.1
Learning English has many advantages, we will know the
development of knowledge, science and technology because most
of books, articles, journals of science are written in English. There
are four skills in learning English that must be mastered by
students those are speaking, listening, reading and writing.
Reading receives a special focus. There are number of reasons for
this. Learning English language text, it means the study of
meaning of word and sentences. Many foreign language students
often have reading as one of their most important goals. They
want to be able to read for information and pleasure. In other
1 J Harmer, The Practice of English Language Teaching Longman
Handbooks for Language Teacher, (London: Longman Ninth Impression,
2001)

2
word, students have to read English material for their subject. The
student often thought to be easier to obtain information from
written text by reading. Allah said in the Qur’an about the
command to read:
“Proclaim ! (or Read!) in the name of the Lord and
Cherisher, Who created. Created man, out of a (mere) clot of
congealed blood. Proclaim! And thy Lord is Most Beautiful.
He Who taught (the use of) the pen. Taught men that which
he knew not ”.2
According to the verses above, it is clear that Qur’an
emphasizes reading skill to build knowledge and understanding in
order to mastery the world.
Reading, the one of cooperative skill is important so that
students need to further develop, refine, extend, and apply their
reading strategies to a variety of different text. Reading is very
important for Indonesian students because it helps them to
understand many books written English, either to obtain
information and message for scientific purpose or just for
2A. Yusuf Ali, The Holy Qur’an Text, Translation and Commentary,
America: Amana Corp, 1983) p.1761-1762

3
relaxation. Success in reading is very important for students, both
for academic and vocational achievement.
Usually there are some reasons why someone reads. First,
they often have reading as one of their most important goals. They
want to be able to read for information and pleasure, for their
career, and for study purpose. Second, written texts serve various
pedagogical purposes. Good reading texts also provide good
models for writing, and provide opportunities to introduce new
topics, to stimulate discussion, and to study language.
According to school-based curriculum there are some
kinds of text taught in the ninth grade of junior high school
that are: procedure, narrative, and report. In this study, the
researcher focuses on narrative text in several aspects of
generic structure, social function and language feature which
have to comprehend by the ninth grade of junior high school
in their reading skill result.
Reading skill need more comprehension to get the
information of the reading. To comprehend, a reader must have a
wide range of capacities and abilities. These include cognitive
capacities, motivation, and various types of knowledge. Of course,
the specific cognitive, motivational, and linguistic capacities and
the knowledge base called on in any act of reading comprehension
depend on the texts in use and the specific activity in which one is
engaged.

4
One of the ways to make the teaching reading effective is
making the students actively so they will enjoy learning and they
can improve their reading skill. Reading can be fun activity when
we know strategy or technique in reading. Reading does not occur
in a vacuum. It is done for a purpose, to achieve some end. We
need technique in reading. Students need technique in reading to
achieve reading goals. Technique can be an activity in reading. To
achieve the expected situation, teacher should give the students
more activities that can attract their attention to participate in the
lesson actively. Teacher should make students to be a good reader.
Fluent readers recognize and get meaning from word they see in
pint, and use their knowledge of the structure of the language to
begin forming a mental nation of the topic. They need teaching
method, teaching methods are the mean by which the teachers
attempt to bring about the desired learning.
Basically, method in teaching concerns the way teachers
organize and use technique or strategy of teaching, subject matter,
teaching tools, teaching material and teaching procedure, that will
achieve these objective, carrying out the procedures, evaluating
the success of the learning activities and following up the success
and failure.
Reading is skill which highly valued by students and
teacher alike. Students almost get texts in their study. The text can
be difficult or easy, depending on factor inherent in the text, on

5
the relationship between the text and the knowledge and abilities
of the reader, and on the activities in which the reader is engaged.3
In Junior High School, reading are not easy. In fact,
students of ninth grades SMP Ma’arif NU 02 Jatinegara have the
problem to understand their English learning especially in reading.
They are still lack of vocabulary. Their comprehension can be
recognized through their way of reading. Their low
comprehension is shown when they do not understand what they
read. The students cannot answer question based on the selection,
this may be caused by their limited vocabulary and bad memory.
As soon as they read, they have to close the text, but they cannot
answer the questions because they cannot retain what they have
just read. In reading activity, students are forced to know the
implied and stated messages of the texts given. Some students
face difficulties in reading English text. They must learn to
navigate through unfamiliar vocabulary and grammar structure.
Based on the problem above, in order to make
comprehension easier in reading and a text, the teacher should use
the strategy that is easy for the students in teaching reading
comprehension. So those, the students can enjoy and be stimulated
in learning English as foreign language especially in reading
comprehension.
3Elizabeth S. Pang, teaching reading, (Belgium: the International
Academy of Education) (IAE),2003) p.12

6
One of reading strategy have been use to improve
students’ reading comprehension is PQ4R Introduced by Thomas
and Robinson 1972. PQ4R is the systematic strategy consist of
several steps they are Preview, Question, Read, Reflect, Recite,
and Review. 4Each step functions to optimize the students’ ability
to develop the idea, gaining the information and stimulating the
students to recognize the new vocabularies.
In order for the implementation of learning by using
PQ4R strategy work well, it takes considerable time and students
are more diligent, careful and thorough. In cooperative learning,
students will learn in groups and are given the opportunity more
actively in learning activities. So there is a greater opportunity to
understand PQ4R strategy and improve learning outcomes in the
English language narrative material.
Because of the reason above, the researcher conducted an
experimental research in SMP Ma’arif NU 02 Jatinegara by using
PQ4R strategy in teaching reading.
B. Research Question
How effective is the use of PQ4R strategy to improve
students’ reading comprehension skill of narrative text at the ninth
grade of SMP Ma’arif NU 02 Jatinegara in the academic year of
2015/2016?
4Agus Suprijono, Cooperatif Learning, (Yogyakarta: Pustaka
Pelajar, 2009), p. 103.

7
C. Objective of the Research
The Objective of The Research based on the statement of
the problem is to find out the effectiveness of PQ4R strategy to
improve the students’ reading comprehension skill of narrative
text at the ninth grade of SMP Ma’arif NU 02 Jatinegara in the
academic year of 2015/2016
D. Benefits of the Research
This result of the research is expected to be able to give
the following benefit for:
1. English teacher
By doing this research, the teacher will find a new
effective teaching process using PQ4R strategy especially in
teaching students’ reading comprehension.
2. Students
Students are hoped to be easier to understand the text
and more active in reading activity.
3. The Writer
By conducting this research, hopefully the researcher
will get some experience and knowledge how to implement
PQ4R strategy in teaching reading comprehension. This
research can be evaluation for researcher who frequently used
monotonous technique in teaching reading in the classroom.

8
CHAPTER II
LITERATURE REVIEW
TEACHING READING NARRATIVE TEXT THROUGH PQ4R
STRATEGY
A. Theoretical Review
1. Reading
a. Definition of Reading
Reading is an exercise dominated by the eyes and
the brain. The eyes receive messages and the brain then
has to work out the significance of the messages. It means
that people receive the information from their eyes then
understand the meaning by their brain. According to Jack
Richards reading perceives a written text in order to
understand its context.1
Reading is a skill that is taken for granted.
Reading is likewise a skill that teachers simply expect
learners to acquire.2Reading is a receptive skill. Receptive
skills are the ways in which people extract meaning from
the discourse they see or hear.3In this aspect, the cognitive
processes involved in reading are similar to those
employed while listening. Though, in both, students are
1Jack Richards, John Platt and Heidi Weber, Longman Dictionary of
Applied Linguistics, (UK: Longman Group, 1990), p. 127
2H. Douglas brown, Language Assesment principle and classroom
practices,(US:Lonman,2004), p.185
3Jeremy Harmer, The Practice of English Language Teaching,
(Harlow: Pearson Education Ltd., 2001), 3rd ed., p.199.

9
engaged in decoding a message rather than encoding,
reading is not simply an act of absorbing information
only. It is communicative act that involves creating
discourse from text.
From the definition above the researcher can
conclude that reading is an ability of cognitive process or
interaction between the graphic symbols and the language
skills of a reader. Reading is also a process of
communication between a writer and a reader. A writer
has message in his/her mind, such as teaching, fasts, ideas
and argument that he/she wants to share the writer puts
the message into word or printed verbal symbols. When
the messages enter the reader's mind, it means that
communication goes on. In comprehending the content of
the text, reader not only uses eyes but also their mind
concentration to catch the writer's idea.
b. Type of Reading
1) Extensive Reading
Brown explains that Extensive reading is
carried out to achieve a general understanding of a
usually somewhat longer text (book, long article, or
essays, etc).4 Extensive reading is also to obtain a
general understanding of a subject and include
4H. Douglas brown, Teaching by Principles an Interactive Approach
to Language Pedagogy, (US:Longman), p.313

10
reading longer text for pleasure; use extensive reading
is to improve general knowledge.5 It is reading
activity that in teacher encourages students to choose
for themselves what they like to read and to do so for
pleasure and general language improvement.
2) Intensive Reading
Brown explains that Intensive reading is
usually a classroom-oriented activity in which
students focus on the linguistic or semantic details of
a passage. Intensive reading calls students attention to
grammatical form, discourse markers, and other
surface structure details for the purpose of
understanding literal meaning, implication, rhetorical
relationships, and the like.6For this reading activity,
the teacher chooses and directed what the students
read and it is designed to develop specific receptive
skill.7
Intensive reading as an activity to take a text,
study it line, referring at every moment to our
dictionary and our grammar, comparing, analyzing,
5Jeremy Harmer, The practice of English Language Teaching, p.
283.
6H. Douglas brown,Teaching by Principles an InteractiveApproach
to Language Pedagogy, (US:Longman), p.312
7Jeremy Harmer, The practice of English Language Teaching, p.
286.

11
translating and retaining every expression that it
contains.
c. The Objectives of Reading
Every action has purpose in doing it. Reading has
several purpose or aim when it is done. According to
Rivers and Temperley as quoted Nunan suggest that
second language learners will want to read for the
following purposes:
1) To obtain information for some purposes or because
we are curious about some topic.
2) To obtain instruction on how to perform some task for
our work or daily life (e.g. knowing how an appliance
works).
3) To act in a play, play a game, do a puzzle.
4) To keep in touch with friends by correspondence or to
understand business letter.
5) To know when or where something will take place or
what is available.
6) To know what is happening or has happened (as
reported in newspapers, magazines, reports).
7) For enjoyment or excitement.8
Based on the objectives above we can understand
that reading need a special attention. It is not surprised if
reading is one of the important skills in learning foreign
language. The objectives above is reason why getting
students to read. Reading is useful for other purposes too:
8 David Nunan, Designing Tasks for the Communicative Classroom,
(United Kingdom: Cambridge University Press, 1989), p. 34.

12
any exposure to English (provided students understand it
more or less) is a good thing for language students.
Reading is an activity with a purpose. A person
may read in order to gain information or verify existing
knowledge, or in order to critique a writer's ideas or
writing style. A person may also read for enjoyment, or to
enhance knowledge of the language being read. The
purpose for reading guides the reader's selection of texts.
d. Reading Comprehension
One of the goals Reading is comprehension.
Reading can help people to improve their comprehension.
Comprehension can be meant the process by which a
person understands the meaning of written or spoken
language.9 A good reader will get comprehension when
they read. To get comprehension we have to know some
types of comprehension. Comprehension has some types,
they are:10
1) Literal comprehension: Reading in order to
understand, remember, or recall the information
explicitly contained in passage
2) Inferential comprehension: Reading in order to find
information which is not explicitly stated in passage,
9Jack Richards, John Platt and Heidi Weber, Longman Dictionary of
Applied Linguistics, (UK: Longman Group, 1990), p. 54
10Jack Richards, John Platt and Heidi Weber, Longman Dictionary
of Applied Linguistics., p238

13
using the reader’s experience and intuition, and by
inferring
3) Critical/ evaluative comprehension: Reading in order
to compare information in a passage with the reader’s
own knowledge and value
4) Appreciative comprehension: Reading in order to gain
an emotional or other kind of valued response from
passage
Janette K. Klinger defines reading comprehension
is the process of constructing meaning by coordinating a
number of complex process that include word reading,
word and world knowledge and fluency.11
It means
reading with comprehension has meaning that the reader
is able to extract from the selection its essential facts and
understanding, visualized details and sense the readiness
of facts. Reading Comprehension requires motivation,
mental frameworks for holding ideas, concentration and
good study techniques or strategies Good readers
recognize and get meaning from word they see in print,
and use their knowledge of the structure of the language
to begin forming a mental nation of the topic.
11
Janette K. Klinger, Sharon Vaugh, and Alison Boardman,
Teaching Reading Comprehension to Students with Learning Difficulties,
(New York: The Guilford Press, 2007 ), p. 2

14
2. Text
a. Definition of Text
Text is a system of communication is organized
as cohesive units. A text is any completed act of
communication such as a greeting between friends in the
street, a television advertisement, a novel, or a film and so
on. As far as speech and writing are concerned, a text
stands alone as an act of communication.12
Text is when these words are put together to
communicate a message.13
Halliday and Hasan said that a
text is a social exchange of meanings.14
The meaning of a
sentence may have different meaning according to the
context. For example, I am buying a drink for everybody
here, and the mean of that sentence is one drink for all or
one drink for each. Therefore, if we are a teacher, we must
be able to develop students’ abilities to exchange the
meanings in different points of sentence.
12
Peter Knap and Megan Watkins, Genre, text, grammar :
technologies for teaching and assesing writing. (Australia : University of
New South Wales. 2005) p.29
13Mark and Kathy Anderson, Text Types in English,(South Yarra :
Macmillan Education. 2003) p. 1
14 M. A. K. Halliday & Ruqaiya Hasan, Language, Context, and
Text: Aspects of Language in Social-Semiotic Perspective, (Hongkong:
Oxford University Press, 1984), p. 11.

15
b. Types of Text
There are two main categories of text. They are
literary and factual. Within these are various text types.
Each text type has a common way of using language
1) Literary text is text that appeal to our emotions and
imagination. Literary texts can make us laugh or cry,
think about our own life or consider our beliefs. There
are three main text types in this category:15
a) Narrative
Narrative is text that construct a view of the world
that entertains or informs the reader or listener.
b) Poetic
Text that Express feelings or experience of the
poet so as to describe, praise or critics.
c) Dramatic
Text that portray human experience through
enactment, sometimes in order to make social
comment.16
2) Factual text
Factual text is text that present information or ideas
and aim to show, tell or persuade the audience. The
main text types in this category are:17
15
Mark and Kathy Anderson, Text Types in English,(South Yarra :
Macmillan Education. 2003) p. 2
16Mark and Kathy Anderson, Text Types in English, p. 8

16
a) Response
Text that respond to anarchistic work by
providing a description of the work and a
judgment.
b) Discussion
Text that present differing opinions on a subject
to the reader or listener.
c) Explanation
Text that explain how or why something occurs.
d) Exposition
Text that argue or persuade by presenting one side
of an issue.
e) Report
Text that describe or to present information about
a subject.
f) Recount
Text that retell a series of events, usually in the
order they occurred.
g) Procedure
Text that instruct someone on how something can
be done.
17
Mark and Kathy Anderson, Text Types in English, p. 1

17
3. Narrative
a. Definition of narrative text
Narrative is kind of text which tells about events,
or accuracies, which can make the reader feels that it is
real. A narrative tells about something that happened in
the past.
A narrative is a piece of writing that tells a story.
The story can be imaginary or based on a real incident.18
A narrative tells about something that happened in
the past.19
Narrative is a text which contents about a story
like a story of citizen (folktale), the story of animals
(fable), legend, etc. that a narrative text contains story by
presenting the sequence of events and actors which are
characterized as heroes or cowards. It can be concluded
that narrative text is a spoken or written text to
communicate a massage, which is used to interpret its
meaning in the story.
b. Social Function of Narrative Text
Narrative is kind of genre which has social
function to amuse, entertain and to deal with actual or
vicarious experience in different ways. Narrative deals
18
Ng Foo Mun, Ng Lai Foong, Ng How Seng and Gabriel Mich. Kia
Tolok, Creative English: Workbook, (Jakarta: Penerbit Erlangga, 2008), p.viii
(overview).
19Margaret Bonner, Step Into Writing, (London: Longman, 1994),
p.48.

18
with problematic events which lead to a crisis or a turning
point of some kinds, which in turn finds a resolution.
c. Types of narrative text
There are many types of narrative text, including:
1) Romance, typically tells of two lovers who overcome
difficulties to end up together.
2) Science function, use a setting involving science and
technology.
3) Humor, the aims to make the audience laugh as part
of retelling story.
4) Diary – novels, the text presented like diary entries.
5) Adventure, typically tells of exciting dangerous
journey of experience.20
d. Generic Structure of Narrative Text
Narrative text consists of generic structure that
can be provided as follow:
1) Orientation
It introduces the participants of the story and
informs the settings. Normally, the writer explain
when the story happened and where the events is
taken place.
2) Complication
It tells the rising crises of the events. It is the
climax of the narrative. In the middle of the story,
20
Mark Anderson and Kathy Anderson, Text Types in English, p. 28

19
generally, the narrator shows the complication.
Complication makes the story more interesting
because the main character is prevented to reach his
or her wanted. In this part, narrator brings up the
issues occurred in the story. Complications are the
description of real life and tell the readers that every
issues or problems can be solved.
3) Resolution
After spelling many issues in the climax of
the narrative, the narrator then tells to the readers
about the resolution of issues or the problems.
Resolution is the crisis which is resolved, for
better or worse. A satisfying narration will give the
readers the resolution of the problem or complication.
Generally, the resolution is placed in the end of
narration, but sometimes the narrator will place other
issues or complication after he or she presents the
resolution of the problem. It is used to make the story
does not come to the end. In short, resolution is the
ending of the story.
4) Re-orientation
Re-orientation is optional of generic structure
of narrative. So re-orientation is sometimes there and

20
sometimes it isn’t there in narrative text. It is usually
in ending of story or closure of events.21
e. Language Features of Narrative Text
The language features of narrative text, they are:
1) Using nouns and pronouns to identify people, animal
or things involved. For example: king, princess, he,
she, etc.
2) Specific participant is special characteristics object.
For example: Cinderella, Aladdin, etc.
3) Using adjectives are useful to shape noun phrase. For
example: beautiful white skinned lady, etc.
4) Using time connective and conjunctions to sequence
the events. For example: then, when, suddenly, etc.
5) Using adverbs and adverbial phrases to indicate place
and time. For example: here, there, at home, etc.22
The students have to know the generic
structure and language features of narrative text in
order they can understand and identify the meaning of
narrative text.
21
Peter Knap and Megan Watkins, Genre, text, grammar :
technologies for teaching and assesing writing. (Australia : University of
New South Wales. 2005) p.223
22Peter Knap and Megan Watkins, Genre, text, grammar, p.221
21
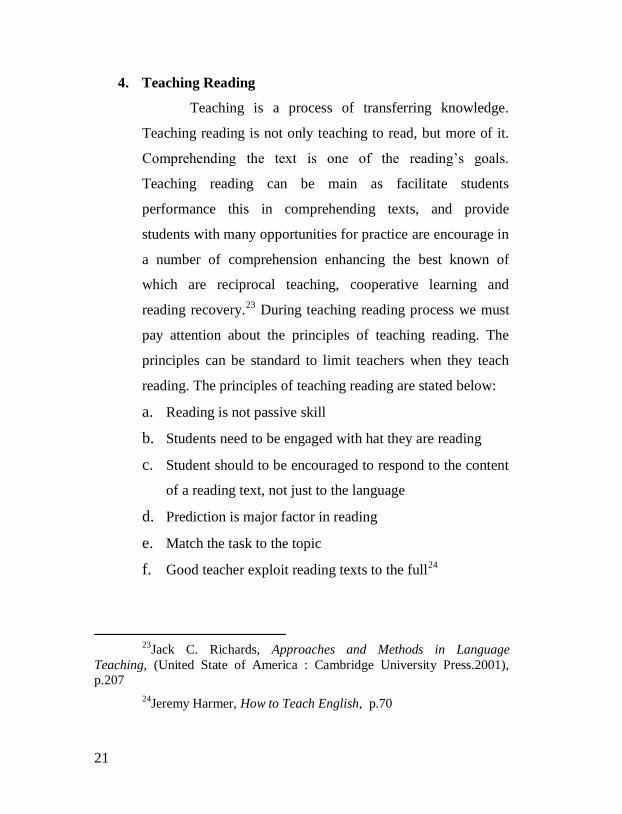
4. Teaching Reading
Teaching is a process of transferring knowledge.
Teaching reading is not only teaching to read, but more of it.
Comprehending the text is one of the reading’s goals.
Teaching reading can be main as facilitate students
performance this in comprehending texts, and provide
students with many opportunities for practice are encourage in
a number of comprehension enhancing the best known of
which are reciprocal teaching, cooperative learning and
reading recovery.23
During teaching reading process we must
pay attention about the principles of teaching reading. The
principles can be standard to limit teachers when they teach
reading. The principles of teaching reading are stated below:
a. Reading is not passive skill
b. Students need to be engaged with hat they are reading
c. Student should to be encouraged to respond to the content
of a reading text, not just to the language
d. Prediction is major factor in reading
e. Match the task to the topic
f. Good teacher exploit reading texts to the full24
23
Jack C. Richards, Approaches and Methods in Language
Teaching, (United State of America : Cambridge University Press.2001),
p.207
24Jeremy Harmer, How to Teach English, p.70

22
Teaching reading is not vacuum activity. Students
must enjoy during reading process. As we know the
advantages of reading, so we must pay attention how to
increase reading comprehension in classroom. Teaching
reading need more than only read text. According to the
definitions about reading and reading comprehension, we
have three points based on the explanation above, they are:
a. The reader who is doing the comprehending
b. The text that is to be comprehend
c. The activity in which comprehension is a part
5. Teaching Reading Narrative Text through PQ4R Strategy
a. Definition of Learning Strategy
Learning strategies are ways that will be used by
teachers to choose learning activities that will be used
during the learning process. Selection is done by
considering the circumstances, learning resources, needs
and characteristics of learners faced in order to achieve
specific learning goals.25
b. PQ4R Strategy
The beginning experience can be constructed
through reading activities. With this activity the students
25
Hamzah B. Uno, model pembelajaran menciptakan proses belajar
mengajar yang kreatif dan efektif (Jakarta: Bumi aksara,2007).p. 3

23
will have a stock of knowledge. One of the strategies that
can be develop in order to read is PQ4R.26
One of the strategies that the most known for
helping students understand and remember the material
they read is PQ4R strategy. This strategy is based on
PQRST strategy and SQ3R strategy.27
The steps in PQ4R reading strategy is as follows:
1) Preview
Students find the main ideas developed in the
reading material. The parts that can be read like
introductory chapter, table of contents, topics and sub-
topics, titles, or a summary of a chapter. Search basic
idea can also be done by reading one or two sentences
of each page quickly.
2) Question
Students formulate the questions for himself.
Question can be developed from the simple to the
complex question. Question include what, who,
where, when, why and how.28
Questions were
developed for the formation of declarative knowledge,
structural and procedural knowledge.
26
Agus Suprijono, Cooperatif Learning, (Yogyakarta: Pustaka
Pelajar, 2009), p. 103.
27Trianto, S.Pd., M.Pd, Model-Model Pembelajaran Inovatif
Berorientasi Kuntruktivistik, (Jakarta: Prestasi Pustaka, 2002), p. 147.
28Agus Suprijono, Cooperative Learning, p.103

24
3) Read
At this stage the students find answers to all
the question that have been formulated. In the Qur’an
read as described in detail in the Al-Alaq verses 1-5.
This means that:
“Proclaim ! (or Read!) in the name of the Lord and
Cherisher, Who created. Created man, out of a (mere) clot of
congealed blood. Proclaim! And thy Lord is Most Beautiful.
He Who taught (the use of) the pen. Taught men that which
he knew not ”.29
Based on the verse above, the prophet
muhammad is expected by God to be able to read,
though before this verse was revealed the Prophet
Muhammad was illiterate people. Someone could read
fluently when it several times to repeat the reading.
Verily Allah has made the power of nature to make
you a man who knows reading, even though you do
not learn it before this. For it as reasonable beings
have a lot to study through reading.
29
A. Yusuf Ali, The Holy Qur’an Text, Translation and
Commentary, America: Amana Corp, 1983) p.1761-1762

25
4) Reflect
During the reading, students not only enough
to remember or memorize, but the most important is
they have dialogue with what they read.30
They try to
understand what they read. The trick is as follow, (1)
correlate what has been read with the things that have
been known before, (2) concerned sub-topics in the
text with the concepts, (3) concerned the reading with
the fact that involved.
5) Recite
At this stage, students are asked to re-reflect
the information that has been learned. In delivering
what has been read and understood by students is they
are able to formulate these concepts and articulate the
important points that have been read by their own
language. It would be better if the students not only
deliver verbally, but also in written form.31
6) Review
The final step is the students are asked to
make a summary or formulate the essence of the
material that has been read. In this step, students are
able to formulate a conclusion as the answer to the
question that have been formulated.
30
Agus Suprijono, Cooperative Learning, p.104.
31Agus Suprijono, Cooperative Learning, p.104.
26
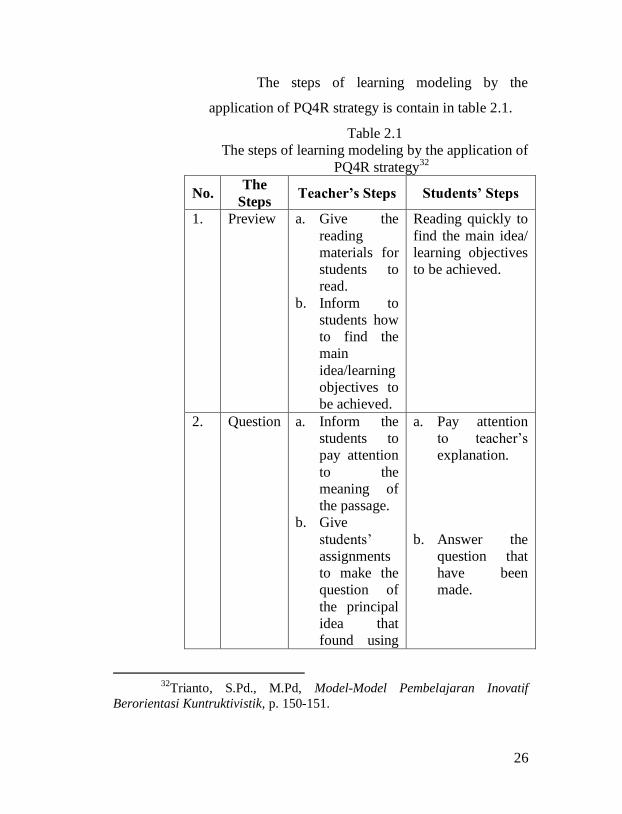
The steps of learning modeling by the
application of PQ4R strategy is contain in table 2.1.
Table 2.1
The steps of learning modeling by the application of
PQ4R strategy32
No. The
Steps Teacher’s Steps Students’ Steps
1. Preview a. Give the
reading
materials for
students to
read.
b. Inform to
students how
to find the
main
idea/learning
objectives to
be achieved.
Reading quickly to
find the main idea/
learning objectives
to be achieved.
2. Question a. Inform the
students to
pay attention
to the
meaning of
the passage.
b. Give
students’
assignments
to make the
question of
the principal
idea that
found using
a. Pay attention
to teacher’s
explanation.
b. Answer the
question that
have been
made.
32
Trianto, S.Pd., M.Pd, Model-Model Pembelajaran Inovatif
Berorientasi Kuntruktivistik, p. 150-151.

27
No. The
Steps Teacher’s Steps Students’ Steps
the words
what, why,
who, and
how.
3. Read Instruct students
to read and
respond / answer
the questions that
had been
prepared before.
Read actively
while providing a
response to what
has been read and
answer the
questions made.
4. Reflect Simulating /
inform the
materials on
reading material.
Students not only
memorize and
remember the
subject matter but
try to solve the
problem of
information
provided by
teachers with the
knowledge that has
been known
through reading
materials.
5. Recite Ask students to
make the essence
of the whole
discussion of the
lessons learn
today.
a. Ask and
answer
questions.
b. See the notes /
the essence
have been
made before
c. Making the
essence of the
whole
discussion.
6. Review a. Ask students
to read the
a. Read the
essence that
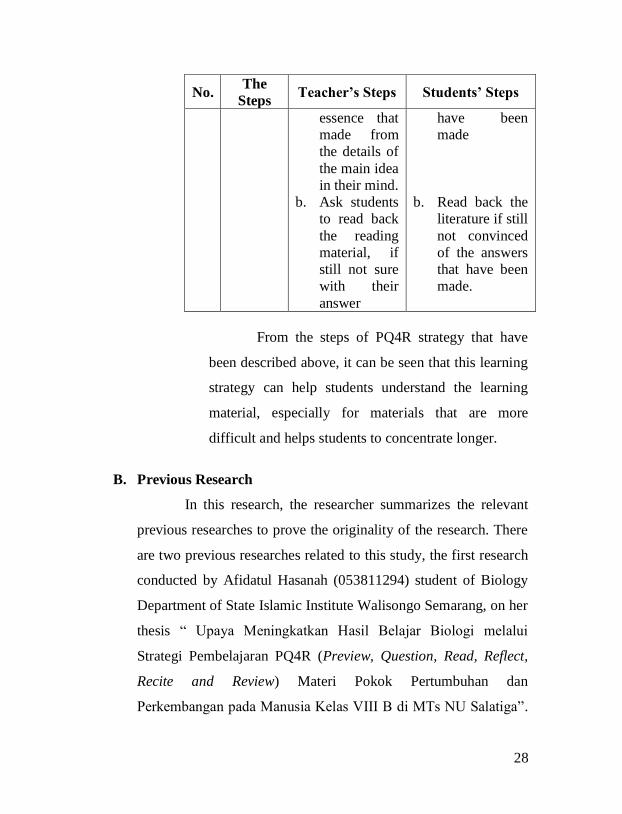
28
No. The
Steps Teacher’s Steps Students’ Steps
essence that
made from
the details of
the main idea
in their mind.
b. Ask students
to read back
the reading
material, if
still not sure
with their
answer
have been
made
b. Read back the
literature if still
not convinced
of the answers
that have been
made.
From the steps of PQ4R strategy that have
been described above, it can be seen that this learning
strategy can help students understand the learning
material, especially for materials that are more
difficult and helps students to concentrate longer.
B. Previous Research
In this research, the researcher summarizes the relevant
previous researches to prove the originality of the research. There
are two previous researches related to this study, the first research
conducted by Afidatul Hasanah (053811294) student of Biology
Department of State Islamic Institute Walisongo Semarang, on her
thesis “ Upaya Meningkatkan Hasil Belajar Biologi melalui
Strategi Pembelajaran PQ4R (Preview, Question, Read, Reflect,
Recite and Review) Materi Pokok Pertumbuhan dan
Perkembangan pada Manusia Kelas VIII B di MTs NU Salatiga”.

29
It contains about increasing the learning outcomes of students
with the application of PQ4R strategy particularly in the subject
matter of human growth and development on the achievement of
the first cycle on average 5.97 with classical learning
completeness next cycle II 23.33% on average of 6.84 with
classical completeness 53.33% and the third cycle on average 8.18
with classical completeness 86.66%.
In this study, the research goal was achieved because the
student has met the completeness criteria classical study of more
than 80% of the number of students with KKM 65.33
The differences between her research and this research is
the previous research use the PQ4R strategy to improve students’
achievement and the research method is Classroom action
research but this research use PQ4R strategy to improve students’
reading comprehension skill especially for narrative text using
experimental research method.
Another research by the title of “Efektifitas Strategi PQ4R
(Preview, Question, Read, Reflect, Recite, and Review)
Berkombinasi Mindmap terhadap Hasil Belajar Peserta Didik
pada Materi Pokok Klasifikasi Makhluk Hidup Kelas VII di Mts
NU 05 Sunan Katong Kaliwungu Tahun Ajaran 2010/2011”
33
Afidatul Hasanah, “Upaya Meningkatkan hasil belajar biologi
melalui pembelajaran strategi pembelajaran PQ4R (Prevew, Question, Read,
Reflect, Recite and Review) Materi Pokok Pertumbuhan dan Perkembangan
pada Manusia Kelas VIII B di MTs NU Salatiga”, Skripsi Fakultas Tarbiyah
IAIN Walisongo Semarang, (Semarang: Perpustakaan Tarbiyah, 2010)

30
is conducted by Felakhah Khasanah, student of Biology
Department of State Islamic Institute Walisongo Semarang.34
The research methodology was an experimental research, which
conducted in two classes; the experimental group (VII C) and
control group (VII B) as sample. The VII C was taught by using
PQ4R Strategy, while the VII B was taught without PQ4R
Strategy. The writer gave written test to gather the data. The test
had been tried out to find out the validity, reliability, difficulty
level, and discriminating power before it was used to gather the
data. The formula that was used to analyze the data was t-test. It
was used to determine whether or not there was a significance
difference between students’ score in experimental group and
students’ score in control group
After the data had been collected by using test, it was found
that t-test was (2.345), whereas the t-table was (1.665) for a = 5%.
The t-test score was higher than the t-table (2.345 > 1.665). It was
meant that Ha (alternative hypotheses) was accepted while Ho (null
hypotheses) was rejected. Since t-test score was higher than the t-
table, PQ4R Strategy was effective in improving students’
achievement at the seventh grade students of MTS NU 05 Sunan
Katong Kaliwungu.
34
Felakhah Hasanah, “Efektifitas Strategi PQ4R (Preview, Question,
Read, Reflect, Recite, and Review) Berkombinasi Mindmap terhadap Hasil
Belajar Peserta Didik pada Materi Pokok Klasifikasi Makhluk Hidup Kelas
VII di Mts NU 05 Sunan Katong Kaliwungu Tahun Ajaran 2010/2011”,
Skripsi Fakultas Tarbiyah IAIN Walisongo Semarang, (Semarang:
Perpustakaan Tarbiyah, 2010)

31
The differences between the second previous research and
this research is her research used PQ4R strategy combine with
Mind map to improve students’ achievement but this research
only use PQ4R strategy to improve students’ reading
comprehension skill of narrative text.
C. Hypothesis
A hypothesis is a temporary answer to the formulation of
research problems, in which the formulation of research problem
have been expressed in the form of question sentence.35
In this
study, the researchers propose a hypothesis that the use of PQ4R
strategy is effective in teaching students’ reading comprehension
of narrative text.
35
Sugiyono, Metode Penelitian Kuantitatif Kualitatif Dan R&D
(Bandung : Alfabeta,2012), p.64

32
CHAPTER III
RESEARCH METHOD
This chapter discusses about sources of data, research deign,
research setting, population and sample of research, variables and
indicators of research, methods of data collection, and methods of data
analysis.
A. Research Design
Research design played an important role in a research
because the quality of research greatly depended on the design. In
this research, the researcher uses the form of quantitative one.
According to Michael J Wallace, quantitative approach is broadly
used to describe what can be counted or measured and can
therefore be considered objective.1 That means the method and
instrument involve numerical measurement and then the statistical
quantification will be conducted.
In this research, researcher used an experimental research.
An experimental research involves two groups: experimental
group and control group. An experimental group received a new
treatment while control group received an usual treatment. This
study used pre-test and post-test.
The design of the experiment could be described as
follows:
1Michael J Wallace, Action Research for Language Teacher,
(Cambridge: Cambridge University Press, 1998), p. 38.

33
Adopted from Arikunto.2
Where:
E = experimental group
C = control group
01 = pre-test for experimental group
02 = post test for experimental group
03 = pre-test for control group
04 = post test for control group
X = treatment by using PQ4R strategy
Y = treatment by using conventional method
From the design above, subjects of research were grouped
into an experimental group (top line) and a control group (bottom
line). The quality of subjects was first checked by pre-testing them
(01 and 03). Then, the experimental treatment (taught by using
PQ4R strategy) was applied to the experimental group, while the
control group (taught using conventional method). The test was
held in the form of multiple choice test. The results of post-test
(02 and 04) were then computed statistically.
B. Subject and Setting of The Research
This study was conducted with 9th
grade students of SMP
Ma’arif Nu 02 Jatinegara in academic year of 2015/2016 which is
2Suharsimi Arikunto, Prosedur penelitian Suatu Pendekatan
Praktik, (Jakarta: PT Rineka Cipta, 2010), p.125

34
located at Jalan raya Penyalahan Jatinegara. The subjects of this
study were the ninth grade students of SMP Ma’arif NU 02
Jatinegara in the academic year of2015/2016. This study was
conducted in the first semester. Due to limitation of time, the
researcher did not take all students as the subjects of the study, but
drew a sample.
1. Population
According to Arikunto, population is whole subject in
the research.3 Population can be defined as two kinds, target
of population and access of population. Target of population
is population that has been planned in the research planning.
Access of population is population that can be accessed when
the researcher determines the number of population.4
The population of this research is all ninth grade of
SMP Ma’arif NU 02 Jatinegara in the Academic year of
2015/2016 which consist of two classes with twenty three in
each class.
2. Sample and Sampling Technique
Sample means apart of population that will be
observed. Whose characteristics can represent and describe
3Suharsimi Arikunto, Prosedur Penelitian: Suatu Pendekatan
Praktik, (Jakarta: PT. Rineka Cipta, 2010), p.173
4Sukardi, Metodologi Penelitian Pendidikan, (Yogyakarta: Bumi
Aksara, 2010), P.53-54

35
the real population.5 Sample was done by taking the
subject/sample which is not based on strata, random, or area
but it is based on the consideration of a certain purpose. Some
reason for using sample;
a. The large among of population.
b. The observation that done for all unit of population may
damage.
c. Saving time, money, and power.
d. Be able to give the comprehensive output.
In this research, the researcher use non probability
sampling with total sampling or population sampling. Non
probability sampling is sampling technique that does not
provide the same opportunity for each element of population.6
Total sampling or population sampling is sampling technique
where all of the population become a sample.7 The students
of two classes, class A and B which consist of approximately
46 students, will be sample from the population. Class A will
be the Experimental class and class B will be the control
class.
5Sugiarto, Teknik Sampling, (Jakarta: Gramedia Pustaka Utama,
2003) 2nd
Ed, P.2
6Sugiyono, Metode Penelitian Pendidikan (Pendekatan Kuantitatif,
Kualitatif dan R & D) , (Bandung: Alfabeta, 2010), p. 84
7Sugiyono, Metode Penelitian Pendidikan ,p. 85

36
C. Variable of Research
A variable is any factor, condition, situation, treatment and all
actions that can be used to influence the experimental.8
According to Fred N. Kerlingert as cited by Arikunto, that all
experiments have one fundamental idea behind them; to test the
effect of one or more independent variables on a dependent
variable (it is possible to have more than one dependent variables
in experiments).9
This research that use PQ4R strategy in teaching students’
reading comprehension had two variable, those variable were :
1. Independent variable (X)
Independent variable is the variable that is the cause
or effect the onset or change in the dependent variable.10
The
independent variable of this research is the use of PQ4R
strategy in teaching students’ reading comprehension on
narrative text.
The indicators of this variable are:
a. Teacher gives the reading passage to the students
8Wina Sanjaya, penelitian pendidikan: jenis, metode dan prosedur,
(Jakarta: Kencana.2013), p.95.
9Suharsimi Arikunto, Prosedur Penelitian Suatu Pendekatan
Praktek -edisi revisi, (jakarta : Rineka Cipta, 2010).p.162
10AhmadTanzeh,Pengantar metode penelitian. (Yogyakarta: teras,
2009), p.85.

37
b. The students read the reading passage and find the main
idea (Read)
c. The students pay attention to the meaning of the passage,
the generic structure of narrative text and make the
question of the main idea that found using the words
what, why, who, and how.(Question)
d. The students read and respond / answer the questions that
had been prepared before.(Read)
e. The students solve the problem of information provided
by teachers.( Reflect)
f. The students make the essence of the whole discussion
about narrative text. (Recite)
g. The students read the essence that made from the details
of the main idea and read back the reading material, if still
not sure with their answer.(Review)
2. Dependent variable (Y)
The dependent variable is a variable that is affected or
that become the result because of the existence of the
independent variable.11
The dependent variable of this research is the improve
of students’ reading comprehension on narrative text.
The indicators of this variable are :
a. Identifying the purpose of the text
b. Identifying main idea of a paragraph
11
Suharsimi Arikunto, “Prosedur penelitian...”, p. 162.

38
c. Identifying generic structure of narrative text.(orientation,
complication and resolution)
d. Identifying variation of sentence structure in the text
e. Identifying meaning of words in the text
f. Identifying sentence meaning in the text
D. Method of Data collection
1. Observation
Observation was the activity that was done by the
researcher to get data. There were two kinds of observation,
they were: Non systematic observation’ which was done by
the researcher without using instrument. Systematic
observation which was done by the researcher using
instrument as the guide of the research.12
The observation focuses on students’ activity in
classroom. In this part, the researcher used checklist as
instrument to take information related to the activity in the
class room. The observation paper can be seen in appendix.
2. Documentation
The documentation method was to look for the data
concerning matters or the variable that took the form of the
note, transcript, book, newspaper, magazine, inscription,
12
Suharsimi Arikunto, Dasar-Dasar evaluasi pendidikan, (jakarta :
bumi aksara, 2002) 3rd
Ed, p.157

39
agenda, etc.13
It refers to the archival data that helps the
researcher to collect the needed data. Documentation method
is to get a researcher data linked to research object that will be
elaborated in this research. This method is used to collect the
data from the result of students’ test. It is also to get the data
of the students’ name list that include in population and
sample of research documentation of teaching and learning
process in English subject. The writer got the data from
teacher English guidance.
3. Test
Brown states that a test is a method of measuring a
person’s ability, knowledge, or performance in a given
domain.14
Test is a set question used to measure the
achievement or capability of individual class.15
The purpose
of a test are several, for example to diagnose a students’
strengths, weakness and difficulties, to measure achievement,
to measure aptitude and potential, to identify readiness for a
program. In this Research, test is given to try-out class,
control class and experiment class. Tests were used to
measure students’ reading comprehension skill and were
administered twice; namely, the pre-test and post-test.
13
Suharsimi Arikunto, Prosedur Penelitian Suatu Pendekatan
Praktek -edisi revisi, p.274
14Douglas Brown, Language assessment Principles and Classroom
Practices, (San Francisco: Longman, 2004), p. 3.
15Suharsimi Arikunto, Dasar-Dasar evaluasi pendidikan,p.157

40
a. Pre-test
Before the teacher taught new material by using
PQ4R Strategy the teacher give the test to the students.
Pre-test is given to the experimental and control class in
the same way.
b. Post-test
Post-test is given to the experimental class and
control class. It is given in order to know the
improvement of students’ reading comprehension in
narrative text after they are taught using PQ4R Strategy
(experimental class) and without using PQ4R (control
class).
In collecting the required data in the test the
writer used multiple choices. The choice of multiple-
choice type was based on the following considerations:
1) It was easy and consistent
2) It was easy to compute and determine the reliability
of the test
3) It was economical because the number of items can be
answered in a short period of testing time
Each of the tests consisted of some reading
passages and some multiple choices reading
comprehension questions followed in reading passage.
Correct answers are score 1 and wrong answers are score

41
0. The question consist of 20 items which approximately
finish on 40 minutes.
The score of students’ achievement can be
calculated by using this following formula:16
Score
x100%
To find out whether test item is qualified as good
instrument in the research or not before used to measure
students’ reading comprehension skill, previously try out
test must be held. Try out test is implemented to find out
the validity, reliability, level of difficulty, and
discriminating power of test item. After validity,
reliability, level of difficulty, and discriminating power of
test item were found out, then choose test item which is
qualified to be used as instrument for measuring the
students’ reading comprehension skill. And the steps are
as follow:
1) Validity of test
The validity is an important quality of any
test. It is a condition in which a test can measure what
is supposed to be measured. According to Arikunto,
16
Suharsimi Arikunto, Prosedur Penelitian Suatu Pendekatan
Praktik, p. 235

42
“a test is valid if it measures what it purpose to be
measured”.17
The validity of an item can be known by
doing item analysis. It is counted using product –
moment correlation formula:
( )( )
* ( )+* ( )+
rxy = the coefficients of correlation between X
and Y
N = the total of subject of experiment
⅀X = the sum of score X item
⅀Y = the sum of score Y item
2) Reliability of test
It means consistent. Reliability refers to the
consistency of test scores. Besides having high
validity, a good test should have high reliability too.
Alpha formula is used to know reliability of test is K
- R. 20.18
(
) (
)
17
Suharsimi Arikunto, Prosedur Penelitian Suatu Pendekatan
Praktek -edisi revisi, (jakarta : Rineka Cipta, 2010).p.211
18Suharsimi Arikunto, Prosedur Penelitian Suatu Pendekatan
Praktek -edisi revisi, (jakarta : Rineka Cipta, 2010).p.231

43
r11 = Instrument reliability
k = The number of items in the test
vt =Total variance
p = The proportion of students who give the right
answer
q = The proportion of students who give the
wrong answer
3) Degree of test difficulty
A good question isa question which includes
cognitive aspect and not to easy or too difficult. Too
easy question is not stimulate learners to enhance
efforts to solve it, otherwise a question that is too
hard will cause students to become desperate and do
not have the spirit to try again because out of reach.
To determine the level of difficulty of questions can
be used the following formula19
Where :
P = The difficulty’s index
B = The number of students who has right answer
JS = The number of students
19
Suharsimi Arikunto, Dasar-Dasar Evaluasi Pendidikan, p. 208.

44
The criteria are :
P = 0,00 ≤ p ≤ 0,30 Difficult question
P= 0,30 ≤ p ≤ 0,70 Sufficient
P= 0,70 ≤ p ≤ 1,00 Easy.
4) Discriminating power
The discriminating power is a measure of the
effectiveness of a whole test. The higher and low
values of discriminating power are the more effective
the test will be.
Where :
D : discrimination index.
JA : member of student in upper group.
JB : member of student in low group.
BA : member of students in upper group who
answer the item correctly.
BB : member of students in low group who answer
the item correctly.
The criteria are :
D < 0.2 is poor.
0.2 < D ≤ 0.4 is fair.
0.4 < D ≤ 0.7 is good.
0.7 < D ≤ 1 is very good.
0.8

45
E. Method of Data Analysis
1. Pre-Requisite Test
Before the researcher determines the statistical
analysis technique used, researcher examined the normality,
homogeneity and of the data. To get the normality and
homogeneity test the researcher used pre-test score.
Pre-test was given before the treatments. The
researcher determines the statically analysis technique
whether both classes have normal distribution. If the data have
normal and homogeny distribution, the treatment and teaching
can be conducted to both classes.
a. Normality test
Normality test is used to know the distribution
data normal or not. To find out the distribution data is
used normality test with Chi square.20
Calculate the chi square (x1), the formula:
∑(
)
Where:
X = Chi-kuadrat
O = Frequency that was obtained from data
E = Frequency that was hoped
k = the sum of interval class
20
Sudjana, MetodaStatistika, (Bandung:Tarsito 2002), p.273.

46
b. Homogeneity test
It is used to know whether the data are homogenous
or not.
The formula is:
F=
21
Where:
Vb : bigger variance
Vk: smaller variance
The hypotheses in homogeneity test are:
Ho : homogeny variance =
Ha : non homogeny variance =
If the calculation result of
( ) by 5%
degree of significant so Ho is accepted, it means the data
is homogeneous or both of groups have the same variance.
c. Test of average
It is used to examine average whether
experimental class and the control class that has been
decided having significance different average. by using
the following formula:22
t=
√
with s=√( )
( )
21
Sudjana, “Metoda Statistika...”, p.250
22Sudjana, “Metoda Statistika...”, p.239

47
where:
: average of experimental group
: average of control group
: number of experimental group
: number of control group
: standard deviation of experimental group
: standard deviation control group
The criteria of this test is Ho is accepted if –
where
obtained from the distribution list t with df =
( ) and opportunities (
). Values for
other t Ho rejected.
2. End Phase Analysis
a. Normality Test
The second steps of this test is same as the
normality test on the initial data.
b. Homogeneity test
The second steps of this test is same as the
homogeneity test on the initial data.
c. Hypothesis test
Analysis of hypothesis test is a further analysis of
the analysis preliminary. Hypothesis test is used to
conclude whether the hypothesis is accepted or rejected.
The statistical technique used is t-test. i.e.:

48
Ho =
Ha =
= average data of experimental group
= average data of control group
The formula is :
√
with s=√( )
( )
where:
: average of experimental group
: average of control group
: number of experimental group
: number of control group
: standard deviation of experimental group
: standard deviation control group
Testing criteria that apply Ho is accepted if t count >t
table with determine dk = (n 1 + n 2 - 2) and = 5% with
opportunities (1 - ). Values for other t Ho rejected.

49
CHAPTER IV
RESEARCH FINDING AND ANALYSIS
This chapter is related to the analysis of data collection from
the research finding and discussion. This research was intended to find
out the effectiveness of using PQ4R strategy in teaching reading
narrative text an experimental research of ninth grade students of
SMP Ma’arif NU 02 Jatinegara.
A. Description of Research
Findings of this research described that there were
different result between experimental class which taught by using
PQ4R Strategy and control class which was taught without using
PQ4R Strategy on reading narrative text. The research was
conducted in SMP Ma’arif NU 02 Jatinegara at the ninth grade in
the academic year of 2015/2016.
In this research, the researcher used non probability
sampling with total sampling or population sampling. Non
probability sampling is sampling technique which is not give the
same opportunity for each element of population.1 The students of
two classes, class A and B which consist of approximately 46
students, as the sample from the population. Class B was a control
class and class A was an experiment class.
1Sugiyono, Metode PenelitianPendidikan Kualitatif, Kuantitatif dan
R & D , p 84-85.

50
Before items were given to the students, the researcher
gave tryout test for tryout class on 10th
September 2015 to analyze
validity, reliability, difficulty level, and the discrimination power
of each item. The researcher prepared 35 items as the instrument
of the test. Test was given to know the validity, reliability, degree
of test difficulty and discriminating power of test item of tryout
test in control class that was provided by the researcher.
In this research finding of tryout test, the researcher used
product-moment formula to analyze validity. The researcher
applied the spearman brown formula which was combined with
product moment formula to analyze reliability of instrument. The
degree of test difficulty used difficulty level formula by
considered five levels of difficulty. The last analysis of tryout test
was discriminating power by divided into two groups; lower
group and upper group which consist of 12 students in upper
groups and 12 students in lower group.
The researcher gave pre-test on 16th
September 2015 in
control and experimental group. The questions consisted of 20
items were stated valid according to tryout analysis. After giving
pre-test, the writer determined the materials and lesson plans of
learning activities. Pre-test was conducted to both groups to know
that two groups were normal and homogeny.
After knowing the control group and experimental group
had same variant. Before giving the treatment and conventional
method, the researcher prepared lesson plan and material to

51
learning activity. The researcher conducted conventional method
in control class on 23rd
and 30th
September 2015. The control
group was not taught by using PQ4R Strategy, but the teacher
explained the material using conventional method without giving
variation or special treatment in learning process.
The treatment for experimental group on 17th
and 30th
September 2015 by using PQ4R Strategy, which is appropriate to
teach narrative text focused on reading skill.
After gave treatments in experimental group and
conventional teaching in control group, the researcher gave post-
test on 1st October 2015 to both experimental group and control
group.
From the post-test, it could be known that there were
significant result between control group and experimental group
by hypothesis test which showed the value of t-test is higher than
t-table.
B. Data Analysis and Test of Hypothesis
1. Data Analysis
a. Data Analysis of Try-out Finding
1) Validity of Instrument
As mentioned in chapter III, validity refers to
the precise measurement of the test. In this study, item
validity was used to know the index validity of the
test. To know the validity of instrument, the writer
used the Pearson product moment formula to analyze

52
each item. It was obtained that from 35 test items;
there were 20 test items which were valid and 15 test
items which were invalid. It was invalid with the
reason the computation result of their rxy value (the
correlation of score each item) was lower than their
rable value.
Table 4.1
Validity of Each Item
Criteria rtable Number of question total
Valid
0,404
1, 2, 3, 5, 6, 8, 10, 11, 13,
15, 16, 17, 20, 21, 23, 25,
26, 29, 30, 32.
20
Invalid 4, 7, 9, 12, 18, 19, 22, 24,
27, 28, 31, 33, 34, 35.
15
The following was the example of item
validity computation for item number 1 and for the
other items would use the same formula.
N = 24 ∑Y = 437
∑XY = 269 ∑X2 = 12
∑X = 12 ∑Y2 = 9093
( )( )
* ( ) +* ( ) +
( ) ( )( )
√* ( ) ( ) + * ( ( ) +
√( ) ( )

53
rxy = 0,612
From the computation above, the result of
computing validity of the item number 1 was 0.612.
After that, the researcher consulted the result to the
table of r Product Moment with the number of subject
(N)=24 and significance level 5% it was 0.404. Since
the result of the computation was higher than r in
table, the index of validity of the item number 1 was
considered to be valid.
2) Reliability
A good test must be valid and reliable. To get
the coefficient of correlation, the researcher applied
the product-moment formula and then continued to
the spearman-brown formula. The formula of product
moment as follow: Before computing the reliability,
the researcher had to compute product moment
formula ( ) with the formula below:
N = 24 ∑XY = 2192
∑Y = 240 ∑X = 196
∑Y2 = 2712 ∑X
2 = 1964
( )( )
* ( ) +* ( ) +
( ) ( )( )
* ( ) ( ) +* ( ) ( ) +
xyr

54
( )( )
( )( )
After finding product moment formula (r )
the computation was continued to the Spearman-
Brown formula as follow:
From the computation above, it was found out
that (the total of reliability test) was 0,816
whereas the number of subjects was 24 and the
critical value for r-table with significance level 5%
was 0.404. Thus, the value resulted from the
computation was higher than its critical value. It could
be concluded that the instrument used in this research
was reliable.
3) Degree of Test Difficulty
The following is the computation of the level
difficulty for item number 1 and for the other items
would use the same formula
XY
11r

55
B = 8 + 4
JS = 24
It is proper to say that the index difficulty of
the item number 1 above can be said as the medium
category, because the calculation result of the item
number 1 is in the interval 0. 50 . After
computing 35 items of the try-out test, there were 5
items were considered to be easy, 29 items were
considered to be medium, and there were 1 item was
considered to be difficult.
Table 4.2
Degree of Difficulty Each Item
Criteria Number of Question Total
Easy 5, 15, 19, 29, 32 5
Medium 1, 2, 3, 4, 6, 7, 8, 9, 10, 11,
12, 13, 14, 16, 17, 20, 21, 22,
23, 24, 25, 26, 27, 28, 30, 31,
33, 34, 35.
29
Difficult 18 1
4) The Discriminating Power
The following is the computation of
discriminating power of item number 1. To do this
analysis, the number of try-out subjects was divided
70,0 p

56
into two classes, upper and lower classes. They were
upper and lower class.
Table 4.3
The table of Discriminating Power of Number 1
Upper Group Lower Group
No Code Score No Code Score
1 T-1 1 1 T-13 0
2 T-2 0 2 T-14 0
3 T-3 0 3 T-15 0
4 T-4 1 4 T-16 0
5 T-5 1 5 T-17 1
6 T-6 0 6 T-18 0
7 T-7 1 7 T-19 0
8 T-8 1 8 T-20 0
9 T-9 1 9 T-21 1
10 T-10 1 10 T-22 1
11 T-11 1 11 T-23 0
12 T-12 0 12 T-24 1
Sum 8 Sum 4
This was the analysis of discriminating power
for item number 1:
BA = 8
BB = 4
JA =12
JB =12

57
According to the criteria, the item number 1
above was medium category, because the calculation
result of the item number 1 was in the interval 0.20
. After computing 35 items of try –out
test and after being consulted to the discriminating
power category, there were 7 items which considered
being good, 22 items were satisfied and 6 items were
poor.
Table 4.4
Discriminating Power of Each Item
Criteria Number of Each Question Total
Poor 4, 7, 14, 27, 28, 35. 6
Satisfied 1, 2, 3, 5,6, 8, 9, 10, 12, 13, 16,
17, 18, 19, 20, 21, 22, 24, 26, 32,
33, 34
22
Good 11, 15, 23, 25, 29, 30, 31. 7
Based on the analysis of validity, reliability,
difficulty level, and discriminating power, finally 35
items of test, there were 20 items were accepted to be
used in pre-test and post-test. They were number 1, 2,
3, 4,5, 6, 8, 10, 11, 13, 15,17,20, 21, 23, 25, 26, 29,
30 and 32.
40.0 D

58
2. The Data Analysis of Pre-request Test
Table 4.5
Pre-test Score of the Experimental Class and
the Control Class
CONTROL EXPERIMENT
NO CODE SCORE NO CODE SCORE
1 C-1 35 1 E-1 35
2 C-2 50 2 E-2 60
3 C-3 30 3 E-3 35
4 C-4 50 4 E-4 55
5 C-5 60 5 E-5 50
6 C-6 50 6 E-6 35
7 C-7 30 7 E-7 35
8 C-8 45 8 E-8 45
9 C-9 35 9 E-9 40
10 C-10 35 10 E-10 35
11 C-11 40 11 E-11 55
12 C-12 75 12 E-12 80
13 C-13 50 13 E-13 55
14 C-14 55 14 E-14 70
15 C-15 35 15 E-15 50
16 C-16 35 16 E-16 40
17 C-17 40 17 E-17 45
18 C-18 40 18 E-18 45
19 C-19 40 19 E-19 45
20 C-20 30 20 E-20 35
21 C-21 55 21 E-21 55
22 C-22 55 22 E-22 60
23 C-23 40 23 E-23 35
Sum 1010 1095
N 23 23
Average 43,913 47,608
Varians(s2) 127,174 151,976
Standard
Deviation (S) 11,277 12,327

59
a. Normality test
The normality test was used to know whether the
data obtained was normally distributed or not. Test data of
this research used the formula of Chi square.
Ha: The distribution list was normal.
Ho: The distribution list was not normal
With the criteria:
Ho accepted if X 2count < X 2
table
Ho rejected if X 2count> X 2
table
With a = 5% and df = k-1.
Table 4.6
The normality result of pre-test in experimental class
and control class.
Class X 2count X 2
table Criteria
Experimental 5.89 11.07 Normal
Control 5.42 11.07 Normal
Based on the analysis above, it can be seen that
X2count both of class lower that X 2
table (X 2
count < X 2table), so
Ho accepted. And the conclusion is the distribution data
of experimental and control classes were normal.
b. Homogeneity test
The homogeneity test is used to know whether the
group sample that was taken from population is
homogeneous or not.
Ho: 12 = 2
2
Ha: 12 ≠ 2

60
Table 4.7
The Homogeneity Result of Pre-Test in Experimental
And Control Class
Class Variance
(S2)
N Df Fcount Ftable Criteria
Experimental 151.976 23 22 1.195 2.048 Homogen
Control 127.174 23 22
According to the formula above, it is obtained
that:
F =
F =
F = 1.195
Based on computation above it is obtained that
Fcount is lower than Ftable so Ho accepted. It can be
concluded that data of pre test from experimental and
control class have the same variance or homogeneous.
c. Testing the similarity of average of the initial data
between experimental class and control class
To test the difference of average, used t-test
Ho: µ1 = µ2
Ha: µ1≠ µ2
Where
µ1 : average data of experimental group
µ2 : average data of control group

61
Table 4.8
The Average Similarity Test of Reading Skill Pretest
in Experimental and Control Class
Variation
Source Experimental Control Criteria
Sum 1095 1010
Ho
accepted
N 23 23
Average (X) 47,608 43,913
Variance (S2) 151,976 127,174
Standar of
deviation (S) 12,327 11,277
According to the formula above, it is obtained that:
Tcount=
√
= 1,061
With and df = 23+23-2= 44, obtained
ttable =2.02. From the result of calculation t-test, tcount=
1,061 Because t count was lower than t table (2.02>1,061) So
Ho is accepted.
3. The Data Analysis of Post-Request Test
a. Normality test
Ha: The distribution list was normal.
Ho: The distribution list was not normal

62
With the criteria:
Ho accepted if X 2count < X 2
table
Ho rejected if X 2count> X 2
table
With a = 5% and df = k-1.
Table 4.9
The result of normality test of post-test of the
experimental And control class
Class X 2count X 2
table Criteria
Experimental 1,05 11.07 Normal
Control 0,96 11.07 Normal
Based on analysis above, it can be seen that
X 2count both of class lower that X 2
table (X 2
count < X 2table), so
Ho accepted. And the conclusion is the distribution data
of experimental and control classes are normal.
b. Homogeneity test
The homogeneity test is used to know whether
the group sample that was taken from population is
homogeneous or not.
Ho: 12 = 2
2
Ha: 12 ≠ 2
Table 4.10
The result of homogeneity test of post-test of the
experimental and control class
Class Variance
(S2)
N Df Fcount Ftable Criteria
Experimental 128,360 23 22 1,043
2,048
Homogeneous
Control 133,893 23 22

63
according to the formula above, it is obtained that:
F =
F =
= 1,043
Based on computation above it is obtained that
Fcount is lower than Ftable so Ho accepted. It can be
concluded that data of pre test from experimental and
control class have the same variance or homogeneous.
c. Hypothesis test
Hypothesis test is used to know whether there is a
difference on post test of experimental class and control
classes. The data which is used to test the hypothesis is
score post test both of class. To test the difference of
average used t-test.
Ho: µ1 = µ2: it means there is no significant
difference between the reading skill
improvement of students who were
taught by using PQ4R Strategy and who
were taught by using non-PQ4R Strategy.
Ha: µ1≠ µ2 : it means there is significant difference
between the reading skill improvement of
students who were taught by using PQ4R
Strategy and who were taught by using
non-PQ4R Strategy.

64
Table 4.11
The Result of Computation T-Test
Class N Average
(X)
Variance
(S2)
Standar of
deviation (s)
ttable
tcount
criteria
Experimental 23 74,783 128,360 11,330 2,02 2,768 Ha accepted
Control 23 65,435 133,893 11,571
Based on the computation above, it is obtained
that the average of post test of the experimental class who
are taught by using PQ4R Strategy is 74,783 and standard
deviation (s) is 11,330. While the average of post test of
the control class who are taught by using non-PQ4R
Strategy is 65,435 and standard deviation (s) is 11.571.
with df = 23+23-2 = 44 by α= 5%, so obtained ttable= 2.02.
From the result of calculation t-test tcount= 2,768. if
compared between ttable and tcount, tcount>ttable. it means that
Ho is rejected and Ha is accepted. there is significant
difference between the reading skill improvement of
students who were taught by using PQ4R Strategy and
who were taught by using non-PQ4R Strategy.
C. Observation Interpretation
The observation was carried out during the treatment
focused on the students’ comprehension in Narrative Text. The
concern was given by viewing the students’ observable behavior
appeared in class within teamwork phase. In this case, the
researcher saw their activeness, through the questions pertaining

65
to narrative text. Questioning, here, has many purposes in teaching
reading.
Firstly, the question which was given to the students
provided the teacher information about their understanding on
narrative during the research or treatment and enabled the teacher
to measure their understanding through the answers they gave
whether correct, incorrect or partially correct
While during the teamwork, the observation result shown
that it was about 60%-80% of students who gave explanation and
answered the question on given material correctly and about less
than 20% answered incorrectly to other students’. Observation
showed that score of control class was 65% while experiment
class was 80%. It showed that experiment class was higher than
control class in class activity during the research is conducted.
The score specification is in appendix.
D. Discussion of the Research Findings
After getting the result of the research, the researcher
discussed the data. Based on the teaching learning processed, it
could be seen that PQ4R Strategy was able to answer the
statement of the problem.
1. The comparison of average score between pre-test of
experimental class and pre-test of control class was not
significance/homogeneous.

66
The homogeneity of pre-test is very important for the
researcher if he/she want to continue his/her research.2 The
average score of experimental class was 47.609 and the
average score of control class was 43.913.
2. The progress between pre-test and post-test of experimental
class and control class .
The difference effect of experimental class and
control class was on the treatment. The students of
experimental class was taught by using PQ4R Strategy, while
the students of control class was taught by using non-PQ4R
Strategy. The progress of learning process in experimental
class was sharp, it can be seen on students’ activity in
treatment process by using PQ4R Strategy:
a. The students are interest in joining the learning process.
By using PQ4R Strategy, the teacher could create
an interesting teaching learning process in the classroom
because the students could be happy and they would not
get bored. It also makes students enthusiastic in reading
text.
b. The students were motivated to learn together.
It means that teaching using PQ4R Strategy had
advantages in learning process, especially in reading
narrative text. The strategy of using PQ4R could help the
2Suharsimi Arikunto, Prosedur Penelitian Suatu Pendekatan
Praktik, (Jakarta: PT. Rineka Cipta, 2006,) p.321.

67
students solve their problem in reading; besides, it also
encouraged the students to be more active and motivated.
c. The students were started to learn independently.
It means that using PQ4R Strategy can build
students’ independent learning, they were more enthusiast
to learn about reading especially in narrative text.
d. The students can understand more about the material.
It means that after using PQ4R Strategy students
can understand about how to find the main idea in the
passage as well.
It was affected to the students average score of post-test
was 74.783 while the average score of pre-test was 47.609.
The progress of learning process in control class was steady,
because the teacher taught using non-PQ4R Strategy, it can be
seen on the students’ average score of post-test was 65.435
while the average score of pre-test was 43.913.
E. Limitation of the Research
The researcher realizes that this research had not been
done optimally. There were constraints and obstacles faced during
the research process. Some limitations of this research were:
1. The research was limited at SMP Ma’arif NU 02 Jatinegara in
the academic year of 2015/ 2016. When the same researches
conducted in other schools, it is still possible that different
result will be gained.

68
2. Relative of the implementation process of this research have
short of time, makes this research could not be do maximal.
But it was enough to fulfill all requirements for a research.
3. Relative lack of experience and knowledge of the researcher,
makes implementation process of this research was less
smooth. But the researcher tried as maximal as possible to do
this research.
Considering all those limitations, there is a need to do
more research about teaching narrative text using the same or
different medium. In the hope there will be more optimal result.

69
CHAPTER V
CONCLUSIONS AND SUGGESTIONS
In this chapter, the researcher wants to conclude the result of
the research, and wants to suggest to the reader especially to the
students and teachers in relation with the result of this research. The
researcher hopes it would be useful for the readers to improve the
quality of English teaching, especially in teaching narrative text to the
ninth grade students of junior high school.
A. Conclusions
The conclusion of this research is drawn in accordance
with the result of the data analysis in the previous chapter. After
getting the result of study, the researcher concludes that PQ4R
Strategy was effective in teaching reading narrative text. By using
PQ4R Strategy, the teacher could create an interesting teaching
learning process in the classroom because the students could be
happy and they would not get bored.
There are some significant differences between
experimental and control class. The average score for the
experimental class was 47.609 for the pre-test and 74.783 for the
post test. While the average scores for the control class was
43.913 for the pretest and 65.435 for the post-test. It means that
there was an improvement of the students’ achievement in
narrative text. Each class had different achievement. The

70
achievement of the experimental class was higher than the control
class.
In the result of post-test of experimental class were 74.783
which were higher than the control class 65.435. It means that
teaching narrative text by using PQ4R Strategy was better than
teaching narrative text by using non-PQ4R Strategy.
The result of the calculation using the t-test showed that
tvalue = 2.768 and ttable for α: 5% was 2.02. It means that t value was
higher than t table {2.768>2.02}. It can be concluded that there is
a significant difference in the students’ score in narrative text with
the ninth year students of SMP Ma’arif NU 02 Jatinegara in
academic year of 2015/ 2016 between students who have been
taught by using PQ4R Strategy and those who have been taught
by using a non-PQ4R Strategy.
In addition, teaching narrative text by using PQ4R
Strategy can help the students improve their reading skills. It
could be seen when teaching and learning process, the students
were enthusiasm in learning it.
B. Suggestions
In teaching and learning English at Junior High School,
the teacher must create enjoyable, fun and interesting atmosphere,
because the enjoyment is the basic modal that has to be noticed in
order to get students’ attention in learning. So, the students are
interested in learning. The teacher can create an entertainment or
enjoyment situation by giving PQ4R in delivering materials. By

71
using PQ4R, students do not only pay attention to the material but
also they can identify some grammatical structures in interesting
and different way. If the students have high interest, it would not
be difficult for the teacher to deliver the lesson. In addition, the
students also will be easily to open their minds on understanding
the material.
The researcher hopes that the school institution can
support teachers to create enjoyable, fun and interesting
atmosphere in learning English especially in teaching narrative
text. So, this research can improve students’ English skill
especially in reading.
C. Closing
The true praise only belongs to Allah, who gives power
and health until this thesis can be finished. The writer is sure that
this research is far from the perfectness. Therefore, constructive
criticism and advices are really expected. Finally, the writer
hopes that it can be useful for her and for the readers in general.

BIBLIOGHRAPHY
Ali, A. Yusuf, The Holy Qur’an Text, Translation and Commentary,
America: Amana Corp, 1983.
Anderson, Mark and Kathy Anderson, Text Types in English,
Australia: Macmillan,1997.
Arikunto, Suharsimi, Dasar-Dasar Evaluasi Pendidikan, Jakarta:
Bumi aksara, 2002 3rd
Ed
Arikunto, Suharsimi, Prosedur Penelitian Suatu Pendekatan Praktek -
edisi revisi, Jakarta: Rineka Cipta, 2010.
B. Uno, Hamzah, Model Pembelajaran Menciptakan Proses Belajar
Mengajar yang Kreatif, Jakarta: Bumi aksara, 2007.
Bonner, Margaret, Step Into Writing, London: Longman, 1994.
Brown, Douglass, Language assessment Principles and Classroom
Practices, San Francisco: Longman, 2004.
Departemen Agama RI, Mushaf Al-Qur’an dan Terjemah, Jakarta:
Pena Pundi Aksara, 2009.
Halliday, M. A. K & Ruqaiya Hasan, Language, Context, and Text:
Aspects of Language in
Social-Semiotic Perspective, Hongkong: Oxford University Press,
1984.
Harmer, Jeremy, The Practice of English Language Teaching
Longman Handbooks for Language Teacher, London:
Longman Ninth Impression, 2001
Harmer, Jeremy, The Practice of English Language Teaching 3rd ed,
Harlow: Pearson Education Ltd., 2001

Harmer,Jeremy How to Teach English, England: Pearson Education,
1998
Hartono, Statistik Untuk Penelitian, Yogyakarta: Pustaka Pelajar,
2004.
Hasanah, Afidatul,“Upaya Meningkatkan hasil belajar biologi melalui
Pembelajaran Strategi Pembelajaran PQ4R (Preview,
Question, Read, Reflect, Recite and Review) Materi Pokok
Pertumbuhan dan Perkembangan pada Manusia Kelas VIII B
di MTs NU Salatiga”, Skripsi Fakultas Tarbiyah IAIN
Walisongo Semarang, (Semarang: Perpustakaan Tarbiyah,
2010)
Hasanah, Felahah, “ Efektifitas Strategi PQ4R (Preview, Question,
Read, Reflect, Recite and Review) Berkombinasi Mindmap
Terhadap Hasil Belajar Peserta Didik Pada Materi Pokok
Klasifikasi Makhluk Hidup Kelas VII di Mts NU Sunan
Katong Kaliwungu Tahun Ajaran 2010/2011”, Skripsi
Fakultas Tarbiyah IAIN Walisongo Semarang, (Semarang:
Perpustakaan Tarbiyah, 2010)
Klinger, Janette K, Sharon Vaugh and Alison Boardman, Teaching
Reading ComprehensionTo Students With Learning
Difficulties, New York: The Guilford Press, 2007.
Knap, Peter and Megan Watkins, Genre, text, grammar : technologies
for teaching and assesing writing, Australia : University of
New South Wales. 2005
Mun, Ng Foo, Ng Lai Foong, Ng How Seng and Gabriel Mich. Kia
Tolok, Creative English: Workbook, (Jakarta: Penerbit
Erlangga, 2008), p.viii (overview)
Nunan, David, Designing Tasks for the Communicative Classroom,
United Kingdom: Cambridge University Press, 1989.
Richards, Jack, John Platt and Heidi Weber, Longman Dictionary of
Applied Linguistics, UK: Longman Group, 1990.

Richards, Jack C., Approaches And Methods in Language Teaching,
United State of America: Cambridge University Press, 2001.
Sanjaya, Wina, Penelitian Pendidikan: Jenis, Metode dan Prosedur,
Jakarta: Kencana, 2013
S. Pang, Elizabeth, Teaching Reading, Belgium: the International
Academy of Education (IAE), 2003.
Sudjana, Metoda Statistika, Bandung: Tarsito 2002
Sukardi, Metodologi Penelitian Pendidikan, Yogyakarta: Bumi
Aksara, 2010
Sugiarto, Teknik Sampling, Jakarta: Gramedia Pustaka Utama, 2003
Sugiyono, Metode Penelitian Kuantitatif Kualitatif Dan R&D,
Bandung : Alfabeta,2012.
Suprijono, Agus, Cooperatif Learning, Yogyakarta: Pustaka Pelajar,
2009.
Tanzeh, Ahmad, Pengantar Metode penelitian, Yogyakarta: Teras,
2009
Trianto, S.Pd., M.Pd, Model-Model Pembelajaran Inovatif
Berorientasi Kontruktivistik, Jakarta: Prestasi Pustaka, 2002.
W. Stoller, Grabe, Teaching and Researching Reading, London:
Longman Press.

APPENDICES


Appendix 1
LIST OF STUDENTS OF TRY OUT CLASS
No. Nama kode
1. Agus Riyanto T-1
2. Aliatul Nafisah T-2
3. Alif Khotun Nurul Huda T-3
4. Aminatun Khasanah T-4
5. Dedi Purwanto T-5
6. Irfanudin T-6
7. Misbahul Ulum T-7
8. Khoerul T-8
9. Kurnengsih T-9
10. Muhamad Sofarudin T-10
11. Munawaroh T-11
12. Nadia Ismi Azizah T-12
13. Norma Azmi T-13
14. Nur Fauziyah T-14
15. Pipit Pitriani T-15
16. Purkon Maulana T-16
17. Silviani T-17
18. Siti Aminah T-18
19. Siti Fatimah T-19
20. Siti Khofifah T-20
21. Siti Laelatul Iqoh T-21
22. Ulfaizah T-22
23. Zaenab T-23
24 Ahmad Fauzi T-24

Appendix 2
LIST OF STUDENTS OF IX A (EXPERIMENTAL CLASS)
No. Name Code
1. Agus Riyanto E-01
2. Aliatul Nafisah E-02
3. Alif Khotun Nurul Huda E-03
4. Aminatun Khasanah E-04
5. Dedi Purwanto E-05
6. Irfanudin E-06
7. Misbahul Ulum E-07
8. Khoerul E-08
9. Kurnengsih E-09
10. Muhamad Sofarudin E-10
11. Munawaroh E-11
12. Nadia Ismi Azizah E-12
13. Norma Azmi E-13
14. Nur Fauziyah E-14
15. Pipit Pitriani E-15
16. Purkon Maulana E-16
17. Silviani E-17
18. Siti Aminah E-18
19. Siti Fatimah E-19
20. Siti Khofifah E-20
21. Siti Laelatul Iqoh E-21
22. Ulfaizah E-22
23. Zaenab E-23

Appendix 3
LIST OF STUDENTS OF IX B (CONTROL CLASS)
No. Name Code
1. Arinal Haqo C-01
2. Azdi Pangestu C-02
3. Hibatulloh C-03
4. Izul Maulana C-04
5. Lulu Pajriyah C-05
6. Lutpawati C-06
7. M. Ali Firmansyah C-07
8. M. Rizqon Ali C-08
9. Marsha Atiekah C-09
10. Maulana Zulfa C-10
11. Muawanah C-11
12. Muhamad Aldi C-12
13. Muzaki C-13
14. Sahrul C-14
15. Salsa Nabila C-15
16. Silfiatunnisa C-16
17. Sinta Kurniati C-17
18. Siti Hujiah C-18
19. Tuti Maryani C-19
20. Zidan Mubarok C-20
21. Juaroh C-21
22. Ahmad Faozi C-22
23. Ahmad Dzikron C-23

Appendix 4
THE SCHEDULE OF THE RESEARCH
NO. DATE ACTIVITIES
1. 10 September 2015 Try out test
2. 16 september 2015 Pre-test in control and experimental
class
3. 17 September 2015 Treatment by using PQ4R Strategy in
Experimental Class
4. 23 September 2015 Teaching with non-PQ4R Strategy in
Control Class
5. 30 September 2015 Treatment by using PQ4R strategy in
Experimental class
Teaching with non-PQ4R strategy in
control Class
6. 01 0ktober 2015 Post-test in control and experimental
class

Appendix 5
THE COMPUTATION OF THE VALIDITY, RELIABILITY,
DIFFICULTY LEVEL AND DISCRIMINATING POWER OF
THE TRY-OUT TEST
1 2 3 4 5 6 7 8 9 10 11
1 T-1 1 1 1 0 1 1 0 1 1 1 1
2 T-2 0 0 0 0 1 1 1 1 1 1 0
3 T-3 0 1 0 1 1 1 0 1 1 1 0
4 T-4 1 1 1 1 1 1 1 1 1 0 0
5 T-5 1 0 1 1 0 0 1 0 1 1 1
6 T-6 0 1 0 0 0 0 1 1 0 0 1
7 T-7 1 1 1 1 1 1 0 1 1 1 1
8 T-8 1 1 1 1 1 1 1 1 0 1 1
9 T-9 1 0 1 1 1 1 1 0 1 1 0
10 T-10 1 0 1 0 1 1 0 0 1 1 1
11 T-11 1 1 1 1 1 1 1 1 0 0 1
12 T-12 0 0 1 1 1 0 0 0 0 0 1
13 T-13 0 0 0 0 1 0 0 0 0 0 1
14 T-14 0 0 0 0 0 0 1 0 0 1 0
15 T-15 0 0 0 0 1 0 0 0 0 0 0
16 T-16 0 0 1 1 1 1 0 0 1 1 0
17 T-17 1 1 0 1 1 1 1 1 0 1 0
18 T-18 0 0 0 0 0 0 0 0 0 0 0
19 T-19 0 0 0 1 1 0 0 1 0 0 0
20 T-20 0 0 1 1 0 0 0 0 1 0 0
21 T-21 1 1 1 0 1 1 1 1 1 1 0
22 T-22 1 1 0 1 0 0 0 0 0 0 0
23 T-23 0 0 1 1 1 1 1 0 1 1 024 T-24 1 1 1 0 0 1 1 1 0 0 0
SX 12 11 14 14 17 14 12 12 12 13 9
SX2 12 11 14 14 17 14 12 12 12 13 9
SXY 268 242 303 262 345 312 248 258 247 279 207
rxy 0,605 0,512 0,597 0,094 0,481 0,707 0,363 0,484 0,351 0,520 0,543
rtabel 0,404 0,404 0,404 0,404 0,404 0,404 0,404 0,404 0,404 0,404 0,404
Criteria Valid Valid Valid Invalid Valid Valid Invalid Valid Invalid Valid Valid
U 8 7 9 8 11 9 7 8 8 8 9
L 4 4 5 6 7 5 5 4 4 5 1
N1 12 12 12 12 12 12 12 12 12 12 12
N2 12 12 12 12 12 12 12 12 12 12 12
D 0,33 0,25 0,33 0,17 0,33 0,33 0,17 0,33 0,33 0,25 0,667
Criteria
Satisfac
tory
Satisfac
tory
Satisfac
toryPoor
Satisfac
tory
Satisfac
toryPoor
Satisfac
tory
Satisfac
tory
Satisfac
toryGood
R 12 11 14 14 18 14 12 12 12 13 10
N 24 24 24 24 24 24 24 24 24 24 24
FR 0,50 0,46 0,58 0,58 0,75 0,58 0,50 0,50 0,50 0,54 0,42
Criteria Medium Medium Medium Medium Easy Medium Medium Medium Medium Medium Medium
Used Used Used Unused Used Used Unused Used Unused Used Used
No KodeNo Item
Criteria
Valid
ity
Dis
crim
inating P
ow
er
Difficulty
Level

12 13 14 15 16 17 18 19 20 21 22
0 1 0 1 1 1 1 1 1 0 1
1 0 0 1 0 0 1 1 0 0 1
1 0 1 0 0 0 1 0 0 1 1
1 1 0 1 0 0 0 1 1 1 1
1 0 0 0 1 1 0 1 1 1 0
1 1 0 1 1 1 0 0 1 1 0
1 1 1 1 1 1 0 1 1 1 0
0 1 1 1 1 1 0 1 1 0 0
1 1 1 1 0 0 0 1 0 1 1
0 1 0 1 1 1 1 1 1 1 1
1 1 0 1 1 1 0 0 1 1 1
1 0 1 1 1 1 1 1 1 0 1
0 0 1 1 1 1 0 1 0 0 1
1 0 0 0 0 0 1 1 0 0 1
0 0 1 0 0 0 0 0 0 0 0
1 1 0 1 1 1 0 1 1 0 1
1 1 1 1 0 0 0 1 1 1 0
0 1 0 0 0 0 0 0 0 1 0
1 0 0 1 0 0 0 0 0 0 1
0 0 0 0 1 1 0 0 0 0 0
1 1 1 1 1 1 0 1 1 1 1
0 1 1 0 0 0 0 1 1 0 0
0 0 0 0 1 1 0 0 0 1 01 0 0 1 1 0 0 1 1 0 1
15 13 10 16 14 13 6 16 14 12 14
15 13 10 16 14 13 6 16 14 12 14
293 277 193 336 295 279 123 320 305 253 275
0,256 0,496 0,139 0,582 0,499 0,520 0,196 0,376 0,621 0,423 0,254
0,404 0,404 0,404 0,404 0,404 0,404 0,404 0,404 0,404 0,404 0,404
Invalid Valid Invalid Valid Valid Valid Invalid Invalid Valid Valid Invalid
9 8 6 11 9 9 5 10 9 8 9
6 5 5 6 6 5 1 7 5 4 6
12 12 12 12 12 12 12 12 12 12 12
12 12 12 12 12 12 12 12 12 12 12
0,25 0,25 0,08 0,42 0,25 0,33 0,33 0,25 0,33 0,33 0,25
Satisfac
tory
Satisfac
toryPoor Good
Satisfac
tory
Satisfac
tory
Satisfac
tory
Satisfac
tory
Satisfac
tory
Satisfac
tory
Satisfac
tory
15 13 11 17 15 14 6 17 14 12 15
24 24 24 24 24 24 24 24 24 24 24
0,63 0,54 0,46 0,71 0,63 0,58 0,25 0,71 0,58 0,50 0,63
Medium Medium Medium Easy Medium Medium Difficult Easy Medium Medium Medium
Unused Used Unused Used Used Used Unused Unused Used Used Unused
No Item

23 24 25 26 27 28 29 30 31 32 33
1 0 1 1 1 1 1 1 1 0 1
0 1 1 1 0 0 0 1 1 0 0
0 1 0 1 1 1 1 1 1 1 0
0 1 1 0 0 0 1 0 0 1 0
1 0 0 0 1 1 1 0 1 1 0
0 0 1 1 1 0 1 1 1 1 1
1 1 1 0 0 0 1 0 1 1 0
1 0 1 1 1 0 1 1 1 1 1
1 0 1 0 0 1 1 1 0 1 0
1 1 1 1 0 0 1 1 1 1 1
1 1 1 1 1 1 1 1 0 1 1
1 1 0 1 0 0 1 1 1 1 1
0 0 0 0 0 0 1 1 1 0 1
0 1 1 0 0 0 0 0 0 1 1
0 0 0 1 0 0 0 0 1 0 1
0 0 0 1 1 0 0 0 1 0 0
0 1 0 1 0 0 1 0 0 1 0
0 1 1 0 1 1 0 0 0 0 0
1 0 0 0 0 0 0 0 0 0 0
0 0 0 0 0 0 1 1 0 1 0
1 0 1 1 1 1 1 1 1 1 0
0 0 0 0 0 0 1 0 0 1 0
0 0 1 1 1 1 0 0 1 1 00 0 0 0 0 0 1 1 0 1 0
10 10 13 13 10 8 17 13 14 17 9
10 10 13 13 10 8 17 13 14 17 9
232 196 278 278 213 169 350 274 287 340 182
0,617 0,176 0,508 0,508 0,384 0,304 0,548 0,459 0,401 0,415 0,231
0,404 0,404 0,404 0,404 0,404 0,404 0,404 0,404 0,404 0,404 0,404
Valid Invalid Valid Valid Invalid Invalid Valid Valid Invalid Valid Invalid
8 7 9 8 6 5 12 10 10 10 7
2 3 4 5 4 3 6 4 5 7 3
12 12 12 12 12 12 12 12 12 12 12
12 12 12 12 12 12 12 12 12 12 12
0,50 0,33 0,42 0,25 0,17 0,17 0,50 0,50 0,42 0,25 0,33
GoodSatisfac
toryGood
Satisfac
toryPoor Poor Good Good Good
Satisfac
tory
Satisfac
tory
10 10 13 13 10 8 18 14 15 17 10
24 24 24 24 24 24 24 24 24 24 24
0,42 0,42 0,54 0,54 0,42 0,33 0,75 0,58 0,63 0,71 0,42
Medium Medium Medium Medium Medium Medium Easy Medium Medium Easy Medium
Used Unused Used Used Unused Unused Used Used Unused Used Unused
No Item

34 35
1 0 27
1 0 17
0 0 20
0 0 20
0 0 19
1 0 20
0 0 25
1 1 28
0 0 21
1 0 26
1 0 28
0 0 21
1 0 13
1 1 12
1 1 7
0 0 17
0 1 20
0 1 7
0 1 8
0 0 8
0 1 29
0 0 9
1 1 180 1 16
10 9 436
10 9
196 145
0,176 -0,231
0,404 0,404
Invalid Invalid
7 1
4 8
12 12
12 12
0,25 -0,58
Satisfac
toryPoor
11 9
24 24
0,46 0,38
Medium Medium
Unused Unused
676
Y Y2
729
289
400
400
361
400
625
784
441
81
784
441
169
144
49
289
400
49
64
64
841
324256
9060

Formula
Criteria
The item test is valid if rxy > rtabel
The following is the example of counting the validity of item number 1, and
for the other items will use the same formula.
No.123456789
101112131415161718192021222324
S
By using that formula, we obtain that :
x xrxy =
x - x -
rxy =
On a = 5% with N= 24 it is obtained = 0,404
Because of rxy > r tabel, so the item number 1 is valid.
0 8 0 64
The Computation of Item Validity Test
X Y X2
Y2
1 270
T-1T-2
0
441
20
0 170 7 0
0
Code27
0 17 01
21 0
729289
0 20 0 400
784
784
28
T-3T-4T-5T-6
T-9T-10T-11
1440
0 8 0 64
XY
00
1 20361
1 400
0 289
1 19 1
1 21
10
49
169
25 1 625
1 441
13
28 1
00
190 20 0 400 0
251
211 26 1 676 26
00 12
281
1 280
1
0 7 0 49 01 400
0
29
20
1 81 91 29 841
1 20
00
0 18 0
0,605
9060121224 24
1 9
1 16 1 256 16324
T-24
T-22T-23
436
9060 26812 436 12
268 12 43624
T-12T-13T-14
T-7T-8
T-18T-19T-20T-21
T-15T-16T-17
22
22
2222
YYNXXN
YXXYN
rxy
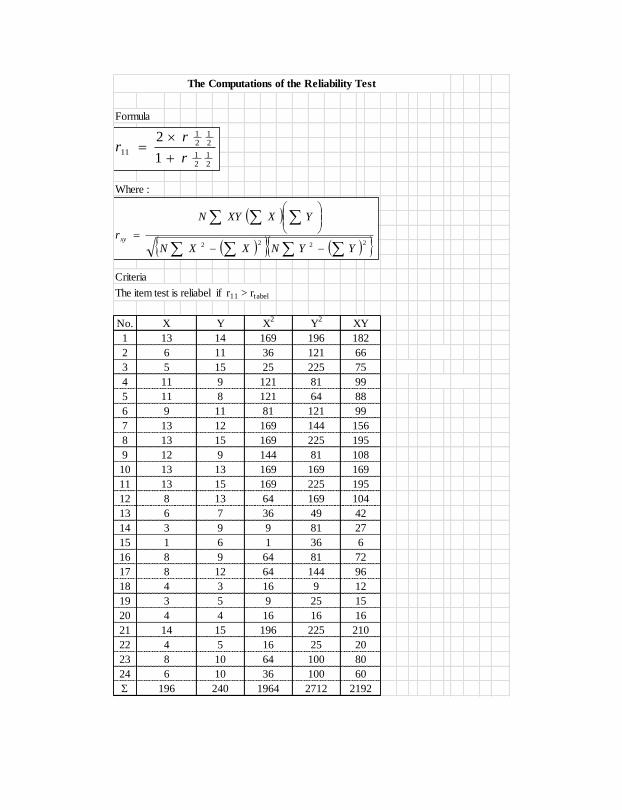
Formula
Where :
Criteria
The item test is reliabel if r11 > rtabel
No.
1
2
3
4
5
6
7
8
9
10
11
12
13
14
15
16
17
18
19
20
21
22
23
24
S
169 196 182
66
The Computations of the Reliability Test
Y X2
Y2
XY
13
X
14
11
121
81 99
648
6 11
75
9 121
36 121
5 15 25 225
81 121 99
13
88
9 11
11
12 169 144 156
13 15 169 225 195
144 81 10812 9
4
169
49 42
72
195
27
104
36 6
9612 64 144
81
8 169
1 6 1
64
8
13 13 169 169
9 813 9
13
15
64
6 7 36
13 169 225
15
16 16
3 9 12
5
36
64 100 80
16
210
20
196 225
16
16
9 25
5
196 1964 2712 2192
4 25
100 60
8 9
15
240
3
4
10
10
4
8
6
14
2222
YYNXXN
YXXYN
rxy
21
21
21
21
111
2
r
rr

By using that formula, we obtain that :
x x
x - x -
=
The result of l rxy is applied to the reliability formula
2 x
+
On a = 5% with N= 24 it is obtained rtabel = 0,404
Because of r11 > r tabel, so the item number 1 is reliable
aku kurang setuju dengan pemakaian r tabel, karena reliabilitas teorinya harus lebih dari 0,60.
0,816>0,60 maka dikatakan reliabel. Mw pake yang mana mbg ani???silahkan
196 24
24
240
rxy 0,6891
2712
2402192 196
r11 = 0,816
r11 =0,689
0,69
rxy =
1
24 196422

Formula
Keterangan:
Criteria
< <
< <
< <
< <
Acording to the criterions, the item number 1 is medium
1
0
9
T-1 1
1
0
T-6
T-4 1
8
7
T-20
9
T-18
5
T-3 0
T-5 1
T-15
6
T-77
= 0,33
DP
=8 4
111
10
12
T-1111
12
10
12 12
T-10 1
4Sum Sum8
3 3
0
4
0
0
8
4
T-19
5 T-17 1
6
T-16
T-24 1
T-23 0
T-9 1
T-8
T-12 0
0
1
1
T-22
T-21
D : The discrimination index.
N :The number of the students who answered correctly in one group
0T-2
Interval
0,20
0,40
Criteria
Poor
2 2 T-14
Upper Group Lower Group
No Score
0
01 T-13
Medium
1
The Computations of the Discriminating Power Test
The following is the example of the computation of the discriminating
power of item number 1, and for the other items will use the same
formula.
No Code Score
Good
0,70
D
D
D
0,40
0,00
0,70
1,00
0,20
D Excellent
U : The number of the students in the upper group who answered item correctly.
L : The number of the students in the lower group who answered item correctly.
Code
N
LCorrectUCorrectD

Rumus
Keterangan:
: The facility value (index of difficulty)
: The number of student who answered correctly
: The total number of the student
Criteria
< <
< <
< <
+
=
10 T-10
11
0
T-11 T-23 11 11
T-22 11 10
0
T-19 0
9
T-18
0
1
9 T-9 1
T-7 7
0
1
6
7
T-6
T-5
2
T-17
4 T-16
Acording to the criterions, the item number 1 is medium
FR =8 4
24
1 8 T-20
Sum 4Sum 8
T-21 0
T-8
T-24 012 T-12 0 12
8
0,50
1 T-1
1
6
T-2 T-14
T-13
5
4 T-4 1
3 T-3 0 3 T-15
5
0
Score
1 2
0 1
0
Easy1,00
CodeNo
1
The Computation Level of Difficulty Test
FR
R
N
0,30 FR 0,70
Code
The following is the example of the computation of the facility value
of item number 1, and for the other items will use the same formula.
Lower Group
Interval IK Criteria
Medium
Upper Group
Difficult0,00 FR 0,30
0,70
ScoreNo
FR
N
RFR

Appendix 6
SCORE PRE TEST BETWEEN EXPERIMENTAL CLASS
AND CONTROL CLASS
CONTROL (X2) EXPERIMENT (X1)
NO CODE SCORE NO CODE SCORE
1 C-1 35 1 E-1 35
2 C-2 50 2 E-2 60
3 C-3 30 3 E-3 35
4 C-4 50 4 E-4 55
5 C-5 60 5 E-5 50
6 C-6 50 6 E-6 35
7 C-7 30 7 E-7 35
8 C-8 45 8 E-8 45
9 C-9 35 9 E-9 40
10 C-10 35 10 E-10 35
11 C-11 40 11 E-11 55
12 C-12 75 12 E-12 80
13 C-13 50 13 E-13 55
14 C-14 55 14 E-14 70
15 C-15 35 15 E-15 50
16 C-16 35 16 E-16 40
17 C-17 40 17 E-17 45
18 C-18 40 18 E-18 45
19 C-19 40 19 E-19 45
20 C-20 30 20 E-20 35
21 C-21 55 21 E-21 55
22 C-22 55 22 E-22 60
23 C-23 40 23 E-23 35
Sum 1010 1095
N 23 23
Average 43,913
47,608
Varians(s2) 127,174 151,976
Standard Deviation (S) 11,277 12,327

Appendix 7
SCORE POST-TEST BETWEEN EXPERIMENTAL CLASS
AND CONTROL CLASS
CONTROL (X2) EXPERIMENT (X1)
NO CODE SCORE NO CODE SCORE
1 C-1 75 1 E-1 65
2 C-2 40 2 E-2 90
3 C-3 75 3 E-3 60
4 C-4 75 4 E-4 75
5 C-5 70 5 E-5 80
6 C-6 70 6 E-6 80
7 C-7 80 7 E-7 90
8 C-8 60 8 E-8 80
9 C-9 60 9 E-9 90
10 C-10 55 10 E-10 55
11 C-11 60 11 E-11 75
12 C-12 85 12 E-12 90
13 C-13 70 13 E-13 75
14 C-14 70 14 E-14 80
15 C-15 60 15 E-15 70
16 C-16 55 16 E-16 75
17 C-17 75 17 E-17 70
18 C-18 60 18 E-18 75
19 C-19 70 19 E-19 80
20 C-20 40 20 E-20 65
21 C-21 70 21 E-21 75
22 C-22 75 22 E-22 80
23 C-23 55 23 E-23 45
Sum 1505 1720
N 23 23
Average 65,434 74,782
Varians(s2) 133,893 128,359
Deviation Standard (S) 11,571 11,329

Appendix 8
The Result of Normality Test of Pre-Test of Control Class
Hypothesis
Ho: the data distributes normally
H1: the data does not distribute normally
Hypothesis test
with the criteria
Ho accepted if
Hypothesis test
Maximum Score = 75
Minimum Score = 30
Range (R) = 75-30 = 45
class interval (k) = 1 + 3,3 log 23 = 5,494 = "= 8 kelas"
length of the class (P) = 45/8= 5,63
X
35 -8,70 75,61
50 6,30 39,74
30 -13,70 187,57
50 6,30 39,74
60 16,30 265,83
50 6,30 39,74
30 -13,70 187,57
45 1,30 1,70
35 -8,70 75,61
35 -8,70 75,61
40 -3,70 13,66
75 31,30 979,96
50 6,30 39,74
55 11,30 127,79
35 -8,70 75,61
35 -8,70 75,61
40 -3,70 13,66
40 -3,70 13,66
40 -3,70 13,66
30 -13,70 187,57
55 11,30 127,79
55 11,30 127,79
40 -3,70 13,66
1010,0 5 2798,91
1
16
15
12
5
10
11
14
13
Uji Normalitas Nilai Pre-Test reading skill
Kelas kontrol
6
7
8
9
No.
4
3
2
19
20
21
22
23
18
17
tabelhitung22 oH
XX 2)( XX

Average
(X) = =
1005,043,6957
23
Standard
deviationS
2 =
= 2798,91
(23-1)
= 127,2233202
S = 11,27933155 = 43,6957
Frequency of observation
Class Bk Zi P(Zi) L Ei Oi
29,5 -1,26 -0,3959
30 - 37 1,81 0,1873 4,3 8 3,1639
37,5 -0,55 -0,2086
38 - 45 0,00 0,2721 6,3 6 0,0107
45,5 0,16 0,0635
46 - 53 2,79 0,2441 5,6 4 0,4641
53,5 0,87 0,3076
54 - 61 3,28 0,1351 3,1 4 0,2559
61,5 1,58 0,4428
62 - 69 3,77 0,0462 1,1 0 1,0615
69,5 2,29 0,4889
70 - 75 4,26 0,0548 1,3 1 0,4592
75,5 2,82 0,4976
#REF! X ² = 5,42
with a = 5%, and dk =6- 1 = 5 obtained X ² tabel = 11,07
because X ² count < X ² table, so the data distributes normally
i
ii
E
EO2
N
X
1
)(2
n
XX i
1
)(2
n
XX i

Appendix 9
The Result of Normality Test of Pre-Test of Experimental
Class
Hypothesis
Ho: the data distributes normally
H1: the data does not distribute normally
Hypothesis test
with the criteria
Ho accepted if
Hypothesis test
Maximum Score = 80
Minimum Score = 35
Range (R) = 80-35 = 45
class interval (k) = 1 + 3,3 log 23 = 5,494
length of the class (P) = 8,19 >>> 8
X
35 -12,39 153,54
60 12,61 158,98
35 -12,39 153,54
55 7,61 57,89
50 2,61 6,81
35 -12,39 153,54
35 -12,39 153,54
45 -2,39 5,72
40 -7,39 54,63
35 -12,39 153,54
55 7,61 57,89
80 32,61 1063,33
55 7,61 57,89
70 22,61 511,15
50 2,61 6,81
40 -7,39 54,63
45 -2,39 5,72
45 -2,39 5,72
45 -2,39 5,72
35 -12,39 153,54
55 7,61 57,89
60 12,61 158,98
35 -12,39 153,54
1095,0 5 3344,57
4
No.
1
2
3
5
6
7
8
9
10
11
12
13
16
17
18
14
15
19
20
21
22
23
XX 2)( XX XX 2)( XX
oHtabelhitung
22

Average (X) = 1090,0 47,3913
23
Standard
deviation S
2 =
= 2447,83
(23-1)
= 111,265
= 10,5482= 47,3913
Frequency of observation
34,5 -1,22 -0,3892
35 42 13,23 0,2106 4,8 9 3,5663
42,5 -0,46 -0,1786
43 50 0,00 0,2945 6,8 6 0,0882
50,5 0,29 0,1159
51 58 19,36 0,2380 5,5 4 0,3966
58,5 1,05 0,3539
59 66 22,43 0,1111 2,6 2 0,1208
66,5 1,81 0,4650
67 74 25,49 0,0299 0,7 1 0,0517
74,5 2,57 0,4949
75 80 28,56 0,0042 0,1 1 1,6628
80,5 3,14 0,4992 #REF!
#REF! X ² = 5,89
with a = 5%, and dk = 6 - 1 = 5 obtained X ² tabel = 11,07
because X ² count < X ² table, so the data distributes normally
Ei Oiclass Bk Zi P(Zi) L
N
X
1
)(2
n
XX i
1
)(2
n
XX i
i
ii
E
EO2

Appendix 10
The Result of Homogeneity Test Between Control and
Experimental Class
Hypothesis
Hypothesis test
Ho accepted if F < F(1-a) (nb-1):(nk-1)
F (1-a) (nb-1):(nk-1)
with a = 5% :
dk pembilang = nb - 1 = 23 - 1 = 22
dk penyebut = nk -1 = 23 - 1 = 22
F (0.05)(22:22) = `
eksperimenvariation source
Varians (s2) 151,976 127,174
kontrol
sum 1095 1010
N 23 23
F =151,9763
1,195127,1739
43,91347,609Average (X)
Karena F berada pada daerah penerimaan Ho, maka dapat disimpulkan bahwa kedua
kelompok mempunyai varians yang sama atau homogen
2,048
1,1950 2,048
Standard deviation (s) 12,328 11,277
Daerah penerimaan Ho
Daerah penerimaan Ho
terkecilVarians
terbesarVarians F

Appendix11
T-Test
hypothesis
Ho : =
Ha : ≠
Hypothesi test
where:
Ho accepted if -t(1-1/2a)<t < t(1-1/2a)(n1+n2-2)
Ha accepted untuk harga t lainnya
Dari data diperoleh:
1 + 1
+ 2
1 1
23 23
with a = 5% and dk = 23 + 23 - 2 = 44 it is obtained t(0.025)(44) =
1,061
µ1 µ2
µ1 µ2
variation source eksperimen kontrol
sum 1095 1010
N 23 23
Standard deviation (s) 12,328 11,277
Average 47,609 43,913
Varians (s2) 151,976 127,174
11,814223 23
t47,61 43,91
= 1,061
11,8142 +
2,02
-2,02 2,02
Karena t berada pada daerah penerimaan Ho, maka dapat disimpulkan bahwa ada persamaan pre test
antara kelompok eksperimen dengan kelompok kontrol.
s =127,173923151,976323
Daerah penerimaan Ho
Daerah penolakanHo
21 n
1
n
1 s
xx t 21
2nn
1n1n s
21
222
211
ss

Appendix 12
The Result of Normality Test of Post-Test of Control Class
Hypothesis
Ho: the data distributes normally
H1: the data does not distribute normally
Hypothesis test
with the criteria
Ho accepted if
Hypothesis test
Maximum Score = 85
Minimum Score = 40
Range (R) = 85-40 = 45
class interval (k) = 1 + 3,3 log 23 = 5,494
length of the class (P) = 45/5.5 = 8,19 >>>> 8
X
75 9,57 91,49
40 -25,43 646,93
75 9,57 91,49
75 9,57 91,49
70 4,57 20,84
70 4,57 20,84
80 14,57 212,15
60 -5,43 29,54
60 -5,43 29,54
55 -10,43 108,88
60 -5,43 29,54
85 19,57 382,80
70 4,57 20,84
70 4,57 20,84
60 -5,43 29,54
55 -10,43 108,88
75 9,57 91,49
60 -5,43 29,54
70 4,57 20,84
40 -25,43 646,93
70 4,57 20,84
75 9,57 91,49
55 -10,43 108,88
1505,0 0 2945,65
13
14
3
4
5
6
7
8
9
10
11
12
No.
1
2
15
16
17
18
19
20
21
22
23
tabelhitung22 oH tabelhitung22
XX 2)( XX XX 2)( XX

Average = 1505,0 65,4348
23
Standard deviation
S2
=
2945,65
(23-1)
133,893
S = 11,5712 = 65,4348
frequency of observation
39,5 -2,24 -0,4875
40 47 8,65 0,0481 1,1 2 0,7233
47,5 -1,55 -0,4394
48 55 0,00 0,1347 3,1 3 0,0031
55,5 -0,86 -0,3047
56 63 12,16 0,2383 5,5 5 0,0423
63,5 -0,17 -0,0664
64 71 13,91 0,2663 6,1 6 0,0026
71,5 0,52 0,1999
72 79 15,66 0,1880 4,3 5 0,1057
79,5 1,22 0,3879
80 85 17,41 0,0706 1,6 2 0,0868
85,5 1,73 0,4585 #REF!
#REF! X ² = 0,96
with a = 5%, and dk = 6 - 1 = 5 it is obtained X ² table = 11,07
because X ² count < X ² table, so the data distributes normally
class Bk Zi P(Zi) L Ei Oi
N
X
1
)(2
n
XX i
1
)(2
n
XX i
i
ii
E
EO2

Appendix 13
The Result of Normality Test of Post-Test of Experimental Class
Hypothesis
Ho: the data distributes normally
H1: the data does not distribute normally
Hypothesis test
with the criteria
Ho accepted if
Hypothesis test
Maximum Score = 90
Minimum Score = 45
Range (R) = 90-45 = 45
class interval (k) = 1 + 3,3 log 23 = 5,494
length of the class (P) = 45/5.5 = 8,18 >>>> 8
X
65 -9,78 95,70
90 15,22 231,57
60 -14,78 218,53
75 0,22 0,05
80 5,22 27,22
80 5,22 27,22
90 15,22 231,57
80 5,22 27,22
90 15,22 231,57
55 -19,78 391,35
75 0,22 0,05
90 15,22 231,57
75 0,22 0,05
80 5,22 27,22
70 -4,78 22,87
75 0,22 0,05
70 -4,78 22,87
75 0,22 0,05
80 5,22 27,22
65 -9,78 95,70
75 0,22 0,05
80 5,22 27,22
45 -29,78 887,00
1720,0 0 2823,91
13
14
3
4
5
6
7
8
9
10
11
12
No.
1
2
15
16
17
18
19
20
21
22
23
tabelhitung22
XX 2)( XX XX 2)( XX
oH
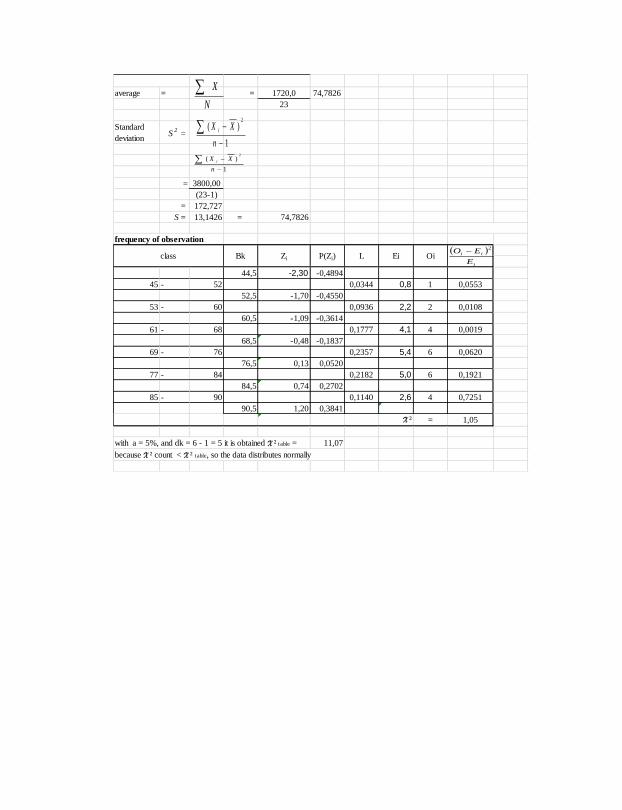
average = = 1720,0 74,7826
23
Standard
deviationS
2 =
= 3800,00
(23-1)
= 172,727
S = 13,1426 = 74,7826
frequency of observation
44,5 -2,30 -0,4894
45 - 52 8,53 0,0344 0,8 1 0,0553
52,5 -1,70 -0,4550
53 - 60 0,00 0,0936 2,2 2 0,0108
60,5 -1,09 -0,3614
61 - 68 11,60 0,1777 4,1 4 0,0019
68,5 -0,48 -0,1837
69 - 76 13,13 0,2357 5,4 6 0,0620
76,5 0,13 0,0520
77 - 84 14,66 0,2182 5,0 6 0,1921
84,5 0,74 0,2702
85 - 90 16,20 0,1140 2,6 4 0,7251
90,5 1,20 0,3841 #REF!
#REF! X ² = 1,05
with a = 5%, and dk = 6 - 1 = 5 it is obtained X ² table = 11,07
because X ² count < X ² table, so the data distributes normally
class Bk Zi P(Zi) L Ei Oi
N
X
1
)(2
n
XX i
1
)(2
n
XX i
i
ii
E
EO2

Appendix 14
The Result of Homogeneity Test Between Control and
Experimental Class
Hypothesis
:
Hypothesis test
Ho accepted if F < F 1/2a (nb-1):(nk-1)
F 1/2a (nb-1):(nk-1)
Dari data diperoleh:
with a = 5%:
dk pembilang = nb - 1 = 23 - 1 = 22
dk penyebut = nk -1 = 23 - 1 = 22
F (0.05)(22:22) = 2,048
1,0431 2,0478
Karena F berada pada daerah penerimaan Ho, maka dapat disimpulkan bahwa kedua kelompok mempunyai varians yang
sama atau homogen
Standard deviation (s) 11,330 11,571
F =133,8930
= 1,043128,3600
Average 74,783 65,435
Varians (s2) 128,360 133,893
Sum 1720 1505
N 23 23
variation source Eksperimen Kontrol
Daerah penerimaan Ho
Daerah penerimaan Ho
terkecilVarians
terbesarVarians F

Appendix 15
T-Test
Hypothesis
Ho : =
Ha : ≠
Hypothesis test
where:
Ha accepted if t count > t(1-a)(n1+n2-2)
Dari data diperoleh:
1 + 1
+ 2
1 1
23 23
with a = 5% and dk = 23 + 23 - 2 = 44 it is obtained t(0.05)(44) =
Karena t berada pada daerah penerimaan Ha, maka dapat disimpulkan bahwa kelompok eksperimen ada perbedaan
dengan kelompok kontrol.
11,451023 23
t =74,78 65,43
= 2,768
11,4510 +
2,02
2,02 2,768
Standard deviation (s) 11,330 11,571
s =23 128,3597 23 133,8933
=
Average 74,783 65,435
Varians (s2) 128,360 133,893
Sum 1720 1505
N 23 23
variation source Eksperimen Kontrol
m1 m2
m1 m2
Daerah penerimaan Ho
Daerah penerimaan Ho
21 n
1
n
1 s
xx t 21
2nn
1n1n s
21
222
211
ss

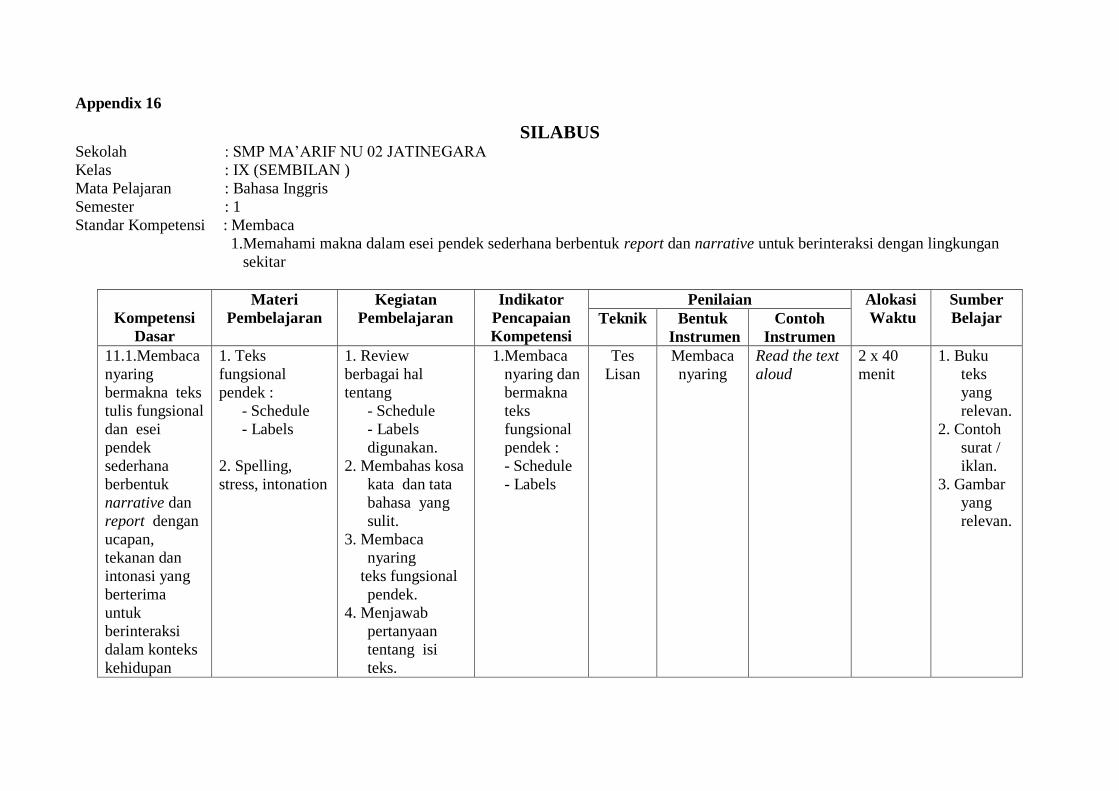
Appendix 16
SILABUS
Sekolah : SMP MA’ARIF NU 02 JATINEGARA
Kelas : IX (SEMBILAN )
Mata Pelajaran : Bahasa Inggris
Semester : 1
Standar Kompetensi : Membaca
1.Memahami makna dalam esei pendek sederhana berbentuk report dan narrative untuk berinteraksi dengan lingkungan
sekitar
Kompetensi
Dasar
Materi
Pembelajaran
Kegiatan
Pembelajaran
Indikator
Pencapaian
Kompetensi
Penilaian Alokasi
Waktu
Sumber
Belajar Teknik Bentuk
Instrumen
Contoh
Instrumen
11.1.Membaca
nyaring
bermakna teks
tulis fungsional
dan esei
pendek
sederhana
berbentuk
narrative dan
report dengan
ucapan,
tekanan dan
intonasi yang
berterima
untuk
berinteraksi
dalam konteks
kehidupan
1. Teks
fungsional
pendek :
- Schedule
- Labels
2. Spelling,
stress, intonation
1. Review
berbagai hal
tentang
- Schedule
- Labels
digunakan.
2. Membahas kosa
kata dan tata
bahasa yang
sulit.
3. Membaca
nyaring
teks fungsional
pendek.
4. Menjawab
pertanyaan
tentang isi
teks.
1.Membaca
nyaring dan
bermakna
teks
fungsional
pendek :
- Schedule
- Labels
Tes
Lisan
Membaca
nyaring
Read the text
aloud
2 x 40
menit
1. Buku
teks
yang
relevan.
2. Contoh
surat /
iklan.
3. Gambar
yang
relevan.

sehari-hari
5. Menentukan
tujuan
komunikatif
teks
terkait.
11.2
Merespon
makna
dalam teks
tulis
fungsional
pendek
secara
akurat,
lancar dan
berterima
untuk
berinteraksi
dalam
konteks
kehidupan
sehari-hari
1. Teks
fungsional
pendek
- Schedule
- Labels
2.Informasi
dalam teks
fungsional
pendek
- gagasan
utama
- informasi
rinci
- informasi
tersirat
- makna kata,
frasa, kalimat
3. Tujuan
Komunikatif
4. Ciri
kebahasaan
1. Tanya jawab
tentang
berbagai hal
terkait materi.
2. Membaca teks
fungsional
pendek.
3. Menjawab
pertanyaan isi
teks.
4. Menjawab
pertanyaan
terkait :
-jenis teks.
-tujuan
komunikatif
-ciri
kebahasaan
-langkah
retorika
Mengident
ifikasi
makna
dalam teks
fungsional
pendek
schedules,
dan surat
labels
Mengidentifikasi
berbagai
informasi
dalam teks
fungsional
pendek
- Schedule
- Labels
Tes
Tulis
Pilihan
Ganda
Choose the
best option,
a, b, c or d
based on the
text.
2 x 40
menit
1. Buku
teks
yang
relevan.
2. Contoh
jadwal
3. Gambar
yang
relevan.
4. Labels
- Obat
-
Makana
n
-
Minum
an

11.3 Meresp
on makna
dan
langkah
retorika
dalam esei
pendek
sederhana
secara
akurat,
lancar dan
berterima
untuk
berinteraksi
dalam
konteks
kehidupan
sehari-hari
dalam teks
berbentuk
narrative
dan report
1.Teks tertulis
berbentuk
- narrative
- report
2.Informasi
dalam teks
monolog
narrative
and report
- gagasan
utama
- informasi
rinci
- informasi
faktual
1. Tanya jawab
tentang
berbagai hal
terkait tema,
topik, jenis
teks.
2. Membaca teks.
3. Menjawab
pertanyaan
tentang isi
teks.
4. Menjawab
pertanyaan
terkait :
1. jenis teks.
2. tujuan
komunikati
f.
3. langkah
retorika
Mengidentifikasi
makna
dalam teks
monolog
berbentuk
narrative
and report.
Mengident
ifikasi
berbagai
informasi
dalam teks
monolog
berbentuk
narrative
and report.
Tes
Tulis
Tes
Tulis
Uraian
Pilihan
ganda
Answer the
questions
based on the
text.
Choose the
best answer
based on the
text
2 x 40
menit
1. Buku
teks
yang
relevan.
2. Contoh
surat /
iklan.
3. Gambar
yang
relevan.
11.4 Membaca
nyaring
bermakna teks
tulis fungsional
dan esei
pendek
sederhana
berbentuk
1.Teks tertulis
narrative/report
terkait tema
tertentu
2. Spelling,
stress, Intonation
1. Tanya jawab
berbagai hal
terkait
tema/topik
bacaan
2. Mendengarkan
teks report
yang
1.Membaca
nyaring dan
bermakna
teks
monolog
berbentuk ;
narrative/R
ep-ort
Tes
lisan
Tes
Membaca
nyaring
Uraian
singkat
Read the text
loudy
Give short
answers !
2x40
menit
1.Buku teks
yang
relevan
2.Teks
otentik
dari
jurnal,
majalah,

narrative dan
report dengan
ucapan,
tekanan dan
intonasi yang
berterima
untuk
berinteraksi
dalam konteks
kehidupan
sehari-hari
dibacakan
guru/teman
3. Menirukan teks
yang dibaca
guru/ teman
4. Membaca
nyaring dengan
ucapan dan
intonasi yang
benar
5. Menjawab
berbagai
pertanyaan
tentang isi
bacaan
2.Mengidenti
fikasi
berbagai
informasi
dalam teks
monolog
lisan koran
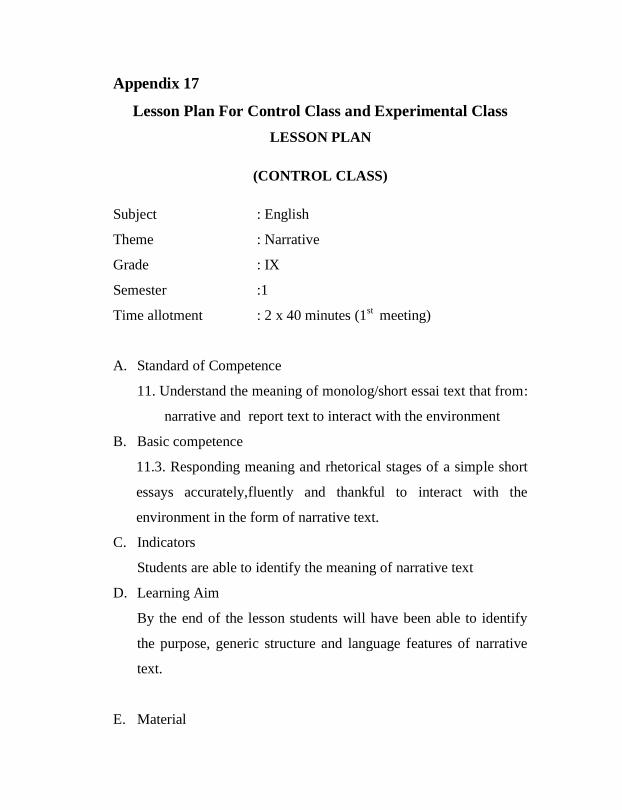
Appendix 17
Lesson Plan For Control Class and Experimental Class
LESSON PLAN
(CONTROL CLASS)
Subject : English
Theme : Narrative
Grade : IX
Semester :1
Time allotment : 2 x 40 minutes (1st
meeting)
A. Standard of Competence
11. Understand the meaning of monolog/short essai text that from:
narrative and report text to interact with the environment
B. Basic competence
11.3. Responding meaning and rhetorical stages of a simple short
essays accurately,fluently and thankful to interact with the
environment in the form of narrative text.
C. Indicators
Students are able to identify the meaning of narrative text
D. Learning Aim
By the end of the lesson students will have been able to identify
the purpose, generic structure and language features of narrative
text.
E. Material
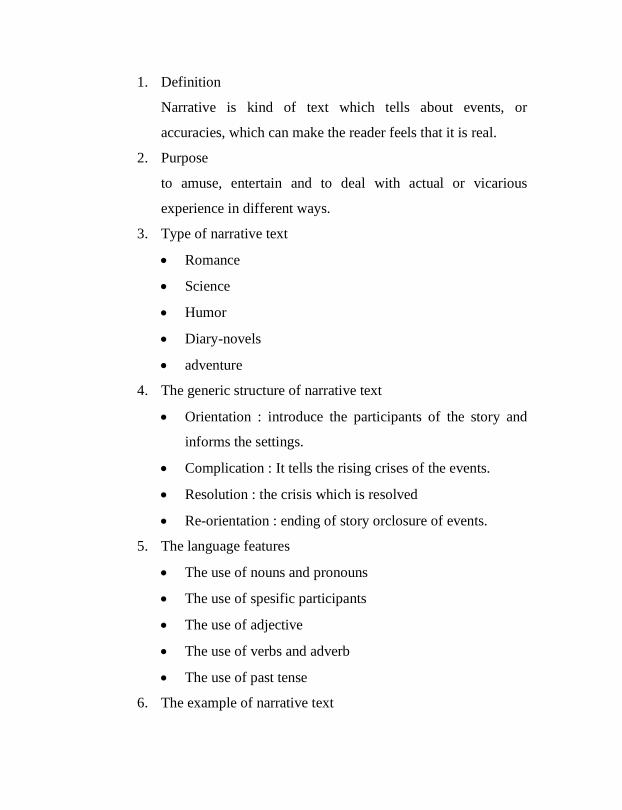
1. Definition
Narrative is kind of text which tells about events, or
accuracies, which can make the reader feels that it is real.
2. Purpose
to amuse, entertain and to deal with actual or vicarious
experience in different ways.
3. Type of narrative text
Romance
Science
Humor
Diary-novels
adventure
4. The generic structure of narrative text
Orientation : introduce the participants of the story and
informs the settings.
Complication : It tells the rising crises of the events.
Resolution : the crisis which is resolved
Re-orientation : ending of story orclosure of events.
5. The language features
The use of nouns and pronouns
The use of spesific participants
The use of adjective
The use of verbs and adverb
The use of past tense
6. The example of narrative text
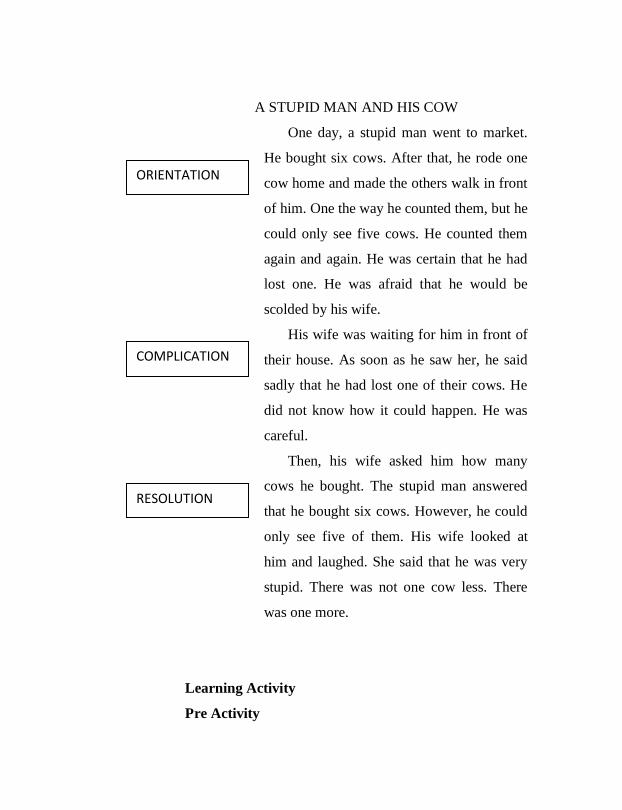
A STUPID MAN AND HIS COW
One day, a stupid man went to market.
He bought six cows. After that, he rode one
cow home and made the others walk in front
of him. One the way he counted them, but he
could only see five cows. He counted them
again and again. He was certain that he had
lost one. He was afraid that he would be
scolded by his wife.
His wife was waiting for him in front of
their house. As soon as he saw her, he said
sadly that he had lost one of their cows. He
did not know how it could happen. He was
careful.
Then, his wife asked him how many
cows he bought. The stupid man answered
that he bought six cows. However, he could
only see five of them. His wife looked at
him and laughed. She said that he was very
stupid. There was not one cow less. There
was one more.
Learning Activity
Pre Activity
ORIENTATION
COMPLICATION
RESOLUTION

Apperception (15 minutes)
Greating (Assalamualaikum Wr Wb)
Teacher checks the students’ attendance
Teacher guide the studints to pray/ recite basmallah
Teacher tells the students the learning aim
Main Activity (55 minutes)
1) Building Knowledge of the Field (BkoF)
Teacher ask to the students about the story which
is their like
Teacher show the pictures about the story which
will be discuss and the students have to guess the
picture.
Teacher explain that the story include naarative.
2) Modeling of the Text (MoT)
Teacher explains the definition of narrative text
and some part of narrative text.
Teacher gives an example of narrative text
Teacher ask students to show parts of narrative
text based on the explanation.
Teacher gives another narrative text and the
students have to identify the narrative texts
3) Joint Construction of the Text (JcoT)
Teacher ask students to write down the result on
the blackboard then it discuss together

Teacher gives time to students to ask about the
difficult words
4) Independent Construction of the Text (ICoT)
Teacher gives evaluation about the topic
Post Activity (10 minutes)
The teacher gives feedback and conclusion
The teacher close the class by recite hamdalah
F. Teaching Method
Method : discussion
G. Media
- Slide
- worksheet
H. Assesment
Instrument : Test
Scoring guide :
- Every correct answer scored 1
- Maximum score 20 x 5 = 100
- The Students’ score the correct answer x 100
Total item


LESSON PLAN
(EXSPERIMENTAL CLASS)
Subject : English
Theme : Narrative
Grade : IX
Semester : 1
Time allotment : 2 x 40 minutes (2nd
meeting)
A. Standard of Competence
11. Understand the meaning of monolog/short essai text that from:
narrative and report text to interact with the environment
B. Basic competence
11.3. Responding meaning and rhetorical stages of a simple short
essays accurately,fluently and thankful to interact with the
environment in the form of narrative text.
C. Indicators
Students are able to identify the meaning of narrative text
D. Learning Aim
By the end of the lesson students will have been able to identify
the purpose, generic structure and language features of narrative
text.

E. Material
1. Definition
Narrative is kind of text which tells about events, or
accuracies, which can make the reader feels that it is real.
2. Purpose
to amuse, entertain and to deal with actual or vicarious
experience in different ways.
3. Type of narrative text
Romance
Science
Humor
Diary-novels
adventure
4. The generic structure of narrative text
Orientation : introduce the participants of the story and
informs the settings.
Complication : It tells the rising crises of the events.
Resolution : the crisis which is resolved
Re-orientation : ending of story orclosure of events.
5. The language features
The use of nouns and pronouns
The use of spesific participants
The use of adjective
The use of verbs and adverb
The use of past tense

6. The example of narrative text
THE THIRSTY CROW
One hot day, a thirsty crow flew all
over the fields looking for water. For a
long time, she could not find anything.
She felt very weak, almost giving up
hope.
Suddenly, she saw a water jug
below her. She flew straight down to
see if there was any water inside. Yes,
she could see some water inside the
jug!
The crow tried to push her head
into the jug. Sadly she found that the
neck of the jug was too narrow. Then
she tried to push the jug down for the
water to flow out. She found that the
jug was too heavy.
The crow thought hard for a while.
Then looking around her, she saw some
pebbles. She suddenly had a good idea.
She started picking up the pebbles one
by one, dropping each into the jug. As
more and more pebbles filled the jug,
the water kept rising. Soon it was high
ORIENTATION
COMPLICATION
RESOLUTION

enough for the crow to drink. Her plan
had worked.
Learning Activity
Pre Activity
Apperception (15 minutes)
Greating (Assalamualaikum Wr Wb)
Teacher checks the students’ attendance
Teacher guide the studints to pray/ recite basmallah
Teacher tells the students the learning aim
Main Activity (55 minutes)
1) Building Knowledge of the Field (BkoF)
Teacher gives the prievew about the previous
lesson
Teacher show the pictures about the story which
will be discuss and the students have to guess the
picture.
Teacher explain that the story include naarative.
2) Modeling of the Text (MoT)
Teacher explains the definition of narrative text
and some part of narrative text.
Teacher gives another example of narrative text
Students identify the generic structure of
narrative tex

3) Joint Construction of the Text (JcoT)
Teacher give the reading passage of narrative text
for students to read and informs to the students
how to find the main idea. (Preview)
Teacher Inform the students to pay attention to
the meaning of the passage, the generic structure
of narrative text and give students’ assignments
to make the question of the main idea that found
using the words what, why, who, and
how.(Question)
Teacher Instructs the students to read and
respond / answer the questions that had been
prepared before.(Read)
Teacher Simulating / inform the materials on
reading material.(Reflect)
Teacher Ask students to make the essence of the
whole discussion about narrative text (Recite)
Ask students to read the essence that made from
the details of narrative and ask students to read
back the reading material, if still not sure with
their answer.(Review)
4) Independent Construction of the Text (ICoT)
Teacher devide students into groups
Teacher Give another narrative text to each group

Teacher Ask students to identify the topic, parts
of narrative and language features of narrative in
their group by using PQ4R strategy
Teacher choose some group to present their
discussion result
Post Activity (10 minutes)
The teacher gives feedback and conclusion
The teacher close the class by recite hamdalah
F. Teaching Method
Method : discussion
Model : PQ4R
G. Media
- Slide
- worksheet
H. Assesment
Instrument : Test
Scoring guide :
- Every correct answer scored 1
- Maximum score 20 x 5 = 100
- The Students’ score the correct answer x 100
Total item


Appendix 18
INSTRUMENT OF PRE-TEST AND POST TEST
INSTRUMENT FOR PRE TEST
Choose the best answer based on the following question!
The following text is for question 1 to 3.
Once upon a time there was a girl name Cindrella. She lived
with her bad step-mother and two step-sisters. She had to do all the
household chores.
One day the king invited all the ladies in the kingdom to go to
a ball (pesta dansa) in the palace. He wanted to find the Crown
Prince a wife. The step sisters went to the ball that night with their
mother. Cindrella was left alone. She cried because she actually
wanted to go to the ball, too.
Just then a fairy godmother came. With her magic wand, she
gave Cindrella a coach (kereta), two horses and footmen. She also
gave Cindrella a lovely dress to wear the ball and a pair of glass
slippers. She told Cindrella to come home before midnight.
At the ball, Cindrella danced all night with the Prince. The
Prince fell in love with her. At midnight, Cindrella ran home.
Unfortunately, one of her slippers slipped off at the door. She did not
have time to put it back on. The Prince was sad as he could not find
Cindrella again that night.
The next day, the Prince and his men brought along the glass
slipper. They went all over the Kingdom to search for the owner. After
searching for along time, finally, they came to Cindrella’s house. The

slipper fit her. The prince was very happy to find Cindrella again.
They got married and lived ever after.
Adapted from http://abidtinfaz.blogspot.com/2015/01/soal-bahasa-
inggris-narrative-text-dan.html,12 juni 18:47
1. What is the purpose of the text above?
a. To entertain readers with an actual, or vicarious experience
b. To inform what happened in the past
c. To give a description of a beautiful girl
d. To retell about Cindrella’s experience/memory
2. What was there at the palace one day?
a. A game c. A birthday party
b. A ball d. Crown part
3. Why did the king hold the event at his palace?
a. To celebrate his birthday d. To entertain his people
b. To celebrate his wedding
c. To find his crown prince a wife
The following text is for question 4 to 9.
A STUPID MAN AND HIS COWS
One day, a stupid man went to market. He bought six cows.
After that, he rode one cow home and made the others walk in front of
him. One the way he counted them, but he could only see five cows.
He counted them again and again. He was certain that he had lost one.
He was afraid that he would be scolded by his wife.
His wife was waiting for him in front of their house. As soon
as he saw her, he said sadly that he had lost one of their cows. He did
not know how it could happen. He was careful.
Then, his wife asked him how many cows he bought. The
stupid man answered that he bought six cows. However, he could only

see five of them. His wife looked at him and laughed. She said
that he was very stupid. There was not one cow less. There was one
more.
Adapted from http://www.pitt.edu
Choose the correct answer by crossing a, b, c, or d!
4. How many cows did the stupid man buy?
a. One d. Six
b. Four
c. Five
5. On his way home, how many cows did he see?
a. One d. Six
b. Four
c. Five
6. Which of the following statements is true according to the
text?
a. The stupid man spent much money on cows
b. The stupid man was scolded by his wife
c. The stupid man thought that he had lost one of his cows
d. The stupid man lost one cow on his way home
7. What does the word “them” in paragraph 1 line 3 refer to?
a. The other d. The lost cows
b. The cows
c. The home
8. Which of the following words is the synonim of “stupid”?
a. Unlucky d. Dull
b. Dilligent
c. Clever

9. Which of the following words is the antonym of “certain”?
a. Sure d. Positive
b. Unsure
c. Of course
The following text is for question 10 to 13.
THE THIRSTY CROW
One hot day, a thirsty crow flew all over the fields looking for
water. For a long time, she could not find anything. She felt very
weak, almost giving up hope.
Suddenly, she saw a water jug below her. She flew straight
down to see if there was any water inside. Yes, she could see some
water inside the jug!
The crow tried to push her head into the jug. Sadly she found
that the neck of the jug was too narrow. Then she tried to push the jug
down for the water to flow out. She found that the jug was too heavy.
The crow thought hard for a while. Then looking around her,
she saw some pebbles. She suddenly had a good idea. She started
picking up the pebbles one by one, dropping each into the jug.
As more and more pebbles filled the jug, the water kept rising.
Soon it was high enough for the crow to drink. Her plan had worked.
Adapted from kumpulan soal bahasa inggris
10. The thirsty crow flew all over the field because...
a. She felt very weak d. She was looking for water
b. She couldn’t find any water
c. She couldn’t find anything

11. She saw some pebbles (last paragraph) The underlined word
means...
a. Little animal’s d. Little stones
b. Big rocks
c. Little leaves
12. The complications of the text are found in...
a. Paragraph 1 and 2 d. Paragraph 3 and 4
b. Paragraph 2 and 3 e. Paragraph 1 and 3
c. Paragraph 2 and 4
13. What is the moral value of the text above?
a. If someone has a problem we must try hard to help him
b. Don’t be afraid to do something although it is very
dangerous
c. If you want something you must do it by yourself
d. If you try hard enough you may soon find the answer to
your problem
The following text is for question 14 to 16.
THE RABBIT AND CROCODILE
Once upon a time, a rabbit wanted to cross a river but he
could not swim. He had an idea. He saw a boss of crocodile
swimming in the river. The rabbit asked the boss of crocodile, "How
many crocodiles are there in the river?" The boss of crocodile
answered, "We are twenty here." "Where are they?" the rabbit asked
for the second time. "What is it for?" the boss of crocodile asked.
"All of you are good, nice, gentle and kind, so I want to make
a line in order. Later I will know how kind you are," said the rabbit.

Then, the boss of the crocodile called all his friends and asked them to
make a line in order from one side to the other side of the river. Just
then, the rabbit started to count while jumping from one crocodile to
another: one ... two ... three ... four ... until twenty, and finally, he
thanked all crocodiles because he had crossed the river.
Adapted from http://understandingtext.blogspot.com
14. The story mainly tells us about...
a. Twenty crocodiles
b. The boss of the crocodile
c. A rabbit and twenty crocodiles
d. A rabbit and the boss of crocodile
15. We know from the first paragraph that the rabbit actually
wanted...
a. To cross the river
b. To swim across the river
c. To meet the boss of crocodile
d. To know where the crocodiles are
16. “All of you are good, nice, gentle, and kind ..." (Paragraph 2)
The underlined word is synonymous with...
a. Wild
b. Diligent
c. Cheerful
d. Easygoing

The following text is for question 17 to 20.
A FISHERMAN AND A FISH
A long time ago, there lived fisherman. One day he had been
fishing all day, but he did not catch anything. In the evening, he
caught a very small fish.
The fish said, “Please don’t eat me. Please, I am too small to
make you good dinner. Please, throw me back to the water. Later,
when I grow bigger, you come back and catch me again.” “No” said
the fisherman. “I am to keep you. If you get back into the water, you
take very good care, and you will never come near me again.”
Then the fisherman put the poor little fish and his pond at the
backyard. When the fish grew bigger, it becomes a good friend of the
fisherman. He never wanted to eat the fish.
Adapted from kumpulan soal bahasa inggris
17. What is the purpose of the text?
a. To tell how to do something step by step
b. To entertain the readers
c. To tell past events
d. To describe a person or place
18. Below is what the fish asked the fisherman to do, except…
a. Not to eat him
b. To throw him back to the water
c. To come back and catch him again when he grew bigger
d. To make him a good dinner

19. What did the fisherman do to the fish?
a. He took care of the fish
b. He ate him
c. He sold him
d. He gave him to another person
20. What happened between the fisherman and the fish at last…?
a. The fisherman eat the fish
b. The fisherman became a good friend with him
c. The fish made a good house for the fisherman
d. The fish gave the fisherman everything he wanted
-Good Luck-

INSTRUMENT FOR POST-TEST
Choose the best answer based on the following question!
The following text is for question 1 to 3.
THE RABBIT AND CROCODILE
Once upon a time, a rabbit wanted to cross a river but he
could not swim. He had an idea. He saw a boss of crocodile
swimming in the river. The rabbit asked the boss of crocodile, "How
many crocodiles are there in the river?" The boss of crocodile
answered, "We are twenty here." "Where are they?" the rabbit asked
for the second time. "What is it for?" the boss of crocodile asked.
"All of you are good, nice, gentle and kind, so I want to make
a line in order. Later I will know how kind you are," said the rabbit.
Then, the boss of the crocodile called all his friends and asked them to
make a line in order from one side to the other side of the river. Just
then, the rabbit started to count while jumping from one crocodile to
another: one ... two ... three ... four ... until twenty, and finally, he
thanked all crocodiles because he had crossed the river.
Adapted from http://understandingtext.blogspot.com
1. The story mainly tells us about...
a. Twenty crocodiles
b. The boss of the crocodile
c. A rabbit and twenty crocodiles
d. A rabbit and the boss of crocodile

2. We know from the first paragraph that the rabbit actually
wanted...
a. To cross the river
b. To swim across the river
c. To meet the boss of crocodile
d. To know where the crocodiles are
3. “All of you are good, nice, gentle, and kind ..." (Paragraph 2) The
underlined word is synonymous with...
a. Wild
b. Diligent
c. Cheerful
d. Easygoing
The following text is for question 4 to 6.
Once upon a time there was a girl name Cindrella. She lived
with her bad step-mother and two step-sisters. She had to do all the
household chores.
One day the king invited all the ladies in the kingdom to go to
a ball (pesta dansa) in the palace. He wanted to find the Crown
Prince a wife.The step sisters went to the ball that night with their
mother. Cindrella was left alone. She cried because she actually
wanted to go to the ball, too.
Just then a fairy godmother came. With her magic wand, she
gave Cindrella a coach (kereta), two horses and footmen. She also
gave Cindrella a lovely dress to wear the ball and a pair of glass
slippers. She told Cindrella to come home before midnight.

At the ball, Cindrella danced all night with the Prince. The
Prince fell in love with her. At midnight, Cindrella ran home.
Unfortunately, one of her slippers slipped off at the door. She did not
have time to put it back on. The Prince was sad as he could not find
Cindrella again that night.
The next day, the Prince and his men brought along the glass
slipper. They went all over the Kingdom to search for the owner. After
searching for along time, finally, they came to Cindrella’s house. The
slipper fit her. The prince was very happy to find Cindrella again.
They got married and lived ever after.
Adapted from http://abidtinfaz.blogspot.com/2015/01/soal-bahasa-
inggris-narrative-text-dan.html,12 juni 18:47
4. What is the purpose of the text above?
a. To entertain readers with an actual, or vicarious experience
b. To inform what happened in the past
c. To give a description of a beautiful girl
d. To retell about Cindrella’s experience/memory
5. What was there at the palace one day?
a. A game c. A birthday party
b. A ball d. Crown part
6. Why did the king hold the event at his palace?
a. To celebrate his birthday d. To entertain his people
b. To celebrate his wedding
c. To find his crown prince a wife

The following text is for question 7 to 10.
THE THIRSTY CROW
One hot day, a thirsty crow flew all over the fields looking for
water. For a long time, she could not find anything. She felt very
weak, almost giving up hope.
Suddenly, she saw a water jug below her. She flew straight
down to see if there was any water inside. Yes, she could see some
water inside the jug!
The crow tried to push her head into the jug. Sadly she found
that the neck of the jug was too narrow. Then she tried to push the jug
down for the water to flow out. She found that the jug was too heavy.
The crow thought hard for a while. Then looking around her,
she saw some pebbles. She suddenly had a good idea. She started
picking up the pebbles one by one, dropping each into the jug.
As more and more pebbles filled the jug, the water kept
rising. Soon it was high enough for the crow to drink. Her plan had
worked.
Adapted from kumpulan soal bahasa inggris
7. The thirsty crow flew all over the field because...
a. She felt very weak d. She was looking
for water
b. She couldn’t find any water
c. She couldn’t find anything
8. She saw some pebbles (last paragraph) The underlined word
means...

a. Little animal’s d. Little stones
b. Big rocks
c. Little leaves
9. The complications of the text are found in...
a. Paragraph 1 and 2 d. Paragraph 3 and 4
b. Paragraph 2 and 3 e. Paragraph 1 and 3
c. Paragraph 2 and 4
10. What is the moral value of the text above?
a. If someone has a problem we must try hard to help him
b. Don’t be afraid to do something although it is very
dangerous
c. If you want something you must do it by yourself
d. If you try hard enough you may soon find the answer to
your problem
The following text is for question 11to 14.
A FISHERMAN AND A FISH
A long time ago, there lived fisherman. One day he had been
fishing all day, but he did not catch anything. In the evening, he
caught a very small fish.
The fish said, “Please don’t eat me. Please, I am too small to
make you good dinner. Please, throw me back to the water. Later,
when I grow bigger, you come back and catch me again.” “No” said
the fisherman. “I am to keep you. If you get back into the water, you
take very good care, and you will never come near me again.”

Then the fisherman put the poor little fish and his pond at the
backyard. When the fish grew bigger, it becomes a good friend of the
fisherman. He never wanted to eat the fish.
Adapted from kumpulan soal bahasa inggris
11. What is the purpose of the text?
a. To tell how to do something step by step
b. To entertain the readers
c. To tell past events
d. To describe a person or place
12. Below is what the fish asked the fisherman to do, except…
a. Not to eat him
b. To throw him back to the water
c. To come back and catch him again when he grew bigger
d. To make him a good dinner
13. What did the fisherman do to the fish?
a. He took care of the fish
b. He ate him
c. He sold him
d. He gave him to another person
14. What happened between the fisherman and the fish at last…?
a. The fisherman eat the fish
b. The fisherman became a good friend with him
c. The fish made a good house for the fisherman
d. The fish gave the fisherman everything he wanted
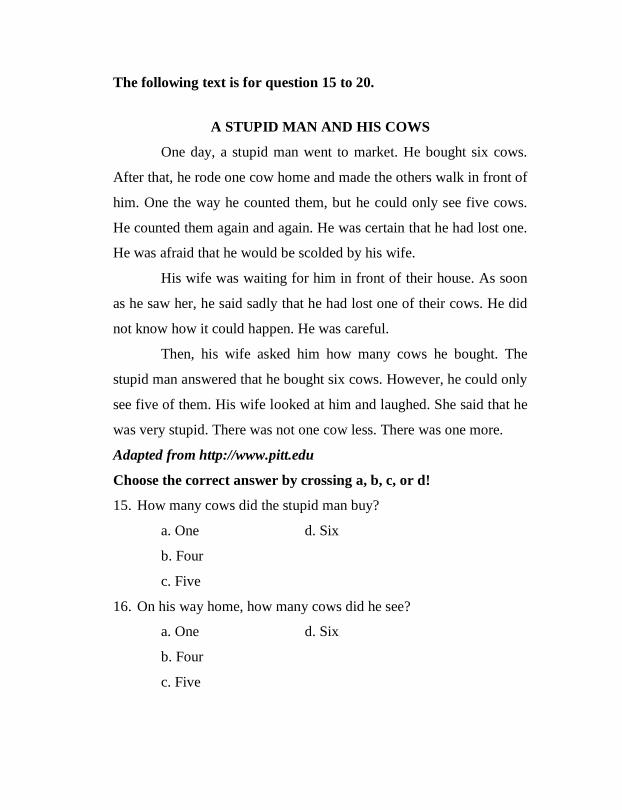
The following text is for question 15 to 20.
A STUPID MAN AND HIS COWS
One day, a stupid man went to market. He bought six cows.
After that, he rode one cow home and made the others walk in front of
him. One the way he counted them, but he could only see five cows.
He counted them again and again. He was certain that he had lost one.
He was afraid that he would be scolded by his wife.
His wife was waiting for him in front of their house. As soon
as he saw her, he said sadly that he had lost one of their cows. He did
not know how it could happen. He was careful.
Then, his wife asked him how many cows he bought. The
stupid man answered that he bought six cows. However, he could only
see five of them. His wife looked at him and laughed. She said that he
was very stupid. There was not one cow less. There was one more.
Adapted from http://www.pitt.edu
Choose the correct answer by crossing a, b, c, or d!
15. How many cows did the stupid man buy?
a. One d. Six
b. Four
c. Five
16. On his way home, how many cows did he see?
a. One d. Six
b. Four
c. Five
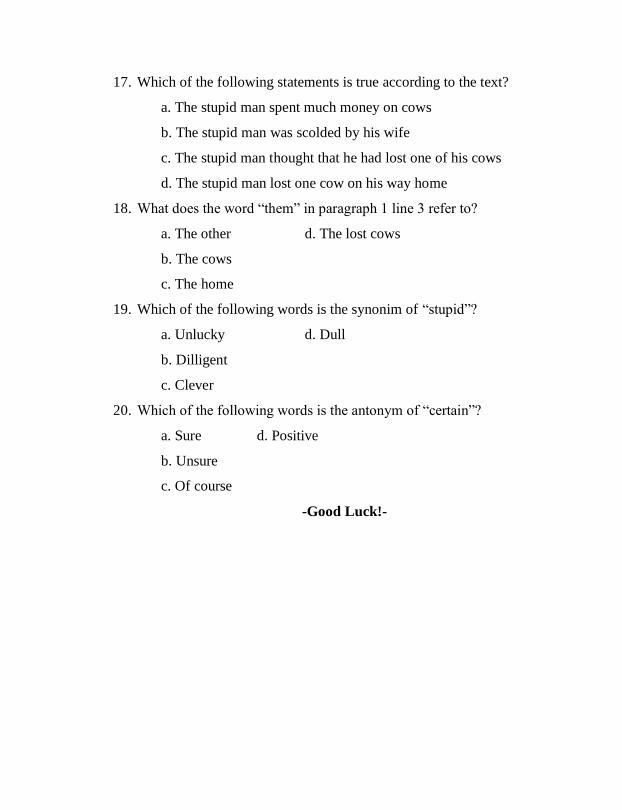
17. Which of the following statements is true according to the text?
a. The stupid man spent much money on cows
b. The stupid man was scolded by his wife
c. The stupid man thought that he had lost one of his cows
d. The stupid man lost one cow on his way home
18. What does the word “them” in paragraph 1 line 3 refer to?
a. The other d. The lost cows
b. The cows
c. The home
19. Which of the following words is the synonim of “stupid”?
a. Unlucky d. Dull
b. Dilligent
c. Clever
20. Which of the following words is the antonym of “certain”?
a. Sure d. Positive
b. Unsure
c. Of course
-Good Luck!-

Appendix 19
The Answer Key of Pre-Test and Post-Test
THE ANSWER KEY FOR PRE-TEST
No. No.
1. A 11. D
2. B 12. B
3. C 13. D
4. D 14. C
5. C 15. A
6. C 16. D
7. B 17. C
8. D 18 D
9. B 19. A
10. B 20. B
THE ANSWER KEY FOR POST TEST
No. No.
1. C 11. C
2. A 12. D
3. D 13. A
4. A 14. B
5. B 15. D
6. C 16. C
7. B 17. C
8. D 18 B
9. B 19. D
10. D 20. B

KISI-KISI PRE-TEST
Dependent variable
The improvement of students’ reading
comprehension in narrative text
Question
Number
1. Identifying variation of sentence structure
in narrative text
7, 8, 9, 16
2. Identifying rhetorical stages of the text 3
3. Identifying communicative purpose
(information) of the text
1, 17
4. Identifying main idea of a paragraph 14
5. Identifying meaning of words in the text 11
6. Identifying sentence meaning in the text 6
7. Identifying the generic structure of the text 2,4, 5, 10, 12,
13, 15, 18, 19,
20.

KISI-KISI POST-TEST
Dependent variable
The improvement of students’ reading
comprehension
in narrative text
Question
Number
1. Identifying variation of sentence structure
in narrative text
3, 18, 19, 20
2. Identifying rhetorical stages of the text 6
3. Identifying communicative purpose
(information) of the text
4, 11
4. Identifying main idea of a paragraph 1
5. Identifying meaning of words in the text 7
6. Identifying sentence meaning in the text 17
7. Identifying the generic structure of the text 2,5, 8, 9, 10, 12,
13, 14, 15, 16.

Appendix 20
OBSERVATION CHECKLIST
No. Activities Score Description
1. Students’ ability in understanding
narrative text
1 Very low
2 Low
3 High enough
4 High
5 Very high
2. Students’ ability in identifying
communicative purpose of the text
1 Very low
2 Low
3 High enough
4 High
5 Very high
3. Students’ ability in identifying
rethorical stage of the text
1 Very low
2 Low
3 High enough
4 High
5 Very high
4. Students’ comprehension in
identifying main idea of the text
1 Very low
2 Low
3 High enough
4 High
5 Very high
5. Students’ comprehension in
identifying the generic structure of
the text
1 Very low
2 Low
3 High enough
4 High
5 Very high
6. Students’ ability in identifying
sentence meaning of the text
1 Very low
2 Low
3 High enough
4 High
5 Very high
7. Students’ enjoyment in learning
process
1 Very
uninterested
2 Uninterested

No. Activities Score Description
3 Interested
enough
4 Interested
5 Very interested
8. Students’ seriousness in
understanding material
1 Very Unserious
2 Unserious
3 Seriousenough
4 Serious
5 Very serious
Total score 40
Score of class situation = 100%ScoreMaximum
ScoreTotal
Poor 0 – 35%
Fair 40 – 59%
Average 60 – 74%
Good 75 – 84%
Excellent 85 – 100%

OBSERVATION CHEKLIST FOR EXPERIMENT CLASS
No. Activities Score Description
1. Students’ ability in understanding
narrative text
1 Very low
2 Low
3 High enough
4 √ High
5 Very high
2. Students’ ability in identifying
communicative purpose of the text
1 Very low
2 Low
3√ High enough
4 High
5 Very high
3. Students’ ability in identifying
rethorical stage of the text
1 Very low
2 Low
3√ High enough
4 High
5 Very high
4. Students’ comprehension in
identifying main idea of the text
1 Very low
2 Low
3 High enough
4 High
5√ Very high
5. Students’ comprehension in
identifying the generic structure of
the text
1 Very low
2 Low
3√ High enough
4 High
5 Very high
6. Students’ ability in identifying
sentence meaning of the text
1 Very low
2 Low
3√ High enough
4 High
5 Very high
7. Students’ enjoyment in learning
process
1 Very
uninterested
2 Uninterested
3 Interested

No. Activities Score Description
enough
4 Interested
5√ Very interested
8. Students’ seriousness in
understanding material
1 Very Unserious
2 Unserious
3 Seriousenough
4√ Serious
5 Very serious
Total score 32
Score of class situation = 100%40
32
= 80 %
Based on the result above it belongs to good criteria
Poor 0 – 35%
Fair 40 – 59%
Average 60 – 74%
Good 75 – 84%
Excellent 85 – 100%

OBSERVATION CHEKLIST FOR CONTROL CLASS
No. Activities Score Description
1. Students’ ability in understanding
narrative text
1 Very low
2 Low
3√ High enough
4 High
5 Very high
2. Students’ ability in identifying
communicative purpose of the text
1 Very low
2 Low
3√ High enough
4 High
5 Very high
3. Students’ ability in identifying
rethorical stage of the text
1 Very low
2 Low
3√ High enough
4 High
5 Very high
4. Students’ comprehension in
identifying main idea of the text
1 Very low
2 Low
3 High enough
4√ High
5 Very high
5. Students’ comprehension in
identifying the generic structure of
the text
1 Very low
2 Low
3 High enough
4√ High
5 Very high
6. Students’ ability in identifying
sentence meaning of the text
1 Very low
2 Low
3√ High enough
4 High
5 Very high
7. Students’ enjoyment in learning
process
1 Very
uninterested
2 Uninterested
3√ Interested

No. Activities Score Description
enough
4 Interested
5 Very interested
8. Students’ seriousness in
understanding material
1 Very Unserious
2 Unserious
3√ Seriousenough
4 Serious
5 Very serious
Total score 26
Score of class situation = 100%40
26
= 65 %
Based on the result above it belongs to Average criteria
Poor 0 – 35%
Fair 40 – 59%
Average 60 – 74%
Good 75 – 84%
Excellent 85 – 100%

Appendix 21
Documentation of Research
Pre-test in Experimental Class Pre-test in Control Class
Treatment in Experimental Class

Treatment in Control Class
Post-test in Experimental Class Post-test in Control Class


CURRICULUM VITAE
Name : Anizul Fatuni’mah
Place and date of birth : Tegal, 5th
December 1993
Original address : Kalijambu, Bojong, Tegal
Dormitory address : Margoyoso II Street tambakaji, Ngaliyan,
Semarang
Mobile number : 087-830-395-639
Education : 1. SDN Kalijambu
2. MTS NU Hasyim Asy’ari Bojong
3. MAN Babakan-Lebaksiu-Tegal
4. Student of Education and Teacher
Training Faculty Walisongo State
Islamic University Semarang 2011
Semarang, 15 November 2015
The Researcher
Anizul Fatuni’mah
113411017