Embed Size (px)
Citation preview

Teaching Randomization-based Methods in an Introductory
Statistics Course: ���The CATALST Curriculum
Robert delMas!University of Minnesota
NSF DUE-08144333!!!
Workshop materials developed in collaboration with !Andrew Zieffler and Nicola Parker!

Overview of Workshop • Overview/background of CATALST course!
• Example course activities (Unit 1)!‣ Matching Dogs to Owners!
• Example course activities (Unit 2)!‣ Sleep Deprivation!
• Example course activities (Unit 3)!‣ Kissing the “Right” Way!

Overview/Background of CATALST
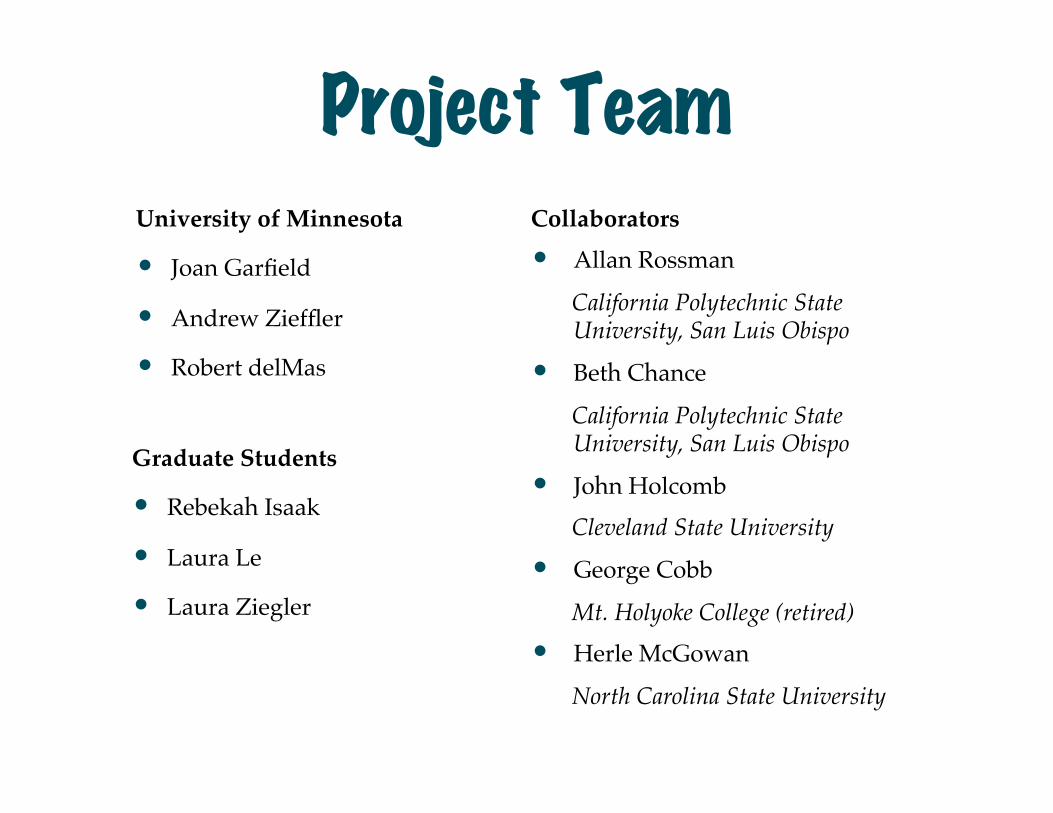
Project Team University of Minnesota!
• Joan Garfield!
• Andrew Zieffler!
• Robert delMas
Collaborators!
• Allan Rossman!
California Polytechnic State University, San Luis Obispo!
• Beth Chance!
California Polytechnic State University, San Luis Obispo!
• John Holcomb!Cleveland State University!
• George Cobb!
Mt. Holyoke College (retired)!• Herle McGowan!
North Carolina State University
Graduate Students!
• Rebekah Isaak!
• Laura Le!
• Laura Ziegler

Course Pedagogy • Course activities designed to develop students’
statistical reasoning and promote transfer !
‣ Based on research in cognition and learning!
‣ Instructional design principles!
• Student-centered approach!
‣ Cooperative groups!
• Minimal lectures (“just-in-time” as needed)!
‣ Small-group and class discussion

Course Emphasis: Inference The core logic of inference as the foundation
(Cobb, 2007)!
• Specify a Model: Specify a model to reasonably approximate the variation in outcomes attributable to the random process!
• Randomize & Repeat: Use the model to generate simulated data and collect a summary measure!
• Evaluate: Examine the distribution of the resulting summary measures

Course Content • No t-tests; Use of probability for simulation and
modeling (TinkerPlotsTM) !
• Coherent curriculum that builds ideas of models, chance, simulated data & inference from first day!
• Immersion in statistical thinking!
• Activities and homework assignments are based on actual research studies using real data

Three Course Units ���15 Week Semester
• Unit 1: Modeling and Simulation !‣ Building and using probability models!‣ Learning to use the core logic of inference!
• Unit 2: Comparing Groups!‣ Randomization Tests!‣ Design: Random Assignment and Random Sampling!
• Unit 3: Sampling and Estimation!‣ Standard Error of a Sample Statistic (Bootstrapping)!‣ Confidence Intervals

TinkerPlots™ Software • TinkerPlots™ was chosen because of its unique
visual capabilities for simulation!
‣ Allows students to see the random devices they select (e.g., sampler, spinner)!
‣ Easily use models to simulate and collect data!
‣ Allows students to visually examine and evaluate distributions of statistics!
• The author, Cliff Konold, is currently seeking a new publisher for TinkerPlots™

Resources���
https://github.com/zief0002/Statistical-Thinking Textbook and data
http://www.tc.umn.edu/~catalst/ More information, lesson plans, etc.

Example Course Activity Unit 1
Modeling & Simulation

• Course Location: Unit 1: Modeling and Simulation!
• Learning Goals: (1) Begin to develop understanding of the reasoning process of statistical inference; (2) Understand that if an observed result is very unlikely under a particular model, then the result provides strong evidence against that particular model!
• Preparation:!
‣ Introduction to Statistical Hypothesis Testing [textbook]
Matching Dogs to Owners
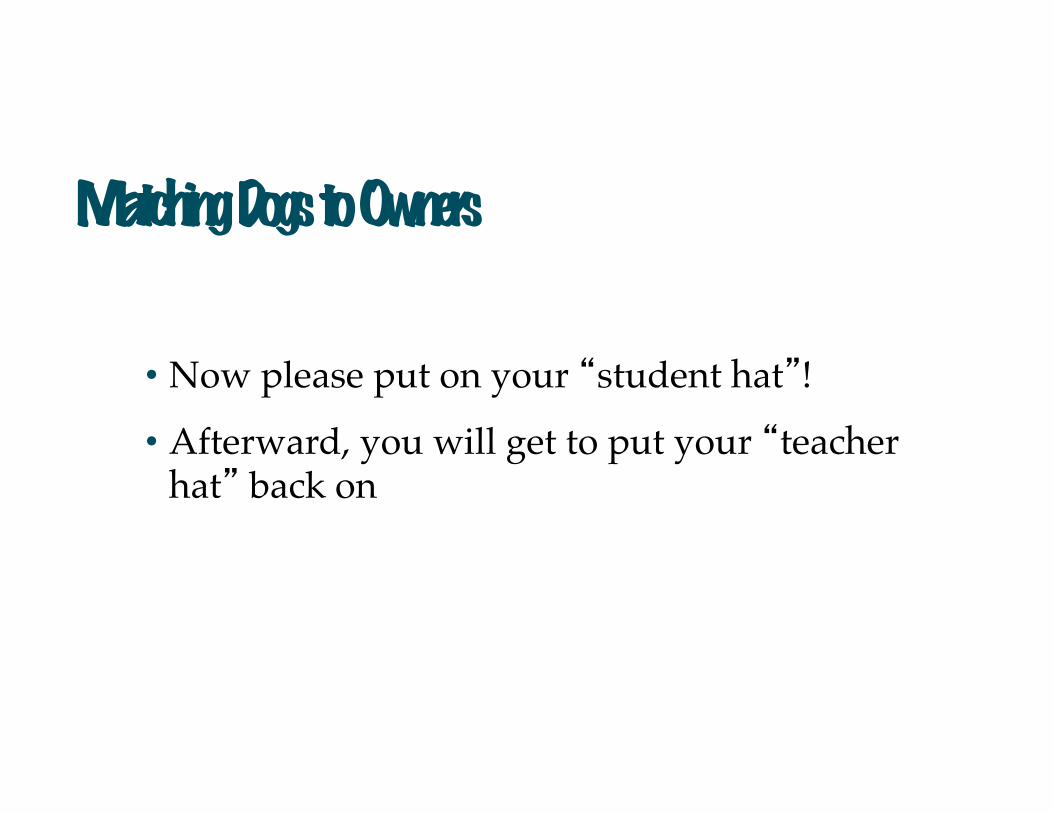
Matching Dogs to Owners !
• Now please put on your “student hat”!!
• Afterward, you will get to put your “teacher hat” back on

Are humans able to match dogs to their owners better than blind luck?
Research Question���

Matching Dogs to Owners
• Match the dogs to the owners as best as you can.
• On a piece of paper, create a two column grid.!
• First column OWNER, second column DOG!
• Write the numbers 1 through 6 under OWNER!
OWNER DOG!1!2!3!4!5!6!

1.
2.
3.
4.
5.
6.
1.
2.
3.
4.
5.
6.

Matching Dogs to Owners
!
• READY ?.... here come the answers.....

1 1
OWNER DOG

2 3
OWNER DOG

3 6
OWNER DOG

4 5
OWNER DOG

5 2
OWNER DOG

6 4
OWNER DOG

Matching Dogs to Owners
!
Now, we will look at how TinkerPlotsTM
can be used to shuffle the dogs and match them to the owners randomly.

Model
Sampling without replacement.
6 dogs
sampled one at a time
The dogs are selected randomly.!ASSUMPTION: humans have no ability to match dogs with owners (blind guessing).

Simulate
Trial Result!Number of matches between
dog number and owner number!!
Right-click on the Trial Result to “Collect” it

Evaluate
Which results are likely or unlikely under the null model?

Matching Dogs to Owners WRAP UP • What does the “blind guessing” model
mean?!
• Why do we use the “blind guessing” model to simulate our data?!
• What does it mean to have evidence that “supports” or “doesn’t support” the blind guessing model?

Matching Dogs to Owners REFLECTION !
Teacher hats back on!!• What about this activity (content, format…) do you think might help maximize student learning in your classroom?
• What are your hesitations / what do you think might hinder student learning in your classroom? What questions do you still have about the implementation of such a course?
• Presuming that you wanted to implement these activities in your courses, how comfortable would you feel doing so? Why or why not?

Example Course Activity Unit 2
Comparing Groups

• Course Location: Unit 2: Comparing Groups!
• Learning Goals: !1) Compare two groups with quantitative outcome variable
using TinkerPlotsTM to carry out a randomization test; !2) Find and use the p-value from the randomization test to
draw a conclusion!
• Preparation:!
‣ Stickgold, R., James, L., & Hobson, J. A. (2000). Visual discrimination learning requires sleep after training. Nature Neuroscience, 3(12), 1237–1238.!
‣ Mission Improbable: A Concise and precise definition of p-value. [web article]
Sleep Deprivation
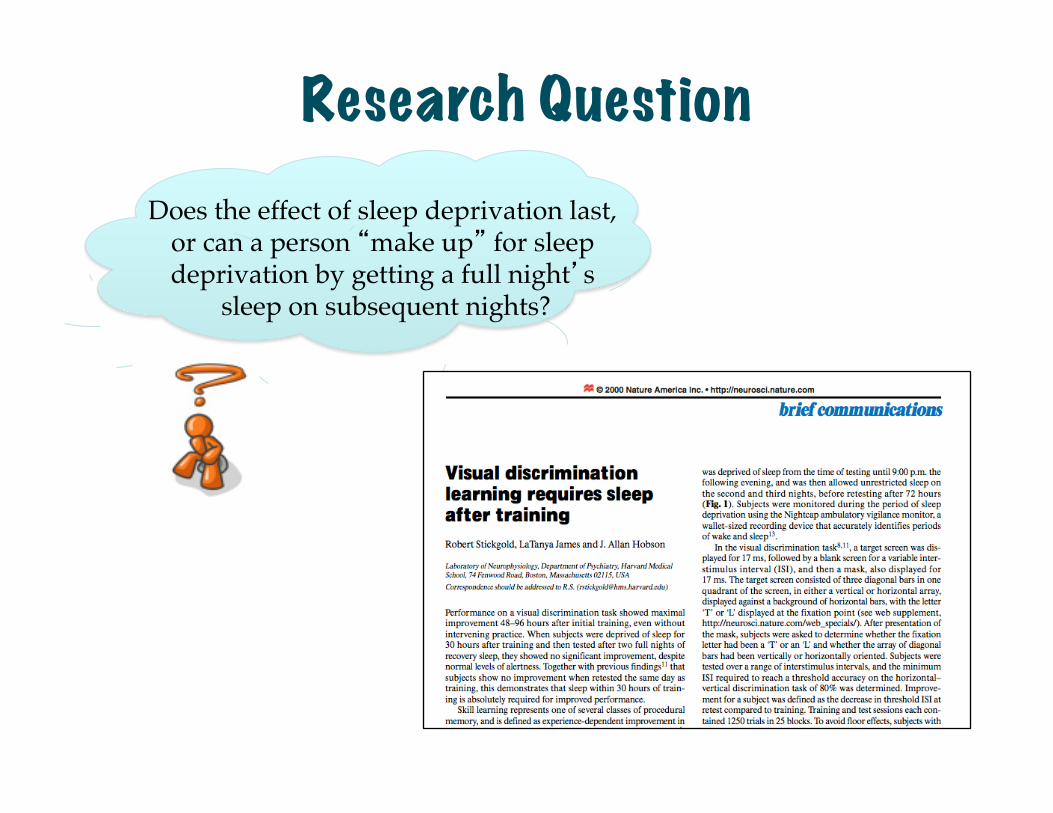
Does the effect of sleep deprivation last, or can a person “make up” for sleep deprivation by getting a full night’s
sleep on subsequent nights?
Research Question���

Volunteers between the ages of 18 and 25 trained and tested on a visual discrimination task
(n = 11) (n = 10 )
Study Design���
Night following training, subjects randomly assigned to have unrestricted sleep or to be deprived of sleep
Next two nights subjects were allowed as much sleep as they wanted then they were re-tested
How were the groups determined: Random
assignment!

Observed Difference���
Could the observed sample mean difference of 15.92 have happened just by chance?
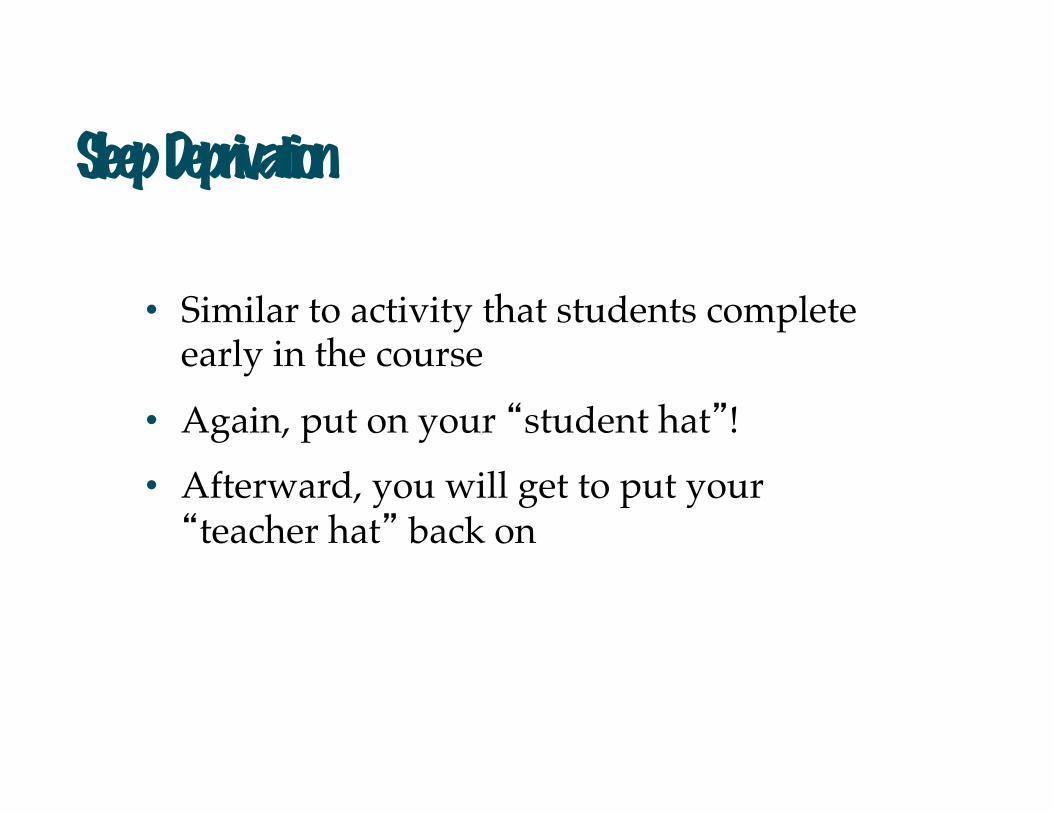
Sleep Deprivation
• Similar to activity that students complete early in the course!
• Again, put on your “student hat”!!
• Afterward, you will get to put your “teacher hat” back on
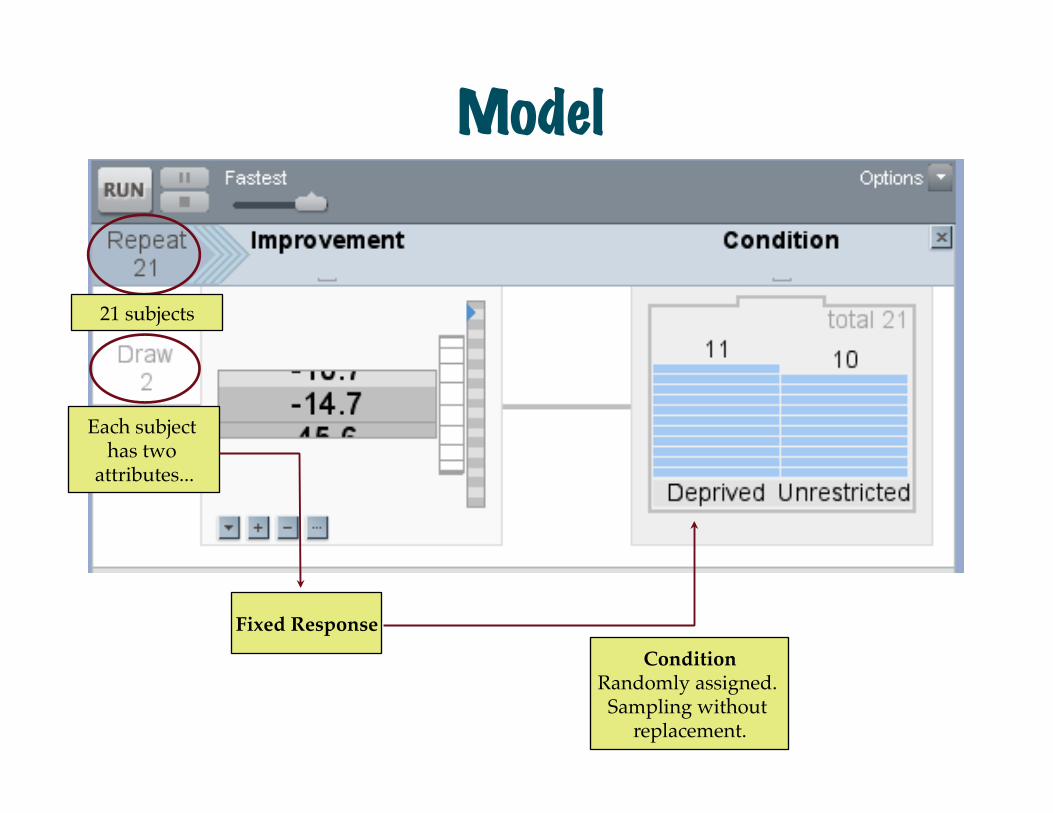
Model
Fixed Response Condition!
Randomly assigned. Sampling without
replacement.
21 subjects
Each subject has two
attributes...

Simulate
Trial Result!Difference between
treatment and control is 3.9.
Collect the Statistics!The mean Improvement for
both Control & Treatment

Evaluate
What proportion of results are at least as extreme as the observed
result of 15.9?

Model: There is no effect of unrestricted sleep.
Simulate: Carry out the random assignment and compute the mean difference.
Evaluate: Under the model, the observed result of 15.9 (or a more extreme result) is very unlikely to have occurred by chance.

Sample Wrap-Up Questions��� • What is the purpose of random assignment in this study? !
• Why do we need to conduct a test? Why can't we just answer the research question using the differences found in the observed data?!
• What was the model (null model) used to simulate the data?!
• Where was the plot of the simulated differences centered (location)? Why does that location make sense?!
• What was the p-value you obtained? What does this suggest about the answer to the research question?

Example Course Activity Unit 3
Sampling & Estimation

• Course Location: Unit 3: Sampling and Estimation!
• Learning Goals: (1) Use TinkerPlotsTM to carry out a bootstrap analysis to estimate a standard error; (2) Compute an interval estimate for a proportion!
• Preparation:!
‣ Standard Deviation Tutorial. [web article]
Kissing the “Right” Way

What percentage of couples lean their heads to the right when
kissing?
Research Question���

Observation of 124 couples between the ages of 13 and 70
80 Couples!Lean Right
44 Couples!Lean Left
Study Design���
Couples were observed in public places (e.g., airports, beaches, train stations, parks) and were not holding any luggage
Direction of head lean was recorded.
How were the groups determined: Self-selection

Problem: A different sample of 124 couples would have given a slightly
different answer to the question. How do we account for this?!
!Statistical Problem: How much variation
is there in the estimate from sample-to-sample?
What percentage of all couples lean to the right?!
!64.5% of the couples observed leaned to the right. This is a good initial guess (a point estimate).
What we would like to do...!!
Re-sample 124 couples from the population, observe the percentage that lean to the right when kissing, do this many times, compute the amount of
variation in the estimate...but we do not have access to the population (if we did, why
estimate?)
Bootstrapping���
Solution: Use sample as a substitute for the population,
and resample from the sample (with replacement, of course!)

Model
Lean Direction!Randomly sampled WITH replacement.
124 couples
Each subject has one
attribute...
WITH!REPLACEMENT!
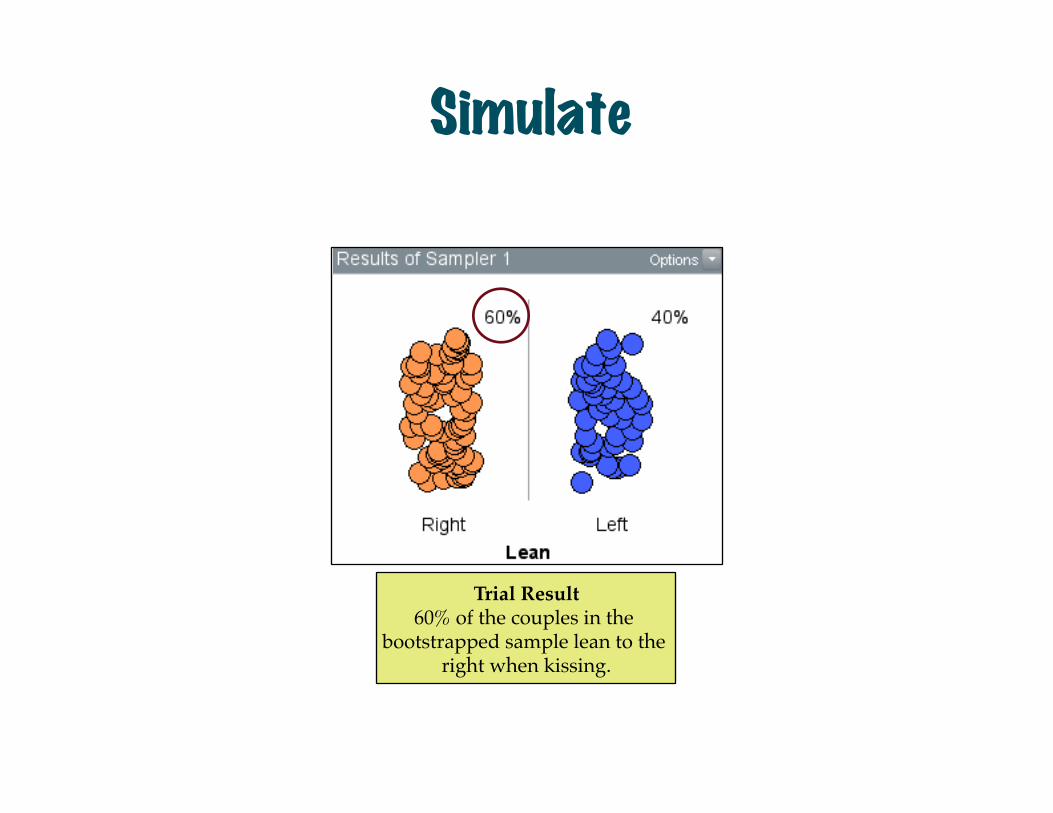
Simulate
Trial Result!60% of the couples in the
bootstrapped sample lean to the right when kissing.

Evaluate
The standard error of the estimate is ~4.527
The percentage of couples who lean to the right when kissing is
between 55.45% and 73.55%. !(64.5% ± 9.05)

Sample Wrap-Up Questions • What is the standard error?!• What is the margin of error?!• How would you interpret the margin of
error in this context? In general?!• What is the purpose of an interval
estimate?!• How would you interpret your interval
estimate?

CATALST Curriculum Page
• TinkerPlotsTM Instructions!• Visualizations!• Homework Assignments!• Readings!
http://www.tc.umn.edu/~catalst/
Aids for Students’ Learning
Aids for Teaching • Lesson Plans!

Questions & Discussion

Thank You! If you have any questions about the CATALST course, please contact anyone of the PIs:
Joan Garfield ([email protected])!
Robert delMas ([email protected])!
Andrew Zieffler ([email protected])