Embed Size (px)
Citation preview
Journal of Public Economics 96 (2012) 1000–1014
Contents lists available at SciVerse ScienceDirect
Journal of Public Economics
j ourna l homepage: www.e lsev ie r .com/ locate / jpube
Teaching new markets old tricks: The effects of subsidized investment onlow-income neighborhoods
Matthew Freedman ⁎Department of Economics, 262 Ives Faculty Building, Cornell University, Ithaca, NY 14853, United States
⁎ Tel.: +1 607 254 8245.E-mail address: [email protected].
0047-2727/$ – see front matter © 2012 Elsevier B.V. Allhttp://dx.doi.org/10.1016/j.jpubeco.2012.07.006
a b s t r a c t
a r t i c l e i n f oArticle history:Received 22 September 2011Received in revised form 16 May 2012Accepted 16 July 2012Available online 14 August 2012
Keywords:Place-based programsBusiness incentivesTax creditsLow-income neighborhoodsRegression discontinuity
This paper examines the effects of investment subsidized by the federal government's New Markets TaxCredit (NMTC) program, which provides tax incentives to encourage private investment in low-incomeneighborhoods. I identify the impacts of the program by taking advantage of a discontinuity in the rule deter-mining the eligibility of census tracts for NMTC-subsidized investment. Using this discontinuity as a source ofquasi-experimental variation in commercial development across tracts, I find that subsidized investment hasmodest positive effects on neighborhood conditions in low-income communities. Though spillovers appear tobe small and crowd out incomplete, the results suggest that some of the observed impacts on neighborhoodsare attributable to changes in the composition of residents as opposed to improvements in the welfare ofexisting residents.
© 2012 Elsevier B.V. All rights reserved.
1. Introduction
Over the past several decades, the federal government in the U.S.has revisited its approach to tackling the problem of persistent pov-erty in low-income communities. Greater emphasis has been placedon market-based incentive schemes that rely on the private sector toprovide resources perceived as necessary to alleviate poverty and blightin distressed cities and neighborhoods. As interest in business-orientedmechanisms to address stagnation in disadvantaged communitiesgrew, a number of new programs emerged that attempt to encourageprivate investments in low-income areas, often using tax incentives.
This paper evaluates the effectiveness of the New Markets TaxCredit (NMTC) program in reducing poverty and improving otherneighborhood conditions over the course of the 2000s. The NMTC,which was signed into law in 2000 as part of the Community RenewalTax Relief Act, arose out a desire to encourage private capital invest-ment in neighborhoods thought to be overlooked during the econom-ic boom of the 1990s. The program provides tax credits to investorswho make equity investments in Community Development Entities.These entities are charged with investing the proceeds from the equi-ty investments in businesses and real estate projects in certain desig-nated low-income census tracts.
In order to identify the effects of NMTC-subsidized investment onneighborhood conditions, I take advantage of a discontinuity in theformula used to designate tracts as low-income. The discontinuitygenerates pseudo-random assignment of investment in tracts arounda certain income threshold. Tracts below the threshold are eligible to
rights reserved.
receive NMTC-subsidized investment, whereas those above it aregenerally not eligible. However, on all other dimensions, the tractson either side of the threshold are similar. Hence, comparing out-comes among tracts within a sufficiently narrow window aroundthe cutoff permits one to draw causal inferences regarding the effectsof investment subsidized by the NMTC on neighborhood conditions.
Using data from the 2000 Decennial Census and the 2005–2009American Community Survey, I find modest benefits associated withsubsidized investment targeted at low-income neighborhoods. Povertyand unemployment rates fall by statistically significant amounts intracts that receive NMTC-subsidized investment relative to similartracts that do not. While also positive, the estimated impacts on otherneighborhood characteristics, including house values, are statisticallyindistinguishable from zero. Moreover, household turnover rates in af-fected communities are slightly higher, which suggests that the ob-served changes in neighborhood characteristics may not be entirelydriven by improvements in the conditions of existing residents, butrather may at least in part be attributable to changes in neighborhoodcomposition in the wake of new investment. Consistent with the mod-est positive impact of subsidized investment I find using survey datafrom residents, I also detect small but positive effects on total employ-ment and the quality of jobs using administrative data derived fromun-employment insurance tax records. Finally, the results suggest thatwhile the NMTC program may redirect some investment dollars fromhigher to lower income areas and could crowd out some unsubsidizedinvestment, spillovers are not large and crowd out is not complete.
This paper makes several important contributions. First, I shednew light on the effectiveness of tax incentives in encouraging localeconomic development. Much of what we know about the usefulnessof tax incentives in revitalizing communities comes from work on
1001M. Freedman / Journal of Public Economics 96 (2012) 1000–1014
state enterprise zones (EZs). State EZs provide tax incentives to newand expanding businesses in designated cities and neighborhoods.These incentives can take the form of employment credits or income,property, or sales tax breaks. Evaluating the effectiveness of EZs hasproven challenging, in part because of the high degree of variation inprogram characteristics across states; not only do programs differ inthe generosity and types of incentives offered to businesses, but theyalso vary in the criteria used to determine communities' eligibilityfor the program. Perhaps partly a result, the findings of existingstudies on the effects of the EZs are mixed. Several papers, such asPapke (1994), Billings (2009), Ham et al. (2011) and Freedman(forthcoming), find positive effects of EZs on local economic activityand neighborhood conditions.1 However, Boarnet and Bogart (1996),Elvery (2009), Neumark and Kolko (2010), and others find that EZshave little or no effect on local employment, casting doubt on the effec-tiveness of tax incentives in spurring growth in targeted areas.2
More broadly, this paper contributes to the growing literatureon the impact of a new generation of place-based policies in theU.S. Much of this research has focused narrowly on housing policy(e.g., Baum-Snow and Marion, 2009; Gabriel and Rosenthal, 2009;Freedman and Owens, 2011). The work that has been done outsidehousing has typically struggled with identification, often due tononrandom selection of communities into programs. I exploit plausiblyexogenous variation in subsidized investment across communities thatresults from federal rules determining the eligibility of census tracts forNMTC funds.
The paper is organized as follows. The next section provides back-ground on the NMTC program. Section 3 details my econometric ap-proach. After describing the data and providing descriptive statisticsin Section 4, I present results on the spatial distribution of NMTC-subsidized investment in Section 5. Section 6 examines how this invest-ment affects housing and resident characteristics in low-income com-munities. Section 7 takes up the issue of crowd out and the impact ofsubsidized investment on employment and the composition of jobs inlow-income communities. Section 8 concludes.
5 The information in this section is derived in large part from the CDFI Fund'swebsite (www.cdfifund.gov), which outlines CDE eligibility requirements in detailand provides a list of current CDEs.
6 Though originally scheduled to begin in fiscal 2002, no allocations were made until2003 owing to delays in launching the program (U.S. Government Accountability Of-fice, 2007).
7 Applications to the CDFI Fund require CDEs to describe their intended use of thefunds in four areas. Those areas include business strategy, capitalization strategy, man-agement strategy, and community impact. Each of these areas is given a score by eachmember of a panel of CDFI reviewers that ranges from 0 to 25. Extra points are alsoawarded if the applicant has a demonstrable history of serving disadvantaged commu-
2. The New Markets Tax Credit program
2.1. Program structure
Introduced in the late 1990s as a pro-business way to stimulate in-vestment in the nation's distressed areas, the NMTC program wassigned into law in December 2000 as part of the Community RenewalTax Relief Act of 2000.3 Administered by the Community DevelopmentFinancial Institutions (CDFI) Fund at the U.S. Department of the Treasury,the NMTC program, which allocated a total of $26 billion in tax creditsbetween fiscal years 2002 and 2009, encourages capital investment inbusinesses that are located in low-income neighborhoods by offeringtax incentives to investors who make qualified equity investments(QEIs) in Community Development Entities (CDEs).4 The credit totals39% of the cost of the investment and is claimed over a seven-year creditallowance period, with 5% being claimed each year over the first threeyears and 6% each year over the final four years.
CDEs are domestic corporations or partnerships that meet sever-al criteria. First, their primary mission must be to serve or provide
1 Recent work on federal Empowerment Zones and Enterprise Communities, whichwere first established in 1994, suggests that they have increased economic activity intargeted areas (Busso et al., 2012; Ham et al., 2011).
2 Notably, most EZ programs involve employment tax credits and target high pover-ty areas. In contrast, the NMTC program uses investment subsidies and targets onlymoderately low-income areas.
3 See the online appendix for additional details regarding the structure of the NMTCprogram.
4 The original NMTC program was authorized to allocate $15 billion between fiscalyears 2002 and 2006. In subsequent years, the program has been amended and re-authorized a number of times.
investment capital to low-income communities or persons. Second,CDEs must maintain accountability to the community by including resi-dent representation on any governing or advisory board. Finally, CDEsmust be certified by the CDFI Fund. A CDE remains certified for the lifeof the organization as long as it continues to meet the mission and ac-countability requirements. As of December 2011, there were 5473CDEs distributed across all 50 states and the District of Columbia.5
Among the currently certified CDEs are community development finan-cial institutions, community development corporations, other non-profitfinancial intermediaries, government agencies, commercial and invest-mentbanks, and other for-profitfinancial institutions (Armistead, 2005).
Each fiscal year between 2003 and 2009, between 40 and 100CDEs received tax credit allocation rights totaling between $2 billionand $5 billion.6 The average allocation to a CDE in any given year isclose to $50 million. While the NMTC program represents only a frac-tion of total spending and foregone taxes among federal communityand economic development programs, it has expanded over timeand continues to grow both because more allocations have beenmade available by Congress and because tax credits from early roundscontinue to be claimed.
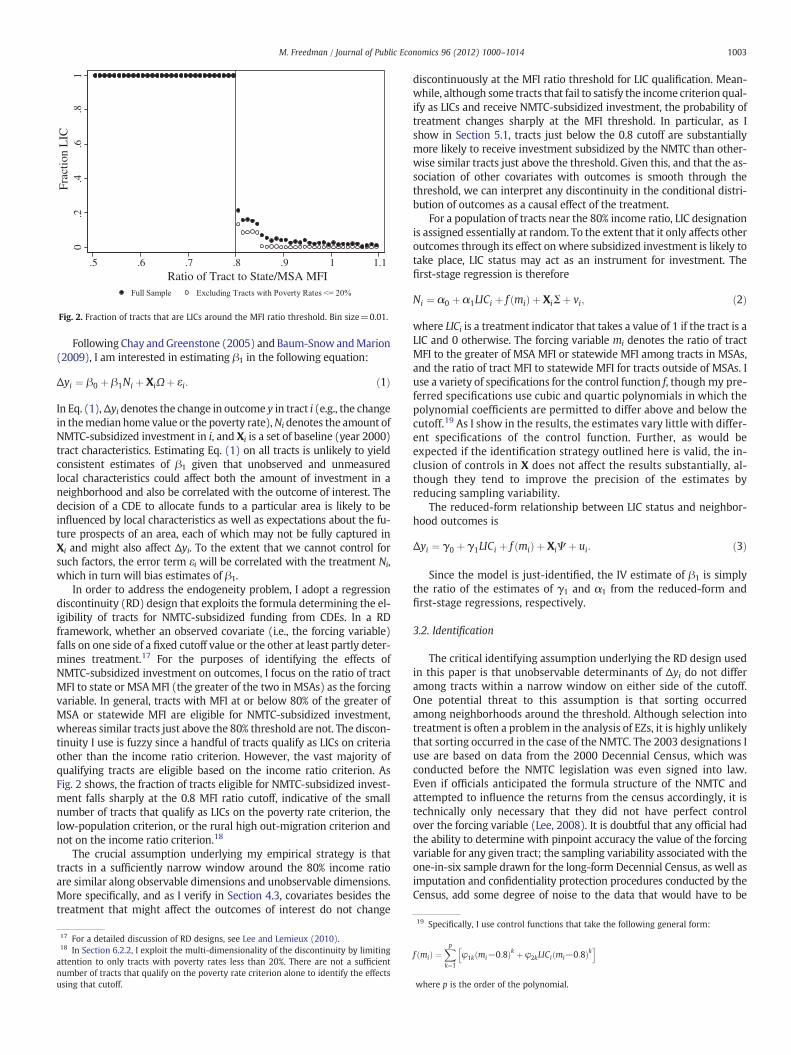
Unlike the Low-Income Housing Tax Credit or the Community De-velopment Block Grant programs, which leave decisions about the al-location of funds to states or localities, NMTC allocations flow directlyfrom the federal government to CDEs. The CDEs that receive alloca-tions are selected through a competitive application process, withless than one-fifth of applicants receiving allocations in any givenyear.7 Once a CDE is awarded a NMTC allocation, it has five years touse the proceeds of QEIs to provide equity or debt capital in theform of so-called qualified low-income community investments(QLICIs).8 As Fig. 1 shows, as the amounts that the CDFI Fund allocat-ed to CDEs generally rose over the course of the decade, QLICIs in-creased steadily until fiscal year 2008, at which point they slowedin the face of the recession. In 2009, however, investment under theprogram recovered.9
NMTC program rules dictate that “substantially all” of the invest-ments made by CDEs go to designated low-income communities(LICs), but these investments can take a number of different forms.Over 85% of QLICIs take the form of loans. However, since investors'returns are at least in part covered by the tax credit, CDEs have theflexibility to offer below-market interest rates or other preferentialterms to qualified projects or businesses. Nonetheless, CDEs stillhave an incentive to assist viable projects with strong prospects. In-deed, there is some concern that the NMTC program crowds out pri-vate unsubsidized investment. Gurley-Calvez et al. (2009) argue thatcrowd out is not complete and that the NMTC program not only
nities or businesses, or if the NMTC plans to invest most of its capital in unrelated en-tities. Each reviewer tallies his or her own points and makes a recommendation ofwhether the CDE should receive funding and, if so, how much. CDFI staff then reviewthe top proposals, and the NMTC program manager makes the final allocation determi-nation (Rubin and Stankiewicz, 2005).
8 CDEs may be for-profit or not-for-profit; the latter account for about one-fourth ofCDEs that receive NMTC financing. However, to invest in eligible projects, a not-for-profit CDE must create a for-profit subsidiary.
9 The QLICI data in the figure reflect reports to the CDFI Fund through December2009. At $4.6 billion, total fiscal year 2009 investment was about 20% higher than whatis shown in the figure. Because the outcome data cover only through calendar year2009, I do not consider any investment that occurs in calendar year 2010.

01
23
45
Bill
ions
($)
2003 2004 2005 2006 2007 2008 2009*
Fig. 1. NMTC allocations and qualified LIC investments by fiscal year. * Data on qualifiedLIC investments for 2009 only include investments reported through December 2009.
1002 M. Freedman / Journal of Public Economics 96 (2012) 1000–1014
redirects investment dollars from higher income to lower incomecommunities, but also increases the overall amount of resourcesavailable for investment in low-income areas. However, research onother place-based programs suggests that crowd out is a potentiallylarge concern (Sinai and Waldfogel, 2005; Eriksen and Rosenthal,2010). I discuss the implications of crowd out for my analysis andpresent some suggestive evidence on the extent of crowd out inSection 7.
Over two-thirds of CDE investment has historically gone to commer-cial real estate development (70% of all investment dollars through2009). Commercial real estate projects are typically easier to pair withother tax incentives. Further, because they are fixed in place, real estateprojects are unlikely to fall out of compliancewith NMTC program rules(Lambie-Hanson, 2008). Of the investment dollars not directed towardcommercial real estate investment, most go to business development,which mainly constitutes loans to firms. Investments of this kind,which constitute about 26% of all NMTC investment dollars to date,are about half the size of commercial real estate investments on aver-age. Meanwhile, only about half of a percent of NMTC funds go to resi-dential real estate development, in part because the financing ofresidential rental property is not permitted under the NMTC.10 The re-mainder of the funds (about 4%) largely goes toward financing CDE ac-tivities and loan purchases.
Through 2009, $16 billion of QEI proceeds had been funneled to3278 qualified active low-income community businesses (QALICBs).11
The average amount of funding provided by a CDE to a QALICB through2009 was about $4.9 million, but this is skewed higher by several verylarge projects. Themedian investmentwas $2.3 million. Relative to pro-ject costs, NMTC funding is often substantial. Using cost estimatesreported by CDEs, NMTC financing coverswell over one-third of projectcosts on average (U.S. Government Accountability Office, 2010).
2.2. Low-income communities
In general, communities eligible for NMTC-subsidized investmentthrough CDEs are census tracts that meet at least one of two criteria.Tracts outsidemetropolitan statistical areas (MSAs)withmedian familyincome (MFI) that does not exceed 80% of their state's MFI qualify forNMTC-subsidized investment, as do tracts in MSAs with MFI that doesnot exceed 80% of the greater of MSA MFI or statewide MFI. Tractswith poverty rates of at least 20% also qualify as LICs. A handful of“low-population” tracts also qualify; these tracts have populations lessthan 2000, are located in Empowerment Zones, and are contiguouswith another LIC. Finally, several “rural, high out-migration” tractsqualify; these tracts are located outside MSAs, have MFI less thanor equal to 85% of statewide MFI, and have net out-migration of atleast 10% of the population between 1980 and 2000.12
CDEs are also permitted to finance businesses outside of LICs aslong as the businesses serve a targeted population, which constitutes“individuals, or an identified group of individuals, including an Indian
10 Residential rental property is eligible for funding under the Low-Income HousingTax Credit.11 Some QALICBs received multiple investments from CDEs. In total, 4444 invest-ments were made through 2009.12 The NMTC and the Community Reinvestment Act (CRA), which aims to encouragecommercial banks and savings institutions to assist in meeting the credit needs oflower-income communities, have similar, but not identical, formula structures. Censustracts in MSAs are designated underserved under the CRA if tract MFI is less than orequal to 80% of MSA MFI (as opposed to 80% of the maximum of statewide and MSAMFI). Census tracts outside of MSAs are designated underserved under the CRA if tractMFI is less than or equal to 80% of non-metropolitan state MFI (as opposed to state MFImore broadly defined). Hence, the income ratio used to determine CRA eligibility is al-ways different than the income ratio used to determine NMTC eligibility status fortracts outside MSAs, and is different for 36% of tracts within MSAs. Further, not onlyare previous estimates of the magnitude of the CRA's effects on neighborhood out-comes modest (Gabriel and Rosenthal, 2009; Bhutta, 2010), but using CRA eligibilitystatus (along with a flexible control function using the CRA income ratio) also yieldsno significant results in a reduced-form regression analogous to Eq. (3).
tribe, who (a) are low-income persons; or (b) otherwise lack ade-quate access to loan or equity investments”.13 In practice, LICs havereceived 95% of NMTC investment dollars and 96% of NMTCprojects.14
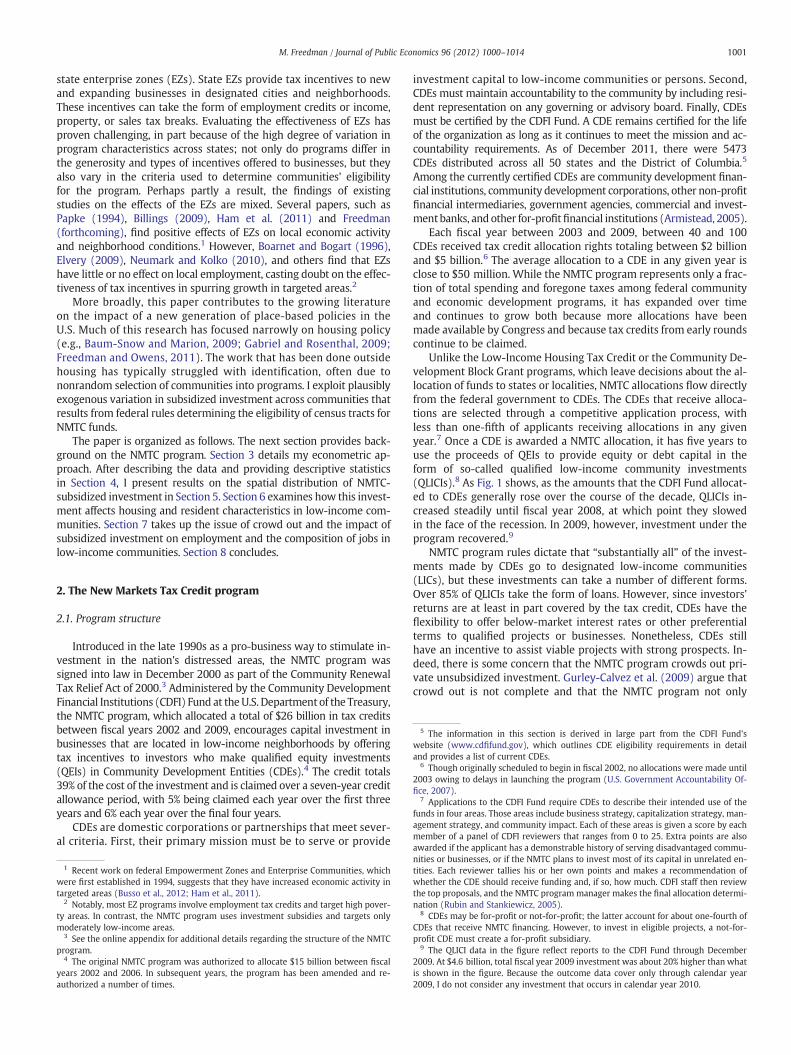
Of the 65,443 tracts in the 50 states and the District of Columbia,39% currently qualify as LICs. Of those that qualify, over 98% qualifyeither on the MFI ratio or the poverty rate criterion. Of those, 95%qualify on the MFI criterion; only 1305 tracts qualify on the povertyrate criterion alone.15 Fig. 2 shows tract LIC status as a function ofits MFI ratio for all tracts with MFI between 50% and 110% of stateor MSA MFI (the solid dots) and for only tracts with poverty ratesless than 20% in the same 60 percentage point window (the hollowdots). Consistent with program rules, all tracts with MFI ratios lessthan 0.8 qualify as LICs and are eligible to receive NMTC-subsidizedinvestment. Immediately above the 0.8 MFI ratio threshold, the frac-tion of tracts that are LICs drops sharply. In the full sample, only10.8% of tracts with MFI ratios between 0.8 and 0.9 are LICs.16
Among tracts with poverty rates less than 20%, only 4.9% of those withMFI ratios between 0.8 and 0.9 are LICs (a handful of low-populationand rural, high out-migration tracts below the poverty rate cutoff andabove the income cutoff qualify as LICs). As I discuss in subsequent sec-tions, as a result of the nonlinearity in eligibility at the MFI ratio cutoff,NMTC investment activity varies discontinuously at the 0.8 threshold,which allows me to credibly identify the effects of investment spurredby the NMTC on neighborhood outcomes.
3. Empirical approach
3.1. Model
This paper aims to identify the effects of investment subsidized bythe NMTC on each of several neighborhood outcomes. I conduct theanalysis at the level of census tract; tracts have populations that aver-age 4000 and are designed by the U.S. Census Bureau to approximateneighborhoods.
13 American Jobs Creation Act of 2004 (HR 4520).14 These figures exclude NMTC investment put toward financing CDE activities andloan purchases.15 Current designations are based on 2000 Decennial Census data and geographicboundaries. Beginning in mid-2012, designations will be based on 2006–2010 Ameri-can Community Survey data and boundaries.16 Because few tracts qualify on the poverty rate criterion alone, the discontinuity ineligibility is much smaller at the 20% poverty rate threshold. Nearly 70% of tracts withpoverty rates greater than 15% but less than 20% are LICs.
0.2
.4.6
.81
Frac
tion
LIC
.5 .6 .7 .8 .9 1 1.1Ratio of Tract to State/MSA MFI
Fig. 2. Fraction of tracts that are LICs around the MFI ratio threshold. Bin size=0.01.
1003M. Freedman / Journal of Public Economics 96 (2012) 1000–1014
Following Chay andGreenstone (2005) and Baum-Snow andMarion(2009), I am interested in estimating β1 in the following equation:
Δyi ¼ β0 þ β1Ni þ XiΩþ εi: ð1Þ
In Eq. (1),Δyi denotes the change in outcome y in tract i (e.g., the changein themedian home value or the poverty rate),Ni denotes the amount ofNMTC-subsidized investment in i, and Xi is a set of baseline (year 2000)tract characteristics. Estimating Eq. (1) on all tracts is unlikely to yieldconsistent estimates of β1 given that unobserved and unmeasuredlocal characteristics could affect both the amount of investment in aneighborhood and also be correlated with the outcome of interest. Thedecision of a CDE to allocate funds to a particular area is likely to beinfluenced by local characteristics as well as expectations about the fu-ture prospects of an area, each of which may not be fully captured inXi and might also affect Δyi. To the extent that we cannot control forsuch factors, the error term εi will be correlated with the treatment Ni,which in turn will bias estimates of β1.
In order to address the endogeneity problem, I adopt a regressiondiscontinuity (RD) design that exploits the formula determining the el-igibility of tracts for NMTC-subsidized funding from CDEs. In a RDframework, whether an observed covariate (i.e., the forcing variable)falls on one side of a fixed cutoff value or the other at least partly deter-mines treatment.17 For the purposes of identifying the effects ofNMTC-subsidized investment on outcomes, I focus on the ratio of tractMFI to state or MSAMFI (the greater of the two in MSAs) as the forcingvariable. In general, tracts with MFI at or below 80% of the greater ofMSA or statewide MFI are eligible for NMTC-subsidized investment,whereas similar tracts just above the 80% threshold are not. The discon-tinuity I use is fuzzy since a handful of tracts qualify as LICs on criteriaother than the income ratio criterion. However, the vast majority ofqualifying tracts are eligible based on the income ratio criterion. AsFig. 2 shows, the fraction of tracts eligible for NMTC-subsidized invest-ment falls sharply at the 0.8 MFI ratio cutoff, indicative of the smallnumber of tracts that qualify as LICs on the poverty rate criterion, thelow-population criterion, or the rural high out-migration criterion andnot on the income ratio criterion.18
The crucial assumption underlying my empirical strategy is thattracts in a sufficiently narrow window around the 80% income ratioare similar along observable dimensions and unobservable dimensions.More specifically, and as I verify in Section 4.3, covariates besides thetreatment that might affect the outcomes of interest do not change
17 For a detailed discussion of RD designs, see Lee and Lemieux (2010).18 In Section 6.2.2, I exploit the multi-dimensionality of the discontinuity by limitingattention to only tracts with poverty rates less than 20%. There are not a sufficientnumber of tracts that qualify on the poverty rate criterion alone to identify the effectsusing that cutoff.
discontinuously at the MFI ratio threshold for LIC qualification. Mean-while, although some tracts that fail to satisfy the income criterion qual-ify as LICs and receive NMTC-subsidized investment, the probability oftreatment changes sharply at the MFI threshold. In particular, as Ishow in Section 5.1, tracts just below the 0.8 cutoff are substantiallymore likely to receive investment subsidized by the NMTC than other-wise similar tracts just above the threshold. Given this, and that the as-sociation of other covariates with outcomes is smooth through thethreshold, we can interpret any discontinuity in the conditional distri-bution of outcomes as a causal effect of the treatment.
For a population of tracts near the 80% income ratio, LIC designationis assigned essentially at random. To the extent that it only affects otheroutcomes through its effect on where subsidized investment is likely totake place, LIC status may act as an instrument for investment. Thefirst-stage regression is therefore
Ni ¼ α0 þ α1LICi þ f mið Þ þ XiΣþ vi; ð2Þ
where LICi is a treatment indicator that takes a value of 1 if the tract is aLIC and 0 otherwise. The forcing variable mi denotes the ratio of tractMFI to the greater of MSA MFI or statewide MFI among tracts in MSAs,and the ratio of tract MFI to statewide MFI for tracts outside of MSAs. Iuse a variety of specifications for the control function f, though my pre-ferred specifications use cubic and quartic polynomials in which thepolynomial coefficients are permitted to differ above and below thecutoff.19 As I show in the results, the estimates vary little with differ-ent specifications of the control function. Further, as would beexpected if the identification strategy outlined here is valid, the in-clusion of controls in X does not affect the results substantially, al-though they tend to improve the precision of the estimates byreducing sampling variability.
The reduced-form relationship between LIC status and neighbor-hood outcomes is
Δyi ¼ γ0 þ γ1LICi þ f mið Þ þ XiΨ þ ui: ð3Þ
Since the model is just-identified, the IV estimate of β1 is simplythe ratio of the estimates of γ1 and α1 from the reduced-form andfirst-stage regressions, respectively.
3.2. Identification
The critical identifying assumption underlying the RD design usedin this paper is that unobservable determinants of Δyi do not differamong tracts within a narrow window on either side of the cutoff.One potential threat to this assumption is that sorting occurredamong neighborhoods around the threshold. Although selection intotreatment is often a problem in the analysis of EZs, it is highly unlikelythat sorting occurred in the case of the NMTC. The 2003 designations Iuse are based on data from the 2000 Decennial Census, which wasconducted before the NMTC legislation was even signed into law.Even if officials anticipated the formula structure of the NMTC andattempted to influence the returns from the census accordingly, it istechnically only necessary that they did not have perfect controlover the forcing variable (Lee, 2008). It is doubtful that any official hadthe ability to determine with pinpoint accuracy the value of the forcingvariable for any given tract; the sampling variability associated with theone-in-six sample drawn for the long-form Decennial Census, as well asimputation and confidentiality protection procedures conducted by theCensus, add some degree of noise to the data that would have to be
19 Specifically, I use control functions that take the following general form:
f mið Þ ¼Xp
k¼1
φ1k mi−0:8ð Þk þ φ2kLICi mi−0:8ð Þkh i
where p is the order of the polynomial.

21 These data are derived from LEHD's OnTheMap program, which provides annualcross-sectional information on jobs at detailed geographies. I include in the sample on-ly private primary jobs; a primary job represents the highest paying job for each work-er in each year. This eliminates from the sample many low-earnings, transient jobs andallows for a closer comparison to past work on the employment effects of EZs. The re-sults are qualitatively and quantitatively similar if one uses all private-sector jobs. SeeAndersson et al. (2008) for details regarding the data.22 These thresholds are not adjusted for inflation each year, and hence there is a grad-ually declining fraction of jobs in the low-earnings bin and a gradually increasing frac-tion of jobs in the high-earnings bin. In the empirical analysis, I test for whether tractsthat received subsidized investment experienced differentially large or small changesin the shares.23 Arizona, Arkansas, DC, Massachusetts, Mississippi, and New Hampshire are exclud-ed because they did not provide data to the LEHD program one or more years between2002 and 2009. Notably, because the LEHD data are available each year, the resultsusing them are not subject to the same timing problems associated with results usingthe 2005–2009 ACS.24 About two-thirds of tracts in Louisiana and Mississippi and one-fifth of tracts in Al-abama (a total of 1403 tracts) were designated part of the GO Zone. Developments inthese areas were given special preference in the wake of Hurricane Katrina. Includingthese tracts in the sample has little effect the findings overall, but results in a weakerfirst-stage and affects the precision of some of the estimates.
1004 M. Freedman / Journal of Public Economics 96 (2012) 1000–1014
predicted by local officials. These factors militate against anyunobserved sorting around the threshold that might invalidate the RDdesign. As further checks that no sorting has occurred around the cutoff,in Section 4.3 I provide descriptive evidence and test formally that thereis no discontinuity in the distribution of the forcing variable at the cutoffand that observable baseline covariates evolve smoothly through thethreshold.
Notably, the fuzzy RD design provides a weighted average of theeffects of the treatment for the subpopulation of neighborhoodsnear the cutoff that receive investment, with weights proportionalto the ex-ante likelihood of having a MFI ratio near the threshold. Itis unlikely that the treatment effect is homogenous across all neigh-borhoods, and hence it would be misguided to assume that the esti-mated effects would be similar in very high income or very lowincome neighborhoods far from the threshold. The lack of externalvalidity is a common feature of RD designs, but it does not implythat the estimates in this paper are not of interest. Indeed, the localaverage treatment effect that I identify is of critical importance to un-derstanding how the NMTC program spurs investment, and how thisinvestment affects disadvantaged (albeit not extremely poor) com-munities (i.e., those tracts with MFI near 80% of the MSA or state MFI).
4. Data
4.1. Data sources
The data used in this analysis come from several sources. The firstis the CDFI Fund at the U.S. Treasury. The CDFI Fund provided data onall CDE investments, including the amount of the investment (includ-ing total project cost and NMTC funding), the type of investment(commercial real estate, business development, etc.), and the locationof the investment (street address). Using commercial GIS software, Iassigned each investment to a census tract. These data were thenmerged with information at the tract level on LIC eligibility, whichis derived from 2000 Decennial Census data.
Baseline resident characteristics of tracts were taken from the 2000Decennial Census. These data include a number of demographic charac-teristics, including total population, racial and ethnic composition, theage distribution, educational attainment levels, household size, house-hold and family income, poverty rates, and unemployment rates. Thedata also contain a host of tract housing characteristics, including totalhousing units, share vacant, share occupied, share owned, share rented,share with a mortgage, median age of units, median number of roomsper unit, household turnover, and median house value.
In order to examine how neighborhoods changed over the courseof the 2000s, I use small-area American Community Survey (ACS) es-timates for 2005–2009. These data are based on interviews conductedby the Census Bureau over a five-year period in the second half of thedecade. These data do not measure neighborhood characteristics in agiven area in a particular year, but instead measure average neigh-borhood characteristics over the entire five-year period. The geo-graphic boundaries in the 2005–2009 ACS largely match those usedin the 2000 Decennial Census.20 I extract from the ACS informationon house values, household income, poverty rates, unemploymentrates, and household turnover at the tract level.
The neighborhood outcomes of interest are measured as changesbetween 2000 and 2005–2009. To the extent that NMTC-subsidizedprojects take place later in the decade or take some time to have animpact on neighborhood conditions, these outcome measures maynot fully capture their effects and the IV estimates presented in subse-quent sections should be scaled up. In other words, the overlap in the
20 There were several exceptions. After 2000, changes in county or county equiva-lents occurred in Virginia, Colorado, and Alaska. Additionally, nine states used 2010Census boundaries for census tracts in the ACS. I normalized all geography to 2000using crosswalks provided by the Census.
period during which we observe outcomes and the period in whichinvestment occurs may introduce a degree of measurement errorthat will tend to bias me toward finding no effects of investment onneighborhood conditions.
The Decennial Census and ACS are each survey-based and provideinformation on the demographic and economic characteristics of tractresidents. To the extent that the intent of the NMTC program was torevitalize blighted communities, the effects of investment subsidizedby the program on tract residents are of particular policy interest.Also important, however, are the effects on commercial activity in af-fected areas. Ideally, one would have information on all subsidizedand unsubsidized commercial real estate investment, business loans,and job growth for all tracts, in which case one could quantify the cu-mulative effect of subsidized investment on economic activity as wellas the amount of crowd out associated with the program.
While I do not have data on all commercial real estate investmentand loans for all tracts, I obtained administrative data on total em-ployment and the composition of jobs within tracts from the Longitu-dinal Employer-Household Dynamics (LEHD) program at the CensusBureau.21 These data, which are derived from state unemploymentinsurance records and cover over 98% of private sector employment,contain job counts as well as pay categories (fraction of jobs payingless than $15,000 annually, fraction of jobs paying between $15,000and $39,999 annually, and fraction of jobs paying $40,000 or more an-nually).22 While these data are only available for 2002–2009 and onlyfor 45 states,23 they allow me to test directly for the impact of subsi-dized investment on the number of jobs and the types of jobs availablewithin affected communities. In turn, while I cannot quantify the totalamount of crowd out associated with the program, I can shed somelight on whether subsidized investment is generating more or betterjobs. To the extent that there is differentially greater job growth or ashift toward better paying jobs in communities that receive subsidizedinvestment, it would suggest that if there is crowd out of unsubsidizedinvestment, it is not complete.
4.2. Summary statistics
Excluding those in Gulf Opportunity (GO) Zones24 or in tracts withmissing information in either the 2000 Decennial Census or the 2005–2009 ACS, QLICIs between 2003 and 2009 were distributed across 488counties and 1538 tracts in the U.S.25 Table 1 characterizes the differ-ences between tracts that received projects and those that did not.
25 These exclude loan purchases by CDEs. Note that I use the date that CDEs reportusing the proceeds of QEIs to make QLICIs as opposed to the date that the CDFI Fundreports allocating credits to CDEs. Once awarded credits, CDEs have up to five yearsto use the proceeds of QEIs to make investments, and therefore actual investments,much less their impacts on neighborhoods, could take some time to materialize.
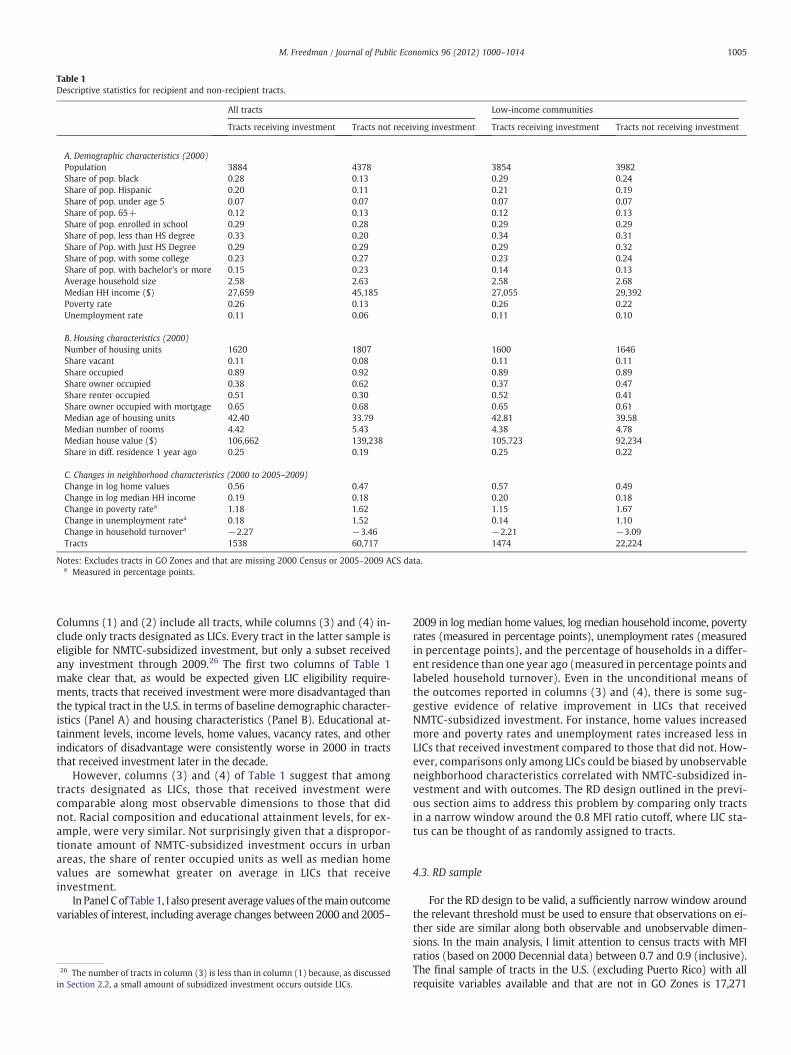
Table 1Descriptive statistics for recipient and non-recipient tracts.
All tracts Low-income communities
Tracts receiving investment Tracts not receiving investment Tracts receiving investment Tracts not receiving investment
A. Demographic characteristics (2000)Population 3884 4378 3854 3982Share of pop. black 0.28 0.13 0.29 0.24Share of pop. Hispanic 0.20 0.11 0.21 0.19Share of pop. under age 5 0.07 0.07 0.07 0.07Share of pop. 65+ 0.12 0.13 0.12 0.13Share of pop. enrolled in school 0.29 0.28 0.29 0.29Share of pop. less than HS degree 0.33 0.20 0.34 0.31Share of Pop. with Just HS Degree 0.29 0.29 0.29 0.32Share of pop. with some college 0.23 0.27 0.23 0.24Share of pop. with bachelor's or more 0.15 0.23 0.14 0.13Average household size 2.58 2.63 2.58 2.68Median HH income ($) 27,659 45,185 27,055 29,392Poverty rate 0.26 0.13 0.26 0.22Unemployment rate 0.11 0.06 0.11 0.10
B. Housing characteristics (2000)Number of housing units 1620 1807 1600 1646Share vacant 0.11 0.08 0.11 0.11Share occupied 0.89 0.92 0.89 0.89Share owner occupied 0.38 0.62 0.37 0.47Share renter occupied 0.51 0.30 0.52 0.41Share owner occupied with mortgage 0.65 0.68 0.65 0.61Median age of housing units 42.40 33.79 42.81 39.58Median number of rooms 4.42 5.43 4.38 4.78Median house value ($) 106,662 139,238 105,723 92,234Share in diff. residence 1 year ago 0.25 0.19 0.25 0.22
C. Changes in neighborhood characteristics (2000 to 2005–2009)Change in log home values 0.56 0.47 0.57 0.49Change in log median HH income 0.19 0.18 0.20 0.18Change in poverty ratea 1.18 1.62 1.15 1.67Change in unemployment ratea 0.18 1.52 0.14 1.10Change in household turnovera −2.27 −3.46 −2.21 −3.09Tracts 1538 60,717 1474 22,224
Notes: Excludes tracts in GO Zones and that are missing 2000 Census or 2005–2009 ACS data.a Measured in percentage points.
1005M. Freedman / Journal of Public Economics 96 (2012) 1000–1014
Columns (1) and (2) include all tracts, while columns (3) and (4) in-clude only tracts designated as LICs. Every tract in the latter sample iseligible for NMTC-subsidized investment, but only a subset receivedany investment through 2009.26 The first two columns of Table 1make clear that, as would be expected given LIC eligibility require-ments, tracts that received investment were more disadvantaged thanthe typical tract in the U.S. in terms of baseline demographic character-istics (Panel A) and housing characteristics (Panel B). Educational at-tainment levels, income levels, home values, vacancy rates, and otherindicators of disadvantage were consistently worse in 2000 in tractsthat received investment later in the decade.
However, columns (3) and (4) of Table 1 suggest that amongtracts designated as LICs, those that received investment werecomparable along most observable dimensions to those that didnot. Racial composition and educational attainment levels, for ex-ample, were very similar. Not surprisingly given that a dispropor-tionate amount of NMTC-subsidized investment occurs in urbanareas, the share of renter occupied units as well as median homevalues are somewhat greater on average in LICs that receiveinvestment.
In Panel C of Table 1, I also present average values of themain outcomevariables of interest, including average changes between 2000 and 2005–
26 The number of tracts in column (3) is less than in column (1) because, as discussedin Section 2.2, a small amount of subsidized investment occurs outside LICs.
2009 in log median home values, log median household income, povertyrates (measured in percentage points), unemployment rates (measuredin percentage points), and the percentage of households in a differ-ent residence than one year ago (measured in percentage points andlabeled household turnover). Even in the unconditional means ofthe outcomes reported in columns (3) and (4), there is some sug-gestive evidence of relative improvement in LICs that receivedNMTC-subsidized investment. For instance, home values increasedmore and poverty rates and unemployment rates increased less inLICs that received investment compared to those that did not. How-ever, comparisons only among LICs could be biased by unobservableneighborhood characteristics correlated with NMTC-subsidized in-vestment and with outcomes. The RD design outlined in the previ-ous section aims to address this problem by comparing only tractsin a narrow window around the 0.8 MFI ratio cutoff, where LIC sta-tus can be thought of as randomly assigned to tracts.
4.3. RD sample
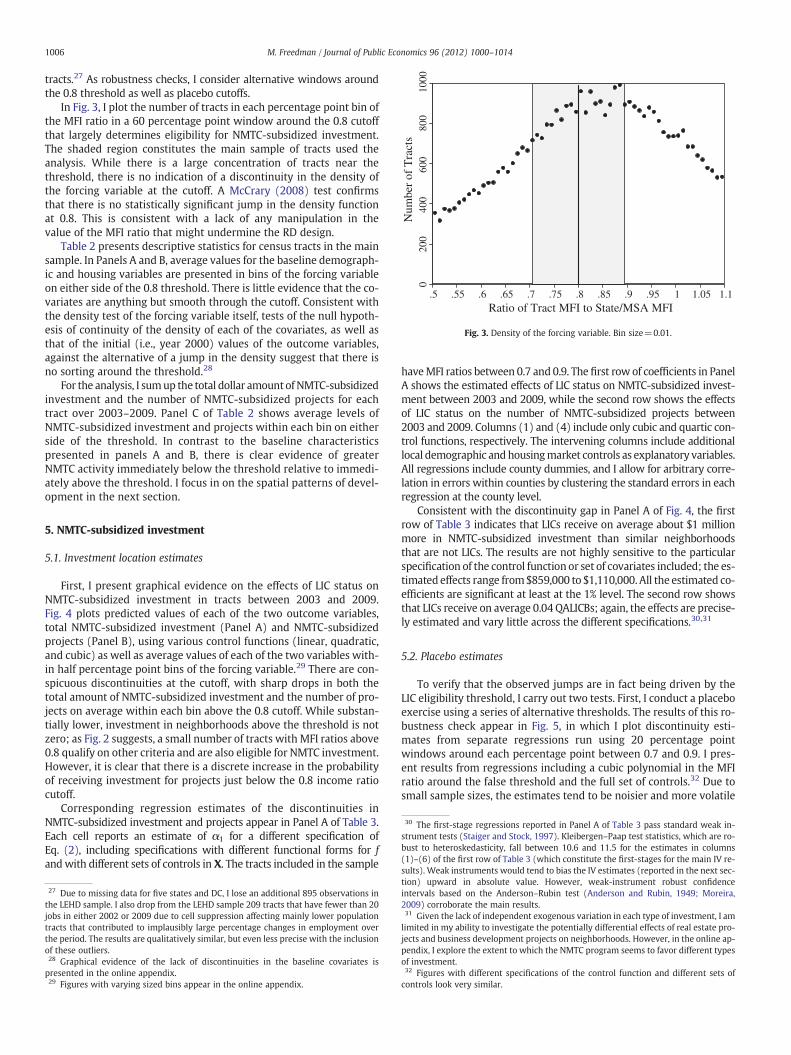
For the RD design to be valid, a sufficiently narrow window aroundthe relevant threshold must be used to ensure that observations on ei-ther side are similar along both observable and unobservable dimen-sions. In the main analysis, I limit attention to census tracts with MFIratios (based on 2000 Decennial data) between 0.7 and 0.9 (inclusive).The final sample of tracts in the U.S. (excluding Puerto Rico) with allrequisite variables available and that are not in GO Zones is 17,271
020
040
060
080
010
00N
umbe
r of
Tra
cts
.5 .55 .6 .65 .7 .75 .8 .85 .9 .95 1 1.05 1.1Ratio of Tract MFI to State/MSA MFI
Fig. 3. Density of the forcing variable. Bin size=0.01.
30 The first-stage regressions reported in Panel A of Table 3 pass standard weak in-strument tests (Staiger and Stock, 1997). Kleibergen–Paap test statistics, which are ro-bust to heteroskedasticity, fall between 10.6 and 11.5 for the estimates in columns(1)–(6) of the first row of Table 3 (which constitute the first-stages for the main IV re-sults). Weak instruments would tend to bias the IV estimates (reported in the next sec-
1006 M. Freedman / Journal of Public Economics 96 (2012) 1000–1014
tracts.27 As robustness checks, I consider alternative windows aroundthe 0.8 threshold as well as placebo cutoffs.
In Fig. 3, I plot the number of tracts in each percentage point bin ofthe MFI ratio in a 60 percentage point window around the 0.8 cutoffthat largely determines eligibility for NMTC-subsidized investment.The shaded region constitutes the main sample of tracts used theanalysis. While there is a large concentration of tracts near thethreshold, there is no indication of a discontinuity in the density ofthe forcing variable at the cutoff. A McCrary (2008) test confirmsthat there is no statistically significant jump in the density functionat 0.8. This is consistent with a lack of any manipulation in thevalue of the MFI ratio that might undermine the RD design.
Table 2 presents descriptive statistics for census tracts in the mainsample. In Panels A and B, average values for the baseline demograph-ic and housing variables are presented in bins of the forcing variableon either side of the 0.8 threshold. There is little evidence that the co-variates are anything but smooth through the cutoff. Consistent withthe density test of the forcing variable itself, tests of the null hypoth-esis of continuity of the density of each of the covariates, as well asthat of the initial (i.e., year 2000) values of the outcome variables,against the alternative of a jump in the density suggest that there isno sorting around the threshold.28
For the analysis, I sumup the total dollar amountof NMTC-subsidizedinvestment and the number of NMTC-subsidized projects for eachtract over 2003–2009. Panel C of Table 2 shows average levels ofNMTC-subsidized investment and projects within each bin on eitherside of the threshold. In contrast to the baseline characteristicspresented in panels A and B, there is clear evidence of greaterNMTC activity immediately below the threshold relative to immedi-ately above the threshold. I focus in on the spatial patterns of devel-opment in the next section.
5. NMTC-subsidized investment
5.1. Investment location estimates
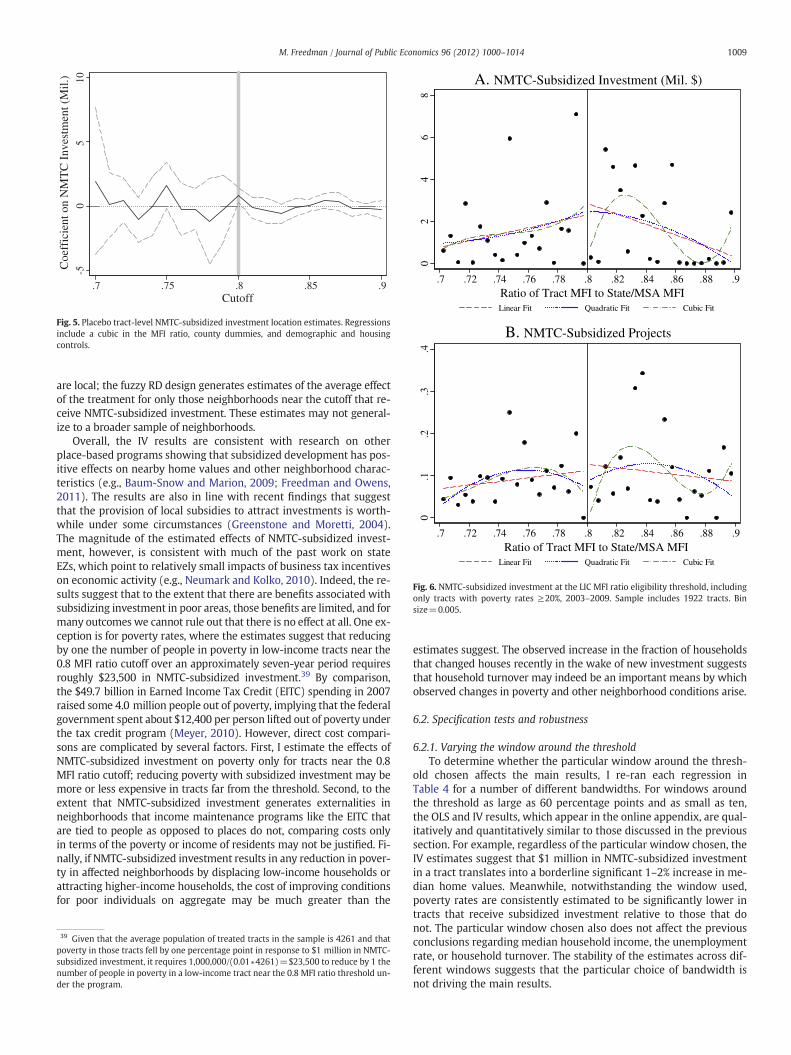
First, I present graphical evidence on the effects of LIC status onNMTC-subsidized investment in tracts between 2003 and 2009.Fig. 4 plots predicted values of each of the two outcome variables,total NMTC-subsidized investment (Panel A) and NMTC-subsidizedprojects (Panel B), using various control functions (linear, quadratic,and cubic) as well as average values of each of the two variables with-in half percentage point bins of the forcing variable.29 There are con-spicuous discontinuities at the cutoff, with sharp drops in both thetotal amount of NMTC-subsidized investment and the number of pro-jects on average within each bin above the 0.8 cutoff. While substan-tially lower, investment in neighborhoods above the threshold is notzero; as Fig. 2 suggests, a small number of tracts with MFI ratios above0.8 qualify on other criteria and are also eligible for NMTC investment.However, it is clear that there is a discrete increase in the probabilityof receiving investment for projects just below the 0.8 income ratiocutoff.
Corresponding regression estimates of the discontinuities inNMTC-subsidized investment and projects appear in Panel A of Table 3.Each cell reports an estimate of α1 for a different specification ofEq. (2), including specifications with different functional forms for fandwith different sets of controls in X. The tracts included in the sample
27 Due to missing data for five states and DC, I lose an additional 895 observations inthe LEHD sample. I also drop from the LEHD sample 209 tracts that have fewer than 20jobs in either 2002 or 2009 due to cell suppression affecting mainly lower populationtracts that contributed to implausibly large percentage changes in employment overthe period. The results are qualitatively similar, but even less precise with the inclusionof these outliers.28 Graphical evidence of the lack of discontinuities in the baseline covariates ispresented in the online appendix.29 Figures with varying sized bins appear in the online appendix.
haveMFI ratios between 0.7 and 0.9. The first row of coefficients in PanelA shows the estimated effects of LIC status on NMTC-subsidized invest-ment between 2003 and 2009, while the second row shows the effectsof LIC status on the number of NMTC-subsidized projects between2003 and 2009. Columns (1) and (4) include only cubic and quartic con-trol functions, respectively. The intervening columns include additionallocal demographic andhousingmarket controls as explanatory variables.All regressions include county dummies, and I allow for arbitrary corre-lation in errors within counties by clustering the standard errors in eachregression at the county level.
Consistent with the discontinuity gap in Panel A of Fig. 4, the firstrow of Table 3 indicates that LICs receive on average about $1 millionmore in NMTC-subsidized investment than similar neighborhoodsthat are not LICs. The results are not highly sensitive to the particularspecification of the control function or set of covariates included; the es-timated effects range from$859,000 to $1,110,000. All the estimated co-efficients are significant at least at the 1% level. The second row showsthat LICs receive on average 0.04 QALICBs; again, the effects are precise-ly estimated and vary little across the different specifications.30,31
5.2. Placebo estimates
To verify that the observed jumps are in fact being driven by theLIC eligibility threshold, I carry out two tests. First, I conduct a placeboexercise using a series of alternative thresholds. The results of this ro-bustness check appear in Fig. 5, in which I plot discontinuity esti-mates from separate regressions run using 20 percentage pointwindows around each percentage point between 0.7 and 0.9. I pres-ent results from regressions including a cubic polynomial in the MFIratio around the false threshold and the full set of controls.32 Due tosmall sample sizes, the estimates tend to be noisier and more volatile
tion) upward in absolute value. However, weak-instrument robust confidenceintervals based on the Anderson–Rubin test (Anderson and Rubin, 1949; Moreira,2009) corroborate the main results.31 Given the lack of independent exogenous variation in each type of investment, I amlimited in my ability to investigate the potentially differential effects of real estate pro-jects and business development projects on neighborhoods. However, in the online ap-pendix, I explore the extent to which the NMTC program seems to favor different typesof investment.32 Figures with different specifications of the control function and different sets ofcontrols look very similar.
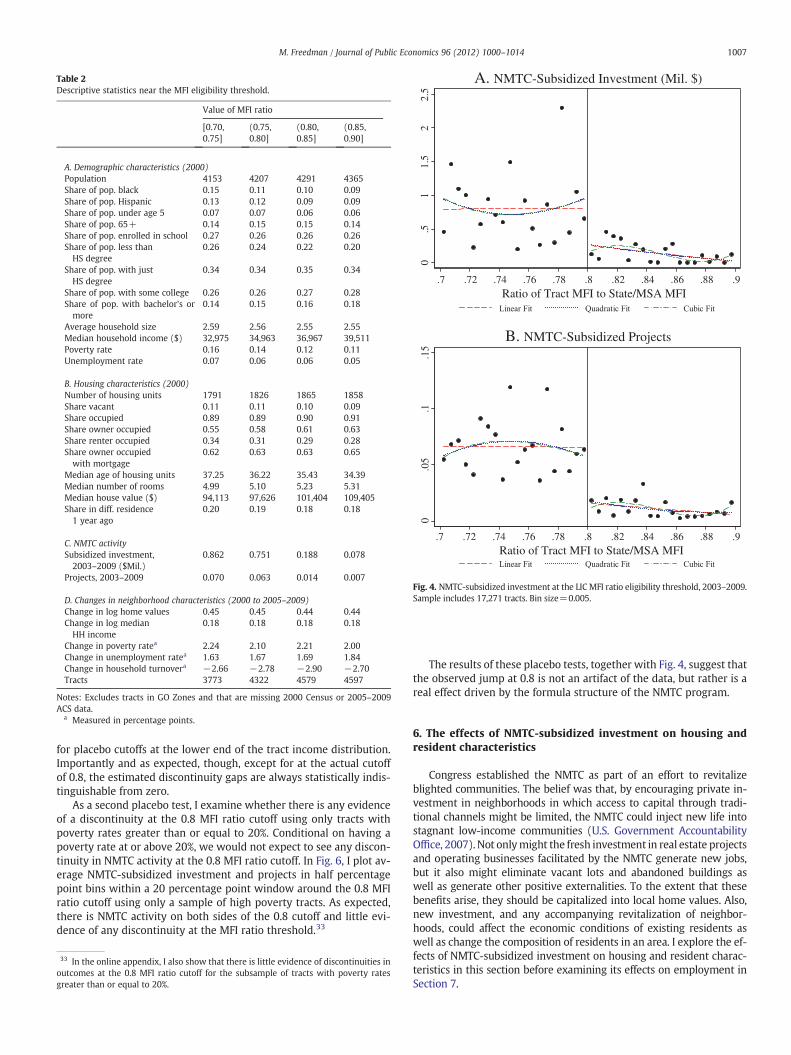
Table 2Descriptive statistics near the MFI eligibility threshold.
Value of MFI ratio
[0.70,0.75]
(0.75,0.80]
(0.80,0.85]
(0.85,0.90]
A. Demographic characteristics (2000)Population 4153 4207 4291 4365Share of pop. black 0.15 0.11 0.10 0.09Share of pop. Hispanic 0.13 0.12 0.09 0.09Share of pop. under age 5 0.07 0.07 0.06 0.06Share of pop. 65+ 0.14 0.15 0.15 0.14Share of pop. enrolled in school 0.27 0.26 0.26 0.26Share of pop. less thanHS degree
0.26 0.24 0.22 0.20
Share of pop. with justHS degree
0.34 0.34 0.35 0.34
Share of pop. with some college 0.26 0.26 0.27 0.28Share of pop. with bachelor's ormore
0.14 0.15 0.16 0.18
Average household size 2.59 2.56 2.55 2.55Median household income ($) 32,975 34,963 36,967 39,511Poverty rate 0.16 0.14 0.12 0.11Unemployment rate 0.07 0.06 0.06 0.05
B. Housing characteristics (2000)Number of housing units 1791 1826 1865 1858Share vacant 0.11 0.11 0.10 0.09Share occupied 0.89 0.89 0.90 0.91Share owner occupied 0.55 0.58 0.61 0.63Share renter occupied 0.34 0.31 0.29 0.28Share owner occupiedwith mortgage
0.62 0.63 0.63 0.65
Median age of housing units 37.25 36.22 35.43 34.39Median number of rooms 4.99 5.10 5.23 5.31Median house value ($) 94,113 97,626 101,404 109,405Share in diff. residence1 year ago
0.20 0.19 0.18 0.18
C. NMTC activitySubsidized investment,2003–2009 ($Mil.)
0.862 0.751 0.188 0.078
Projects, 2003–2009 0.070 0.063 0.014 0.007
D. Changes in neighborhood characteristics (2000 to 2005–2009)Change in log home values 0.45 0.45 0.44 0.44Change in log medianHH income
0.18 0.18 0.18 0.18
Change in poverty ratea 2.24 2.10 2.21 2.00Change in unemployment ratea 1.63 1.67 1.69 1.84Change in household turnovera −2.66 −2.78 −2.90 −2.70Tracts 3773 4322 4579 4597
Notes: Excludes tracts in GO Zones and that are missing 2000 Census or 2005–2009ACS data.
a Measured in percentage points.
A. NMTC-Subsidized Investment (Mil. $)
0.5
11.
52
2.5
.7 .72 .74 .76 .78 .8 .82 .84 .86 .88 .9Ratio of Tract MFI to State/MSA MFI
B. NMTC-Subsidized Projects
0.0
5.1
.15
.7 .72 .74 .76 .78 .8 .82 .84 .86 .88 .9Ratio of Tract MFI to State/MSA MFI
Fig. 4. NMTC-subsidized investment at the LIC MFI ratio eligibility threshold, 2003–2009.Sample includes 17,271 tracts. Bin size=0.005.
1007M. Freedman / Journal of Public Economics 96 (2012) 1000–1014
for placebo cutoffs at the lower end of the tract income distribution.Importantly and as expected, though, except for at the actual cutoffof 0.8, the estimated discontinuity gaps are always statistically indis-tinguishable from zero.
As a second placebo test, I examine whether there is any evidenceof a discontinuity at the 0.8 MFI ratio cutoff using only tracts withpoverty rates greater than or equal to 20%. Conditional on having apoverty rate at or above 20%, we would not expect to see any discon-tinuity in NMTC activity at the 0.8 MFI ratio cutoff. In Fig. 6, I plot av-erage NMTC-subsidized investment and projects in half percentagepoint bins within a 20 percentage point window around the 0.8 MFIratio cutoff using only a sample of high poverty tracts. As expected,there is NMTC activity on both sides of the 0.8 cutoff and little evi-dence of any discontinuity at the MFI ratio threshold.33
33 In the online appendix, I also show that there is little evidence of discontinuities inoutcomes at the 0.8 MFI ratio cutoff for the subsample of tracts with poverty ratesgreater than or equal to 20%.
The results of these placebo tests, together with Fig. 4, suggest thatthe observed jump at 0.8 is not an artifact of the data, but rather is areal effect driven by the formula structure of the NMTC program.
6. The effects of NMTC-subsidized investment on housing andresident characteristics
Congress established the NMTC as part of an effort to revitalizeblighted communities. The belief was that, by encouraging private in-vestment in neighborhoods in which access to capital through tradi-tional channels might be limited, the NMTC could inject new life intostagnant low-income communities (U.S. Government AccountabilityOffice, 2007). Not onlymight the fresh investment in real estate projectsand operating businesses facilitated by the NMTC generate new jobs,but it also might eliminate vacant lots and abandoned buildings aswell as generate other positive externalities. To the extent that thesebenefits arise, they should be capitalized into local home values. Also,new investment, and any accompanying revitalization of neighbor-hoods, could affect the economic conditions of existing residents aswell as change the composition of residents in an area. I explore the ef-fects of NMTC-subsidized investment on housing and resident charac-teristics in this section before examining its effects on employment inSection 7.
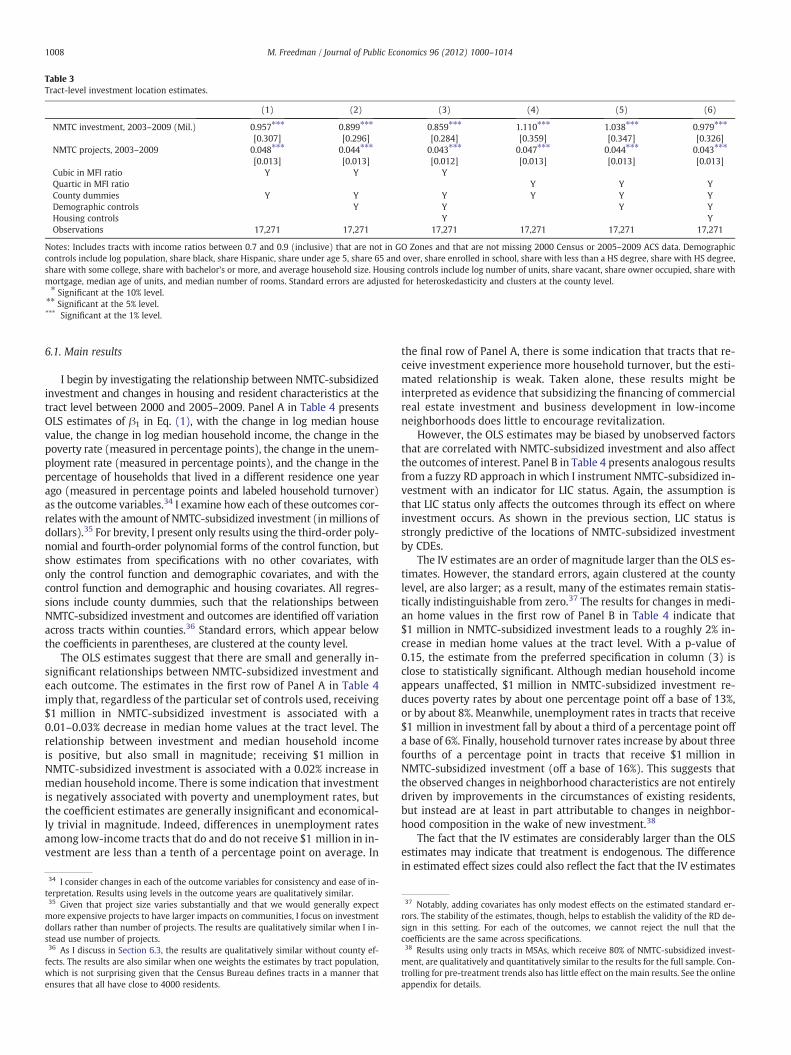
Table 3Tract-level investment location estimates.
(1) (2) (3) (4) (5) (6)
NMTC investment, 2003–2009 (Mil.) 0.957⁎⁎⁎ 0.899⁎⁎⁎ 0.859⁎⁎⁎ 1.110⁎⁎⁎ 1.038⁎⁎⁎ 0.979⁎⁎⁎
[0.307] [0.296] [0.284] [0.359] [0.347] [0.326]NMTC projects, 2003–2009 0.048⁎⁎⁎ 0.044⁎⁎⁎ 0.043⁎⁎⁎ 0.047⁎⁎⁎ 0.044⁎⁎⁎ 0.043⁎⁎⁎
[0.013] [0.013] [0.012] [0.013] [0.013] [0.013]Cubic in MFI ratio Y Y YQuartic in MFI ratio Y Y YCounty dummies Y Y Y Y Y YDemographic controls Y Y Y YHousing controls Y YObservations 17,271 17,271 17,271 17,271 17,271 17,271
Notes: Includes tracts with income ratios between 0.7 and 0.9 (inclusive) that are not in GO Zones and that are not missing 2000 Census or 2005–2009 ACS data. Demographiccontrols include log population, share black, share Hispanic, share under age 5, share 65 and over, share enrolled in school, share with less than a HS degree, share with HS degree,share with some college, share with bachelor's or more, and average household size. Housing controls include log number of units, share vacant, share owner occupied, share withmortgage, median age of units, and median number of rooms. Standard errors are adjusted for heteroskedasticity and clusters at the county level.⁎ Significant at the 10% level.
⁎⁎ Significant at the 5% level.⁎⁎⁎ Significant at the 1% level.
1008 M. Freedman / Journal of Public Economics 96 (2012) 1000–1014
6.1. Main results
I begin by investigating the relationship between NMTC-subsidizedinvestment and changes in housing and resident characteristics at thetract level between 2000 and 2005–2009. Panel A in Table 4 presentsOLS estimates of β1 in Eq. (1), with the change in log median housevalue, the change in log median household income, the change in thepoverty rate (measured in percentage points), the change in the unem-ployment rate (measured in percentage points), and the change in thepercentage of households that lived in a different residence one yearago (measured in percentage points and labeled household turnover)as the outcome variables.34 I examine how each of these outcomes cor-relates with the amount of NMTC-subsidized investment (inmillions ofdollars).35 For brevity, I present only results using the third-order poly-nomial and fourth-order polynomial forms of the control function, butshow estimates from specifications with no other covariates, withonly the control function and demographic covariates, and with thecontrol function and demographic and housing covariates. All regres-sions include county dummies, such that the relationships betweenNMTC-subsidized investment and outcomes are identified off variationacross tracts within counties.36 Standard errors, which appear belowthe coefficients in parentheses, are clustered at the county level.
The OLS estimates suggest that there are small and generally in-significant relationships between NMTC-subsidized investment andeach outcome. The estimates in the first row of Panel A in Table 4imply that, regardless of the particular set of controls used, receiving$1 million in NMTC-subsidized investment is associated with a0.01–0.03% decrease in median home values at the tract level. Therelationship between investment and median household incomeis positive, but also small in magnitude; receiving $1 million inNMTC-subsidized investment is associated with a 0.02% increase inmedian household income. There is some indication that investmentis negatively associated with poverty and unemployment rates, butthe coefficient estimates are generally insignificant and economical-ly trivial in magnitude. Indeed, differences in unemployment ratesamong low-income tracts that do and do not receive $1 million in in-vestment are less than a tenth of a percentage point on average. In
34 I consider changes in each of the outcome variables for consistency and ease of in-terpretation. Results using levels in the outcome years are qualitatively similar.35 Given that project size varies substantially and that we would generally expectmore expensive projects to have larger impacts on communities, I focus on investmentdollars rather than number of projects. The results are qualitatively similar when I in-stead use number of projects.36 As I discuss in Section 6.3, the results are qualitatively similar without county ef-fects. The results are also similar when one weights the estimates by tract population,which is not surprising given that the Census Bureau defines tracts in a manner thatensures that all have close to 4000 residents.
the final row of Panel A, there is some indication that tracts that re-ceive investment experience more household turnover, but the esti-mated relationship is weak. Taken alone, these results might beinterpreted as evidence that subsidizing the financing of commercialreal estate investment and business development in low-incomeneighborhoods does little to encourage revitalization.
However, the OLS estimates may be biased by unobserved factorsthat are correlated with NMTC-subsidized investment and also affectthe outcomes of interest. Panel B in Table 4 presents analogous resultsfrom a fuzzy RD approach in which I instrument NMTC-subsidized in-vestment with an indicator for LIC status. Again, the assumption isthat LIC status only affects the outcomes through its effect on whereinvestment occurs. As shown in the previous section, LIC status isstrongly predictive of the locations of NMTC-subsidized investmentby CDEs.
The IV estimates are an order of magnitude larger than the OLS es-timates. However, the standard errors, again clustered at the countylevel, are also larger; as a result, many of the estimates remain statis-tically indistinguishable from zero.37 The results for changes in medi-an home values in the first row of Panel B in Table 4 indicate that$1 million in NMTC-subsidized investment leads to a roughly 2% in-crease in median home values at the tract level. With a p-value of0.15, the estimate from the preferred specification in column (3) isclose to statistically significant. Although median household incomeappears unaffected, $1 million in NMTC-subsidized investment re-duces poverty rates by about one percentage point off a base of 13%,or by about 8%. Meanwhile, unemployment rates in tracts that receive$1 million in investment fall by about a third of a percentage point offa base of 6%. Finally, household turnover rates increase by about threefourths of a percentage point in tracts that receive $1 million inNMTC-subsidized investment (off a base of 16%). This suggests thatthe observed changes in neighborhood characteristics are not entirelydriven by improvements in the circumstances of existing residents,but instead are at least in part attributable to changes in neighbor-hood composition in the wake of new investment.38
The fact that the IV estimates are considerably larger than the OLSestimates may indicate that treatment is endogenous. The differencein estimated effect sizes could also reflect the fact that the IV estimates
37 Notably, adding covariates has only modest effects on the estimated standard er-rors. The stability of the estimates, though, helps to establish the validity of the RD de-sign in this setting. For each of the outcomes, we cannot reject the null that thecoefficients are the same across specifications.38 Results using only tracts in MSAs, which receive 80% of NMTC-subsidized invest-ment, are qualitatively and quantitatively similar to the results for the full sample. Con-trolling for pre-treatment trends also has little effect on the main results. See the onlineappendix for details.
A. NMTC-Subsidized Investment (Mil. $)
02
46
8
.7 .72 .74 .76 .78 .8 .82 .84 .86 .88 .9Ratio of Tract MFI to State/MSA MFI
B. NMTC-Subsidized Projects
0.1
.2.3
.4
.7 .72 .74 .76 .78 .8 .82 .84 .86 .88 .9Ratio of Tract MFI to State/MSA MFI
Fig. 6. NMTC-subsidized investment at the LIC MFI ratio eligibility threshold, includingonly tracts with poverty rates ≥20%, 2003–2009. Sample includes 1922 tracts. Binsize=0.005.
-50
510
Coe
ffic
ient
on
NM
TC
Inv
estm
ent (
Mil.
)
.7 .75 .8 .85 .9Cutoff
Fig. 5. Placebo tract-level NMTC-subsidized investment location estimates. Regressionsinclude a cubic in the MFI ratio, county dummies, and demographic and housingcontrols.
1009M. Freedman / Journal of Public Economics 96 (2012) 1000–1014
are local; the fuzzy RD design generates estimates of the average effectof the treatment for only those neighborhoods near the cutoff that re-ceive NMTC-subsidized investment. These estimates may not general-ize to a broader sample of neighborhoods.
Overall, the IV results are consistent with research on otherplace-based programs showing that subsidized development has pos-itive effects on nearby home values and other neighborhood charac-teristics (e.g., Baum-Snow and Marion, 2009; Freedman and Owens,2011). The results are also in line with recent findings that suggestthat the provision of local subsidies to attract investments is worth-while under some circumstances (Greenstone and Moretti, 2004).The magnitude of the estimated effects of NMTC-subsidized invest-ment, however, is consistent with much of the past work on stateEZs, which point to relatively small impacts of business tax incentiveson economic activity (e.g., Neumark and Kolko, 2010). Indeed, the re-sults suggest that to the extent that there are benefits associated withsubsidizing investment in poor areas, those benefits are limited, and formany outcomes we cannot rule out that there is no effect at all. One ex-ception is for poverty rates, where the estimates suggest that reducingby one the number of people in poverty in low-income tracts near the0.8 MFI ratio cutoff over an approximately seven-year period requiresroughly $23,500 in NMTC-subsidized investment.39 By comparison,the $49.7 billion in Earned Income Tax Credit (EITC) spending in 2007raised some 4.0 million people out of poverty, implying that the federalgovernment spent about $12,400 per person lifted out of poverty underthe tax credit program (Meyer, 2010). However, direct cost compari-sons are complicated by several factors. First, I estimate the effects ofNMTC-subsidized investment on poverty only for tracts near the 0.8MFI ratio cutoff; reducing poverty with subsidized investment may bemore or less expensive in tracts far from the threshold. Second, to theextent that NMTC-subsidized investment generates externalities inneighborhoods that income maintenance programs like the EITC thatare tied to people as opposed to places do not, comparing costs onlyin terms of the poverty or income of residents may not be justified. Fi-nally, if NMTC-subsidized investment results in any reduction in pover-ty in affected neighborhoods by displacing low-income households orattracting higher-income households, the cost of improving conditionsfor poor individuals on aggregate may be much greater than the
39 Given that the average population of treated tracts in the sample is 4261 and thatpoverty in those tracts fell by one percentage point in response to $1 million in NMTC-subsidized investment, it requires 1,000,000/(0.01∗4261)=$23,500 to reduce by 1 thenumber of people in poverty in a low-income tract near the 0.8 MFI ratio threshold un-der the program.
estimates suggest. The observed increase in the fraction of householdsthat changed houses recently in the wake of new investment suggeststhat household turnover may indeed be an important means by whichobserved changes in poverty and other neighborhood conditions arise.
6.2. Specification tests and robustness
6.2.1. Varying the window around the thresholdTo determine whether the particular window around the thresh-
old chosen affects the main results, I re-ran each regression inTable 4 for a number of different bandwidths. For windows aroundthe threshold as large as 60 percentage points and as small as ten,the OLS and IV results, which appear in the online appendix, are qual-itatively and quantitatively similar to those discussed in the previoussection. For example, regardless of the particular window chosen, theIV estimates suggest that $1 million in NMTC-subsidized investmentin a tract translates into a borderline significant 1–2% increase in me-dian home values. Meanwhile, notwithstanding the window used,poverty rates are consistently estimated to be significantly lower intracts that receive subsidized investment relative to those that donot. The particular window chosen also does not affect the previousconclusions regarding median household income, the unemploymentrate, or household turnover. The stability of the estimates across dif-ferent windows suggests that the particular choice of bandwidth isnot driving the main results.
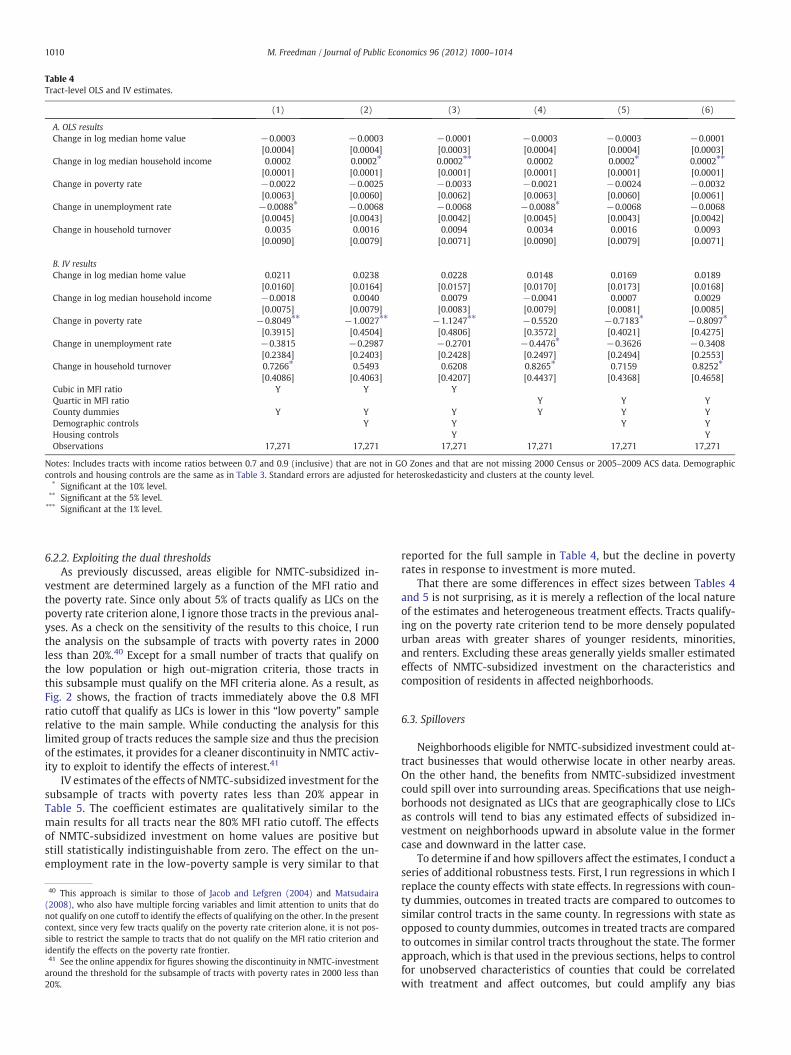
Table 4Tract-level OLS and IV estimates.
(1) (2) (3) (4) (5) (6)
A. OLS resultsChange in log median home value −0.0003 −0.0003 −0.0001 −0.0003 −0.0003 −0.0001
[0.0004] [0.0004] [0.0003] [0.0004] [0.0004] [0.0003]Change in log median household income 0.0002 0.0002⁎ 0.0002⁎⁎ 0.0002 0.0002⁎ 0.0002⁎⁎
[0.0001] [0.0001] [0.0001] [0.0001] [0.0001] [0.0001]Change in poverty rate −0.0022 −0.0025 −0.0033 −0.0021 −0.0024 −0.0032
[0.0063] [0.0060] [0.0062] [0.0063] [0.0060] [0.0061]Change in unemployment rate −0.0088⁎ −0.0068 −0.0068 −0.0088⁎ −0.0068 −0.0068
[0.0045] [0.0043] [0.0042] [0.0045] [0.0043] [0.0042]Change in household turnover 0.0035 0.0016 0.0094 0.0034 0.0016 0.0093
[0.0090] [0.0079] [0.0071] [0.0090] [0.0079] [0.0071]
B. IV resultsChange in log median home value 0.0211 0.0238 0.0228 0.0148 0.0169 0.0189
[0.0160] [0.0164] [0.0157] [0.0170] [0.0173] [0.0168]Change in log median household income −0.0018 0.0040 0.0079 −0.0041 0.0007 0.0029
[0.0075] [0.0079] [0.0083] [0.0079] [0.0081] [0.0085]Change in poverty rate −0.8049⁎⁎ −1.0027⁎⁎ −1.1247⁎⁎ −0.5520 −0.7183⁎ −0.8097⁎
[0.3915] [0.4504] [0.4806] [0.3572] [0.4021] [0.4275]Change in unemployment rate −0.3815 −0.2987 −0.2701 −0.4476⁎ −0.3626 −0.3408
[0.2384] [0.2403] [0.2428] [0.2497] [0.2494] [0.2553]Change in household turnover 0.7266⁎ 0.5493 0.6208 0.8265⁎ 0.7159 0.8252⁎
[0.4086] [0.4063] [0.4207] [0.4437] [0.4368] [0.4658]Cubic in MFI ratio Y Y YQuartic in MFI ratio Y Y YCounty dummies Y Y Y Y Y YDemographic controls Y Y Y YHousing controls Y YObservations 17,271 17,271 17,271 17,271 17,271 17,271
Notes: Includes tracts with income ratios between 0.7 and 0.9 (inclusive) that are not in GO Zones and that are not missing 2000 Census or 2005–2009 ACS data. Demographiccontrols and housing controls are the same as in Table 3. Standard errors are adjusted for heteroskedasticity and clusters at the county level.
⁎ Significant at the 10% level.⁎⁎ Significant at the 5% level.⁎⁎⁎ Significant at the 1% level.
1010 M. Freedman / Journal of Public Economics 96 (2012) 1000–1014
6.2.2. Exploiting the dual thresholdsAs previously discussed, areas eligible for NMTC-subsidized in-
vestment are determined largely as a function of the MFI ratio andthe poverty rate. Since only about 5% of tracts qualify as LICs on thepoverty rate criterion alone, I ignore those tracts in the previous anal-yses. As a check on the sensitivity of the results to this choice, I runthe analysis on the subsample of tracts with poverty rates in 2000less than 20%.40 Except for a small number of tracts that qualify onthe low population or high out-migration criteria, those tracts inthis subsample must qualify on the MFI criteria alone. As a result, asFig. 2 shows, the fraction of tracts immediately above the 0.8 MFIratio cutoff that qualify as LICs is lower in this “low poverty” samplerelative to the main sample. While conducting the analysis for thislimited group of tracts reduces the sample size and thus the precisionof the estimates, it provides for a cleaner discontinuity in NMTC activ-ity to exploit to identify the effects of interest.41
IV estimates of the effects of NMTC-subsidized investment for thesubsample of tracts with poverty rates less than 20% appear inTable 5. The coefficient estimates are qualitatively similar to themain results for all tracts near the 80% MFI ratio cutoff. The effectsof NMTC-subsidized investment on home values are positive butstill statistically indistinguishable from zero. The effect on the un-employment rate in the low-poverty sample is very similar to that
40 This approach is similar to those of Jacob and Lefgren (2004) and Matsudaira(2008), who also have multiple forcing variables and limit attention to units that donot qualify on one cutoff to identify the effects of qualifying on the other. In the presentcontext, since very few tracts qualify on the poverty rate criterion alone, it is not pos-sible to restrict the sample to tracts that do not qualify on the MFI ratio criterion andidentify the effects on the poverty rate frontier.41 See the online appendix for figures showing the discontinuity in NMTC-investmentaround the threshold for the subsample of tracts with poverty rates in 2000 less than20%.
reported for the full sample in Table 4, but the decline in povertyrates in response to investment is more muted.
That there are some differences in effect sizes between Tables 4and 5 is not surprising, as it is merely a reflection of the local natureof the estimates and heterogeneous treatment effects. Tracts qualify-ing on the poverty rate criterion tend to be more densely populatedurban areas with greater shares of younger residents, minorities,and renters. Excluding these areas generally yields smaller estimatedeffects of NMTC-subsidized investment on the characteristics andcomposition of residents in affected neighborhoods.
6.3. Spillovers
Neighborhoods eligible for NMTC-subsidized investment could at-tract businesses that would otherwise locate in other nearby areas.On the other hand, the benefits from NMTC-subsidized investmentcould spill over into surrounding areas. Specifications that use neigh-borhoods not designated as LICs that are geographically close to LICsas controls will tend to bias any estimated effects of subsidized in-vestment on neighborhoods upward in absolute value in the formercase and downward in the latter case.
To determine if and how spillovers affect the estimates, I conduct aseries of additional robustness tests. First, I run regressions in which Ireplace the county effects with state effects. In regressions with coun-ty dummies, outcomes in treated tracts are compared to outcomes tosimilar control tracts in the same county. In regressions with state asopposed to county dummies, outcomes in treated tracts are comparedto outcomes in similar control tracts throughout the state. The formerapproach, which is that used in the previous sections, helps to controlfor unobserved characteristics of counties that could be correlatedwith treatment and affect outcomes, but could amplify any bias
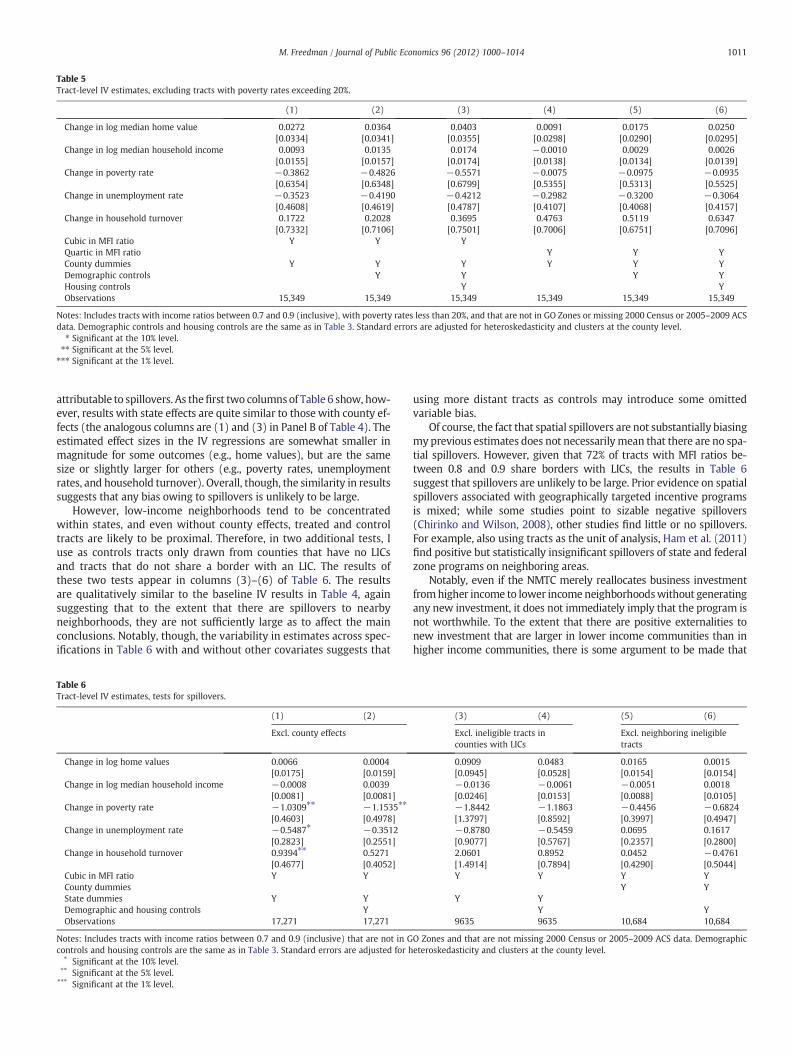
Table 5Tract-level IV estimates, excluding tracts with poverty rates exceeding 20%.
(1) (2) (3) (4) (5) (6)
Change in log median home value 0.0272 0.0364 0.0403 0.0091 0.0175 0.0250[0.0334] [0.0341] [0.0355] [0.0298] [0.0290] [0.0295]
Change in log median household income 0.0093 0.0135 0.0174 −0.0010 0.0029 0.0026[0.0155] [0.0157] [0.0174] [0.0138] [0.0134] [0.0139]
Change in poverty rate −0.3862 −0.4826 −0.5571 −0.0075 −0.0975 −0.0935[0.6354] [0.6348] [0.6799] [0.5355] [0.5313] [0.5525]
Change in unemployment rate −0.3523 −0.4190 −0.4212 −0.2982 −0.3200 −0.3064[0.4608] [0.4619] [0.4787] [0.4107] [0.4068] [0.4157]
Change in household turnover 0.1722 0.2028 0.3695 0.4763 0.5119 0.6347[0.7332] [0.7106] [0.7501] [0.7006] [0.6751] [0.7096]
Cubic in MFI ratio Y Y YQuartic in MFI ratio Y Y YCounty dummies Y Y Y Y Y YDemographic controls Y Y Y YHousing controls Y YObservations 15,349 15,349 15,349 15,349 15,349 15,349
Notes: Includes tracts with income ratios between 0.7 and 0.9 (inclusive), with poverty rates less than 20%, and that are not in GO Zones or missing 2000 Census or 2005–2009 ACSdata. Demographic controls and housing controls are the same as in Table 3. Standard errors are adjusted for heteroskedasticity and clusters at the county level.
⁎ Significant at the 10% level.⁎⁎ Significant at the 5% level.
⁎⁎⁎ Significant at the 1% level.
1011M. Freedman / Journal of Public Economics 96 (2012) 1000–1014
attributable to spillovers. As thefirst two columnsof Table 6 show, how-ever, results with state effects are quite similar to those with county ef-fects (the analogous columns are (1) and (3) in Panel B of Table 4). Theestimated effect sizes in the IV regressions are somewhat smaller inmagnitude for some outcomes (e.g., home values), but are the samesize or slightly larger for others (e.g., poverty rates, unemploymentrates, and household turnover). Overall, though, the similarity in resultssuggests that any bias owing to spillovers is unlikely to be large.
However, low-income neighborhoods tend to be concentratedwithin states, and even without county effects, treated and controltracts are likely to be proximal. Therefore, in two additional tests, Iuse as controls tracts only drawn from counties that have no LICsand tracts that do not share a border with an LIC. The results ofthese two tests appear in columns (3)–(6) of Table 6. The resultsare qualitatively similar to the baseline IV results in Table 4, againsuggesting that to the extent that there are spillovers to nearbyneighborhoods, they are not sufficiently large as to affect the mainconclusions. Notably, though, the variability in estimates across spec-ifications in Table 6 with and without other covariates suggests that
Table 6Tract-level IV estimates, tests for spillovers.
(1) (2)
Excl. county effects
Change in log home values 0.0066 0.0004[0.0175] [0.0159]
Change in log median household income −0.0008 0.0039[0.0081] [0.0081]
Change in poverty rate −1.0309⁎⁎ −1.1535⁎⁎
[0.4603] [0.4978]Change in unemployment rate −0.5487⁎ −0.3512
[0.2823] [0.2551]Change in household turnover 0.9394⁎⁎ 0.5271
[0.4677] [0.4052]Cubic in MFI ratio Y YCounty dummiesState dummies Y YDemographic and housing controls YObservations 17,271 17,271
Notes: Includes tracts with income ratios between 0.7 and 0.9 (inclusive) that are not in Gcontrols and housing controls are the same as in Table 3. Standard errors are adjusted for h
⁎ Significant at the 10% level.⁎⁎ Significant at the 5% level.⁎⁎⁎ Significant at the 1% level.
using more distant tracts as controls may introduce some omittedvariable bias.
Of course, the fact that spatial spillovers are not substantially biasingmy previous estimates does not necessarily mean that there are no spa-tial spillovers. However, given that 72% of tracts with MFI ratios be-tween 0.8 and 0.9 share borders with LICs, the results in Table 6suggest that spillovers are unlikely to be large. Prior evidence on spatialspillovers associated with geographically targeted incentive programsis mixed; while some studies point to sizable negative spillovers(Chirinko and Wilson, 2008), other studies find little or no spillovers.For example, also using tracts as the unit of analysis, Ham et al. (2011)find positive but statistically insignificant spillovers of state and federalzone programs on neighboring areas.
Notably, even if the NMTC merely reallocates business investmentfromhigher income to lower income neighborhoodswithout generatingany new investment, it does not immediately imply that the program isnot worthwhile. To the extent that there are positive externalities tonew investment that are larger in lower income communities than inhigher income communities, there is some argument to be made that
(3) (4) (5) (6)
Excl. ineligible tracts incounties with LICs
Excl. neighboring ineligibletracts
0.0909 0.0483 0.0165 0.0015[0.0945] [0.0528] [0.0154] [0.0154]−0.0136 −0.0061 −0.0051 0.0018[0.0246] [0.0153] [0.0088] [0.0105]−1.8442 −1.1863 −0.4456 −0.6824[1.3797] [0.8592] [0.3997] [0.4947]−0.8780 −0.5459 0.0695 0.1617[0.9077] [0.5767] [0.2357] [0.2800]2.0601 0.8952 0.0452 −0.4761[1.4914] [0.7894] [0.4290] [0.5044]Y Y Y Y
Y YY Y
Y Y9635 9635 10,684 10,684
O Zones and that are not missing 2000 Census or 2005–2009 ACS data. Demographiceteroskedasticity and clusters at the county level.
Table 7Tract-level IV estimates, employment and job composition.
(1) (2) (3) (4) (5) (6)
Change in log private employment 0.0117 0.0130 0.0129 0.0168 0.0185 0.0163[0.0319] [0.0339] [0.0355] [0.0310] [0.0331] [0.0343]
Change in percentage jobs paying b$15K/year −1.0575 −1.0640 −1.1296 −1.2601⁎ −1.2670 −1.3487[0.6821] [0.7217] [0.7695] [0.7442] [0.7891] [0.8419]
Change in percentage jobs paying $15K–$40 K/year 0.4738 0.5007 0.5676 0.4574 0.4624 0.5191[0.5450] [0.5854] [0.6240] [0.5570] [0.5973] [0.6328]
Change in percentage jobs paying $40K+/year 0.5838 0.5632 0.5620 0.8027 0.8046 0.8296[0.5777] [0.6042] [0.6371] [0.6329] [0.6587] [0.6961]
Cubic in MFI ratio Y Y YQuartic in MFI ratio Y Y YCounty dummies Y Y Y Y Y YDemographic controls Y Y Y YHousing controls Y YObservations 16,167 16,167 16,167 16,167 16,167 16,167
Notes: Includes tracts with income ratios between 0.7 and 0.9 (inclusive) that are not in GO Zones and that are not missing 2000 Census or 2005–2009 ACS data. Excludes AZ, AR,DC, MA, MS, and NH and tracts with fewer than 20 jobs. Demographic controls and housing controls are the same as in Table 3. Standard errors are adjusted for heteroskedasticityand clusters at the county level.
⁎ Significant at the 10% level.⁎⁎ Significant at the 5% level.⁎⁎⁎ Significant at the 1% level.
42 A primary job represents the job that accounts for the largest fraction of an individ-ual's annual earnings. The results are similar if one includes both primary and second-ary jobs in the sample.
1012 M. Freedman / Journal of Public Economics 96 (2012) 1000–1014
thegovernment should attempt to redirect some investment into poorerareas. On the other hand, if most of the money is funding investmentsthat would have occurred in low-income neighborhoods regardless ofthe program, it would represent a more significant concern. I discussthe issue of crowd out in more detail in the next section.
7. Crowd out and employment effects
Amajor concern regarding the NMTC is that funds may be allocatedto projects that would have received financing regardless. A direct testof the extent of crowd out, which has been significant in place-basedhousing programs (Sinai and Waldfogel, 2005; Eriksen and Rosenthal,2010), would require data not only on NMTC-subsidized business in-vestment and commercial real estate transactions, but also on all busi-ness investment and commercial real estate transactions. The lack of adiscontinuity in these indicators at the LIC threshold would indicatethat the program is having little effect on overall business activity.
I do not attempt to quantify the precise amount of crowd out asso-ciated with the NMTC in this paper due to the lack of such expansiveand detailed data. However, to the extent that there is crowd out ofunsubsidized investment, one would expect to find little to no effectof NMTC-subsidized investment on housing and resident characteris-tics. Yet as discussed in the previous section, there is some indicationthat subsidized investment has positive, albeit small, effects on neigh-borhood conditions. Though still merely suggestive, a change in totalemployment and the composition of jobs in an area in response tonew investment would provide more compelling evidence that theNMTC program is not merely crowding out private unsubsidizedinvestment.
Using LEHD data for 45 states between 2002 and 2009, I exploitthe discontinuity generated by the rule determining LIC status totest whether investment subsidized by the NMTC program betweenthose years affected the total number of private-sector jobs and thecomposition of those jobs within tracts. Finding a positive effect onemployment and the quality of jobs (in this case measured by earn-ings) would help to rationalize some of the findings with respect tohome values, poverty, and unemployment. On the other hand, thefinding of no effect on employment or the types of jobs in a commu-nity would not be entirely inconsistent with the previous results forneighborhood residents; even if they do not create new jobs, to theextent that NMTC-subsidized investments have amenity effects(e.g., by tearing down abandoned properties) or attract relatively af-fluent people to an area, they could have positive implications for res-ident survey-based measures of neighborhood conditions.
I present IV results using the LEHD data in Table 7. The results in thefirst row suggest that investment subsidized under the NMTC programhas a modest positive effect on private-sector employment. Althoughimprecisely estimated, the estimates suggest that $1 million in invest-ment increases the number of private-sector jobs in a relatively poortract by about 1–2%. For tracts near the cutoff, which on average haveabout 1320 private-sector jobs, that translates into roughly 20 jobs,each coming at a cost of approximately $50,000. This is consistentwith cost estimates fromother place-based programs aimed at fosteringbusiness activity in distressed areas; recent research has suggested thatthe cost of creating a job under state EZ programs and federal Empow-erment Zones and Enterprise Communities programs is in the range of$20,000 to $100,000 (Glaeser and Gottlieb, 2008). Notably, though,while the job counts exclude secondary jobs, there is no restriction onearnings or hours on the primary jobs included in the sample.42
Hence, the cost per full-time equivalent job is likely well above $50,000.The results in Table 7 also show that NMTC investment is associated
with a reduction in the share of jobs that pay less than $15,000 annuallyand a commensurate increase in the share of jobs paying $15,000 annu-ally or more. Though there was a rightward shift in the distribution ofearnings across tracts over the time period considered, the shift wasmore pronounced in tracts that received NMTC-subsidized investment.This suggests that, to the extent that subsidized investment generatedjobs, those jobs tended to be higher quality jobs on average. These re-sults are consistent with Busso et al. (2012), who findmodest increasesin wages among workers in federal urban Empowerment Zones. None-theless, the changes in shares of jobs in each pay category in response tonew investment are not large, and in general, we cannot rule out thatinvestment had no effect on average job quality. However, the patternthat emerges from these results and those results in the previous sec-tion suggests that, even though the program is relatively new andmany of its projects might still be taking root, there may be some posi-tive impact of subsidized investment on low-income neighborhoods.
While not conclusive, these results also suggest that to the extentthat there is crowd out associated with the NMTC program, it is notcomplete. This finding is consistent with Gurley-Calvez et al. (2009),who analyze individual and corporate income tax data and arguethat the NMTC crowds out some, but not all private investment. Theresults are also in line with recent qualitative work on the NMTC, in-cluding studies by the U.S. Government Accountability Office (2007,

1013M. Freedman / Journal of Public Economics 96 (2012) 1000–1014
2010) and Abravanel et al. (2007). These reports suggest that while aconcern, crowd out does not appear to be complete and that someprojects would not be feasible without NMTC support.43 Further,both the GAO and Abravanel et al. conclude that although communitybenefits were not a chief concern in CDEs' selection of projects, therewas some evidence that NMTC-subsidized investment in poor areashad positive spillovers.
8. Conclusion
Although place-based policies have grown in importance in recentdecades, many remain skeptical of their efficacy. Lending credence tothis skepticism are numerous studies on programs such as state EZsthat suggest that there is little to no benefit associated with subsidiz-ing investment in struggling cities and neighborhoods. However,many of these studies have struggled themselves with identification,due in large part to self-selection of areas into place-based programs.
The paper adds to the literature on place-based programs by eval-uating the effects of the New Markets Tax Credit (NMTC) program onneighborhoods. The structure of the program allows me to overcomeendogeneity and selection problems that have plagued past studieson other place-based programs. In particular, a discontinuity in theformula used to determine program eligibility for census tracts gener-ates pseudo-random assignment of NMTC-subsidized investment toneighborhoods around a certain income threshold. Tracts below thethreshold are eligible to receive investment under the program,whereas those above it are generally not eligible. However, the tractson either side of the threshold are otherwise similar. Hence, compar-ing outcomes among tracts within a sufficiently narrow windowaround the cutoff permits one to draw causal inferences regardingthe effects of NMTC-subsidized investment on neighborhoods.
I find some evidence that investment subsidized under the NMTCprogram reduces poverty and unemployment rates in relativelylow-income census tracts, although the results suggest that someof these effects are driven by changes in the composition of residentsrather than improvement in the welfare of existing residents. Theimpacts on other neighborhood characteristics, including homevalues, are positive but statistically indistinguishable from zero.There is also some evidence to suggest that investment increasestotal private-sector employment and improves the quality of jobsin affected areas. However, the estimated effects are not large andare often statistically imprecise. I tentatively conclude that whilethere appear to be somepositive effects of subsidized investment in dis-advantaged neighborhoods, the benefits associated with subsidized in-vestment are modest. This finding is consistent with results fromstudies on other place-based programs, such as the Low-Income Hous-ing Tax Credit (Baum-Snow andMarion, 2009) and the Community Re-investment Act (Gabriel and Rosenthal, 2009).
More broadly, this paper builds on a burgeoning literature exploitinggeographic boundaries to identify the effects of various policies andprograms. Research along these lines include studies on education(Black, 1999), the environment (Ito, 2011), social insurance programs(Lalive, 2008), minimum wages (Dube et al., 2010), and other areas.Expanding on this literature, this paper exploits a discontinuous eligibil-ity formula that generates quasi-experimental variation across geogra-phies in subsidized investment to evaluate a large-scale place-basedprogram that aims to reinvigorate distressed communities. While theNMTC program is still in its infancy and further research is necessaryto establish its longer-run impacts on neighborhoods, this paper sug-gests that its initial effects may be positive, but not large.
Acknowledgments
I would like to thank John Abowd, David Card, Mark Duggan,George Jakubson, David Lee, Jeffrey Lin, Alexandre Mas, JordanMatsudaira, Henry Overman, Emily Owens, Philip Tegeler, Brett
Theodos, Lars Vilhuber, Jeffrey Zax, and two anonymous referees aswell as seminar participants at Cornell University, the Federal ReserveBank of Philadelphia, Princeton University, the University of Roches-ter, the Association for Public Policy Analysis and Management Meet-ings, and the Urban Economics Association Meetings for helpfulcomments. I would also like to thank Greg Bischak, Jim Greer, and Jo-seph Valenti at the Community Development Financial InstitutionsFund at the U.S. Treasury for assistance with the data used in thisstudy and for sharing their insights into the details of the New Mar-kets Tax Credit program. The research reported in this article used re-sources provided by Cornell University's Social Science Gateway,which is funded through NSF Grant 0922005. All the views expressedin this paper are my own and in no way reflect those of the U.S. De-partment of the Treasury.
Appendix A. Supplementary data
Supplementary data to this article can be found online at http://dx.doi.org/10.1016/j.jpubeco.2012.07.006.
References
Abravanel, Martin, Pindus, Nancy, Theodos, Brett, 2007. Analysis of selected New Mar-kets Tax Credit projects. Urban Institute, Report for the US Department of Treasury,Community Development Financial Institutions Fund.
Anderson, T.W., Rubin, Herman, 1949. Estimators of the parameters of a single equa-tion in a complete set of stochastic equations. Annals of Mathematical Statistics20 (1), 570–582.
Andersson, Fredrik, Freedman, Matthew, Roemer, Marc, Vilhuber, Lars, 2008. LEHDOnTheMap technical documentation. Technical Paper DATA-OTM-2.0.3. U.S. Cen-sus Bureau.
Armistead, P. Jefferson, 2005. Is the NMTC program making a difference in low-incomecommunities? Community Development Investment Review 1 (1), 13–20.
Baum-Snow, Nathaniel, Marion, Justin, 2009. The effects of low-income housing taxcredit development on neighborhoods. Journal of Public Economics 93 (5–6),654–666.
Bhutta, Neil, 2010. GSE activity and mortgage supply in lower-income and minorityneighborhoods: The effect of the affordable housing goals. Journal of Real Estate Fi-nance and Economics 45 (1), 238–261.
Billings, Stephen, 2009. Do enterprise zones work? An analysis at the borders. PublicFinance Review 37 (1), 68–93.
Black, Sandra, 1999. Do better schools matter? Parental valuation of elementary educa-tion. Quarterly Journal of Economics 114 (2), 577–599.
Boarnet, Marlon, Bogart, William, 1996. Enterprise zones and employment: evidencefrom New Jersey. Journal of Urban Economics 40 (2), 198–215.
Busso, Matias, Gregory, Jesse, Kline, Patrick, 2012. Assessing the incidence and efficien-cy of a prominent place based policy. American Economic Review. http://dx.doi.org/10.2139/ssrn.1768086.
Chay, Kenneth, Greenstone, Michael, 2005. Does air quality matter? Evidence from thehousing market. Journal of Political Economy 113 (2), 376–424.
Chirinko, Robert, Wilson, Daniel, 2008. State investment tax incentives: a zero-sumgame? Journal of Public Economics 92 (12), 2362–2384.
Dube, Arindrajit, Lester, William, Reich, Michael, 2010. Minimum wage effects acrossstate borders: estimates using contiguous counties. The Review of Economics andStatistics 92 (4), 945–964.
Elvery, Joel, 2009. The impact of enterprise zones on residential employment: an eval-uation of the enterprise zone programs of California and Florida. Economic Devel-opment Quarterly 23 (1), 44–59.
Eriksen, Michael, Rosenthal, Stuart, 2010. Crowd out effects of place-based subsidizedrental housing: new evidence from the LIHTC program. Journal of Public Econom-ics 94 (11–12), 953–966.
Freedman, Matthew, forthcoming. Targeted business incentives and local labor mar-kets. Journal of Human Resources.
Freedman, Matthew, Owens, Emily, 2011. Low-income housing development andcrime. Journal of Urban Economics 70 (2–3), 115–131.
Gabriel, Stuart, Rosenthal, Stuart, 2009. Government-sponsored enterprises, the commu-nity reinvestment act, and homeownership in targeted underserved neighborhoods.In: Glaeser, Edward, Quigley, John (Eds.), HousingMarkets and the Economy. LincolnInstitute of Land Policy, Cambridge, MA.
Glaeser, Edward, Gottlieb, Joshua, 2008. The economics of place-making policies.Brookings Papers on Economic Activity 39 (1), 155–253.
Greenstone, Michael, Moretti, Enrico, 2004. Bidding for industrial plants: does winninga ‘million dollar plant’ increase welfare? NBER Working Paper 9844.
Gurley-Calvez, Tami, Gilbert, Thomas, Harper, Katherine, Marples, Donald, Daly, Kevin,2009. Do tax incentives affect investment: an analysis of the New Markets TaxCredit. Public Finance Review 37 (4), 371–398.
Ham, John, Swenson, Charles, İmrohoroğlu, Ayşe, Song, Heonjae, 2011. Governmentprograms can improve local labor markets: evidence from state enterprise zones,federal empowerment zones, and federal enterprise community. Journal of PublicEconomics 95 (7–8), 779–797.

1014 M. Freedman / Journal of Public Economics 96 (2012) 1000–1014
Ito, Koichiro, 2011. Do consumers respond to marginal or average prices? Evidencefrom nonlinear electricity pricing. University of California-Berkeley Working Paper.
Jacob, Brian, Lefgren, Lars, 2004. Remedial education and student achievement: aregression-discontinuity analysis. The Review of Economics and Statistics 86 (1),226–244.
Lalive, Rafael, 2008. How do extended benefits affect unemployment duration? A re-gression discontinuity approach. Journal of Econometrics 142 (2), 785–806.
Lambie-Hanson, Lauren, 2008. Assessing the prevalence of real estate investments inthe New Markets Tax Credit program. Federal Reserve Bank of San Francisco, Com-munity Development Investment Center Working Paper.
Lee, David, 2008. Randomized experiments from non-random selection in U.S. HouseElections. Journal of Econometrics 142 (2), 675–697.
Lee, David, Lemieux, Thomas, 2010. Regression discontinuity designs in economics.Journal of Economic Literature 48 (2), 281–355.
Matsudaira, Jordan, 2008. Mandatory summer school and student achievement. Journalof Econometrics 142 (2), 829–850.
McCrary, Justin, 2008. Testing for manipulation of the running variable in the regres-sion discontinuity design. Journal of Econometrics 142 (2), 698–714.
Meyer, Bruce, 2010. The effects of the earned income tax credit and recent reforms. In:Brown, Jeffrey (Ed.), Tax Policy and the Economy, 24. University of Chicago Press,Chicago.
Moreira, Marcelo, 2009. Tests with correct size when instruments can be arbitrarilyweak. Journal of Econometrics 152 (2), 131–140.
Neumark, David, Kolko, Jed, 2010. Do enterprise zones create jobs? Evidence fromCalifornia's enterprise zone program. Journal of Urban Economics 68 (1), 1–19.
Papke, Leslie, 1994. Tax policy and urban development: evidence from the Indiana en-terprise zone program. Journal of Public Economics 54 (1), 37–49.
Rubin, Julia, Stankiewicz, Gregory, 2005. The New Markets Tax Credit program: a mid-course assessment. Community Development Investment Review 1 (1), 1–11.
Sinai, Todd, Waldfogel, Joel, 2005. Do low-income housing subsidies increase the occu-pied housing stock? Journal of Public Economics 89 (11–12), 2137–2164.
Staiger, Douglas, Stock, James, 1997. Instrumental variables regression with weak in-struments. Econometrica 65 (3), 557–586.
U.S. Government Accountability Office, 2007. Tax Policy: New Markets Tax Credit Ap-pears to Increase Investment by Investors in Low-Income Communities, but Op-portunities Exist to Better Monitor Compliance. GAO-07-296.
U.S. Government Accountability Office, 2010. New Markets Tax Credit: The CreditHelps Fund a Variety of Projects in Low-Income Communities, But Could Be Simpli-fied. GAO-10-334.