Embed Size (px)
Citation preview

MARINE ENVIRONMENTS Teaching Module for Grades 6-12
2
Dear Educator,
We are pleased to present you with the first in a series of teaching and learning modules developed by the DEEPEND (Deep-Pelagic Nekton Dynamics) consortium and their consultants. DEEPEND is a research network focusing primarily on the pelagic zone of the Gulf of Mexico, therefore the majority of the lessons will be based around this topic. Whenever possible, the lessons will focus specifically on events of the Gulf of Mexico or work from the DEEPEND scientists. All modules in this series aim to engage students in grades 6 through 12 in STEM disciplines, while promoting student learning of the marine environment. We hope these lessons enable teachers to address student misconceptions and apprehensions regarding the unique organisms and properties of marine ecosystems. We intend for these modules to be a guide for teaching. Teachers are welcome to use the lessons in any order they wish, use just portions of lessons, and may modify the lessons as they wish. Furthermore, educators may share these lessons with other school districts and teachers; however, please do not receive monetary gain for lessons in any of the modules. Moreover, please provide credit to photographers and authors whenever possible. This first module focuses on the marine environment in general including biological, chemical, and physical properties of the water column. We have provided a variety of activities and extensions within this module such that lessons can easily be adapted for various grade and proficiency levels. Given that education reform strives to incorporate authentic science experiences, many of these lessons encourage exploration and experimentation to encourage students to think and act like a scientist.
Additional teaching modules, and materials such as animations, videos, and blog posts (kids and adults), will also be posted on the DEEPEND website as they become available (http://www.deependconsortium.org/). We hope you and your students dive into these materials and benefit from the adventure.
Sincerely, K. Denise Kendall, Ph.D. on behalf of the DEEPEND Education and Outreach Team

3
Contents Marine Environments Background for Teachers .......................................................................................... 5
Aquatic Habitats ........................................................................................................................................ 5
The Gulf of Mexico .................................................................................................................................... 5
Marine Environments ............................................................................................................................... 6
Chemical and Physical Properties ............................................................................................................. 7
Chemical Substances ............................................................................................................................. 7
Nutrients ............................................................................................................................................... 7
Temperature ......................................................................................................................................... 7
Oxygen .................................................................................................................................................. 7
Light ...................................................................................................................................................... 8
Pressure ................................................................................................................................................. 8
Salinity and Density ............................................................................................................................... 8
Community composition ....................................................................................................................... 9
Closer Look at Pelagic Zones ..................................................................................................................... 9
Epipelagic zone ...................................................................................................................................... 9
Mesopelagic zone ................................................................................................................................ 10
Bathypelagic and Abyssopelagic zones ............................................................................................... 10
Hadalpelagic zone ............................................................................................................................... 10
Marine Environments Background for Students ........................................................................................ 11
The Pelagic Ocean Zone .......................................................................................................................... 12
Chemical and Physical Properties of the Water Column ........................................................................ 13
What is water? ........................................................................................................................................ 14
How do scientists sample the water column? ........................................................................................ 15
Pelagic Zone! ............................................................................................................................................... 16
Objective ................................................................................................................................................. 16
Next Generation Science Standards applicable to activity and extensions ............................................ 16
Supplies ................................................................................................................................................... 16
Lesson ..................................................................................................................................................... 17
Example Flipchart ................................................................................................................................ 20
Bookmark Template ............................................................................................................................ 21
Organisms in the Water Column ......................................................................................................... 25
4
Buoyancy! ................................................................................................................................................... 26
Objective ................................................................................................................................................. 26
Next Generation Science Standards applicable to activity and extensions ............................................ 26
Supplies ................................................................................................................................................... 26
Lesson ..................................................................................................................................................... 26
Sink or Float ........................................................................................................................................ 28
What Water is Denser? ....................................................................................................................... 29
Water Density Investigation ............................................................................................................... 31
Sink to Float ........................................................................................................................................ 33
Under Pressure! .......................................................................................................................................... 35
Objective ................................................................................................................................................. 35
Next Generation Science Standards applicable to activity and extensions ............................................ 35
Supplies ................................................................................................................................................... 35
Lesson ..................................................................................................................................................... 35
Hydrostatic Pressure of the Pelagic Zones .......................................................................................... 37
Hydrostatic Pressure Exploration........................................................................................................ 39
Hydrostatic Pressure Challenge! ......................................................................................................... 41
Ocean Acidification! .................................................................................................................................... 42
Objective ................................................................................................................................................. 42
Next Generation Science Standards applicable to activity and extensions ............................................ 42
Supplies ................................................................................................................................................... 42
Lesson ..................................................................................................................................................... 42
pH of a Solution ................................................................................................................................... 44
Acidification of the Ocean! ................................................................................................................. 45
Culmination ................................................................................................................................................. 46
Objective ................................................................................................................................................. 46
Lesson ..................................................................................................................................................... 46
Dive in with the DEEPEND crew! ......................................................................................................... 47
References and resources for teachers and students ................................................................................ 48

5
Marine Environments Background for Teachers
An organism within its habitat is surrounded by abiotic and biotic factors which drive how the organism lives and behaves. The term abiotic is derived from the Greek words a meaning "not" and biotic meaning "living." Hence, abiotic factors are non-living components, such as pH, sunlight, turbidity, salinity, nutrients, and depth Biotic, the Greek word for "life," encompasses factors that are living such as plants, bacteria, fungi, and animals. The 510 million km2 of Earth's surface are covered with diverse habitats. Some of Earth's habitats are deserts, rivers, grasslands, prairies, tundras, oceans, sandy soil, urban, and rainforests. The primary focus of this module are marine habitats, particularly those of the open ocean. Aquatic Habitats Earth appears as a blue sphere from outer space even though there are large land masses on it. This is because aquatic habitats, marine and freshwater, occupy approximately 70% of the Earth's surface. Roughly 97% of these aquatic habitats contain seawater which is primarily held in the ocean basins. The remaining water exists in inland basins, water vapor, underground aquifers, frozen bodies such as icecaps and glaciers, and within organisms. Water is transferred between these basins via the hydrologic (water) cycle. The hydrologic cycle is primarily driven by solar energy and gravitational forces. Water changes between chemical phases (liquid, solid, and gas) as it transitions through the hydrologic cycle. Accordingly, while the volume of water molecules in a particular aquatic basin is relatively stable the actual water molecules are constantly circulating. The Gulf of Mexico The research focus of the DEEPEND consortium are the marine waters of the Gulf of Mexico. The DEEPEND Consortium has received grant funding from the Gulf of Mexico Research Initiative to investigate the biodiversity and distribution of animals in the Gulf of Mexico's deep-sea ecosystem. The Gulf of Mexico is an ocean basin that contains approximately 2,460 quadrillion liters of seawater and connects to two other main marine environments: the Atlantic Ocean and Caribbean Sea. The Gulf of Mexico is bounded on the northeast, north, and northwest by five states of the United States (listed from west to east): Texas, Louisiana, Mississippi, Alabama, and Florida. The southwest and south is bordered by Mexico, while Cuba is located along the southeastern margin. The Gulf of Mexico extends about 1600 km west to east and 900 km north to south, for a total surface area of about 1.5 million km2. The average water depth of the Gulf of Mexico is 1,616 m and the estimated maximum depth is between 3,600 and 4,400 m. The Gulf of Mexico is estimated to be about 300 million years old, and scientists predict it was formed as a result of shifting tectonic plates and seafloor subsidence (the sinking of Earth's crust). Both fresh and marine water systems enter the Gulf of Mexico. More than 20 freshwater river drainages into the Gulf of Mexico, of which most of the water volume enters through the Mississippi River Delta. Concurrently, marine waters from the Caribbean Sea enters via the Yucatan Strait located between Cuba and Mexico. These waters

6
circulate through the Gulf of Mexico in a clockwise loop and then leave via the Florida Straits, located between Florida and Cuba to join the Gulf Stream. In 2010, the Gulf of Mexico experienced an environmental disaster when the Deepwater Horizon rig exploded and sunk. Oil gushed into the Gulf of Mexico, and this disaster became known as the Deepwater Horizon Oil Spill. Current research endeavors are documenting the effects of this disaster on marine ecosystems. Marine Environments The marine environment on Earth is extremely diverse. The largest marine bodies are the five major oceans: Atlantic, Pacific, Arctic, Indian, and Southern. These oceans are connected via many seas, gulfs, straits, and other bodies of water. The commonality among these marine environments is the presences of saltwater. Marine environments are characterized by many physical and chemical properties, including temperature, sunlight, nutrients, salinity, dissolved gasses, acidity, and turbulence. Variation in these properties has been and continues to be meticulously documented, as these properties are used to delineate habitat boundaries within the marine environments. The most distinct division within marine environments is the delineation of coastal and open ocean regions. The coastal region extends along the shoreline to the edge of the continental shelf, while open ocean habitats are those beyond the continental shelf. The continental shelf is an underwater gradual slope that extends outward from the land into the water. Along this slope, water is typically shallower closer to the land and then proceeds to get deeper at the outer edge of the shelf prior to dropping off. Open ocean waters extend from the surface to ocean floor beyond the continental shelf. The open ocean waters are sub-divided into two main regions: the pelagic zone (ocean waters) and benthic zone (ocean floor). Scientists use a vertical dimension, referred to as the water column, which extends from the surface of the water to the substrate bottom to describe habitats (zones) within the pelagic zone. The pelagic water column is composed of the epipelagic, mesopelagic, bathypelagic, abyssopelagic, and hadalpelagic zones. The epipelagic zone is the uppermost zone in the water column extending to approximately 200 m. Sunlight penetrates the epipelagic zone, and accordingly it is also referred to as the sunlight zone. Descending through the epipelagic zone we encounter the mesopelagic zone. Some sunlight penetrates this zone creating a dim light presence, and therefore this zone is sometimes referred to as the twilight zone. Nevertheless, at about 800m we encounter darkness. The mesopelagic zone extends to about 1000 m after which we encounter the bathypelagic zone. No sunlight reaches the bathypelagic zone, thus this zone is also called the midnight zone. It is estimated that the bathypelagic zones extends 4000 m in depth. The region from 4000–6000 m as the abyssopelagic zone. The deepest region of the oceans is the hadalpelagic zone (6000-10000 m). Once the water column reaches substrate the pelagic zone ends and the benthic zone is encountered. The benthic zone extends horizontally across the bottom of the coastal and open ocean regions. It is the deepest marine region as it encompasses all of the ocean floor of the coastal
7
and open ocean regions varying topographically by location. The benthic zone is dominated by the abyssal plains, which are soft sediment bottoms composed primarily of silt. Also present in the benthic zone are cliffs, volcanoes, trenches, and other unique natural structures. Animals, living and dead on the sea floor are also considered part of the benthic zone.
Chemical and Physical Properties Chemical Substances Marine waters are composed of 96.5% pure water (hydrogen and oxygen) and 3.5% other chemicals. The most abundant chemical compounds and elements in marine environments are sodium and chloride (elements that make up salt). The pH, which is the molar concentration of hydrogen ions in a solution, of marine waters is presently slightly basic at 8.1 pH units. Sodium and chloride make up approximately 2.9% of marine waters. Iron, phosphates, and nitrogen are considered limiting nutrients in marine environments, as the quantity of these nutrients determines population sizes and health. Other inorganic properties of marine environments include sulphates, calcium, potassium, bicarbonate, boron, strontium, fluorine, magnesium, bromine, silicon, manganese, cobalt, copper, and gold. The amounts of these chemicals vary, with some having only a trace presence. Nutrients Nutrients cycle within an ecosystem which produces an interesting dynamic within marine environments, as marine ecosystems can span thousands of meters in depth. As organisms in aquatic systems die they sink to the benthic zone where minerals are released by decomposers. As a result of this, deep waters tend to have higher amounts of minerals, but primary production mainly takes place in surface waters where sunlight is present. The nutrients are still present in the system and eventually ascend back up the water column, but they are limiting factors in population growth and health dependent on the speed of the nutrient cycle. Temperature Temperature within the water column tends to decrease from the surface to the ocean floor. The temperature of a marine habitat is influenced primarily by the latitudinal location and water currents. Water has one of the highest specific heats. This unique property of water means that it requires more energy to change the temperature of water. As a result, water temperatures remain more stable than atmospheric temperatures. Temperatures in the epipelagic zone are typically warmer than temperatures in the mesopelagic, bathypelagic, abyssopelagic, and hadalpelagic zones. This is due to solar energy warming surface waters. The depths of the bathypelagic, abyssopelagic, and hadalpelagic zones receive no solar radiation, and therefore are much colder. The surface temperature for the Gulf of Mexico is typically in the range of 10–32 oC, while the ocean floor averages around 2 oC. Oxygen While oxygen is present in all zones, the levels vary amongst the zones. Epipelagic waters have abundant oxygen levels because atmospheric oxygen enters ocean waters at the surface due to the natural attraction between water and oxygen. When oxygen enters aquatic habitats from

8
the atmosphere it is referred to as dissolved oxygen. Saturation occurs when all bonds are filled and water can no longer attract oxygen. Cold water has a higher saturation volume than warmer waters. Consequently, the colder waters present in the bathypelagic, abyssopelagic, and hadalpelagic zones have a high saturation volume for oxygen and therefore are capable of carrying more dissolved oxygen. Portions of the mesopelagic zone (especially around 500 m) often has low oxygen levels, as it has a lower saturation volume than the bathypelagic, abyssopelagic, and hadalpelagic zones and it is not in constant contact with atmospheric oxygen, as the epipelagic zone waters are. So as we descend the water column, we begin with high oxygen at the surface then pass through lower oxygen zones and ultimately reach higher oxygen presence in the abyss and trenches. An interesting phenomena that occurs yearly in summer in the Gulf of Mexico is the formation of hypoxic zones, particularly in the coastal regions and near the Mississippi Delta. Hypoxic zones, are areas of low oxygen concentration in the water column (below 2 parts per million [ppm]). Very few aquatic organisms can survive in hypoxic conditions, and these areas are sometimes also referred to as "dead zone." An excess of nutrients, particularly phosphorus and nitrogen, are the foundation of hypoxic zones, as they cause eutrophication. Eutrophication is the enrichment by chemical nutrients that results in extreme plant growth (e.g., algal blooms) because these nutrients are no longer limiting in the system. The predominance of hypoxic zones near coastal regions where basins that cross land masses drain is thought to be affected by urbanization and the use of fertilizers in agricultural practices. However, natural cycles such as the hydrologic cycle and nitrogen cycle also play a role as atmospheric nitrogen is deposited onto land and water environments. Light Another physical property that varies throughout the water column are light levels. White light is composed of a rainbow of light, each with its own associated wavelength and energy level. As light enters any aquatic system it is absorbed. Longer wavelengths are absorbed fastest as they have the lowest energy level. As a result, as we descend the water column longer wavelengths, such as red light, disappear closer to the surface than shorter wavelengths, such as blue light. This phenomenon affects pigmentation of organisms in the water column as well as light production via bioluminescence (bios from the Greek word for "living" and lumen from the Latin word for "light"). While bioluminescent organisms are found throughout the water column most live in deeper waters. The majority of bioluminescent marine organisms produce blue or green light as this light can be seen at deeper depths. Pressure Hydrostatic pressure increases with increasing water depth. Hydrostatic pressure is the pressure exerted on a body due to the weight of overlying water. More pressure is exerted at deeper depths because larger quantities of water are above an organism. Salinity and Density The concentration of salt in the water is referred to as salinity. Seawater is more dense than freshwater due to the presence of dissolved salt in the water. Thus, saltier water tends to sink

9
below water with less salt (e.g., freshwater). Many objects that sink in freshwater can float in seawater due to the differences in density. Local physical properties such as tides, currents, and inlets can affect the mixing of waters and as a result affect salinity concentrations. Marine coastal environments tend to have lower salinity levels than open waters. The average salinity of marine environments is 35 parts per thousand (ppt). Salinity also affects levels of dissolved oxygen. There is an inverse linear relationship between salinity and dissolved oxygen whereby as salinity increases oxygen solubility decreases. So, saltier waters have less dissolved oxygen. The chemical and physical properties of aquatic systems do not stand independently from each other; rather they are interconnected and changes in one property can cascade to others. Community composition It is customary for scientists to describe ecosystems not only by the chemical and physical properties, but also the organisms that live within them. Two of the most prominent descriptive measurements used to describe biotic composition are species richness and species evenness. Species richness is simply the number of unique species present in the community, while species evenness is a measure of how evenly individuals are distributed among the different species. In marine habitats it has been traditionally thought that the most diverse zones are near the coastline, but this may be misleading as coastal environments are more accessible for exploration. It is estimated that more than 90% of underwater habitats have not been explored to date. With new technologies, especially unmanned submersibles (deep see vehicles), exploration endeavors are leading to the discovery of new organisms in deeper marine habitats. Closer Look at Pelagic Zones Through the understanding of chemical and physical properties in the water column we can now describe the pelagic zones in more detail. Epipelagic zone The epipelagic, sometimes called the euphotic (eu from the Greek word for "well" and phos from the Greek word for "light") zone (up to 200 m) is home to a wide variety of organisms including plants due to the abundance of sunlight. Plants are able to successfully photosynthesize, and thus grow and provide primary production to this zone. Some plants found in the epipelagic zone include free floating algae (seaweed), sea grasses, and phytoplankton. While the open water nature of the epipelagic zone allows photosynthetic organisms to thrive it concurrently presents other organisms with survival challenges. The epipelagic zone is home to many animals including sharks, jellyfish, sting rays, dolphins, bluefin tuna, whales, zooplankton, seals, sea turtles, and many more. There are little to no hiding places from predation in this zone, but many animals are typically dark in coloration on their upper side and lighter on the underside. This adaptation, known as countershading, helps camouflage many organisms living in the epipelagic zone. When predators look upwards, prey species blend into lighter sunlight waters above, and concurrently when predators look downwards, prey blend into the darker twilight waters below. The temperatures of the epipelagic zone are relatively warm and oxygen can be replenished from atmospheric oxygen. Population dynamics in this zone are largely limited by resources such as iron, phosphates, and
10
nitrogen which sink to the ocean floor as organisms die and must be broken down and then ascend the water column before returning. Mesopelagic zone As we descend into the mesopelagic, sometimes referred to as the disphotic (dys from the Greek word for "bad or abnormal" and phos from the Greek word for "light") zone (200–1000 m) we notice there are no longer any plants present. The dim lighting conditions do not allow for photosynthesis to occur, therefore plants are not found in this deep in the water column. The water temperature beings to get colder as there is less sunlight to be absorbed. Animals in this zone also live in open waters, so they have little to no hiding places just like in the epipelagic zone except now the waters are darker in color. As a results, many animals in this zone are narrow in shape. Colors start to become obscure as wavelengths are absorbed. Animals in this zone have red or black coloration to blend into the darker waters. Red wavelengths are some of the first to be absorbed by water, so this color is more difficult to see at these depths. Some animals in this zone also have larger eyes to help them see in the darker water as well as sharp fangs and large mouths to more efficiently catch prey. It is common behavior for predators in this zone to sit and wait for their prey to float or swim by. This zone is home to many bioluminescent organisms. Bioluminescence is used to communicate, attract prey and mates, and to scare predators. Animals such as squids, krill, lantern fishes, crabs, hatchetfishes, shrimps, and dragonfishes call the mesopelagic zone home. Bathypelagic and Abyssopelagic zones As we reach the bathypelagic and abyssopelagic, also known as the aphotic (a from the Greek word for "not" and phos from the Greek word for "light"), zones (1000 to 6000 m) the waters become very dark and ultimately without light. These waters also become much colder than waters in the epipelagic and mesopelagic zones. These colder waters are capable of holding more oxygen so we see increases in dissolved oxygen in comparison to the mesopelagic zone above. The colder waters also decrease activity and metabolic rates of animals. The pressure at these depths is immense and can reach two tons per square inch. Animals brought to the surface from these depths often struggle with the pressure and temperature changes as they affect chemical processes within the organism. Predators in this zone also practice a sit and wait manner of hunting or wait for food (marine snow) to float down from the epipelagic and mesopelagic zones. Several animals in this zone bioluminesce, primarily in the colder color spectrum of blue and green, for communication, hunting, and mating. Inhabitants of the bathypelagic and abyssopelagic zones include octopi, viperfishes, giant squids, chimaeras, anglerfishes, snailfishes, and gulper eels.
Hadalpelagic zone The hadalpelagic zone (6000 m to 10000 m) makes up a small fraction of the Earth's oceans. Hadalpelagic waters are found inside great trenches like the Marianas. Since no waters this deep are found in the Gulf of Mexico the hadalpelagic zone is not discussed in detail in this module.

11
Marine Environments Background for Students

12
The Pelagic Ocean Zone
Pelagic ocean zones are one region of the open ocean waters. Open ocean waters include any water beyond the continental shelf. Pelagic zones extend vertically from the surface to the ocean floor. This vertical dimension is referred to as the water column. The pelagic water column is composed of five main zones: epipelagic, mesopelagic, bathypelagic, abyssopelagic, and hadalpelagic (Figure 1). The epipelagic zone is the uppermost zone in the water column extending to approximately 200 m. This zone is sometimes called the "sunlight zone" because sunlight penetrates the waters. The epipelagic zone is inhabited by many plants and animals such as sea grasses, floating algae, phytoplankton, sharks, sting rays, dolphins, jellyfish, sea turtles, whales, and tuna fish. Descending through the epipelagic zone we encounter the mesopelagic zone (200–1000 m). There is dim light present in the mesopelagic zone so it is sometimes called the "twilight zone." No plants live in this zone because there is not enough sunlight to photosynthesize; however, animals such as squids, krill, lantern fishes, crabs, hatchetfishes, shrimps, and dragonfishes inhabit the mesopelagic zone. At a depth of 1000m we encounter the bathypelagic zone. The bathypelagic zone extends to 4000 m where we encounter the abyssopelagic zone. Absolutely no light reaches these two zones so they are often called the "midnight zones." Once again, we see no plants in the bathypelagic or abyssopelagic zones, but there are animal inhabitants including octopi, viperfishes, giant squids, chimaeras, anglerfishes, snailfishes, and gulper eels. Depths beyond 6000 m are the hadalpelagic zone. The hadalpelagic zone include the deep trenches which make up a small fraction of the Earth's oceans.
Figure 1. Pelagic ocean zones extending from the surface to the ocean floor (the benthic zone).
13
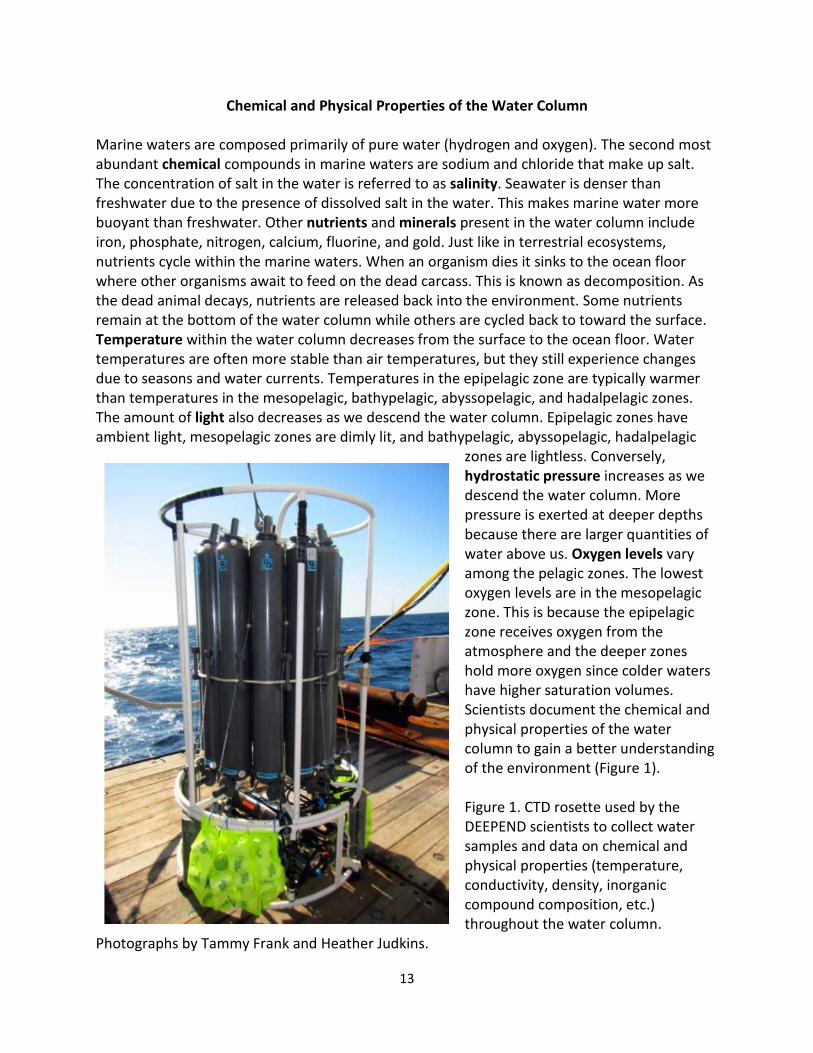
Chemical and Physical Properties of the Water Column Marine waters are composed primarily of pure water (hydrogen and oxygen). The second most abundant chemical compounds in marine waters are sodium and chloride that make up salt. The concentration of salt in the water is referred to as salinity. Seawater is denser than freshwater due to the presence of dissolved salt in the water. This makes marine water more buoyant than freshwater. Other nutrients and minerals present in the water column include iron, phosphate, nitrogen, calcium, fluorine, and gold. Just like in terrestrial ecosystems, nutrients cycle within the marine waters. When an organism dies it sinks to the ocean floor where other organisms await to feed on the dead carcass. This is known as decomposition. As the dead animal decays, nutrients are released back into the environment. Some nutrients remain at the bottom of the water column while others are cycled back to toward the surface. Temperature within the water column decreases from the surface to the ocean floor. Water temperatures are often more stable than air temperatures, but they still experience changes due to seasons and water currents. Temperatures in the epipelagic zone are typically warmer than temperatures in the mesopelagic, bathypelagic, abyssopelagic, and hadalpelagic zones. The amount of light also decreases as we descend the water column. Epipelagic zones have ambient light, mesopelagic zones are dimly lit, and bathypelagic, abyssopelagic, hadalpelagic
zones are lightless. Conversely, hydrostatic pressure increases as we descend the water column. More pressure is exerted at deeper depths because there are larger quantities of water above us. Oxygen levels vary among the pelagic zones. The lowest oxygen levels are in the mesopelagic zone. This is because the epipelagic zone receives oxygen from the atmosphere and the deeper zones hold more oxygen since colder waters have higher saturation volumes. Scientists document the chemical and physical properties of the water column to gain a better understanding of the environment (Figure 1). Figure 1. CTD rosette used by the DEEPEND scientists to collect water samples and data on chemical and physical properties (temperature, conductivity, density, inorganic compound composition, etc.) throughout the water column.
Photographs by Tammy Frank and Heather Judkins.

14
What is water?
Water is an essential compound of life. It not only covers 70% of Earth, but it is also found within organisms. The amount of water on Earth today is believed to be the same volume present when Earth formed. A water molecule is made up of a strong bond between one oxygen atom and two hydrogen atoms (Figure 1). Billions of water molecules bond together to form a single drop of water. Water in its purest form is tasteless, odorless, and colorless so the
presence of additional chemical substances is responsible for taste, odor, and discoloration. There are three states in which water can occur: solid, liquid, and gas. Ice is the solid state of water that occurs at 0 oC, it is less dense than water because molecules move further apart. When you put a liquid bottle of water in the freezer you will notice that it expands. The water we commonly think of is the liquid state, it is fluid and occurs between 0 oC and 100 oC. The gaseous state of water, occurring at temperatures above 100 oC, is water vapor (you may know it "steam"). Water vapor is present in the atmosphere, it is what clouds are made of. The bonds of water constantly break and reform. As water changes states it continuously cycles through the hydrologic cycle and travels around Earth (Figure 2).
Figure 2. The major stages in the hydrologic cycle.
Figure 1. Water molecule model.
15
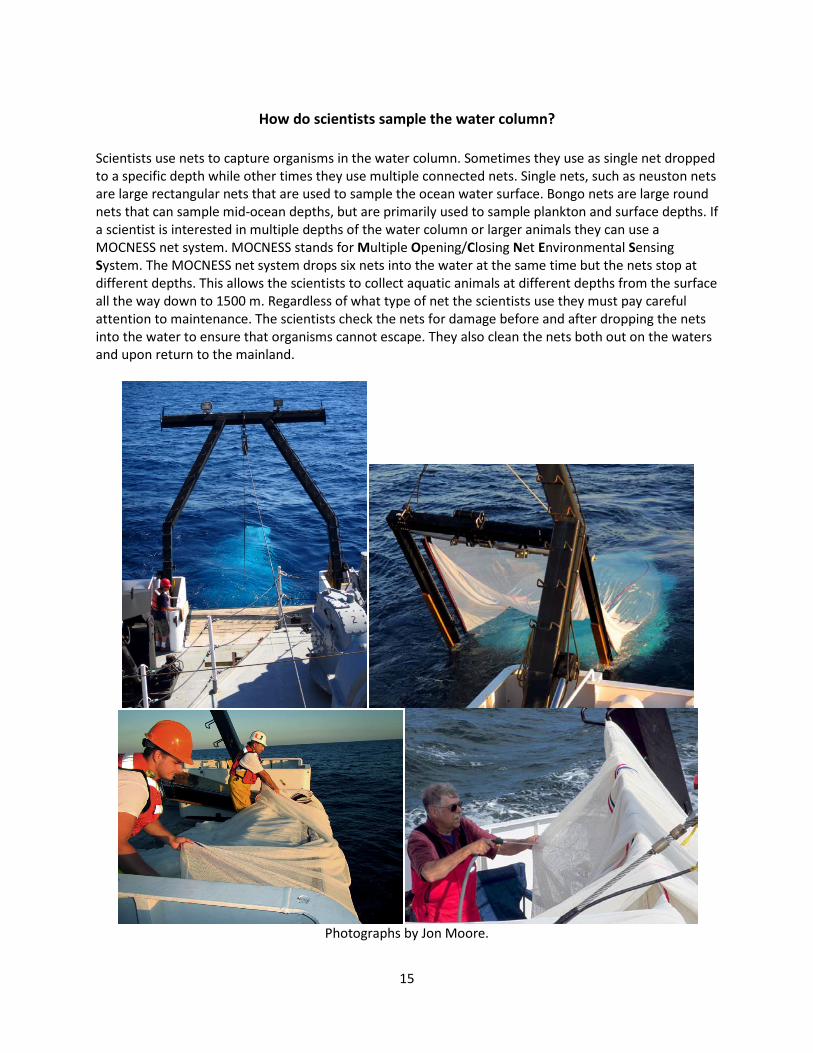
How do scientists sample the water column? Scientists use nets to capture organisms in the water column. Sometimes they use as single net dropped to a specific depth while other times they use multiple connected nets. Single nets, such as neuston nets are large rectangular nets that are used to sample the ocean water surface. Bongo nets are large round nets that can sample mid-ocean depths, but are primarily used to sample plankton and surface depths. If a scientist is interested in multiple depths of the water column or larger animals they can use a MOCNESS net system. MOCNESS stands for Multiple Opening/Closing Net Environmental Sensing System. The MOCNESS net system drops six nets into the water at the same time but the nets stop at different depths. This allows the scientists to collect aquatic animals at different depths from the surface all the way down to 1500 m. Regardless of what type of net the scientists use they must pay careful attention to maintenance. The scientists check the nets for damage before and after dropping the nets into the water to ensure that organisms cannot escape. They also clean the nets both out on the waters and upon return to the mainland.
Photographs by Jon Moore.
16
Pelagic Zone! Objective Students will compare the chemical, physical, and/or biological properties of three main pelagic ocean zones.
Next Generation Science Standards applicable to activity and extensions • MS-LS1-5. Construct a scientific explanation based on evidence for how environmental
and genetic factors influence the growth of organisms. • MS-LS1-6. Construct a scientific explanation based on evidence for the role of
photosynthesis in the cycling of matter and flow of energy into and out of organisms. • MS-LS2-1. Analyze and interpret data to provide evidence for the effect of resource
availability on organisms and populations of organisms in an environment. • MS-LS2-3. Develop a model to describe the cycling of matter and flow of energy among
living and nonliving parts of an ecosystem affect populations. • MS-LS2-4. Construct an argument supported by empirical evidence that changes to
physical or biological components of an ecosystem. • MS-ETS1-2. Evaluate competing design solutions using a systematic process to
determine how well they meet the criteria and constraints of the problem. • MS-ETS1-3. Analyze data from tests to determine similarities and differences among
several design solutions to identify the best characteristics of each that can be combined into a new solution to better meet the criteria for success.
• MS-PS4-2. Develop and use a model to describe that waves are reflected, absorbed, or transmitted through various materials.
• HS-LS2-6. Evaluate the claims, evidence, and reasoning that the complex interactions in ecosystems maintain relatively consistent numbers and types of organisms in stable conditions, but changing conditions may result in a new ecosystem.
• HS-LS4-5. Evaluate the evidence supporting claims that changes in environmental conditions may result in: (1) increases in the number of individuals of some species, (2) the emergence of new species over time, and (3) the extinction of other species.
Supplies
• Flipcharts: o Two full sheets of paper per student, legal paper is ideal as it provides more space o Art supplies - colored pencils, markers, stapler, glitter, glue, etc.
• Bookmarks: o Template o Art supplies - colored pencils, markers, stapler, glitter, glue, etc. o Hole punch o String for tassels
• Water column: o 2-liter bottle o Saltwater organisms

17
o Salt o Scale o Cups o Ice o Aluminum foil o Cling wrap or cheese cloth o Heat lamp o Marker o Ruler o Hand lens o Thermometer o Oxygen probe o pH probe or strips o Optional for extension: leaf litter, mesh bags/cheese cloth to make leaf litter bags,
additional bottles
Lesson This is a great lesson for combining English and Science curricula for middle and high school age groups. This activity focuses on visualizing the pelagic ocean zones. Students can be asked to include chemical, physical and/or biological properties.
There are many ways to conduct this lesson. It can be a standalone lesson, included in interactive science notebooks, or it can be used as a formative assessment. For instance, this can be a teacher-centered activity with the teacher leading a class discussion of the pelagic zones. Students can take notes and then complete their flipcharts. Alternatively, students can be given a reading assignment such as "The Pelagic Zones" and "Chemical and Physical Properties of the Water Column" in the student background and self-identify key descriptions of each zone. For more advanced students, teachers can charge students with finding, evaluating, and synthesizing information through online searches rather than just providing them with information.
The base of the flipchart is put together by stacking the two full sheets of paper. Fold both pieces of paper so the top edge goes approximately 2/3 of the way down. Then take the top sheet and fold it upwards so half of the flap overhangs the top of the bottom sheet. Now use three staples to secure the layers. These staples should go along the top edge of the bottom sheet. You now have a flip chart with three layers (epipelagic, mesopelagic, and bathypelagic) and a header! See diagram on the next page for visualization. An example flip chart is included in the pages that follow. This flip chart only includes three pelagic zones as there is still uncertainty if the deepest point in the Gulf of Mexico reaches the abyssopelagic zone. Other activities in this module follow suit. If desired, you can include the abyssopelagic and hadalpelagic zones in any of these activities. For example, extra pages can be added to create a flip chart with five layers.

18
On the top of each layer students should draw the pelagic zone. Then, they should flip up
the layer and provide a written description of each zone. Students can write a descriptive paragraph, key words, or single sentences. They can be asked to include biological, physical, and chemical properties or just focus on one aspect. To foster collaboration, students can be assigned to jigsaw groups and focus on one property in groups and then return to original groups for peer teaching. Discussion can be fostered throughout the activity by having students brainstorm together and peer critique flip charts. Students should provide only constructive criticisms; for example if information is misrepresented or if misconceptions are present, it is important to model critique for students.
An extension of this activity is to include all ocean zones. Students would need to redesign their flip charts, this is a great engineering challenge for students on how to present the unique demography of the continental shelf and ocean floor. Students can redesign the flip chart by adding extra pages, folding differently, cutting other divisions, or adding cutouts. While this is a challenge, it is certainly achievable.
An alternative way to explore the pelagic zones is to have students draw a food web that focuses on interactions within and among the zones. Students can draw this on a single sheet of paper with zone boundaries outlined.
Another extension could be to ask students to perform literature searches to document properties of the water column in a specific regions on Earth (e.g., Gulf of Mexico, Atlantic Ocean, Mediterranean Sea, and Arctic Ocean). Then, have students host a "Marine Environments Fair" to share their flipcharts with their peers and families.
An alteration of this activity is to have students complete a pelagic ocean zone bookmark (template provided). Cut out the hole at the top of the template with a hole punch to insert a bookmark tassel.
The last activity included in this section is "Organisms in the Water Column." This activity has students set up a water column with differing abiotic and biotic factors. Students wait for organisms to acclimate and then come to conclusions about the preferred environment of each organism. This activity can also be set up as a demonstration.
“Organisms in the Water Column” can also be modified to investigate the effects of hypoxia on water column properties and organisms. Two identical water columns can be set up then a leaf litter bag can be added to one of the columns to decrease the amount of dissolved oxygen

19
in the water column. Four or more days after adding the leaf litter bag students can collect and analyze data comparing the two water columns. If an oxygen probe is available students will be able to quantify the change and difference in dissolved oxygen levels.
20
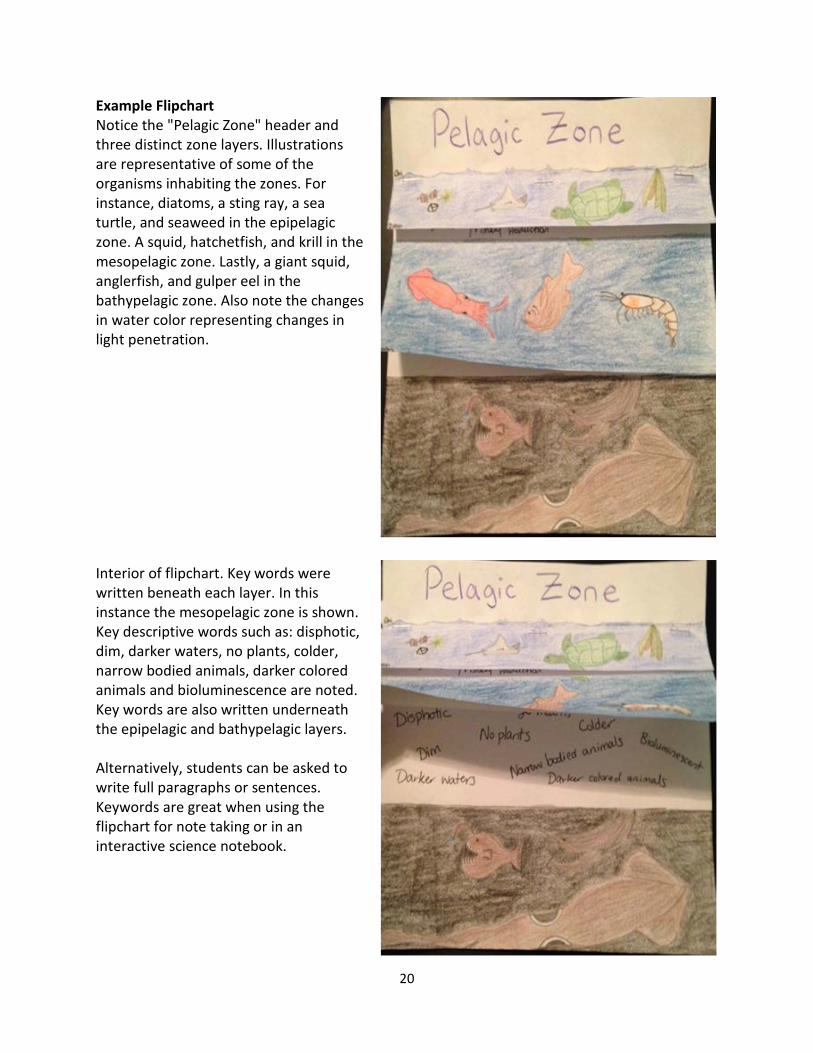
Example Flipchart Notice the "Pelagic Zone" header and three distinct zone layers. Illustrations are representative of some of the organisms inhabiting the zones. For instance, diatoms, a sting ray, a sea turtle, and seaweed in the epipelagic zone. A squid, hatchetfish, and krill in the mesopelagic zone. Lastly, a giant squid, anglerfish, and gulper eel in the bathypelagic zone. Also note the changes in water color representing changes in light penetration. Interior of flipchart. Key words were written beneath each layer. In this instance the mesopelagic zone is shown. Key descriptive words such as: disphotic, dim, darker waters, no plants, colder, narrow bodied animals, darker colored animals and bioluminescence are noted. Key words are also written underneath the epipelagic and bathypelagic layers. Alternatively, students can be asked to write full paragraphs or sentences. Keywords are great when using the flipchart for note taking or in an interactive science notebook.
21
Bookmark Template

22
Epipelagic zone photo gallery
A. Flying fish; B. Crab Larvae; C. Crab Zoea; D. Juvenile Sailfish; E. Physophora hydrostatica; F. Lobster larvae; G. Sargassum; and H. Pteropod. Photographs by Dante B. Fenolio.

23
Mesopelagic zone photo gallery
A. Firefly squid; B. Heteropod; C. Waryfish; D. Acanthephyra; E. Diaphus mollis; F. Cranchia scabra; G. Argyropelecus gigas; H. Chauliodus sloani; and I. Amphipod. Photographs by Dante B. Fenolio.
24
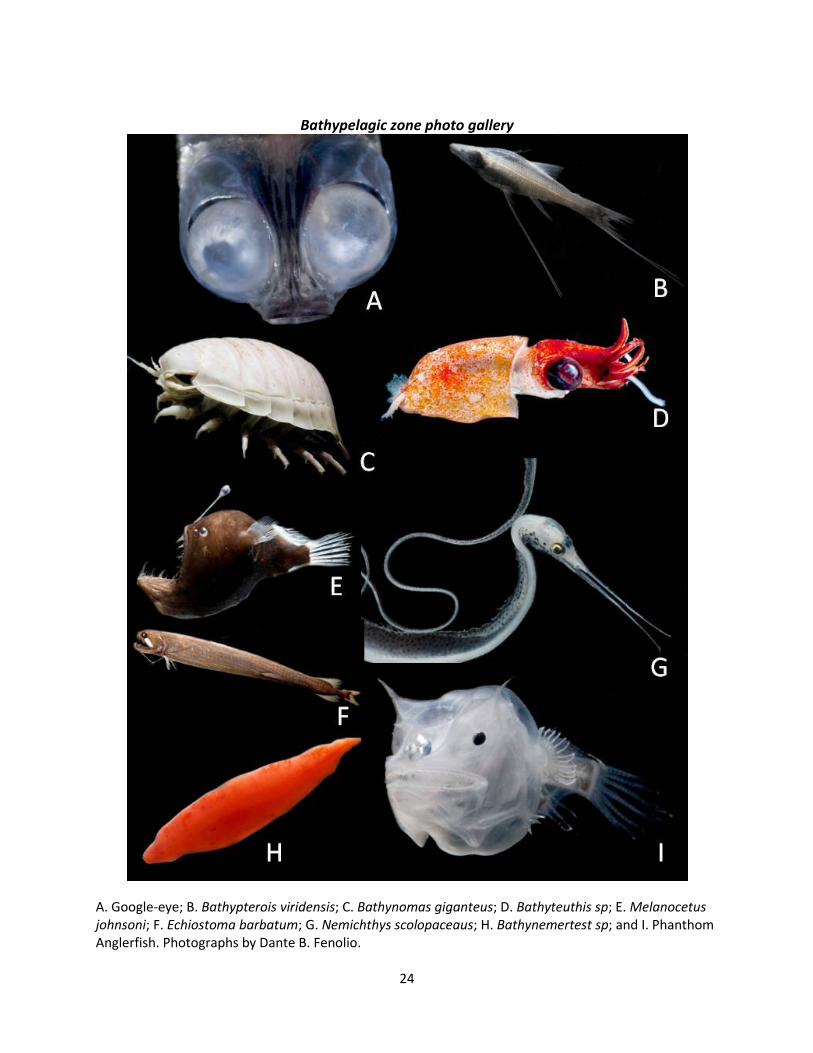
Bathypelagic zone photo gallery
A. Google-eye; B. Bathypterois viridensis; C. Bathynomas giganteus; D. Bathyteuthis sp; E. Melanocetus johnsoni; F. Echiostoma barbatum; G. Nemichthys scolopaceaus; H. Bathynemertest sp; and I. Phanthom Anglerfish. Photographs by Dante B. Fenolio.
25
Name: _________________________ Date:________________
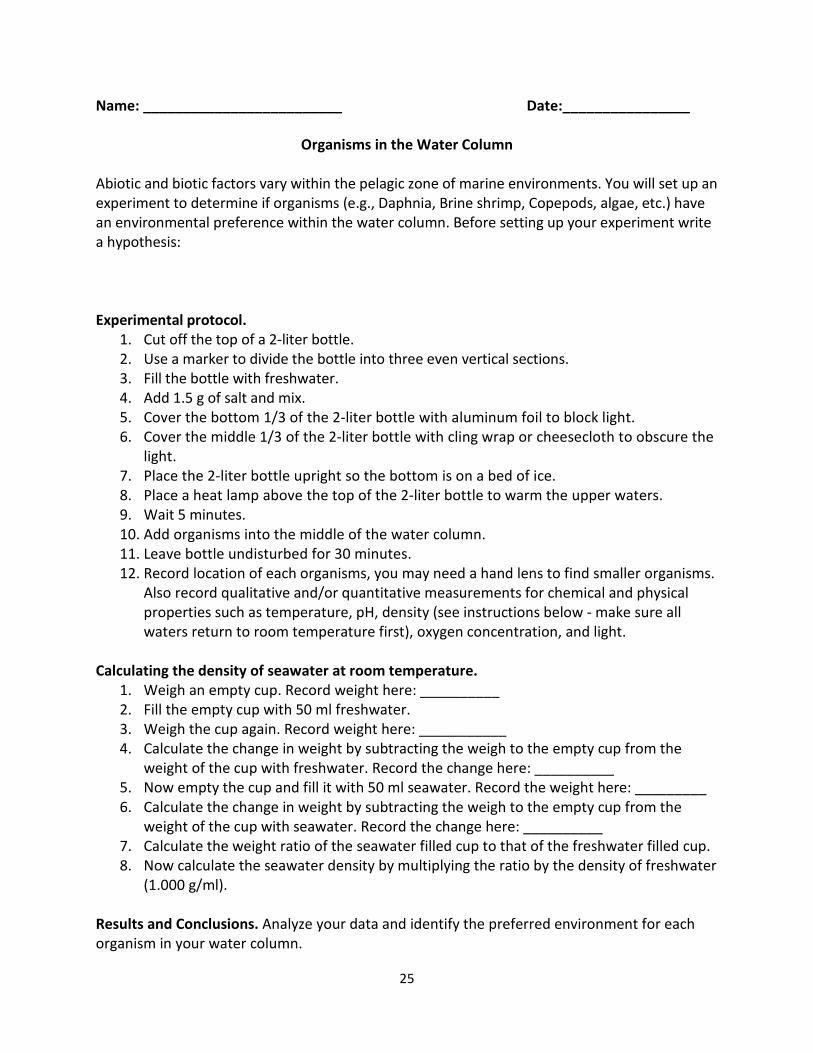
Organisms in the Water Column Abiotic and biotic factors vary within the pelagic zone of marine environments. You will set up an experiment to determine if organisms (e.g., Daphnia, Brine shrimp, Copepods, algae, etc.) have an environmental preference within the water column. Before setting up your experiment write a hypothesis: Experimental protocol.
1. Cut off the top of a 2-liter bottle. 2. Use a marker to divide the bottle into three even vertical sections. 3. Fill the bottle with freshwater. 4. Add 1.5 g of salt and mix. 5. Cover the bottom 1/3 of the 2-liter bottle with aluminum foil to block light. 6. Cover the middle 1/3 of the 2-liter bottle with cling wrap or cheesecloth to obscure the
light. 7. Place the 2-liter bottle upright so the bottom is on a bed of ice. 8. Place a heat lamp above the top of the 2-liter bottle to warm the upper waters. 9. Wait 5 minutes. 10. Add organisms into the middle of the water column. 11. Leave bottle undisturbed for 30 minutes. 12. Record location of each organisms, you may need a hand lens to find smaller organisms.
Also record qualitative and/or quantitative measurements for chemical and physical properties such as temperature, pH, density (see instructions below - make sure all waters return to room temperature first), oxygen concentration, and light.
Calculating the density of seawater at room temperature.
1. Weigh an empty cup. Record weight here: __________ 2. Fill the empty cup with 50 ml freshwater. 3. Weigh the cup again. Record weight here: ___________ 4. Calculate the change in weight by subtracting the weigh to the empty cup from the
weight of the cup with freshwater. Record the change here: __________ 5. Now empty the cup and fill it with 50 ml seawater. Record the weight here: _________ 6. Calculate the change in weight by subtracting the weigh to the empty cup from the
weight of the cup with seawater. Record the change here: __________ 7. Calculate the weight ratio of the seawater filled cup to that of the freshwater filled cup. 8. Now calculate the seawater density by multiplying the ratio by the density of freshwater
(1.000 g/ml).
Results and Conclusions. Analyze your data and identify the preferred environment for each organism in your water column.
26
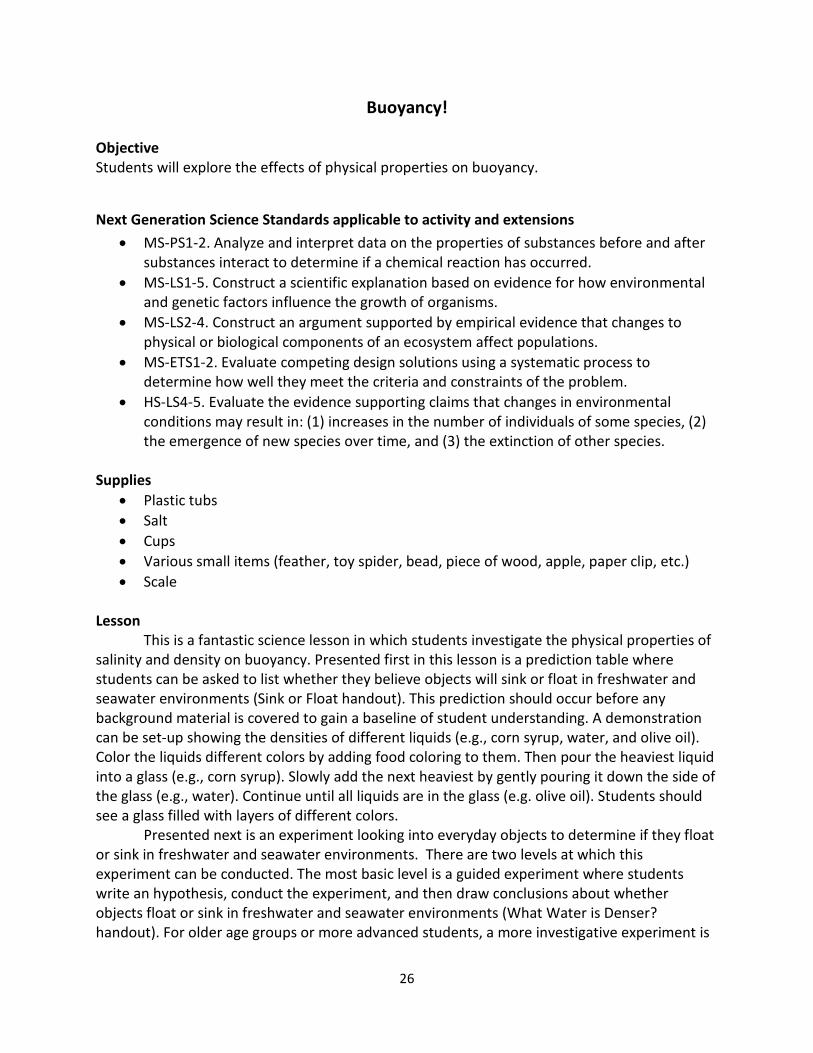
Buoyancy! Objective Students will explore the effects of physical properties on buoyancy.
Next Generation Science Standards applicable to activity and extensions • MS-PS1-2. Analyze and interpret data on the properties of substances before and after
substances interact to determine if a chemical reaction has occurred. • MS-LS1-5. Construct a scientific explanation based on evidence for how environmental
and genetic factors influence the growth of organisms. • MS-LS2-4. Construct an argument supported by empirical evidence that changes to
physical or biological components of an ecosystem affect populations. • MS-ETS1-2. Evaluate competing design solutions using a systematic process to
determine how well they meet the criteria and constraints of the problem. • HS-LS4-5. Evaluate the evidence supporting claims that changes in environmental
conditions may result in: (1) increases in the number of individuals of some species, (2) the emergence of new species over time, and (3) the extinction of other species.
Supplies
• Plastic tubs • Salt • Cups • Various small items (feather, toy spider, bead, piece of wood, apple, paper clip, etc.) • Scale
Lesson This is a fantastic science lesson in which students investigate the physical properties of salinity and density on buoyancy. Presented first in this lesson is a prediction table where students can be asked to list whether they believe objects will sink or float in freshwater and seawater environments (Sink or Float handout). This prediction should occur before any background material is covered to gain a baseline of student understanding. A demonstration can be set-up showing the densities of different liquids (e.g., corn syrup, water, and olive oil). Color the liquids different colors by adding food coloring to them. Then pour the heaviest liquid into a glass (e.g., corn syrup). Slowly add the next heaviest by gently pouring it down the side of the glass (e.g., water). Continue until all liquids are in the glass (e.g. olive oil). Students should see a glass filled with layers of different colors. Presented next is an experiment looking into everyday objects to determine if they float or sink in freshwater and seawater environments. There are two levels at which this experiment can be conducted. The most basic level is a guided experiment where students write an hypothesis, conduct the experiment, and then draw conclusions about whether objects float or sink in freshwater and seawater environments (What Water is Denser? handout). For older age groups or more advanced students, a more investigative experiment is

27
presented (Water Density Investigation handout). At this level students are asked to design their own experiment. An extension experiment is also included. In the extension students are challenged to make objects float that sink in freshwater by using salt to change the density of the water (Sink to Float handout). Another extension that can be conducted using these concepts focuses on the three states of water: solid, liquid, and gas. Time to change states can be explored between freshwater and seawater to determine how impurities (salt) in water can alter physical properties. Additionally, these activities can be used as background materials for a discussion on how animal stay submerged in aquatic systems.

28
Name: _________________________ Date:________________
Sink or Float
Predictions: Do you think the object will float or sink in the different aquatic environments?
Freshwater Seawater
Float Float
Sink Sink
29
Name: _________________________ Date: ________________
What Water is Denser?
Density of an object or liquid is determined by dividing the mass by volume. The density of an object compared to the density of surrounding liquid determines whether an object will sink or float. Objects that are denser than the liquid sink while objects less dense float. The density of liquids are also different. Materials:
• Two tubs • Freshwater • Saltwater • Various objects (feather, toy spider, bead, piece of wood, apple, paper clip, etc.)
Question: What water is denser: freshwater or seawater? Write a hypothesis: Conduct an experiment:
1. Fill one tub with freshwater and the other tub with saltwater. Make sure each tub has the same volume.
2. Choose 10 objects to test. List them in the data table. 3. Now put the objects one by one into the tub with freshwater. Observe each object.
Record whether it floats at the surface, hovers in the water column, or sinks to the bottom.
4. After testing each object in the freshwater dry off each object. 5. Now test the objects one by one in the saltwater tub. Observe each object again and
record results. 6. Clean up your station making sure to dry off all objects and water spills.

30
Data: Object Freshwater Saltwater
Conclusions:

31
Name: _________________________ Date: ________________
Water Density Investigation
Density of an object or liquid is determined by dividing the mass by volume. The density of an object compared to the density of liquid determines whether an object will sink or float. Objects that are denser than the liquid sink while objects less dense float. The density of liquid is also different. Materials:
• Two tubs • Freshwater • Saltwater • Various objects (feather, toy spider, bead, piece of wood, apple, paper clip, etc.)
Question: What water is denser: freshwater or seawater? Write a hypothesis: Experimental design, explain how you will test your hypothesis:

32
Data: Conclusions:
33
Name: _________________________ Date: ________________
Sink to Float Density of an object or liquid is determined by dividing the mass by volume. The density of an object compared to the density of liquid determines whether an object will sink or float. Objects that are denser than the liquid sink while objects less dense float. The density of liquids are also different. Seawater is denser (~1.027 g/ml) than freshwater (1.000 g/ml) because more substances are dissolved in seawater than freshwater. In this activity you will explore if you can make objects that sink in freshwater float by manipulating salinity. Question: Can manipulating salinity impact the density of a liquid and therefore alter the buoyancy of an object? Write a hypothesis: Materials:
• Tub • Cup • Freshwater • Salt • Various objects (feather, toy spider, bead, piece of wood, apple, paper clip, etc.)
Conduct an experiment:
1. Fill one tub with freshwater. 2. Identify five items that sink in freshwater. List them in the data table. 3. Now add salt little by little mixing well until one of the objects floats to the top. 4. Determine the density of the water (see protocol below). 5. Return all water to the tub and add more salt little by little until another object floats. 6. Calculate the new density. Repeat until all objects float.
Calculating the density of seawater at room temperature.
1. Weigh an empty cup. Record weight here: __________ 2. Fill the empty cup with freshwater. 3. Weigh the cup again. Record weight here: ___________

34
4. Calculate the change in weight by subtracting the weigh to the empty cup from the weight of the cup with freshwater. Record the change here: __________
5. Now empty the cup and fill it with the seawater. Record the weight here: _________ 6. Calculate the change in weight by subtracting the weigh to the empty cup from the
weight of the cup with seawater. Record the change here: __________ 7. Calculate the weight ratio of the seawater filled cup to that of the freshwater filled cup. 8. Now calculate the seawater density by multiplying the ratio by the density of freshwater
(1.000 g/ml). Data:
Object Density to float (g/ml)
Conclusions:
35
Under Pressure! Objective Students will compare hydrostatic pressure in the water column.
Next Generation Science Standards applicable to activity and extensions
• MS-LS2-4. Construct an argument supported by empirical evidence that changes to physical or biological components of an ecosystem affect populations.
• MS-ETS1-2. Evaluate competing design solutions using a systematic process to determine how well they meet the criteria and constraints of the problem.
• MS-ETS1-3. Analyze data from tests to determine similarities and differences among several design solutions to identify the best characteristics of each that can be combined into a new solution to better meet the criteria for success.
Supplies
• Plastic bottles and cups of varying shapes and sizes depending on activity design • Rulers • Tacks • Strong tape (e.g., gorilla or duct tape) • Water • Food coloring • Tub, sink, or outdoor area
Lesson This is a great lesson for combining Engineering and Science curricula for middle and high school age groups. This lesson focuses on exploring hydrostatic pressure.
There are many ways to conduct this lesson, the first of which is a demonstration. The demonstration is a great way to engage students. A single demonstration vessel can be set up by the teacher using the instructions outlined in student experiment handouts. Students can observe what happens and discuss their observations. Alternatively multiple vessels of differing shapes, sizes, and with unique hole patterns can be set up for observation and comparison.
Another way to is to conduct an explorative lesson on hydrostatic pressure through experimentation by the students. A structured class activity comparing hydrostatic pressure in the same vessels and at the same depths can be conducted using the "Hydrostatic Pressure of the Pelagic Zones" handout. This experiment can also be conducted as an open-ended inquire activity using the "Hydrostatic Pressure Exploration" handout. Alternatively, an experiment comparing hydrostatic pressure in different vessels but at the same depths can be carried out using the "Hydrostatic Pressure Exploration" handout.
Lastly, this lesson can be completed as an engineering challenge in which students must first conduct research and secondly design the vessel that will produce the highest pressure. This engineering challenge promotes healthy competition and investigation within the classroom. The challenge is outlined in the "Hydrostatic Pressure Challenge" handout.

36
You can use a single activity of this lesson, or use them all sequentially to scaffold learning. For all activities it is recommended that groups of 3–5 be used. It is strongly recommended that the teacher assist with piercing holes for younger students. If class time is limited materials can be pre-prepared by marking the sides of the vessels and piercing and covering holes. Obtaining large numbers of plastic bottles can be completed more easily by asking students to rinse and bring in bottles or through coordination with school recycling programs.
37
Name: _________________________ Date: ________________
Hydrostatic Pressure of the Pelagic Zones
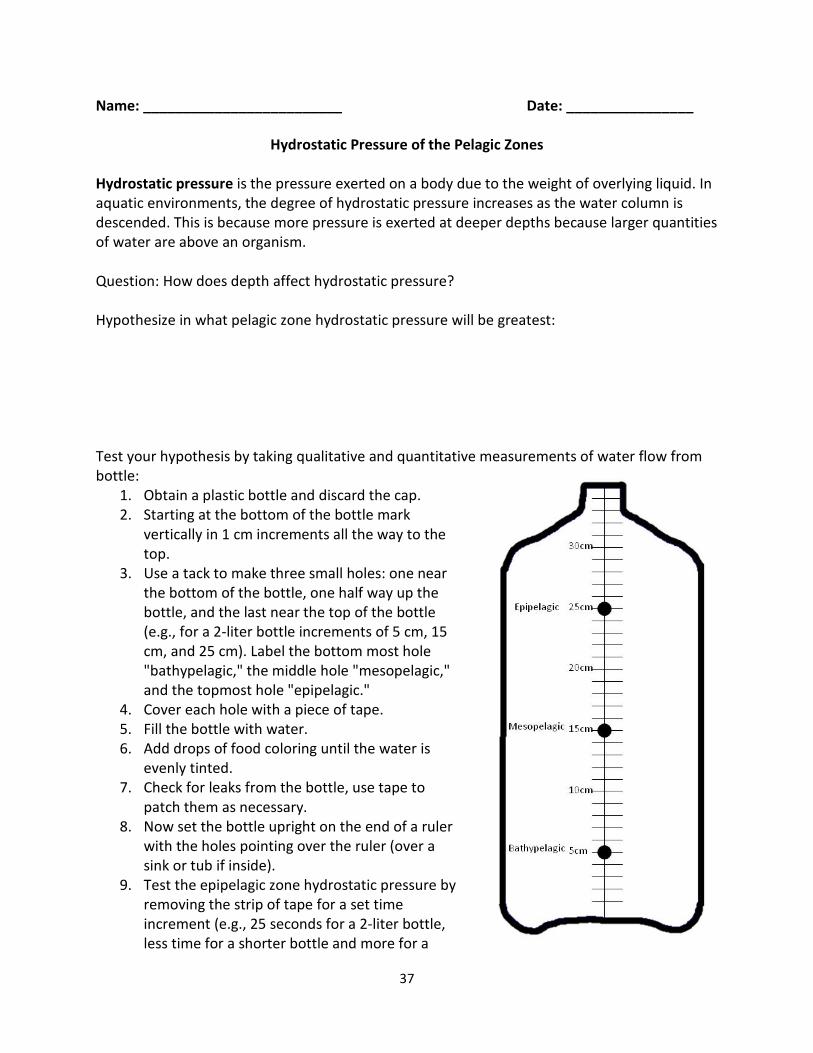
Hydrostatic pressure is the pressure exerted on a body due to the weight of overlying liquid. In aquatic environments, the degree of hydrostatic pressure increases as the water column is descended. This is because more pressure is exerted at deeper depths because larger quantities of water are above an organism. Question: How does depth affect hydrostatic pressure? Hypothesize in what pelagic zone hydrostatic pressure will be greatest: Test your hypothesis by taking qualitative and quantitative measurements of water flow from bottle:
1. Obtain a plastic bottle and discard the cap. 2. Starting at the bottom of the bottle mark
vertically in 1 cm increments all the way to the top.
3. Use a tack to make three small holes: one near the bottom of the bottle, one half way up the bottle, and the last near the top of the bottle (e.g., for a 2-liter bottle increments of 5 cm, 15 cm, and 25 cm). Label the bottom most hole "bathypelagic," the middle hole "mesopelagic," and the topmost hole "epipelagic."
4. Cover each hole with a piece of tape. 5. Fill the bottle with water. 6. Add drops of food coloring until the water is
evenly tinted. 7. Check for leaks from the bottle, use tape to
patch them as necessary. 8. Now set the bottle upright on the end of a ruler
with the holes pointing over the ruler (over a sink or tub if inside).
9. Test the epipelagic zone hydrostatic pressure by removing the strip of tape for a set time increment (e.g., 25 seconds for a 2-liter bottle, less time for a shorter bottle and more for a
38
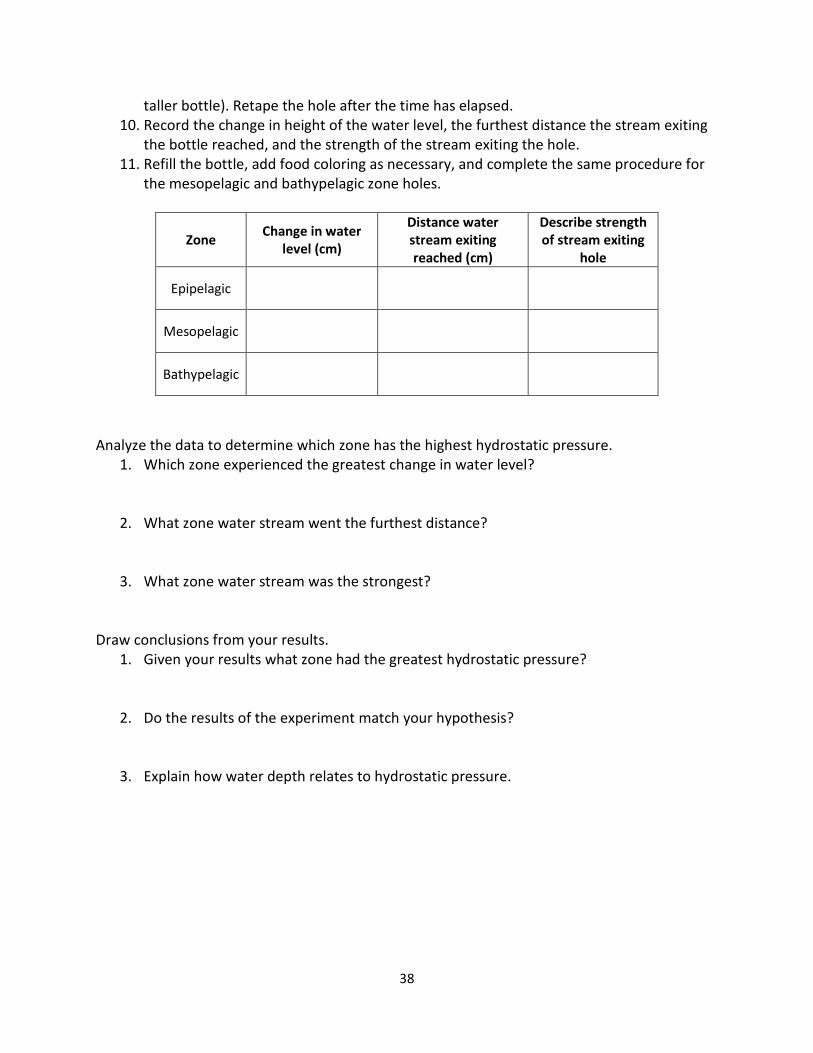
taller bottle). Retape the hole after the time has elapsed. 10. Record the change in height of the water level, the furthest distance the stream exiting
the bottle reached, and the strength of the stream exiting the hole. 11. Refill the bottle, add food coloring as necessary, and complete the same procedure for
the mesopelagic and bathypelagic zone holes.
Zone Change in water level (cm)
Distance water stream exiting reached (cm)
Describe strength of stream exiting
hole
Epipelagic Mesopelagic Bathypelagic
Analyze the data to determine which zone has the highest hydrostatic pressure.
1. Which zone experienced the greatest change in water level?
2. What zone water stream went the furthest distance?
3. What zone water stream was the strongest? Draw conclusions from your results.
1. Given your results what zone had the greatest hydrostatic pressure?
2. Do the results of the experiment match your hypothesis?
3. Explain how water depth relates to hydrostatic pressure.

39
Name: _________________________ Date: ________________
Hydrostatic Pressure Exploration
Hydrostatic pressure is the pressure exerted on a body due to the weight of overlying liquid. In aquatic environments, the degree of hydrostatic pressure increases as the water column is descended. This is because more pressure is exerted at deeper depths because larger quantities of water are above an organism. Conduct an experiment exploring hydrostatic pressure in differing aquatic environments, some factors to consider include the structure of the aquatic environment and depth. Write a research question: Write a hypothesis: Basic experimental protocol:
1. Obtain a plastic vessel. 2. Starting at the bottom of the vessel mark vertically in 1cm increments all the way to the
top. 3. Use a tack to make a small hole(s) in the bottle. 4. Cover the hole(s) with a piece of tape. 5. Fill the vessel with water. 6. Add drops of food coloring until the water is evenly tinted. 7. Check for leaks from the bottle, use tape to patch them as necessary. 8. Set the vessel upright on the edge of a ruler (over a sink or tub if inside). 9. Test the hydrostatic pressure by removing the strip of tape for a set increment of time.
Retape the hole. Record the change in height of the water level, the furthest distance the stream exiting the bottle reached, and the strength of the stream.
10. Refill the bottle, add food coloring as necessary, and complete the same procedure for remaining holes.
Outline your experimental design including your control, independent, and dependent variables:

40
Collect your data: Analyze your data and draw conclusions:
41
Name: _________________________ Date: ________________
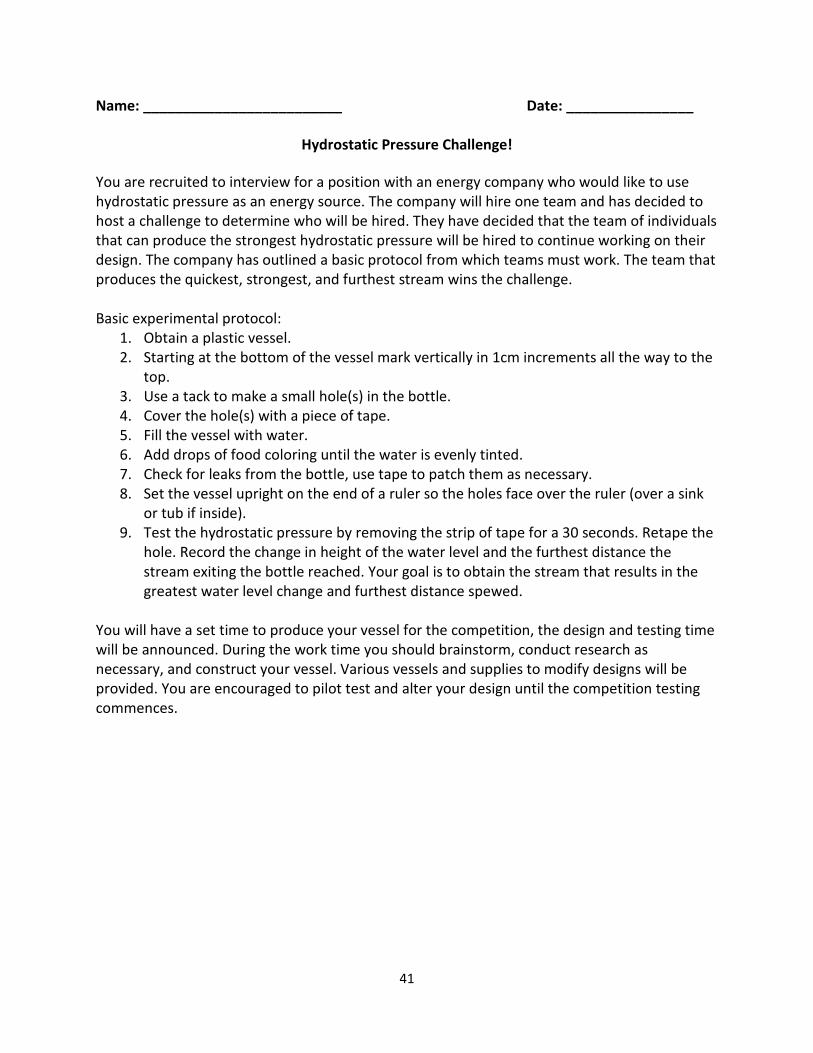
Hydrostatic Pressure Challenge! You are recruited to interview for a position with an energy company who would like to use hydrostatic pressure as an energy source. The company will hire one team and has decided to host a challenge to determine who will be hired. They have decided that the team of individuals that can produce the strongest hydrostatic pressure will be hired to continue working on their design. The company has outlined a basic protocol from which teams must work. The team that produces the quickest, strongest, and furthest stream wins the challenge. Basic experimental protocol:
1. Obtain a plastic vessel. 2. Starting at the bottom of the vessel mark vertically in 1cm increments all the way to the
top. 3. Use a tack to make a small hole(s) in the bottle. 4. Cover the hole(s) with a piece of tape. 5. Fill the vessel with water. 6. Add drops of food coloring until the water is evenly tinted. 7. Check for leaks from the bottle, use tape to patch them as necessary. 8. Set the vessel upright on the end of a ruler so the holes face over the ruler (over a sink
or tub if inside). 9. Test the hydrostatic pressure by removing the strip of tape for a 30 seconds. Retape the
hole. Record the change in height of the water level and the furthest distance the stream exiting the bottle reached. Your goal is to obtain the stream that results in the greatest water level change and furthest distance spewed.
You will have a set time to produce your vessel for the competition, the design and testing time will be announced. During the work time you should brainstorm, conduct research as necessary, and construct your vessel. Various vessels and supplies to modify designs will be provided. You are encouraged to pilot test and alter your design until the competition testing commences.
42
Ocean Acidification! Objective Students will be introduced to the pH scale.
Next Generation Science Standards applicable to activity and extensions
• MS-LS2-4. Construct an argument supported by empirical evidence that changes to physical or biological components of an ecosystem affect populations.
• MS-ETS1-2. Evaluate competing design solutions using a systematic process to determine how well they meet the criteria and constraints of the problem.
• HS-LS4-6. Create or revise a simulation to test a solution to mitigate adverse impacts of human activity on biodiversity.
• HS-LS4-5. Evaluate the evidence supporting claims that changes in environmental conditions may result in: (1) increases in the number of individuals of some species, (2) the emergence of new species over time, and (3) the extinction of other species.
Supplies
• Cups • Liquids of different pH (e.g., tap water, lemon juice, bleach, tea, soda, etc.) • pH strips • pH probe
Lesson This lesson introduces the phenomenon ocean acidification. First, students investigate unknown solutions to determine if they are acids, bases, or neutral on the pH scale. Using the "pH of a Solution" handout students first predict the chemical properties of solutions and then test using pH strips. Then, students complete the "Ocean Acidification" activity. This activity challenges students to change the pH of water by using common solutions (sugar water, soda, and lemon juice). This exploration strengthens student understanding of the pH scale while reinforcing the reality that pH of a solution can change. A pH probe is needed for this activity, however, the activity can be modified so students look at a change of 1 pH (more easily detectable when using pH strips). Also, if pH paper is not available a homemade acid indicator can be used. To create the homemade indicator boil 0.5 L of distilled water. Finely chop RED cabbage. Stir cabbage into boiling water, remove from heat, and let sit until cold. Transfer the liquid to a jar while straining the cabbage particles. The indicator should be dark reddish-purple. For testing add drops of indicator to sample until sample changes color: red = acid, no effect = neutral, blue = weak base, and green = strong base. A discussion can ensue from this activity about the survival or organisms as chemical properties of aquatic systems change. An extension of the Ocean Acidification portion of the lesson is to have students reverse the effects of acidification through the addition of weak and strong bases. A pH chart of common solutions has been included on the following page for student reference.

43

44
Name: _________________________ Date: ________________
pH of a Solution
Select ten sample solutions. Predict if they will be acidic, basic, or neutral. Then, using pH strips determine the pH of the solutions. Record your results below.
Solution Name pH predication (acidic, basic, neutral) pH
How many of your predictions were correct? What was your most basic solution? Your most acidic?
45
Name: _________________________ Date:________________
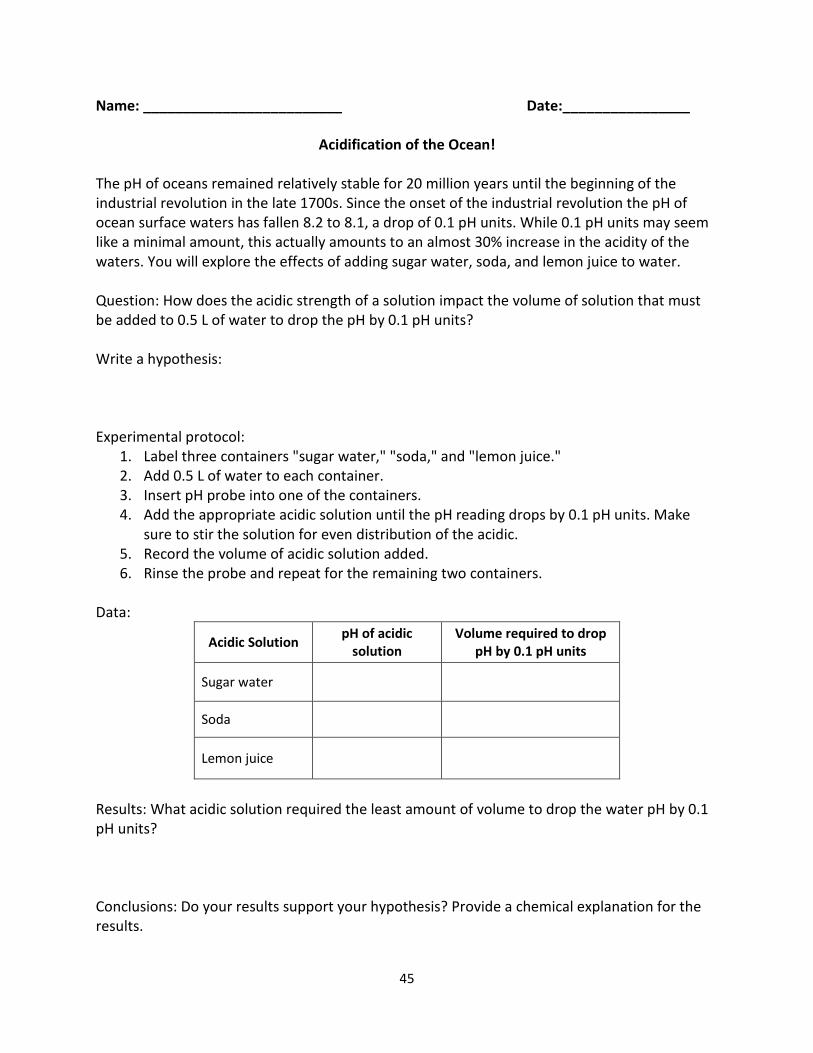
Acidification of the Ocean!
The pH of oceans remained relatively stable for 20 million years until the beginning of the industrial revolution in the late 1700s. Since the onset of the industrial revolution the pH of ocean surface waters has fallen 8.2 to 8.1, a drop of 0.1 pH units. While 0.1 pH units may seem like a minimal amount, this actually amounts to an almost 30% increase in the acidity of the waters. You will explore the effects of adding sugar water, soda, and lemon juice to water. Question: How does the acidic strength of a solution impact the volume of solution that must be added to 0.5 L of water to drop the pH by 0.1 pH units? Write a hypothesis: Experimental protocol:
1. Label three containers "sugar water," "soda," and "lemon juice." 2. Add 0.5 L of water to each container. 3. Insert pH probe into one of the containers. 4. Add the appropriate acidic solution until the pH reading drops by 0.1 pH units. Make
sure to stir the solution for even distribution of the acidic. 5. Record the volume of acidic solution added. 6. Rinse the probe and repeat for the remaining two containers.
Data:
Acidic Solution pH of acidic solution
Volume required to drop pH by 0.1 pH units
Sugar water
Soda
Lemon juice Results: What acidic solution required the least amount of volume to drop the water pH by 0.1 pH units? Conclusions: Do your results support your hypothesis? Provide a chemical explanation for the results.

46
Culmination Objective Students should be able to synthesize information learned in this module and apply it to a real life scenario. Lesson This lesson provides students with a means to summarize their learning. This lesson can also be used as an assessment tool providing insights into student mastery of content in relation to marine environments. The premise of this lesson is for students to put themselves into the shoes of the DEEPEND scientists. Students are asked to predict what data they will obtain from water column sampling in the Gulf of Mexico. This lesson can be expanded by having students track a cruise in real time (DEEPENDconstorium.org). Students can be asked to map the locations, to track weather patterns, to observe current patterns, and to modify their predictions regarding water properties accordingly.
47
Name: _________________________ Date: ________________
Dive in with the DEEPEND crew!
The first DEEPEND cruise set sail at 2:37am on May 1, 2015 in the Gulf of Mexico. The University of Southern Mississippi's research vessel, the R/V Point Sur, was home to the scientists and crew for seven days. During these seven days the scientists collected organisms from the water column as well as water samples. At eight sites water samples were taken from at least three depths within the water column ensuring samples were representative of the epipelagic, mesopelagic, and bathypelagic zones. Based on what you know about the marine water column, what chemical and physical properties do you expect are present in each zone of the water column? Do you expect all sites to have the same properties? Provide a narrative and hypothetical data table/figure. ______________________________________________________________________________________________________________________________________________________________________________________________________________________________________________________________________________________________________________________________________________________________________________________________________________________________________________________________________________________________________________________________________________________________________________________________________________________________________________________________.
48
References and resources for teachers and students Day T. 2006. Oceans. Chelsea House; New York. MarineBio Conservation Society. http://marinebio.org National Oceanic and Atmospheric Administration (NOAA). www.noaa.gov Nollet L.M., Boylston T., Chen F., Coggins P., Hydlig G., McKee L.H., & Kerth C. (Eds.). 2012; 2nd Edition. Handbook of Meat, Poultry, and Seafood Quality. Wiley-Blackwell. Science Learning Hub. The University of Waikato. http://sciencelearn.org.nz/Contexts/Life-in-the-Sea/Science-Ideas-and-Concepts/Marine-habitats Seafriends Marine Conservation and Education Centre New Zealand. www.seafriends.org.nz/index.htm WhaleTimes, Inc. http://whaletimes.org/ World Wildlife Foundation. www.worldwildlife.org/habitats/ocean-habitat
49
© 2015 K. Denise Kendall and DEEPEND consortium Photo Credits: Heather Judkins, University of South Florida St. Petersburg. Tammy Frank, Nova Southeastern University Oceanographic Center. Jon Moore, Florida Atlantic University. Dante Fenolio, San Antonio Zoo. Squirt Stills: Stanton Broadway, San Antonio Zoo. About the Author: Dr. K. Denise Kendall is a graduate of the Department of Ecology and Evolutionary Biology at the University of Tennessee-Knoxville (2013). She holds a Florida Professional Teaching Certificate (Biology 6-12) from the University of West Florida. Dr. Kendall is committed to the advancement of science education in K-12 and higher education through the integration of authentic scientific experiences into course curricula.