Embed Size (px)
Citation preview
Vol.:(0123456789)
https://doi.org/10.1007/s10649-021-10090-9
1 3
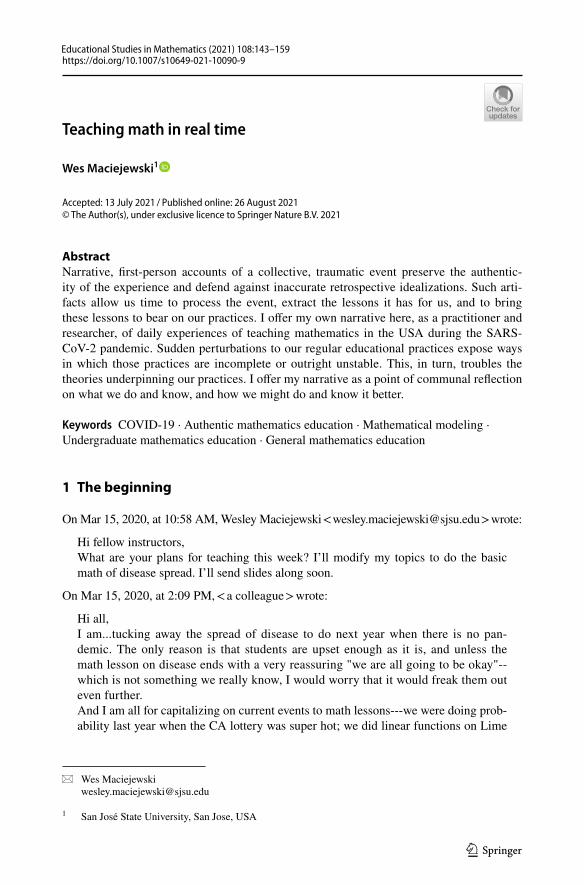
Teaching math in real time
Wes Maciejewski1
Accepted: 13 July 2021 © The Author(s), under exclusive licence to Springer Nature B.V. 2021
AbstractNarrative, first-person accounts of a collective, traumatic event preserve the authentic-ity of the experience and defend against inaccurate retrospective idealizations. Such arti-facts allow us time to process the event, extract the lessons it has for us, and to bring these lessons to bear on our practices. I offer my own narrative here, as a practitioner and researcher, of daily experiences of teaching mathematics in the USA during the SARS-CoV-2 pandemic. Sudden perturbations to our regular educational practices expose ways in which those practices are incomplete or outright unstable. This, in turn, troubles the theories underpinning our practices. I offer my narrative as a point of communal reflection on what we do and know, and how we might do and know it better.
Keywords COVID-19 · Authentic mathematics education · Mathematical modeling · Undergraduate mathematics education · General mathematics education
1 The beginning
On Mar 15, 2020, at 10:58 AM, Wesley Maciejewski < [email protected] > wrote:
Hi fellow instructors,What are your plans for teaching this week? I’ll modify my topics to do the basic math of disease spread. I’ll send slides along soon.
On Mar 15, 2020, at 2:09 PM, < a colleague > wrote:
Hi all,I am...tucking away the spread of disease to do next year when there is no pan-demic. The only reason is that students are upset enough as it is, and unless the math lesson on disease ends with a very reassuring "we are all going to be okay"--which is not something we really know, I would worry that it would freak them out even further.And I am all for capitalizing on current events to math lessons---we were doing prob-ability last year when the CA lottery was super hot; we did linear functions on Lime
* Wes Maciejewski [email protected]
1 San José State University, San Jose, USA
Published online: 26 August 2021
Educational Studies in Mathematics (2021) 108:143–159
/
1 3
scooters and Ford go bikes to determine best buy; we talk about the Warren Buffet Challenge during March Madness. But this pandemic is a hotbed of emotions...Just my 2 cents.
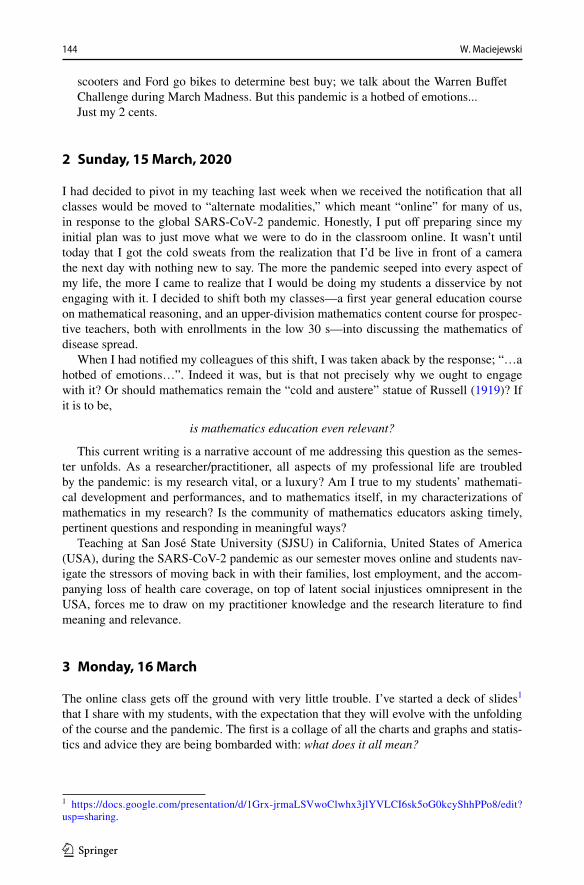
2 Sunday, 15 March, 2020
I had decided to pivot in my teaching last week when we received the notification that all classes would be moved to “alternate modalities,” which meant “online” for many of us, in response to the global SARS-CoV-2 pandemic. Honestly, I put off preparing since my initial plan was to just move what we were to do in the classroom online. It wasn’t until today that I got the cold sweats from the realization that I’d be live in front of a camera the next day with nothing new to say. The more the pandemic seeped into every aspect of my life, the more I came to realize that I would be doing my students a disservice by not engaging with it. I decided to shift both my classes—a first year general education course on mathematical reasoning, and an upper-division mathematics content course for prospec-tive teachers, both with enrollments in the low 30 s—into discussing the mathematics of disease spread.
When I had notified my colleagues of this shift, I was taken aback by the response; “…a hotbed of emotions…”. Indeed it was, but is that not precisely why we ought to engage with it? Or should mathematics remain the “cold and austere” statue of Russell (1919)? If it is to be,
is mathematics education even relevant?
This current writing is a narrative account of me addressing this question as the semes-ter unfolds. As a researcher/practitioner, all aspects of my professional life are troubled by the pandemic: is my research vital, or a luxury? Am I true to my students’ mathemati-cal development and performances, and to mathematics itself, in my characterizations of mathematics in my research? Is the community of mathematics educators asking timely, pertinent questions and responding in meaningful ways?
Teaching at San José State University (SJSU) in California, United States of America (USA), during the SARS-CoV-2 pandemic as our semester moves online and students nav-igate the stressors of moving back in with their families, lost employment, and the accom-panying loss of health care coverage, on top of latent social injustices omnipresent in the USA, forces me to draw on my practitioner knowledge and the research literature to find meaning and relevance.
3 Monday, 16 March
The online class gets off the ground with very little trouble. I’ve started a deck of slides1 that I share with my students, with the expectation that they will evolve with the unfolding of the course and the pandemic. The first is a collage of all the charts and graphs and statis-tics and advice they are being bombarded with: what does it all mean?
1 https:// docs. google. com/ prese ntati on/d/ 1Grx- jrmaL SVwoC lwhx3 jlYVL CI6sk 5oG0k cyShh PPo8/ edit? usp= shari ng.
144 W. Maciejewski
1 3
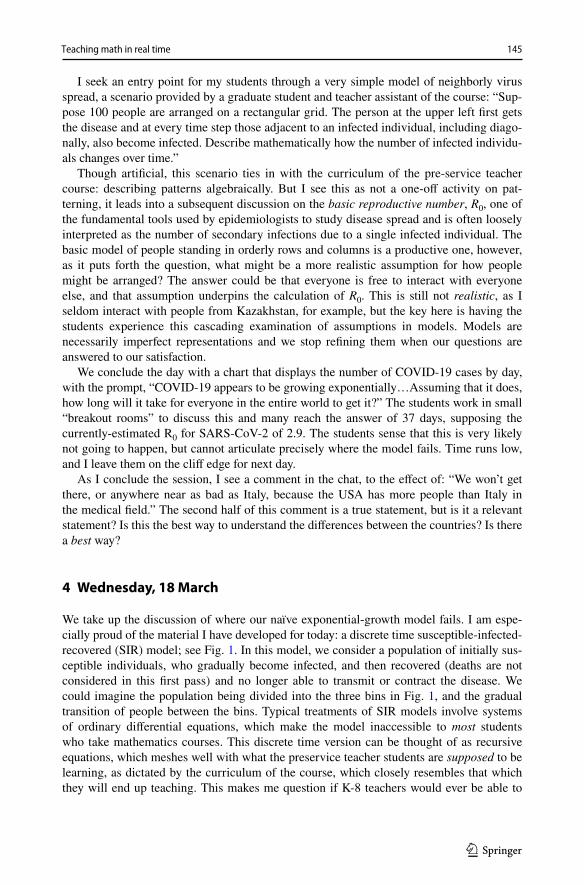
I seek an entry point for my students through a very simple model of neighborly virus spread, a scenario provided by a graduate student and teacher assistant of the course: “Sup-pose 100 people are arranged on a rectangular grid. The person at the upper left first gets the disease and at every time step those adjacent to an infected individual, including diago-nally, also become infected. Describe mathematically how the number of infected individu-als changes over time.”
Though artificial, this scenario ties in with the curriculum of the pre-service teacher course: describing patterns algebraically. But I see this as not a one-off activity on pat-terning, it leads into a subsequent discussion on the basic reproductive number, R0, one of the fundamental tools used by epidemiologists to study disease spread and is often loosely interpreted as the number of secondary infections due to a single infected individual. The basic model of people standing in orderly rows and columns is a productive one, however, as it puts forth the question, what might be a more realistic assumption for how people might be arranged? The answer could be that everyone is free to interact with everyone else, and that assumption underpins the calculation of R0. This is still not realistic, as I seldom interact with people from Kazakhstan, for example, but the key here is having the students experience this cascading examination of assumptions in models. Models are necessarily imperfect representations and we stop refining them when our questions are answered to our satisfaction.
We conclude the day with a chart that displays the number of COVID-19 cases by day, with the prompt, “COVID-19 appears to be growing exponentially…Assuming that it does, how long will it take for everyone in the entire world to get it?” The students work in small “breakout rooms” to discuss this and many reach the answer of 37 days, supposing the currently-estimated R0 for SARS-CoV-2 of 2.9. The students sense that this is very likely not going to happen, but cannot articulate precisely where the model fails. Time runs low, and I leave them on the cliff edge for next day.
As I conclude the session, I see a comment in the chat, to the effect of: “We won’t get there, or anywhere near as bad as Italy, because the USA has more people than Italy in the medical field.” The second half of this comment is a true statement, but is it a relevant statement? Is this the best way to understand the differences between the countries? Is there a best way?
4 Wednesday, 18 March
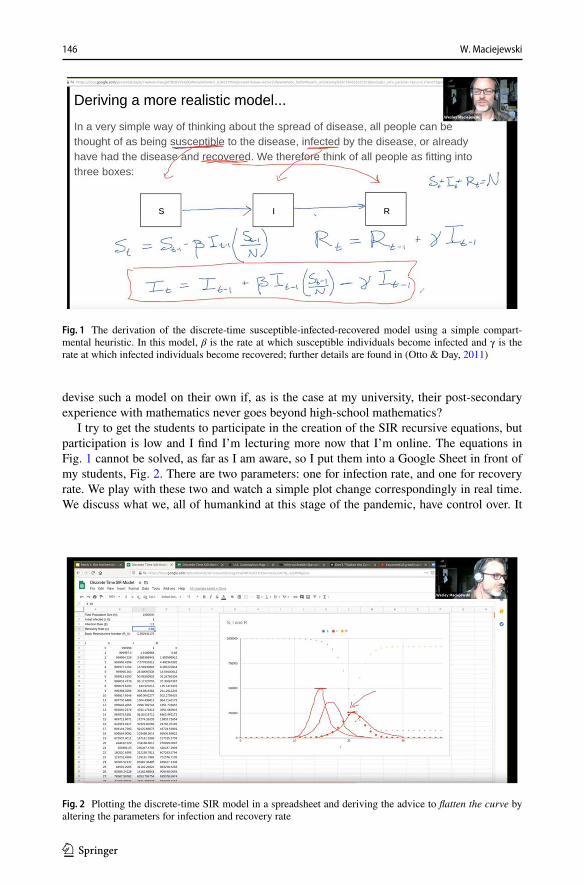
We take up the discussion of where our naïve exponential-growth model fails. I am espe-cially proud of the material I have developed for today: a discrete time susceptible-infected-recovered (SIR) model; see Fig. 1. In this model, we consider a population of initially sus-ceptible individuals, who gradually become infected, and then recovered (deaths are not considered in this first pass) and no longer able to transmit or contract the disease. We could imagine the population being divided into the three bins in Fig. 1, and the gradual transition of people between the bins. Typical treatments of SIR models involve systems of ordinary differential equations, which make the model inaccessible to most students who take mathematics courses. This discrete time version can be thought of as recursive equations, which meshes well with what the preservice teacher students are supposed to be learning, as dictated by the curriculum of the course, which closely resembles that which they will end up teaching. This makes me question if K-8 teachers would ever be able to
145Teaching math in real time
1 3
devise such a model on their own if, as is the case at my university, their post-secondary experience with mathematics never goes beyond high-school mathematics?
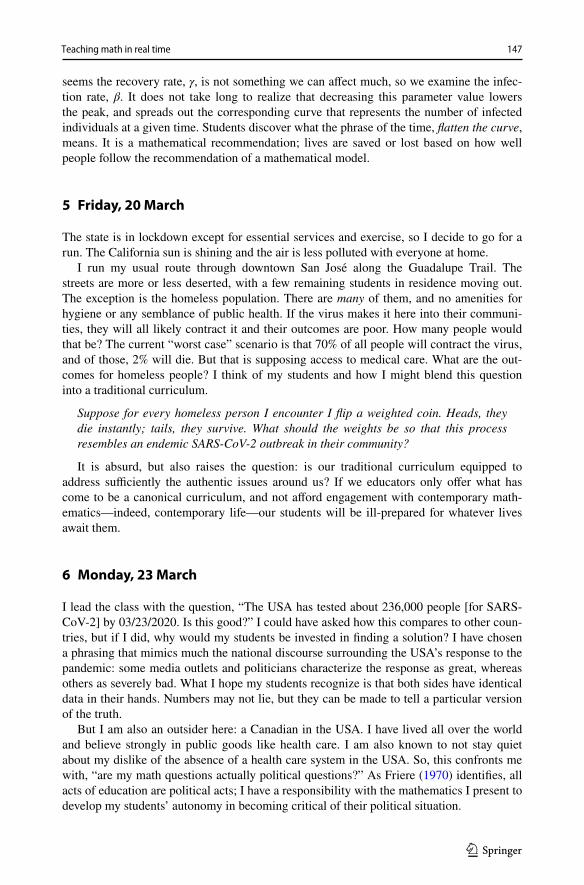
I try to get the students to participate in the creation of the SIR recursive equations, but participation is low and I find I’m lecturing more now that I’m online. The equations in Fig. 1 cannot be solved, as far as I am aware, so I put them into a Google Sheet in front of my students, Fig. 2. There are two parameters: one for infection rate, and one for recovery rate. We play with these two and watch a simple plot change correspondingly in real time. We discuss what we, all of humankind at this stage of the pandemic, have control over. It
Fig. 1 The derivation of the discrete-time susceptible-infected-recovered model using a simple compart-mental heuristic. In this model, β is the rate at which susceptible individuals become infected and γ is the rate at which infected individuals become recovered; further details are found in (Otto & Day, 2011)
Fig. 2 Plotting the discrete-time SIR model in a spreadsheet and deriving the advice to flatten the curve by altering the parameters for infection and recovery rate
146 W. Maciejewski
1 3
seems the recovery rate, γ, is not something we can affect much, so we examine the infec-tion rate, β. It does not take long to realize that decreasing this parameter value lowers the peak, and spreads out the corresponding curve that represents the number of infected individuals at a given time. Students discover what the phrase of the time, flatten the curve, means. It is a mathematical recommendation; lives are saved or lost based on how well people follow the recommendation of a mathematical model.
5 Friday, 20 March
The state is in lockdown except for essential services and exercise, so I decide to go for a run. The California sun is shining and the air is less polluted with everyone at home.
I run my usual route through downtown San José along the Guadalupe Trail. The streets are more or less deserted, with a few remaining students in residence moving out. The exception is the homeless population. There are many of them, and no amenities for hygiene or any semblance of public health. If the virus makes it here into their communi-ties, they will all likely contract it and their outcomes are poor. How many people would that be? The current “worst case” scenario is that 70% of all people will contract the virus, and of those, 2% will die. But that is supposing access to medical care. What are the out-comes for homeless people? I think of my students and how I might blend this question into a traditional curriculum.
Suppose for every homeless person I encounter I flip a weighted coin. Heads, they die instantly; tails, they survive. What should the weights be so that this process resembles an endemic SARS-CoV-2 outbreak in their community?
It is absurd, but also raises the question: is our traditional curriculum equipped to address sufficiently the authentic issues around us? If we educators only offer what has come to be a canonical curriculum, and not afford engagement with contemporary math-ematics—indeed, contemporary life—our students will be ill-prepared for whatever lives await them.
6 Monday, 23 March
I lead the class with the question, “The USA has tested about 236,000 people [for SARS-CoV-2] by 03/23/2020. Is this good?” I could have asked how this compares to other coun-tries, but if I did, why would my students be invested in finding a solution? I have chosen a phrasing that mimics much the national discourse surrounding the USA’s response to the pandemic: some media outlets and politicians characterize the response as great, whereas others as severely bad. What I hope my students recognize is that both sides have identical data in their hands. Numbers may not lie, but they can be made to tell a particular version of the truth.
But I am also an outsider here: a Canadian in the USA. I have lived all over the world and believe strongly in public goods like health care. I am also known to not stay quiet about my dislike of the absence of a health care system in the USA. So, this confronts me with, “are my math questions actually political questions?” As Friere (1970) identifies, all acts of education are political acts; I have a responsibility with the mathematics I present to develop my students’ autonomy in becoming critical of their political situation.
147Teaching math in real time
1 3
7 Wednesday, 25 March
Class begins and the participant count slowly climbs at the bottom of my screen. I feel pressure, self-imposed, to get through as much material as I can today and I begin when attendance is at 50%. It is more a lecture than I would like, but I press on with the increas-ing tension in my chest. The presentation is going well, and I have students try some prob-lems, but as they do I become aware of the silence of my office and suddenly annoyed by the array of black rectangles on my monitors in front of me. I let time pass in silence. Then: “Who has an answer for me?” Silence. “(Student A)?” Silence. “(Student B)?” No sound.
“Ok, I can’t take this. I can’t be talking to myself each day. I need you all to partici-pate. You can’t learn math in isolation. You need to talk about it, to share where you are and where you’re going in each problem. That’s how people learn. Everyone—un-mute and cameras on. Let’s get learning.” Slowly, gradually, sound fills my head-phones. I hear a younger sister recite her Spanish alphabet; dishes clanging as if in a restaurant kitchen; a loud T.V. and people talking; cars and traffic; wind; a cacoph-ony. Cameras turn on and I’m transported to my students’ kitchen tables and couches and bedrooms and cars and parents’ businesses, a public park, a shot of downtown. Caught off guard, I’m now mute. “Ah...ok—that’s fine if you’re muted. Just do your best and participate when you can.”
Class ends and the silence of my private office once again envelops me.
8 Friday, 27 March
The weather is nice and I go for another run. There are more people out than last time, but it seems that they are respecting social distancing. What is peculiar is that small cliques of people seem to be distancing from other cliques. Groups of three or four move as a unit around other groups of three and four. I wonder what effect this behavior has on the spread of the virus?
Rust in Peace…Polaris appears on my playlist and blasts me out of my trance: “I spread disease like a dog…”. The performers derive their name from a unit of measurement devel-oped during the cold war: one Megadeath is one million human lives lost, typically due to nuclear war. In times of need, mathematics is there for you.
The cliques of people turn my thoughts back to the basic reproductive ratio, R0, and how I might explain it to my students. In a typical, ordinary differential equation (ODE)-based SIR model of disease spread, R0 is defined—in the absence of death, a simplifying assumption—as the transmission rate divided by the recovery rate (Otto & Day, 2011). With this definition it is easy to see how R0 = 1 is a threshold for the disease spread: go above 1 and people are being infected faster than recovering and the disease spreads; below 1 and recovery is faster than transmission and the disease is kept at bay. We discussed this in class yesterday in terms of what proportion of people should be vaccinated against a disease so that it does not spread. But what is difficult to have the students understand is the assumptions underpinning R0. With an ODE SIR model, it is assumed that every individual can interact with any other; the population is well-mixed. Clearly that is not the case. Peo-ple are networked. We are not free to interact with whomever. People tend to interact more with those in their immediate clique, altering traditional derivations and interpretations of
148 W. Maciejewski
1 3
R0 (Danon et al., 2011). Despite this reality, R0 persists in being widely used when discuss-ing disease spread: as imperfect as it is, it is useful (Freudenthal, 1968).
There is a question lurking here for my students, but also for the mathematics education community: why model? The best answer I have is, to answer a question asked of a situ-ation. The situation is not modeled itself, but rather a question must be posed to elicit the model (Lesh et al., 2000). This seems to be lacking from so much of the modeling litera-ture; it does not matter how authentic the situation is (Kaiser & Schwarz, 2010), there is nothing to be modeled in the absence of a question. The current pandemic is no exception. A modeler might take the humanitarian perspective and ask about the predicted loss of life, whereas one might take an economic perspective and ask about the effect on unem-ployment. Both are valid approaches, and neither are intrinsic to the pandemic, but rather arise from questions asked of it. If we do not permit our students to ask questions of a situ-ation, then we are not permitting them to engage in an authentic mathematical modeling experience.
And what does it mean for a situation presented to the students to be authentic? Follow-ing Niss (1987), it ought to be one that might be reasonably encountered by a practitioner in the domain in which it is embedded. But I press back against that: would the students choose that domain to begin with? So much of what we do as researchers and practition-ers is normative, and this seems to be inescapable. No matter how woke or aware we are, we are, and that brings along background and culture and bias. If we are to be authentic with our teaching, we must foreground and center our students’ point of view (Leung et al., 2020). But as much as I believe in that as I write it, I find it difficult to do it in practice.
9 Monday, 30 March
It is the first day of Spring Break for the California State University. So far, no reports of wild beach parties like those in Florida over the past weeks. I am thinking how I will have to alter the assessment in my courses, having switched to alternate modalities. My students are stressed and overworked, and we are all dealing with confinement with family; no mat-ter how much we love them, they take time and energy. All this means I should assess in a way that minimizes the time required of me to create and grade the assessments, all the while affording opportunities for my students to demonstrate their newly acquired math-ematical skills and knowledge and perspectives. It is a difficult balancing act and I am not sure how to best respond.
Before the alternate modalities, students completed their second midterm. It was a two-stage (Gilley & Clarkston, 2014), open-resource (Maciejewski, 2019) exam, with individ-uals solving one free-response question, then breaking into groups of 4 (the number of chairs around the desks in our physical classroom) and solving a second question. That group question springs to mind as I check the latest SARS-CoV-2 infection numbers in the USA (around 150,000):
How long would it take you to pay off your share of the Federal Government of the USA’s debt?
There are many ways the students could tackle this. Only a couple pushed back against “your share”—does it make sense for all individuals to have an equal share, no matter how small relative to the total amount, if you did not support some of the policies (e.g., war) that led to the debt?
149Teaching math in real time
1 3
But why this comes to mind now is: what share of the COVID-19 deaths am I respon-sible for? The USA in particular saw the slow rising wave of the virus encroaching on its territory and the effect similar waves had on other countries. Systemic incompetence lead to a delayed response and policies already in place or adopted ad hoc led to further delays and permitted a foothold for the virus. The exponential growth curve we are riding could have been a significantly lower power if we had adopted a quicker, reasoned response. But this would have required those who hold the power, and the citizenry who hold them to account, to be capable of engaging with and understanding quantitative information and predictions and models.
Our only guesses at how the virus will spread rely heavily on mathematical machinery. Not understanding the machinery entails not fully understanding the predictions. It is not that the leaders had not received an education; many have degrees from the top universi-ties in the world. But I question what skills their education afforded the development of. Mathematics is often conceived by those who practice it as rigorously logical, the apex of abstract, careful reasoning. Yet the same practitioners teach the subject in an astoundingly rote and procedural way, especially in post-secondary where the clear majority of students enrolled in mathematics courses never see beyond the procedures to practice and memorize (Maciejewski & Merchant, 2016; Tallman et al., 2016). The deeper reasoning skills are never fostered in the majority of our students, and some of them go on to create policy to respond to pandemics. Their mis-actions, or their outright absence of relevant knowledge, are equally attributable to them as to those who educated them. The voter who votes only along party lines and was never afforded the opportunity to develop the logical, quantita-tive, reasoning skills necessary to navigate a complex information society can point to their teachers for the failure of the policies they voted for. As educators, we all share the burden of society.
10 Monday, 6 April
Classes are returning today from Spring Break. I have decided to start with the mathemat-ics of social networks. My university is in the heart of Silicon Valley and the currency that drives the entire local—and sets the pace for the global—economy is data, but not tradi-tional notions of data nor traditional ways of looking at data. The data that Silicon Valley techies salivate over is the structure and evolution of social networks. Knowing how people relate, how these relations change over time, and who the key players are has created new ways of thinking about data and how to leverage it. Case in point, an entirely new career has arisen in the last few years, that of influencer, that explicitly attempts to extend and leverage a person’s relative position within a social network. We have also seen the swell-ing of fake news that, when spread over social networks, has swayed the outcomes of elec-tions and initiated genocides around the world (Bourg et al., 2018). Given their prominence in contemporary life, it is surprising to see a complete absence of social network theory in foundational mathematics curriculum. But again, an over-reliance on traditional cur-riculum limits what teachers and the teacher educators can do with their education: if they never are given the opportunity to engage with contemporary mathematics, they cannot be expected to teach contemporary mathematics.
I begin my class today talking about social networks in the broader political and social context. As I do, it strikes me that my students do not know of any other world than the cur-rent hyper-connected one. Cambridge Analytica sounds vaguely familiar to only a couple
150 W. Maciejewski
1 3
of them; when I show a video of the of rise extreme partisanship in the House of Congress (Business Insider, 2016), I recall that many of my students were born post 9/11 (i.e., the 11 September, 2001, terrorist attacks on the World Trade Center) and know US politics only as being extremely polarized. The ways in which my students access and use knowledge is also markedly different than the ways I did as an undergraduate. As a result, the nature of the knowledge that what was once highly valued is shifting: being educated no longer ought to mean knowing a large, specialized body of knowledge. That knowledge is easily accessed through the device in your back pocket. Knowing the quadratic formula or the names of the Platonic solids—indeed, that there are such things as Platonic solids—is as antiquated as knowing Latin. The perspective on what being educated means needs to shift and mathematics is well-positioned, with its current surge in prominence, to lead that shift.
I drag a Google Sheet into view with the class list on it. The students fill it out by locat-ing their name along the top row and putting a “1” in each row that corresponds to a fellow student’s name they recognize in the first column, whether it be that they sat together in class, or completed the group portion of the exam together, etc. The other sheets auto-populate a degree distribution histogram, and an adjacency matrix for the social network, which I plot in an online network visualization website. I put the link for this network in the Zoom chat and the students are free to drag the vertices around to see how the class is connected. The task I give them is, “Who is the most important student in our class?” This is left up to interpretation and the students quickly develop notions of “importance” that closely resemble what is used as research-level metrics: the vertices with the highest degrees (i.e., degree centrality (Bonacich, 1987)), those vertices that are at a minimum dis-tance to all others in the network (closeness (Bavelas, 1950)), and those whose connections have the most connections.
As I am going through these lessons with my class of pre-service teachers, the course textbook (Billstein et al., 2019) sitting across my desk catches my eye. The text has no mention of contemporary mathematics; indeed, it first was published in 1981, 1 year before my birth and 17 years before Google’s and seems to have changed very little since then. Its 600-odd, glossy, and cluttered pages articulate at length what has come to be the canonical body of foundational mathematics. It makes me question: how was this curriculum settled on? More importantly, how might it be changed? It took a Cold War to crown calculus as the monarch of elementary mathematics (Tucker, 2013), but even the relevance of calculus is waning in many fields. What might take its place, and would teachers and teacher educa-tors be able to teach it?
11 Monday, 13 April
We start class today by returning to our discussion of the “most important” student in class. I have the visualization of our social network open alongside the spreadsheet, which the students and I are filling out live. This leads to around 20 min of dead air during class, but I think this is worth it. This chasing through the network to calculate the distances between students may be tedious, but also illustrates what is involved in the spread of disease; what route might SARS-CoV-2 have taken from the wet market in China to the SJSU campus?
Lately, I feel that perhaps the experiences I have for my students are too far removed from the experiences they have had and will have (Yackel & Cobb, 1996). This leads to me feeling the “seduction” of a canonical curriculum, as might be present in a textbook (Wag-ner, 2012), and a compulsion to deliver such a curriculum at least in part. To that end, I
151Teaching math in real time
1 3
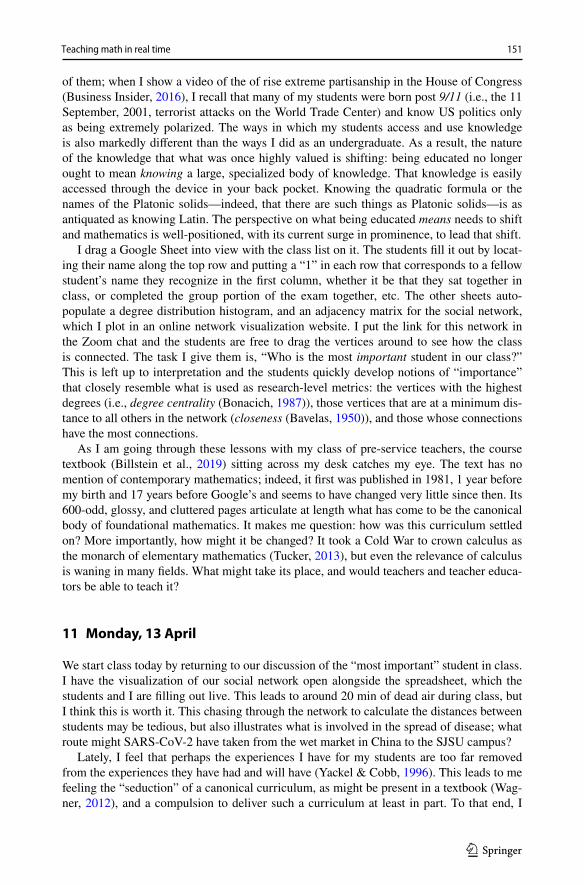
steer the course in the direction of probability theory, not losing sight of having this emerge from social networks. The exit sign for our detour comes in the form of a question: “Have you ever noticed that on average your friends have more friends than you?” Many students unmute at this and give a yes and a chuckle. I tell them to turn to our social network, find their vertex, and calculate the average number of friends their friends have. Sure enough, all the students, except for 2, have fewer friends than their friends do, on average. They seem surprised at this, and some voice their uncertainty in their own calculations. I assure them that they are correct and this is a mathematical phenomenon that arises in social net-works: the Friendship Paradox (Feld, 1991). It is a simple enough result, but there are some technical points that may lead to confusion—re-writing variance in terms of a dif-ference of expected values, for example. I write the expression for the average number of friends the friends of a randomly-selected member of the social network has, Fig. 3.
We have not had much contact with expected values, so I chose to use this equation as an invitation for encountering them further. This invitation hopefully rides the wave of sur-prise the students expressed from the Friendship Paradox.
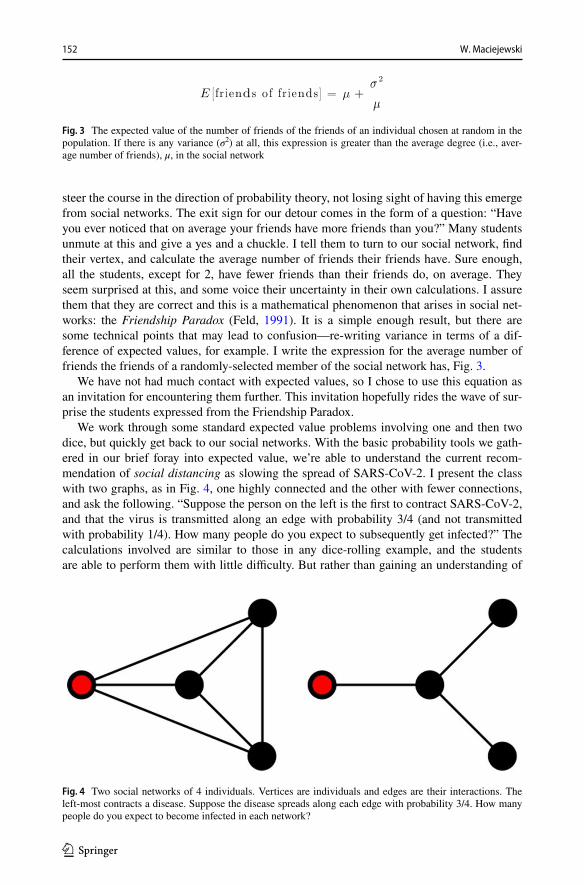
We work through some standard expected value problems involving one and then two dice, but quickly get back to our social networks. With the basic probability tools we gath-ered in our brief foray into expected value, we’re able to understand the current recom-mendation of social distancing as slowing the spread of SARS-CoV-2. I present the class with two graphs, as in Fig. 4, one highly connected and the other with fewer connections, and ask the following. “Suppose the person on the left is the first to contract SARS-CoV-2, and that the virus is transmitted along an edge with probability 3/4 (and not transmitted with probability 1/4). How many people do you expect to subsequently get infected?” The calculations involved are similar to those in any dice-rolling example, and the students are able to perform them with little difficulty. But rather than gaining an understanding of
Fig. 3 The expected value of the number of friends of the friends of an individual chosen at random in the population. If there is any variance (σ2) at all, this expression is greater than the average degree (i.e., aver-age number of friends), μ, in the social network
Fig. 4 Two social networks of 4 individuals. Vertices are individuals and edges are their interactions. The left-most contracts a disease. Suppose the disease spreads along each edge with probability 3/4. How many people do you expect to become infected in each network?
152 W. Maciejewski
1 3
some artificial gambling scenario from a traditional curriculum, the students begin to see why they are now taking this class remotely: removing connections in a social network reduces the expected number of infected individuals. Staying at home saves lives.
12 Tuesday, 21 April
I decide to do more with probability, since it is a topic with strongly held intuitions that often are wrong (Garfield & Ahlgren, 1988). Truthfully, I could also use a reprieve from pandemic talk. The daily press conferences and the unabating increase in cases is exhaust-ing. Also, math is more than making sense of the world around us or modeling or social justice; it is also about getting familiar and comfortable with using it, unpacking formulas and equations and performing calculations. Unpopular as that opinion might be currently, it is nonetheless fact. Successful mathematics education is a careful balance of all these and more aspects and forces.
The question for today I thought is a fairly straight-forward review of expected value: “The game is as follows. You flip a coin and if you get heads, you roll one die; tails, and you roll two. What is the expected value of this game?” As it happens, this is difficult for the students to work through. A whole class discussion, punctuated by individual work, helps resolve this.
Students discussed what they should do and quickly suggested that everything ought to be multiplied by 1/2 to account for the coin flip. What made up “everything” was discussed next and it did not take long to narrow that down to the numbers 1 to 12, inclusive, which are the outcomes of the random process. Next, we needed the probabilities. I prompted the students to calculate those. Slowly, the first trickled in: 1/2 × 1/6. “How did you get that?” “Well, I’d first have to flip a heads and then roll a 1. That’s the only possibility.” Finding the probability of obtaining a 2 proved to be more problematic; a minute or so of silence went by which was interrupted by a correct answer: 1/2 × 1/6 + 1/2 × 1/36. Students discuss how this could been seen by drawing a 6 × 6 chart of the possible outcomes of a roll of two dice and use this to find the required probability: 1/36 for rolling a 2 on 2 dice. The third probability followed shortly after, and the fourth and fifth and sixth appeared in rapid suc-cession. The students found a pattern and were exploiting that. “What about the probability of a 7 appearing?” An answer appears in the chat window: 1/2 × 1/6 + 1/2 × 6/36. This is followed by a flurry of agreement and disagreement. “Who is correct? Try something for me: try verbalizing what needs to take place. Sometimes when we’re getting good at some-thing, we go faster and faster and think less and less about it. Verbalizing will help slow you down and focus on what you’re doing.” A consensus slowly emerges: 1/2 × 6/36. “Now how about the probability of observing an 8?” An answer instantly appears: 1/2 × 7/36. I write it on the screen; “How did she get that?” A perturbed response: “She was following the pattern, but the pattern isn’t like that! It goes down now to 5/36. We have to go back to our chart!”.
Once we have all the components for the expected value calculation, the students set off on calculating. It is a lengthy expression and I tell them that there is no way I’m doing all those additions of fractions and finding common denominators. I despise cal-culation, and I despise even more that so many people view mathematics as calculation and that proficiency in mathematics is equated with quick, accurate calculation. I tell them to find an easier way. One student suggests we take out a common ½ term. We do, and notice that some distribution and rewriting allows us to separate those numbers with a 1/6
153Teaching math in real time
1 3
multiplicand from those with fractions of 36. Separating like this reveals a calculation we performed at the start of class: the expected value of rolling 1 die. What must the other expression be? The expected value of 2 dice! Now, without calculating this, what should it be? Try to anticipate the answer. A pause, only brief, and an answer in the chat: 7, since that’s where the distribution balances. Excellent, so now our expression is 1/2 × (3.5 + 7). That’s a calculation I don’t mind doing.
I end the session and pause to reflect on our exchange. The problem had nothing to do with the pandemic, nor was it particularly realistic; I felt as though I betrayed my students, and you, my reader, by spending so much time on this problem. But now I realize that it has all the aspects of calculation that I want the students to master: recognizing and lever-aging patterns, rewriting expressions through commutativity and distributitivity, flexibil-ity in procedural knowledge, drawing on multiple representations, and anticipation of the results of actions. The initial question was not phrased in a particularly rich or real form, but nevertheless afforded the opportunity of deep mathematical investigation and engage-ment. I almost did not introduce this task, as it was an aside in service of the broader narra-tive. In my commitment to my new curriculum, to highlighting the latent social injustice of my adopted country laid bare by the pandemic, and to making the mathematics authentic, again in the sense of Niss (1987), I almost skipped right past authentic mathematical activ-ity, in the sense of exploring the structure of mathematics. I often tell my students that math must be done with eyes open, meaning they need to be aware of the actions they are taking and why they are taking them; likewise, I cannot forget to teach with my eyes open.
13 Monday, 27 April
Today we focus on correlations. Planning for this class was difficult. I found myself ques-tion my intentions and how I was planning to enact them: if I have students work some simple linear regression problems, and I point them to where correlation is appearing in the pandemic discourse, are they any better able to engage with the information than they were before? Put another way, are my intentions constructively aligned (Biggs & Tang, 2011) with how I enact them?
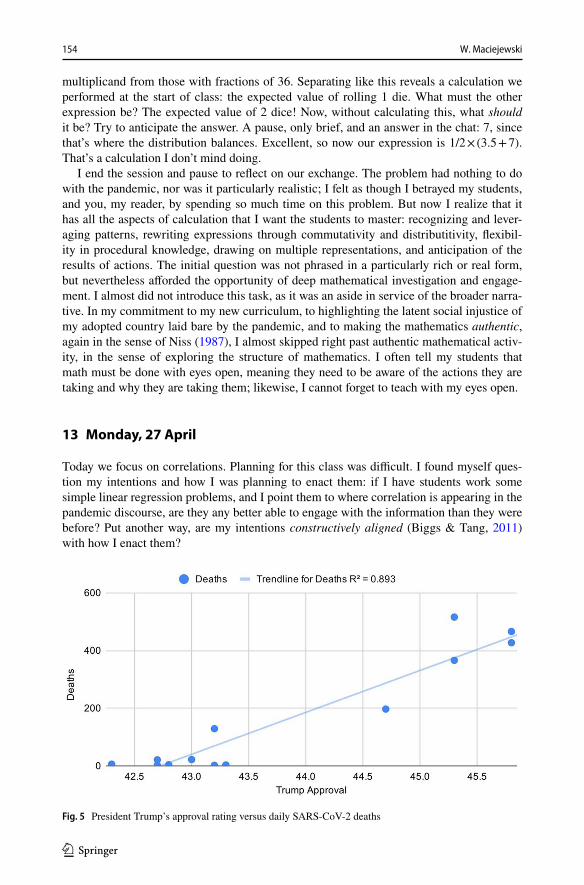
Fig. 5 President Trump’s approval rating versus daily SARS-CoV-2 deaths
154 W. Maciejewski
1 3
I choose the middle ground of standard correlation examples with an opportunity for student participation. We consider time spent studying and grade point average with data I manufactured, and the correlation between height and weight, using data reported by the class of their own height and weight, inputted by the students into a Google Sheet. A sim-ple couple of clicks and we have a line of best fit and a coefficient of determination. We have very little time for this all, and as much as I know it would be good for the students to dwell on some experiences with correlations, we discuss some examples briefly and turn to a common curriculum topic of correlation and causality. The standard examples of cor-relation without an underlying causal relationship are mostly inert and not really rousing interest—the correlated decline in sales for the Studebaker car and rutabagas, for instance, which both happened to fall out of favor simultaneously. So, I draw data from Donald Trump’s presidential approval rating for March (Silver, 2020) along with the daily death count for the same time period (US Historical Data, 2020). I plot these, as in Fig. 5, and a clear linear trend emerges (R2 = 0.89). Did an increase in deaths make Donald Trump a more popular president?
14 Wednesday, 29 April
For the second class this week, I focus on statistics. I lead with the question, “How do we know when things are (likely) true?,” and present the example of the sudden and brief pop-ularity of hydroxychloroquine in the USA as a potential cure for COVID-19. The recom-mendation to use this drug to treat COVID-19 did not come out of nowhere, as at least two studies had demonstrated its effectiveness in treating the disease (Chen et al., 2020; Gautret et al., 2020). However, at least one subsequent study (Magagnoli et al., 2020) found no effect of the drug on the severity of COVID-19 and an increased mortality rate, which led the authors to write, “[t]hese findings highlight the importance of awaiting the results of ongoing prospective, randomized, controlled studies before widespread adoption of these drugs” (pg. 1). What I hoped to highlight to my students with these contrasting studies is that deciding whether some treatment is effective or not is not always a straightforward task. We need a profound knowledge of statistics, and of mathematics more generally, to build confidence in our conclusions. Moreover, medical professionals, in whom we often place a good deal of trust, are not always sufficiently statistically literate to produce reliable results (Ioannidis, 2005).
I segue into statistical testing by sketching a caricature of the general approach: (i) assume outcomes behave in some way, (ii) go gather some data; (iii) see if the data behaves in the way you thought it should; and (iv) if the probability of observing what you did is small (by your standards!), then it is likely not what you expected, therefore (v) either your expectations are incorrect, or the data come from a process that do not follow those expectations. We illustrate this via two toy examples. First: “You flip a coin 5 times and get 3 heads and 2 tails. Is this coin biased?” The probability of observing this is 10/32 and the students conclude that the coin is likely not biased. Second: “You flip a coin 5 times and get 5 heads. Is this coin biased?” The probability of observing this is 1/32 and the students conclude that the coin is likely biased. I find that this task, as simple as it is, affords a seam-less entry point into statistical thinking.
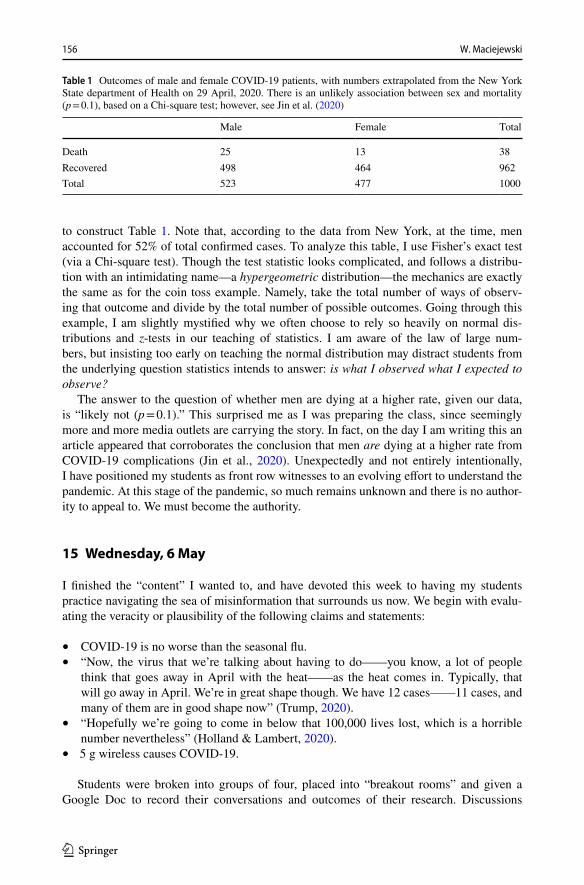
We extend this to examine the claim that men die of COVID-19 at a higher rate than women. To do this, we suppose we have a sample of 1000 of people who have tested posi-tive for SARS-CoV-2 and use the outcome data from the New York Department of Health
155Teaching math in real time
1 3
to construct Table 1. Note that, according to the data from New York, at the time, men accounted for 52% of total confirmed cases. To analyze this table, I use Fisher’s exact test (via a Chi-square test). Though the test statistic looks complicated, and follows a distribu-tion with an intimidating name—a hypergeometric distribution—the mechanics are exactly the same as for the coin toss example. Namely, take the total number of ways of observ-ing that outcome and divide by the total number of possible outcomes. Going through this example, I am slightly mystified why we often choose to rely so heavily on normal dis-tributions and z-tests in our teaching of statistics. I am aware of the law of large num-bers, but insisting too early on teaching the normal distribution may distract students from the underlying question statistics intends to answer: is what I observed what I expected to observe?
The answer to the question of whether men are dying at a higher rate, given our data, is “likely not (p = 0.1).” This surprised me as I was preparing the class, since seemingly more and more media outlets are carrying the story. In fact, on the day I am writing this an article appeared that corroborates the conclusion that men are dying at a higher rate from COVID-19 complications (Jin et al., 2020). Unexpectedly and not entirely intentionally, I have positioned my students as front row witnesses to an evolving effort to understand the pandemic. At this stage of the pandemic, so much remains unknown and there is no author-ity to appeal to. We must become the authority.
15 Wednesday, 6 May
I finished the “content” I wanted to, and have devoted this week to having my students practice navigating the sea of misinformation that surrounds us now. We begin with evalu-ating the veracity or plausibility of the following claims and statements:
• COVID-19 is no worse than the seasonal flu.• “Now, the virus that we’re talking about having to do―you know, a lot of people
think that goes away in April with the heat―as the heat comes in. Typically, that will go away in April. We’re in great shape though. We have 12 cases―11 cases, and many of them are in good shape now” (Trump, 2020).
• “Hopefully we’re going to come in below that 100,000 lives lost, which is a horrible number nevertheless” (Holland & Lambert, 2020).
• 5 g wireless causes COVID-19.
Students were broken into groups of four, placed into “breakout rooms” and given a Google Doc to record their conversations and outcomes of their research. Discussions
Table 1 Outcomes of male and female COVID-19 patients, with numbers extrapolated from the New York State department of Health on 29 April, 2020. There is an unlikely association between sex and mortality (p = 0.1), based on a Chi-square test; however, see Jin et al. (2020)
Male Female Total
Death 25 13 38Recovered 498 464 962Total 523 477 1000
156 W. Maciejewski
1 3
were rich, with students drawing on a variety of internet sources and the mathematics we encountered in class.
The second activity was devoted to creating misinformation. Again, the students were broken into groups of 4 and were tasked to “…produce a message (i.e., tweet/newspaper headling/etc.) that is incorrect or misleading in some way, but is also very believable.” The groups came up with the following:
• “People with underlying health problems are the only ones to suffer from the virus.”• “Did you know that smoking weed could help your lungs in the fight with COVID-19
respiratory issues?”• “If you conceive a child during quarantine, they will be 30% more likely to be born
with COVID-19.”
Students produced seemingly strong justifications for each, but all resting on common errors of misrepresentations. For the first claim, students manipulated the vertical axis on a bar graph used in the media so that death rates for infected people under the age of 44 were indistinguishable from 0%. They then used known correlations between age and underlying medical conditions to jump to their conclusion. As a further example, students with the sec-ond claim above used a study—albeit, appearing in a highly specialized journal—reporting the increased white blood cell count (WBC) for heavy marijuana users (Alshaarawy, 2019) to argue that the increased WBC better enables a marijuana user to manage a coronavirus infection, and by extension, symptoms of COVID-19. The logic is faulty and misleading and I am gleaming over these solutions: my students are getting it. They are seeing how mathematics can be used, for good or for ill, in the world around them.
Our Zoom session ends and I slump into my chair and remain there for an unquantifia-ble amount of time. These last few weeks were effortful and I am suddenly cognizant of my depleted energy stores, as though I had just completed a marathon. Some might call this teaching ambitious (Lampert et al., 2010), but that does not quite describe how I felt dur-ing the course or how I feel about it now. My teaching of this course was authentic in that I came across a real situation (teaching the mathematics of the pandemic) that I was emo-tionally invested in enough in order to question it (does a standard, traditional mathematics curriculum prepare our students to navigate their lived experiences?) and resolve the ques-tion (via the curriculum I enacted). That endeavor has deepened my understanding of my own educational practice and I hope it will go on to contribute to broader understandings of mathematics education. Not that my solution was perfect, I’m certain some cutting here and some tightening there will make it better, but it was an attempt. My own attempt, too, which will differ from others’. My teaching was authentic in that I modeled with it what I want my students to do in their mathematical activity: encounter a situation you care about, question it, resolve your questions, and learn from the encounter.
16 Looking back—Sunday, 20 September, 2020
Six months have passed since I began this reflection. The USA has passed 6.5 million cases and 200,000 deaths; numbers more than 1600 and 2700 times, respectively, what they were when I began writing. Classes are still online, and students are learning the same curricula that were in the courses a year ago. In many regards, everything has changed, and in others, nothing.
157Teaching math in real time
1 3
Mathematics education is not immune to time. We do not have the luxuries of work-ing within a purely scientific field, uncovering the laws of nature, seemingly static against our brief lifespans. Rather, mathematics education needs to be far more reflexive, perhaps even doing away with the glacial aspects of academia. The world of mathematics education unfolds around and within and between us, in real time.
References
Alshaarawy, O. (2019). Total and differential white blood cell count in cannabis users: Results from the cross-sectional National Health and Nutrition Examination Survey, 2005–2016. Journal of Cannabis Research, 2(1), 1.
Bavelas, A. (1950). Communication patterns in task-oriented groups. The Journal of the Acoustical Society of America, 22(6), 725–730.
Biggs, J., & Tang, C. (2011). Teaching for quality learning at university. McGraw-Hill Education (UK).Billstein, R., Libeskind, S., Lott, J., & Boschmans, B. (2019). A problem solving approach to mathematics
for elementary school teachers (13th ed.). Pearson.Bonacich, P. (1987). Power and centrality: A family of measures. American Journal of Sociology, 92(5),
1170–1182.Bourg, A., & Jacoby, J. (Producers), & Jacoby, J. (Director). (2018). The Facebook dilemma. Retrieved from
https:// www. pbs. org/ video/ the- faceb ook- dilem ma- part- one- s43cuc/.Business Insider. (2016). This 60-second animation shows how divided Congress has become over the last
60 years [video]. YouTube. https:// www. youtu be. com/ watch?v= tEczk hfLwqM.Chen, Z., Hu, J., Zhang, Z., Jiang, S., Han, S., Yan, D., ... & Zhang, Z. (2020). Efficacy of hydroxychloro-
quine in patients with COVID-19: Results of a randomized clinical trial. MedRxiv.Danon, L., Ford, A. P., House, T., Jewell, C. P., Keeling, M. J., Roberts, G. O., ... & Vernon, M. C. (2011).
Networks and the epidemiology of infectious disease. Interdisciplinary perspectives on infectious dis-eases, 2011.
Feld, S. L. (1991). Why your friends have more friends than you do. American Journal of Sociology, 96(6), 1464–1477.
Freire, P. (1970). Pedagogy of the oppressed (MB Ramos, Trans.). Continuum, 2007.Freudenthal, H. (1968). Why to teach mathematics so as to be useful. Educational studies in mathematics,
3–8.Garfield, J., & Ahlgren, A. (1988). Difficulties in learning basic concepts in probability and statistics: Impli-
cations for research. Journal for research in Mathematics Education, 44–63.Gautret, P., Lagier, J. C., Parola, P., Meddeb, L., Mailhe, M., Doudier, B., ... & Honoré, S. (2020). Hydroxy-
chloroquine and azithromycin as a treatment of COVID-19: Results of an open-label non-randomized clinical trial. International journal of antimicrobial agents, 105949.
Gilley, B. H., & Clarkston, B. (2014). Collaborative testing: Evidence of learning in a controlled in-class study of undergraduate students. Journal of College Science Teaching, 43(3), 83–91.
Holland, S. & Lambert, L. (2020). Trump now says he hopes U.S. deaths from coronavirus are under 100,000. Reuters. Retrieved from https:// www. reute rs. com/ artic le/ health- coron avirus- usa- trump/ trump- now- says- he- hopes- us- deaths- from- coron avirus- are- under- 100000- idUSW 1N2BU 01T.
Ioannidis, J. P. (2005). Why most published research findings are false. PLoS Medicine, 2(8), e124.Jin, J. M., Bai, P., He, W., Wu, F., Liu, X. F., Han, D. M., ... & Yang, J. K. (2020). Gender differences in
patients with COVID-19: Focus on severity and mortality. Frontiers in Public Health, 8, 152.Kaiser, G., & Schwarz, B. (2010). Authentic modelling problems in mathematics education—examples and
experiences. Journal Für Mathematik-Didaktik, 31(1), 51–76.Lampert, M., Beasley, H., Ghousseini, H., Kazemi, E., & Franke, M. (2010). Using designed instructional
activities to enable novices to manage ambitious mathematics teaching. In Instructional explanations in the disciplines (pp. 129–141). Springer.
Lesh, R., Hoover, M., Hole, B., Kelly, A., and Post, T. (2000). Principles for developing thought-revealing activities for students and teachers. In Research design in mathematics and science education (pp. 591–646). Lawrence Erlbaum Associates.
Leung, F. S., Radzimski, V., & Doolittle, E. (2020). Reimagining authentic mathematical tasks for non-STEM majors. Canadian Journal of Science, Mathematics and Technology Education, 1–13.
Maciejewski, W. (2019) Let your students cheat on exams. PRIMUS.
158 W. Maciejewski
1 3
Maciejewski, W., & Merchant, S. (2016). Mathematical tasks, study approaches, and course grades in undergraduate mathematics: A year-by-year analysis. International Journal of Mathematical Educa-tion in Science and Technology, 47(3), 373–387.
Magagnoli, J., Narendran, S., Pereira, F., Cummings, T., Hardin, J. W., Sutton, S. S., & Ambati, J. (2020). Outcomes of hydroxychloroquine usage in United States veterans hospitalized with Covid-19. MedRxiv.
Niss, M. (1987). Applications and modelling in the mathematics curriculum—state and trends. Interna-tional Journal of Mathematical Education in Science and Technology, 18(4), 487–505.
Otto, S. P., & Day, T. (2011). A biologist’s guide to mathematical modeling in ecology and evolution. Princeton University Press.
Russell, B. (1919). The study of mathematics. Mysticism and Logic and Other Essays.Silver, N. (2020). How popular is Donald Trump? Retrieved from https:// proje cts. fivet hirty eight. com/
trump- appro val- ratin gs/.Tallman, M. A., Carlson, M. P., Bressoud, D. M., & Pearson, M. (2016). A characterization of calculus
I final exams in US colleges and universities. International Journal of Research in Undergraduate Mathematics Education, 2(1), 105–133.
Trump, D. (2020). Remarks by President Trump at the White House business session with our nation’s Gov-ernors. Retrieved from https:// www. white house. gov/ briefi ngs- state ments/ remar ks- presi dent- trump- white- house- busin ess- sessi on- natio ns- gover nors/.
Tucker, A. (2013). The history of the undergraduate program in mathematics in the United States. The American Mathematical Monthly, 120(8), 689–705.
US Historical Data. (2020). Retrieved from https:// covid track ing. com/ data/ us- daily/.Wagner, D. (2012). Opening mathematics texts: Resisting the seduction. Educational Studies in Mathemat-
ics, 80(1–2), 153–169.Yackel, E., & Cobb, P. (1996). Sociomathematical norms, argumentation, and autonomy in mathematics.
Journal for Research in Mathematics Education, 27(4), 458–477.
Publisher’s note Springer Nature remains neutral with regard to jurisdictional claims in published maps and institutional affiliations.
159Teaching math in real time