Embed Size (px)
Citation preview
O’Dwyer et al. Large-scale Assessments in Education (2015) 3:1 DOI 10.1186/s40536-014-0011-6
RESEARCH Open Access
Teaching for conceptual understanding: Across-national comparison of the relationshipbetween teachers’ instructional practices andstudent achievement in mathematicsLaura M O’Dwyer1*, Yang Wang2 and Katherine A Shields3
* Correspondence:[email protected] of EducationalResearch, Measurement andEvaluation, Lynch School ofEducation, Boston College, ChestnutHill, Massachusetts, USAFull list of author information isavailable at the end of the article
©Am
Abstract
Background: Educators, researchers and policy-makers worldwide continue tostruggle to understand the changes needed for improving educational outcomesand attainment for students, particularly in content areas such as mathematics andscience that are essential for developing a highly skilled workforce. Given thecontinuing emphasis on linking teacher practices with student outcomes, this studyaims to explore teachers’ use of particular instructional strategies and whether use isassociated with student achievement.
Methods: Using data from the Trends in International Mathematics and ScienceStudy (TIMSS) 2007, this study examines eighth grade teachers’ use of instructionalpractices that support students’ conceptual understanding, and examines therelationship between those practices and mathematics test scores. Data from fourcountries was examined: U.S., Korea, Japan, and Singapore. Descriptive statistics and aseries of multilevel regression models were used.
Results: The results show that teachers in the U.S. were most similar to Koreanteachers in the frequency and types of teaching practices reported, and that theyreported using some practices at least as frequently, or more frequently thanteachers in the other countries. A sub-set of teachers’ instructional practices arerelated to mathematics achievement in the U.S. and Singapore, but not in Korea orJapan.
Conclusions: Teacher practices explained very little of the variability in test scores,even in cases where particular instructional practices were positively and significantlyrelated to achievement. This research highlights the challenges for examining theteacher-level correlates of student test scores using data from cross-sectional,international studies that do not include measures of students’ prior achievement,classroom observations, or estimates of students’ out-of-school instruction.
Keywords: Mathematics achievement; Teachers and teaching; Instructional practices;TIMSS
2015 ODwyer et al.; licensee Springer. This is an Open Access article distributed under the terms of the Creative Commonsttribution License (http://creativecommons.org/licenses/by/2.0), which permits unrestricted use, distribution, and reproduction in anyedium, provided the original work is properly credited.
O’Dwyer et al. Large-scale Assessments in Education (2015) 3:1 Page 2 of 30
BackgroundResearchers and policymakers worldwide have an ongoing interest in understanding
the ways in which teachers contribute to students’ learning and academic achievement.
In the U.S. for example, prompted by the most recent federal investments in education,
the Race to the Top program authorized under sections 14005 and 14006 of the Ameri-
can Recovery and Reinvestment Act of 2009 (ARRA), which places specific emphasis
on improving teacher quality, researchers, policy-makers and practitioners are increas-
ingly interested in the interplay between teacher quality and student achievement.
However, as with many constructs in education, teacher quality is a multidimensional
construct that includes not only teacher qualifications, but also teachers’ pedagogical
content knowledge, their professional development activities, their instructional prac-
tices and quality, as well as their attitudes toward students and teaching (Darling-
Hammond and Youngs, 2002; Goe, 2007). While several studies have linked overall
measures of the quality of instructional practice (such as standardized teacher evalu-
ation ratings) to student test scores (Borman and Kimball, 2005; Heneman et al.,
2006; Holtzapple, 2003; Kimball et al., 2004; Milanowski, 2004), other studies have
found no such connections (e.g., Gallagher, 2004; Rowan et al., 1997; D’Agostino, 2000).
Overall, there appears to be little consensus on the specific instructional strategies
that are consistently associated with student achievement.
The purpose of this research is to describe patterns in teachers’ instructional prac-
tices in eighth-grade mathematics classrooms in four countries that participated in the
Trends in International Mathematics and Science Study (TIMSS) 2007 (the U.S., Korea,
Japan, and Singapore), and to examine the relationship between teachers’
instructional practices and students’ achievement in mathematics. This research
also highlights the challenges for using data from international cross-sectional
comparative studies to link student outcomes with teachers’ instructional practices.
Instructional practices and student achievement
Demonstrating relationships between specific teaching practices and student achievement
has proven difficult. From a methodological perspective, cross-sectional educational
research designs do not allow us to know whether a teacher is using a particular strategy
because that teacher has high-achieving students, or whether that strategy is producing
high-achieving students. Likewise, cross-sectional studies that lack information
about students’ prior achievement make it difficult to disentangle a single teacher’s
contribution to students’ achievement.
Beyond these challenges, Hiebert and Grouws (2007) attribute the lack of consensus
on the relationship between instructional strategies and student achievement to an
absence of well-developed theories describing how teaching practices affect learning; to
the varying effectiveness of a given teaching approach that depends on the learning
goals; and to the mediating effects of student and contextual variables. However,
evidence has accumulated for the effectiveness of some teaching practices. For example,
Hill et al. (2005) found that teachers’ pedagogical content knowledge, the specialized
mathematical knowledge and skills used in teaching mathematics, were positively associated
with gains in students’mathematical achievement over time.
Likewise, Hattie’s (2009) exhaustive synthesis of meta-analyses of research on student
achievement identifies a number of teaching strategies with moderate-to-large effect
O’Dwyer et al. Large-scale Assessments in Education (2015) 3:1 Page 3 of 30
sizes across multiple studies. These strategies include “problem-solving teaching,”
which is defined as a set of methods that help students to define the problem, then
assess and select among possible solutions. In alignment with Hattie’s findings,
Camburn and Han (2011) found support for a significant effect for problem-solving and
related instructional strategies in a review of evidence from the past twenty years of
student achievement studies based on large-scale assessments. The associated student
activities included “solving novel problems, engaging in reasoning and analysis, and
making connections to real world applications of knowledge” (p. 593). These practices
can be understood within the framework of conceptual and procedural mathematics
knowledge (Hiebert and Lefevre, 1987; Hiebert, 2003).
Conceptual knowledge is the understanding of core principles and the relationships
among them (Hiebert and Lefevre, 1987; diSessa and Sherin, 1998; Star, 2005). Hiebert
and Grouws (2007) outline two key aspects of instructional practices that help students
develop conceptual understanding: giving students the opportunity to “struggle” with
problems (p. 387), and discussing conceptual relationships “explicitly” (p. 383). These
approaches help students develop the ability to transfer their skills and knowledge to
new contexts. Prawat (1989a), whose work was a resource for the TIMSS conceptual
framework underlying the teacher and classroom context surveys, connects conceptual
knowledge development with teacher practices that attend to students’ explanations
and problem-solving strategies. By contrast, procedural knowledge is limited to recognizing
the mathematical system of symbols and rules, and carrying out procedures using that
system (Star, 2005). Conceptual knowledge allows the student to select and apply the right
procedure for the situation, and to incorporate new information correctly into what he or
she already knows (Prawat, 1989b). In the U.S., the National Council of Teachers of
Mathematics (NCTM) (2000) recognizes the importance of conceptual understanding,
calling for students to learn “with understanding, actively building new knowledge from
experience and previous knowledge” and “reflecting on their thinking” (p. 2).
Teaching practices that help students to develop conceptual knowledge have been
linked to achievement in the literature. These practices include: giving students challenging
assignments (Newmann et al., 2001; Schacter and Thum, 2004); providing opportunities
to apply learning and solve unique problems (Wenglinsky, 2002); spending time on
conceptual activities such as estimation, writing equations, and word problems
(Lubienski, 2006); and having students discuss the reasons behind their answers to
questions (Gales and Yan, 2001). The research companion to the NCTM Standards
(Mewborn, 2003) also cites studies that link higher achievement to providing students
with opportunities to solve problems and talk with each other about their approaches
(Fennema, et al., 1996), as well as helping students see the associations between concepts
and mathematical symbols (Gearhart et al., 1999).
Evidence from international comparative studies
With the almost 20 years of available data from international comparative studies in
education such as the TIMSS, the Progress in International Reading Literacy Study
(PIRLS), and the Programme for International Student Assessment (PISA), secondary
analyses have been conducted in individual counties that examined the relationship
between teachers’ instructional practices and student achievement. For example,
using TIMSS 1995 eighth grade data in the U.S., Tomoff et al. (2000) compared

O’Dwyer et al. Large-scale Assessments in Education (2015) 3:1 Page 4 of 30
the NCTM-recommended practices to those reported by the sample of TIMSS
mathematics teachers and found that the use of drill and review exercises was sig-
nificantly negatively associated with mathematics achievement. Their study also
showed that more interactive, conceptual activities such as group and project-based work
showed no relationship. In Japan, House (2009) found that higher-achieving fourth
grade students in the 2007 TIMSS sample reported being asked more frequently to
work on problems independently and to explain their answers, although procedural
skills such as memorization of procedures and practicing computation were also
positively related to achievement in this younger population.
A small number of researchers have used data from international comparative studies
to describe the differences in teachers’ instructional practices across countries, and
to examine the relationship between instructional practices and achievement. For
example, as part of a multi-country study using 1999 TIMSS eighth grade data,
Desimone et al. (2005) analyzed whether teachers’ use of conceptual versus computational
instructional strategies was predictive of classroom-level mathematics achievement. The
authors found weak relationships within countries, and no meaningful variation in the
strength of this relationship across countries. In country-specific analyses, they found a
weak positive association between conceptual instruction and achievement in the U.S.,
but no such relationship in Singapore or Japan.
Evidence on instructional practice in the U.S. and East Asia
In the U.S., researchers, policy-makers, practitioners, and even the general public are
keenly aware that multiple international studies have shown that our students consistently
lag behind students in some countries, particularly students in East Asian countries. For
example, on the 2007 TIMSS and PISA assessments, U.S. middle school students
performed below the OECD mean in mathematics, and lagged behind the East
Asian countries; Singapore, Korea and Japan ranked among the top five countries
in TIMSS and the top 10 in PISA, compared to the U.S. at 9th in TIMSS and 31st
in PISA (Mullis et al., 2008; OECD, 2010). Moreover, evidence shows that only 6%
of U.S. students scored in the advanced category of TIMSS, compared to 40% of
students in Korea and Singapore, and 26% in Japan (Mullis et al., 2008).
Studies that have explored explanations for what distinguishes East Asian nations
from lower performing countries, including the U.S., reported various differences
including stronger teacher preparation (Heck, 2007; Kim et al., 2011) and a uniform,
coherent national curriculum (Schmidt et al., 2005). Some strands of research also
explore the cultural roots of these differences, such as a predominant focus on
the collective, a greater emphasis on hard work and practice, and the role of the
teacher as content expert in the Eastern tradition, compared to a focus on the individual
and child-centered pedagogy in the Western tradition (Kaiser and Blömeke, 2013). Other
researchers point to the amount of time spent both in and outside of school on
mathematics instruction as an important distinguishing characteristic (Lewis and
Seidman, 1994, Bray, 2003; Bray and Kwo, 2013). In particular, valid comparisons across
education systems may be hampered by the existence of for-profit, supplementary
“shadow education” systems that operate in parallel to those sampled in international
comparative studies. Despite their strong education systems, cram schools, referred to as
juku in Japan and hagwons in Korea, are ubiquitous in many East Asian countries

O’Dwyer et al. Large-scale Assessments in Education (2015) 3:1 Page 5 of 30
(Bray and Kwo, 2013). In Singapore for example, the number of juku almost tripled
between 1994 and 2002 (Bray, 2003) and in 2008 in Korea, more than 70% of
middle school students received extensive tutoring outside of the country’s formal
education system sampled and assessed by international comparative studies
(Bray and Kwo, 2013).
Related to instructional practice differences, classroom observational studies suggest
that teachers in higher-performing countries tend to use strategies that support
conceptual knowledge development more frequently than their peers in the U.S.,
where teachers spend more time nurturing basic procedural skills at the expense of
critical thinking and understanding of underlying concepts (Prawat, 1989a). This
finding is supported by the 1999 TIMSS video study, which collected classroom
observations from randomly selected classrooms in six high-performing countries and the
U.S., and reported that teachers in U.S. classrooms spent more time completing repetitive
exercises rather than applying and extending skills to new, different problems; reviewed
previously taught procedures and material more frequently; covered less advanced
content; covered a scattered mix of skills and concepts rather than a single coherent topic;
and suffered more interruptions to the lesson (Hiebert et al., 2005). Researchers have also
found that teachers in Japan (Whitman and Lai, 1990) and Singapore (VanTassel-Baska
et al., 2008) focused more on critical thinking and lesson structure, when compared to
U.S. teachers who focused more on discipline and rules. Japanese teachers also reported a
more unified view of what constitutes “good” mathematics instruction than their
American counterparts (Jacobs and Morita, 2002).
Research purpose
Recognizing the limitations of international cross-sectional studies of educational
outcomes that use self-report instructional practices, the present study seeks to extend the
field’s understanding of the relationship between teaching for conceptual understanding
and mathematics achievement using TIMSS 2007 data. The objective of this research is to
describe patterns in teaching for conceptual understanding in eighth-grade mathematics
classrooms in the U.S. and three East Asian countries, Korea, Japan, and Singapore, and to
examine how teaching for conceptual understanding in mathematics classrooms is
associated with students’ achievement in mathematics. Korea, Japan, and Singapore
were selected as comparisons to the U.S. because, over repeated international studies, they
have out-performed the U.S. For example, while the mean mathematics scores for the U.S.,
Korea, Japan, and Singapore were each above the TIMSS international mean (i.e., 500)
across the 49 participating countries/jurisdictions in 2007, the means in 2007 for
Singapore (593), Japan (570), and South Korea (597) were each higher than the mean
in the U.S. (508). Moreover, this pattern of lower mean achievement for the U.S.
compared to these countries was observed in all past TIMSS administrations for
mathematics – TIMSS 1995, 1999, 2003, and most recently in 2011.
Using TIMSS 2007 data from individual students, data from their mathematics
teachers, as well as information about their schools, this research addresses the following
research questions:
1. How does teaching for conceptual understanding in mathematics classrooms vary
across the U.S., Korea, Japan, and Singapore?
O’Dwyer et al. Large-scale Assessments in Education (2015) 3:1 Page 6 of 30
2. Within these four countries, is teaching for conceptual understanding associated
with students’ mathematics achievement? And, do the associations between
teaching for conceptual understanding and students’ mathematics achievement vary
across the U.S., Korea, Japan, and Singapore?
These questions were addressed using teacher data and individual student data, and
analyses were conducted separately by country. Descriptive analyses and ANOVA with
teacher data were used to address the first research question, and a series of two-level
hierarchical linear regression models with student, teacher and school data was used to
address the second research question. In addition to addressing these research questions,
this study highlights the challenges for using data from cross-sectional, international
comparative studies to link student outcomes with teachers’ instructional practices.
MethodsThis section describes the TIMSS 2007 sample, the variables and measures derived
from the TIMSS student, teacher, and school questionnaire data, and the data analyses
used to address the research questions. Explicit descriptions of the model specifications
used to estimate the relationship between teachers’ instructional practices and student
achievement are also provideda.
TIMSS 2007 sample
The final analysis sample for each country was defined after the data files were cleaned
according to specific criteria. First, students with missing cases on the student-level
covariates were removed from the analysis sample (2% or 164 students in the U.S.,
0.03% or 14 students in Korea, 1% or 35 students in Japan, and 0.5% or 21 students in
Singapore). Studies have shown that estimates are not sensitive to the choice of treatment
of missing data at such minimal levels (Little & Rubin, 2002), and so we do not expect the
listwise deletion of these small numbers of cases to introduce bias.
Second, students and classrooms linked with more than one mathematics teacher
were removed from the analysis sample. This step ensured that only students whose
test scores could be linked with one teacher were included in the analyses, a necessary
condition for examining the association between teachers’ instructional practices and
student achievement. Through this process, 216 students were removed in U.S. (3%)
and 58 students in Korea (1%). In Japan, the number of students removed at this step was
large, 1212 (22%), and because in many schools all students were linked with more than
one teacher, 37 schools (of the available 146) were removed from the sample at this stage.
In Singapore, 171 students (4%) in two schools (of the available 164) were removed.
Third, some classrooms were randomly removed from the analysis sample to allow
comparisons across countries. The TIMSS sample is selected using a two-stage
stratified sampling procedure to produce a representative sample of students from
participating countries; schools are randomly sampled at the first stage and intact
classrooms are sampled within each sampled school at the second stage (Joncas, 2008).
The majority of TIMSS countries randomly sampled only one intact classroom in each
school, resulting in classroom effects being confounded with school effects. However,
some countries (e.g., the U.S. and Singapore) routinely sampled more than one classroom
per school. To allow direct comparisons among the four countries included in this study,
O’Dwyer et al. Large-scale Assessments in Education (2015) 3:1 Page 7 of 30
one classroom was randomly selected within each school to be included in the analyses.
This process resulted in the random removal of 192 classrooms in the U.S., 20 in Japan,
and 133 in Singapore. No classrooms were removed from the Korean sample since
all schools sampled only one classroom. As a consequence of including only students
from one mathematics classroom and their mathematics teacher, the classroom and
school levels are confounded. In describing the analyses and the results we refer to
the between school effects, recognizing that they could also be considered between
classroom effects.
Finally, schools fewer than five students were removed from the analysis sample (only
one in Japan and none in the other three countries) and schools with missing teacher
instructional practice data were removed from the analysis samples (23 schools in the
U.S., no schools in Korea, one school in Japan, and two schools in Singapore).
Overall, the analyses were conducted with data from 217 schools and 3255 students
in the U.S., 150 schools and 4102 students in Korea, 107 schools and 2719 students in
Japan, and 160 schools and 2270 students in Singapore. Table 1 shows that mean
achievement and the variability in achievement were similar in the reported
samples (Mullis et al. 2008) and the analysis samples. Moreover, the percentages of
students whose teachers asked them to engage in the six activities in about half
the lessons or more were similar in the reported and analysis samples.
Variables and measures
The research questions were addressed using students’ eighth grade mathematics
achievement, the instructional practices reported by their teachers, as well as informa-
tion about the student body in the sampled schools. The teacher instructional prac-
tice measures were derived from teachers’ responses to the mathematics teacher
survey. In addition, the analyses included student and school covariates derived
from the student and school questionnaires. The student achievement and teacher
practice measures, as well as the student and school covariates are discussed in
turn.
Mathematics achievement
At the eighth grade, the student mathematics assessment comprised four sub-domains,
each contributing to a total mathematics score: Number (30%), Algebra (30%), Geometry
(20%), and Data and Chance (20%) (Mullis et al., 2005). TIMSS uses item response theory
(IRT) in combination with conditioning and multiple imputation to summarize students’
total mathematics and sub-domain achievement on a scale with a mean of 500 and a
standard deviation of 100, and a set of five plausible values are provided to account for
the fact that not all students are administered all test items (Foy et al., 2008).
HLM multilevel regression modeling software was used so that all five plausible
values representing students’ total mathematics achievement were used appropriately in
the analyses.
Teaching for conceptual understanding measures
The teaching for conceptual understanding measures used to address the research questions
were derived from a sub-set of the questions relating to teachers’ self-reported instructional
practices in the mathematics classroom (Mullis et al., 2008). Specifically, six of the available
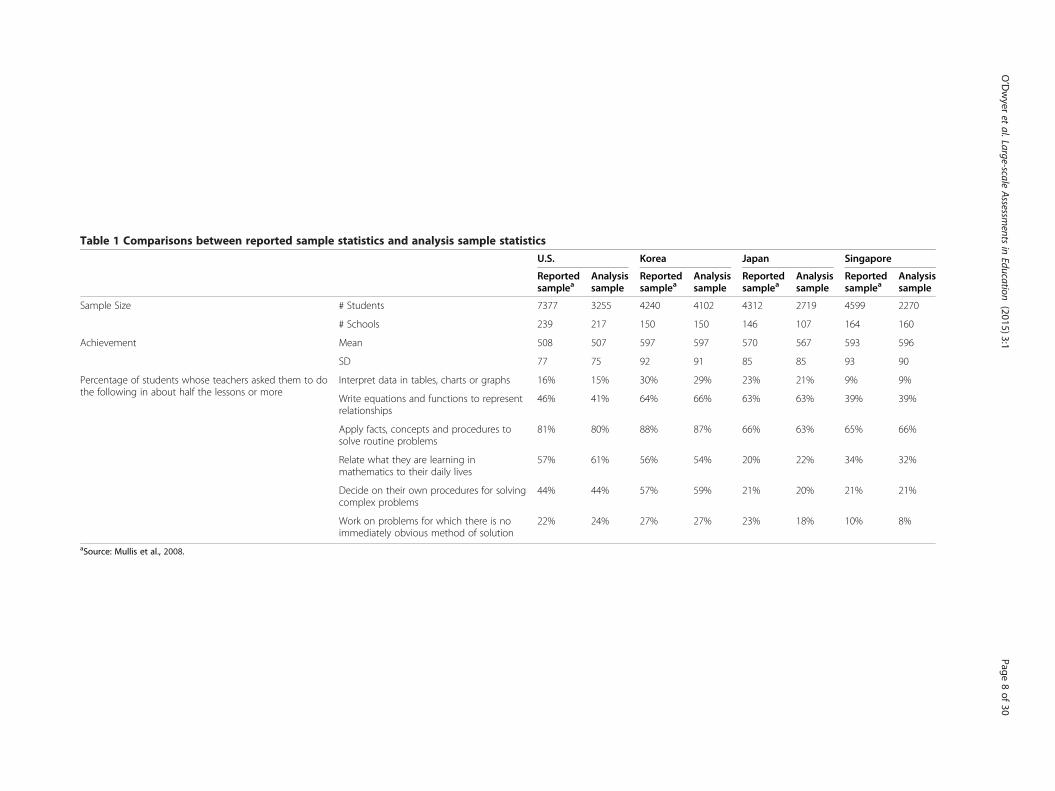
Table 1 Comparisons between reported sample statistics and analysis sample statistics
U.S. Korea Japan Singapore
Reportedsamplea
Analysissample
Reportedsamplea
Analysissample
Reportedsamplea
Analysissample
Reportedsamplea
Analysissample
Sample Size # Students 7377 3255 4240 4102 4312 2719 4599 2270
# Schools 239 217 150 150 146 107 164 160
Achievement Mean 508 507 597 597 570 567 593 596
SD 77 75 92 91 85 85 93 90
Percentage of students whose teachers asked them to dothe following in about half the lessons or more
Interpret data in tables, charts or graphs 16% 15% 30% 29% 23% 21% 9% 9%
Write equations and functions to representrelationships
46% 41% 64% 66% 63% 63% 39% 39%
Apply facts, concepts and procedures tosolve routine problems
81% 80% 88% 87% 66% 63% 65% 66%
Relate what they are learning inmathematics to their daily lives
57% 61% 56% 54% 20% 22% 34% 32%
Decide on their own procedures for solvingcomplex problems
44% 44% 57% 59% 21% 20% 21% 21%
Work on problems for which there is noimmediately obvious method of solution
22% 24% 27% 27% 23% 18% 10% 8%
aSource: Mullis et al., 2008.
O’Dwyer
etal.Large-scale
Assessm
entsin
Education (2015) 3:1
Page8of
30

O’Dwyer et al. Large-scale Assessments in Education (2015) 3:1 Page 9 of 30
items were used to represent teachers’ practices related to teaching for conceptual
understanding. As discussed in the previous section, academic achievement has
been shown to relate to instructional practices that help students develop conceptual
understanding. TIMSS developed the set of teacher practice items in part by drawing on
research on these issues (Schmidt and Cogan, 1996), particularly work by Prawat (1989a;
1989b) on the aspects of teaching that promote conceptual understanding, such as
analyzing how students explain and solve problems, and giving students opportunities to
engage with fundamental concepts. TIMSS developers used three of these six items in the
1999 administration as part of an index of Teachers’ Emphasis on Mathematics Reasoning
and Problem-solving (Mullis et al., 2000).
Measured on a scale ranging from “Every or almost every lesson” (3) to “Never” (0),
the following six items that asked teachers to report how often they asked students to
do the following were used to represent teachers’ practices related to teaching for
conceptual understanding:
… write equations and functions to represent relationships
… interpret data in tables, charts or graphs
… apply facts, concepts and procedures to solve routine problems
… relate what they are learning in mathematics to their daily lives
… decide on their own procedures for solving complex problems
… work on problems for which there is no immediately obvious method of solution
Teachers’ responses to the six individual items were used to represent teachers’
practices related to teaching for conceptual understanding. While the TIMSS instructional
practice items do not map neatly onto the constructs of conceptual versus procedural
knowledge development, the six items used in this study were chosen to represent several
key elements of teaching for conceptual understanding. “Writ[ing] equations and
functions to represent relationships” gives students the opportunity to explicitly
examine conceptual relationships, using the symbolic language of mathematics
(Hiebert, 2003; Prawat, 1989a). When students “relate what they are learning to
their daily lives, ” they must transfer mathematical knowledge to a real-world context and
connect different pieces of information (Hiebert and Lefevre, 1987). To “interpret data in
tables, charts or graphs, ” “apply facts, concepts and procedures to solve routine
problems, ” and “decide on their own procedures for solving complex problems, ”
students must select the appropriate procedure and use it correctly for the given
context (Hiebert and Lefevre, 1987). When students select their own methods of
solution, the teacher also has an opportunity to observe students’ thought processes and
misconceptions (Hiebert and Grouws, 2007; Prawat, 1989a). Taking these problem-
solving skills a step further, when students “work on problems for which there is no
immediately obvious method of solution, ” they grapple with problems in which
they have incomplete information or skills, creating a productive opportunity for
growth (Hiebert and Grouws, 2007). In contrast, TIMSS instructional practice
items representing activities that focus on procedural knowledge development were
not included in this study (e.g., “memorize formulas and procedures” and “practice
adding, subtracting, multiplying and dividing without using a calculator” (Mullis
et al., 2008)).

O’Dwyer et al. Large-scale Assessments in Education (2015) 3:1 Page 10 of 30
The authors explored the creation of a composite variable across all six items since
composites have the advantage of providing a more comprehensive measure of the
construct when compared to a single variable (DeVellis, 2012). However, principal
axis factoring (PAF) indicated that the composite was not unidimensional across
countries. Specifically, the six items split across two or three factors in the four
countries. The frequency with which teachers asked students to “relate what they
are learning in mathematics to their daily lives,” “decide on their own procedures for
solving complex problems” and “work on problems for which there is no immediately
obvious method of solution” loaded on a single factor in all four countries. The reliability
of the three-item scale ranged from 0.6 in Korea and Singapore to 0.7 in the U.S. and
Japan. The remaining three items, the frequency with which teachers asked their students
to “interpret data in tables, charts or graphs,” “write equations and functions to represent
relationships” and “apply facts, concepts and procedures to solve routine problems”
loaded on a single factor in the U.S., Japan, and Singapore, but across two factors in
Korea. The reliability of this scale was lower than optimal, ranging from .4 in the U.S. and
Korea to .5 in Singapore and .7 in Japan. Based on the dimensionality of the items across
countries and their lack of alignment with a theoretical construct, a composite variable
was not created and teachers’ responses to the six items were used individually in the ana-
lyses to represent teachers’ practices related to teaching for conceptual understanding.
Student and school covariates
As student and school characteristics have been found to be associated with academic
achievement, covariates measured at the student and school levels were included in the
analyses. The purpose of the covariates was to account for student-to-student, and
school-to-school differences that were unrelated to teachers’ instructional practices.
The student-level covariates included characteristics that prior research has linked with
achievement: students’ gender (Else-Quest et al., 2010; Liu and Wilson, 2009; Robinson
and Lubienski, 2011), home background (Henderson and Berla, 1994; Berliner, 2006;
Schreiber, 2002; Sirin, 2005; Votruba-Drzal, 2006; Yeung et al., 2002), and attitudes
toward and beliefs about mathematics (Choi and Chang, 2011; Ho et al., 2000; Ma
and Kishor, 1997; Singh et al., 2002). Likewise, the socioeconomic status of the
school has been found to be associated with outcomes for individual students
(Rothstein, 2004; Rumberger and Palardy, 2005).
Students’ gender was included as a covariate (male = 1, female = 0) at the student level
and multiple student-level measures were combined to create a composite variable to
represent students’ home resources and family background. The home background
composite was created from several related questions: home educational resources
Table 2 Reliabilities (α) for composite covariates
U.S. Korea Japan Singapore
α α α α
Home Background Composite 0.65 0.56 0.67 0.62
Positive Affect Toward Mathematics Index (PAT-M)† 0.86 0.89 0.84 0.88
Self-Confidence in Learning Mathematics Index (SCM)† 0.84 0.86 0.78 0.82
Students' Valuing Mathematics Index (SVM)† 0.73 0.74 0.70 0.76†Source: Martin & Preuschoff, 2008.
O’Dwyer et al. Large-scale Assessments in Education (2015) 3:1 Page 11 of 30
(possession of a calculator, study desk, and dictionary), number of books in the home,
and parents’ highest education. The inter-relatedness of the items was confirmed using
PAF and within each country, a standardized factor score with a mean of 0 and a standard
deviation of 1 was created to represent students’ home background. The reliability of the
student home background composite is shown in Table 2 for each country. Also, to
account for school-to-school differences related to the economic resources available in
students’ homes, the student home background composite was aggregated to the school
level and included as a school-level covariate.
In an effort to control for student-to-student differences in attitudes toward and
perceptions about mathematics, perceptions about their own ability in mathematics,
as well differences in motivation to learn, three composite indices provided in the TIMSS
student database were included as covariates in the analyses. The indices measured stu-
dents’ Positive Affect Toward Mathematics (PAT-M), students’ Self-Confidence in Learn-
ing Mathematics (SCM) and Students’ Valuing Mathematics (SVM) and were created by
computing the mean of the student’s scores on the constituent items (Martin and Pre-
uschoff, 2008). The response categories for the items used to create the indices were agree
a lot = 1, agree a little = 2, disagree a little = 3, and disagree a lot = 4. On each index, stu-
dents were classified into low, medium and high based on the mean across the constituent
items. Subsequently, a categorical variable was created in which students with a mean
score of 2 or lower received a classification of high (+1); students with mean scores greater
than 2 but lower than 3 received a classification of medium (0); and students with scores
of 3 or more received a low (−1) classification (Martin and Preuschoff, 2008). Since
the three indices were categorical, two dummy variables were created for each
index in which the high (+1) group was the reference group for all comparisons.
The categorical versions of the indices were used in the models because these
characteristics were included as student-level covariates and were not central to ad-
dressing the research questions. The reliabilities of the three indices across coun-
tries are shown in Table 2.
Analysis procedures
Analyses were conducted separately by country and included teacher-level analyses
(research question 1) and student-level analyses (research question 2). To address the first
research question, descriptive statistics were calculated using teachers’ responses to the six
individual teaching for conceptual understanding items and the results were represented
both graphically and numerically. In addition, one-way ANOVAs with Bonferroni post hoc
tests were conducted to examine whether the frequency of teaching for conceptual
understanding in the U.S. was significantly different from the frequency in the East
Asian countries. The descriptive statistics and ANOVAs allowed comparisons among
countries with respect to mathematics teachers’ use of instructional practices that support
conceptual understanding. In each country, sampling weights were used to make
adjustments for non-response and to ensure that subgroups of the sample were
properly represented in the estimation of population parameters (Joncas, 2008).
Since the descriptive analyses and ANOVAs were based on teacher data, the mathematics
teacher sampling weight (MATWGT) was applied to generate accurate estimates in
each country.

O’Dwyer et al. Large-scale Assessments in Education (2015) 3:1 Page 12 of 30
To address the second research question, a series of multilevel linear regression
models was formulated for each country. HLM software was chosen so that all five
plausible values could be analyzed appropriately and so that the sampling weights could
be applied at the appropriate level. In the series of models, students’ achievement on
the TIMSS mathematics assessment, represented by five plausible values, was regressed
on teachers’ practices related to teaching for conceptual understanding along with the
student and school covariates. Multilevel regression procedures ensured that the statistical
dependence among students within schools was accounted for by the complex residual
structure thereby producing correct estimates of the standard errors associated with the
regression coefficients; allowed student, teacher and school characteristics to be included
in a single model to predict students’ mathematics achievement; and allowed all
five plausible values to be handled simultaneously (Raudenbush and Bryk, 2002). The
multilevel regression analyses required the calculation of student population estimates
within each country and so the authors followed the guidelines set forth in the TIMSS
documentation and applied the student sampling weight (TOTWGT) at the student level.
Since this weight includes the probability of both the school and student being selected
from the population, no weights were required at the school level (Joncas, 2008).
At the first stage, an unconditional (or null) two-level regression model was specified
for each country. This model was used to partition the total variability in mathematics
achievement scores into within- and between-school variance components. These
unconditional variance components were used to estimate the degree of statistical
dependence (nesting) among students within schools for each country, as indicated
by the intra-class correlation coefficient (ICC) and served as a comparison for subsequent
models that included teachers’ instructional practices as well as the student and school
covariates. For each country, the unconditional model used to calculate the ICC was as
follows:
Y ij ¼ β0j þ rij and β0j ¼ γ00 þ u0j
At the second stage, teachers’ practices related to teaching for conceptual understanding
and the student and school covariates were included in the model to predict students’
mathematics scores. The six individual teaching for conceptual understanding items were
added to the models separately, thereby allowing the association between each one and
mathematics scores to be examined independently. In each country, the level-1 model
included the student covariates:
Y ij ¼ β0j þ β1j Genderð Þij þ β2j Home Background Compositeð Þij þ β3j PAT‐M D1ð Þijþ β4j PAT‐MD2ð Þij þ β5j SVM D1ð Þij þ β6j SVM D2ð Þij þ β7j SCM D1ð Þijþ β8j SCM D2ð Þij þ rij
In this model, the mathematics score for student i in school j (Yij) was predicted by
the linear combination of student covariates and a random student effect, rij. The
regression coefficients β1 through β8 represent the association between each covariate and
mathematics achievement, holding all other predictors in the model constant. The level-1
covariates were entered into the model uncentered since they were dichotomous
(i.e., gender), standardized to have a mean of 0 and a standard deviation of 1 (i.e.,
home background composite), or were coded as dichotomous dummy variables (i.e.,
PAT-M, SVM, and SCM).

O’Dwyer et al. Large-scale Assessments in Education (2015) 3:1 Page 13 of 30
At level-2, the aggregated student home background composite was included as a
school covariate along with the teaching for conceptual understanding measures, each
added separately. In each country, six level-2 models were formulated, one for each of
the six teaching for conceptual understanding items, as follows:
β0j ¼ γ00 þ γ01 Aggregated HBIð Þjþ γ02 Teaching for Conceptual Understanding Measureð Þj þ u0j
In each of the six intercept-only models, the γ02 regression coefficient represented
the association between a particular teaching for conceptual understanding measure
and mathematics test scores, holding all covariates in the model constant. The
individual teaching for conceptual understanding measures were entered into the
model uncentered. The percentage of economically disadvantaged students in the school
was grand mean centered around the mean for all schools.
During the model development phase, the significance and reliability of the variability
in the level-1 regression coefficients associated with the student covariates across
schools was evaluated using McCoach’s guidelines (2010). With some exceptions, the
level-1 regression coefficients were found to be constant across schools and so these
regression coefficients were fixed. However, in the U.S. and Japan, the relationships
between mathematics test scores and gender, and between test scores and the SVM
index, were not constant across schools. Also, in Japan, the relationship between
mathematics test scores and the SCM index was not constant across schools. Additional
exploratory analyses revealed that the variability in these relationships across schools was
not related to the level-2 variables included in the analyses, the teaching for conceptual
understanding measures and the percent of economically disadvantaged students in the
school covariate. Therefore, in the final models, the slopes associated with these level-1
variables in the U.S. and Japan were allowed to vary randomly across schools, but no
level-2 predictors were included in the models to predict that variability. In all other
countries and for the other level-1 variables in the U.S. and Japan models, the level-1
slopes were fixed. For the fixed P level-1 slopes, the models were:
βpj ¼ γp0
And, for the random P level-1 slopes (e.g., for the gender and SVM slopes in the U.S.
and Japan, and for the SCM slope in Japan) the models were:
βpj ¼ γp0 þ upj
Comparisons between the fixed effects across models with different varying slopes is
deemed to be appropriate since allowing slopes to vary randomly has little effect on the
fixed effects or the standard errors associated with these fixed effects (Raudenbush and
Bryk, 2002).
For each country, the regression coefficients and variance components from these
models were evaluated to examine whether teaching for conceptual understanding
predicted students’ mathematics achievement within each country, after controlling
for student characteristics, and whether these relationships varied across countries.
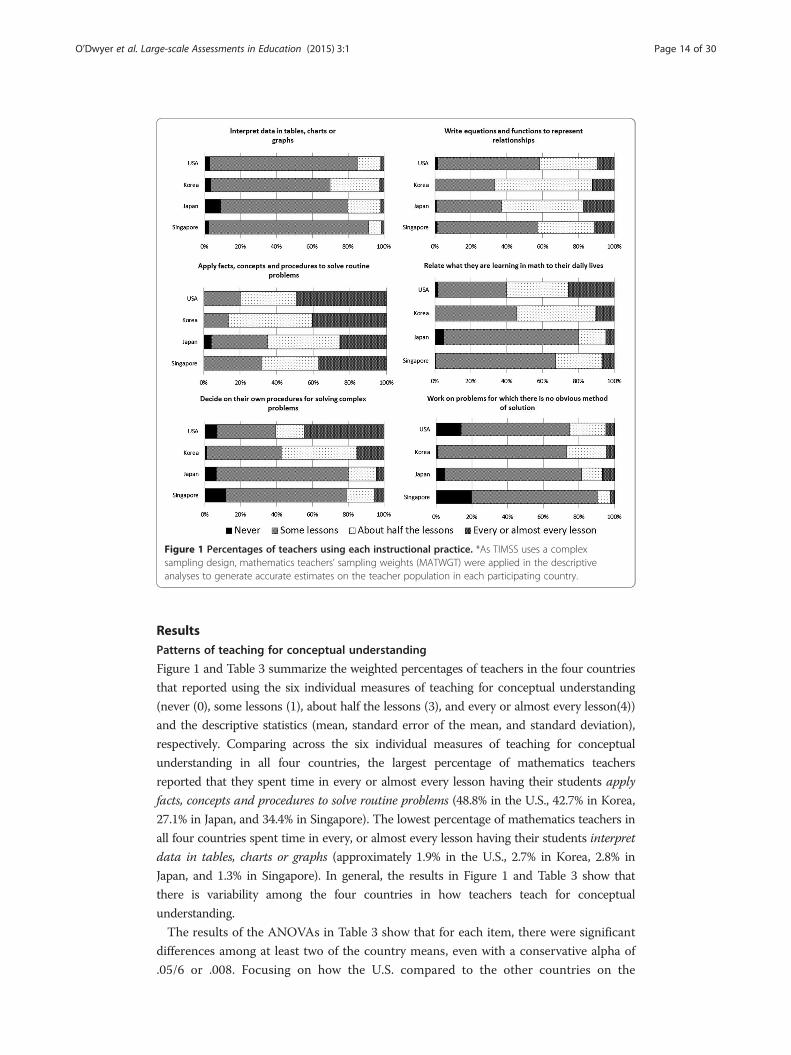
Figure 1 Percentages of teachers using each instructional practice. *As TIMSS uses a complexsampling design, mathematics teachers’ sampling weights (MATWGT) were applied in the descriptiveanalyses to generate accurate estimates on the teacher population in each participating country.
O’Dwyer et al. Large-scale Assessments in Education (2015) 3:1 Page 14 of 30
ResultsPatterns of teaching for conceptual understanding
Figure 1 and Table 3 summarize the weighted percentages of teachers in the four countries
that reported using the six individual measures of teaching for conceptual understanding
(never (0), some lessons (1), about half the lessons (3), and every or almost every lesson(4))
and the descriptive statistics (mean, standard error of the mean, and standard deviation),
respectively. Comparing across the six individual measures of teaching for conceptual
understanding in all four countries, the largest percentage of mathematics teachers
reported that they spent time in every or almost every lesson having their students apply
facts, concepts and procedures to solve routine problems (48.8% in the U.S., 42.7% in Korea,
27.1% in Japan, and 34.4% in Singapore). The lowest percentage of mathematics teachers in
all four countries spent time in every, or almost every lesson having their students interpret
data in tables, charts or graphs (approximately 1.9% in the U.S., 2.7% in Korea, 2.8% in
Japan, and 1.3% in Singapore). In general, the results in Figure 1 and Table 3 show that
there is variability among the four countries in how teachers teach for conceptual
understanding.
The results of the ANOVAs in Table 3 show that for each item, there were significant
differences among at least two of the country means, even with a conservative alpha of
.05/6 or .008. Focusing on how the U.S. compared to the other countries on the
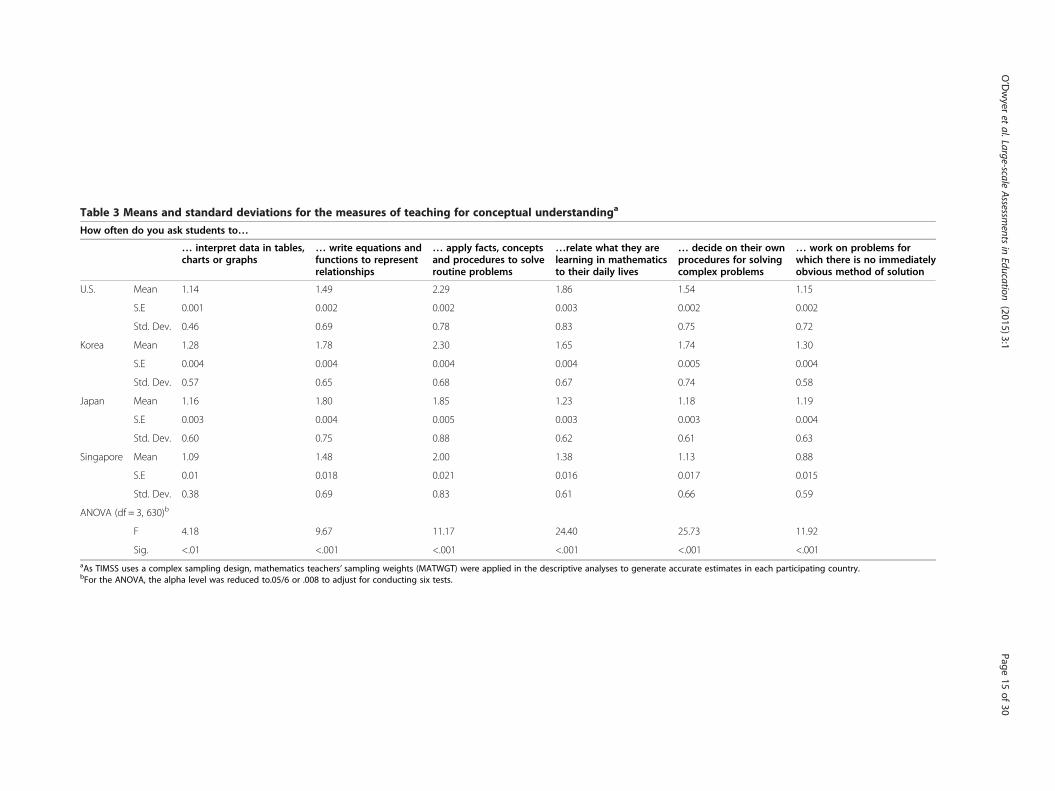
Table 3 Means and standard deviations for the measures of teaching for conceptual understandinga
How often do you ask students to…
… interpret data in tables,charts or graphs
… write equations andfunctions to representrelationships
… apply facts, conceptsand procedures to solveroutine problems
…relate what they arelearning in mathematicsto their daily lives
… decide on their ownprocedures for solvingcomplex problems
… work on problems forwhich there is no immediatelyobvious method of solution
U.S. Mean 1.14 1.49 2.29 1.86 1.54 1.15
S.E 0.001 0.002 0.002 0.003 0.002 0.002
Std. Dev. 0.46 0.69 0.78 0.83 0.75 0.72
Korea Mean 1.28 1.78 2.30 1.65 1.74 1.30
S.E 0.004 0.004 0.004 0.004 0.005 0.004
Std. Dev. 0.57 0.65 0.68 0.67 0.74 0.58
Japan Mean 1.16 1.80 1.85 1.23 1.18 1.19
S.E 0.003 0.004 0.005 0.003 0.003 0.004
Std. Dev. 0.60 0.75 0.88 0.62 0.61 0.63
Singapore Mean 1.09 1.48 2.00 1.38 1.13 0.88
S.E 0.01 0.018 0.021 0.016 0.017 0.015
Std. Dev. 0.38 0.69 0.83 0.61 0.66 0.59
ANOVA (df = 3, 630)b
F 4.18 9.67 11.17 24.40 25.73 11.92
Sig. <.01 <.001 <.001 <.001 <.001 <.001aAs TIMSS uses a complex sampling design, mathematics teachers’ sampling weights (MATWGT) were applied in the descriptive analyses to generate accurate estimates in each participating country.bFor the ANOVA, the alpha level was reduced to.05/6 or .008 to adjust for conducting six tests.
O’Dwyer
etal.Large-scale
Assessm
entsin
Education (2015) 3:1
Page15
of30
O’Dwyer et al. Large-scale Assessments in Education (2015) 3:1 Page 16 of 30
frequency of teaching for conceptual understanding, the post hoc tests indicate patterns
in the differences. First, teachers in the U.S. reported that they had their students engage
in four of the six practices significantly more frequently than teachers in some of the other
countries. Specifically, mathematics teachers in the U.S. (M = 1.86, SD = 0.83) reported
significantly higher rates for having their students relate what they are learning in
mathematics to their daily lives than teachers in Japan (M = 1.26, SD = 0.62), Korea
(M = 1.65, SD = 0.67), or Singapore (M = 1.38, SD = 0.61). Likewise, the post hoc
tests showed that teachers in the U.S. (M = 2.29, SD = 0.78) reported having their
students apply facts, concepts and procedures to solve routine problems significantly more
frequently than teachers in Japan (M= 1.85, SD = 0.88) or Singapore (M= 2.00, SD = 0.83).
Teachers in the U.S. (M = 1.54, SD = 0.75) also had their students decide on their own
procedures for solving complex problems significantly more often than teachers in
Japan (M= 1.18, SD = 0.61) or Singapore (M= 1.13, SD = 0.66). Finally, teachers in the U.S.
(M = 1.15, SD = 0.72) reported having their students work on problems for which there is no
immediately obvious method of solution significantly more frequently than teachers in
Singapore (M = 0.88, SD = 0.59).
This pattern was reversed for the practice of having students write equations and
functions to represent relationships and interpret data in tables, charts or graphs.
Teachers in the U.S. (M = 1.49, SD = 0.69) were significantly less likely to have their
students write equations and functions to represent relationships than teachers in either
Japan (M = 1.80, SD = 0.75) or Korea (M = 1.78, SD = 0.65). Although the frequency of
teachers having their students interpret data in tables, charts or graphs was low in both
countries (see Figure 1), teachers in the U.S. (M = 1.14, SD = 0.46) were significantly less
likely than teachers in Korea (M = 1.28, SD = 0.57) to engage in this practice.
These patterns across the four countries support the findings from classroom observation
studies (Hiebert et al., 2005; VanTassel-Baska et al., 2008; Whitman and Lai, 1990) that
there is variability in teachers’ use of the instructional practices measured on the TIMSS
teacher survey across countries.
Teaching for conceptual understanding and mathematics test scores
Tables 4, 5, 6, and 7 present the regression coefficients associated with the six individual
teaching for conceptual understanding measures (Models 1–6) for predicting students’
total mathematics test scores in the U.S., Korea, Japan, and Singapore, respectively.
Since the student and school covariates are included in Models 1 through 6, the tables
also present those regression coefficients. Using the standard deviation of students’
mathematics scores in the sample, the coefficients were transformed into predicted
standardized differences by dividing the regression coefficient by the standard deviation of
the outcome variable (see Table 1). For example, if an independent variable X is associated
with a regression coefficient b for predicting the outcome variable Y, the standardized
regression coefficient is interpreted as the predicted standard deviation change in Y for a
one unit increase in X, holding all else constant. In this case, a one unit increase
in X corresponds to increasing teaching for conceptual understanding practices
from never to some lessons, from some lessons to about half the lessons, or from about
half the lessons to every or almost every lesson. Subsequent to the interpretation of the
fixed effects, the percentage of variance explained by the models is discussed.
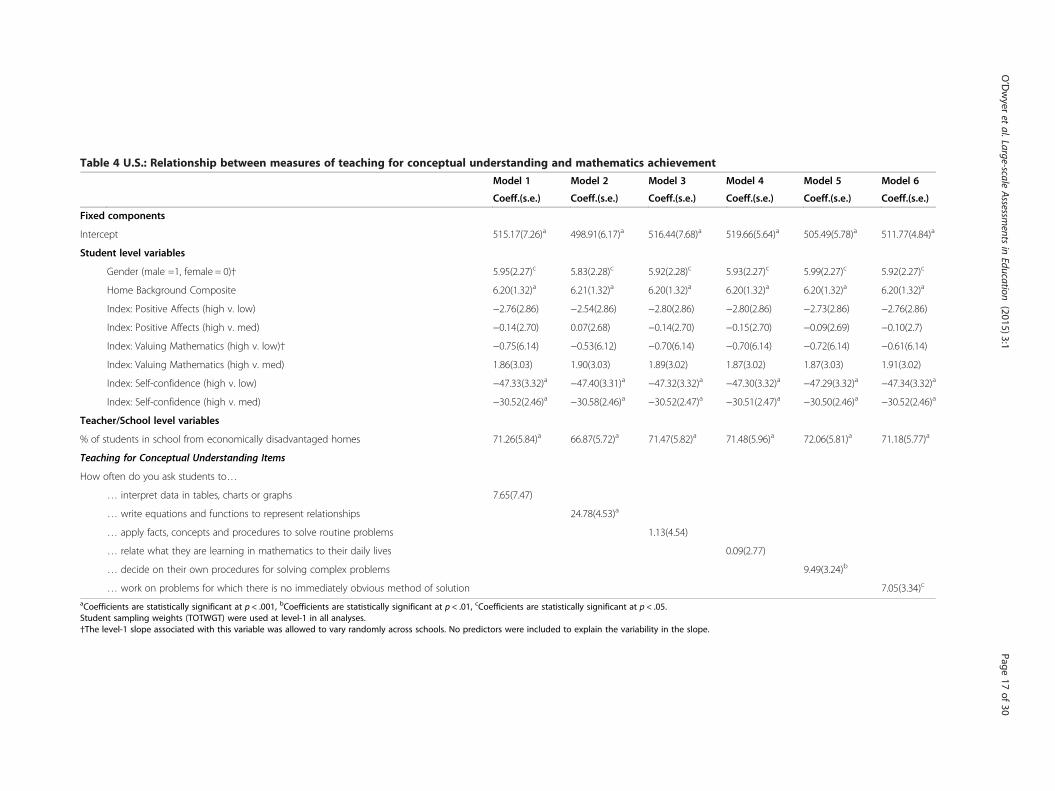
Table 4 U.S.: Relationship between measures of teaching for conceptual understanding and mathematics achievement
Model 1 Model 2 Model 3 Model 4 Model 5 Model 6
Coeff.(s.e.) Coeff.(s.e.) Coeff.(s.e.) Coeff.(s.e.) Coeff.(s.e.) Coeff.(s.e.)
Fixed components
Intercept 515.17(7.26)a 498.91(6.17)a 516.44(7.68)a 519.66(5.64)a 505.49(5.78)a 511.77(4.84)a
Student level variables
Gender (male =1, female = 0)† 5.95(2.27)c 5.83(2.28)c 5.92(2.28)c 5.93(2.27)c 5.99(2.27)c 5.92(2.27)c
Home Background Composite 6.20(1.32)a 6.21(1.32)a 6.20(1.32)a 6.20(1.32)a 6.20(1.32)a 6.20(1.32)a
Index: Positive Affects (high v. low) −2.76(2.86) −2.54(2.86) −2.80(2.86) −2.80(2.86) −2.73(2.86) −2.76(2.86)
Index: Positive Affects (high v. med) −0.14(2.70) 0.07(2.68) −0.14(2.70) −0.15(2.70) −0.09(2.69) −0.10(2.7)
Index: Valuing Mathematics (high v. low)† −0.75(6.14) −0.53(6.12) −0.70(6.14) −0.70(6.14) −0.72(6.14) −0.61(6.14)
Index: Valuing Mathematics (high v. med) 1.86(3.03) 1.90(3.03) 1.89(3.02) 1.87(3.02) 1.87(3.03) 1.91(3.02)
Index: Self-confidence (high v. low) −47.33(3.32)a −47.40(3.31)a −47.32(3.32)a −47.30(3.32)a −47.29(3.32)a −47.34(3.32)a
Index: Self-confidence (high v. med) −30.52(2.46)a −30.58(2.46)a −30.52(2.47)a −30.51(2.47)a −30.50(2.46)a −30.52(2.46)a
Teacher/School level variables
% of students in school from economically disadvantaged homes 71.26(5.84)a 66.87(5.72)a 71.47(5.82)a 71.48(5.96)a 72.06(5.81)a 71.18(5.77)a
Teaching for Conceptual Understanding Items
How often do you ask students to…
… interpret data in tables, charts or graphs 7.65(7.47)
… write equations and functions to represent relationships 24.78(4.53)a
… apply facts, concepts and procedures to solve routine problems 1.13(4.54)
… relate what they are learning in mathematics to their daily lives 0.09(2.77)
… decide on their own procedures for solving complex problems 9.49(3.24)b
… work on problems for which there is no immediately obvious method of solution 7.05(3.34)c
aCoefficients are statistically significant at p < .001, bCoefficients are statistically significant at p < .01, cCoefficients are statistically significant at p < .05.Student sampling weights (TOTWGT) were used at level-1 in all analyses.†The level-1 slope associated with this variable was allowed to vary randomly across schools. No predictors were included to explain the variability in the slope.
O’Dwyer
etal.Large-scale
Assessm
entsin
Education (2015) 3:1
Page17
of30
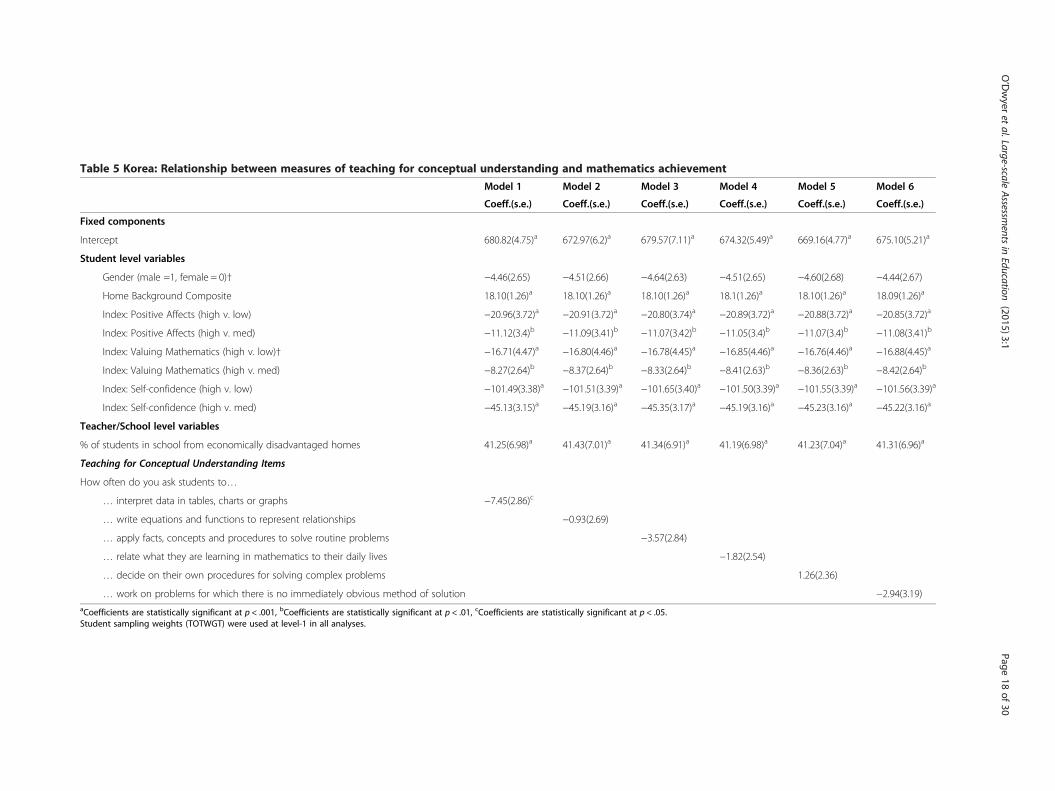
Table 5 Korea: Relationship between measures of teaching for conceptual understanding and mathematics achievement
Model 1 Model 2 Model 3 Model 4 Model 5 Model 6
Coeff.(s.e.) Coeff.(s.e.) Coeff.(s.e.) Coeff.(s.e.) Coeff.(s.e.) Coeff.(s.e.)
Fixed components
Intercept 680.82(4.75)a 672.97(6.2)a 679.57(7.11)a 674.32(5.49)a 669.16(4.77)a 675.10(5.21)a
Student level variables
Gender (male =1, female = 0)† −4.46(2.65) −4.51(2.66) −4.64(2.63) −4.51(2.65) −4.60(2.68) −4.44(2.67)
Home Background Composite 18.10(1.26)a 18.10(1.26)a 18.10(1.26)a 18.1(1.26)a 18.10(1.26)a 18.09(1.26)a
Index: Positive Affects (high v. low) −20.96(3.72)a −20.91(3.72)a −20.80(3.74)a −20.89(3.72)a −20.88(3.72)a −20.85(3.72)a
Index: Positive Affects (high v. med) −11.12(3.4)b −11.09(3.41)b −11.07(3.42)b −11.05(3.4)b −11.07(3.4)b −11.08(3.41)b
Index: Valuing Mathematics (high v. low)† −16.71(4.47)a −16.80(4.46)a −16.78(4.45)a −16.85(4.46)a −16.76(4.46)a −16.88(4.45)a
Index: Valuing Mathematics (high v. med) −8.27(2.64)b −8.37(2.64)b −8.33(2.64)b −8.41(2.63)b −8.36(2.63)b −8.42(2.64)b
Index: Self-confidence (high v. low) −101.49(3.38)a −101.51(3.39)a −101.65(3.40)a −101.50(3.39)a −101.55(3.39)a −101.56(3.39)a
Index: Self-confidence (high v. med) −45.13(3.15)a −45.19(3.16)a −45.35(3.17)a −45.19(3.16)a −45.23(3.16)a −45.22(3.16)a
Teacher/School level variables
% of students in school from economically disadvantaged homes 41.25(6.98)a 41.43(7.01)a 41.34(6.91)a 41.19(6.98)a 41.23(7.04)a 41.31(6.96)a
Teaching for Conceptual Understanding Items
How often do you ask students to…
… interpret data in tables, charts or graphs −7.45(2.86)c
… write equations and functions to represent relationships −0.93(2.69)
… apply facts, concepts and procedures to solve routine problems −3.57(2.84)
… relate what they are learning in mathematics to their daily lives −1.82(2.54)
… decide on their own procedures for solving complex problems 1.26(2.36)
… work on problems for which there is no immediately obvious method of solution −2.94(3.19)aCoefficients are statistically significant at p < .001, bCoefficients are statistically significant at p < .01, cCoefficients are statistically significant at p < .05.Student sampling weights (TOTWGT) were used at level-1 in all analyses.
O’Dwyer
etal.Large-scale
Assessm
entsin
Education (2015) 3:1
Page18
of30
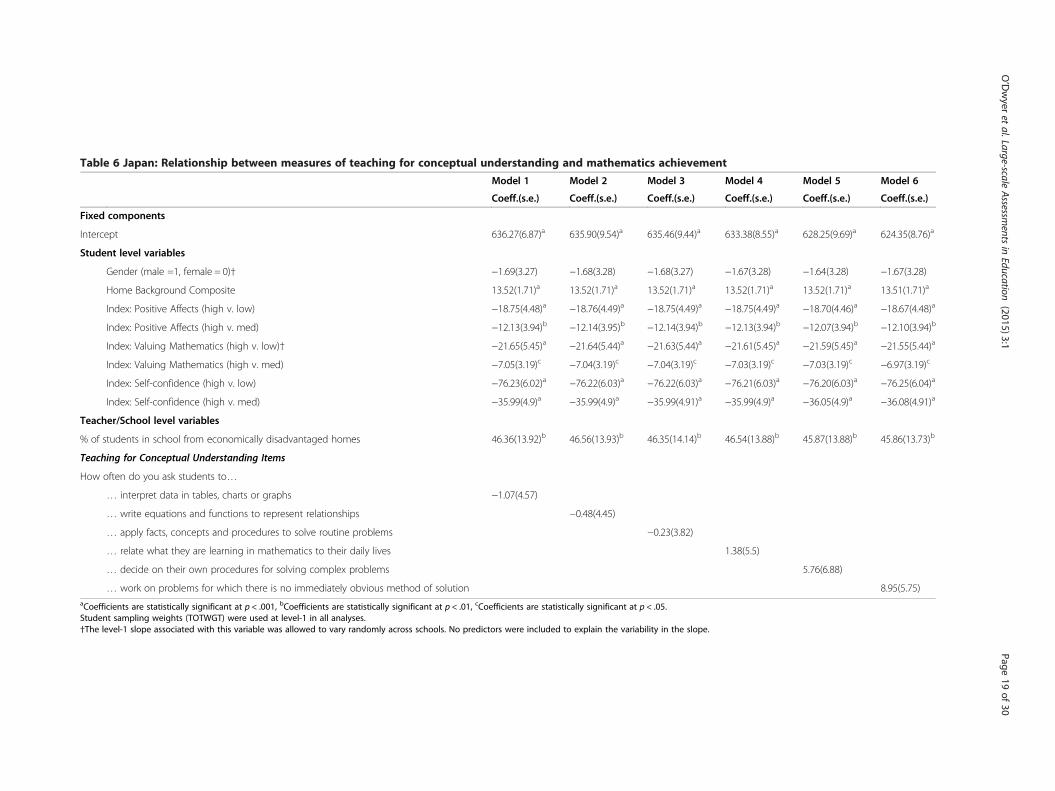
Table 6 Japan: Relationship between measures of teaching for conceptual understanding and mathematics achievement
Model 1 Model 2 Model 3 Model 4 Model 5 Model 6
Coeff.(s.e.) Coeff.(s.e.) Coeff.(s.e.) Coeff.(s.e.) Coeff.(s.e.) Coeff.(s.e.)
Fixed components
Intercept 636.27(6.87)a 635.90(9.54)a 635.46(9.44)a 633.38(8.55)a 628.25(9.69)a 624.35(8.76)a
Student level variables
Gender (male =1, female = 0)† −1.69(3.27) −1.68(3.28) −1.68(3.27) −1.67(3.28) −1.64(3.28) −1.67(3.28)
Home Background Composite 13.52(1.71)a 13.52(1.71)a 13.52(1.71)a 13.52(1.71)a 13.52(1.71)a 13.51(1.71)a
Index: Positive Affects (high v. low) −18.75(4.48)a −18.76(4.49)a −18.75(4.49)a −18.75(4.49)a −18.70(4.46)a −18.67(4.48)a
Index: Positive Affects (high v. med) −12.13(3.94)b −12.14(3.95)b −12.14(3.94)b −12.13(3.94)b −12.07(3.94)b −12.10(3.94)b
Index: Valuing Mathematics (high v. low)† −21.65(5.45)a −21.64(5.44)a −21.63(5.44)a −21.61(5.45)a −21.59(5.45)a −21.55(5.44)a
Index: Valuing Mathematics (high v. med) −7.05(3.19)c −7.04(3.19)c −7.04(3.19)c −7.03(3.19)c −7.03(3.19)c −6.97(3.19)c
Index: Self-confidence (high v. low) −76.23(6.02)a −76.22(6.03)a −76.22(6.03)a −76.21(6.03)a −76.20(6.03)a −76.25(6.04)a
Index: Self-confidence (high v. med) −35.99(4.9)a −35.99(4.9)a −35.99(4.91)a −35.99(4.9)a −36.05(4.9)a −36.08(4.91)a
Teacher/School level variables
% of students in school from economically disadvantaged homes 46.36(13.92)b 46.56(13.93)b 46.35(14.14)b 46.54(13.88)b 45.87(13.88)b 45.86(13.73)b
Teaching for Conceptual Understanding Items
How often do you ask students to…
… interpret data in tables, charts or graphs −1.07(4.57)
… write equations and functions to represent relationships −0.48(4.45)
… apply facts, concepts and procedures to solve routine problems −0.23(3.82)
… relate what they are learning in mathematics to their daily lives 1.38(5.5)
… decide on their own procedures for solving complex problems 5.76(6.88)
… work on problems for which there is no immediately obvious method of solution 8.95(5.75)aCoefficients are statistically significant at p < .001, bCoefficients are statistically significant at p < .01, cCoefficients are statistically significant at p < .05.Student sampling weights (TOTWGT) were used at level-1 in all analyses.†The level-1 slope associated with this variable was allowed to vary randomly across schools. No predictors were included to explain the variability in the slope.
O’Dwyer
etal.Large-scale
Assessm
entsin
Education (2015) 3:1
Page19
of30
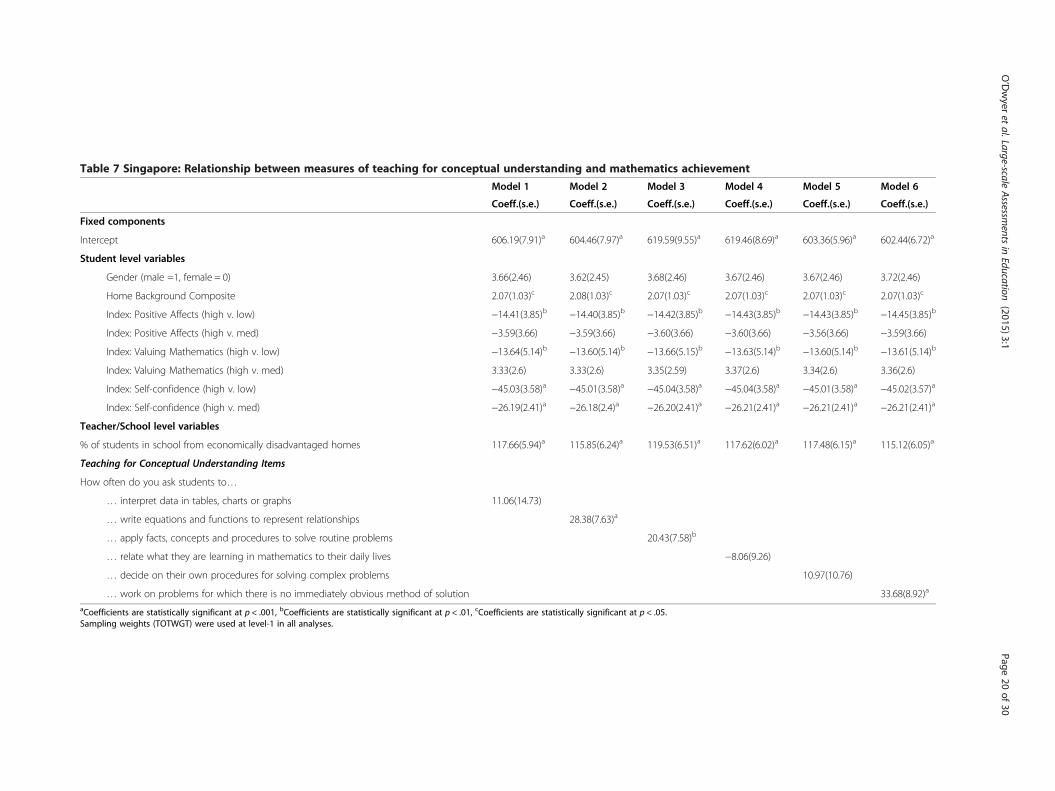
Table 7 Singapore: Relationship between measures of teaching for conceptual understanding and mathematics achievement
Model 1 Model 2 Model 3 Model 4 Model 5 Model 6
Coeff.(s.e.) Coeff.(s.e.) Coeff.(s.e.) Coeff.(s.e.) Coeff.(s.e.) Coeff.(s.e.)
Fixed components
Intercept 606.19(7.91)a 604.46(7.97)a 619.59(9.55)a 619.46(8.69)a 603.36(5.96)a 602.44(6.72)a
Student level variables
Gender (male =1, female = 0) 3.66(2.46) 3.62(2.45) 3.68(2.46) 3.67(2.46) 3.67(2.46) 3.72(2.46)
Home Background Composite 2.07(1.03)c 2.08(1.03)c 2.07(1.03)c 2.07(1.03)c 2.07(1.03)c 2.07(1.03)c
Index: Positive Affects (high v. low) −14.41(3.85)b −14.40(3.85)b −14.42(3.85)b −14.43(3.85)b −14.43(3.85)b −14.45(3.85)b
Index: Positive Affects (high v. med) −3.59(3.66) −3.59(3.66) −3.60(3.66) −3.60(3.66) −3.56(3.66) −3.59(3.66)
Index: Valuing Mathematics (high v. low) −13.64(5.14)b −13.60(5.14)b −13.66(5.15)b −13.63(5.14)b −13.60(5.14)b −13.61(5.14)b
Index: Valuing Mathematics (high v. med) 3.33(2.6) 3.33(2.6) 3.35(2.59) 3.37(2.6) 3.34(2.6) 3.36(2.6)
Index: Self-confidence (high v. low) −45.03(3.58)a −45.01(3.58)a −45.04(3.58)a −45.04(3.58)a −45.01(3.58)a −45.02(3.57)a
Index: Self-confidence (high v. med) −26.19(2.41)a −26.18(2.4)a −26.20(2.41)a −26.21(2.41)a −26.21(2.41)a −26.21(2.41)a
Teacher/School level variables
% of students in school from economically disadvantaged homes 117.66(5.94)a 115.85(6.24)a 119.53(6.51)a 117.62(6.02)a 117.48(6.15)a 115.12(6.05)a
Teaching for Conceptual Understanding Items
How often do you ask students to…
… interpret data in tables, charts or graphs 11.06(14.73)
… write equations and functions to represent relationships 28.38(7.63)a
… apply facts, concepts and procedures to solve routine problems 20.43(7.58)b
… relate what they are learning in mathematics to their daily lives −8.06(9.26)
… decide on their own procedures for solving complex problems 10.97(10.76)
… work on problems for which there is no immediately obvious method of solution 33.68(8.92)a
aCoefficients are statistically significant at p < .001, bCoefficients are statistically significant at p < .01, cCoefficients are statistically significant at p < .05.Sampling weights (TOTWGT) were used at level-1 in all analyses.
O’Dwyer
etal.Large-scale
Assessm
entsin
Education (2015) 3:1
Page20
of30
O’Dwyer et al. Large-scale Assessments in Education (2015) 3:1 Page 21 of 30
For the U.S., Table 4 shows that the frequency with which teachers asked their
students to write equations and functions to represent relationships (b = 24.78, standardized
difference = 0.33, p < .001), decide on their own procedures for solving complex problems
(b = 9.49, standardized difference = 0.13, p < .01), and to work on problems for which there
is no immediately obvious method of solution (b = 7.05, standardized difference = 0.09,
p < .05) were each associated with increased mathematics scores, after controlling for the
covariates included in the models. The largest predicted increase in achievement was
associated with U.S. teachers having their students write equations and functions to
represent relationships; recall that teachers in the U.S. were significantly less likely
than teachers in Japan and Korea to have their students engage in this practice
(Table 3). For every one point increase in teachers’ practice of having their students write
equations and functions to represent relationships (e.g., increasing the frequency of using
this practice from some lessons to about half the lessons), students’ mathematics scores
were predicted to increase by 0.33 standard deviations.
Tables 5 and 6 show that in Korea and Japan, none of the six individual teaching for
conceptual understanding items was significantly associated with students’ mathematics
test scores; the regression coefficients and standardized difference associated with
the individual practice items were small; between −0.08 and 0.01 in Korea and
between −0.003 and 0.11 in Japan.
Table 7 shows that in Singapore, the frequency with which teachers asked their
students to write equations and functions to represent relationships (b = 28.38, standardized
difference = 0.32, p < .001), apply facts, concepts and procedures to solve routine problems
(b = 20.43, standardized difference = 0.23, p < .01), and to work on problems for which there
is no immediately obvious method of solution (b = 33.68, standardized difference = 0.37,
p < .001) were each associated with increased mathematics test scores, after controlling
for the student and school covariates in the model.
Two patterns were apparent in these results. In Korea and Japan the items used to
represent teaching for conceptual understanding were not associated with students’
mathematics test scores. Conversely in the U.S. and Singapore, students in classrooms
where teachers asked their students to write equations and functions to represent
relationships or work on problems for which there is no immediately obvious
method of solution were predicted to have higher mathematics scores, after controlling
for all other variables in the model. The standardized regression coefficients for having
students write equations and functions to represent relationships were almost identical in
both countries; 0.33 in the U.S. compared to 0.32 in Singapore.
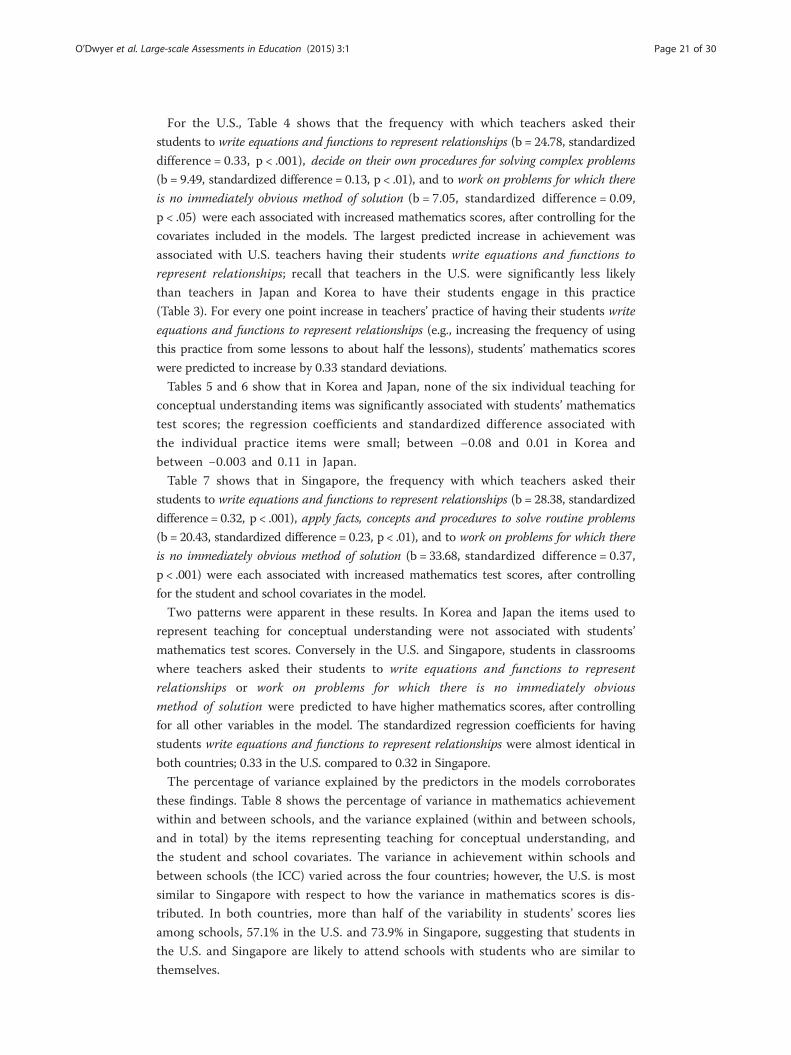
The percentage of variance explained by the predictors in the models corroborates
these findings. Table 8 shows the percentage of variance in mathematics achievement
within and between schools, and the variance explained (within and between schools,
and in total) by the items representing teaching for conceptual understanding, and
the student and school covariates. The variance in achievement within schools and
between schools (the ICC) varied across the four countries; however, the U.S. is most
similar to Singapore with respect to how the variance in mathematics scores is dis-
tributed. In both countries, more than half of the variability in students’ scores lies
among schools, 57.1% in the U.S. and 73.9% in Singapore, suggesting that students in
the U.S. and Singapore are likely to attend schools with students who are similar to
themselves.

Table 8 Variance in mathematics achievement explained by the measures of teaching for conceptual understanding
Covariates-OnlyModel†
Model 1 Model 2 Model 3 Model 4 Model 5 Model 6
Interpret data Write equations Apply facts Relate learning Decide on procedures Work on problems
U.S. Variance Available: % Explained:
….within schools 57.1% …within schools 38.4% 38.4% 38.4% 38.4% 38.4% 38.4% 38.4%
….btn schools (ICC) 42.9% …btn schools 52.9% 52.8% 57.1% 52.8% 52.6% 54.2% 53.2%
….Total 44.6% 44.6% 46.4% 44.6% 44.5% 45.2% 44.8%
Korea Variance Available: % Explained:
….within schools 89.4% …within schools 40.1% 40.1% 40.1% 40.1% 40.1% 40.1% 40.1%
….btn schools (ICC) 10.6% …btn schools 68.4% 70.2% 68.3% 68.9% 68.2% 68.2% 68.5%
….Total 43.1% 43.3% 43.1% 43.1% 43.1% 43.1% 43.1%
Japan Variance Available: % Explained:
….within schools 80.1% …within schools 26.4% 26.4% 26.4% 26.4% 26.4% 26.4% 26.4%
….btn schools (ICC) 19.9% …btn schools 35.1% 34.8% 34.4% 34.6% 34.7% 37.8% 39.5%
….Total 28.1% 28.1% 28.0% 28.0% 28.0% 28.7% 29.0%
Singapore Variance Available: % Explained:
….within schools 26.1% …within schools 22.5% 22.5% 22.5% 22.5% 22.5% 22.5% 22.5%
….btn schools (ICC) 73.9% …btn schools 75.4% 75.3% 75.4% 75.4% 75.3% 76.0% 76.1%
….Total 61.6% 61.5% 61.6% 61.6% 61.6% 62.0% 62.1%†The fixed effects for these models are not shown.
O’Dwyer
etal.Large-scale
Assessm
entsin
Education (2015) 3:1
Page22
of30
O’Dwyer et al. Large-scale Assessments in Education (2015) 3:1 Page 23 of 30
In Korea and Japan, the majority of variance in mathematics scores is among students
within schools, 89.4% in Korea and 80.1% in Japan. The small percentages of variance
in achievement between schools suggests that teacher-to-teacher differences in teaching
for conceptual understanding practices, or any teacher- or classroom-level practice or
characteristic for that matter, will be of limited use in predicting student-to-student dif-
ferences in achievement in these countries.
Recall that only one classroom per school is included in the analysis sample. As a
consequence, the variance in achievement between classroom within schools and the
between school variance in achievement are confounded, so the proportion of variability
between schools is larger than is observed when classroom-to-classroom differences are
separated from between school differences. For example, when multiple classrooms
per school are included in the analysis in the U.S., a three-level model indicates
that approximately 40% of the variability in mathematics performance lies between
students within classrooms, 47% between classrooms within schools, and 12% between
schools. In Singapore, the only other country with large numbers of schools with more
than one classroom, approximately 23% of the variability in mathematics performance lies
between students within classrooms, 53% between classrooms within schools, and 24%
between schools.
Table 8 also presents the variance components for the covariates-only model
(fixed effects not presented), and for each of Models 1 through 6 in the four countries.
The student and school covariates explained similar percentages of the total variance in
students’ mathematics scores in the U.S. and Korea, 44.6% and 43.1%, respectively. In
Singapore however, the student and school covariates explained approximately 62% of the
total variance in achievement – 22.5% of the 26.1% available within schools, and 75.4% of
the 73.9% between schools.
Despite being significantly associated with achievement in the U.S. and Singapore
(Tables 4 and 7), the frequency with which teachers asked their students to write equations
and functions to represent relationships and work on problems for which there is no
immediately obvious method of solution explained only very small percentages of the total
variance in students’ scores after controlling for the covariates in the model (between 0.2
and 1.6 additional percentage points). Likewise, having students decide on their own
procedures for solving complex problems did not explain any additional variance in
achievement in the U.S., and having students apply facts, concepts and procedures to solve
routine problems did not explain any additional variance in achievement in Singapore.
The percentage of variance explained in Korea and Japan corroborate the findings in
Tables 5 and 6 that these measures of teaching for conceptual understanding were not
associated with mathematics test scores; Models 1 through 6 explained no additional
variance over and above the percentage of variance explained by the covariates.
Student and school covariates and mathematics test scores
Though not central to the research questions posed, patterns were also evident in the
regression coefficients associated with the student and school covariates across the four
countries. The only significant effect for gender was observed in the U.S., with the
difference favoring males. In the three East Asian countries, students’ with more
positive attitudes toward mathematics (higher on the PAT-M index), students who
valued mathematics (higher on the SVM index), and had greater self-confidence in
O’Dwyer et al. Large-scale Assessments in Education (2015) 3:1 Page 24 of 30
learning mathematics (higher on the SCM index) were predicted to have higher
mathematics scores. However, in the U.S., only students’ self-confidence in learning
mathematics was associated with mathematics test scores. In all countries, the
composite representing students’ home background and the school aggregated
home background composite were significantly associated with mathematics test
scores; students from better resourced homes and students in schools where the
student body come from well-resourced homes were predicted to have significantly
higher mathematics scores.
Conclusion and discussionEducators, researchers and policy-makers worldwide continue to struggle to understand
the changes that need to be made to improve educational outcomes and educational
attainment for students, particularly in content areas such as mathematics and science
that are essential for developing a highly skilled workforce. It is evident from the vast
body of educational research that the correlates of student achievement and attainment
are many and varied, particularly across countries, and that it is unlikely we will be able
to isolate a single policy or practice that will alone, resolve all the concerns around
improving student outcomes.
In the U.S., state and federal initiatives such as the Race to the Top program
have renewed the emphasis on linking teacher quality with student outcomes. In
reality, teacher quality is a complex construct that almost certainly hinges on
teachers’ instructional practices, pedagogical content knowledge, attitudes toward
students and teaching, as well as pre-service qualifications and professional development
activities (Darling-Hammond and Youngs, 2002; Goe, 2007). However, while U.S. federal
policies support the idea that how teachers teach is central to teacher quality, there
appears to be little consensus on the specific instructional practices that are consistently
associated with student achievement. The focus of this research was on developing a
deeper understanding of the types of instructional practices, particularly practices
supporting conceptual understanding, used by U.S. teachers compared to teachers
in a subset of higher-performing East Asian countries, and to examine whether
those instructional practices were related to students’ mathematics test scores.
In conducting this study, the authors acknowledge that one of the most significant
challenges for comparing the relationships between student test scores in U.S. to the
test scores of students in East Asian countries is the pervasiveness of out-of-school
instruction in those countries, particularly in mathematics (Bray, 2003; Bray and
Kwo, 2013). The proliferation of for-profit, supplementary instruction through juku
or hagwons is likely to affect the validity of the comparisons, and unfortunately the
extent of the effect is difficult to estimate using data from large-scale, international
studies such as TIMSS, PIRLS, and PISA.
The descriptive results presented here support the findings from previous studies,
including classroom observation studies, that there is variability across countries in
teachers’ use of instructional practices for supporting conceptual understanding
(Hiebert et al., 2005; VanTassel-Baska et al., 2008; Whitman and Lai, 1990). Focusing on
how the U.S. compares to the other countries, it appeared that teachers in the U.S. were
most similar to Korean teachers in the frequency of their reported practices, and that they
reported using some of the practices at least as frequently, or more frequently than
O’Dwyer et al. Large-scale Assessments in Education (2015) 3:1 Page 25 of 30
teachers in the other countries. This pattern is somewhat at odds with previous research
findings about teaching practices in the U.S. For example, Hiebert et al. (2005) concluded
from the 1999 TIMSS video study that, compared to higher performing countries,
teachers in the U.S. spent more time completing repetitive exercises rather than applying
and extending skills to new, different problems. In contrast, these data show that teachers
in U.S. classrooms reported rates for having their students apply facts, concepts
and procedures to solve routine problems, relate what they are learning in mathematics to
their daily lives, decide on their own procedures for solving complex problems, and work
on problems for which there is no immediately obvious method of solution that were
as high, or higher than the top-performing comparison countries.
One possible explanation for the patterns observed may be differences in how
the survey items are interpreted across countries, a significant challenge in any
international study that uses self-report surveys. For example, when presented with
a survey item that uses the term “complex problem” there may be cultural differences in
what constitutes “complex”; something that is considered complex in one culture may be
characterized as basic in another. Likewise, it is also possible that the different patterns
observed in this study are due to the data being gathered from self-reports only, with no
classroom observations or interviews to verify the results. Unfortunately, in the absence of
observational or interview data, it is difficult to disconfirm the hypothesis that cross-
cultural interpretation differences underlie the response patterns.
In Japan, the pattern of responses about use of practices that support conceptual
understanding was at odds with the findings from previous TIMSS administrations. For
example in TIMSS 1999, Japan led the other nations in teaching for conceptual
understanding in eighth grade mathematics classrooms, ranking first in the frequency of
using such practices (Mullis et al., 2000). Moreover, the TIMSS video study, also
conducted in 1999, came to the same conclusion based on classroom observations
(Hiebert et al., 2005). However, the patterns observed here for TIMSS 2007 suggest
there may have been changes in Japanese teachers’ practices in the intervening
years; teachers in Japan no longer reported using the six strategies as frequently as
in previous TIMSS administrations. Overall, teachers in Korea, and in some cases
the U.S., employed these strategies more frequently than teachers in Japan.
In looking at whether teachers’ instructional practices for supporting conceptual
understanding were related to students’ mathematics achievement, two interesting
patterns were observed. The relationships observed between teachers’ instructional
practices and mathematics achievement in the U.S. and Singapore were similar. Of the
six teaching for conceptual understanding practices examined, two were significantly
associated with achievement in both countries. These were: the frequency with which
teachers had their students write equations and functions to represent relationships and
work on problems for which there is no immediately obvious method of solution, one of
the most complex conceptual skills at the higher end of the construct of teaching for
conceptual understanding (Hiebert and Grouws, 2007). In terms of a standardized
effect size, the largest predicted change in mathematics achievement was associated with
teachers having their students write equations and functions to represent relationships.
Holding all else constant, increasing the frequency of using this practice from say some
lessons to about half the lessons was associated with a predicted increase in achievement
of 0.33 standard deviations in the U.S. and 0.33 standard deviations in Singapore. In each

O’Dwyer et al. Large-scale Assessments in Education (2015) 3:1 Page 26 of 30
of these two countries, one additional instructional practice was associated with higher
mathematics test scores: having students decide on their own procedures for solving
complex problems in the U.S., and in Singapore, having students apply facts, concepts
and procedures to solve routine problems, one of the less complex skills at the lower end
of the construct (Hiebert and Lefevre, 1987).
Although teachers in the U.S. had their students write equations and functions to
represent relationships less frequently than teachers in Korea and Japan, the significant
regression coefficient in the U.S. indicates that, even after controlling for student and
school covariates, this instructional strategy may be effective when used. This result in the
U.S. aligns with Camburn and Han’s meta-analysis (Camburn and Han, 2011) that
reported statistically significant support for the positive association between achievement
and certain instructional practices. However, it is at odds with Tomoff et al.’s (2000) study
of the earlier TIMSS 1995 data, which based on the analysis of slightly different survey
items relating to teaching practices, did not find even a weak relationship between
achievement and instructional practices in the U.S.
Likewise, although teachers in Singapore reported some of the lowest frequencies of
having their students write equations and functions to represent relationships, apply
facts, concepts and procedures to solve routine problems, and work on problems for
which there is no immediately obvious method of solution among the four countries
studied, these practices were each positively associated with mathematics achievement.
However, despite observing a statistically significant relationship between some of the
instructional practice measures and mathematics achievement in the U.S. and
Singapore, the measures explained very small percentages of the variability in mathematics
achievement (between 0.2 and 1.6 additional percentage points). These percentages were
similar to those reported by Desimone, Smith, Baker and Ueno’s TIMSS 1999 study
(Desimone et al. 2005) who found that the relationship between mathematics
achievement and the frequency of using strategies for teaching for conceptual
understanding were weak in the U.S. The results from this study confirm that
differences in instructional practices may not be the largest contributing factor to
the observed differences in achievement between U.S. students and students in
higher-scoring, East Asian countries.
First, teachers’ uses of instructional practices were not associated with students’ total
mathematics scores in Korea or Japan. Though not presented as part of this research,
this finding held when we looked at students’ sub-domain scores in Numbers, Algebra,
Geometry, and Data and Chance, and when we included or excluded the student and
school covariates from the model. This finding may be due to the small proportion of
variability in achievement among schools in Korea and Japan that is available to be
explained by differences in teachers’ instructional practices. Compared to the U.S. and
Singapore where 57.1% and 73.9% of the variability in mathematics achievement existed
between schools, respectively, only 10.6% of the variability in mathematics achievement
exists between schools in Korea, and 19.9% in Japan. Furthermore, in Korea, more than
two-thirds of the small proportion of available variance in mathematics scores between
schools was accounted for by the covariates, leaving even less to be explained by differences
in teachers’ uses of instructional practices.
As with any study of this nature, there are additional considerations in the interpretation
of the findings presented here, some of which are intractable issues when conducting
O’Dwyer et al. Large-scale Assessments in Education (2015) 3:1 Page 27 of 30
secondary analyses with large-scale, international comparative study data. First, the
most obvious limitation of this research is that it cannot support causal claims
about the observed relationships between teachers’ instructional practices and student test
scores. Being a cross-sectional observational study that does not include information
about students’ prior achievement, these data do not support claims about whether
student achievement is influenced by teachers’ instructional practices, or whether
teachers are using particular practices because they have high achieving students.
Related to this point is the self-reported nature of the information provided by the
teachers; stronger evidence for the existence of the relationship, or lack of relationship,
between instructional practices and student outcomes would require studies to include a
classroom observation component.
Second, the data analyzed to address the research questions were derived from
the survey data collected as part of the TIMSS 2007 study. So, although the TIMSS
documentation reports that the practices measured on the surveys were those
deemed by TIMSS developers and its partners to be most effective for mathematics
instruction (Mullis et al., 2005), they may not be culturally attuned to the practices
that teachers use in some East Asian countries. In this sense, we cannot be certain
that other, perhaps similar instructional practices are not associated with student
test scores. In addition, there is the possibility that teachers from different cultures
interpreted the survey items in different ways. Also, since teachers were not asked
to indicate the amount of time spent per lesson on the different teaching practices,
it was not possible to discern whether time spent using particular teaching
strategies was associated with the observed differences between countries.
Third, the analysis sample was selected according to strict exclusion criteria and
resulted in the removal of many students and schools. The comparison presented
in Table 1 indicates that the reported samples (Mullis et al., 2008) and analysis
samples were similar in terms of mean achievement, variability in achievement,
and in the percentages of students whose teachers asked them to engage in the six
activities in about half the lessons or more. However, it is possible that the reported and
analysis samples differ on other characteristics and that bias may have been introduced
with the removal of students and schools.
Finally, one possible explanation for the observed differences in mathematics achievement
between countries may be the pervasiveness of supplementary, out-of-school instruction for
East Asian students (Bray, 2003; Bray and Kwo, 2013). While in 1995, 1999, and 2003
TIMSS asked students how much time they spent outside of school receiving instruction in
mathematics, this question was omitted from TIMSS 2007, precluding researchers
and policy makers from exploring this hypothesis. Given the increase in out-of-school
instruction in some countries, we would recommend that a question relating to
out-of-school instruction be re-introduced in future TIMSS studies.
To conclude, while acknowledging these limitations, the authors believe that the
evidence presented in this research contributes to our understanding of the complexity of
teachers’ pedagogical practices in the classroom and points to the need for more nuanced
research in this area. In particular, additional efforts should be undertaken in international
comparative studies to estimate the effects of out-of-school instruction on students’ test
scores, and to disentangle those effects from the effects of countries’ formal education
systems.
O’Dwyer et al. Large-scale Assessments in Education (2015) 3:1 Page 28 of 30
EndnoteaAs the research conducted here is a secondary data analysis no human subjects were
involved and the research is exempt under our organizations' Institutional Review
Boards.
Competing interestsThe authors declare that they have no competing interests.
Authors’ contributionsLOD, YW and KS participated in the development of the rationale for the study. YW prepared the data for analysis.LOD and YW conducted the analyses. LOD drafted the manuscript with contributions from YW and KS. All authorsread and approved the final manuscript.
Author details1Department of Educational Research, Measurement and Evaluation, Lynch School of Education, Boston College,Chestnut Hill, Massachusetts, USA. 2Wisconsin Center for Education Research, University of Wisconsin-Madison, Madison,Wisconsin, USA. 3Department of Educational Research, Measurement and Evaluation, Lynch School of Education, BostonCollege, Chestnut Hill, Massachusetts, USA.
Received: 31 January 2014 Accepted: 4 December 2014
References
Berliner, DC. (2006). Our impoverished view of educational research. Teachers College Record, 108(6), 949–995.Borman, GD, & Kimball, SM. (2005). Teacher quality and educational quality: Do teachers with higher standards-basedevaluation ratings close student achievement gaps? The Elementary School Journal, 106(1), 3–20.Bray, M. (2003). Adverse Effects of Supplementary Private Tutoring: Dimensions, Implications, and Government Responses
(UNESCO International Institute for Educational Planning, p. 84). Downloaded November, 2013.Bray, M, & Kwo, O. (2013). Behind the façade of fee-free education: Shadow education and its implications for social
justice. Oxford Review of Education, 39(4), 480–497.Camburn, EM, & Han, SW. (2011). Two decades of generalizable evidence on U.S. instruction from national surveys.
Teachers College Record, 113(3), 561–610.Choi, N, & Chang, M. (2011). Interplay among school climate, gender, attitude toward mathematics, and mathematics
performance of middle school students. Middle Grades Research Journal, 6(1), 15–28.D’Agostino, J. (2000). Instructional and school effects on students’ longitudinal reading and mathematics achievements.
School Effectiveness and School Improvement, 11(2), 197–235.Darling-Hammond, L, & Youngs, P. (2002). Defining “highly qualified teachers”: What does “scientifically-based research”
actually tell us? Educational Researcher, 31(9), 13–25.Desimone, LM, Smith, T, Baker, D, & Ueno, K. (2005). Assessing barriers to the reform of U.S. mathematics instruction
from an international perspective. American Educational Research Journal, 42(3), 501–535.DeVellis, RF. (2012). Scale Development: Theory and Applications (3rd ed.). Washington, D.C.: SAGE Publications.diSessa, AA, & Sherin, BL. (1998). What changes in conceptual change? International Journal of Science Education, 20(10),
1155–1191.Else-Quest, NM, Hyde, JS, & Linn, MC. (2010). Cross-national patterns of gender differences in mathematics: A meta-analysis.
Psychological Bulletin, 136(1), 103–127.Fennema, E, Carpenter, TP, Franke, ML, Levi, L, Jacobs, VR, & Empson, SB. (1996). A longitudinal study of learning to use
children’s thinking in mathematics instruction. Journal for Research in Mathematics Education, 27(4), 403–434.Foy, P, Galia, J, & Li, I. (2008). Scaling the data from the TIMSS 2007 mathematics and science assessments. Chapter 11.
In JF Olson, MO Martin, & IVS Mullis (Eds.), TIMSS 2007 technical report (pp. 225–280). Chestnut Hill, MA: TIMSS &PIRLS International Study Center, Boston College.
Gales, MJ, & Yan, W. (2001). Relationship between constructivist teacher beliefs and instructional practices to students’mathematical achievement: Evidence from TIMSS (Paper presented at the annual meeting of the AmericanEducational Research Association, Seattle, WA).
Gallagher, HA. (2004). Vaughn Elementary's innovative teacher evaluation system: Are teacher evaluation scores relatedto growth in student achievement? Peabody Journal of Education, 79(4), 79–107.
Gearhart, M, Saxe, GB, Seltzer, M, Schlackman, J, Ching, CC, Nasir, N, & Sloan, TF. (1999). Opportunities to learn fractionsin elementary mathematics classrooms. Journal for Research in Mathematics Education, 30(3), 286–315.
Goe, L. (2007). The link between teacher quality and student outcomes: A research synthesis. Washington, DC: NationalComprehensive Center for Teacher Quality.
Hattie, JAC. (2009). Visible learning: A synthesis of over 800 meta-analyses relating to achievement. New York: Routledge.Heck, RH. (2007). Examining the relationship between teacher quality as an organizational property of schools and
students' achievement and growth rates. Educational Administration Quarterly, 43(4), 399–432.Henderson, AT, & Berla, N. (1994). A new generation of evidence: The family is critical to student achievement. St. Louis,
MO: Danforth Foundation and Flint, MI: Mott (C. S.) Foundation.Heneman, HG, Milanowski, A, Kimball, SM, & Odden, A. (2006). Standards-based teacher evaluation as a foundation for
knowledge- and skill-based pay (CPRE Policy Brief No. RB-45). Philadelphia: Consortium for Policy Research inEducation.
Hiebert, J. (2003). What research says about the NCTM Standards. In J Kilpatrick, WG Martin, & D Schifter (Eds.), Aresearch companion to Principles and Standards for School Mathematics (pp. 5–23). Reston, VA: The National Councilof Teachers of Mathematics, Inc.
O’Dwyer et al. Large-scale Assessments in Education (2015) 3:1 Page 29 of 30
Hiebert, J, & Grouws, DA. (2007). The effects of classroom mathematics teaching on students’ learning. In FK Lester(Ed.), Second handbook for research in mathematics teaching and learning: A project of the National Council ofTeachers of Mathematics (pp. 371–404). Charlotte, NC: Information Age Publishing.
Hiebert, J, & Lefevre, P. (1987). Conceptual and procedural knowledge in mathematics: An introductory analysis. In JHiebert (Ed.), Conceptual and procedural knowledge: The case of mathematics (pp. 1–28). Hillsdale, NJ: LawrenceErlbaum Associates, Inc.
Hiebert, J, Stigler, JW, Jacobs, JK, Givvin, KB, Garnier, H, Smith, M, & Gallimore, R. (2005). Mathematics teaching in theUnited States today (and tomorrow): Results from the TIMSS 1999 video study. Educational Evaluation and PolicyAnalysis, 27(2), 111–132.
Hill, HC, Rowan, B, & Ball, DL. (2005). Effects of teachers' mathematical knowledge for teaching on student achievement.American Educational Research Journal., 42, 371–406.
Ho, H, Senturk, D, Lam, AG, Zimmer, JM, Hong, S, Okamoto, Y, & Wang, C. (2000). The affective and cognitivedimensions of mathematics anxiety: A cross-national study. Journal for Research in Mathematics Education, 31(3),362–379.
Holtzapple, E. (2003). Criterion-related validity evidence for a standards-based teacher evaluation system. Journal ofPersonnel Evaluation in Education, 17(3), 207–219.
House, JD. (2009). Elementary-school mathematics instruction and achievement of fourth-grade students in Japan:Findings from the TIMSS 2007 Assessment. Education, 130(2), 301–307.
Jacobs, JK, & Morita, E. (2002). Japanese and American teachers' evaluations of videotaped mathematics lessons. Journalfor Research in Mathematics Education, 33, 154–175.
Joncas, M. (2008). TIMSS 2007 Sample Design. In JF Olson, MO Martin, & IVS Mullis (Eds.), TIMSS 2007 technical report(pp. 77–92). Chestnut Hill, MA: TIMSS & PIRLS International Study Center, Boston College.
Kaiser, G, & Blömeke, S. (2013). Learning from the Eastern and the Western debate: The case of mathematics teachereducation. ZDM Mathematics Education, 45, 7–19.
Kim, RY, Ham, S, & Paine, LW. (2011). Knowledge expectations in mathematics teacher preparation programs in SouthKorea and the United States: Towards international dialogue. Journal of Teacher Education, 62(1), 48–61.
Kimball, SM, White, B, Milanowski, AT, & Borman, G. (2004). Examining the relationship between teacher evaluation andstudent assessment results in Washoe County. Peabody Journal of Education, 79(4), 54–78.
Lewis, KA, & Seidman, LS. (1994). Mathematics-time capital matters: A cross-country analysis. Economics of Education,13(3), 215–226.
Little, RJA, & Rubin, DB. (2002). Statistical analysis with missing data (2nd ed.). New York: Wiley.Liu, OL, & Wilson, M. (2009). Gender differences in large-scale mathematics assessments: PISA Trend 2000 and 2003.
Applied Measurement in Education, 22(2), 164–184.Lubienski, ST. (2006). Examining instruction, achievement, and equity with NAEP mathematics data. Education Policy
Analysis Archives, 14(14). Retrieved Sep. 23, 2010 from http://epaa.asu.edu/ojs/article/view/85.Ma, X, & Kishor, N. (1997). Assessing the relationship between attitude toward mathematics and achievement in
mathematics: A meta-analysis. Journal for Research in Mathematics Education, 28(1), 26–47.Martin, MO, & Preuschoff, C. (2008). Creating the TIMSS 2007 Background Indices. In JF Olson, MO Martin, & IVS Mullis
(Eds.), TIMSS 2007 technical report (pp. 281–338). Chestnut Hill, MA: TIMSS & PIRLS International Study Center,Boston College.
McCoach, DB. (2010). Hierarchical linear modeling. In GR Hancock & RO Mueller (Eds.), Quantitative methods in the socialand behavioral sciences: A guide for researchers and reviewers (pp. 123–140). New York: Routledge.
Mewborn, DS. (2003). Teaching, teachers’ knowledge, and their professional development. In J Kilpatrick, WG Martin, &D Schifter (Eds.), A research companion to Principles and Standards for School Mathematics (pp. 45–52). Reston, VA:The National Council of Teachers of Mathematics, Inc.
Milanowski, A. (2004). The relationship between teacher performance evaluation scores and student achievement:Evidence from Cincinnati. Peabody Journal of Education, 79(4), 33–53.
Mullis, IVS, Martin, MO, Gonzalez, EJ, Gregory, KD, Garden, RA, O'Connor, KM, & Smith, TA. (2000). TIMSS 1999international mathematics report: Findings from IEA's repeat of the Third International Mathematics and Science Studyat the eighth grade. Chestnut Hill, MA: The International Study Center, Boston College.
Mullis, IVS, Martin, MO, Ruddock, GJ, O'Sullivan, CY, Arora, A, & Erberber, E. (2005). TIMSS 2007 assessment frameworks.Chestnut Hill, MA: TIMSS& PIRLS International Study Center, Lynch School of Education, Boston College.
Mullis, IVS, Martin, MO, Foy, P, Olson, JF, Preuschoff, C, Erberber, E, Arora, A, & Galia, J. (2008). TIMSS 2007 internationalmathematics report: Findings from IEA’s trends in international mathematics and science study at the fourth and eighthgrades. Chestnut Hill, MA: TIMSS & PIRLS International Study Center, Boston College.
National Council of Teachers of Mathematics. (2000). Principles and standards for school mathematics. Reston, VA: NCTM.Newmann, FM, Bryk, AS, & Nagaoka, JK. (2001). Authentic intellectual work and standardized tests: Conflict or coexistence?
Chicago: Consortium on Chicago School Research.OECD. (2010). PISA 2009 at a glance. Paris, France: OECD Publishing.Prawat, RS. (1989a). Teaching for understanding: Three key attributes. Teaching and Teacher Education, 5, 315–328.Prawat, RS. (1989b). Promoting access to knowledge, strategy, and disposition in students: A research synthesis.
Review of Educational Research, 59, 1–41.Raudenbush, SW, & Bryk, AS. (2002). Hierarchical linear models: Applications and data analysis methods (2nd ed.).
Thousand Oaks, CA: Sage.Robinson, JP, & Lubienski, ST. (2011). The development of gender achievement gaps in mathematics and reading
during elementary and middle school: Examining direct cognitive assessments and teacher ratings. AmericanEducational Research Journal, 48(2), 268–302.
Rothstein, R. (2004). Class and schools: Using social, economic, and educational reform to close the Black-White achievementgap. Washington, D.C.: Economic Policy Institute.
Rowan, B, Chiang, FS, & Miller, RJ. (1997). Using research on employees’ performance to study the effects of teacherson students’ achievement. Sociology of Education, 70, 256–284.
O’Dwyer et al. Large-scale Assessments in Education (2015) 3:1 Page 30 of 30
Rumberger, RW, & Palardy, GJ. (2005). Does segregation still matter? The impact of student composition on academicachievement in high school. Teachers College Record, 107(9), 1999–2045.
Schacter, J, & Thum, YM. (2004). Paying for high- and low-quality teaching. Economics of Education Review, 23, 411–430.Schmidt, WH, & Cogan, LS. (1996). Development of the TIMSS context questionnaires. In MO Martin & DL Kelly (Eds.), Third
international mathematics and science study technical report, volume I: design and development. Boston College: ChestnutHill, MA.
Schmidt, WH, Wang, HC, & McKnight, CC. (2005). Curriculum coherence: An examination of U.S. mathematics andscience content standards from an international perspective. Journal of Curriculum Studies, 37(5), 525–559.
Schreiber, JB. (2002). Institutional and student factors and their influence on advanced mathematics achievement.Journal of Educational Research, 95(5), 274–286.
Singh, K, Granville, M, & Dika, S. (2002). Mathematics and science achievement: Effects of motivation, interest, andacademic engagement. Journal of Educational Research, 95(6), 323–332.
Sirin, S. (2005). Socioeconomic status and academic achievement: A meta-analytic review of research. Review ofEducational Research, 75(3), 417–453.
Star, JR. (2005). Reconceptualizing procedural knowledge. Journal for Research in Mathematics Education, 36, 404–411.Tomoff, J, Thompson, M, & Behrens, J. (2000). Measuring NCTM-recommended practices and student achievement with
TIMSS (Paper presented at the annual meeting of the American Educational Research Association, New Orleans,LA).
VanTassel-Baska, J, Feng, A, MacFarlane, B, Heng, M, Teo, CT, Wong, ML, & Khong, BC. (2008). A cross-cultural study ofteachers’ instructional practices in Singapore and the United States. Journal for the Education of the Gifted, 31(3),338–363.
Votruba-Drzal, E. (2006). Economic disparities in middle childhood development: Does income matter? DevelopmentalPsychology, 42(6), 1154–1167.
Wenglinsky, H. (2002). How schools matter: The link between teacher classroom practices and student academicperformance. Education Policy Analysis Archives, 10(12), 1–30.
Whitman, NC, & Lai, MK. (1990). Similarities and differences in teachers' beliefs about effective teaching of mathematics:Japan and Hawai'i. Educational Studies in Mathematics, 21, 71–81.
Yeung, WJ, Linver, MR, & Brooks-Gunn, J. (2002). How money matters for young children’s development: Parental investmentand family processes. Child Development, 73(6), 1861–1879.
Submit your manuscript to a journal and benefi t from:
7 Convenient online submission
7 Rigorous peer review
7 Immediate publication on acceptance
7 Open access: articles freely available online
7 High visibility within the fi eld
7 Retaining the copyright to your article
Submit your next manuscript at 7 springeropen.com