Embed Size (px)
Citation preview

Connecticut State Teachers’ Retirement System
Actuarial Valuation
as of June 30, 2016
(Revised as of November 15, 2017)
November 15, 2017
Board of Directors
Connecticut State Teachers’ Retirement System
765 Asylum Avenue
Hartford, CT 06105
Members of the Board:
This revision of the June 30, 2016 valuation reflects changes contained in the enactment of Senate Bill 1502 (SB
1502), the State budget for the biennium ending June 30, 2019, which impact the valuation results for the fiscal years
ending 2018 and 2019. The laws governing the operation of the Connecticut State Teachers’ Retirement System
provide that actuarial valuations of the assets and liabilities of the System shall be made at least once every two years.
We have conducted the actuarial valuation of the System as of June 30, 2016 and the results of the valuation are
contained in the following report.
In performing the valuation, we relied on data supplied by the System and performed limited tests on the data for
consistency and reasonableness. The valuation was prepared in accordance with the funding objectives of the System
as set forth in Chapter 167a, Section 10-183z of the Connecticut General Statutes. The normal cost and accrued liability
of the System are developed using the entry age normal cost method. Under this method, the normal cost is the level
percent of payroll necessary to fully fund the expected benefits to be earned over the career of each individual active
member. The normal cost is partially funded with active member contributions with the remainder funded by employer
contributions. In this valuation, and due to enactment of SB 1502, the member contribution is increased from 6.0% to
7.0% of member salary effective January 1, 2018. Further, the increased member amount partially offsets the required
employer contribution amount during the biennium ending June 30, 2019.
In determining the System’s liabilities, future events, such as investment returns, salary increases, deaths, retirements,
etc., are anticipated based upon the set of actuarial assumptions as approved by the Board. Since the previous valuation,
several assumptions have been revised or updated as a result of the Experience Study for the Five-Year Period Ending
June 30, 2015. The assets of the system for valuation purposes are developed using an asset smoothing technique which
spreads the recognition of the unexpected portion of market related gains and losses over a period of four years with the
goal of dampening the impact of market volatility upon valuation results.
Off
Cavanaugh Macdonald CC OO NN SS UU LL TT II NN GG,, LL LL CC
The experience and dedication you deserve
3550 Busbee Pkwy, Suite 250, Kennesaw, GA 30144 Phone (678) 388-1700 • Fax (678) 388-1730
www.CavMacConsulting.com Offices in Englewood, CO • Kennesaw, GA • Bellevue, NE
An unfunded accrued liability exists in the amount equal to the excess of accrued liability over valuation assets. The
accrued liability contribution was determined in accordance with subsections (b) and (c) of Section 10-183z of the
Statutes. Based on the current valuation, the expected future contributions together with current assets will be sufficient
to provide the planned benefits. Therefore, in our opinion, the System continues to operate on an actuarially sound basis.
Future actuarial results may differ significantly from the current results presented in this report due to such factors as the
following: plan experience differing from that anticipated by the economic or demographic assumptions; changes in
economic or demographic assumptions; and changes in plan provisions or applicable law. Since the potential impact of
such factors is outside the scope of a normal annual actuarial valuation, an analysis of the range of results is not presented
herein.
This actuarial valuation was performed to determine the recommended funding amount for the System. The asset values
used to determine unfunded liabilities and funded ratios are not market values but less volatile market related values. A
smoothing technique is applied to market values to determine the market related values. The unfunded liability amounts
and funded ratios using the market value of assets would be different. The interest rate used for determining liabilities is
based on the expected return of assets. Therefore, liability amounts in this report cannot be used to assess a settlement
of the obligation.
This is to certify that the independent consulting actuary is a member of the American Academy of Actuaries and has
experience in performing valuations for public retirement systems, that the valuation was prepared in accordance with
principles of practice prescribed by the Actuarial Standards Board, and that the actuarial calculations were performed by
qualified actuaries in accordance with accepted actuarial procedures, based on the current provisions of the retirement
system and on actuarial assumptions and methods that are internally consistent and reasonable, based on the actual
experience of the System.
Respectfully submitted,
John J. Garrett, ASA, FCA, MAAA Cathy Turcot
Principal and Consulting Actuary Principal and Managing Director
Jonathan T. Craven, ASA, EA, FCA, MAAA Ben D. Mobley, ASA, ACA, MAAA
Consulting Actuary Actuary

TABLE OF CONTENTS
Section Item Page No.
I Board Summary 1
II Membership Data 4
III System Assets 5
IV System Liabilities 8
V Actuarial Valuation Results 11
VI Accounting Information 12
Appendices
A Membership Data 14
B Summary of Actuarial Assumptions and Methods 16
C Summary of Plan Provisions 20
D Glossary 23
Section I: Board Summary
Page 1
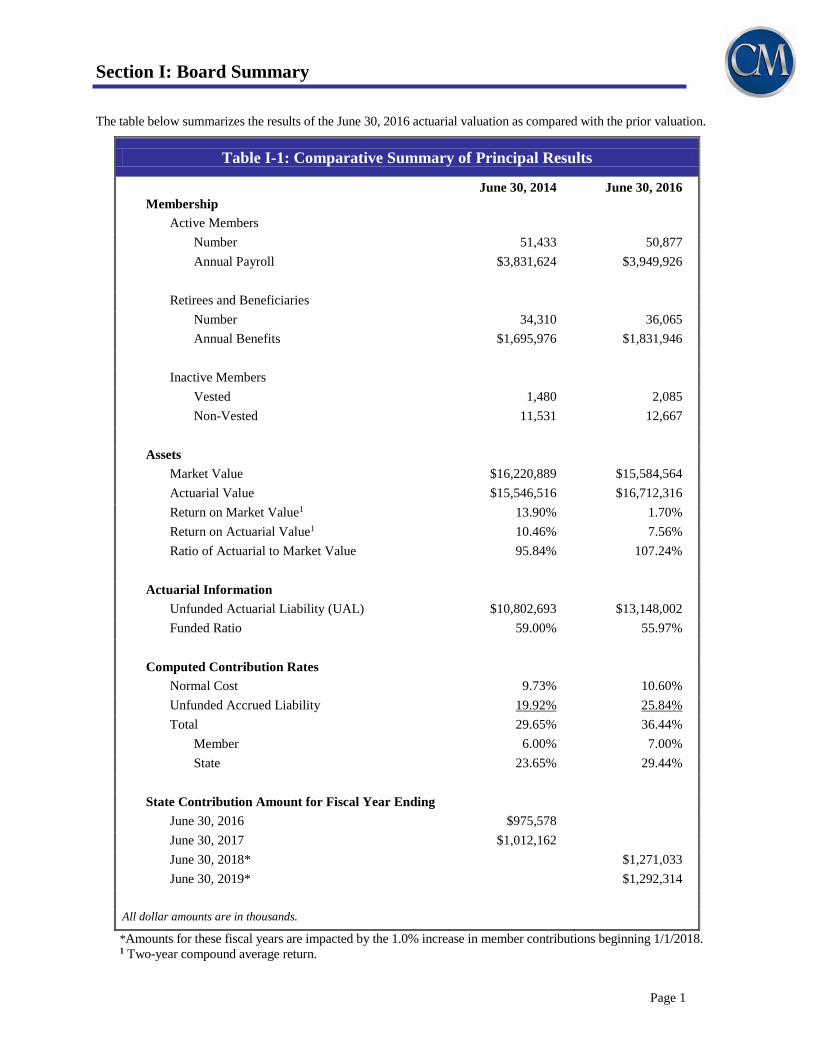
The table below summarizes the results of the June 30, 2016 actuarial valuation as compared with the prior valuation.
Table I-1: Comparative Summary of Principal Results
June 30, 2014 June 30, 2016
Membership
Active Members
Number 51,433 50,877
Annual Payroll $3,831,624 $3,949,926
Retirees and Beneficiaries
Number 34,310 36,065
Annual Benefits $1,695,976 $1,831,946
Inactive Members
Vested 1,480 2,085
Non-Vested 11,531 12,667
Assets
Market Value $16,220,889 $15,584,564
Actuarial Value $15,546,516 $16,712,316
Return on Market Value1 13.90% 1.70%
Return on Actuarial Value1 10.46% 7.56%
Ratio of Actuarial to Market Value 95.84% 107.24%
Actuarial Information
Unfunded Actuarial Liability (UAL) $10,802,693 $13,148,002
Funded Ratio 59.00% 55.97%
Computed Contribution Rates
Normal Cost 9.73% 10.60%
Unfunded Accrued Liability 19.92% 25.84%
Total 29.65% 36.44%
Member 6.00% 7.00%
State 23.65% 29.44%
State Contribution Amount for Fiscal Year Ending
June 30, 2016 $975,578
June 30, 2017 $1,012,162
June 30, 2018* $1,271,033
June 30, 2019* $1,292,314
All dollar amounts are in thousands.
*Amounts for these fiscal years are impacted by the 1.0% increase in member contributions beginning 1/1/2018.
1 Two-year compound average return.
Section I: Board Summary
Page 2
Summary of Key Findings
The employer contribution rate for the System is used to pay the employer’s portion of the normal cost and to amortize
the unfunded actuarial accrued liability (UAAL). The revision due to SB 1502 increased the rate of salary members
are required to contribute which will increase the amount member’s accumulate contribution accounts. The expected
larger future contribution accounts will result in small increases to the accrued liability of active members and their
normal cost rate. The net effect of SB 1502 was to increase the total cost of the program by 0.09% and increase the
member contribution by 1.00% which results in a decrease to the actuarially determined employer contribution
(ADEC) of 0.91% of total expected payroll over the period from January 1, 2018 to June 30, 2019.
The actuarially determined normal cost contribution rate was 9.73% as of June 30, 2014 and increased to 10.60% as
of June 30, 2016. The unfunded actuarial accrued liability increased from $10.803 billion to $13.148 billion over the
two year period. The unfunded actuarial accrued liability rate increased from 19.92% to 25.84%. We note the
following key findings:
The UAAL grew by $2.213 billion due to changes in assumptions adopted by the board as a result of the
Experience Study for the Five-Year Period Ending June 30, 2015. The changes are summarized in
Appendix B.
The UAAL grew by $1.776 billion due to interest and decreased by $1.654 billion due to the amortization
payments over the two year period.
The System experienced actuarial losses on plan assets of $140 million for fiscal year 2015 and $153 million
for fiscal year 2016 as a result of the investment return on the actuarial value of assets being less than the
assumed rate. Table III-3 provides the calculation of the investment losses for the two- year period.
The System experienced net actuarial gains of $73 million as of June 30, 2015 and $231 million as of
June 30 2016 on plan liabilities due to non-investment related experience. Table IV-2 provides the
reconciliation of the UAAL which is summarized as follows:
1. The System provides post-retirement Cost-of-Living Adjustments based upon certain criteria set
forth in the statutes. For purposes of the valuation, the benefits paid to eligible retirees and
beneficiaries are expected to increase at a rate of 3.00% annually for members retired before
September 1992 and 2.00% for members retired on and after September 1, 1992 (1.75% for
members hired on or after July 1, 2007). The actual COLAs granted for members retired before
September 1, 1992 were 3.0% for 2015 and 3.0% for 2016. The actual COLAs granted for
members retired on and after September 1, 1992 were 1.7% for 2015 and 0.0% for 2016. This
resulted in a $42 million gain to the System in 2015 and a $270 million gain to the system in 2016.
2. In years where the salaries of active members increase less than expected, an actuarial gain occurs.
The System experienced a $109 million gain due to salary experience for 2015 and a $96 million
gain due to salary experience for 2016.

Section I: Board Summary
Page 3
3. In addition, there were other gains and losses primarily attributable to the System demographic
experience. The loss for 2015 was $78 million and the loss for 2016 increased plan liabilities by
$135 million.
Section II of the report provides summarized information on the membership data used in the valuation. Section III
of the report covers the System’s assets and Section IV of the report covers the System’s liabilities. The results of the
valuation are provided in Section V of the report and the accounting information is in Section VI. The appendices
provide additional information on: A) the System members; B) the actuarial assumptions and methods; and C) the
summary of plan provisions. In addition, Appendix D provides a glossary of actuarial terminology. It should be noted
that all information contained in this report for periods prior to June 30, 2009 was produced by a prior actuarial
consulting firm.
Section II: Membership Data
Page 4
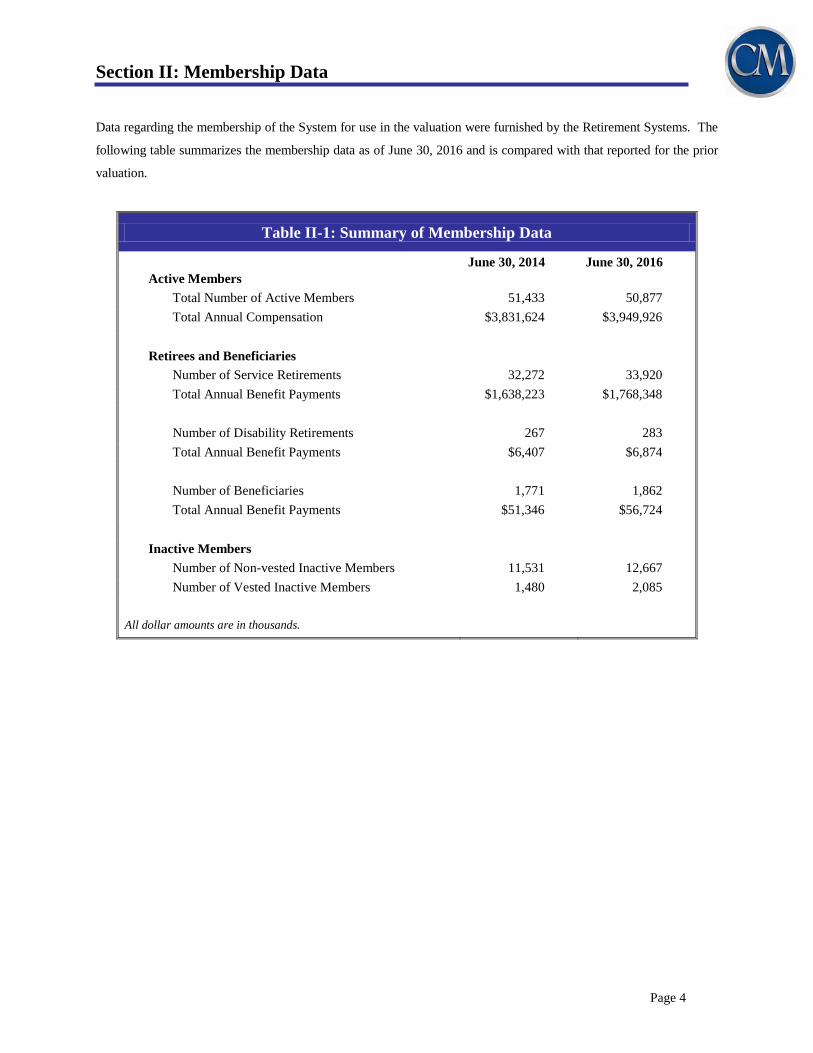
Data regarding the membership of the System for use in the valuation were furnished by the Retirement Systems. The
following table summarizes the membership data as of June 30, 2016 and is compared with that reported for the prior
valuation.
Table II-1: Summary of Membership Data
June 30, 2014 June 30, 2016
Active Members
Total Number of Active Members 51,433 50,877
Total Annual Compensation $3,831,624 $3,949,926
Retirees and Beneficiaries
Number of Service Retirements 32,272 33,920
Total Annual Benefit Payments $1,638,223 $1,768,348
Number of Disability Retirements 267 283
Total Annual Benefit Payments $6,407 $6,874
Number of Beneficiaries 1,771 1,862
Total Annual Benefit Payments $51,346 $56,724
Inactive Members
Number of Non-vested Inactive Members 11,531 12,667
Number of Vested Inactive Members 1,480 2,085
All dollar amounts are in thousands.

Section III: System Assets
Page 5
The following tables provide information on the System’s assets.
Table III-1: Market Value Reconciliation
2014 - 2015 2015 - 2016
Net Market Value as of July 1 $16,220,889 $16,225,777
Additions
State Contributions $984,110 $975,578
ERIP Contributions $ 669 $ 510
Employee Contributions $275,568 $290,557
Change in Net Appreciation $202,079 ($259,813)
Interest and Dividends $6,695 $8,587
Gain on Sale of Securities $359,504 $232,435
Total Additions $1,828,625 $1,247,854
Deductions
Benefit Payments ($1,823,737) ($1,889,067)
Net Increase $4,888 ($641,213)
Net Market Value as of June 30 $16,225,777 $15,584,564
Rate of Return on Market Value 3.55% (0.11)%
Two Year Compounded Return 1.70%
All dollar amounts are in thousands.
Section III: System Assets
Page 6
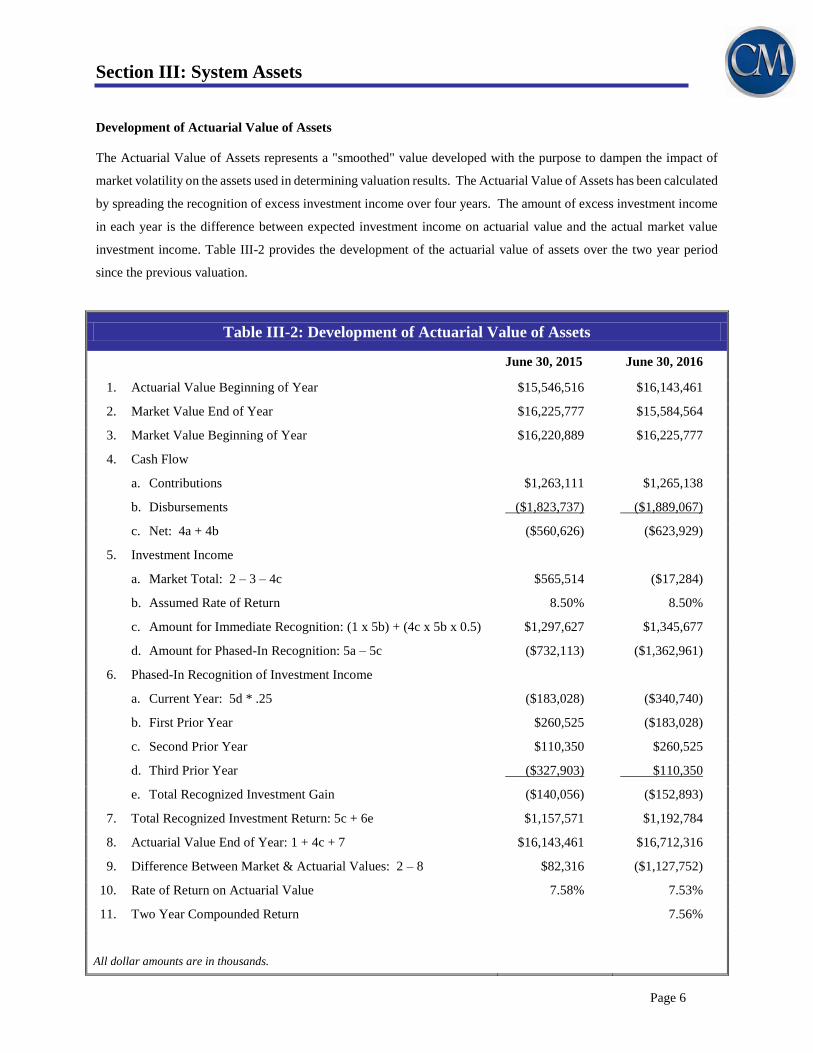
Development of Actuarial Value of Assets
The Actuarial Value of Assets represents a "smoothed" value developed with the purpose to dampen the impact of
market volatility on the assets used in determining valuation results. The Actuarial Value of Assets has been calculated
by spreading the recognition of excess investment income over four years. The amount of excess investment income
in each year is the difference between expected investment income on actuarial value and the actual market value
investment income. Table III-2 provides the development of the actuarial value of assets over the two year period
since the previous valuation.
Table III-2: Development of Actuarial Value of Assets
June 30, 2015 June 30, 2016
1. Actuarial Value Beginning of Year $15,546,516 $16,143,461
2. Market Value End of Year $16,225,777 $15,584,564
3. Market Value Beginning of Year $16,220,889 $16,225,777
4. Cash Flow
a. Contributions $1,263,111 $1,265,138
b. Disbursements ($1,823,737) ($1,889,067)
c. Net: 4a + 4b ($560,626) ($623,929)
5. Investment Income
a. Market Total: 2 – 3 – 4c $565,514 ($17,284)
b. Assumed Rate of Return 8.50% 8.50%
c. Amount for Immediate Recognition: (1 x 5b) + (4c x 5b x 0.5) $1,297,627 $1,345,677
d. Amount for Phased-In Recognition: 5a – 5c ($732,113) ($1,362,961)
6. Phased-In Recognition of Investment Income
a. Current Year: 5d * .25 ($183,028) ($340,740)
b. First Prior Year $260,525 ($183,028)
c. Second Prior Year $110,350 $260,525
d. Third Prior Year ($327,903) $110,350
e. Total Recognized Investment Gain ($140,056) ($152,893)
7. Total Recognized Investment Return: 5c + 6e $1,157,571 $1,192,784
8. Actuarial Value End of Year: 1 + 4c + 7 $16,143,461 $16,712,316
9. Difference Between Market & Actuarial Values: 2 – 8 $82,316 ($1,127,752)
10. Rate of Return on Actuarial Value 7.58% 7.53%
11. Two Year Compounded Return 7.56%
All dollar amounts are in thousands.
Section III: System Assets
Page 7
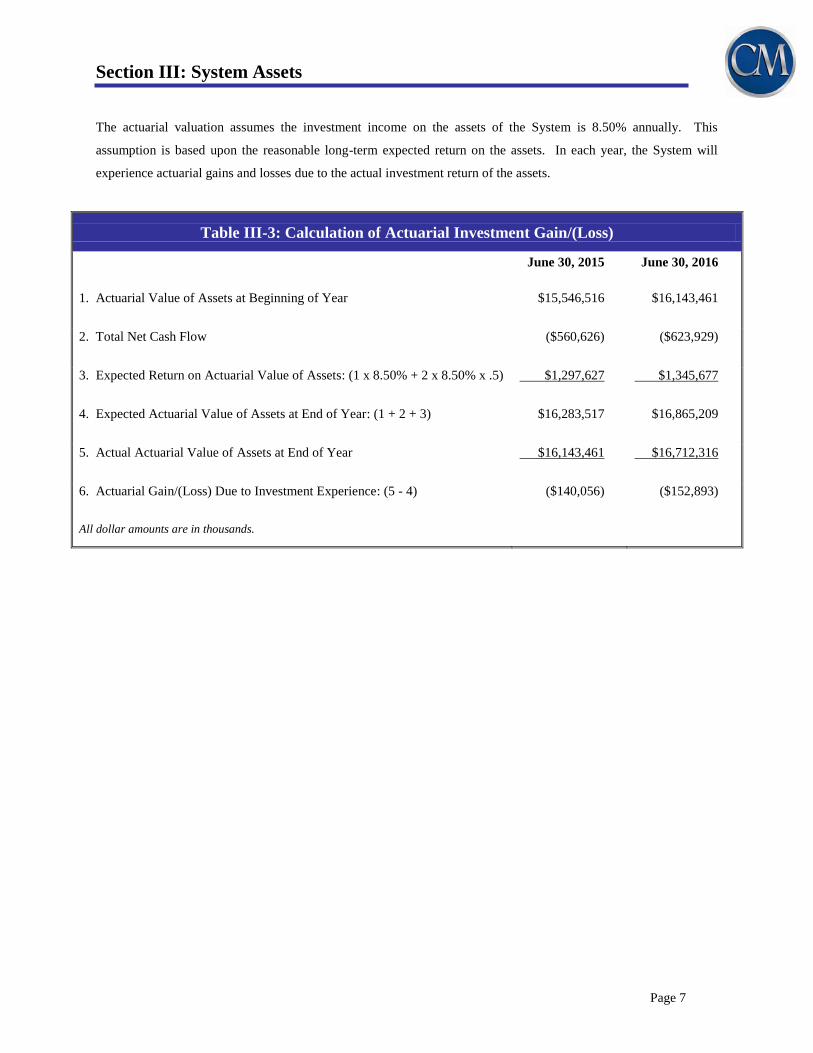
The actuarial valuation assumes the investment income on the assets of the System is 8.50% annually. This
assumption is based upon the reasonable long-term expected return on the assets. In each year, the System will
experience actuarial gains and losses due to the actual investment return of the assets.
Table III-3: Calculation of Actuarial Investment Gain/(Loss)
June 30, 2015 June 30, 2016
1. Actuarial Value of Assets at Beginning of Year $15,546,516 $16,143,461
2. Total Net Cash Flow ($560,626) ($623,929)
3. Expected Return on Actuarial Value of Assets: (1 x 8.50% + 2 x 8.50% x .5) $1,297,627 $1,345,677
4. Expected Actuarial Value of Assets at End of Year: (1 + 2 + 3) $16,283,517 $16,865,209
5. Actual Actuarial Value of Assets at End of Year $16,143,461 $16,712,316
6. Actuarial Gain/(Loss) Due to Investment Experience: (5 - 4) ($140,056) ($152,893)
All dollar amounts are in thousands.
Section IV: System Liabilities
Page 8
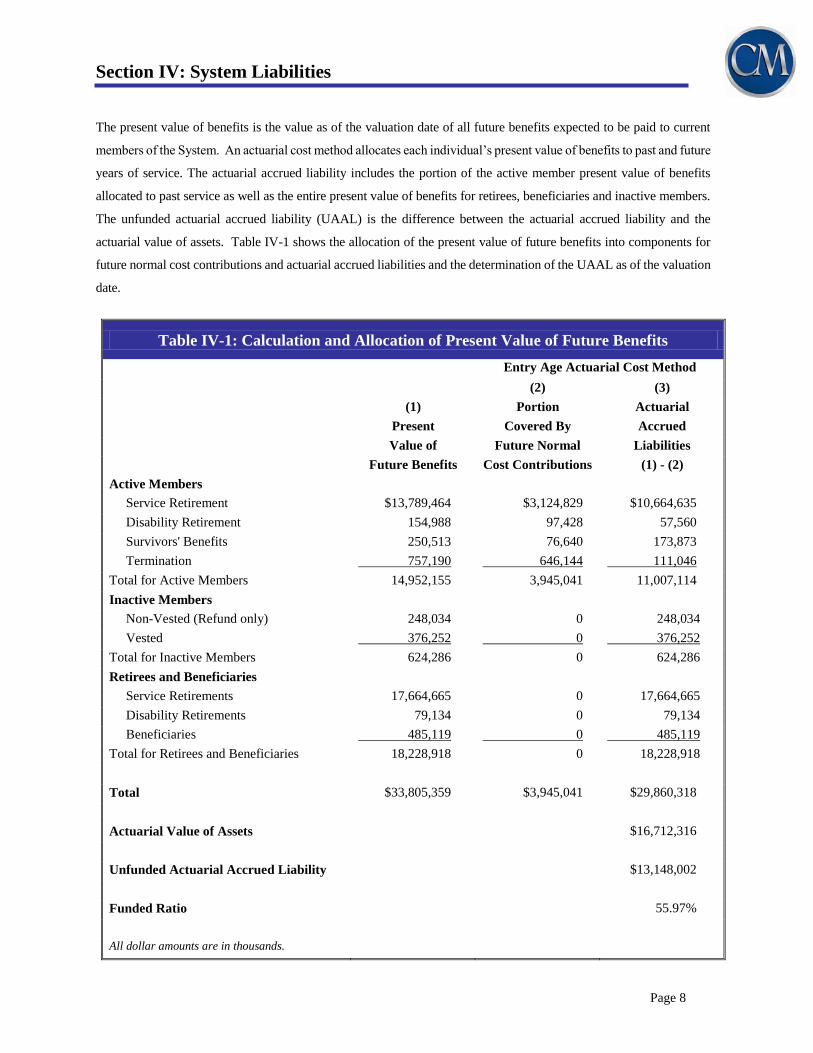
The present value of benefits is the value as of the valuation date of all future benefits expected to be paid to current
members of the System. An actuarial cost method allocates each individual’s present value of benefits to past and future
years of service. The actuarial accrued liability includes the portion of the active member present value of benefits
allocated to past service as well as the entire present value of benefits for retirees, beneficiaries and inactive members.
The unfunded actuarial accrued liability (UAAL) is the difference between the actuarial accrued liability and the
actuarial value of assets. Table IV-1 shows the allocation of the present value of future benefits into components for
future normal cost contributions and actuarial accrued liabilities and the determination of the UAAL as of the valuation
date.
Table IV-1: Calculation and Allocation of Present Value of Future Benefits
Entry Age Actuarial Cost Method
(2) (3)
(1) Portion Actuarial
Present Covered By Accrued
Value of Future Normal Liabilities
Future Benefits Cost Contributions (1) - (2)
Active Members
Service Retirement $13,789,464 $3,124,829 $10,664,635
Disability Retirement 154,988 97,428 57,560
Survivors' Benefits 250,513 76,640 173,873
Termination 757,190 646,144 111,046
Total for Active Members 14,952,155 3,945,041 11,007,114
Inactive Members
Non-Vested (Refund only) 248,034 0 248,034
Vested 376,252 0 376,252
Total for Inactive Members 624,286 0 624,286
Retirees and Beneficiaries
Service Retirements 17,664,665 0 17,664,665
Disability Retirements 79,134 0 79,134
Beneficiaries 485,119 0 485,119
Total for Retirees and Beneficiaries 18,228,918 0 18,228,918
Total $33,805,359 $3,945,041 $29,860,318
Actuarial Value of Assets $16,712,316
Unfunded Actuarial Accrued Liability $13,148,002
Funded Ratio 55.97%
All dollar amounts are in thousands.

Section IV: System Liabilities
Page 9
The funded ratio of the System is the ratio of the actuarial value of assets divided by the actuarial accrued liability as
of the valuation date. As of June 30, 2016, the funded ratio of the System is 55.97% as compared to the ratio in the
prior valuation of 59.00%. The decrease in the funded ratio is primarily attributable to the impact of the changes made
in the experience study. The ratio is a commonly used measure of the funding progress of a System and can be useful
in reviewing the historical trend of a System’s funding progress. Such a review should also consider the impact to
this measure over the historical period due to changes to plan benefits, changes to the actuarial assumptions and
methods, and the significant impact that investment experience can have on the ratio over short-term periods. We
caution that no single “point in time” measure can provide a universal basis for comparing one System to another.
Although the terminology used to describe the excess of the System’s actuarial accrued liability over the System’s
actuarial value of assets is called the “unfunded” actuarial accrued liability, there is a dedicated source of funding for
this liability. The scheduled employer and employee contributions are expected to completely fund the System’s
liabilities (pay off the UAAL) based on statutory funding requirements.
The calculation of the System’s actuarial liabilities require the use of several assumptions concerning the future
experience of the System and its members. In each valuation, the latest year of actual experience is compared to that
expected by the prior valuation. The differences are actuarial gains and losses which decrease or increase the UAAL.
Table IV-2 provides for the reconciliation of the UAAL and shows the primary sources of this year’s gains and losses
due to actuarial experience.

Section IV: System Liabilities
Page 10
Table IV-2: Reconciliation of the UAAL
1. UAAL as of June 30, 2014 $10,802,693
2. Expected Amortization Payment (831,963)
3. Expected Interest (1 x 8.50% + 2 x 8.50% x 0.5) 882,870
4. Expected End of Year UAAL (1 + 2 + 3) $10,853,600
5. Actuarial Experience (Gain)/Loss
Asset Experience 140,056
COLA (42,252)
Salary Experience (108,529)
Post-retirement Mortality 68,936
Retirements 50,163
Turnover and Other (40,904)
Total Actuarial (Gain)/Loss $67,470
6. UAAL as of June 30, 2015 (4 + 5) $10,921,070
7. Expected Amortization Payment (821,738)
8. Expected Interest (6 x 8.50% + 7 x 8.50% x 0.5) 893,367
9. Expected End of Year UAAL (6 + 7 + 8) $10,992,699
10. Actuarial Experience (Gain)/Loss
Assumption Change 2,213,190
Asset Experience 152,893
COLA (270,068)
Salary Experience (96,405)
Post-retirement Mortality 65,345
Retirements (8,272)
Turnover and Other 78,227
Changes due to SB 1502 20,393
Total Actuarial (Gain)/Loss $2,155,303
11. UAAL as of June 30, 2016 (9 + 10) $13,148,002
All dollar amounts are in thousands.

Section V: Actuarial Valuation Results
Page 11
Section IV of this report presented the System’s total present value of future benefits allocated between the present
value of future normal cost contributions and actuarial accrued liability. The portion of the active members’ present
value of benefits allocated to future years of service is funded through annual normal cost contributions comprised of
both active member and employer contributions. The System’s annual normal cost rate is calculated as a percent of
covered payroll, which is expected to remain level over all future years of service. The portion of the total normal
cost rate in excess of the active member contribution rate is the state normal cost rate. The normal cost rate developed
as of the valuation date is presented in Table V-1. Table V-1 also shows the state contribution rates necessary to
amortize the UAAL in accordance with the funding requirements in the statutes.
Table V-1: State Contribution Rate
Normal Cost Rate of Active Members by Expected Benefit Type
Service Retirement 8.40%
Termination 1.71%
Disability Retirement 0.28%
Survivors' Benefits 0.21%
Total Normal Cost Rate for Active Members 10.60%
Less: Active Member Contribution Rate 7.00%
State Normal Cost Rate 3.60%
Unfunded Actuarial Accrued Liabilities
Plan in effect 6/30/1991 (15 years) 28.72%
Public Act 87-381 (1 years) 0.01%
Public Act 92-205 (6 years) (4.84)%
Public Act 98-251 (11 years) 0.02%
Public Act 07-186 (21 years) 1.93%
Total 25.84%
State Contribution Rate* 29.44%
* Rate applies only for period from 1/1/2018 to 6/30/2019. State Contribution Rate is expected to be 1.00%
higher for periods thereafter.
Section VI: Accounting Statement Information
Page 12
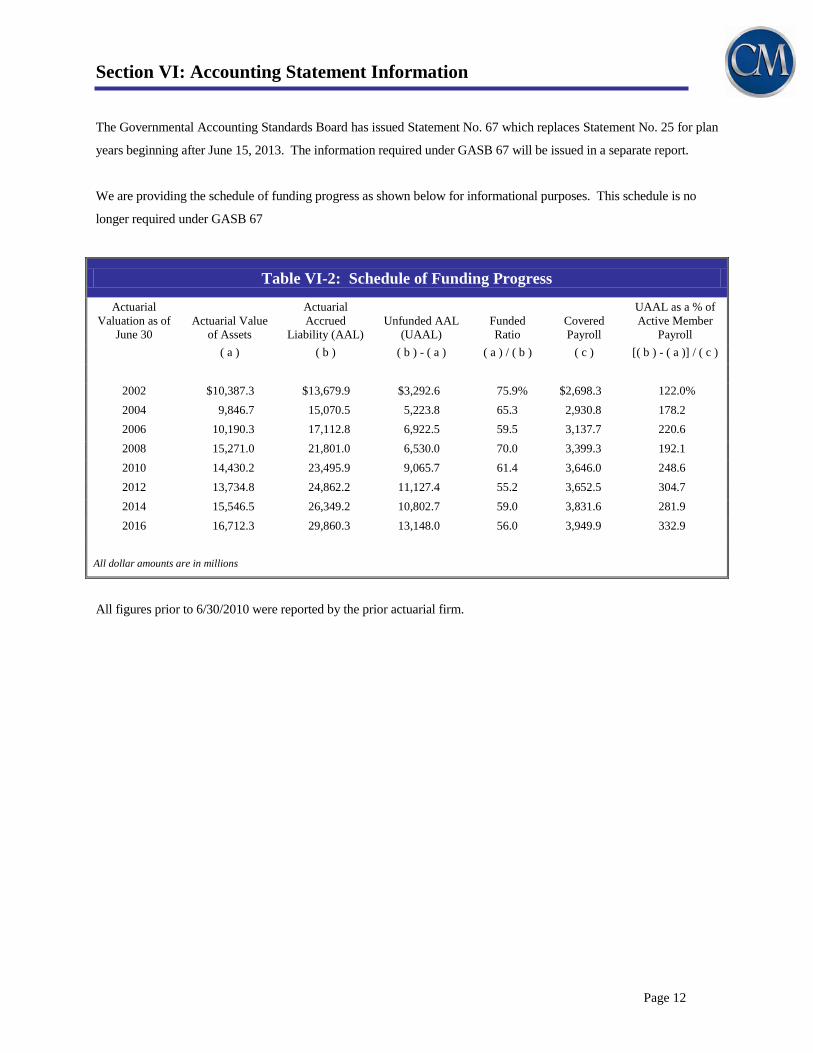
The Governmental Accounting Standards Board has issued Statement No. 67 which replaces Statement No. 25 for plan
years beginning after June 15, 2013. The information required under GASB 67 will be issued in a separate report.
We are providing the schedule of funding progress as shown below for informational purposes. This schedule is no
longer required under GASB 67
Table VI-2: Schedule of Funding Progress
Actuarial
Valuation as of
June 30
Actuarial Value
of Assets
Actuarial
Accrued
Liability (AAL)
Unfunded AAL
(UAAL)
Funded
Ratio
Covered
Payroll
UAAL as a % of
Active Member
Payroll
( a ) ( b ) ( b ) - ( a ) ( a ) / ( b ) ( c ) [( b ) - ( a )] / ( c )
2002 $10,387.3 $13,679.9 $3,292.6 75.9% $2,698.3 122.0%
2004 9,846.7 15,070.5 5,223.8 65.3 2,930.8 178.2
2006 10,190.3 17,112.8 6,922.5 59.5 3,137.7 220.6
2008 15,271.0 21,801.0 6,530.0 70.0 3,399.3 192.1
2010 14,430.2 23,495.9 9,065.7 61.4 3,646.0 248.6
2012 13,734.8 24,862.2 11,127.4 55.2 3,652.5 304.7
2014 15,546.5 26,349.2 10,802.7 59.0 3,831.6 281.9
2016 16,712.3 29,860.3 13,148.0 56.0 3,949.9 332.9
All dollar amounts are in millions
All figures prior to 6/30/2010 were reported by the prior actuarial firm.
Section VI: Accounting Statement Information
Page 13
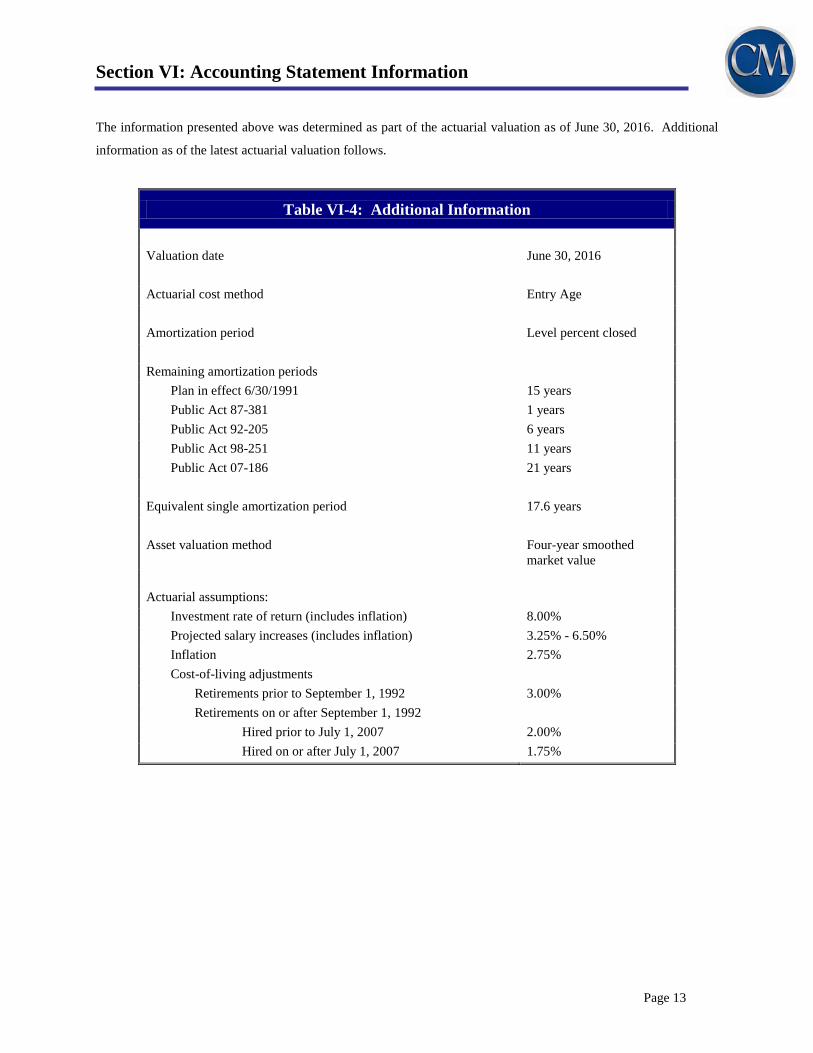
The information presented above was determined as part of the actuarial valuation as of June 30, 2016. Additional
information as of the latest actuarial valuation follows.
Table VI-4: Additional Information
Valuation date June 30, 2016
Actuarial cost method Entry Age
Amortization period Level percent closed
Remaining amortization periods
Plan in effect 6/30/1991 15 years
Public Act 87-381 1 years
Public Act 92-205 6 years
Public Act 98-251 11 years
Public Act 07-186 21 years
Equivalent single amortization period 17.6 years
Asset valuation method Four-year smoothed
market value
Actuarial assumptions:
Investment rate of return (includes inflation) 8.00%
Projected salary increases (includes inflation) 3.25% - 6.50%
Inflation 2.75%
Cost-of-living adjustments
Retirements prior to September 1, 1992 3.00%
Retirements on or after September 1, 1992
Hired prior to July 1, 2007 2.00%
Hired on or after July 1, 2007 1.75%
Appendix A: Additional Membership Data
Page 14
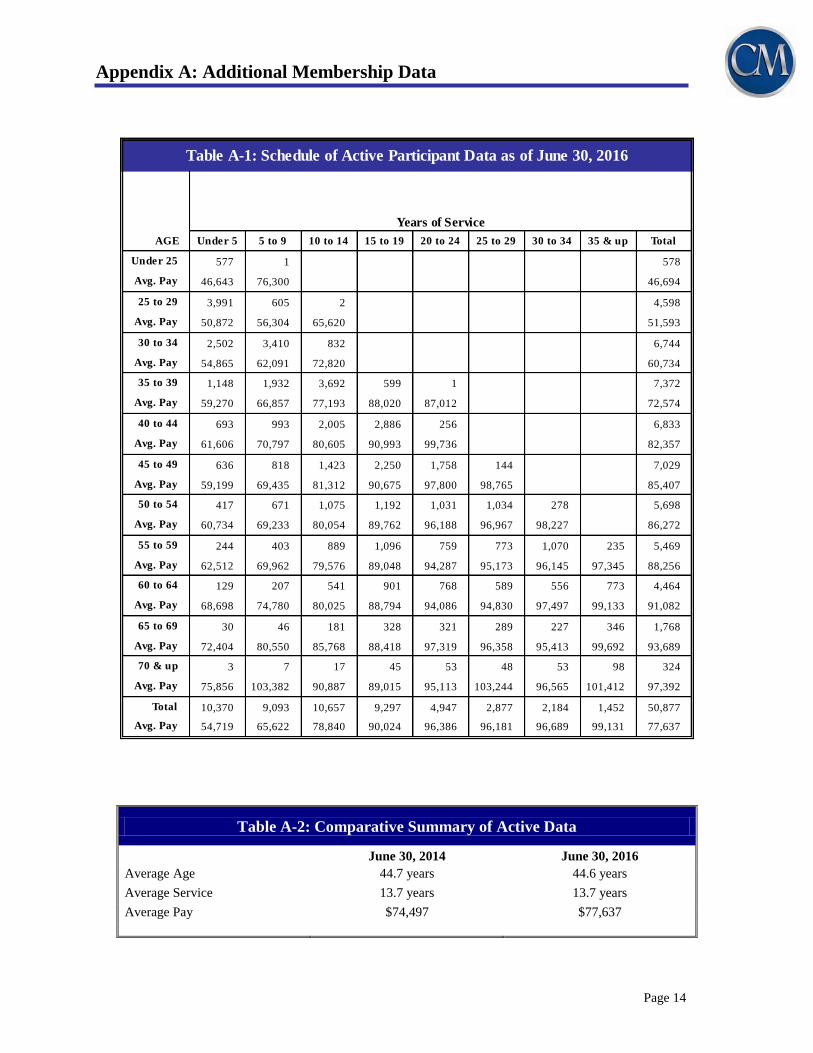
Table A-2: Comparative Summary of Active Data
June 30, 2014 June 30, 2016
Average Age 44.7 years 44.6 years
Average Service 13.7 years 13.7 years
Average Pay $74,497 $77,637
AGE Under 5 5 to 9 10 to 14 15 to 19 20 to 24 25 to 29 30 to 34 35 & up Total
Under 25 577 1 578
Avg. Pay 46,643 76,300 46,694
25 to 29 3,991 605 2 4,598
Avg. Pay 50,872 56,304 65,620 51,593
30 to 34 2,502 3,410 832 6,744
Avg. Pay 54,865 62,091 72,820 60,734
35 to 39 1,148 1,932 3,692 599 1 7,372
Avg. Pay 59,270 66,857 77,193 88,020 87,012 72,574
40 to 44 693 993 2,005 2,886 256 6,833
Avg. Pay 61,606 70,797 80,605 90,993 99,736 82,357
45 to 49 636 818 1,423 2,250 1,758 144 7,029
Avg. Pay 59,199 69,435 81,312 90,675 97,800 98,765 85,407
50 to 54 417 671 1,075 1,192 1,031 1,034 278 5,698
Avg. Pay 60,734 69,233 80,054 89,762 96,188 96,967 98,227 86,272
55 to 59 244 403 889 1,096 759 773 1,070 235 5,469
Avg. Pay 62,512 69,962 79,576 89,048 94,287 95,173 96,145 97,345 88,256
60 to 64 129 207 541 901 768 589 556 773 4,464
Avg. Pay 68,698 74,780 80,025 88,794 94,086 94,830 97,497 99,133 91,082
65 to 69 30 46 181 328 321 289 227 346 1,768
Avg. Pay 72,404 80,550 85,768 88,418 97,319 96,358 95,413 99,692 93,689
70 & up 3 7 17 45 53 48 53 98 324
Avg. Pay 75,856 103,382 90,887 89,015 95,113 103,244 96,565 101,412 97,392
Total 10,370 9,093 10,657 9,297 4,947 2,877 2,184 1,452 50,877
Avg. Pay 54,719 65,622 78,840 90,024 96,386 96,181 96,689 99,131 77,637
Table A-1: Schedule of Active Participant Data as of June 30, 2016
Years of Service

Appendix A: Additional Membership Data
Page 15
Payee Type Number
Service Retirement
A (Life Annuity) 30
B (100% Cash Refund) 40
C (Period Certain and Life) 673
D (Joint and Survivor) 6,972
N (25% Cash Refund) 26,205
Total 33,920
Disability Retirement
A (Life Annuity) 0
B (100% Cash Refund) 0
C (Period Certain and Life) 2
D (Joint and Survivor) 0
N (25% Cash Refund) 1
W (Disability) 280
Total 283
Beneficiaries 1,862
GRAND TOTAL 36,065
Monthly Retirement
Allowances
567,467
$4,727,000
$152,662,186
$0
0
3,571
0
1,798
$572,836
33,002,727
111,762,294
$147,362,350
2,404,060
Table A-3: Number of Monthly Retirement Allowances Of
Benefit Recipients as of June 30, 2016
$77,330
115,939

Appendix B: Actuarial Assumptions and Methods
Page 16
Investment Rate of Return
Assumed annual rate of 8.00% net of investment expenses.
Rates of Annual Salary Increase
Rates of Annual Salary Increase
Assumption
Years of Service
0 6.50%
1 6.50
2 6.25
3 6.25
4 6.25
5 6.25
6 6.25
7 6.25
8 6.25
9 6.25
10 5.50
11 5.50
12 5.00
13 5.00
14 5.00
15 4.75
16 4.50
17 4.25
18 4.00
19 3.75
20 3.50
21+ 3.25

Appendix B: Actuarial Assumptions and Methods
Page 17
Active Member Decrement Rates
a. Table below provides a summary of the assumed rates of service retirement.
Annual Rates of Retirement
Age Unreduced Proratable Reduced
Male Female Male Female Male Female
50 27.5% 27.5% 1.00% 1.00%
55 38.5% 27.5% 4.00% 4.75%
60 22.0% 27.5% 6.0% 5.5%
65 36.3% 32.5% 13.0% 12.5%
70 100.0% 32.5% 30.0% 14.5%
75 100.0% 32.5% 30.0% 18.0%
80 100.0% 100.0% 100.0% 100.0%
b. Table below provides a summary of the assumed rates of mortality while actively employed and disability.
Annual Rates of Death and Disability
Age Pre-Retirement Mortality Disability
Male Female Male Female
20 0.0377% 0.0147% 0.0341% 0.0500%
25 0.0412% 0.0162% 0.0341% 0.0500%
30 0.0404% 0.0205% 0.0341% 0.0410%
35 0.0448% 0.0272% 0.0341% 0.0410%
40 0.0539% 0.0375% 0.0536% 0.0720%
45 0.0818% 0.0622% 0.1219% 0.1200%
50 0.1476% 0.1116% 0.2438% 0.2630%
55 0.2800% 0.1927% 0.5363% 0.4380%
60 0.4557% 0.2914% 0.9604% 0.5000%
64 0.6572% 0.4272%
Appendix B: Actuarial Assumptions and Methods
Page 18
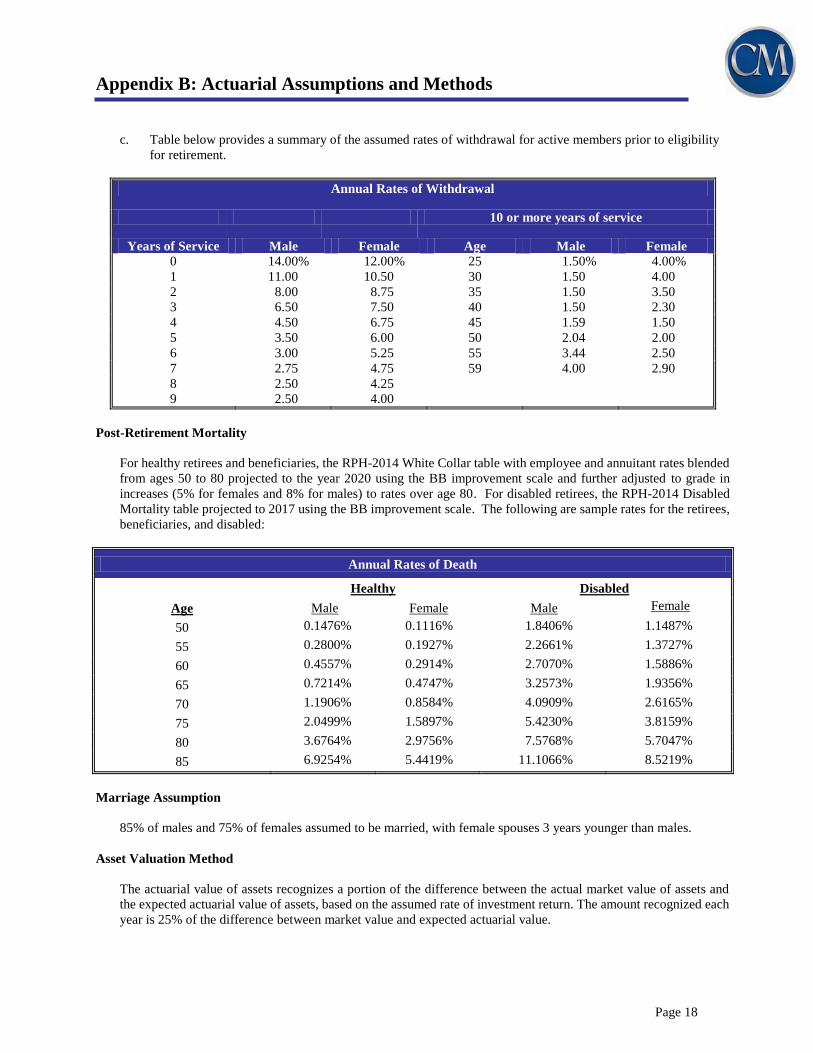
c. Table below provides a summary of the assumed rates of withdrawal for active members prior to eligibility
for retirement.
Annual Rates of Withdrawal
10 or more years of service
Years of Service Male Female Age Male Female
0 14.00% 12.00% 25 1.50% 4.00%
1 11.00 10.50 30 1.50 4.00
2 8.00 8.75 35 1.50 3.50
3 6.50 7.50 40 1.50 2.30
4 4.50 6.75 45 1.59 1.50
5 3.50 6.00 50 2.04 2.00
6 3.00 5.25 55 3.44 2.50
7 2.75 4.75 59 4.00 2.90
8 2.50 4.25
9 2.50 4.00
Post-Retirement Mortality
For healthy retirees and beneficiaries, the RPH-2014 White Collar table with employee and annuitant rates blended
from ages 50 to 80 projected to the year 2020 using the BB improvement scale and further adjusted to grade in
increases (5% for females and 8% for males) to rates over age 80. For disabled retirees, the RPH-2014 Disabled
Mortality table projected to 2017 using the BB improvement scale. The following are sample rates for the retirees,
beneficiaries, and disabled:
Annual Rates of Death
Healthy Disabled
Age Male Female Male Female
50 0.1476% 0.1116% 1.8406% 1.1487%
55 0.2800% 0.1927% 2.2661% 1.3727%
60 0.4557% 0.2914% 2.7070% 1.5886%
65 0.7214% 0.4747% 3.2573% 1.9356%
70 1.1906% 0.8584% 4.0909% 2.6165%
75 2.0499% 1.5897% 5.4230% 3.8159%
80 3.6764% 2.9756% 7.5768% 5.7047%
85 6.9254% 5.4419% 11.1066% 8.5219%
Marriage Assumption
85% of males and 75% of females assumed to be married, with female spouses 3 years younger than males.
Asset Valuation Method
The actuarial value of assets recognizes a portion of the difference between the actual market value of assets and
the expected actuarial value of assets, based on the assumed rate of investment return. The amount recognized each
year is 25% of the difference between market value and expected actuarial value.

Appendix B: Actuarial Assumptions and Methods
Page 19
Actuarial Cost Method
The Entry Age Normal actuarial cost method allocates the plan’s actuarial present value of future benefits to various
periods based upon service. The portion of the present value of future benefits allocated to years of service prior to
the valuation date is the actuarial accrued liability, and the portion allocated to years following the valuation date is
the present value of future normal costs. The normal cost is determined for each active member as the level percent
of payroll necessary to fully fund the expected benefits to be earned over the career of each individual active
member. The normal cost is partially funded with active member contributions with the remainder funded by
employer contributions.
The unfunded accrued liability is determined by subtracting the actuarial value of assets from the actuarial accrued
liability.
Future Cost-of-living Increases
Members who retired prior to September 1, 1992 are assumed to receive an annual Cost-of-Living Adjustment
(COLA) of 3.0%. Members who retired on or after September 1, 1992 and were hired prior to July 1, 2007 are
assumed to receive an annual Cost-of-Living Adjustment (COLA) of 2.0%. Members who retired on or after
September 1, 1992 and were hired on or after July 1, 2007 are assumed to receive an annual Cost-of-Living
Adjustment (COLA) of 1.75%.
Administrative and Investment Expenses
The investment return assumption represents the expected return net of all administrative and investment expenses.
Payroll Growth Rate
The total annual payroll of active members is assumed to increase at an annual rate of 3.25%. This rate does not
anticipate increases in the number of members.
Changes from Prior Valuation
Since the prior valuation, the Board adopted new assumptions based on the 2015 Experience Study. The changes
in assumptions are summarized below:
Economic Assumptions
1. Reduce the inflation assumption from 3.00% to 2.75%.
2. Reduce the real rate of return assumption from 5.50% to 5.25% which, when combined with the inflation
assumption change results in a decrease in the investment rate of return assumption from 8.50% to 8.00%.
3. Reduce the annual rate of wage increase assumption from 0.75% to 0.50%.
4. Slightly modify the merit portion of the salary scale.
5. Reduce the payroll growth assumption from 3.75% to 3.25%.
Demographic Assumptions
6. Update mortality tables to projected versions of the RPH-2014 mortality tables.
7. Increase normal retirement rates for females at most ages and proratable retirement rates for males at most
ages. Decrease early retirement rates for both males and females.
8. Increase rates of withdrawal.
9. Decrease rates of disability for males.
Appendix C: Summary of Plan Provisions
Page 20
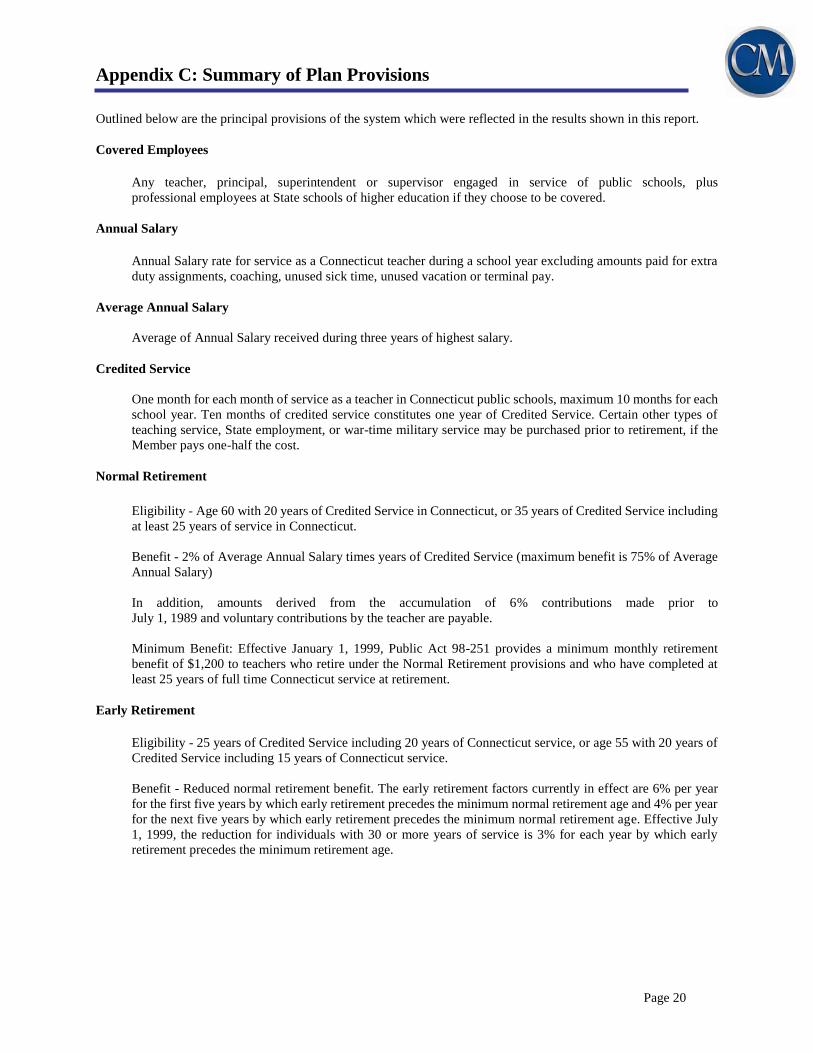
Outlined below are the principal provisions of the system which were reflected in the results shown in this report.
Covered Employees
Any teacher, principal, superintendent or supervisor engaged in service of public schools, plus
professional employees at State schools of higher education if they choose to be covered.
Annual Salary
Annual Salary rate for service as a Connecticut teacher during a school year excluding amounts paid for extra
duty assignments, coaching, unused sick time, unused vacation or terminal pay.
Average Annual Salary
Average of Annual Salary received during three years of highest salary.
Credited Service
One month for each month of service as a teacher in Connecticut public schools, maximum 10 months for each
school year. Ten months of credited service constitutes one year of Credited Service. Certain other types of
teaching service, State employment, or war-time military service may be purchased prior to retirement, if the
Member pays one-half the cost.
Normal Retirement
Eligibility - Age 60 with 20 years of Credited Service in Connecticut, or 35 years of Credited Service including
at least 25 years of service in Connecticut.
Benefit - 2% of Average Annual Salary times years of Credited Service (maximum benefit is 75% of Average
Annual Salary)
In addition, amounts derived from the accumulation of 6% contributions made prior to
July 1, 1989 and voluntary contributions by the teacher are payable.
Minimum Benefit: Effective January 1, 1999, Public Act 98-251 provides a minimum monthly retirement
benefit of $1,200 to teachers who retire under the Normal Retirement provisions and who have completed at
least 25 years of full time Connecticut service at retirement.
Early Retirement
Eligibility - 25 years of Credited Service including 20 years of Connecticut service, or age 55 with 20 years of
Credited Service including 15 years of Connecticut service.
Benefit - Reduced normal retirement benefit. The early retirement factors currently in effect are 6% per year
for the first five years by which early retirement precedes the minimum normal retirement age and 4% per year
for the next five years by which early retirement precedes the minimum normal retirement age. Effective July
1, 1999, the reduction for individuals with 30 or more years of service is 3% for each year by which early
retirement precedes the minimum retirement age.
Appendix C: Summary of Plan Provisions
Page 21
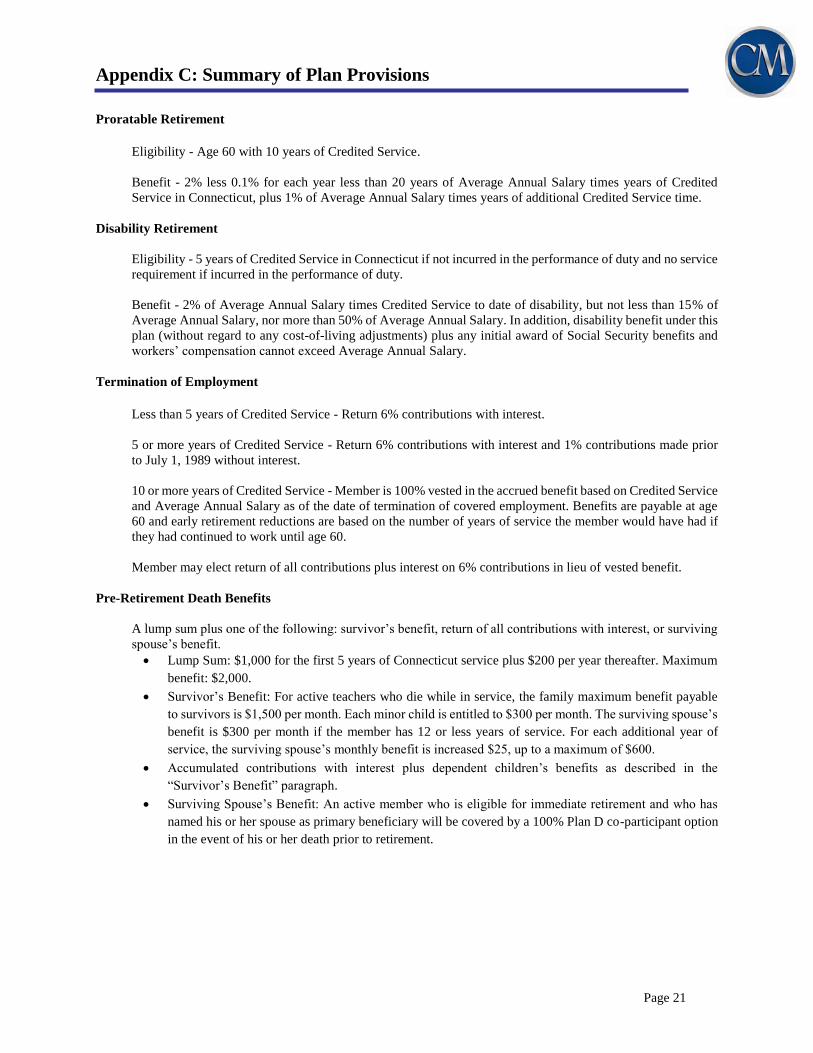
Proratable Retirement
Eligibility - Age 60 with 10 years of Credited Service.
Benefit - 2% less 0.1% for each year less than 20 years of Average Annual Salary times years of Credited
Service in Connecticut, plus 1% of Average Annual Salary times years of additional Credited Service time.
Disability Retirement
Eligibility - 5 years of Credited Service in Connecticut if not incurred in the performance of duty and no service
requirement if incurred in the performance of duty.
Benefit - 2% of Average Annual Salary times Credited Service to date of disability, but not less than 15% of
Average Annual Salary, nor more than 50% of Average Annual Salary. In addition, disability benefit under this
plan (without regard to any cost-of-living adjustments) plus any initial award of Social Security benefits and
workers’ compensation cannot exceed Average Annual Salary.
Termination of Employment
Less than 5 years of Credited Service - Return 6% contributions with interest.
5 or more years of Credited Service - Return 6% contributions with interest and 1% contributions made prior
to July 1, 1989 without interest.
10 or more years of Credited Service - Member is 100% vested in the accrued benefit based on Credited Service
and Average Annual Salary as of the date of termination of covered employment. Benefits are payable at age
60 and early retirement reductions are based on the number of years of service the member would have had if
they had continued to work until age 60.
Member may elect return of all contributions plus interest on 6% contributions in lieu of vested benefit.
Pre-Retirement Death Benefits
A lump sum plus one of the following: survivor’s benefit, return of all contributions with interest, or surviving
spouse’s benefit.
Lump Sum: $1,000 for the first 5 years of Connecticut service plus $200 per year thereafter. Maximum
benefit: $2,000.
Survivor’s Benefit: For active teachers who die while in service, the family maximum benefit payable
to survivors is $1,500 per month. Each minor child is entitled to $300 per month. The surviving spouse’s
benefit is $300 per month if the member has 12 or less years of service. For each additional year of
service, the surviving spouse’s monthly benefit is increased $25, up to a maximum of $600.
Accumulated contributions with interest plus dependent children’s benefits as described in the
“Survivor’s Benefit” paragraph.
Surviving Spouse’s Benefit: An active member who is eligible for immediate retirement and who has
named his or her spouse as primary beneficiary will be covered by a 100% Plan D co-participant option
in the event of his or her death prior to retirement.
Appendix C: Summary of Plan Provisions
Page 22
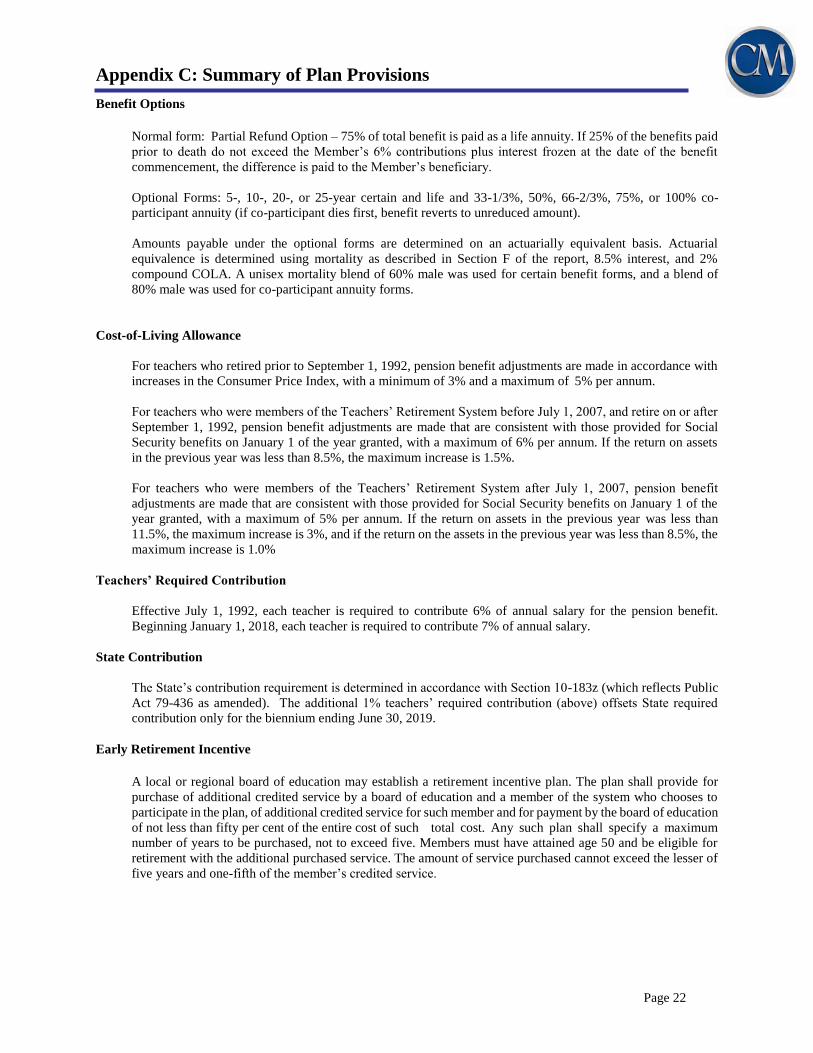
Benefit Options
Normal form: Partial Refund Option – 75% of total benefit is paid as a life annuity. If 25% of the benefits paid
prior to death do not exceed the Member’s 6% contributions plus interest frozen at the date of the benefit
commencement, the difference is paid to the Member’s beneficiary.
Optional Forms: 5-, 10-, 20-, or 25-year certain and life and 33-1/3%, 50%, 66-2/3%, 75%, or 100% co-
participant annuity (if co-participant dies first, benefit reverts to unreduced amount).
Amounts payable under the optional forms are determined on an actuarially equivalent basis. Actuarial
equivalence is determined using mortality as described in Section F of the report, 8.5% interest, and 2%
compound COLA. A unisex mortality blend of 60% male was used for certain benefit forms, and a blend of
80% male was used for co-participant annuity forms.
Cost-of-Living Allowance
For teachers who retired prior to September 1, 1992, pension benefit adjustments are made in accordance with
increases in the Consumer Price Index, with a minimum of 3% and a maximum of 5% per annum.
For teachers who were members of the Teachers’ Retirement System before July 1, 2007, and retire on or after
September 1, 1992, pension benefit adjustments are made that are consistent with those provided for Social
Security benefits on January 1 of the year granted, with a maximum of 6% per annum. If the return on assets
in the previous year was less than 8.5%, the maximum increase is 1.5%.
For teachers who were members of the Teachers’ Retirement System after July 1, 2007, pension benefit
adjustments are made that are consistent with those provided for Social Security benefits on January 1 of the
year granted, with a maximum of 5% per annum. If the return on assets in the previous year was less than
11.5%, the maximum increase is 3%, and if the return on the assets in the previous year was less than 8.5%, the
maximum increase is 1.0%
Teachers’ Required Contribution
Effective July 1, 1992, each teacher is required to contribute 6% of annual salary for the pension benefit.
Beginning January 1, 2018, each teacher is required to contribute 7% of annual salary.
State Contribution
The State’s contribution requirement is determined in accordance with Section 10-183z (which reflects Public
Act 79-436 as amended). The additional 1% teachers’ required contribution (above) offsets State required
contribution only for the biennium ending June 30, 2019.
Early Retirement Incentive
A local or regional board of education may establish a retirement incentive plan. The plan shall provide for
purchase of additional credited service by a board of education and a member of the system who chooses to
participate in the plan, of additional credited service for such member and for payment by the board of education
of not less than fifty per cent of the entire cost of such total cost. Any such plan shall specify a maximum
number of years to be purchased, not to exceed five. Members must have attained age 50 and be eligible for
retirement with the additional purchased service. The amount of service purchased cannot exceed the lesser of
five years and one-fifth of the member’s credited service.
Appendix C: Summary of Plan Provisions
Page 23
Actuarial Accrued Liability - The difference between the actuarial present value of future benefits payments and the
actuarial present value of future normal costs. Also referred to as “accrued liability.”
Actuarial Assumptions - Estimates of expected future experience with respect to rates of mortality, disability,
turnover, retirement, rate or rates of investment income and salary increases. Demographic estimates (rates of
mortality, disability, turnover and retirement) are generally based on past experience, modified for projected changes
in conditions. Fiscal estimates (salary increases, inflation and real investment return) consist of the underlying rates
in an inflation-free environment plus a provision for a long-term average rate of inflation.
Actuarial Cost Method - A mathematical budgeting procedure for allocating the dollar amount of the “actuarial
present value of future benefit payments” between future normal cost and actuarial accrued liability.
Actuarial Present Value - The amount of funds currently required to provide a payment or series of payments in the
future. It is determined by discounting future payments at predetermined rates of interest and by probabilities of
payment. Also referred to as “present value.”
Actuarial Value of Assets - The value of current plan assets recognized for valuation purposes.
Amortization - Paying off an interest-discounted amount with periodic payments of interest and principal, as opposed
to paying off with a lump sum payment.
Experience Gain (Loss) - A measure of difference between actual experience and that expected based upon a set of
actuarial assumptions during the period between two actuarial valuation dates, in accordance with the actuarial cost
method being used.
Normal Cost - The annual cost assigned, under the actuarial funding method, to current and subsequent plan years.
Unfunded Actuarial Accrued Liability - The difference between the actuarial accrued liability and actuarial value of
assets. Also referred to as “unfunded accrued liability.”
.