Embed Size (px)
Citation preview
Teachers, Electoral Cycles and Learning in India
3rd August 2016
Sonja Fagernäs1 and Panu Pelkonen2
Abstract
Teachers are central for learning, but their hiring and management can be influenced by
political factors, especially when they are civil servants. Using an exceptionally large,
administrative school-level panel data set for India, we find significant increases in teacher
transfers and moderate increases in hiring after state elections. Pupils' test scores are up to
0.15 standard deviations lower in the post-election phase. The identification relies on the
staggered and predetermined timing of elections across states. We conduct a range of
estimations to rule out alternative explanations, and conclude that the reorganization of
teachers is likely to disrupt learning.
Keywords: Teacher transfers, Political cycle, Education, India
JEL Codes: D73, H75, I21, J24
1 Department of Economics, University of Sussex. Email: [email protected] Department of Economics, University of Sussex, Centre for the Economics of Education(CEE), LSE, IZA. Email: [email protected].
Acknowledgments: We would like to thank the staff at NUEPA for providing us with theDISE database and for helpful discussions; in particular Professors Vimala Ramachandran,Arun Mehta and Pranati Panda. We would like to thank Dr Suman Bhattacharjea for theASER data and for many illuminating discussions. Helpful comments on this study and earlier(substantially different) versions have been received for instance from Jaime Meza Cordero,Mark Rosenzweig, Bibhas Saha, Abhijeet Singh and participants at the Indian StatisticalInstitute Annual Conference 2013, NEUDC 2014, Trinity College Dublin, the RESConference 2015, WIDER Human Capital Conference 2016 and Journees LAGV 2016. Wewould like to thank Amrita Saha and Aditya Das for research assistance. The authorsacknowledge financial support from the British Academy. We are fully responsible for anyremaining errors.
1
1 Introduction
It is well acknowledged that teachers are a key input in the educational production
function (see e.g. Glewwe et al., 2014). There is also growing recognition of the importance
of the quality of management of schools and other public services within Economics (see e.g.
Bloom et al., 2015). The relevance of management can extend to school systems as a whole,
and can also be influenced by external factors, such as the political process. While the role of
political factors in the provision and management of education is recognized, there is still
limited rigorous quantitative evidence for developing countries, in particular with respect to
teachers (see e.g. Kingdon et al., 2014 for a systematic review). In contexts where teachers are
civil servants, political factors can affect their management.
In this study, we demonstrate that the electoral cycle affects the transfer and recruitment
of Indian public primary school teachers. We also show that the electoral cycle affects
learning. Further analysis indicates that the timing of these effects coincides, implying that the
political cycles in the management of teachers can have performance implications. Our data
source for teachers is an India-wide administrative school records database (District
Information System for Education, DISE). For the analysis on learning we rely on child-level
data from the Annual Status of Education Report (ASER), given that the DISE does not
include reliable indicators on learning.
Regular primary school teachers in India are civil servants, generally on permanent
contracts, with a high degree of job security. They are hired by Indian states and core
recruitment decisions are made at this level (see e.g. Ramachandran et al., 2008 and Sharma
and Ramachandran, 2009).
Teacher transfers are not an uncontroversial topic in India. Transfers of primary school
2
teachers can take place due to administrative reasons, such as the rationalization of teacher-
pupil ratios, upon the request of teachers, in the form of mutually agreed transfers, or on
disciplinary grounds (NUEPA, 2016). The geographic level at which transfers take place
depends on the state. Typically in larger states, transfers take place either within a district or
block (NUEPA, 2016).1 Teachers may request to be transferred for instance due to family
reasons, or due to a desire to change location. However, the transfer process itself is ad hoc;
many states do not have clearly specified transfer policies and mass transfers are reported in
the literature (see e.g. Sharma and Ramachandran, 2009, pp. 161-166, NUEPA, 2016).2 In
some states, such as Rajasthan, elected politicians (Members of Legislative Assembly) can be
influential in teacher transfers.3 Due to the unsystematic nature of the transfers, there can be
scope for specific events, such as political change, or elections to shape the transfers of
teachers.
To the authors' knowledge, there is no existing literature specifically on the effects of
electoral cycles on teacher transfers and recruitment. Electoral cycles in public sector
expenditure have in turn been studied extensively (see e.g. Nordhaus, 1975, Khemani, 2004).
On teachers, the only study that to our knowledge is close to ours is a working paper by
Akhtari et al. (2015), which focuses on Brazilian teachers. The authors find that party
turnover increases the turnover of teachers, and demonstrate that pupil test scores are lower
and drop-out rates higher in municipalities with higher party turnover. With respect to
1 District is a sub-unit of a state, and block a sub-unit of a district.2 While we have obtained documents relating to teacher transfers from specific Indian states,it has proven challenging to codify them or obtain comprehensive coverage of any rules overthe time period studied.3 A few studies suggest that teachers may be used as agents for political support duringelection times and that political connections affect the possibility of obtaining a transfer (seee.g. Béteille, 2009, Kingdon and Muzammil, 2009 and 2013). Teachers can play a role in thepolitical process for instance due to their role in staffing election booths. The data that we usedo not include information on the political connections of teachers.
3
bureaucrats, Iyer and Mani (2012) study the transfers and career progression of Indian
Administrative Service (IAS) officers, including how political change and caste affinity affect
transfers, or the ability to obtain important posts.4 Bertrand et al. (2015) provide a detailed
study on the role of IAS officer characteristics in their effectiveness and how effectiveness
matters for state level performance.
Given the relevance of the Indian states for the hiring and transfer process, our study
focuses on the effects of State Assembly Elections; the timing of which is predetermined and
staggered across states. The timing can thus be considered exogenous. We find large increases
in teacher transfers, and moderate increases the number of teachers and new hires after the
elections in relation to other years, but we do not find evidence of electoral cycles in the
reported days spent on non-teaching assignments.
We propose two general explanations for the post-election increases in transfers and
hiring. Our findings can be compatible with bottlenecks created by a rule that bans transfers
in the pre-election period, but also with increased administrative and political momentum of
the government in the post-election period. The Election Commission of India's Model Code
of Conduct imposes a ban on the transfers of all government employees, who are connected
with election duties in the run-up to elections (from the announcement of the elections). It
also bans the appointment and promotion in Government/Public undertakings during the
period.5 Singh (2012) provides a useful overview of its content and development, including
4 An earlier unpublished study by the authors (Iyer and Mani, 2007) focuses more specificallyon the effects of the electoral cycle.5 For example, Election Commission's letter No. 464/INST/2007-PLN-I dated 7.1.2007 andtitled “Code of Conduct: Do's and Don'ts”, specifies a ban on transfers, appointments andpromotions (p. 2-3). http://eci.nic.in/eci_main/CurrentElections/ECI_Instructions/MCC_%20Do_and_Dont' s .pdf (last accessed 15th July 2016). Current guidelines suggest that thecode applies roughly 5 weeks from the announcement of Assembly Elections.http://eci.nic.in/eci_main1/the_function.aspx#schedulingelec (last accessed 15th July 2016).
4
how political parties perceive to be constrained by it. Anecdotal evidence suggests that the
ban is relevant for how teachers are managed. For example, according to Jha et al. (2008),
over the 2002-2005 period, the “Imposition of model code of conduct for assembly elections
had also delayed teacher recruitment in Bihar and Haryana” (p.332). Iyer and Mani (2007)
study its effect on the transfer of IAS officers in India.
We explore other potential explanations for the post-election increases in transfers. They
cannot be explained by a change in the leading political party, or political alignment of the
local area with the ruling party of the state. While there is some evidence that the caste of the
member of the legislative assembly (MLA) can affect the likelihood of transfers, caste affinity
does not provide a key explanation for the general peak in transfers in the post-election
period.
In addition to teacher transfers and hiring, we analyze the effects of the electoral cycle on
learning. Such a connection can be reflective of the quality of primary schooling, but remains
under explored in the literature. We find that fourth grade pupils perform better in Reading
and Mathematics tests if their schooling does not coincide with the post-election phase that is
characterized by a higher likelihood of teacher transfers and new hiring. The electoral cycle
has either no effect on learning (Reading), or a much milder effect (Mathematics) on pupils in
private schools, indicating that the causes of the cycles lie within the public sector. The
negative effects of the post-election period on learning are stronger in districts that have a
higher degree of excess teacher transfers in the post-election period. At the district level, the
rate of transfers also correlates negatively with learning.
We conduct a range of estimations to rule out potential competing explanations for the
learning effects than the reorganization of teachers. Firstly, we find no connection between the
5
electoral cycle and pupil composition. On average, the composition of teachers does not vary
with the electoral cycle, and the teachers who are transferred in the post-election year do not
differ in their characteristics from those transferred in other years. Depending on the resource,
increases in school resources do take place around the election years, but such increases could
hardly explain the slump in learning in the post-election phase. Finally, over the period
studied, there is little connection between the electoral cycle and various types of reported
crime or communal unrest, which might intensify during election periods and disrupt
schooling.
Based on the evidence and a range of checks for alternative channels, we suggest that
our findings on learning can be considered a consequence of the teacher reorganization
process. The changes in hiring in the post-election period are moderate, but those on transfers
are large in magnitude, and thus could be considered a significant shock to the school system.
They can be accompanied by anxiety over the change, mid-year transfers may lead to schools
missing a teacher until a new one arrives and it can take a while for new teachers to settle. We
do not hold data on teacher shortages in the middle of the school year, but this is one potential
candidate for disruption to learning, as it can reduce teaching time, or the quality of teaching.
In a developed country context, Ronfeldt et. al. (2013) find a negative effect of teacher
turnover on student achievement.
At a broader level, the results on the electoral cycles in the transfers and hiring of
teachers and learning of pupils can be considered symptomatic of impairments in the
management of these services. Given that learning in private schools is largely unaffected by
the electoral cycle, our findings also provide a new angle to the literature on the relative
effectiveness of private versus public schooling (see e.g. Muralidharan and Sundararaman,
6
2015 and Singh, 2015).
We begin with a description of the data set used and the summary statistics (Section 2).
The analysis on teachers, including a discussion of the identification and estimation, is
presented in Section 3. Section 4 focuses on the effects of the electoral cycle on learning.
Section 5 provides further robustness checks, and Section 6 concludes.
2 Data
This study relies on several sources of data. The key data sources on the outcomes of
interest are the District Information System for Education (DISE) and the Annual Status of
Education report (ASER) survey. These are described in detail below.
The data on the Indian Assembly Elections for the years 1999-2012 are supplied by the
Election Commission of India. The timetable for the elections can be found in Appendix 1,
Table A1. Each state is divided into a number of election constituencies. The winning
candidate in each constituency gets a seat in the State Assembly, from which the state
government is formed. By constitution, the Assembly Elections are carried out in each state
every five years, but the cycle is different across states, so that every year sees elections being
held in some states.
2.1 DISE Data
The DISE is an administrative school records database, managed by the National University
of Educational Planning and Administration (NUEPA), Delhi. From the year 2005 onwards,
the database has full, or nearly full coverage of government administered primary schools in
7
India. The data are reported on an annual basis and form a panel data set of schools. The
database includes a rich set of variables on school resources, management and pupils. For
each school, it also includes a teacher level file with information on each teacher and key
characteristics. These include name, age, caste, gender, date of birth, starting point of career
as a teacher and indicators on educational qualifications.6 There are no other comparable
India-wide, annual data sources on schools. In most estimations we use a panel data set of
schools for seven years between 2005-2011.
In terms of timing, the year 2005 refers to the academic year 2005-067, and the data are
collected in the Autumn of 2005, and similarly for the other years as well. To focus on a
unified group of teachers, the sample is restricted to lower primary grades, which in most
states spans grades 1-5.8 Most of our analysis focuses on public sector schools, with a few
robustness checks for private schools. For schools that include both lower and upper primary
grades, the variables in this study relate only to lower primary students, and teachers who
teach such students.
With respect to teachers, the key outcomes of interest are the numbers of teachers,
whether a teacher leaves a school in a particular year (transfer) and the numbers of new
teachers hired per year in a district. We also analyze the effects on the number of days spent
on non-teaching assignments per teacher in a school. The number of teachers includes both
regular teachers and contract teachers. The former are competitively hired to permanent
6 The database was originally introduced for the purpose of planning and monitoring ofnational education programs in India, as such information systems were not available. Theresponsibility of reporting lies with schools. The consistency of the DISE data is checkedannually at the state level with 5% re-sampling, and should involve independent monitors.More details can be found from http//:www.dise.in,http://schoolreportcards.in/SRC-New/AboutDISE/AboutDISE.aspx (Last accessed 15th July2016). 7 The school year begins around June/July in most Indian states.8 In some states, lower primary schools cover grades 1-4.
8
positions and the latter are locally hired on fixed term contracts with lower salaries. With
transfers, we focus only on regular teachers, given that contract teachers are by nature
temporary. In further analysis, we use information on the key characteristics of the teachers:
gender, tenure (years from starting in profession), caste and the possession of a degree.
In order to construct an indicator for teacher transfers, we need to uniquely identify
teachers within schools. The database does not include a teacher identifier. We construct an
identifier based on the gender and the date of birth of the teachers within the schools.9 A
teacher is considered to have transferred during year t if he, or she is no longer present in the
school in the following year (t+1). We focus on teachers between the age of 18 and 55 to
exclude the possibility of retirement.10
In general, teacher departures from schools can be interpreted as transfers. Moving out of
the teaching profession can be considered unusual due to the job security and relatively high
salaries. Thus, when a teacher leaves a school, this can in most cases be interpreted a transfer
to another school, or in some cases to an administrative position (see e.g. Ramachandran et al.
2008). We do not expect these teachers to have left the school system, but to have moved to
another school in the district, or state. We also validate this from the data by counting those
teachers who appear in a specific school for the first time and these numbers are on average in
line with those on teacher exits. Due to the lack of a teacher identifier in the database, we are
unable to track teachers across schools in a credible manner.
To define transfers, we construct a dummy variable for leaving a school for all teachers
up to the year 2010. The mean of the variable for our final sample is 0.171, suggesting a 17.1
percent likelihood of a transfer for each teacher-year observation. This 'exit’ (transfer)
9 The data include names of teachers, but their spelling may vary and some surnames are too common to be used for identifying people. 10 The retirement age is generally 60 (see e.g. NUEPA, 2016).
9
indicator cannot be computed for 2011 since that is the final year in our sample. Schools for
which we cannot uniquely identify all teachers based on gender and date of birth are
excluded.11 Table 1 shows the summary statistics for the variables on teachers that are relevant
for this study. It also includes variables for the electoral cycle, which are described in more
detail below.
TABLE 1
In addition to the data on teachers, in robustness checks we also utilize data on school
characteristics. Summary statistics for the key school level variables are shown in Table 2.
The selection of the sample and the data cleaning procedures are documented more precisely
in the Appendix. The final sample covers schools in 29 (out of 35) states and territories, in a
total of 600 districts.12 It includes about 6 million observations of about 1.3 million unique
primary schools in the form of an unbalanced panel for seven years.
TABLE 2
11 In the raw data for 2005-2011 we have a panel of 12,596,621 teacher observationsbetween the age of 18-55, who teach in lower primary non-private schools. The number fallsby 266,489 (2.1%) due to the exclusion of schools in which teachers who cannot be uniquelyidentified by their date of birth and gender. After excluding year 2011 and some outliers weare left with with 10,182,861 observations. Table 1 reports the 9,546,949 observations forwhich also the phase of election is defined. This selection does not appear to lead to asubstantial bias in terms of key characteristics such as gender, caste or education of theteachers.
12 The territories/states for which we do not have election data are Chandigarh, ArunachalPradesh, Daman and Diu, Dadra Nagar, Lakshadweep and Andaman & Nicobar Islands.
10
2.2 ASER Data
The DISE database does not contain reliable, or comparable data on levels of learning.13
For this purpose, we use survey data on literacy and numeracy skills of children collected by
the ASER Centre14, which are representative and comparable across India.
The ASER survey is an annual survey of rural children, carried out since 2005. The
sampling is representative at the district level. It is a repeated cross-section of household
surveys, which includes a test of Reading and Numerical skills of children, carried out at
home.15 We use the child-level data from 2005 to 2012, and combine it with data on the timing
of state elections. The ASER survey for 2005 covered 6-14 year olds, and in later surveys the
coverage was expanded to 3-16 year olds.16
The tests on learning are categorical. There are five categories for the pupils' reading
skills: ability to read a story (5), paragraph (4), sentence (3), a word (2), or nothing (1). There
are four categories for numerical skills: ability to divide (4), subtract (3), recognize a number
(2), or nothing (1). From these indexes, we construct age-specific z-scores for each pupil in
both Reading and Mathematics, normalized with respect to the ASER survey of 2005. The z-
score for each level of attainment is based on the distribution in the 2005 data for each age
group between 6 to 14, and applied to all consecutive years. This results in a unified outcome
variable that is comparable across time. The main purpose for normalizing the scores is to
13 The DISE has information on the proportions of pupils that pass, or obtain a grade of morethan 60% in the year 5 final exam. However, these are not based on a standardized test andcannot be considered comparable across schools, and are not available for all years.14 www.asercentre.org15 The survey also re-samples some villages in a rotating fashion, allowing in principle shortvillage-level fixed effects. This feature is of limited use to us, given that elections take placeevery 5 years. 16 ASER also includes a school survey of one government school in each village. However,the school survey has not been carried out every year, and the survey does not have a paneldimension, making it mostly unhelpful for our analysis.
11
facilitate interpretation, given that the estimated coefficients can be interpreted as standard
deviations.
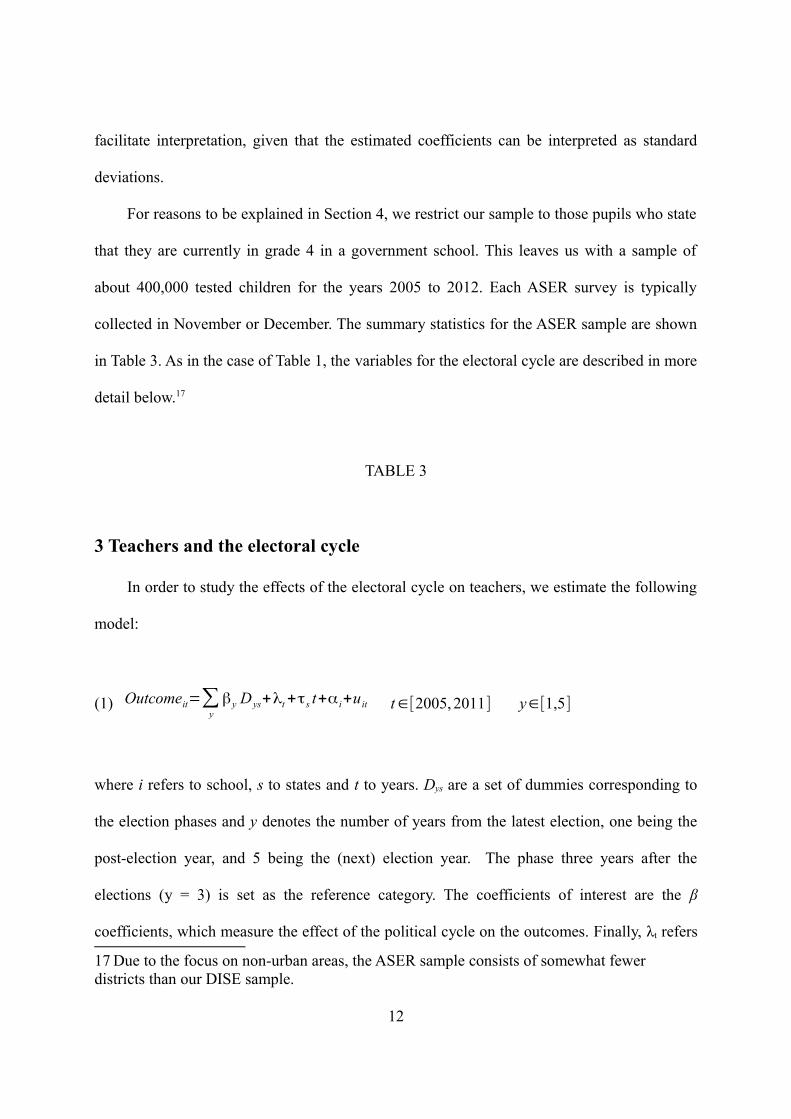
For reasons to be explained in Section 4, we restrict our sample to those pupils who state
that they are currently in grade 4 in a government school. This leaves us with a sample of
about 400,000 tested children for the years 2005 to 2012. Each ASER survey is typically
collected in November or December. The summary statistics for the ASER sample are shown
in Table 3. As in the case of Table 1, the variables for the electoral cycle are described in more
detail below.17
TABLE 3
3 Teachers and the electoral cycle
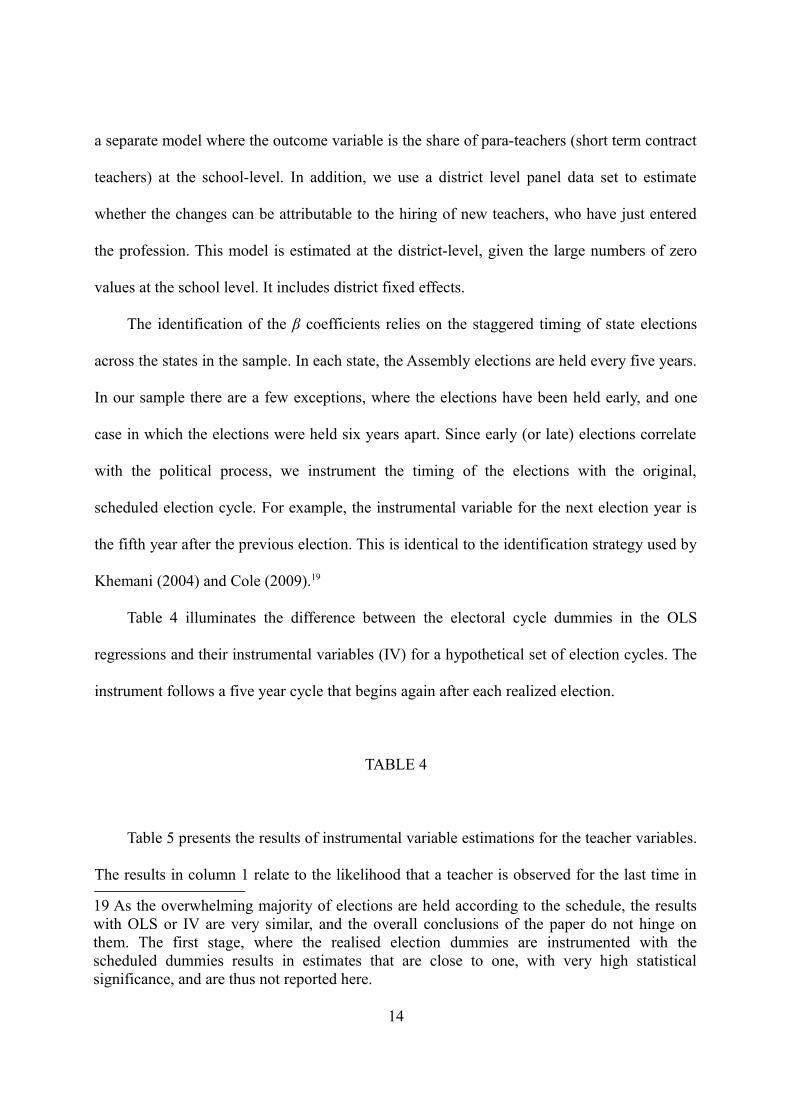
In order to study the effects of the electoral cycle on teachers, we estimate the following
model:
(1) Outcomeit=∑y
βy D ys+λt +τs t+α i+u it t ∈[2005, 2011] y∈[1,5]
where i refers to school, s to states and t to years. Dys are a set of dummies corresponding to
the election phases and y denotes the number of years from the latest election, one being the
post-election year, and 5 being the (next) election year. The phase three years after the
elections (y = 3) is set as the reference category. The coefficients of interest are the β
coefficients, which measure the effect of the political cycle on the outcomes. Finally, λt refers
17 Due to the focus on non-urban areas, the ASER sample consists of somewhat fewerdistricts than our DISE sample.
12

to year effects, τs to state trends and αi to school fixed effects. Standard errors are clustered at
the state level.
The information on teachers and schools for the academic year is collected towards the
end of the calendar year. Suppose that elections take place in the (calendar) year 2008. We
will interpret changes from 2007 to 2008 in schools as 'Election year' effects, and changes
from 2008 to 2009 as 'Post-election year' effects. Post-election effects have in practice taken
place under the new state government, while this is unlikely to hold for the 'Election year'
changes.18 In equation 1, D5s and D1s refer to the 'Election' and the first 'Post-election' years.
Figure 1 illustrates the timing of the elections in relation to the school data, assuming that
elections are held in the calendar year 2008.
FIGURE 1
The first outcome of interest is the likelihood that a teacher leaves in a particular year
(transfer). This is a dummy variable, reflecting the last year in which the teacher is observed
in the school. A linear probability model with teacher level data is estimated. Next we use
school level data to estimate the effects on the total number of teachers in the schools and the
average number of non-teaching assignments per teacher as the dependent variables. The
latter is of interest as teachers are used in election related duties, and therefore elections might
matter for reported non-teaching days.
In order to understand more about any change behind teacher numbers, we also estimate
18 As the school data are annual, but the election month varies, it is inevitably impossible tocleanly divide all effects into (pre-)election and post-election effects. We have also triedalternatives in which we utilise the month of the election more precisely, and define theelection year to run from April to March or October to September, but these alternativeswould lead to roughly similar results, while being less transparent.
13
a separate model where the outcome variable is the share of para-teachers (short term contract
teachers) at the school-level. In addition, we use a district level panel data set to estimate
whether the changes can be attributable to the hiring of new teachers, who have just entered
the profession. This model is estimated at the district-level, given the large numbers of zero
values at the school level. It includes district fixed effects.
The identification of the β coefficients relies on the staggered timing of state elections
across the states in the sample. In each state, the Assembly elections are held every five years.
In our sample there are a few exceptions, where the elections have been held early, and one
case in which the elections were held six years apart. Since early (or late) elections correlate
with the political process, we instrument the timing of the elections with the original,
scheduled election cycle. For example, the instrumental variable for the next election year is
the fifth year after the previous election. This is identical to the identification strategy used by
Khemani (2004) and Cole (2009).19
Table 4 illuminates the difference between the electoral cycle dummies in the OLS
regressions and their instrumental variables (IV) for a hypothetical set of election cycles. The
instrument follows a five year cycle that begins again after each realized election.
TABLE 4
Table 5 presents the results of instrumental variable estimations for the teacher variables.
The results in column 1 relate to the likelihood that a teacher is observed for the last time in
19 As the overwhelming majority of elections are held according to the schedule, the resultswith OLS or IV are very similar, and the overall conclusions of the paper do not hinge onthem. The first stage, where the realised election dummies are instrumented with thescheduled dummies results in estimates that are close to one, with very high statisticalsignificance, and are thus not reported here.
14
the particular school, which we interpret as a transfer. There is a statistically significant
increase in transfers in the post-election year. The magnitude of the coefficient is noteworthy:
in the post-election year, teacher transfers rise by 9 percentage points, while the average
transfer rate is 17 percent, suggesting at least a 50% increase in transfers.
The results in column 2 of Table 5 refer to the total number of teachers in the schools,
and the model is estimated using the school level panel data set. There is a statistically
significant effect on the number of teachers two years after the election year. The magnitude
of the effect is rather small, since with an average of about 3 teachers per school, an increase
of 0.05 would translate into less than a 2% increase. In the third column of Table 5 we show
that the increases are not driven disproportionately by the hiring of shorter term contract
teachers (para-teachers). The para-teacher share does not change significantly across the
electoral cycle.
The fourth column in Table 5 shows the number of days of non-teaching assignments per
teacher, averaged across all lower primary teachers in the school.20 The non-teaching days
reported in the DISE refer to the previous academic year. There does not appear to be any
substantial correlation between the number of days spent on non-teaching assignments and the
election cycle. These formally recorded non-teaching assignments may not be indicative of
informal teacher absences, which can be much larger (see e.g. Kremer et al., 2005).
The final column of Table 5 refers to a similar model, where the dependent variable is
the number of newly hired teachers in a panel of districts. By newly hired, we refer to teachers
who have entered the teaching profession in the specific year. In the panel of districts, the
mean number of annual new hires is 211, with a standard deviation of 374. The results show
20 Non-teaching assignments can include tasks such as staffing of polling booths, revisingelectoral rolls, immunization campaigns and the provision of information on welfare schemesand family planning (see e.g. Ramachandran et al., 2005).
15
that there is a peak in new hiring two years after the elections, with about 100 more teachers
hired in comparison to election year or the post-election year. Columns 3 and 5 of Table 5
together show that the moderate increase in teacher numbers observed in column 2 two years
after the elections is partly driven by new hires, and that that it is not due to the
disproportionate recruitment of para-teachers.21
TABLE 5
Overall, the results indicate that elections are followed by a large increase in teacher
transfers, and a small increase in the total number of teachers a year later, driven by new
hiring. The timing of the effect suggests that this reorganization takes place during the school
year that begins in the post-election year and that these changes will have materialized by the
following school year. Therefore, these changes can signal new policies, or momentum by the
incoming government, but they could also be a result of the bottlenecks that have built up
from pre-election restrictions. It may take some time for the new government to address these
bottlenecks.
Our data are annual and do not allow us to distinguish credibly between these two
potential explanations for the reorganization of teachers. Below we explore three alternative
explanations. We focus on transfers given the relatively large post-election change compared
to that in the number of teachers. We test whether 1) transfers reflect political change in the
sense that they are more common if the leading party in the state changes, 2) transfers are a
political reward, and we would expect to see more transfers after elections in districts that are
21 As a robustness check in Section 5 we also show that many other teacher characteristics donot vary by the electoral cycle.
16

politically aligned with the state, 3) caste based transfers are more common in the post-
election phase, in particular if the caste of the local incoming Member of the Legislative
Assembly (MLAs) matches the caste of the teacher. These data come from the Election
Commission of India.
Table 6 shows the results of estimations of the model in equation (1) in which the post-
election dummy is interacted either with the dummy for the change in the largest party in the
state (column 1), or the share of assembly constituencies in a district that are politically
aligned with the state (column 2). The variables are defined in the notes to Table 6. Districts
consist on average of seven assembly constituencies, and an MLA is elected from each. The
DISE does not include information on the constituency of each school, so we rely on district
level averages for the political outcomes. Neither of the interaction terms is statistically
significant, providing no support for the alternative explanations 1) or 2) above.
TABLE 6
We cannot observe the possible political loyalties of teachers, but can observe their caste,
along with the caste mix of the MLAs in the district. Depending on the state, political
loyalties can be connected to caste status, and MLAs are known to be influential in teacher
transfers, at least in some states (NUEPA, 2016, pp. 85-90).
To test for the relevance of politically motivated transfers in relation to caste, we test for
whether the caste of the Members of the Legislative Assembly (MLA) affects the post-
election transfer rates of teachers. The data on the caste of the Members of the Legislative
Assembly (MLA) are obtained from the same source as the timing of the elections.
17
Table 7 shows the results of the model in equation (1), where the post-election dummy
variable is interacted with the proportion of the district's MLAs, who report being either
scheduled caste (SC) or scheduled tribe (ST), the reference group being the general caste. The
models are estimated for three sub-samples of teachers: general caste, scheduled caste (SC)
and scheduled tribe (ST).22 There are two key results. Firstly, a larger share of SC politicians
is associated with a higher frequency of transfers for SC teachers, independent of the phase of
the electoral cycle. However, importantly for our study, this result does not explain the peak in
post-election transfers even for SC teachers, since the corresponding interaction with the post-
election dummy is not significant. The post election peak in transfers in Scheduled Tribe (ST)
teachers is attributable to changes in the share of Scheduled Caste MLAs (table 7, column 3).
However, ST teachers represent a relatively small fraction of all teachers (12.4%). Overall, we
can conclude that caste does appear to play a role in teacher transfers, but rule out the
possibility that caste-based politics would be a key driver of post-election transfers.
TABLE 7
4 The electoral cycle and learning
Since teachers are a crucial resource in schooling, it is relevant to ask whether the
observed post-election reorganization of teachers could disrupt the school system enough to
affect learning. Mid-year transfers could lead to short-term teacher shortages, new teachers
can take a while to settle in a school and the anticipation of a transfer could create anxiety.23
22 General caste teachers include 'other backward classes', as this is how the caste ofpoliticians is reported. 23 Anecdotal evidence from reports and press suggests that mid-year transfers exist in India,and that they are considered harmful. For example NUEPA (2016), p. 91, or The Tribune
18
To be able to observe teacher shortages during the school year, we would require higher
frequency data on teachers, than are currently available.
The DISE database does not include reliable data on learning, so we use another data
source to study the effects of the electoral cycle on learning. We begin by demonstrating that
learning is also characterized by an electoral cycle that coincides with that for teacher
transfers. For this purpose we use pupil-level data from the ASER survey. Subsequently, we
analyze whether the rate of transfers of teachers at the district level correlates with learning
and study the differences in the effects on learning by districts with above and below median
rates of post-election teacher transfers.
4.1 The role of the electoral cycle
As we are interested in understanding more about the consequences of a school system
specific election effect, we focus on pupils who have been in the education system for a
sufficiently long period. Otherwise, we may capture effects on learning that pre-date formal
schooling. Since lower primary school lasts for five years in most states, fifth graders will
have experienced all phases of the election cycle during their time in school. We therefore
focus on pupils who are currently attending the fourth grade. They have all avoided a specific
election phase. This will provide the source of identifying variation for the estimations. After
pooling fourth graders across all states and years, approximately one fifth of the pupils have
not experienced elections (or another phase of the cycle) during their time in school, since
their 4 years of education fall in between the 5-year election cycle. We match the data on test
25th April 2016.(http://www.tribuneindia.com/news/jammu-kashmir/education/jammu-kashmir/educationdepartment-bans-mid session-transfers-in-valley/227180.html).
19
scores to the timing of the elections by calendar year.
In practice, all pupils enter into one of five exogenously determined treatments, based on
the phase of the election cycle that they begin their schooling in. Abstracting from possible
grade repetition, Table 8 presents the potential electoral phases experienced by the pupils. As
motivated in Section 2.2, the analysis focuses on fourth grade pupils.24 The rows in the Table
refer to years, showing pupils progressing from a lower to a higher grade. The columns refer
to the potential treatments, which depend on the election cycle. Pupils in treatment 1 (T1,
column 1) begin their schooling in the post-election year (phase 1), and enter grade 4 in
phase 4. Among pupils in grade 4, those in treatment 1 have not experienced elections (phase
5) during their schooling by the time of testing (November/December of their fourth grade).
Due to the availability of eight consecutive ASER survey years and the staggered timing of
elections across the states, the five treatments are distributed relatively evenly across states,
cohorts and years in our data.
TABLE 8
In principle, all phases of the election cycle could have different effects on learning, with
differential effects by grade, and decay over time. In practice, not all of such hypothetical
effects would be identifiable from the data. For the sake of tractability, our working
hypothesis is that certain phases of the electoral cycle are worse or better for learning, they
affect all pupils irrespective of grade, but the effects on learning may or may not be
24 Focusing on grade 4 pupils also simplifies the interpretation of the estimates, but similarestimations could be carried out for grade 3 or grade 2 pupils with similar results. Grade 1pupils on the other hand, have been in school for less than half a year at the time of testing.
20
persistent.25 We begin by estimating the following model:
(2) zscoreitd=Ai+ Femalei+Λt +Ωd +βMiss y+uit t ∈[2005,2012] y∈[1,5] .
The dependent variable is the level of skills by pupil i in year t and district d, as
measured by the age-specific z-score (normalized to 2005) in either Reading or Mathematics.
The sample is restricted to grade 4 pupils. The variable of interest is the Missy dummy.
Assuming that no grade repetition took place, this dummy variable indicates whether a pupil
was not attending school in the school year that begins over a certain phase of the election
cycle (y). For example, Miss1 refers to missing the school year that begins in the post-election
year.
A set of dummies (Ai) are used to control for the number of years that the pupil is over or
under aged for the grade. The model also includes gender, survey year effects (Λt), and district
fixed effects (Ωd).26 Again, the actual election phases are instrumented with the intended
election phase.
It is worth noting that in India there is substantial variation in age at all grade levels. For
example, fourth graders are typically 9 or 10 years old, and 93% are between 8 and 12 years
old. We do not have information on grade repetition, and handle this variation by controlling
for age.
To provide another angle to the question, we also estimate the effect of the current
election phase on grade 4 pupils:
25 The persistence of the effects will be discussed in the interpretation of the results.26 This is the level at which the data are representative and it is the lowest geographical
denominator with a panel dimension.
21

(3) zscoreitd=Ai+ Femalei+Λt +Ωd +∑y
βy D ys+u it t ∈[2005, 2012] y∈[1,5] .
This specification is similar to the estimated models on teachers, with similar election
year dummies (Dys) and instrumentation. The election year (D5s) is the excluded category.
Essentially, models (2) and (3) will convey the same message, but are framed differently. The
ASER surveys are also conducted towards the end of the year and the matching with the
timing of the elections is done similarly as with the regressions on teacher outcomes.
Table 9 shows the results for model specification (2). We estimate separate models for
pupils in government (public) and private schools and separate models for Reading and
Mathematics. The rows refer to a missed phase of the election cycle. It is important to note
that each row-column cell represents a coefficient from a separate estimation.
The results in column 1 show that not being in school in the school year beginning
during the post-election year is beneficial for Reading outcomes. Avoiding this year increases
Reading scores on average by 0.084 standard deviations for those currently in grade 4. With
respect to the treatments in Table 8, the result implies that fourth graders would be best off if
they experience 'Treatment 2'; they begin their schooling in phase 2, and enter fourth grade in
phase 5 (the election year).
TABLE 9
Those who miss the election phase 3; three years after elections, appear to do worse than
others. Referring back to Table 8, we can see that fourth graders who miss phase 3 are in
22
'Treatment 4'; they experience elections in the same year that they begin grade 2, and reach
grade 4 two years after the elections. Out of all the treatments linked with experiencing the
post-election year in Table 8 (T1, T3, T4 and T5), those in Treatment 4 are in the 'worst'
position. They are tested in phase 2, having just experienced the school year that begins in the
post-election year (phase 1). This is the year associated with an increase in teacher transfers.
Those in treatments T1 and T5, who experienced the election phase with an increase in
transfers earlier during their schooling, have better skills. This result suggests that there is a
degree of decay in the effect of the post-election shock.
Column 2 shows the results for similar models for Mathematics. The results are broadly
similar to those for Reading, but the estimated coefficients are somewhat larger. A fourth
grade pupil scores 0.115 standard deviations higher, if she has missed the school year starting
in the post-election year during her primary schooling.
In columns 3 and 4 of Table 9, the same estimates are repeated for children who attend
private schools. If the effects on learning are attributed to the government school system, we
would not expect to see effects on learning for private school pupils. For Reading, there is no
evidence that the phases of the election cycle would make a difference for learning; all
coefficients in the Table are statistically insignificant. The same is true for Mathematics in
column 4, with phase 1 being only marginally statistically significant. Overall, the results for
private schools suggest that the findings in columns 1 and 2 are not mere statistical artifacts,
but represent variations in the quality of how government schools are run across the electoral
cycle.
Table 10 presents the results of model (3), separately for Reading and Mathematics. In
this case, each column refers to a single regression, and shows the relationship between grade
23

4 test scores and the current election cycle, at the point when the pupils are tested.
TABLE 10
The baseline group in Table 10 is Treatment T2, or those who are in grade 4 in the
election year. All estimated coefficients in column 1 are negative, suggesting that pupils in all
other treatments fare worse in Reading. Again, the most harmful treatment is T4. This refers
to the group of pupils tested right after the election phase with increased teacher transfers. The
estimate shows that the difference in relation to the ‘best’ treatment is 0.127 standard
deviations.
A comparison of the results in columns 1 and 2 shows that the persistence of the negative
post-election shock to learning is larger for Mathematics than for Reading. For treatment T5,
the turbulent year coincides with the second grade, and for treatment T1, it coincides with the
first grade. The effect of being in these treatments is significantly negative for Mathematics,
but not for Reading.
There is no association between the electoral cycle and Reading in private schools in
Table 10. For Mathematics, there is one marginally significant coefficient for children in
private schools. Here, it is worth emphasizing that even if the cause of the election effects lies
with the public sector, there may still be effects on private sector schools, since we do not
know the educational history of the tested pupils. Further, the private schools in the ASER
data include government aided schools, and can therefore be dependent on the electoral cycle
as well.
Overall, the effects on learning are not trivial in size. The average difference in test
24

scores between those in the best and worst election phases is 0.151 standard deviations for
Mathematics, and 0.127 standard deviations for Reading. The effects of the election cycle are
largely absent for private sector pupils, indicating that features, or events associated with the
public system are likely to explain the effects.
With respect to timing, the results indicate that government school pupils who miss the
school year that begins in election phase 1 and is characterized by a higher rate of teacher
transfers and new hiring, do on average better than others in both Reading and Mathematics.
The pupils who experience this year towards the end of their primary schooling do worse in
tests than those who experience it in earlier grades, suggesting that the effects are not fully
persistent.
4.2 Teacher transfers and learning
Given that the data on learning come from a different source than the data on teachers,
any evidence on the connection between the reorganization of teachers and learning is
indirect. The 'reorganization' of teachers may have multiple effects; the anxiety related to the
transfers, and the more concrete disruption to teaching, or short-term teacher shortage as some
teachers move and new teachers have not yet arrived, or settled in. In the next Section, we
provide a range of evidence to rule out other potential channels of effect for the effects on
learning. Below we show support for the claim that the transfers of teachers after the elections
is associated with the observed variations in learning.
We begin by showing that on average there is a negative correlation between the average
rate of public sector teacher transfers at the district level and pupils' test scores (Table 11).
Again, as would be expected, this only affects learning in private sector schools.
25
TABLE 11
Next, we estimate the extent to which teacher transfers are more frequent in the post-
election year separately for each district, which we call 'excess transfers' using the following
simple OLS model27
(4) Turnovert=α+β D1t+u t t=2005 ... 2010 .
The coefficient β captures the magnitude of the transfers in the district in the post-
election year (phase 1) in comparison to other years on average. Since each regression is
based on only 6 observations, statistical significance is ignored and no other controls are
added. Unsurprisingly, the estimate for β varies substantially by district. The distribution of
the estimated βs have a mean of 0.061, a median of 0.042, and a standard deviation of 0.125.
The mean is in line with the post-election effect on transfers estimated from the individual
level teacher data in Table 5.
We then divide the districts in two groups; those where β is below and those where it is
above the median, and re-estimate the effect of the electoral cycle on learning as in Table 9.
The results of this exercise are shown in Table 12. They reveal that in districts where the post-
election rate of transfers is greater, avoiding the post-election year during primary schooling is
associated with 0.111 standard deviations higher Reading scores and 0.148 standard
deviations higher Mathematics scores. For those districts with a relatively lower post-election
transfer rate, the effects are smaller at 0.0612 standard deviations and 0.0911 standard
deviations, respectively. A cautious interpretation of these results would be that the post-
27 Estimated only for districts for which all year observations are available (569 districts).
26
election excess teacher transfers proxies for the turbulence in the organization of teachers that
leads to lower learning outcomes.
TABLE 12
5 Alternative explanations
In this final Section, we explore a range of alternative explanations for the learning
effects and conclude that none of them appear to explain the effect, leaving the reorganization
of teachers as the likely candidate. Firstly, it is possible that parents who are aware that the
post-election period is characterized by turbulence, respond by moving their children to
private schools.28 This might be significant enough to affect the composition of the pupils and
thus test scores. Private schooling is very common in India, and roughly a quarter of primary
school children attend a private school. Column 1 in Table 13 shows the results for the effect
of the electoral cycle on the likelihood of fourth graders (in ASER) being in a private school.
There is no connection between the likelihood of attending a private school and the election
cycle.
TABLE 13
The next potential explanation that is connected with the teacher transfer process relates
to the characteristics of teachers. The estimated effect of the electoral cycle on learning is an
average effect. Teachers who are transferred will typically move to another school in the
district or state, which should lead to the average characteristics of teachers in the district, or
28 Nearly all 9-10 year olds in the ASER dataset report attending some school, so there islimited variation in general enrolment.
27
state remaining unchanged. For changes in teacher characteristics to explain the effects on
learning, we would need to observe a significant change in the teaching force itself. Table 14
reports the results on models that study whether the characteristics of teachers who leave in
the post-election phase are different from those who leave in other years. We restrict the
analysis to teachers who transfer, and include only observations for the transfer year. We study
the effects of the electoral cycle on the gender, tenure, education, caste or the transferred
teachers and on the following school characteristics of the transferred teachers: urban
location, distance to headquarters, and whether the school of origin has an excess number of
teachers in terms of the district median. None of the results in Table 14 indicate that teachers
who are transferred after the elections would be substantially different from those who are
transferred in other year, or that post-election transfers would substantially change the
composition of teachers.29
TABLE 14
There is a literature on electoral cycles in public expenditure and an association between
physical school resources and the electoral cycle could be justified for instance in connection
with an effort to attract, or reward voters. The DISE database includes information on a range
of school resources. We estimate the effect of the electoral cycle on altogether 13 school
resources. The coefficients are shown in Table 15, alongside basic summary statistics for the
variables. While the results vary by resource, they often do suggest an increase in school
resources during the time of the elections, although the increases are not confined to one
29 A similar analysis could be carried out with the full stock of teachers, with the sameconclusion. Results are available from the authors upon request.
28
specific year. While this can affect schools and learning, it is difficult to see how this would
lead to a post-election decline in test scores.
TABLE 15
As a final check, we test whether the electoral cycle is connected with communal
upheaval or crime that could disrupt schooling. Evidence for earlier periods suggests that
there could be a connection between elections and violence (e.g. Wilkinson, 2006). For this
analysis, we have obtained panel data on the reported numbers of murders, rapes,
kidnappings, riots and arson by Indian police districts (Summary statistics are in the
Appendix, Table A3). Matching the data to the timing of elections across the years and states
allows us to test whether the incidence of these crimes varies by the electoral cycle. Table 16
reports the results.
TABLE 16
The results in Table 16 do not offer support for the alternative hypothesis that communal
violence could explain the disturbances in teaching or learning outcomes. The only
statistically significant effect is a slightly elevated (8%) number of riots two years after the
elections. In a similar robustness check, we have tested whether the election cycles in learning
are similar in districts with and without Naxalite activity, and they are.30
To conclude, the results of models on alternative explanations cannot explain why
learning outcomes would be weaker after the elections. Based on our analysis, the
30 The results are available on request from the authors.
29

reorganization of teachers emerges as the likely explanation for the disruption to learning in
the post-election period.
6 Conclusions
In this study, we have shown evidence of a reorganization of the teaching force after
State assembly elections in India. Indian teachers are substantially more likely to be
transferred a year after elections, by approximately 50%. The numbers of teachers and new
hires also rise moderately two years after the elections. These findings can be consistent with
the Indian Election Commission's Model Code of Conduct, which imposes a ban on the
transfers of government employees in the run-up to elections and also restricts hiring, creating
a backlog of transfers. Alternatively, they can reflect the added 'political momentum' of a new
government. The increases in transfers are not connected specifically with party turnover or
the political alignment of the local area. We find that a teacher’s caste is a partial determinant
of transfers, but is not a key factor explaining the increase in post-election transfers. In either
case, it is evident that the post-election period is characterized by the restructuring of
personnel in schools.
Using a household survey of children for 2005-2012, we show that pupils who avoid the
turbulent phase starting a year after the elections, perform significantly better than others in
both Reading and Mathematics. Such effects are not found for pupils in private primary
schools, confirming that the causes of the cycles in learning lie within the government
schooling sector. The effects on learning are larger in districts with a higher degree of post-
election teacher transfers, and learning correlates negatively with the degree of teacher
transfers in the district. A range of alternative explanations cannot explain the weaker learning
30
outcomes after the election year, leaving the teacher reorganization process as the most likely
candidate.
There is growing recognition of the importance of the management of schooling and
other public services within Economics. For instance, in the context of Indian schooling,
evidence shows that private schools can function more efficiently (e.g. Muralidharan and
Sundararaman, 2015), and the suggested explanations to this range from school autonomy to
teacher accountability. Further, Bloom et. al. (2015) show that for eight countries ranging
from the US to India, 20 basic management practice measures are strongly associated with
better learning outcomes. The impact of the political process, or political system on school
systems, as seen in this study, can be considered an additional management dimension.
The potential learning premium associated with private schools in India has been
estimated to range from zero, or moderate (see e.g. Muralidharan and Sundararaman, 2015) to
more than .50 standard deviations (Singh, 2015). In our study, experiencing specific phases of
the electoral cycle can lead to up to 0.15 standard deviation differences in test scores by grade
4 in government schools. Therefore, such variations in the functioning of schools due to the
election cycle can well be a component of the public-private difference in school quality in
India. As the electoral cycles in learning are largely not observed in the private sector, the
evidence in this study would provide support for a degree of school autonomy in personnel
management.
Our results indicate that one potentially interesting avenue for future research would be
to collect frequent data on teacher shortages, effort, outside activities or teachers' role in the
political process around the election years across Indian states. Another avenue would be to
study the presence of electoral cycles in the management of public sector employees in other
31

countries or in other public services.
References
Akhtari, Mitra and Moreira, Diana and Trucco, Laura Carolina. Political Turnover,
Bureaucratic Turnover, and the Quality of Public Services (August 19, 2015).
Available at SSRN: http://ssrn.com/abstract=2538354
Béteille, Tara (2009). Absenteeism, Transfers and Patronage: The Political Economy of
Teacher Labor Markets in India, PhD diss., Stanford University.
Bloom, Nicholas, Renata Lemos, Rafaella Sadun and John Van Reenen (2015). Does
Management Matter In Schools? The Economic Journal, 125 (584): 647-674.
Cole, Shawn (2009). Fixing Market Failures or Fixing Elections? Elections, Banks and
Agricultural Lending in India. American Economic Journal: Applied Economics 1(1):
219-50.
Glewwe, Paul., Eric A. Hanushek, Sarah Humpage, and Renato Ravina (2014). School
Resources and Educational Outcomes in Developing Countries: A Review of the
Literature from 1990 to 2010. In P. Glewwe (Ed.) Education Policy in Developing
Countries. Chicago, IL: University of Chicago Press.
Iyer, Lakshmi and Anandi Mani (2007). Is there a Political Cycle in Bureaucratic Transfers?
Evidence from the Indian Administrative Service. University of Warwick Publications
Service & WRAP, No. 79.
Iyer, Lakshmi and Anandi Mani (2012). Traveling Agents: Political Change and Bureaucratic
Turnover in India. Review of Economics and Statistics 94(3): 723–739.
32
Jha, Praveen, Subrat Das, Siba Sankar Mohanty and Nandan Kumar Jha (2008). Public
Provisioning for Elementary Education in India. SAGE International Publishing House,
New Delhi.
Khemani, Stuti (2004). Political Cycles in a Developing Economy: Effect of Elections in the
Indian States. Journal of Development Economics, 73: 125-154.
Kingdon, Geeta and Mohammed Muzammil (2009). A Political Economy of Education in
India: The Case of Uttar Pradesh. Oxford Development Studies 37(2): 123-144.
Kingdon, Geeta and Mohammed Muzammil (2013). The School Governance Environment in
Uttar Pradesh, India: Implications for Teacher Accountability and Effort. Journal of
Development Studies, 49(2): 251-269.
Kingdon Geeta Gandhi, Little Angela, Aslam Monazza, Rawal Shenila, Moe Terry, Patrinos,
Harry, Beteille, Tara, Banerji, Rukmini, Parton Brent and Shailendra K. Sharma (2014).
A Rigorous Review of the Political Economy of Education Systems in Developing
Countries. Education Rigorous Literature Review. Department for International
Development, UK.
Kremer, Michael, Karthik Muralidharan, Nazmul Chaudhury, Jeffrey Hammer and F. Halsey
Rogers (2005). Teacher Absence in India: A Snapshot. Journal of the European
Economic Association, 3(2-3): 658-67.
Muralidharan, Karthik, and Venkatesh Sundararaman (2015). The Aggregate Effect of School
Choice: Evidence from a Two-Stage Experiment in India. Quarterly Journal of
Economics, 130(3): 1011-66.
Nordhaus, William (1975).The Political Business Cycle. Review of Economic Studies, 42:
169-190.
33
NUEPA (2016). Teachers in the Indian Education System. NUEPA Research Reports
Publications Series 001/2016. National University of Educational Planning and
Administration, New Delhi.
Ramachandran, Vimala, Suman Bhattacharjea and K. M. Sheshagiri (2008). Primary School
Teachers. The Twists and Turns of Everyday Practice. Educational Resource Unit. New
Delhi.
Sharma, Rashmi and Vimala Ramachandran (2009). The Elementary Education System in
India: Exploring Institutional Structures, Processes and Dynamics, Routledge.
Ronfeldt, Matthew, Susanna Loeb and James Wykoff (2013). How Teacher Turnover Harms
Student Achievement. American Educational Research Journal, Vol. 50(1): 4-36.
Singh, Ujjwal Kumar (2012). Between Moral Force and Supplementary Legality: A Model
Code of Conduct and the Election Commission of India. Election Law Journal, Vol.
11(2): 149-169.
Singh, Abhijeet (2015). Private School Effects in Urban and Rural India: Panel Estimates at
Primary and Secondary School Ages. Journal of Development Economics, 113(2015):
16–32.
Wilkinson, Steven, I. (2006). Votes and Violence. Electoral Competition and Ethnic Riots in
India. Cambridge University Press.
34
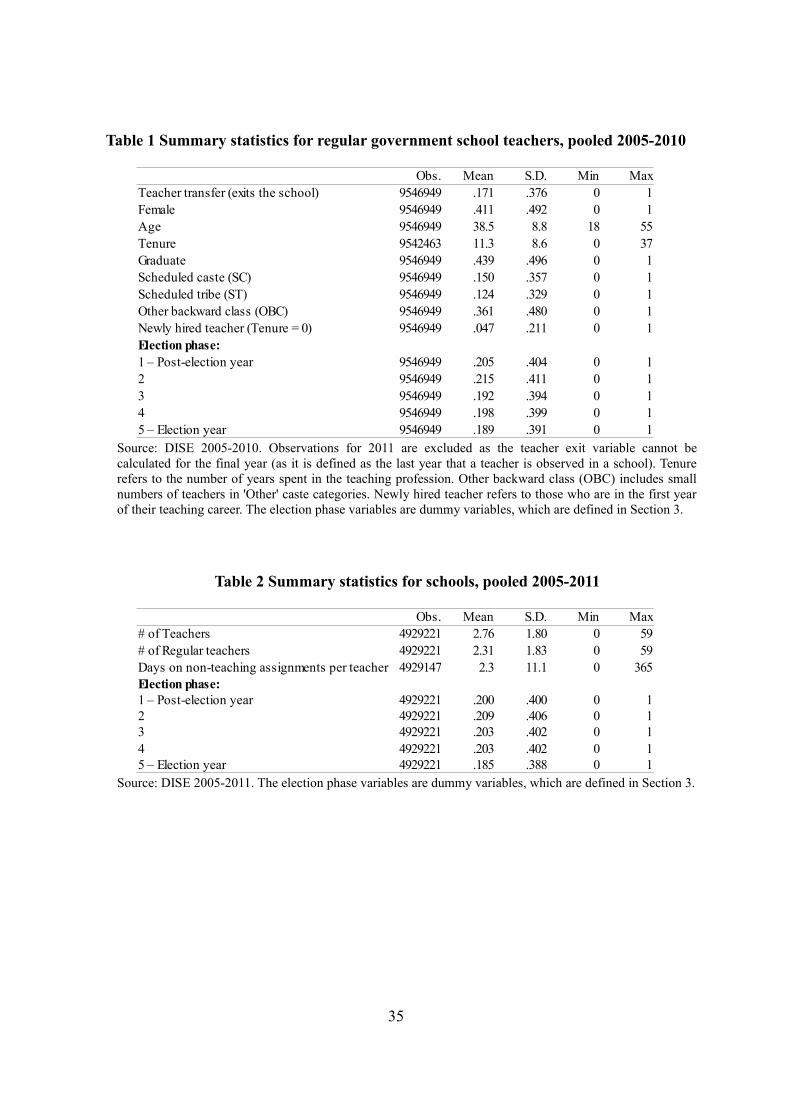
Table 1 Summary statistics for regular government school teachers, pooled 2005-2010
Source: DISE 2005-2010. Observations for 2011 are excluded as the teacher exit variable cannot becalculated for the final year (as it is defined as the last year that a teacher is observed in a school). Tenurerefers to the number of years spent in the teaching profession. Other backward class (OBC) includes smallnumbers of teachers in 'Other' caste categories. Newly hired teacher refers to those who are in the first yearof their teaching career. The election phase variables are dummy variables, which are defined in Section 3.
Table 2 Summary statistics for schools, pooled 2005-2011
Source: DISE 2005-2011. The election phase variables are dummy variables, which are defined in Section 3.
35
Obs. Mean S.D. Min MaxTeacher transfer (exits the school) 9546949 .171 .376 0 1Female 9546949 .411 .492 0 1Age 9546949 38.5 8.8 18 55Tenure 9542463 11.3 8.6 0 37Graduate 9546949 .439 .496 0 1Scheduled caste (SC) 9546949 .150 .357 0 1Scheduled tribe (ST) 9546949 .124 .329 0 1Other backward class (OBC) 9546949 .361 .480 0 1Newly hired teacher (Tenure = 0) 9546949 .047 .211 0 1Election phase:1 – Post-election year 9546949 .205 .404 0 12 9546949 .215 .411 0 13 9546949 .192 .394 0 14 9546949 .198 .399 0 15 – Election year 9546949 .189 .391 0 1
Obs. Mean S.D. Min Max# of Teachers 4929221 2.76 1.80 0 59# of Regular teachers 4929221 2.31 1.83 0 59Days on non-teaching assignments per teacher 4929147 2.3 11.1 0 365Election phase:1 – Post-election year 4929221 .200 .400 0 12 4929221 .209 .406 0 13 4929221 .203 .402 0 14 4929221 .203 .402 0 15 – Election year 4929221 .185 .388 0 1
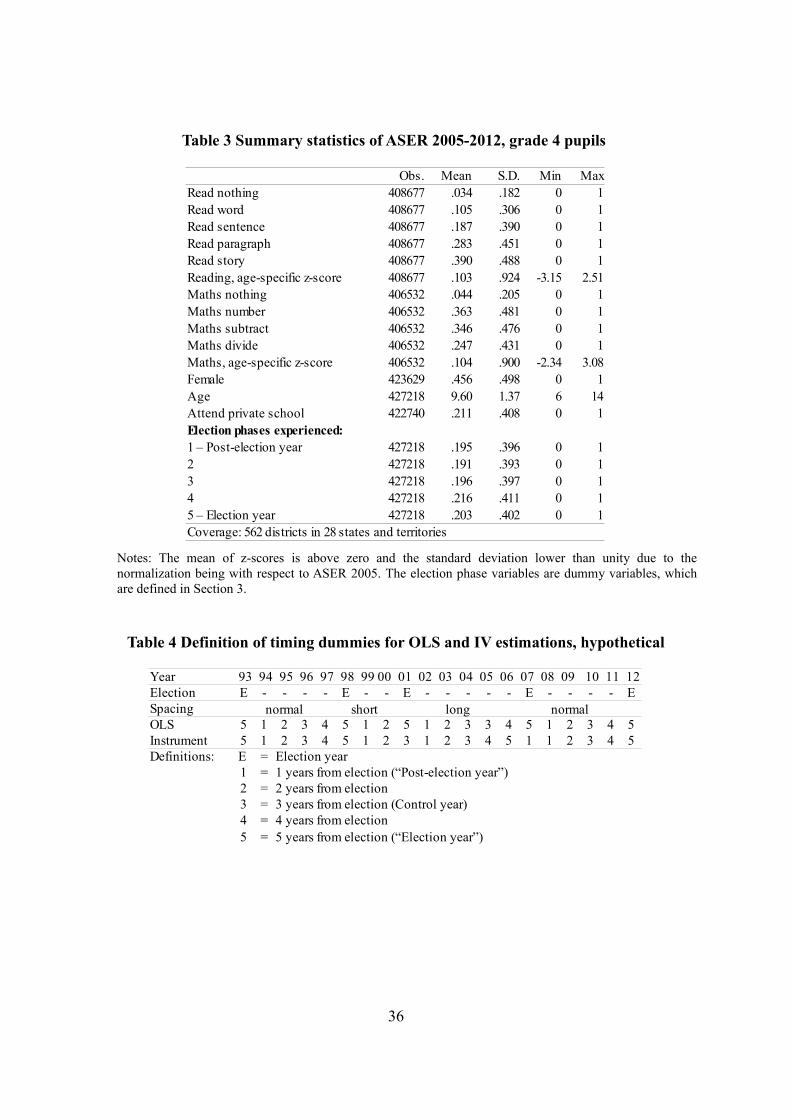
Table 3 Summary statistics of ASER 2005-2012, grade 4 pupils
Notes: The mean of z-scores is above zero and the standard deviation lower than unity due to thenormalization being with respect to ASER 2005. The election phase variables are dummy variables, whichare defined in Section 3.
Table 4 Definition of timing dummies for OLS and IV estimations, hypothetical
36
Year 93 94 95 96 97 98 99 00 01 02 03 04 05 06 07 08 09 10 11 12Election E - - - - E - - E - - - - - E - - - - ESpacing normal short long normalOLS 5 1 2 3 4 5 1 2 5 1 2 3 3 4 5 1 2 3 4 5Instrument 5 1 2 3 4 5 1 2 3 1 2 3 4 5 1 1 2 3 4 5Definitions: E = Election year
1 = 1 years from election (“Post-election year”)2 = 2 years from election3 = 3 years from election (Control year)4 = 4 years from election5 = 5 years from election (“Election year”)
Obs. Mean S.D. Min MaxRead nothing 408677 .034 .182 0 1Read word 408677 .105 .306 0 1Read sentence 408677 .187 .390 0 1Read paragraph 408677 .283 .451 0 1Read story 408677 .390 .488 0 1Reading, age-specific z-score 408677 .103 .924 -3.15 2.51Maths nothing 406532 .044 .205 0 1Maths number 406532 .363 .481 0 1Maths subtract 406532 .346 .476 0 1Maths divide 406532 .247 .431 0 1Maths, age-specific z-score 406532 .104 .900 -2.34 3.08Female 423629 .456 .498 0 1Age 427218 9.60 1.37 6 14Attend private school 422740 .211 .408 0 1Election phases experienced:1 – Post-election year 427218 .195 .396 0 12 427218 .191 .393 0 13 427218 .196 .397 0 14 427218 .216 .411 0 15 – Election year 427218 .203 .402 0 1Coverage: 562 districts in 28 states and territories

Table 5 Effects of the electoral cycle on teachers in government schools, IV estimates
Notes: All models include state trends and year effects. Summary statistics are in Tables 1 and 2. Columns 1-4 include school fixed effects, and column 5 district fixed effects. In column 1 the model is estimated usingindividual teacher data and the dependent variable is a dummy indicating that the teacher is being observedin the school for the last year. The sample in column 1 consists of regular teachers in non-private schoolswho are between 18-55 years old while other columns include teachers of all ages. Column 2 is based onschool-level data and includes para-teachers. Column 3 has a smaller sample than column 2 since someschools have zero teachers. In the model of column 5, the mean number of new hires is 211, and the standarddeviation is 374. Standard errors are clustered at the state level. (+, *, **) refer to statistical significance at10%, 5% and 1% levels, respectively.
37
[1] [2] [3] [4] [5]Dependent: Transfer # of Teachers Share of para- Non-teaching Number of teachers assignments (days) new teachers[4] .0697 .0717 -.0147 .1330 97.1 [.0418] [.0482] [.0172] [.28] [72.8][5] 'Election year' .0207 .0209 .0088 .3130 36.2 [.0185] [.0703] [.0231] [.286] [43.6][1] 'Post-Election year' .0917** .0165 .0229 .4710 25.1 [.0208] [.0601] [.0234] [.404] [33.8][2] .0065 .0476* -.0049 .5940 130* [.00903] [.023] [.0107] [.337] [65.1]Data Teacher-level School-level School-level School-level District-levelObservations 9507638 4813102 4634545 4813054 4103R-squared .022 .040 .064 .011 .148
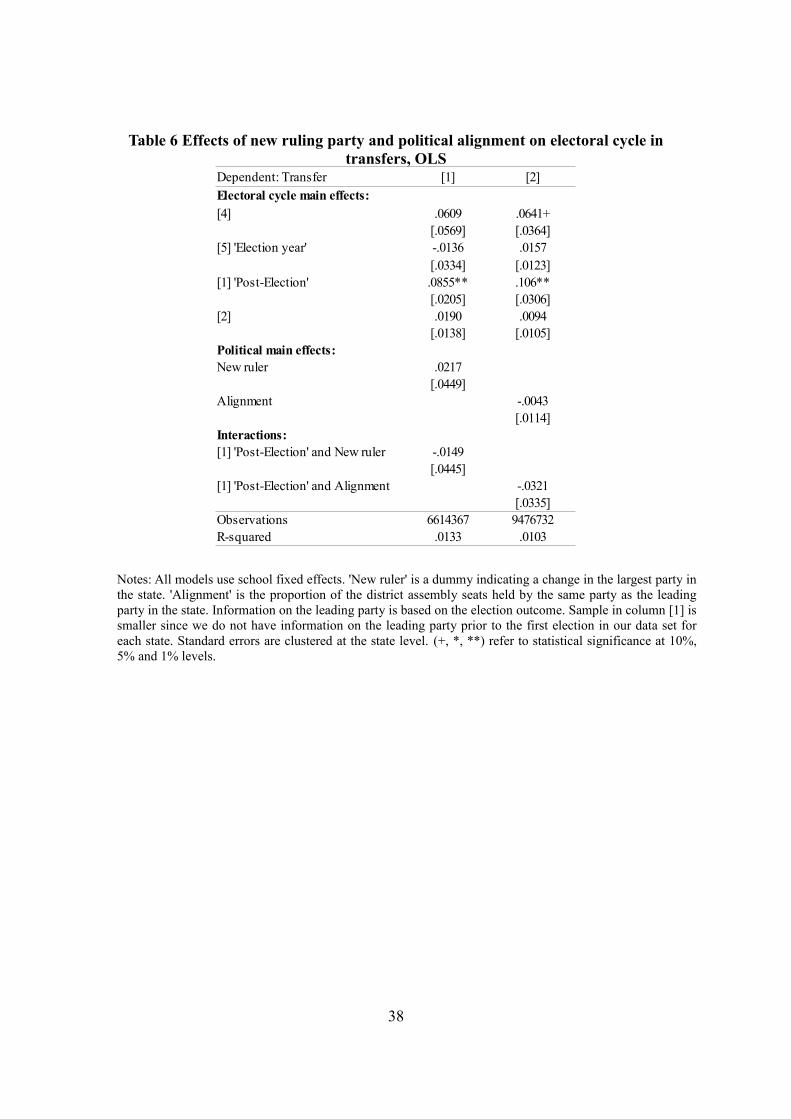
Table 6 Effects of new ruling party and political alignment on electoral cycle intransfers, OLS
Notes: All models use school fixed effects. 'New ruler' is a dummy indicating a change in the largest party inthe state. 'Alignment' is the proportion of the district assembly seats held by the same party as the leadingparty in the state. Information on the leading party is based on the election outcome. Sample in column [1] issmaller since we do not have information on the leading party prior to the first election in our data set foreach state. Standard errors are clustered at the state level. (+, *, **) refer to statistical significance at 10%,5% and 1% levels.
38
Dependent: Transfer [1] [2]Electoral cycle main effects:[4] .0609 .0641+ [.0569] [.0364][5] 'Election year' -.0136 .0157
[.0334] [.0123][1] 'Post-Election' .0855** .106**
[.0205] [.0306][2] .0190 .0094 [.0138] [.0105]Political main effects:New ruler .0217
[.0449]Alignment -.0043
[.0114]Interactions:[1] 'Post-Election' and New ruler -.0149
[.0445][1] 'Post-Election' and Alignment -.0321
[.0335]Observations 6614367 9476732R-squared .0133 .0103
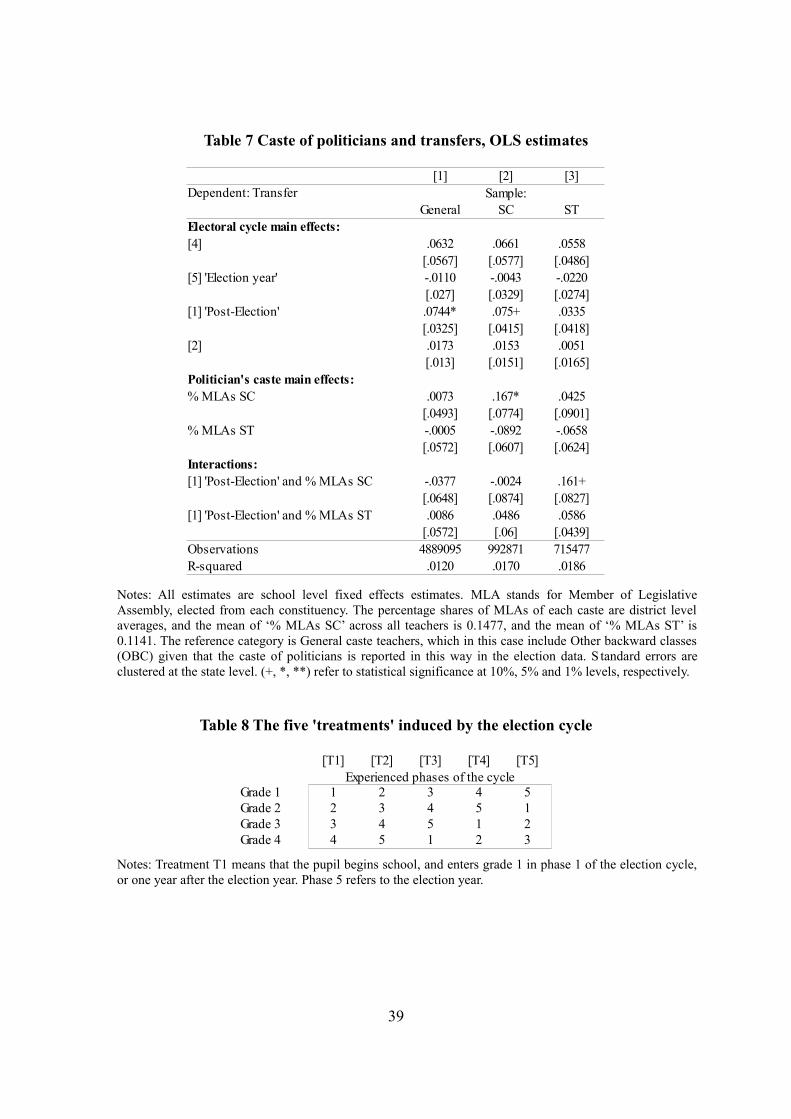
Table 7 Caste of politicians and transfers, OLS estimates
Notes: All estimates are school level fixed effects estimates. MLA stands for Member of LegislativeAssembly, elected from each constituency. The percentage shares of MLAs of each caste are district levelaverages, and the mean of ‘% MLAs SC’ across all teachers is 0.1477, and the mean of ‘% MLAs ST’ is0.1141. The reference category is General caste teachers, which in this case include Other backward classes(OBC) given that the caste of politicians is reported in this way in the election data. S tandard errors areclustered at the state level. (+, *, **) refer to statistical significance at 10%, 5% and 1% levels, respectively.
Table 8 The five 'treatments' induced by the election cycle
Notes: Treatment T1 means that the pupil begins school, and enters grade 1 in phase 1 of the election cycle,or one year after the election year. Phase 5 refers to the election year.
39
[T1] [T2] [T3] [T4] [T5]Experienced phases of the cycle
Grade 1 1 2 3 4 5Grade 2 2 3 4 5 1Grade 3 3 4 5 1 2Grade 4 4 5 1 2 3
[1] [2] [3]Dependent: Transfer Sample: General SC STElectoral cycle main effects:[4] .0632 .0661 .0558 [.0567] [.0577] [.0486][5] 'Election year' -.0110 -.0043 -.0220
[.027] [.0329] [.0274][1] 'Post-Election' .0744* .075+ .0335
[.0325] [.0415] [.0418][2] .0173 .0153 .0051 [.013] [.0151] [.0165]Politician's caste main effects:% MLAs SC .0073 .167* .0425
[.0493] [.0774] [.0901]% MLAs ST -.0005 -.0892 -.0658
[.0572] [.0607] [.0624]Interactions: [1] 'Post-Election' and % MLAs SC -.0377 -.0024 .161+
[.0648] [.0874] [.0827][1] 'Post-Election' and % MLAs ST .0086 .0486 .0586
[.0572] [.06] [.0439]Observations 4889095 992871 715477R-squared .0120 .0170 .0186

Table 9 Learning outcomes of grade 4 pupils, IV models
Notes: Each row-column cell represents the coefficient from a separate regression model (equation 2).Treatments T1-T5 are explained in Table 8. Each model includes district fixed effects, survey year controls,age and gender controls. Standard errors are clustered at the state level. (+, *, **) refer to statisticalsignificance at 10%, 5% and 1% levels.
Table 10 Learning outcomes of grade 4 pupils by current election phase, IV models
Notes: The excluded category in election phases is Treatment 2, or the election year. All models includedistrict fixed effects and year effects, and age and gender controls. Standard errors are adjusted for state levelclustering. (+, *, **) refer to statistical significance at 10%, 5% and 1% levels, respectively.
40
[1] [2] [3] [4]Government Private
Reading Maths Reading MathsTreatment / Election phase missed by grade 4T2 / Miss school year beginning in the post-election year .0843* .115** .0133 .0481+
[.0362] [.0409] [.0221] [.0273]T3 / ..phase 2 -.0130 -.0131 -.0017 -.0114
[.0263] [.0278] [.0139] [.0162]T4 / ..phase 3 -.0719** -.0703** -.0188 -.0320
[.026] [.0267] [.024] [.0287]T5 / ..phase 4 .0056 -.0191 -.0108 -.0047
[.025] [.022] [.017] [.0171]T1 / Miss school year beginning in the election year .0064 .0004 .0164 -.0020
[.0254] [.0302] [.0191] [.0199]Observations (pupils) 317762 316104 83699 83261Number of districts 562 562 562 562
[1] [2] [3] [4] Government Private
Reading Maths Reading MathsTreatment / Years from election:T3 / 1 year from elections -.0803** -.105** -.0143 -.0485*
[.0214] [.0315] [.0206] [.0232]T4 / 2 -.127** -.151** -.0298 -.0678
[.0478] [.052] [.0379] [.0456]T5 / 3 -.0655 -.109* -.0226 -.0450
[.0473] [.0472] [.028] [.0347]T1 / 4 years from elections -.0693 -.101+ -.0007 -.0420
[.0447] [.0521] [.0257] [.0295]Observations (pupils) 317762 316104 83699 83261R-squared .116 .136 .118 .129Number of districts 562 562 562 562

Table 11 District-level teacher transfers and test scores of grade 4 pupils, 2005-2010,OLS
Notes: Dependent variables are normalized z-scores. Rate of transfers is the proportion of formal teacherstransferred in in each district and year. Samples in columns 1 and 3 are pupils enrolled in governmentschools, and in columns 2 and 4, in private schools. All models use district fixed effects and control forgender, year effects and age-to-grade. Standard errors are clustered at the state level. (+, *, **) refer tostatistical significance at 10%, 5% and 1% levels.
Table 12 Reading scores of grade 4 pupils, by missed election phase during primaryschool. Sample divided by the intensity of teacher transfers in the post-election year,
IV models
Notes: β refers to the coefficient in a district-specific regression model (equation 4), where the annualteacher transfer rate is explained by the phase 1 (post-election year) dummy only. 'High' and 'Low' refer toabove and below median values (.04205). Each row-column cell represents a separate estimation. Eachmodel includes district fixed effects, survey year controls, age and gender controls. Standard errors areclustered at the state level. (+, *, **) refer to statistical significance at 10%, 5% and 1% levels.
41
[1] [2] [3] [4]Reading Mathematics
Low β districts High β districts Low β districts High β districtsTreatment T2 .0612+ .111** .0911* .148**
[.0357] [.0401] [.0393] [.0468]T3 -.0068 -.0100 -.0125 -.0093
[.0196] [.0409] [.0271] [.0429]T4 -.063** -.0642* -.0597** -.0617*
[.0229] [.0279] [.0179] [.0312]T5 -.0028 .0004 -.0129 -.0378
[.0263] [.0303] [.0269] [.0252]T1 .0114 -.0151 -.0047 -.0133
[.0225] [.0438] [.0315] [.0491]Observations 139679 174137 139030 173176Number of districts 274 280 274 280
[1] [2] [3] [4] Reading Mathematics Government Private Government PrivateRate of transfers (district level) -.0823* .037 -.164** -.051 [.0343] [.0388] [.0391] [.0453]Constant 1.23** 1.47** 1.19** 1.64** [.0338] [.0477] [.0313] [.0564]Observations 259027 61958 257629 61605R-squared .110 .128 .119 .127Number of districts 581 581 581 581
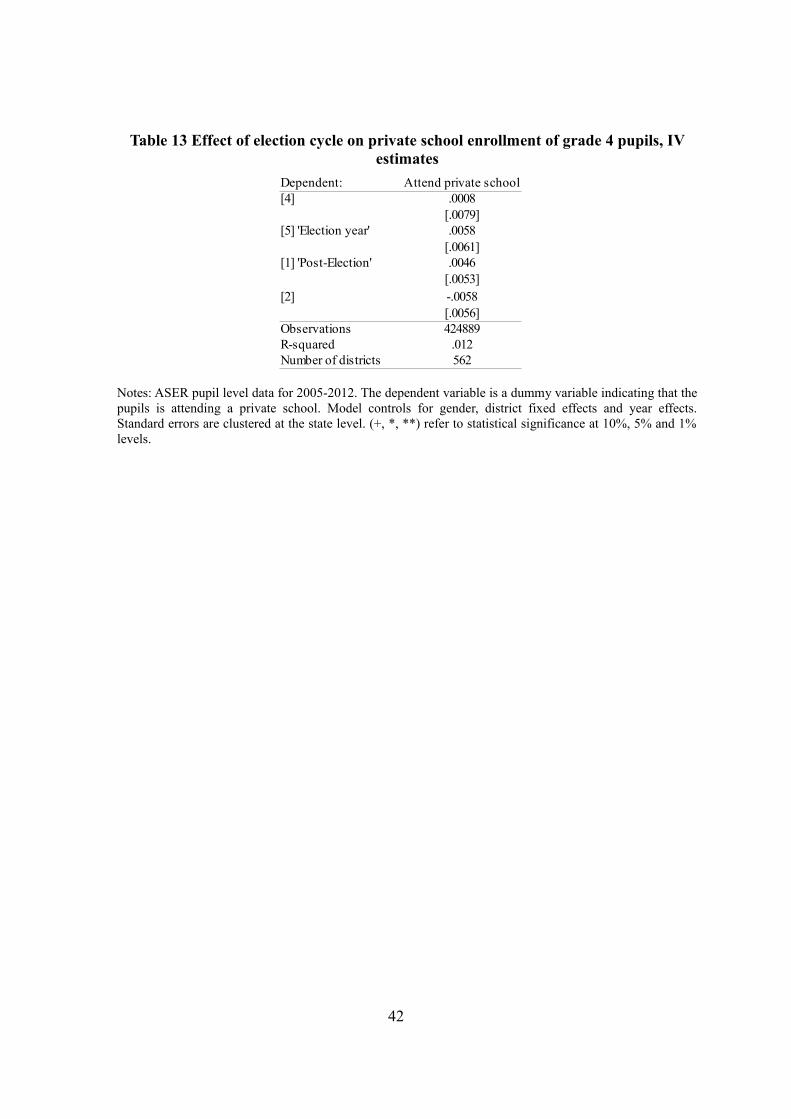
Table 13 Effect of election cycle on private school enrollment of grade 4 pupils, IVestimates
Notes: ASER pupil level data for 2005-2012. The dependent variable is a dummy variable indicating that thepupils is attending a private school. Model controls for gender, district fixed effects and year effects.Standard errors are clustered at the state level. (+, *, **) refer to statistical significance at 10%, 5% and 1%levels.
42
Dependent: Attend private school[4] .0008
[.0079][5] 'Election year' .0058
[.0061][1] 'Post-Election' .0046
[.0053][2] -.0058
[.0056]Observations 424889R-squared .012Number of districts 562
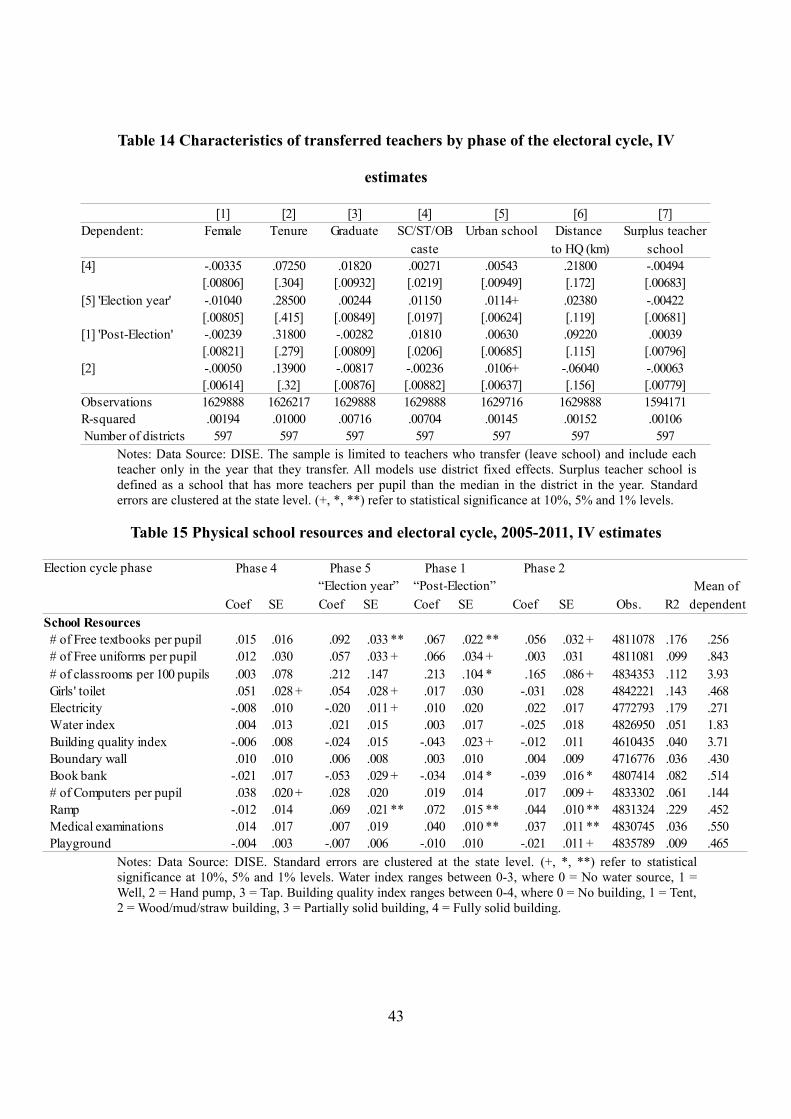
Table 14 Characteristics of transferred teachers by phase of the electoral cycle, IV
estimates
Notes: Data Source: DISE. The sample is limited to teachers who transfer (leave school) and include eachteacher only in the year that they transfer. All models use district fixed effects. Surplus teacher school isdefined as a school that has more teachers per pupil than the median in the district in the year. Standarderrors are clustered at the state level. (+, *, **) refer to statistical significance at 10%, 5% and 1% levels.
Table 15 Physical school resources and electoral cycle, 2005-2011, IV estimates
Notes: Data Source: DISE. Standard errors are clustered at the state level. (+, *, **) refer to statisticalsignificance at 10%, 5% and 1% levels. Water index ranges between 0-3, where 0 = No water source, 1 =Well, 2 = Hand pump, 3 = Tap. Building quality index ranges between 0-4, where 0 = No building, 1 = Tent,2 = Wood/mud/straw building, 3 = Partially solid building, 4 = Fully solid building.
43
Election cycle phase Phase 4 Phase 5 Phase 1 Phase 2 “Election year” “Post-Election” Mean of
Coef SE Coef SE Coef SE Coef SE Obs. R2 dependentSchool Resources # of Free textbooks per pupil .015 .016 .092 .033 ** .067 .022 ** .056 .032 + 4811078 .176 .256 # of Free uniforms per pupil .012 .030 .057 .033 + .066 .034 + .003 .031 4811081 .099 .843 # of classrooms per 100 pupils .003 .078 .212 .147 .213 .104 * .165 .086 + 4834353 .112 3.93 Girls' toilet .051 .028 + .054 .028 + .017 .030 -.031 .028 4842221 .143 .468 Electricity -.008 .010 -.020 .011 + .010 .020 .022 .017 4772793 .179 .271 Water index .004 .013 .021 .015 .003 .017 -.025 .018 4826950 .051 1.83 Building quality index -.006 .008 -.024 .015 -.043 .023 + -.012 .011 4610435 .040 3.71 Boundary wall .010 .010 .006 .008 .003 .010 .004 .009 4716776 .036 .430 Book bank -.021 .017 -.053 .029 + -.034 .014 * -.039 .016 * 4807414 .082 .514 # of Computers per pupil .038 .020 + .028 .020 .019 .014 .017 .009 + 4833302 .061 .144 Ramp -.012 .014 .069 .021 ** .072 .015 ** .044 .010 ** 4831324 .229 .452 Medical examinations .014 .017 .007 .019 .040 .010 ** .037 .011 ** 4830745 .036 .550 Playground -.004 .003 -.007 .006 -.010 .010 -.021 .011 + 4835789 .009 .465
[1] [2] [3] [4] [5] [6] [7]Dependent: Female Tenure Graduate SC/ST/OB Urban school Distance Surplus teacher caste to HQ (km) school[4] -.00335 .07250 .01820 .00271 .00543 .21800 -.00494
[.00806] [.304] [.00932] [.0219] [.00949] [.172] [.00683][5] 'Election year' -.01040 .28500 .00244 .01150 .0114+ .02380 -.00422
[.00805] [.415] [.00849] [.0197] [.00624] [.119] [.00681][1] 'Post-Election' -.00239 .31800 -.00282 .01810 .00630 .09220 .00039
[.00821] [.279] [.00809] [.0206] [.00685] [.115] [.00796][2] -.00050 .13900 -.00817 -.00236 .0106+ -.06040 -.00063
[.00614] [.32] [.00876] [.00882] [.00637] [.156] [.00779]Observations 1629888 1626217 1629888 1629888 1629716 1629888 1594171R-squared .00194 .01000 .00716 .00704 .00145 .00152 .00106Number of districts 597 597 597 597 597 597 597
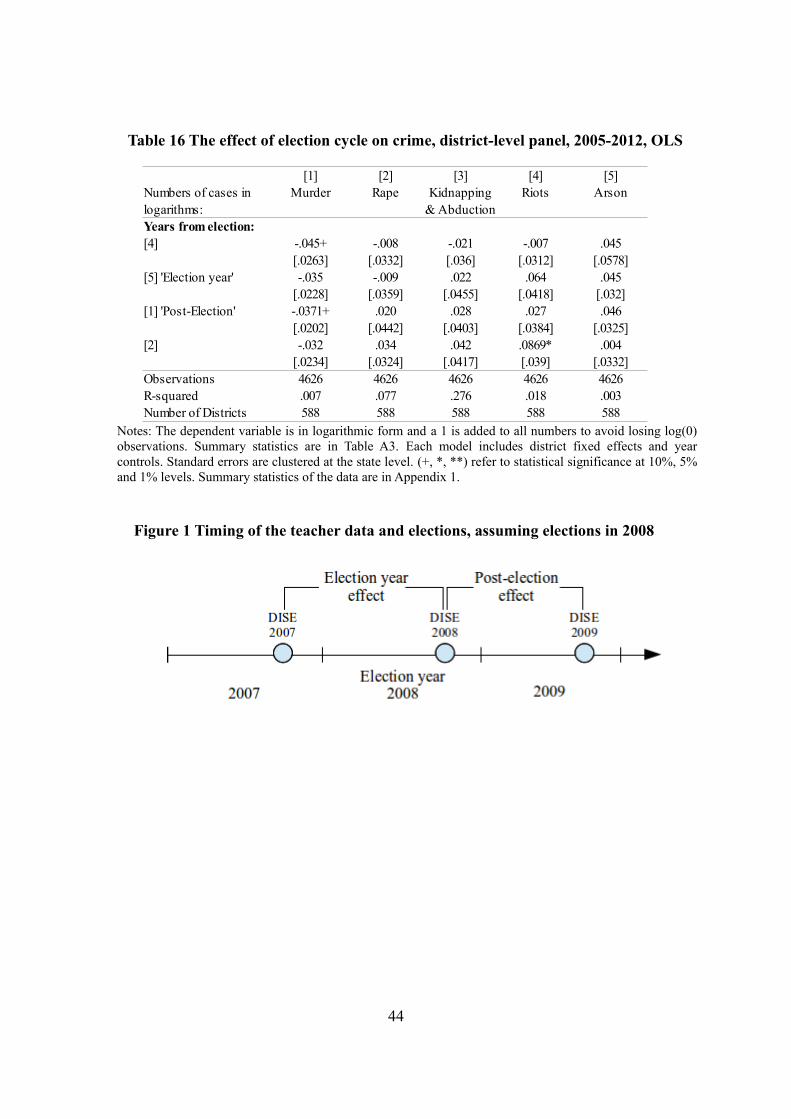
Table 16 The effect of election cycle on crime, district-level panel, 2005-2012, OLS
Notes: The dependent variable is in logarithmic form and a 1 is added to all numbers to avoid losing log(0)observations. Summary statistics are in Table A3. Each model includes district fixed effects and yearcontrols. Standard errors are clustered at the state level. (+, *, **) refer to statistical significance at 10%, 5%and 1% levels. Summary statistics of the data are in Appendix 1.
Figure 1 Timing of the teacher data and elections, assuming elections in 2008
44
[1] [2] [3] [4] [5]Numbers of cases in Murder Rape Kidnapping Riots Arsonlogarithms: & AbductionYears from election:[4] -.045+ -.008 -.021 -.007 .045
[.0263] [.0332] [.036] [.0312] [.0578][5] 'Election year' -.035 -.009 .022 .064 .045
[.0228] [.0359] [.0455] [.0418] [.032][1] 'Post-Election' -.0371+ .020 .028 .027 .046
[.0202] [.0442] [.0403] [.0384] [.0325][2] -.032 .034 .042 .0869* .004
[.0234] [.0324] [.0417] [.039] [.0332]Observations 4626 4626 4626 4626 4626R-squared .007 .077 .276 .018 .003Number of Districts 588 588 588 588 588
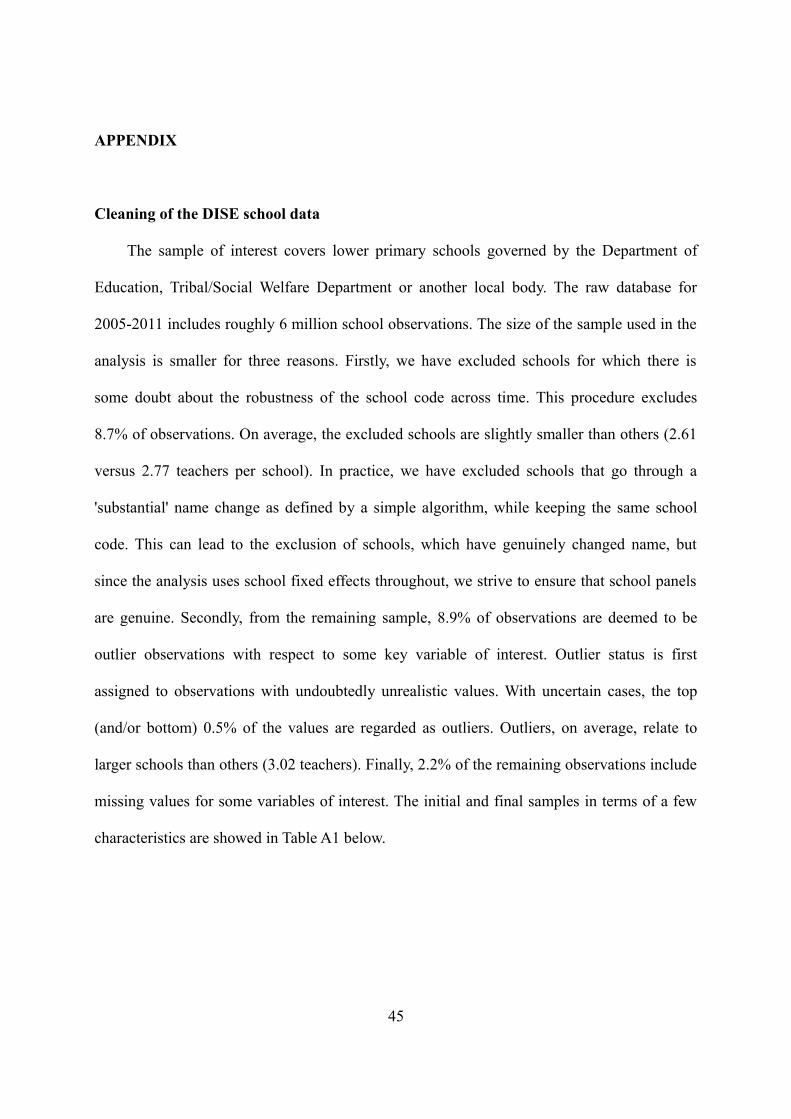
APPENDIX
Cleaning of the DISE school data
The sample of interest covers lower primary schools governed by the Department of
Education, Tribal/Social Welfare Department or another local body. The raw database for
2005-2011 includes roughly 6 million school observations. The size of the sample used in the
analysis is smaller for three reasons. Firstly, we have excluded schools for which there is
some doubt about the robustness of the school code across time. This procedure excludes
8.7% of observations. On average, the excluded schools are slightly smaller than others (2.61
versus 2.77 teachers per school). In practice, we have excluded schools that go through a
'substantial' name change as defined by a simple algorithm, while keeping the same school
code. This can lead to the exclusion of schools, which have genuinely changed name, but
since the analysis uses school fixed effects throughout, we strive to ensure that school panels
are genuine. Secondly, from the remaining sample, 8.9% of observations are deemed to be
outlier observations with respect to some key variable of interest. Outlier status is first
assigned to observations with undoubtedly unrealistic values. With uncertain cases, the top
(and/or bottom) 0.5% of the values are regarded as outliers. Outliers, on average, relate to
larger schools than others (3.02 teachers). Finally, 2.2% of the remaining observations include
missing values for some variables of interest. The initial and final samples in terms of a few
characteristics are showed in Table A1 below.
45

Table A1 Sample selection in the DISE school-level data
Table A2 Election dates 1999-2012
Source: Election Commission of India (http://eci.nic.in/eci/eci.html)
46
2012 2007 2002Gujarat Dec Gujarat Dec Gujarat Dec
Goa Jun Goa May
Punjab FebPunjab Feb
2011 2006 2001Assam Apr Assam Apr Assam May
West Bengal Apr West Bengal Apr
West Bengal May2010 2005 2000
2009
2004 1999
2008Sikkim May Goa June
Madhya Pradesh Nov 2003
NCT of Delhi Nov Delhi Nov Madhya Pradesh Nov
Himachal Pradesh Dec Himachal Pradesh Nov Jammu & Kashmir Oct Goa JanManipur Jan Uttar Pradesh Apr Manipur Feb Punjab Jan Manipur FebUttar Pradesh Jan Uttar Pradesh FebUttarakhand Jan Uttarakhand Feb Uttarakhand Feb
Kerala Apr Kerala Apr Kerala MayTamil Nadu Apr Pondicherry May
Tamil Nadu May Tamil Nadu MayPondicherry Apr Pondicherry May
Bihar Oct Bihar (re-election) Oct Bihar Feb Bihar Feb Haryana Feb
Arunachal Pradesh Oct Jharkhand Nov Manipur Feb Jharkhand Oct Haryana Feb Orissa FebHaryana Oct Maharashtra Oct Maharasthra Oct Arunachal Pradesh Oct Andhra Pradesh Apr Arunachal Pradesh Oct Andhra Pradesh Oct Orissa Apr Andhra Pradesh Apr Karnataka Oct Sikkim Apr Karnataka Apr Maharashtra Oct
Orissa Apr Sikkim Oct Chattisgarh Nov
Mizoram Dec Chattisgarh Nov
Rajasthan Dec Jammu and Kashmir Nov Mizoram Nov Karnataka May Rajasthan Nov Nagaland Mar Himachal Pradesh FebMeghalaya Mar Meghalaya Feb Tripura Mar Nagaland Feb
Tripura Feb
Raw data Change Sch. Code Outliers Final Regression sampleObservations 6059856 524356 494636 5040864 4929221
Mean S.D. Mean S.D. Mean S.D. Mean S.D. Mean S.D.Year 2008.1 2.0 2008.0 2.0 2007.9 2.3 2008.1 2.0 2008.1 2.0# of Teachers 2.77 1.95 2.61 1.80 3.02 3.15 2.76 1.81 2.76 1.80Urban school .07 .25 .05 .22 .10 .30 .07 .25 .07 .25
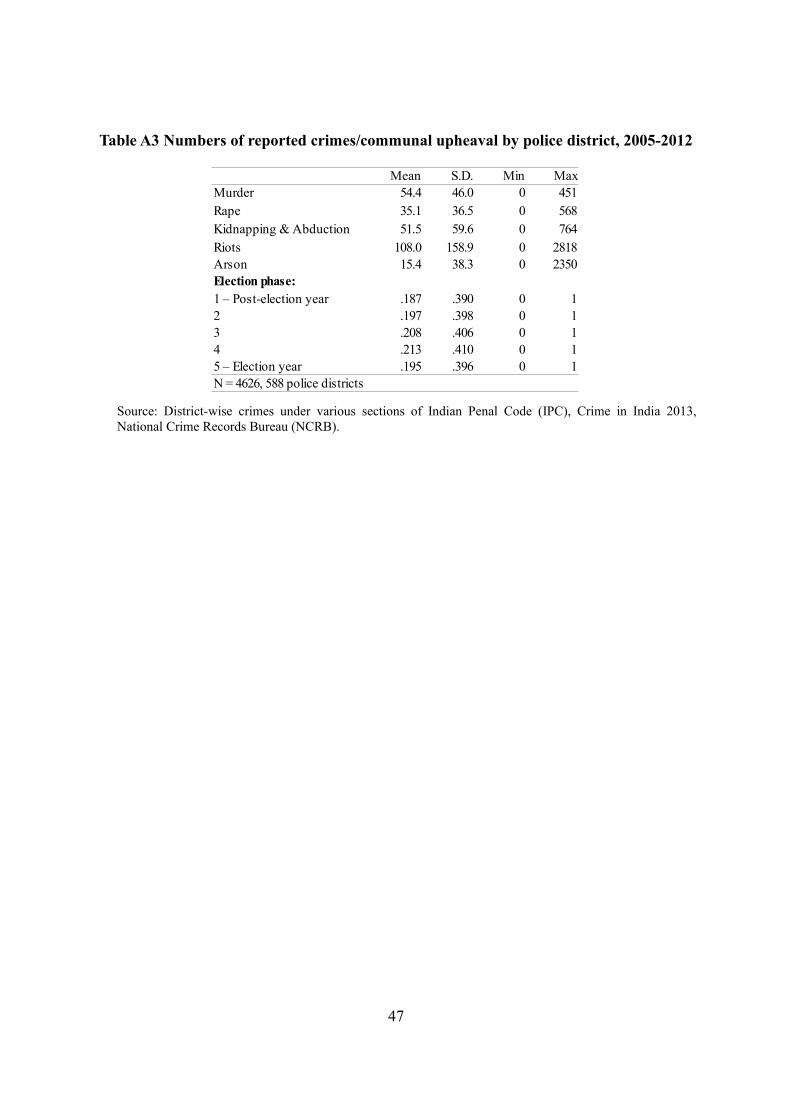
Table A3 Numbers of reported crimes/communal upheaval by police district, 2005-2012
Source: District-wise crimes under various sections of Indian Penal Code (IPC), Crime in India 2013,National Crime Records Bureau (NCRB).
47
Mean S.D. Min MaxMurder 54.4 46.0 0 451Rape 35.1 36.5 0 568Kidnapping & Abduction 51.5 59.6 0 764Riots 108.0 158.9 0 2818Arson 15.4 38.3 0 2350Election phase:1 – Post-election year .187 .390 0 12 .197 .398 0 13 .208 .406 0 14 .213 .410 0 15 – Election year .195 .396 0 1N = 4626, 588 police districts