Embed Size (px)
Citation preview

This article was downloaded by: [Tulane University]On: 30 September 2014, At: 05:01Publisher: RoutledgeInforma Ltd Registered in England and Wales Registered Number: 1072954 Registeredoffice: Mortimer House, 37-41 Mortimer Street, London W1T 3JH, UK
Educational Research and Evaluation:An International Journal on Theory andPracticePublication details, including instructions for authors andsubscription information:http://www.tandfonline.com/loi/nere20
Teachers and tests: assessing pupils'reading achievement in primary schoolsStefan Johansson a , Eva Myrberg a & Monica Rosén aa Department of Education and Special Education , University ofGothenburg , Gothenburg , SwedenPublished online: 29 Aug 2012.
To cite this article: Stefan Johansson , Eva Myrberg & Monica Rosén (2012) Teachers and tests:assessing pupils' reading achievement in primary schools, Educational Research and Evaluation: AnInternational Journal on Theory and Practice, 18:8, 693-711, DOI: 10.1080/13803611.2012.718491
To link to this article: http://dx.doi.org/10.1080/13803611.2012.718491
PLEASE SCROLL DOWN FOR ARTICLE
Taylor & Francis makes every effort to ensure the accuracy of all the information (the“Content”) contained in the publications on our platform. However, Taylor & Francis,our agents, and our licensors make no representations or warranties whatsoever as tothe accuracy, completeness, or suitability for any purpose of the Content. Any opinionsand views expressed in this publication are the opinions and views of the authors,and are not the views of or endorsed by Taylor & Francis. The accuracy of the Contentshould not be relied upon and should be independently verified with primary sourcesof information. Taylor and Francis shall not be liable for any losses, actions, claims,proceedings, demands, costs, expenses, damages, and other liabilities whatsoever orhowsoever caused arising directly or indirectly in connection with, in relation to or arisingout of the use of the Content.
This article may be used for research, teaching, and private study purposes. Anysubstantial or systematic reproduction, redistribution, reselling, loan, sub-licensing,systematic supply, or distribution in any form to anyone is expressly forbidden. Terms &Conditions of access and use can be found at http://www.tandfonline.com/page/terms-and-conditions
Teachers and tests: assessing pupils’ reading achievement
in primary schools
Stefan Johansson*, Eva Myrberg and Monica Rosen
Department of Education and Special Education, University of Gothenburg, Gothenburg, Sweden
(Received 22 December 2011; final version received 26 June 2012)
The purpose of the present study was to examine validity aspects of teachers’judgements of pupils’ reading skills. Data come from Sweden’s participation inthe Progress in International Reading Literacy Study (PIRLS) 2001, for Grades 3and 4. For pupils at the same achievement levels, as measured by PIRLS 2001test, teachers’ judgements of pupils’ achievement levels varied from one teacher toanother. Moreover, there were significant differences between teachers’ judge-ments in Grades 3 and 4. Teachers in Grade 3 who had taught their pupils foralmost 3 years showed higher correspondence between their judgements and pupilachievement within classrooms than 4th-grade teachers who, typically, had onlytaught their pupils for approximately 1 semester at the time of the data collection.The results indicate that teachers’ judgements and tests can be useful withinclassrooms, but that teachers may need external assessments to calibratejudgements over classrooms.
Keywords: teacher judgement; reading achievement; construct validity; structuralequation modelling; PIRLS 2001
Introduction
Assessment of pupil performance is an important issue for pupils, parents, teachers,principals, and stakeholders at different levels in society. Two central aims ofassessment are to promote and to evaluate learning (Broadfoot, 1996; Gipps, 1994;Weeden, Winter, & Broadfoot, 2002). In Swedish primary school, as there are noexternal exams, assessment relies heavily on teacher judgements. The inferences andactions based on interpretations of teacher judgements relate to construct validity ingeneral and the aspect of consequences in particular (Kane, 2006; Messick, 1989). Itis extremely important that teachers’ judgements are trustworthy and that teachershave the tools for making correct judgements for different purposes, such as forsupporting learning and establishing equality of assessment.
It is crucial that teachers are able to assess pupils’ competencies correctly withintheir own classroom in order to give pupils appropriate feedback and to improvetheir learning (Black & Wiliam, 1998; Hattie, 2009). Teachers’ judgements also needto be consistent between teachers, in the sense that pupils with similar knowledge
*Corresponding author. Email: [email protected]
Educational Research and Evaluation
Vol. 18, No. 8, November 2012, 693–711
ISSN 1380-3611 print/ISSN 1744-4187 online
� 2012 Taylor & Francis
http://dx.doi.org/10.1080/13803611.2012.718491
http://www.tandfonline.com
Dow
nloa
ded
by [
Tul
ane
Uni
vers
ity]
at 0
5:01
30
Sept
embe
r 20
14
levels are similarly assessed and receive similar feedback, regardless of teacher orschool.
Appropriate assessments are important in all school subjects, not least when itcomes to assessing reading and writing abilities. Learning to read and to expressoneself in writing is fundamental for continued learning and the development ofproficiency in other school subjects (Campbell, Kelly, Mullis, Martin, & Sainsbury,2001).
In the present study, pupils’ reading achievement results in the Progress inInternational Reading Literacy Study (PIRLS) 2001 as well as teacher judgement ofpupils’ reading and writing skills provide the empirical base.
Purposes
The current study aims at investigating the relationship between teacher judgementsand pupils’ reading achievement in Grades 3 and 4 in Sweden. The overall purpose isto examine construct validity in the two measures within and between classrooms.Using a data set with two grades, Grades 3 and 4, differences in teacher judgementscould be investigated. Typically, Grade 3 teachers have a teacher education designedfor working in Grades 1–3 and most follow their pupils from the start of schoolthrough to Grade 3. In Grade 4, pupils usually get a new teacher with a middle-school teacher education degree (Rosen, Myrberg, & Gustafsson, 2005).
Furthermore, gender and socioeconomic status (SES) were related to the teacherjudgements in order to address the issue of equality in assessment and to control forwhether gender and SES were related to bias in teacher judgements.
Previous research
The relationship between teacher judgement and pupil achievement has been a focusof research interest for some considerable time. Most often, correlations betweenteachers’ judgement and pupils’ academic achievement (e.g., grades, standardisedtest result) are reported at the individual level, without considering the dependenciesin the data (pupils nested within classrooms).
Most research on the relationship between teachers’ judgements and pupils’achievement has concluded that teachers are able to assess pupils reliably withintheir own class. In a review of the literature, Hoge and Coladarci (1989) examined 16studies conducted on the relationships between teacher’s judgements of pupils’achievement and the actual performance of the pupils on an independent criterion ofachievement. The median correlation between teachers’ judgements of pupils’achievement and test results was .66. A critical reader would perhaps argue thataround 50% in unexplained variance should not necessarily lead to the conclusionthat teachers’ judgements are very reliable. However, both test results and teacherjudgements are error-laden and not perfect measures of achievement. Therefore, veryhigh correlations are hard to obtain. According to Hoge and Coladarci, theagreement between the two measures of pupil achievement confirms the value ofteachers’ judgements, thus contradicting those who express doubts about teacherjudgements. They also found high variability between different studies, which couldindicate influence from moderating variables, such as teachers’ education andexperience. It has been claimed that teachers’ judgements can cover a broaderdomain of skills and knowledge than standardised testing and therefore that they
694 S. Johansson et al.
Dow
nloa
ded
by [
Tul
ane
Uni
vers
ity]
at 0
5:01
30
Sept
embe
r 20
14
should be regarded as having high credibility. Drawing on results from a large set ofstudies (30), Harlen (2005) could not find strong support for teachers’ judgementsbeing trustworthy. However, Harlen suggests that one reason for low reliability ofteachers’ judgements was the low validity of the external tests used as a comparisonfor teachers’ judgements. In a US study, Meisels, Bickel, Nicholson, Yange, andAtkins-Burnett (2001) examined the relationship between teachers’ judgements ofpupils’ reading and mathematics skills and test achievement for pupils fromKindergarten to Grade 3. The correlations typically ranged from around .50–.80with no significant differences relating to the subject domain. Kenny and Chekaluk(1993) compared pupil test achievement and two forms of teacher judgements inorder to discover the best risk predictor of educational failure. While in the firstjudgement form, teachers were asked to provide an overall statement of pupilreading achievement (advanced, average, poor), in the second teachers were asked torate their pupils on 15 aspects of reading ability. The researchers concluded that, ingeneral, the teacher judgements demonstrated substantial agreement both with eachother and with the test results. The 15-item questionnaire was found to be the bestpredictor of pupils’ achievement in Grades 1 and 2 with a correlation slightly over.70.
There is, however, limited research on the differences between teachers’judgements of pupil achievement in different grades. Meisels et al. (2001), whoestimated correlations between teacher judgements and pupils’ test scores fromKindergarten to Grade 3, found that correlations between teachers’ judgements andpupils’ achievement on tests were higher for older pupils. However, the test contentwas more expanded in the higher grades, which might indicate that a broader pictureof pupil skills was offered by the tests for older children.
From previous research, it is evident that teacher judgements and test results donot always correspond, and that neither test results nor teacher judgement should beregarded as perfectly valid measures of pupil achievement at the individual level.Teacher judgements could, for example, be influenced by pupils’ characteristics suchas gender and SES. Already in 1971, Svensson demonstrated that girls receivedslightly better grades than was justified by the national test results. This result seemsto be relatively stable in Sweden, with similar patterns occurring in a study byEmanuelsson and Fischbein (1986). In Reuterberg’s and Svensson’s (2000) study ofgender differences in mathematics, results from previous research were replicated.Klapp Lekholm and Cliffordson (2008) also investigated teachers’ grading practices,finding that girls were awarded higher grades relative to their test achievement.Svensson and Reuterberg and Svensson were able to show that national test resultsfor the different SES groups corresponded fairly well to the grade level inmathematics. In another Swedish study, Klapp Lekholm (2008) also investigatedhow pupils with different SES were graded in the ninth grade. When controlling forpupils’ results on national tests, the findings showed a negative relationship betweenSES and grades at school level. This finding points to compensatory gradingstrategies, where pupils from less advantaged home backgrounds get higher gradesthan their test results would otherwise justify.
If teachers sometimes use factors other than achievement as a basis for theirjudgements, this could be a source of the inconsistency between judgements. Formany decades, large between-classroom differences in Swedish teacher judgements ofpupils’ knowledge and skills have been observed (see, e.g., Swedish GovernmentOfficial Reports, 1942), and recent reports suggest that similar patterns exist in
Educational Research and Evaluation 695
Dow
nloa
ded
by [
Tul
ane
Uni
vers
ity]
at 0
5:01
30
Sept
embe
r 20
14
secondary school too (National Agency for Education, 2007, 2009). Without doubt,criteria are difficult to interpret in a common way among teachers and schools(Tholin, 2006). Though most research provides the picture that teachers’ judgementshave been considered as valid measures of pupils’ achievement (Gipps, 1994; Hoge &Coladarci, 1989; Meisels et al., 2001), some studies arrive at different conclusions.For example, both Harlen (2005) and Black and Wiliam (2006) have questioned thetrustworthiness of teacher judgements. With these contradictory results in mind, it isimportant, in order to obtain a more comprehensive picture, to scrutinise the natureof teacher judgements from different angles, in different contexts and educationalsettings and using different methods. It is also necessary to identify factors thatimprove the quality of teacher judgements, as well as factors that can be detrimentalfor teacher judgements. Thus, by investigating how teachers’ judgements and testswork within and between classrooms, the current study seeks to fill a gap in theongoing discussion about teacher judgements and tests.
Method
Data sources
The Progress in International Reading Literacy Study (PIRLS) is a regularlyrecurring assessment of reading achievement of Grade 4 pupils conducted by theInternational Association for the Evaluation of Educational Achievement (IEA).The international design of the PIRLS 2001 study is described in the PIRLS 2001framework (Campbell et al., 2001), as well as in the technical report (Martin, Mullis,& Kennedy, 2003). In 2001, there were 35 countries participating in the survey. Thedatabase holds information given by pupils, their parents, their teachers, and theirschool principals.
The data in the current study derive from Sweden’s participation in PIRLS 2001.In contrast to many other countries, Sweden participated with two samples, one inGrade 3 and one in Grade 4 (Rosen et al., 2005), both of which are used in thecurrent analyses. In Grade 3, 5271 pupils and 351 teachers participated, while thefourth-grade sample comprised 6044 pupils and 344 teachers. Moreover, data frompupils’ parents or guardians were obtained, with the total response rate summed upto the number of pupils in each respective grade.
Variables
Two measures of pupil achievement were used. The first measure comes from thePIRLS 2001 assessment where pupils took a standardised reading test. The PIRLSitem pool comprised 10 blocks and 98 questions, both open-ended response andmultiple choice. The test was developed by scholars from all over the world. The testswere externally corrected by trained raters. By means of item response theory (IRT),all of the pupils’ results are placed on a common scale even if they have not taken allthe test items.
In IRT methodology, an individual’s trait level is estimated from responses totest items (Embretson & Reise, 2000). The IRT scaling approach used in PIRLSis based on multiple imputation or ‘‘plausible values’’ methodology as a means ofobtaining proficiency scores in reading for all pupils. The database contains fiveplausible values for each pupil which should be used to obtain correct standarderrors. This requires that separate analyses are run for each plausible value and
696 S. Johansson et al.
Dow
nloa
ded
by [
Tul
ane
Uni
vers
ity]
at 0
5:01
30
Sept
embe
r 20
14
thereafter that the results of the five analyses are combined into a single value, byaveraging the resulting statistics (Foy & Olson, 2009; Gonzalez & Kennedy,2003). The international mean value in PIRLS is set to 500 points with astandard deviation of 100. The average score in 2001 for the Swedish thirdgraders was 523 with a standard deviation of 73. For the fourth graders, theaverage score was 563 points with a standard deviation of 66 points (Mullis,Martin, Gonzalez, & Kennedy, 2003). In Sweden, the reliability of the test wasfairly high, and the median Cronbach’s alpha across the 10 booklets amounted to0.85 (Mullis et al., 2003).
The other measure of pupil achievement used in the current study was 12teacher judgement variables contained in a diagnostic instrument the purpose ofwhich was to support teachers’ judgements of pupils’ language skills in a moresystematic manner (National Agency for Education, 2002). Building on thisdiagnostic material, the assessment aspects were reformulated as statements on ascale from 1 to 10 for each statement. The scale, on which teachers placed theirjudgements was defined by given endpoints and a midpoint, somewhat similar toa Likert scale. Here, it should be noted that although teachers do not gradepupils’ achievement with a grade in Grades 3 and 4 in Sweden, they neverthelessmake summative judgements in the form of written comments to inform pupilsand their parents about progress.
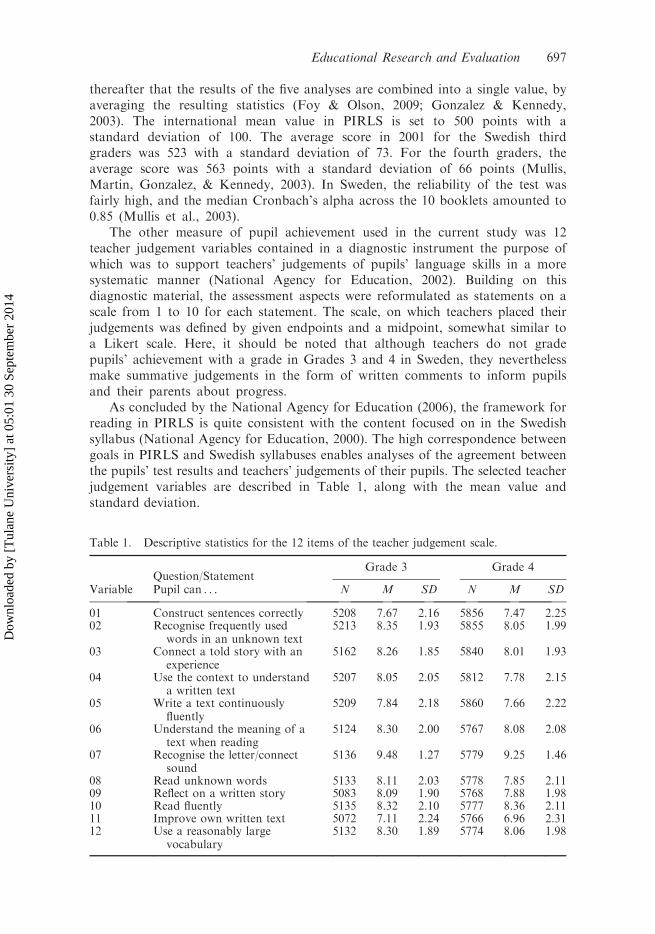
As concluded by the National Agency for Education (2006), the framework forreading in PIRLS is quite consistent with the content focused on in the Swedishsyllabus (National Agency for Education, 2000). The high correspondence betweengoals in PIRLS and Swedish syllabuses enables analyses of the agreement betweenthe pupils’ test results and teachers’ judgements of their pupils. The selected teacherjudgement variables are described in Table 1, along with the mean value andstandard deviation.
Table 1. Descriptive statistics for the 12 items of the teacher judgement scale.
Question/StatementGrade 3 Grade 4
Variable Pupil can . . . N M SD N M SD
01 Construct sentences correctly 5208 7.67 2.16 5856 7.47 2.2502 Recognise frequently used
words in an unknown text5213 8.35 1.93 5855 8.05 1.99
03 Connect a told story with anexperience
5162 8.26 1.85 5840 8.01 1.93
04 Use the context to understanda written text
5207 8.05 2.05 5812 7.78 2.15
05 Write a text continuouslyfluently
5209 7.84 2.18 5860 7.66 2.22
06 Understand the meaning of atext when reading
5124 8.30 2.00 5767 8.08 2.08
07 Recognise the letter/connectsound
5136 9.48 1.27 5779 9.25 1.46
08 Read unknown words 5133 8.11 2.03 5778 7.85 2.1109 Reflect on a written story 5083 8.09 1.90 5768 7.88 1.9810 Read fluently 5135 8.32 2.10 5777 8.36 2.1111 Improve own written text 5072 7.11 2.24 5766 6.96 2.3112 Use a reasonably large
vocabulary5132 8.30 1.89 5774 8.06 1.98
Educational Research and Evaluation 697
Dow
nloa
ded
by [
Tul
ane
Uni
vers
ity]
at 0
5:01
30
Sept
embe
r 20
14
The response rates of the questions in Table 1 ranged between 97–98%. Most ofthe items correspond quite well with the requirements of the PIRLS reading test. Inthat more than one third of the items are open-ended response questions, the testalso involves writing to a certain degree. Therefore, some statements that specificallyaddress writing skills were included (1, 5, 11, and 12). Many mean values are high,which indicates that most pupils were good readers according to their teachers. Thehigh mean values indicate the teacher judgement data have a negatively skeweddistribution. The skewness statistic ranges from –.64 to –1.41 for the 12 items. For ascale consisting of the 12 items, the statistic is7.96. Furthermore, third graders haveon average higher mean values than fourth graders, in spite of fourth graders’ betterachievement results on the PIRLS test.
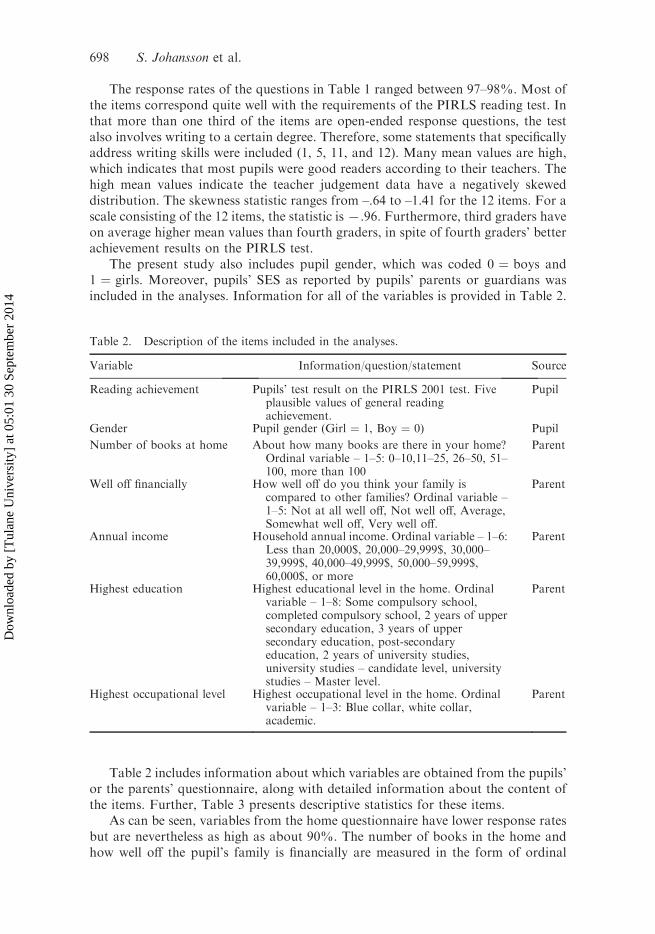
The present study also includes pupil gender, which was coded 0 ¼ boys and1 ¼ girls. Moreover, pupils’ SES as reported by pupils’ parents or guardians wasincluded in the analyses. Information for all of the variables is provided in Table 2.
Table 2 includes information about which variables are obtained from the pupils’or the parents’ questionnaire, along with detailed information about the content ofthe items. Further, Table 3 presents descriptive statistics for these items.
As can be seen, variables from the home questionnaire have lower response ratesbut are nevertheless as high as about 90%. The number of books in the home andhow well off the pupil’s family is financially are measured in the form of ordinal
Table 2. Description of the items included in the analyses.
Variable Information/question/statement Source
Reading achievement Pupils’ test result on the PIRLS 2001 test. Fiveplausible values of general readingachievement.
Pupil
Gender Pupil gender (Girl ¼ 1, Boy ¼ 0) Pupil
Number of books at home About how many books are there in your home?Ordinal variable – 1–5: 0–10,11–25, 26–50, 51–100, more than 100
Parent
Well off financially How well off do you think your family iscompared to other families? Ordinal variable –1–5: Not at all well off, Not well off, Average,Somewhat well off, Very well off.
Parent
Annual income Household annual income. Ordinal variable – 1–6:Less than 20,000$, 20,000–29,999$, 30,000–39,999$, 40,000–49,999$, 50,000–59,999$,60,000$, or more
Parent
Highest education Highest educational level in the home. Ordinalvariable – 1–8: Some compulsory school,completed compulsory school, 2 years of uppersecondary education, 3 years of uppersecondary education, post-secondaryeducation, 2 years of university studies,university studies – candidate level, universitystudies – Master level.
Parent
Highest occupational level Highest occupational level in the home. Ordinalvariable – 1–3: Blue collar, white collar,academic.
Parent
698 S. Johansson et al.
Dow
nloa
ded
by [
Tul
ane
Uni
vers
ity]
at 0
5:01
30
Sept
embe
r 20
14
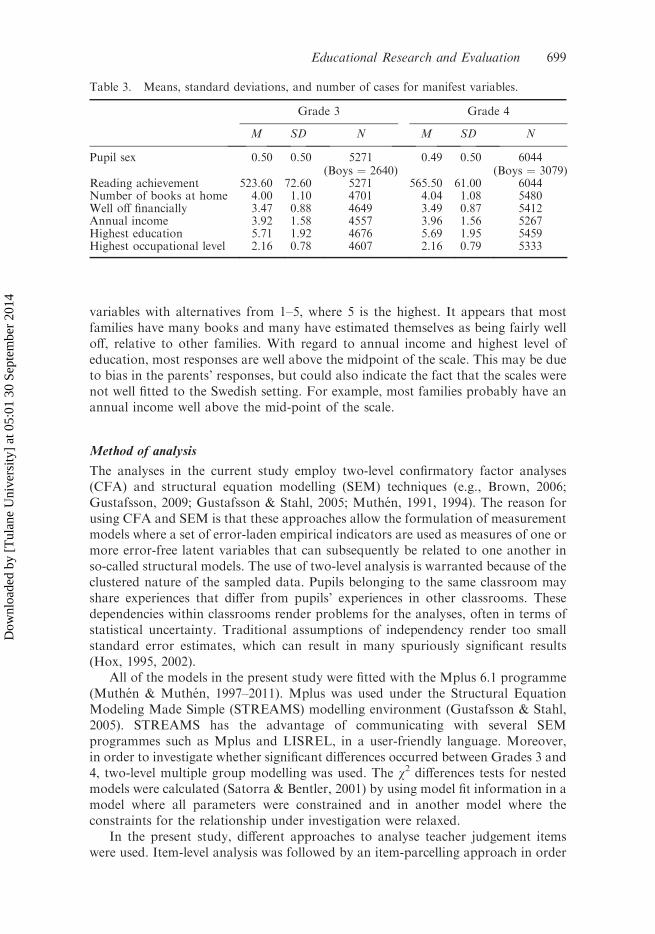
variables with alternatives from 1–5, where 5 is the highest. It appears that mostfamilies have many books and many have estimated themselves as being fairly welloff, relative to other families. With regard to annual income and highest level ofeducation, most responses are well above the midpoint of the scale. This may be dueto bias in the parents’ responses, but could also indicate the fact that the scales werenot well fitted to the Swedish setting. For example, most families probably have anannual income well above the mid-point of the scale.
Method of analysis
The analyses in the current study employ two-level confirmatory factor analyses(CFA) and structural equation modelling (SEM) techniques (e.g., Brown, 2006;Gustafsson, 2009; Gustafsson & Stahl, 2005; Muthen, 1991, 1994). The reason forusing CFA and SEM is that these approaches allow the formulation of measurementmodels where a set of error-laden empirical indicators are used as measures of one ormore error-free latent variables that can subsequently be related to one another inso-called structural models. The use of two-level analysis is warranted because of theclustered nature of the sampled data. Pupils belonging to the same classroom mayshare experiences that differ from pupils’ experiences in other classrooms. Thesedependencies within classrooms render problems for the analyses, often in terms ofstatistical uncertainty. Traditional assumptions of independency render too smallstandard error estimates, which can result in many spuriously significant results(Hox, 1995, 2002).
All of the models in the present study were fitted with the Mplus 6.1 programme(Muthen & Muthen, 1997–2011). Mplus was used under the Structural EquationModeling Made Simple (STREAMS) modelling environment (Gustafsson & Stahl,2005). STREAMS has the advantage of communicating with several SEMprogrammes such as Mplus and LISREL, in a user-friendly language. Moreover,in order to investigate whether significant differences occurred between Grades 3 and4, two-level multiple group modelling was used. The w2 differences tests for nestedmodels were calculated (Satorra & Bentler, 2001) by using model fit information in amodel where all parameters were constrained and in another model where theconstraints for the relationship under investigation were relaxed.
In the present study, different approaches to analyse teacher judgement itemswere used. Item-level analysis was followed by an item-parcelling approach in order
Table 3. Means, standard deviations, and number of cases for manifest variables.
Grade 3 Grade 4
M SD N M SD N
Pupil sex 0.50 0.50 5271(Boys ¼ 2640)
0.49 0.50 6044(Boys ¼ 3079)
Reading achievement 523.60 72.60 5271 565.50 61.00 6044Number of books at home 4.00 1.10 4701 4.04 1.08 5480Well off financially 3.47 0.88 4649 3.49 0.87 5412Annual income 3.92 1.58 4557 3.96 1.56 5267Highest education 5.71 1.92 4676 5.69 1.95 5459Highest occupational level 2.16 0.78 4607 2.16 0.79 5333
Educational Research and Evaluation 699
Dow
nloa
ded
by [
Tul
ane
Uni
vers
ity]
at 0
5:01
30
Sept
embe
r 20
14
to obtain indicators with better measurement properties. Compared to data aggregatedinto parcels, item-level data are often associated with lower reliability and lowercommunality. They also have fewer, larger, and less equal intervals between scale pointsthan is the case for parcels (see, e.g., Bagozzi & Heatherton, 1994; Hau &Marsh, 2001;Kishton & Widaman, 1994; Little, Cunningham, Shahar, & Widaman, 2002). Due topsychometric and estimation advantages using parcels, the overall model fit usuallybecomes more acceptable. However, when a construct is not unidimensional and whenit is unclear what dimensions underlie a construct, it can be problematic to adopt item-parcelling techniques. For example, Bagozzi and Heatherton (1994) have stated thatonly under conditions of unidimensionality should parcelling be considered. However,if the global construct and the relations among constructs form the focus of themodelling, parcelling is better warranted (Little et al., 2002).
The proportion of missing data was very small, most of the items having responserates well above 90%. However, in order to take advantage of all availableinformation, the full information maximum likelihood (FIML) estimator in Mpluswas used. There are many recommendations about what fit indices are to bereported, and which cutoffs are to be used. Several researchers state, however, thatthere are no golden rules or explicit cutoff values, and that one should not reject amodel without careful examination (Bentler, 2007; Goffin, 2007; Markland, 2007). Inthe analyses in this paper, the most commonly used indices provided by Mplus (w2,comparative fit index [CFI], root mean square error approximation [RMSEA], andstandardized root mean square residual [SRMR]) are reported.
Results
Modelling teacher judgement
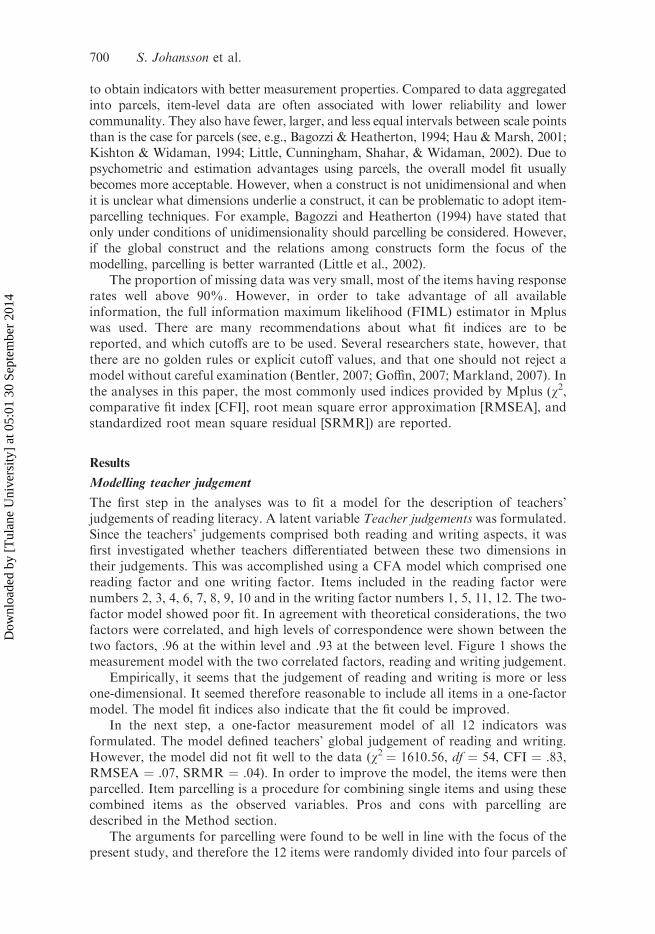
The first step in the analyses was to fit a model for the description of teachers’judgements of reading literacy. A latent variable Teacher judgements was formulated.Since the teachers’ judgements comprised both reading and writing aspects, it wasfirst investigated whether teachers differentiated between these two dimensions intheir judgements. This was accomplished using a CFA model which comprised onereading factor and one writing factor. Items included in the reading factor werenumbers 2, 3, 4, 6, 7, 8, 9, 10 and in the writing factor numbers 1, 5, 11, 12. The two-factor model showed poor fit. In agreement with theoretical considerations, the twofactors were correlated, and high levels of correspondence were shown between thetwo factors, .96 at the within level and .93 at the between level. Figure 1 shows themeasurement model with the two correlated factors, reading and writing judgement.
Empirically, it seems that the judgement of reading and writing is more or lessone-dimensional. It seemed therefore reasonable to include all items in a one-factormodel. The model fit indices also indicate that the fit could be improved.
In the next step, a one-factor measurement model of all 12 indicators wasformulated. The model defined teachers’ global judgement of reading and writing.However, the model did not fit well to the data (w2 ¼ 1610.56, df ¼ 54, CFI ¼ .83,RMSEA ¼ .07, SRMR ¼ .04). In order to improve the model, the items were thenparcelled. Item parcelling is a procedure for combining single items and using thesecombined items as the observed variables. Pros and cons with parcelling aredescribed in the Method section.
The arguments for parcelling were found to be well in line with the focus of thepresent study, and therefore the 12 items were randomly divided into four parcels of
700 S. Johansson et al.
Dow
nloa
ded
by [
Tul
ane
Uni
vers
ity]
at 0
5:01
30
Sept
embe
r 20
14
three items each. The three items were summed, and thus the scale could range from1–30. The four parcels were then used as indicators of the latent variable calledTeacher judgements (Teachers’ judgements of pupils’ reading literacy).
Teacher judgement at two levels
It was necessary to discover whether between-class effects were present in thejudgement data before analysis at the two levels could be made. Therefore, theintraclass correlations were determined. In situations where the intraclass correlationsare .05 or higher, two-level modelling is justified (Muthen, 1994). In the present case,the intraclass correlations were about .35 for the parcel variables, and two-levelmodelling was thus deemed suitable. The two-level model with four parcel variablesobtained close fit and rendered high and even factor loadings. First, the variance in thelatent teacher judgement variable was decomposed into one ‘‘within-classroom level’’dimension and one ‘‘between-classroom level’’ dimension. The two-level measurementmodel along with its factor loadings and model fit is presented in Figure 2.
Figure 1. Two-factor model with one reading and one writing factor.Note: All factors loadings are significant. p 5 .001. Total sample: w2 ¼ 6112.39, df ¼ 106,CFI ¼ .89, RMSEA ¼ .07 SRMRw (within level) ¼ .04 SRMRb (between level) ¼ .08.
Educational Research and Evaluation 701
Dow
nloa
ded
by [
Tul
ane
Uni
vers
ity]
at 0
5:01
30
Sept
embe
r 20
14
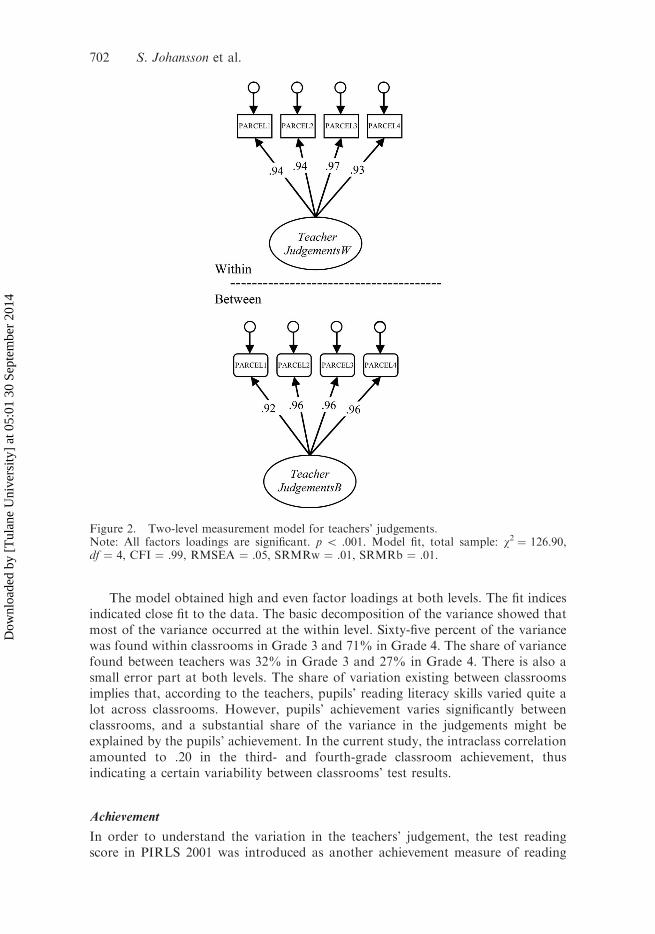
The model obtained high and even factor loadings at both levels. The fit indicesindicated close fit to the data. The basic decomposition of the variance showed thatmost of the variance occurred at the within level. Sixty-five percent of the variancewas found within classrooms in Grade 3 and 71% in Grade 4. The share of variancefound between teachers was 32% in Grade 3 and 27% in Grade 4. There is also asmall error part at both levels. The share of variation existing between classroomsimplies that, according to the teachers, pupils’ reading literacy skills varied quite alot across classrooms. However, pupils’ achievement varies significantly betweenclassrooms, and a substantial share of the variance in the judgements might beexplained by the pupils’ achievement. In the current study, the intraclass correlationamounted to .20 in the third- and fourth-grade classroom achievement, thusindicating a certain variability between classrooms’ test results.
Achievement
In order to understand the variation in the teachers’ judgement, the test readingscore in PIRLS 2001 was introduced as another achievement measure of reading
Figure 2. Two-level measurement model for teachers’ judgements.Note: All factors loadings are significant. p 5 .001. Model fit, total sample: w2 ¼ 126.90,df ¼ 4, CFI ¼ .99, RMSEA ¼ .05, SRMRw ¼ .01, SRMRb ¼ .01.
702 S. Johansson et al.
Dow
nloa
ded
by [
Tul
ane
Uni
vers
ity]
at 0
5:01
30
Sept
embe
r 20
14
literacy. At the within level, this step addresses the extent to which the two measuresaddress the same abilities. To begin with, the relationship turned out to be not quitethe same in Grades 3 and 4. The within-class correlation between Teacher judgementsand ‘‘Achievement’’ amounted to .65 in Grade 3 and .59 in Grade 4 with thedifference between the two grades being significant according to a significant w2 testfor nested models.
Furthermore, to address the question of whether teachers’ judgements wereconsistent, the relation between Teacher judgements and ‘‘Achievement’’ wasexamined at the classroom level. The between-level represents how the teacherjudges his/her class in comparison to how other teachers judge their class. A highcorrelation would indicate that teachers’ average judgements correspond well withthe classrooms’ average test score. In other words, high average test performancesshould render high average judgements. However, when tested, the low correlation(Grade 3 ¼ .25, Grade 4 ¼ .18) does not support such an inference. Instead, low-achieving classrooms might well have a higher average judgement than high-achieving classrooms.
An approach without latent variables was also used, where a scale of the 12 singlejudgement items was related to ‘‘Achievement’’. Compared to the error-free latent-variable approach, this classic approach produced a slightly lower correlation to‘‘Achievement’’ at the within level and a slightly higher correlation at the betweenlevel. At the within level, the estimates were .63 for Grade 3 and .58 for the Grade 4.At the between level, the corresponding estimates were .28 and .19 for third andfourth grades. The small differences between the approaches may be due to the highreliability of the summed scale, which yielded a Cronbach’s alpha of .97. Moreover,the classical approach without taking the between-level effect into account yielded anestimate of .51 for the relation between judgements and test results at the individuallevel.
Gender and SES
In order to examine whether teachers’ judgements were subject to bias, pupil genderand SES were introduced in the model. Gender was introduced as a dummy variable.Two other points should be noted. First, girls’ achievement was significantly better inboth grades (Grade 3 ¼ .15, Grade 4 ¼ .18). Second, the relation between genderand teacher judgement was examined when the test result was kept constant forgender. The results showed that at an equal level of achievement, girls tended toreceive slightly higher judgements than boys, although the effect was quite modest(Grade 3 ¼ .10, Grade 4 ¼ .09). There were no between-class effects for gender.Further, when gender was included in the model the relationship between Teacherjudgements and ‘‘Achievement’’ did not change.
The overall model fit improved as the covariates were introduced, and for all ofthe SEMs acceptable to close fits were obtained. The goodness-of-fit indices areprovided in Table 4.
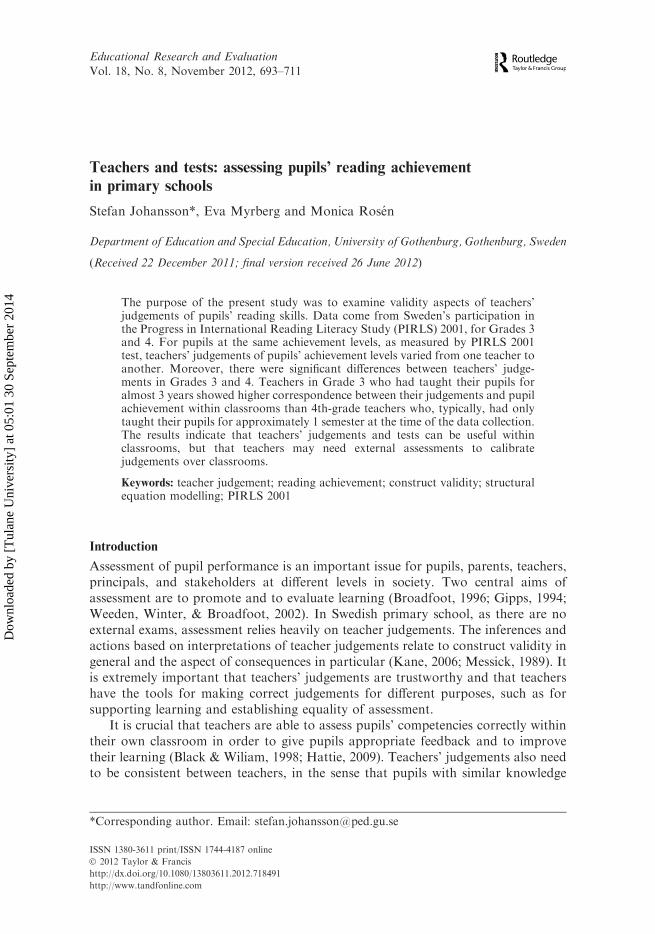
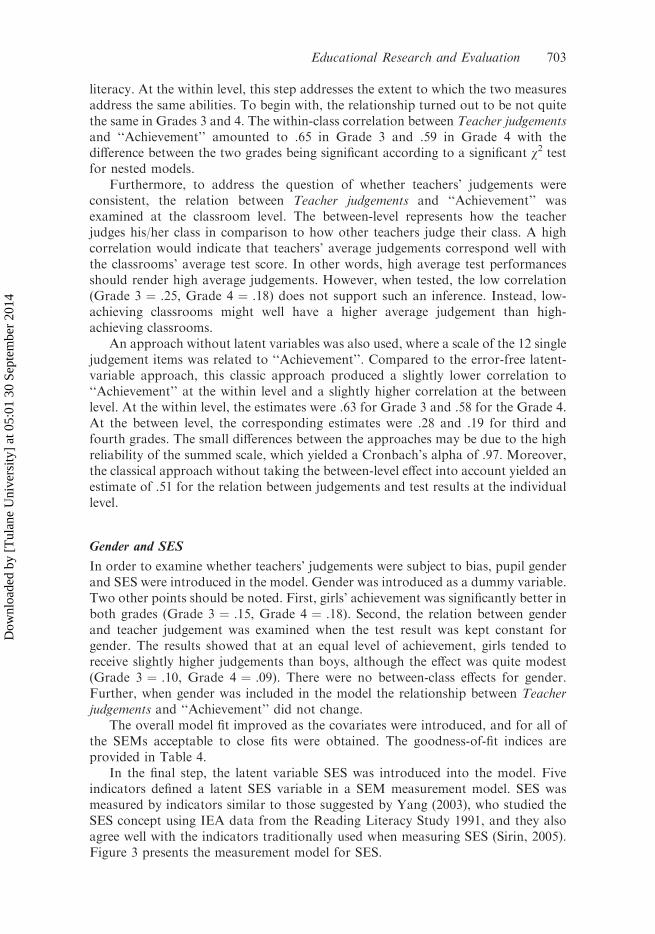
In the final step, the latent variable SES was introduced into the model. Fiveindicators defined a latent SES variable in a SEM measurement model. SES wasmeasured by indicators similar to those suggested by Yang (2003), who studied theSES concept using IEA data from the Reading Literacy Study 1991, and they alsoagree well with the indicators traditionally used when measuring SES (Sirin, 2005).Figure 3 presents the measurement model for SES.
Educational Research and Evaluation 703
Dow
nloa
ded
by [
Tul
ane
Uni
vers
ity]
at 0
5:01
30
Sept
embe
r 20
14
The residuals of the two indicators referring to household financial situation,‘‘income’’ and ‘‘well off’’, were allowed to co-vary in that, besides their relation toSES, they also shared some item-specific variance. The variable was set as a predictorof teachers’ judgements and pupils’ test results at both the within and between levels.The measurement model of pupils’ SES obtained close fit to the data.
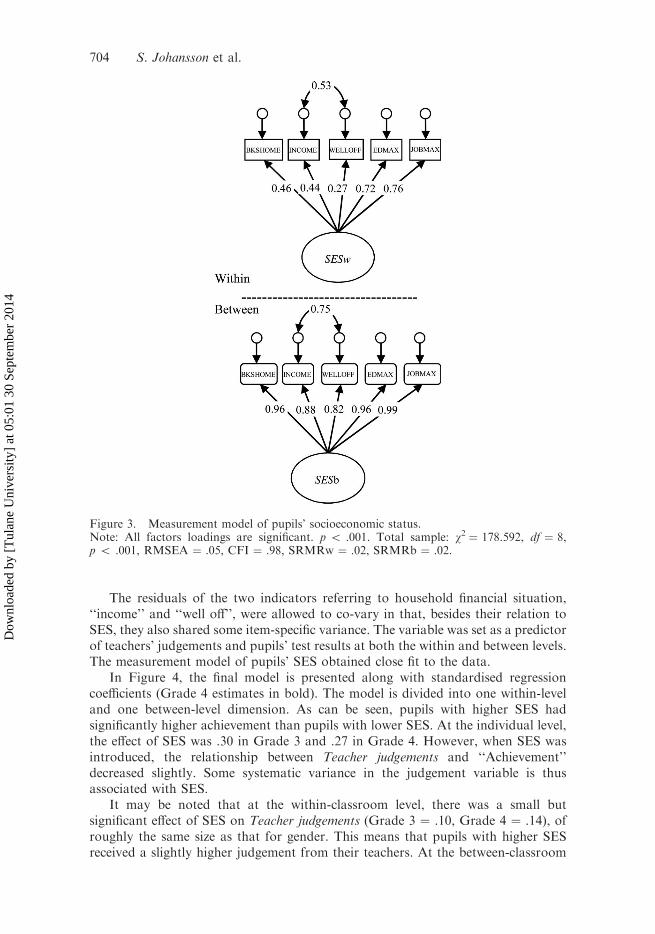
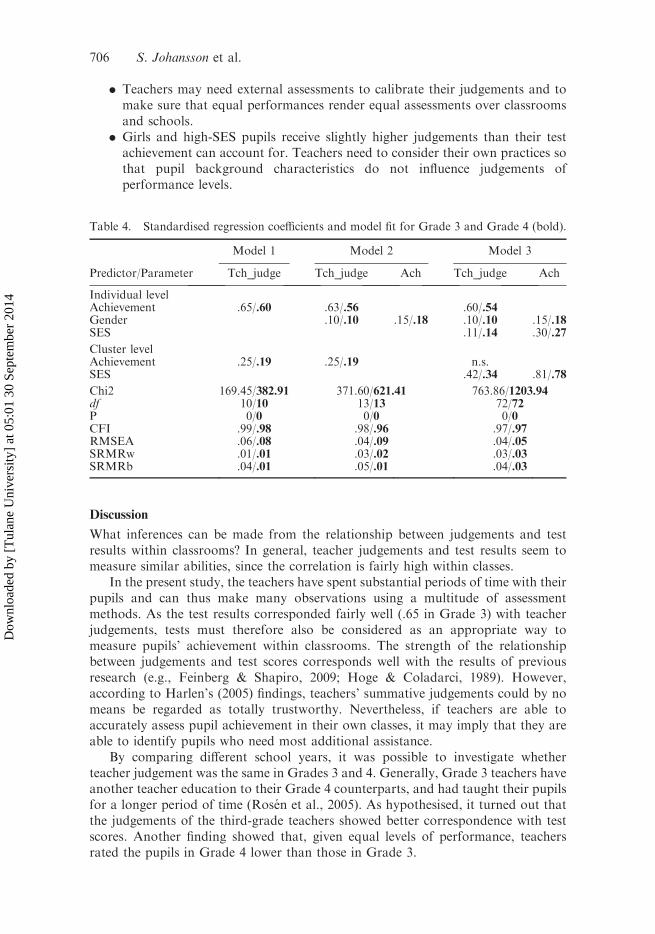
In Figure 4, the final model is presented along with standardised regressioncoefficients (Grade 4 estimates in bold). The model is divided into one within-leveland one between-level dimension. As can be seen, pupils with higher SES hadsignificantly higher achievement than pupils with lower SES. At the individual level,the effect of SES was .30 in Grade 3 and .27 in Grade 4. However, when SES wasintroduced, the relationship between Teacher judgements and ‘‘Achievement’’decreased slightly. Some systematic variance in the judgement variable is thusassociated with SES.
It may be noted that at the within-classroom level, there was a small butsignificant effect of SES on Teacher judgements (Grade 3 ¼ .10, Grade 4 ¼ .14), ofroughly the same size as that for gender. This means that pupils with higher SESreceived a slightly higher judgement from their teachers. At the between-classroom
Figure 3. Measurement model of pupils’ socioeconomic status.Note: All factors loadings are significant. p 5 .001. Total sample: w2 ¼ 178.592, df ¼ 8,p 5 .001, RMSEA ¼ .05, CFI ¼ .98, SRMRw ¼ .02, SRMRb ¼ .02.
704 S. Johansson et al.
Dow
nloa
ded
by [
Tul
ane
Uni
vers
ity]
at 0
5:01
30
Sept
embe
r 20
14
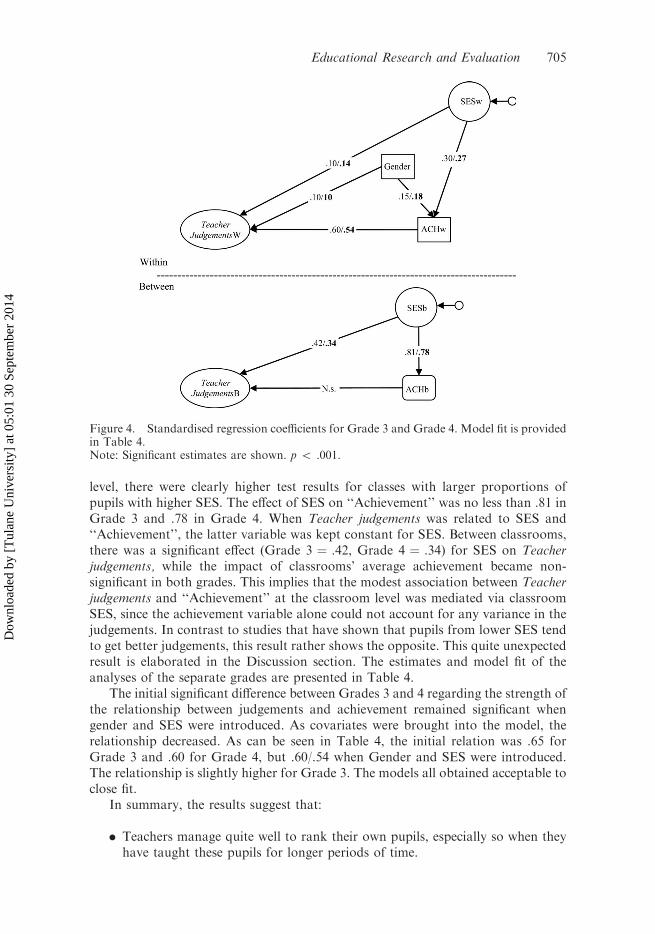
level, there were clearly higher test results for classes with larger proportions ofpupils with higher SES. The effect of SES on ‘‘Achievement’’ was no less than .81 inGrade 3 and .78 in Grade 4. When Teacher judgements was related to SES and‘‘Achievement’’, the latter variable was kept constant for SES. Between classrooms,there was a significant effect (Grade 3 ¼ .42, Grade 4 ¼ .34) for SES on Teacherjudgements, while the impact of classrooms’ average achievement became non-significant in both grades. This implies that the modest association between Teacherjudgements and ‘‘Achievement’’ at the classroom level was mediated via classroomSES, since the achievement variable alone could not account for any variance in thejudgements. In contrast to studies that have shown that pupils from lower SES tendto get better judgements, this result rather shows the opposite. This quite unexpectedresult is elaborated in the Discussion section. The estimates and model fit of theanalyses of the separate grades are presented in Table 4.
The initial significant difference between Grades 3 and 4 regarding the strength ofthe relationship between judgements and achievement remained significant whengender and SES were introduced. As covariates were brought into the model, therelationship decreased. As can be seen in Table 4, the initial relation was .65 forGrade 3 and .60 for Grade 4, but .60/.54 when Gender and SES were introduced.The relationship is slightly higher for Grade 3. The models all obtained acceptable toclose fit.
In summary, the results suggest that:
. Teachers manage quite well to rank their own pupils, especially so when theyhave taught these pupils for longer periods of time.
Figure 4. Standardised regression coefficients for Grade 3 and Grade 4. Model fit is providedin Table 4.Note: Significant estimates are shown. p 5 .001.
Educational Research and Evaluation 705
Dow
nloa
ded
by [
Tul
ane
Uni
vers
ity]
at 0
5:01
30
Sept
embe
r 20
14
. Teachers may need external assessments to calibrate their judgements and tomake sure that equal performances render equal assessments over classroomsand schools.
. Girls and high-SES pupils receive slightly higher judgements than their testachievement can account for. Teachers need to consider their own practices sothat pupil background characteristics do not influence judgements ofperformance levels.
Discussion
What inferences can be made from the relationship between judgements and testresults within classrooms? In general, teacher judgements and test results seem tomeasure similar abilities, since the correlation is fairly high within classes.
In the present study, the teachers have spent substantial periods of time with theirpupils and can thus make many observations using a multitude of assessmentmethods. As the test results corresponded fairly well (.65 in Grade 3) with teacherjudgements, tests must therefore also be considered as an appropriate way tomeasure pupils’ achievement within classrooms. The strength of the relationshipbetween judgements and test scores corresponds well with the results of previousresearch (e.g., Feinberg & Shapiro, 2009; Hoge & Coladarci, 1989). However,according to Harlen’s (2005) findings, teachers’ summative judgements could by nomeans be regarded as totally trustworthy. Nevertheless, if teachers are able toaccurately assess pupil achievement in their own classes, it may imply that they areable to identify pupils who need most additional assistance.
By comparing different school years, it was possible to investigate whetherteacher judgement was the same in Grades 3 and 4. Generally, Grade 3 teachers haveanother teacher education to their Grade 4 counterparts, and had taught their pupilsfor a longer period of time (Rosen et al., 2005). As hypothesised, it turned out thatthe judgements of the third-grade teachers showed better correspondence with testscores. Another finding showed that, given equal levels of performance, teachersrated the pupils in Grade 4 lower than those in Grade 3.
Table 4. Standardised regression coefficients and model fit for Grade 3 and Grade 4 (bold).
Model 1 Model 2 Model 3
Predictor/Parameter Tch_judge Tch_judge Ach Tch_judge Ach
Individual levelAchievement .65/.60 .63/.56 .60/.54Gender .10/.10 .15/.18 .10/.10 .15/.18SES .11/.14 .30/.27
Cluster levelAchievement .25/.19 .25/.19 n.s.SES .42/.34 .81/.78
Chi2 169.45/382.91 371.60/621.41 763.86/1203.94df 10/10 13/13 72/72P 0/0 0/0 0/0CFI .99/.98 .98/.96 .97/.97RMSEA .06/.08 .04/.09 .04/.05SRMRw .01/.01 .03/.02 .03/.03SRMRb .04/.01 .05/.01 .04/.03
706 S. Johansson et al.
Dow
nloa
ded
by [
Tul
ane
Uni
vers
ity]
at 0
5:01
30
Sept
embe
r 20
14
These differences may have several causes. The differing emphasis on how thedevelopment of pupils’ reading literacy skills should be supported and how readingliteracy should be defined in the two types of teacher education may be one factor.Another may be that teachers have probably known their pupils for varying periodsof time; many third-grade teachers have taught the same pupils for almost 3 years,while the majority of fourth-grade teachers have only taught the pupils’ in this studyfor a single semester. As many third-grade teachers have followed the pupils’development over a 3-year period, they have, in contrast to the Grade 4 teachers,been able to follow reading literacy progression. In their diagnostic material, theNational Agency for Education (2002) focuses explicitly on progression. Teachersare required to monitor pupils’ progression and take this into account in theirassessments. It is also likely that fourth-grade teachers tend to be more demanding intheir judgements since they usually also teach older pupils (in Grades 4–6 or 4–9).Furthermore, there is a greater demand in Grade 4 than in Grade 3 to use readingability in order to learn the content in other school subjects where the focus onlearning to read is greater. Thereby, the teacher observations in Grade 4 may, due tothe more difficult reading material, be somewhat harsher. All these differences maybe related to the ‘‘anchoring’’ effect as described by Tversky and Kahneman (1974).Anchoring affects peoples’ decision making in different estimations by biasinganswers toward the starting points or initial values.
As the PIRLS test was corrected by external markers, it was possible to addressthe question of whether teacher judgements are valid measures for comparisonsacross classrooms (between teachers). The results showed that there was littleagreement between teachers’ judgements. While one teacher could rate his or herpupils at a moderate level, when the mean achievement of the class was high, anothercould do it the other way around. One explanation for this might be that teacherswere not aware of their own class’s achievement in relation to other classes. Anotherreason for the lack of correspondence can perhaps be related to the scale. The meanvalues are high for most items, indicating that the full scale was not used. Eventhough differences in pupil reading ability were present, they are not possible toperceive. A scale where teachers could more explicitly compare their own pupils’achievement to the achievement of pupils in other classes (e.g. ‘‘I think that incomparison with the typical Swedish Grade 3 (Grade 4) classroom, the pupils in myclass can construct sentences. . .’’ ‘‘much worse’’, ‘‘worse’’, ‘‘equally well’’, ‘‘better’’,‘‘much better’’) could have improved the comparison across classrooms. Anotheroption to judge the classroom average achievement would have been to ask theteachers for an estimation of the class achievement on the same scale (1–10).
Furthermore, pupil gender had a slight effect on the teachers’ judgements and, atan equal achievement level on the test, girls received higher judgements than boys.Girls have, for example, previously been shown to receive somewhat higher overalljudgements (e.g., grades) than is justified by achievement on national tests (Klapp-Lekholm & Cliffordson, 2008; Reuterberg & Svensson, 2000; Svensson, 1971).However, as is recognised by Wernersson, girls may work harder and may havebetter achievement on ordinary school tasks which, although not visible in the testscores, may nevertheless influence teacher judgement (Swedish Government OfficialReports, 2010).
Pupil SES was highly related to achievement, both within and betweenclassrooms, thus confirming previous research on the topic (Sirin, 2005; Yang &Gustafsson; 2004). Moreover, some systematic variance in the judgements could be
Educational Research and Evaluation 707
Dow
nloa
ded
by [
Tul
ane
Uni
vers
ity]
at 0
5:01
30
Sept
embe
r 20
14
related to SES. Within classrooms, the effect was similar to the effect for gender,although it was slightly higher for Grade 4 than for Grade 3. The results couldindicate that higher SES pupils were given higher judgements than their test resultswould otherwise justify. However, given the small effects, it may be reasonable thatthe high-SES pupils received slightly higher ratings because they achieved better ontask types not included in the test. It is possible that these pupils are more motivatedtowards school and that motivation is a variable which reflects higher teacherjudgements. Further research will be needed in order to shed more light on this issue.
At the between-classroom level, and when achievement was kept under control,high-SES classes received substantially higher judgements from their teachers. Oneexplanation for this is that since teachers were not aware of the actual level ofachievement of their own class, or that of the other classes, they took advantage ofinformation about pupils’ social background when estimating the level ofachievement of the class. Teachers have some information about their classroomSES level, in relation to the SES level of other classes/schools. Thus, the SES variableprobably holds more information at the between level than the achievement variable.Teachers are more likely to be aware of SES differences between classes/schools thanthey are of achievement differences, especially since, in recent decades, Swedishschools have become increasingly segregated (Myrberg & Rosen, 2006). Analternative interpretation would be that high-SES classrooms were rated in anunfair manner, receiving judgements that were too high relative to test results.However, such an interpretation would not correspond with the results of KlappLekholm (2008), who found the presence of a compensatory grading strategy there.In Klapp Lekholm’s study, not only did teachers have access to the achievement testresults but also to scoring rubrics. Thus, it would be reasonable to presume that theseteachers could calibrate pupils’ scores to a grade in a more precise manner. In thepresent study, teachers had no information about their pupils’ test results and thuscould not calibrate these toward a common standard. There are no explicit criteriafor each step in the scale, and it can therefore be difficult for teachers to know howthe scale is interpreted in other classrooms. However, as previous research hasshown, interpretation of criteria is problematic for many teachers (e.g., Selghed,2004; Tholin, 2006). Thus, a certain degree of variability across classrooms is not asurprising finding, even if criteria had been fitted to each mark on the scale.
The national tests implemented in third grade in 2008 (Swedish GovernmentOfficial Reports, 2007) may have led to more adequate comparisons of pupils’achievement between classrooms. This is because teachers gained access to commoncriteria for evaluating levels of knowledge in their classes. This is a question of greatrelevance for future research.
Notes on contributors
Stefan Johansson is a PhD candidate in Educational Science at the University of Gothenburg,Sweden. In his dissertation project, he uses large-scale data to investigate different aspectswhich could influence teachers’ assessments of pupils’ reading literacy.
Eva Myrberg is a senior lecturer and researcher at the University of Gothenburg, Sweden. Shehas studied effects of educational resources on educational achievement and has a specialinterest in the influence of different aspects of teacher competence.
Monica Rosen is a professor of Education at the University of Gothenburg, Sweden. She hasworked on large-scale national and international assessments of schools in a range of researchprojects at the Department of Education since 1990. Her research has mainly been focused on
708 S. Johansson et al.
Dow
nloa
ded
by [
Tul
ane
Uni
vers
ity]
at 0
5:01
30
Sept
embe
r 20
14
studies of reading literacy, international comparisons and change across time, on issues ofeducational policy and equity, and on methodological issues that accompany analyses ofeducational assessment data.
References
Bagozzi, R.P., & Heatherton, T.F. (1994). A general approach to representing multifacetedpersonality constructs: Application to state self-esteem. Structural Equation Modeling, 1,35–67.
Bentler, P.M. (2007). On tests and indices for evaluating structural models. Personality andIndividual Differences, 42, 825–829.
Black, P., & Wiliam, D. (1998). Assessment and classroom learning. Assessment in Education:Principles, Policy & Practice, 5, 7–74.
Black, P., & Wiliam, D. (2006). The reliability of assessments. In J. Gardner (Ed.), Assessmentand learning (pp. 119–131). Gateshead, UK: Sage.
Broadfoot, P. (1996). Education, assessment and society. Buckingham, UK: Open UniversityPress.
Brown, T.A. (2006). Confirmatory factor Aanalysis for applied research. New York, NY: TheGuilford Press.
Campbell, J.R.,Kelly, D.L.,Mullis, I.V.S.,Martin,M.O., & Sainsbury,M. (2001).Framework andspecifications for PIRLS assessment 2001 – 2nd edition. Chestnut Hill, MA: Boston College.
Emanuelsson, I., & Fischbein, S. (1986). Vive la difference? A study on sex and schooling.Scandinavian Journal of Educational Research, 30, 71–84.
Embretson, E.S., & Reise, P.S. (2000). Item response theory for psychologists. Mahwah, NJ:Lawrence Erlbaum Associates.
Feinberg, A.B., & Shapiro, E.S. (2009). Teacher accuracy: An examination of teacher-basedjudgments of students’ reading with differing achievement levels. Journal of EducationalResearch, 102, 453–462.
Foy, P., & Olson, F.J. (2009). TIMSS 2007 user guide for the international database. ChestnutHill, MA: Boston College.
Gipps, C. (1994). Beyond testing: Towards a theory of educational assessment. London, UK:The Falmer Press.
Goffin, R.D. (2007). Assessing the adequacy of structural equation models: Golden rules andeditorial policies. Personality and Individual Differences, 42, 831–839.
Gonzalez, J.E., & Kennedy, M.A. (2003). PIRLS 2001 user guide for the internationaldatabase. Chestnut Hill, MA: Boston College.
Gustafsson, J.-E. (2009). Strukturell ekvationsmodellering [Structural equation modelling]. InG. Djurfeldt & M. Barmark (Eds.), Statistisk verktygslada 2 Multivariat analys (pp. 269–321). Lund, Sweden: Studentlitteratur.
Gustafsson, J.-E., & Stahl, P.A. (2005). STREAMS user’s guide, Version 3.0 for Windows 95/98/NT. Molndal, Sweden: MultivariateWare.
Harlen, W. (2005). Trusting teachers’ judgement: Research evidence of the reliability andvalidity of teachers’ assessment used for summative purposes. Research Papers inEducation, 20, 245–270.
Hattie, J. (2009). Visible learning: A synthesis of over 800 meta-analyses relating to achievement.London, UK: Routledge.
Hau, K.-T., & Marsh, H.W. (2004). The use of item parcels in structural equation modeling:Non-normal data and small sample sizes. British Journal of Mathematical and StatisticalPsychology, 57, 327–351.
Hoge, R.D., & Coladarci, T. (1989). Teacher-based judgments of academic achievement: Areview of literature. Review of Educational Research, 59, 297–313.
Hox, J. (1995). Applied multilevel analysis. Amsterdam, The Netherlands: TT-Publikaties.Hox, J. (2002). Multilevel analysis – Techniques and applications. Mahwah, NJ: Lawrence
Erlbaum Associates.Kane, M. (2006). Validation. In R. Brennan (Ed.), Educational measurement (4th ed., pp. 17–
64). Washington, DC: American Council on Education and National Council onMeasurement in Education.
Kenny, D.T., & Chekaluk, E. (1993). Early reading performance: A comparison of teacher-based and test-based assessments. Journal of Learning Disabilities, 26, 227–236.
Educational Research and Evaluation 709
Dow
nloa
ded
by [
Tul
ane
Uni
vers
ity]
at 0
5:01
30
Sept
embe
r 20
14
Kishton, J.M., & Widaman, K.F. (1994). Unidimensional versus domain representativeparceling of questionnaire items: An empirical example. Educational and PsychologicalMeasurement, 54, 757–765.
Klapp Lekholm, A. (2008). Grades and grade assignment: Effects of student andschool characteristics (Doctoral dissertation). Retrieved from http://hdl.handle.net/2077/18673
Klapp Lekholm, A., & Cliffordson, C. (2008). Discrepancies between school grades and testscores at individual and school level: Effects of gender and family background.Educational Research and Evaluation, 14, 181–199.
Little, T.D., Cunningham, W.A., Shahar, G., & Widaman, K.F. (2002). To parcel or not toparcel: Exploring the question, weighing the merits. Structural Equation Modeling, 9, 151–173.
Markland, D. (2007). The golden rule is that there are no golden rules: A commentary on PaulBarrett’s recommendations for reporting model fit in structural equation modeling.Personality and Individual Differences, 42, 851–858.
Martin, M.O., Mullis, I.V.S., & Kennedy, A.M. (2003). PIRLS 2001 technical report. ChestnutHill, MA: Boston College.
Meisels, S.J., Bickel, D.D., Nicholson, J., Yange, X., & Atkins-Burnett, S. (2001). Trustingteachers’ judgments: A validity study of a curriculum-embedded performance assessmentin Kindergarten to Grade 3. American Educational Research Journal, 38, 73–95.
Messick, S. (1989). Validity. In R.L. Linn (Ed.), Educational measurement (3rd ed., pp. 13–103). New York, NY: Macmillan.
Mullis, I.V.S., Martin, M.O., Gonzalez, E.J., & Kennedy, A.M. (2003). PIRLS 2001international report: IEA’s Study of Reading Literacy Achievement in Primary Schools.Chestnut Hill, MA: Boston College.
Muthen, B.O. (1991). Multilevel factor analysis of class and student achievement components.Journal of Educational Measurement, 28, 338–354.
Muthen, B.O. (1994). Multilevel covariance structure-analysis. Sociological Methods &Research, 22, 376–398.
Muthen, L.K., & Muthen, B.O. (1997–2011). Mplus user’s guide. Los Angeles, CA: Authors.Myrberg, E., & Rosen, M. (2006). Reading achievement and social selection in independent
schools in Sweden: Results from IEA PIRLS 2001. Scandinavian Journal of EducationalResearch, 50, 185–205.
National Agency for Education. (2000). Kursplaner for grundskolan [Syllabuses for thecompulsory school]. Stockholm, Sweden: Author.
National Agency for Education. (2002). Spraket lyfter! Diagnosmaterial i svenska ochsvenska som andra sprak for aren fore skolar 6 [Progression in language! Diagnosticmaterial for Swedish and Swedish as second language for Grades 2–5]. Stockholm,Sweden: Author.
National Agency for Education. (2006). Med fokus pa lasforstaelse. En analys av skillnader ochlikheter mellan internationella jamforande studier och nationella kursplaner [Readingliteracy in focus. An analysis of differences and similarities between internationalcomparative studies and national syllabuses]. Stockholm, Sweden: Author.
National Agency for Education. (2007). Provbetyg – Slutbetyg – Likvardig bedomning? [Testgrades – Final grades – Equality in assessment?]. Stockholm, Sweden: Author.
National Agency for Education. (2009). Likvardig betygssattning i gymnasieskolan? En analysav sambandet mellan nationella prov och kursbetyg [Equal grading in upper secondaryschool? An analysis of the correspondence between national test results and grades].Stockholm, Sweden: Author.
Reuterberg, S.-E., & Svensson, A. (2000). Kons- och socialgruppsskillnader i matematik –orsaker och konsekvenser [Gender differences and SES differences in mathematics: Causesand consequenses]. Molndal, Sweden: University of Gothenburg.
Rosen, M., Myrberg, E., & Gustafsson, J.-E. (2005). Laskompetens i skolar 3 och 4. Nationellrapport fran PIRLS 2001 i Sverige. The IEA Progress in International Reading LiteracyStudy [Reading literacy in Grade 3 and 4. National report from PIRLS 2001 in Sweden](Report No. 236). Goteborg, Sweden: University of Gothenburg.
Satorra, A., & Bentler, P.M. (2001). A scaled difference chi-square test statistic for momentstructure analysis. Psychometrika, 66, 507–514.
710 S. Johansson et al.
Dow
nloa
ded
by [
Tul
ane
Uni
vers
ity]
at 0
5:01
30
Sept
embe
r 20
14
Selghed, B. (2004). Annu icke godkant – Larares satt att erfara betygssystemet och desstillampning i yrkesutovningen [Not yet passed: How teachers’ experience a criterion-referenced grading system and what they say about its use in Swedish secondary school](Doctoral dissertation). Retrieved from http://dspace.mah.se/handle/2043/7829
Sirin, S.R. (2005). Socioeconomic status and academic achievement: A meta-analytic review ofresearch. Review of Educational Research, 75, 417–453.
Svensson, A. (1971). Relative achievement. School performance in relation to intelligence, sexand home environment (Doctoral dissertation). Retrieved from http://hdl.handle.net/2077/14447
Swedish Government Official Reports. (1942). Betankande med utredning och forslag angaendebetygssattningen i Folkskolan [Proposal concerning grading in compulsory school] (ReportNo. 11). Stockholm, Sweden: Department of Education.
Swedish Government Official Reports. (2007). Tydliga mal och kunskapskrav i grundskolan.Forslag till nytt mal- och uppfoljningssystem [Clear goals and knowledge demands in thecompulsory school. Proposal for a new goal and follow-up system] (Report No. 28).Stockholm, Sweden: Department of Education.
Swedish Government Official Reports. (2010). Konsskillnader i skolprestationer – ideer omorsaker [Gender differences in school performances – ideas about causes] (Report No. 51).Stockholm, Sweden: Department of Education.
Tholin, J. (2006). Att Kunna Klara Sig i Okand Natur. En studie av betyg och betygskriterier –historiska betingelser och implementering av ett nytt system [Being able to survive in anunknown environment. A study of grades and grading criteria – historical factors andimplementation of a new system]. (Doctoral dissertation). Retrieved from http://hdl.handle.net/2077/16892
Tversky, A., Kahneman, D. (1974). Judgment under uncertainty: Heuristics and biases.Science, 4157, 1124–1131.
Weeden, P., Winter, J., & Broadfoot, P. (2002). Assessment. What’s in it for schools? NewYork, NY: RoutledgeFalmer.
Yang, Y. (2003). Measuring socioeconomic status and its effects at individual and collectivelevels: A cross-country comparision (Doctoral dissertation). Retrieved from http://hdl.handle.net/2077/15895
Yang, Y., & Gustafsson, J.-E. (2004). Measuring socioeconomic status at individual andcollective levels. Educational Research and Evaluation, 10, 259–288.
Educational Research and Evaluation 711
Dow
nloa
ded
by [
Tul
ane
Uni
vers
ity]
at 0
5:01
30
Sept
embe
r 20
14