Embed Size (px)
Citation preview

The Tech Confidence Index
Teachers and Technology Use
In the ClassroomExclusive Survey Results

Your Source for Actionable PK-12 Market Intelligence marketbrief.edweek.org
Announcing
We are pleased to announce the launch of EdWeek Market Brief, a new
market intelligence service from Education Week. While Education Week has long been reporting on the events and changes in this marketplace, we saw a growing need on the part of district leaders and service providers alike for deeper insights … proprietary research … data-driven analysis.
Now, EdWeek Market Brief delivers actionable analysis, and helps you to better understand and respond to the business of education. Become a Charter Member, and you will be better equipped to predict and act on changes in the market.
You’ll Have Actionable Insight At Your Fingertips
Market Intel Sophisticated, deep analysis of the demand- and supply-sides of education, to better understand district challenges and opportunities.
Data Insights Proprietary, survey-based research to reveal school district needs, trends and market direction. You’ll have complete access to the analysis, charts, data visualizations, and data.
K-12 Insider Exclusive in-depth interviews with district leaders that give you an inside look at the nuances and complexities of how decisions are made, and provides practical advice and lessons learned.
Analyst’s View Sharp, original takes on education market challenges from industry experts, revealing market opportunities and trouble spots.
Purchasing Alert Regular updates on the hottest RFPs, and what current purchasing trends divulge about upcoming district initiatives and challenges.
Marketplace K-12 Blog Already the most influential voice on the K-12 market, this free blog is your daily dose of news developments and trends in the business of education, featuring actionable charts, graphs, and multimedia.
Be the FirstAs a Charter Member, you will be the first to get your hands on this intelligence.
Schedule a site tour and get Charter Member pricing. Contact Ryan Lanier at
800-346-1834 | marketbrief.edweek.org

The Education Week Tech Confidence Index Teachers and Technology Use In The Classroom 1
About Editorial Projects In Education Editorial Projects in Education (EPE) is a nonprofit, tax-exempt organization based in Bethesda, Md. Its primary mission is to help raise the level of awareness and understanding among professionals and the public of important issues in American education. EPE covers local, state, national, and international news and issues from preschool through the 12th grade. Editorial Projects in Education publishes Education Week, America’s newspaper of record for precollegiate education, the online Teacher, EdWeek Market Brief, and the TopSchoolJobs employment resource. It also produces periodic special reports on issues ranging from technology to textbooks, as well as books of special interest to educators.
The Education Week Research Center conducts surveys, collects data, and performs analyses that appear in Education Week and special reports such as Quality Counts, and Technology Counts. The center also conducts independent research studies and maintains the Education Counts online data resource.
REPORT: Holly Yettick, Director, Education Week Research Center, Sterling Lloyd, Senior Research Associate, Education Week Research Center, Alexandra Harwin, Research Analyst, Education Week Research Center, Andrew Riemer, Survey Analyst, Education Week Research Center, Christopher B. Swanson, Vice President, Research and Development, Editorial Projects in Education.
6935 Arlington Road Bethesda, MD 20814 www.edweek.org/rc | [email protected]
COVER PHOTO: Getty Images and Education Week
Copyright © 2016 by Editorial Projects in Education Inc.

The Education Week Tech Confidence Index Teachers and Technology Use In The Classroom 2
Inside:Executive Summary ...............................................................................................3
Introduction: The Education Week Tech Confidence Index ...............................4
Bulls and Bears: A Snapshot of Teachers with Higher and Lower Confidence in Educational Technology ...............................6
Are Bears Luddites? ..............................................................................................6
Demographics .......................................................................................................6
Using Technology: Teachers ................................................................................ 7
Using Technology: Students .................................................................................8
Perceptions of Student Preparation ................................................................... 10
Challenges ............................................................................................................ 11
Who Has the Ears of the Bulls and the Bears? ..................................................12
Conclusion ............................................................................................................13

The Education Week Tech Confidence Index Teachers and Technology Use In The Classroom 3
Executive SummarySince 1997, Education Week’s annual Technology Counts has tracked the evolution of digital technology and learning in the nation’s schools. For the 2016 edition of the report, the Education Week Research Center created a brand new way of examining teachers’ views on educational technology. Based on exclusive results from an original national survey of about 700 teachers, the Education Week Tech Confidence Index takes the pulse of America’s educators and gauges their level of confidence in educational technology in K-12 schools, both now and in the future.
As a follow-up to that analysis, the Education Week Research Center is now delving more deeply into the technology perceptions and practices of two particular groups of teachers: those with the most confidence in educational technology, and those with the least. The highly confident ed-tech “Bulls” score in the top 20 percent of respondents on the Confidence Index. Their less confident “Bear” counterparts score in the bottom 20 percent on the Index.
By exploring a broader set of survey results, this report also sheds light on the characteristics and behaviors of Bulls and Bears. Among the central conclusions to emerge from our comparison of these distinctive groups: A teacher’s overall level of confidence in educational technology translates into a distinct set of behaviors, perceptions, and choices in the classroom.
Key findings, which are discussed in more detail throughout the report, include:
• Bears are not innovation-averse Luddites who fear or dislike technology. In fact, just 1 percent of Bears report that they are resistant to new technologies.
• Bulls are more likely to work in suburban and lower-poverty schools, whereas Bears tend to teach in urban and higher-poverty environments.
• Bulls are more likely than Bears to make daily use of technological tools and devices to provide or support instruction.
• The students of the typical Bull spend about twice as much class time using digital tools than their peers taught by the typical Bear.
• Bulls rate their students as better-prepared to use technology to pursue each of eight activities identified in the survey.
Shedding light on the perceptions and behaviors of these prototypical teachers may help us better understand the ways in which technology is used (or not used) in American schools.

The Education Week Tech Confidence Index Teachers and Technology Use In The Classroom 4
Introduction: The Education Week Tech Confidence IndexThe Education Week Tech Confidence Index takes the pulse of perspectives on educational technology in K-12 schools. Introduced in the 2016 edition of Education Week’s annual Technology Counts report, the Index uses eight different questions to assess views of the present conditions and future promise in four key areas shaping educational technology: performance, funding, the policymaking environment, and public support.
The results are based on the views of about 700 classroom teachers who shared their perspectives in an online survey that the Education Week Research Center conducted in April 2016. While the sample is not statistically representative of the nation’s teachers, the results capture the perceptions of a diverse group of educators whose schools vary in grade range, poverty level, and location.
Responses for each of the eight Index items were scored on a 0-100 scale, with 0 representing the most negative response category and 100 the most positive. The overall score for the Index is calculated by averaging results for all eight questions.
For 2016, the overall score —a comprehensive indicator of teachers’ confidence in educational technology—is 49 out of 100.
49
2016 Tech Confidence Index
Share of Teachers Earning Lower, Higher Scores on the Education Week Tech Confidence Index
3%6%
54%
36%
Very high High Low Very low

The Education Week Tech Confidence Index Teachers and Technology Use In The Classroom 5
Most teachers score in the middle of the Index, between 25 and 75 out of 100. However, confidence does skew toward the bottom half of the scale. A majority of teachers earn low scores between 26 and 50 while a third earn high scores between 51 and 75. The remainder score at the far ends of the scale, earning either very high or very low scores.
The 2016 results are meant to provide baseline information as we continue to track confidence in educational technology in future reports. Because the Index can be used with multiple audiences, future reports may also examine how teachers’ confidence compares with the perspectives of other groups, such as district leaders.
The Index also has a temporal dimension offering an opportunity to better understand both teachers’ current perspectives on educational technology and their views on how this sector will fare over the next year. Teachers have more confidence in the future than the present. The average score for the four items measuring current confidence is 43. By contrast, the average for the four future-oriented questions is 55, indicating that teachers expect progress in the year ahead.
When it comes to the four areas assessed by the Index, teachers express the highest levels of confidence in the overall performance of educational technology. They are least confident in ed-tech funding.
Trend data are not yet available, so what we have now is a snapshot of teachers’ perspectives on ed-tech. However, with that information, we can sketch detailed portraits of teachers with higher and lower levels of confidence in the role of technology and digital tools in the classroom. In the sections that follow, we use the Index as a jumping off point to flesh out the “personas” of teachers who stand at opposite ends of the confidence continuum.
Confidence Score by Area
Performance 55
Public Support 55
Policy 46
Funding 40
Education Week Tech Confidence Index
Overall 49
Current Conditions 43
Future Outlook 55

The Education Week Tech Confidence Index Teachers and Technology Use In The Classroom 6
Bulls and Bears: A Snapshot of Teachers with Higher and Lower Confidence in Educational Technology
What does it mean to have greater or lesser amounts of confidence in educational technology? How does confidence express itself in school settings, in terms of behaviors, perceived challenges, and the sources of information teachers use to learn about ed-tech tools?
We delve into these questions by using the results of the Education Week Tech Confidence Index to sketch a portrait of two groups of teachers: Highly confident “Bulls” are teachers whose Index scores place them in the top 20 percent of those taking the survey. At the other end of the spectrum, the less-confident “Bears” have Index scores in the lowest 20 percent.
To construct detailed personas for these Bulls and Bears, the Education Week Research Center also examined their views and responses on a wide range of issues. In addition to gauging teachers’ confidence in ed-tech, the broader survey examined topics including: demographics, technology use, perceptions of student preparation levels, perceived challenges, sources of information about educational technology, and influences on the selection of classroom technology. Although Bulls and Bears share some similarities, the results suggest some key differences with important implications for students and for schools. Namely, we find that teachers’ confidence in educational technology aligns with distinct sets of behaviors, perceptions, and choices in the classroom. Bulls 45%
Bears 57
Percent Bears, Bulls in High-Poverty Schools
Bulls 40%
Bears 24
Percent Bears, Bulls Working in Suburban Schools
Are Bears Luddites?
One might be tempted to assume that Bears’ lack of confidence in educational technology stems from a reflexive fear or dislike of technology, resisting innovation in order to cling stubbornly to the past. But this does not seem to be the case – at least in the minds of the Bears. Just 1 percent of Bears (and no Bulls) report that they are resistant to new technologies and among the last to adopt them. An equally small share of Bears and Bulls (3 percent of each group) are generally skeptical about new technologies, preferring to try them later than most people.
Demographics
If Bears are not skeptical of technology on principle, then why do they have so little confidence in ed-tech? Perceptions are often affected by environments. And our survey results do suggest that confidence levels vary based on characteristics of the school settings in which teachers work.

The Education Week Tech Confidence Index Teachers and Technology Use In The Classroom 7
Bulls are more likely to work in suburban and lower-poverty schools, whereas Bears tend to teach in urban and higher-poverty environments. Research has consistently shown that schools in high-poverty communities may face additional educational and technology-related challenges such as the digital divide between more and less affluent families.
Despite these differences, Bulls and Bears are quite similar when it comes to the grade levels and subjects they teach. The two groups also have comparable years of experience in the classroom. In fact, there is no evidence to support the idea that Bulls are simply youthful Millennials whose ed-tech confidence stems from growing up as digital natives.
Using Technology: Teachers
When it comes to teachers and ed-tech, confidence also appears to correspond closely to behavior. That is, the ways in which teachers actually make use of technology in the classroom vary by confidence level. In fact, Bulls are more likely than Bears to make daily use of nearly every tool we asked about on the survey. For instance, 47 percent of Bulls say they use digital curricula on a daily basis compared with only 17 percent of Bears. Similarly, Bulls are nearly three times more likely to report daily use of learning management systems (LMS) than their Bear counterparts.
Bulls and Bears diverge when it comes to devices (rather than tools). Of the six devices we asked about, Bulls are most likely to use laptops on a daily basis (64 percent). By contrast, Bears are most likely to use desktops daily (49 percent). With the exception of e-readers (which neither group uses much), Bulls are more likely than Bears to use every type of device.
Daily Use of Tech Tools by Teachers
83%
84
65
56
49
37
28
21
47
17
27
16
38
14
25
13
17
11
25
10
16
5
23
13
Wireless connectivity
Grading/ administrative tools
Parent/student communication tools
Multimedia tools
Digital curricula
Dashboards for student data
LMS
Assessment tools
Web-based collaboration tools
Educational games
Online videos
Website creation/ editing tools Bulls Bears

The Education Week Tech Confidence Index Teachers and Technology Use In The Classroom 8
This suggests that, for the teachers who took the survey, greater levels of confidence in educational technology are associated with more frequent use of devices and tools.
One exception to this general pattern is wireless access, the tool that Bulls and Bears are most likely to use daily. Here the two groups report using wireless on a daily basis in equal numbers.
Using Technology: Students
We also find evidence that a teacher’s level of confidence in educational technology can spill over onto her students. In fact, the students of the typical Bull spend nearly twice as much class time using digital learning tools. Half of class time is spent digitally engaged in Bull classrooms, compared with about 25 percent among the students of Bears.
What tools are these students using and to what end?
We asked teachers how frequently their students use six different devices: desktops, laptops, whiteboards, tablets, cell phones, and e-readers. Across the board, Bulls’ students use every kind of device more frequently than do the students of Bears.
Laptops are the most commonly used device in Bulls’ classrooms. Half of Bulls say their students use laptops on a daily basis. By contrast, interactive whiteboards are the most prominent digital device in Bears’ classrooms, with just over a quarter (26 percent) of Bears saying their students use whiteboards daily.
Daily Use of Tech Devices by Teachers
64%
48
60
49
46
35
26
13
19
13
2
2
Laptop
Desktop
Interactive whiteboard
Cell phone
Tablet
E-reader Bulls Bears
Percent Class Time Using Digital Tools: Students of Bears vs. Students of Bulls
Bulls 50%
Bears 25
Percent of class time for typical teacher

The Education Week Tech Confidence Index Teachers and Technology Use In The Classroom 9
At first glance, laptops appear to have more potential than whiteboards to facilitate “active” and innovative uses of technology that involve creation and collaboration. After all, they are easy to move and to use for student-centered activities that depart from the traditional model of the teacher-directed lesson centered on the chalkboard (or whiteboard).
But when asked about six purposes of student technology use, Bulls and Bears alike are most likely to say that their students use technology daily for the purpose of skills and drills. Although such activities are not generally thought of as being particularly innovative, it is possible that digital tools could offer new, more student-centered ways to approach an old task.
That said, Bulls’ students are more likely than the students of Bears to use technology for all six reasons, which include individual and group projects, educational gaming, research, and collaboration.
Percent Bear, Bull Students Using Tech Tools Daily
50%
17
40
26
29
23
19
13
17
Laptop
Interactive whiteboard
Desktop
Tablet
Cell phone
E-reader Bulls Bears
10
5
2
Daily Technology Use by Purpose: Students of Bears vs. Students of Bulls
31%
14
24
7
22
7
21
7
19
9
12
Drills, review, or practice exercises
Individual projects
Collaboration
Research
Educational games
Group projects Bulls Bears1
The Education Week Tech Confidence Index Teachers and Technology Use In The Classroom 10
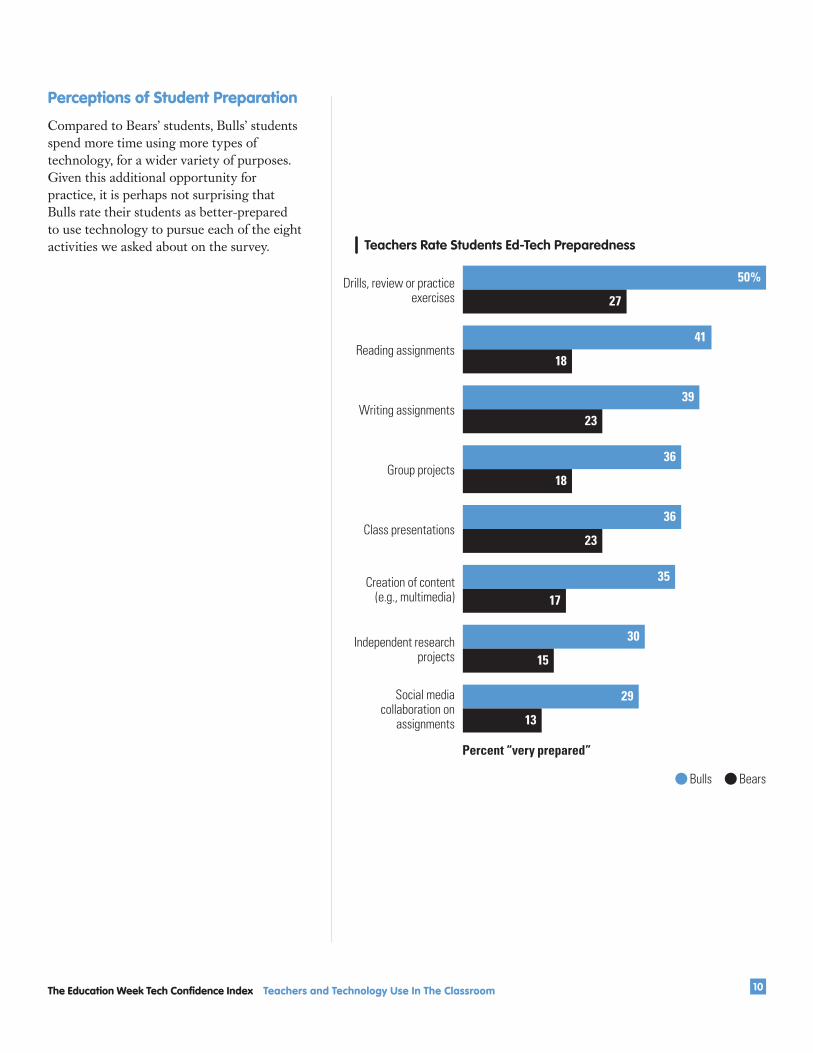
Perceptions of Student Preparation
Compared to Bears’ students, Bulls’ students spend more time using more types of technology, for a wider variety of purposes. Given this additional opportunity for practice, it is perhaps not surprising that Bulls rate their students as better-prepared to use technology to pursue each of the eight activities we asked about on the survey. Teachers Rate Students Ed-Tech Preparedness
50%
27
41
18
39
23
36
18
36
23
35
17
30
15
29
13
Drills, review or practice exercises
Reading assignments
Writing assignments
Group projects
Class presentations
Creation of content (e.g., multimedia)
Independent research projects
Social media collaboration on
assignments
Bulls Bears
Percent “very prepared”

The Education Week Tech Confidence Index Teachers and Technology Use In The Classroom 11
Challenges
If Bears are less confident than Bulls about educational technology, it may be because they perceive greater challenges related to basic needs like teacher training, functioning software, and support from IT staff. In fact, Bears are more likely to report significant challenges related to each of the educational technology-related problems we asked about.
For Bears and Bulls alike, the top ed-tech challenge is a shortage of devices. Nearly two-thirds of Bears (64 percent) say a lack of devices is a very significant challenge, as do 28 percent of Bulls.
Ed-Tech Challenges
28%
64
24
43
23
35
21
43
17
25
14
29
11
31
7
20
Too few digital devices
Lack of training for teachers
School internet access unreliable or slow
State/district curriculum demands
Software glitches
Insufficient support from IT staff
Lack of guidance from school administrators
Classroom management
challenges
Bulls Bears
Percent “very significant”

The Education Week Tech Confidence Index Teachers and Technology Use In The Classroom 12
Who Has the Ears of the Bulls and the Bears?
When it comes to educational technology, Bulls are exposed to a wider variety of information sources and influences than are Bears.
To understand the ways in which teachers acquire information regarding educational technology, we asked survey respondents to identify the people, events, publications, and organizations from which they learn about new tools. Bulls are more likely than Bears to learn about educational technology from 13 of the 17 different information sources we asked about on the survey. However, both Bulls and Bears most frequently learn from other teachers, the news media, and in-person professional development.
Fellow teachers in the same school building are the top source of information on educational technology for Bulls as well as for Bears. But teachers are sources of ed-tech information for a higher share of Bears (86 percent) than Bulls (78 percent).The education-focused news media is the number two information source for Bulls. More than two-thirds of Bulls (69 percent) learn about educational technology from the education news media. For Bears, the education news media ties with in-person professional development as the number two ed-tech information source. About 60 percent of Bears consult each source for ed-tech information.
Teachers’ decisions about which digital technologies to use in the classroom can be influenced by a range of stakeholders. We asked survey respondents to rate the influence of 10 different types of individuals or groups.
Bulls are more likely than Bears to report that the educational technology they use in their classrooms is strongly impacted by all 10 of the influences listed on the survey.
Bears and Bulls alike consider themselves to be the top influencers of the educational technologies used in their classrooms. More than 60 percent of Bulls (64 percent) and 52 percent of Bears say that they,
Influences on Classroom Tech Use
64%
52
41
14
37
21
35
21
31
15
28
10
24
12
10
5
5
7
4
Me personally
School-based technology coordinator
Teachers in my building
Superintendent/district administrators
School principal
Students
District school board
Professional associations or unions
Ed-tech companies and providers
Parents2
Bulls Bears
Percent “very influential”

The Education Week Tech Confidence Index Teachers and Technology Use In The Classroom 13
themselves, are very influential when it comes to deciding which technologies will be used in their classrooms.
When it comes to the influences on Bears and Bulls, the biggest gap relates to school-based-technology coordinators. These coordinators are the second biggest influence on Bulls but barely squeak into the top five for Bears. Bears are more likely to work in high-poverty schools, which may have fewer resources. So one possibility is that Bears are simply less likely to have technology coordinators at their schools.
Conclusion
It would be wrong to suggest that Bears and Bulls hail from different planets. The many similarities between them include comparable levels of teaching experience, identical top technology uses (skill and drill), and important ed-tech influences (themselves).
However, the results of this report do indicate that ed-tech confidence makes a real difference. Highly-confident Bulls and their less-confident Bear peers report distinct sets of behaviors, challenges, and sources of ed-tech information. In addition, the students of Bulls spend a lot more class time using technology than do the students of Bears. These differences almost certainly impact student learning experiences and instruction. It remains to be seen whether and to what degree such differences are environmental versus perceptual. Is a Bear simply a Bull in a barren ed-tech setting? Or is there something about the attitudes and experiences of the two groups that set them on different paths?