Embed Size (px)
Citation preview

Teacher Wellbeing Index 2018
The charity for everyone working in education

Education Support Partnership is the UK’s only charity providing mental health and wellbeing support services to all education staff and organisations.

3
ForewordWe are proud to publish our second annual Index report, which presents a robust, comprehensive picture of the changing mental health and wellbeing of education professionals throughout the UK.
Since last year’s report, demand for our charity’s services has reached record levels.
We have seen a 35% increase in teachers calling our emotional support helpline and a 42% increase in applications for our financial grants programme. Our counsellors hear daily from those struggling with the demands of ever-greater accountability, a growing testing culture and high levels of workload.
This is reflected in the findings of this year’s Index, in which over a third of education professionals said their job had made them feel stressed most or all of the time in the past few weeks, compared to 18% of the UK workforce overall. A staggering 57% have also considered leaving the sector within the past two years because of health pressures.
The consequence is a mounting recruitment and retention crisis.
Teaching is one of the most important jobs there is, a chance to shape the future of the next generation. But by turning the role into an unmanageable task we risk alienating those with the passion and skill to succeed. Of particular concern for me this year is
the sharp rise in poor mental health amongst senior leaders. Through a perceived notion of ‘commitment’ and ‘selflessness’ this group is failing to seek help when they need it most – something not aided by increasingly intolerable demands and expectations within the current education system. We must do more to protect this group and support them to manage their own wellbeing as well as equipping them with the resources to create a positive culture for their staff.
As a society, the need for clear measures that protect the wellbeing and mental health of all has never appeared more urgent. In education, it is becoming critical. This is why, as a charity over the past year, we are increasingly expanding our work outside crisis support for individuals, to influence structural and environmental factors that can reduce the risk of poor mental health and wellbeing.
This has seen us engage directly with Government, regulators and stakeholders to inform and shape policy, plus work face-to-face in over 900 schools and colleges to improve workplace culture and implement practical measures that leave a lasting impact on staff wellbeing.
I hope you will read this report and our recommendations with interest.
Julian Stanley, CEO Education Support Partnership
FOREWORD
4
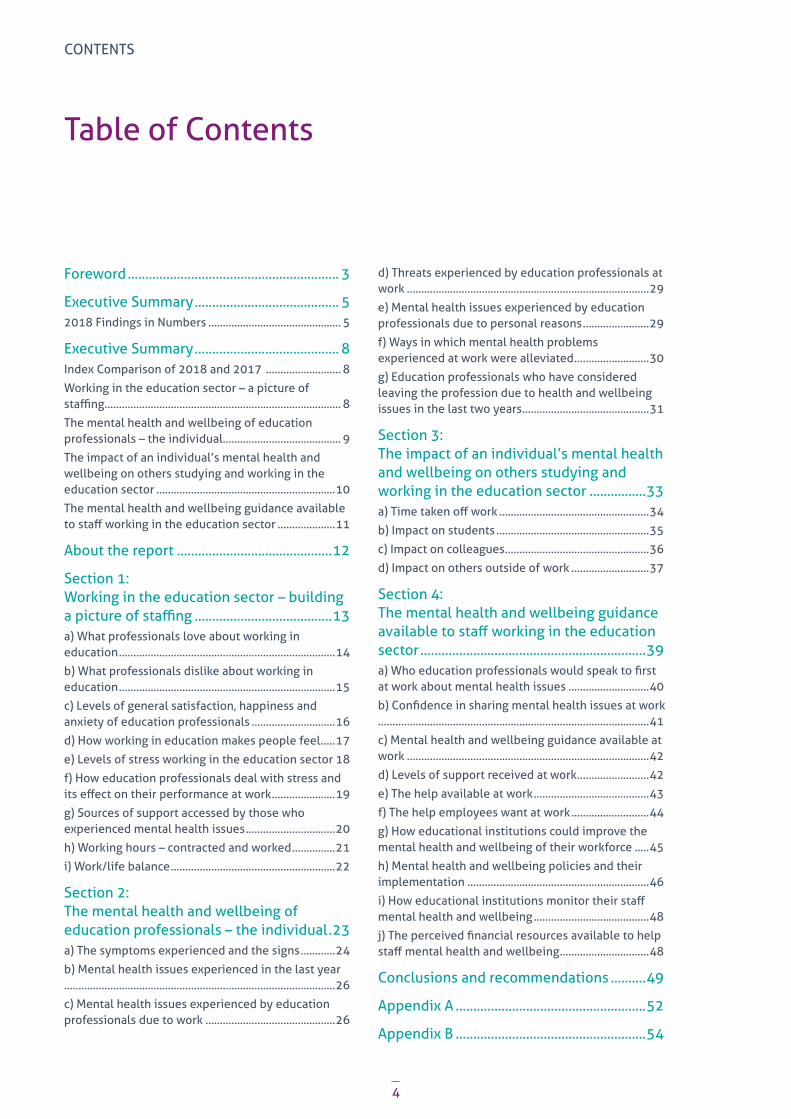
Table of Contents
Foreword ............................................................ 3
Executive Summary ......................................... 52018 Findings in Numbers .............................................. 5
Executive Summary ......................................... 8Index Comparison of 2018 and 2017 .......................... 8
Working in the education sector – a picture of staffing.................................................................................. 8
The mental health and wellbeing of education professionals – the individual......................................... 9
The impact of an individual’s mental health and wellbeing on others studying and working in the education sector ..............................................................10
The mental health and wellbeing guidance available to staff working in the education sector ....................11
About the report ............................................12
Section 1: Working in the education sector – building a picture of staffing .......................................13a) What professionals love about working in education ...........................................................................14
b) What professionals dislike about working in education ...........................................................................15
c) Levels of general satisfaction, happiness and anxiety of education professionals .............................16
d) How working in education makes people feel .....17
e) Levels of stress working in the education sector 18
f) How education professionals deal with stress and its effect on their performance at work ......................19
g) Sources of support accessed by those who experienced mental health issues ...............................20
h) Working hours – contracted and worked ...............21
i) Work/life balance .........................................................22
Section 2: The mental health and wellbeing of education professionals – the individual .23a) The symptoms experienced and the signs ............24
b) Mental health issues experienced in the last year ..............................................................................................26
c) Mental health issues experienced by education professionals due to work .............................................26
d) Threats experienced by education professionals at work ....................................................................................29
e) Mental health issues experienced by education professionals due to personal reasons .......................29
f) Ways in which mental health problems experienced at work were alleviated ..........................30
g) Education professionals who have considered leaving the profession due to health and wellbeing issues in the last two years ............................................31
Section 3: The impact of an individual’s mental health and wellbeing on others studying and working in the education sector ................33a) Time taken off work ....................................................34
b) Impact on students .....................................................35
c) Impact on colleagues ..................................................36
d) Impact on others outside of work ...........................37
Section 4: The mental health and wellbeing guidance available to staff working in the education sector ................................................................39a) Who education professionals would speak to first at work about mental health issues ............................40
b) Confidence in sharing mental health issues at work ..............................................................................................41
c) Mental health and wellbeing guidance available at work ....................................................................................42
d) Levels of support received at work .........................42
e) The help available at work ........................................43
f) The help employees want at work ...........................44
g) How educational institutions could improve the mental health and wellbeing of their workforce .....45
h) Mental health and wellbeing policies and their implementation ...............................................................46
i) How educational institutions monitor their staff mental health and wellbeing ........................................48
j) The perceived financial resources available to help staff mental health and wellbeing ...............................48
Conclusions and recommendations ..........49
Appendix A ......................................................52
Appendix B ......................................................54
CONTENTS
5
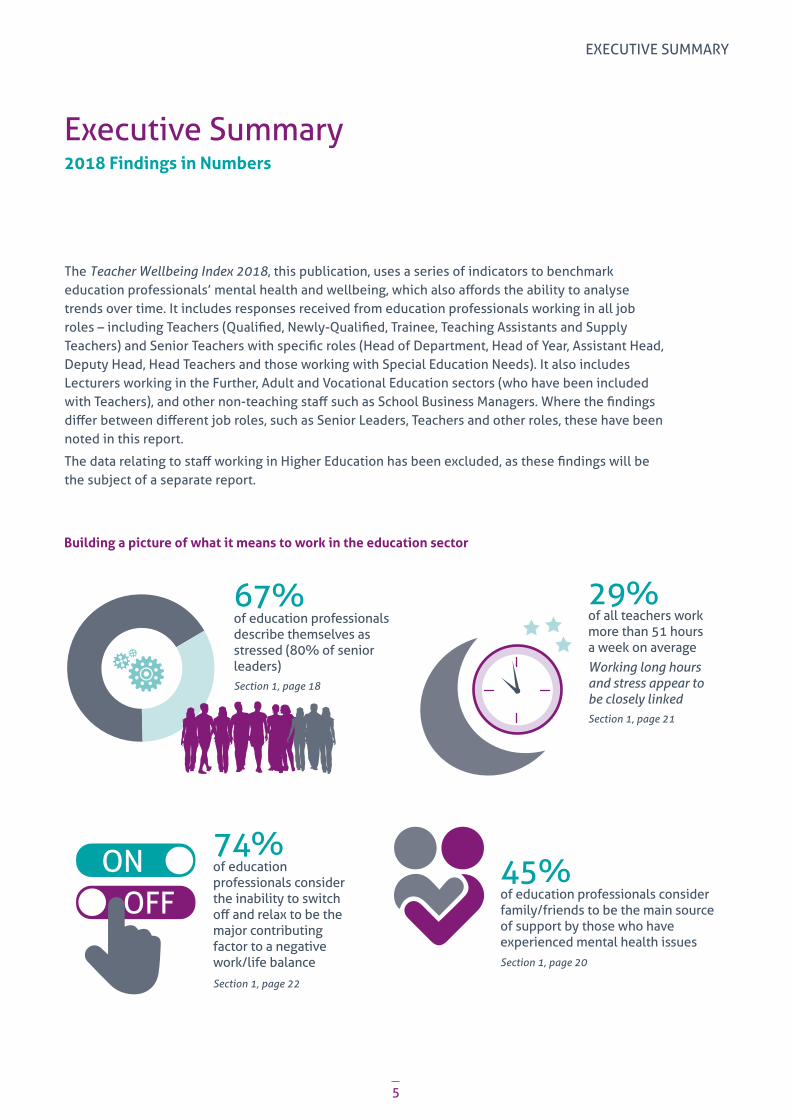
Executive Summary2018 Findings in Numbers
Building a picture of what it means to work in the education sector
The Teacher Wellbeing Index 2018, this publication, uses a series of indicators to benchmark education professionals’ mental health and wellbeing, which also affords the ability to analyse trends over time. It includes responses received from education professionals working in all job roles – including Teachers (Qualified, Newly-Qualified, Trainee, Teaching Assistants and Supply Teachers) and Senior Teachers with specific roles (Head of Department, Head of Year, Assistant Head, Deputy Head, Head Teachers and those working with Special Education Needs). It also includes Lecturers working in the Further, Adult and Vocational Education sectors (who have been included with Teachers), and other non-teaching staff such as School Business Managers. Where the findings differ between different job roles, such as Senior Leaders, Teachers and other roles, these have been noted in this report.
The data relating to staff working in Higher Education has been excluded, as these findings will be the subject of a separate report.
67%
74%45%
of education professionals describe themselves as stressed (80% of senior leaders)
of education professionals consider the inability to switch off and relax to be the major contributing factor to a negative work/life balance
of education professionals consider family/friends to be the main source of support by those who have experienced mental health issues
Section 1, page 18
Section 1, page 21
Section 1, page 22
Section 1, page 20
29%of all teachers work more than 51 hours a week on averageWorking long hours and stress appear to be closely linked
ONOFF
EXECUTIVE SUMMARY

6
The mental health and wellbeing of education professionals – the individual
31%
57%
43% & 37%
have experienced a mental health issue in the past academic year
More than half of all education professionals have considered leaving the sector over the past two years as a result of health pressures.
of education professionals’ symptoms could be signs of anxiety or depression respectively - both considerably higher than nationally reported. 50% of those showing such signs were formally diagnosed by their General Practitioner (GP)
Section 2, page 26
Section 2, page 31
Section 2, page 25
43%of education professionals attribute work symptoms to student behavioural issuesSection 2, page 28
76%
72%
of education professionals have experienced behavioural, psychological or physical symptoms due to their work, compared with 60% of UK employees
of education professionals cite workload as the main reason for considering leaving their jobs
Section 2, page 27
Section 2, page 31
EXECUTIVE SUMMARY

7
The impact of an individual’s mental health and wellbeing on others working in the education sector
The mental health and wellbeing guidance available to staff working in the education sector
47%
64%
65%
36%
74%
35%
40%
56%
of education professionals with mental health symptoms were away for a month or more over the academic year
of educational institutions do not regularly survey their staff to establish levels of employee wellbeing
of education professionals would not feel confident in disclosing mental health problems or unmanageable stress to their employer
of education professionals report that they had no form of mental health support where they work
of education professionals consider they do not have enough guidance about mental health and wellbeing at work
of senior leaders (and 30% of teachers) believe that taking time off work due to mental health symptoms will have a negative effect on working relationships with their colleagues
of senior leaders and teachers believe that having time off work due to mental health symptoms will have a negative impact on their students’ studies
of senior leaders (and 49% of teachers) believe that as a result of psychological, physical or behavioural problems at work their personal relationships have suffered
Section 3, page 34
Section 4, page 48
Section 4, page 40
Section 4, page 43
Section 4, page 42
Section 3, page 36
Section 3, page 35
Section 3, page 38
EXECUTIVE SUMMARY

8
Executive SummaryIndex Comparison of 2018 and 2017
Base: all education professionals, +/- percentage change
Working in the education sector – a picture of staffing
KEY
Red light (+/- 10% and over) = highlighting a major change (positive or negative)
Amber light (+/- 5-9%) = keep a watching brief on this change (positive or negative)
Green light (+/- 0-4%) = data consistent across both years
Level of satisfactionLevel of happiness
Level of anxiety
How working in education made people feel in the preceding few weeks (based on most/all of the time):
Tense (+ 9%)
Stressed (+ 5%)
Miserable
Optimistic (- 5%)
Relaxed
Worried
Cheerful
Excited
Overall current levels of stress working in the education sector (note – comparison with feeling stressed above in preceding weeks)
Sources of support accessed by those who used substances or behaviours to cope with workplace stress and/or anxiety
Family/friends (+ 8%)
Partner/spouse
GP/NHS/Health professionals
Peers/colleagues
None of these
Employer/line manager/senior staff member at work (+ 9%)
Websites/a general internet search
Counsellor/psychiatrist/psychologist
A union
Work/life balance – Factors which contribute a great deal or somewhat to a negative work-lie balance
Inability to switch off and relax
Working long hours and weekdays
Not finding time to be with my family/friends
Working over the weekends
Working during holidays
Family commitments preventing me from doing a good job at work
EXECUTIVE SUMMARY

9
The mental health and wellbeing of education professionals – the individual
The symptoms experienced and the signs in the last 1-2 years
Insomnia/difficulty sleeping (+ 15%)
Irritability/mood swings (+ 14%)
Tearfulness (+ 13%)
Over-eating (+ 9%)
Forgetfulness (+ 14%)
Difficulty concentrating (+ 13%)
Muscle tension (+ 8%)
Recurring headaches/migraines (+ 9%)
Dizziness (+ 14%)
Changes in appetite (+ 9%)
Panic attacks
Under-eating (+ 5%)
High blood pressure
Symptoms experienced linked to possible signs of mental health issues – Self-defined or suggested by someone else
Anxiety
Depression (+ 5%)
Exhaustion
Post-traumatic stress disorder (PTSD)
Obsessive compulsive disorder (OCD)
Eating disorder (including Anorexia, Bulimia, Binge Eating Disorders)
Personality disorder
Bipolar disorder
Schizophrenia/psychosis
Formal diagnosis by a General Practitioner (GP) following mental health signs displayed (highest 3 signs only)
Anxiety (+ 10% diagnosis)
Depression
Exhaustion
Mental health issues experienced by education professionals due to work where work was a contributing factor
Behavioural (eg changes to appetite, irritability, procrastination, mood swings)
Physical symptoms (eg raised blood pressure, muscle tension, sweating, dizziness, headaches or migraines)
Psychological symptoms (eg depression, anxiety, panic attacks)
Work issues that symptoms were related to
Excessive workload (- 10%)
Work/life balance (- 5%)
Students’ behaviour (+ 9%)
Low income
Unreasonable demands from manager (- 8%)
Rapid pace of change (eg National Curriculum) (- 21%)
Problems with students’ parents (+ 6%)
Bullying by colleagues
Redundancy/restructure
Lack of opportunities to work independently
Discrimination
Retirement
Mental health issues experienced by education professionals due to personal reasons
Family issues (- 7%)
Financial worries (- 8%)
Health concerns (- 8%)
Bereavement
Trauma (- 5%)
Housing problems
Problems with neighbours
Ways in which mental health problems experienced at work were alleviated
Physical exercise (- 5%)
Mediation/mindfulness
Alcohol
Therapy/counselling
I didn’t try to alleviate/solve them
Self-medication
Other
Drugs
Education professionals who have considered leaving the profession due to health and wellbeing issues in the last two years
Volume of workload (- 6%)
Seeking better work/life balance (- 9%)
Unreasonable demands from managers
Student behaviour (+ 7%)
Mental health concerns
Seeking higher pay (+ 7%)
Rapid pace of organisational change (- 5%)
Physical health concerns
Retiring from profession/sector
EXECUTIVE SUMMARY

10
The impact of an individual’s mental health and wellbeing on others studying and working in the education sector
Time taken off work
A day here and there (- 5%)
More than a week in total over the academic year
More than a month in total over the academic year
Signed off for up to six months
Signed off for over six months
Impact on students
No impact (- 5%)
Negative impact on their studies
Negative impact on their results
Negative impact on their own mental health
Impact on others outside of work
My personal relationships suffered
My work performance suffered
I had to take time off work
My work relationships suffered
I felt suicidal
I had to leave my job
My personal relationships broke down
EXECUTIVE SUMMARY

11
The mental health and wellbeing guidance available to staff working in the education sector
Who education professionals would speak to first at work about mental health
They would see it as a sign of weakness
Somebody outside of work
I did not speak to anybody about it
Colleague
Line Manager
Why education professionals did not speak to anyone at work
They would see it as a sign of weakness
They wouldn’t be supportive (+ 5%)
I prefer to seek support from people outside of work (- 7%)
I would be worried about losing my job
People at work have been the cause of my difficulties in the past
No-one talks about their problems at work (- 10%)
Confidence in sharing mental health issues at work
Confident
Not very confident
Education professionals who spoke to someone at work or outside work and how this helped
It gave me perspective and helped me realise I am not alone (- 6%)
It restored my confidence in my abilities
It equipped me with practical advice
It enabled me to seek professional support
I don’t think it helped
I gained permission to seek help / it removed the stigma
Mental health and wellbeing guidance available at work
Sufficient guidance
Insufficient guidance
Levels of support received at work to those who experience mental health and wellbeing problems
Well supported
Not very well supported (+ 7%)
The help available at work
Union people to talk to
Employee assistance counselling services
Encouragement to speak up when struggling
HR staff to talk to
Exercise classes, groups or programmes
Mindfulness classes or programmes
Training on common mental health conditions
Mentoring/co-worker support schemes
Health-related support staff to talk to
Mental health first aid training
Resilience, energy or stress management classes or programmes
Massage or relaxation classes or programmes
How educational institutions could improve the mental health and wellbeing of their workforce
Managers working with their staff to reduce workload
Changes being better communicated to staff by managers
My employer having a well-implemented pupil/student behaviour policy
The leadership team being more approachable
My employer implementing a structured staff health and wellbeing programme (eg stress management workshops, support groups etc)
My employer allowing flexible working hours to fit with other commitments
My employer having to meet high standards of health and wellbeing provision for staff regulated by an independent body (- 5%)
My employer making us more aware of the support available (eg Employee Assistance Programmes)
Colleagues being more understanding and accommodating of each other’s needs and feelings
Mental health and wellbeing policies
How well mental health and wellbeing policies were being implemented (- 9% most/some of the time; + 11% no/never)
EXECUTIVE SUMMARY

12
This report explores the mental health and wellbeing of education professionals working across the education sector. The underpinning research had three aims:
1) To provide a description of the mental health and wellbeing of teachers and education staff using the most recent data
2) Analyse trends over time
3) Identify differences in the teacher and education staff populations as appropriate
The research was conducted using an online survey of education professionals drawn from YouGov’s panel. The total sample size was 1,502 education professionals and the survey was conducted during the period 27 June to 22 July 2018. The sample includes all job roles within the education profession from senior leaders through to support staff. Appendix A gives a detailed breakdown of the responses received by sector and region, and also by gender, age and time spent working in education.
The findings from this survey are presented in two reports – this report which details the findings relating to education staff in different job roles in the Early Years, Primary, Secondary, Further, Adult, and Vocational Education sectors; and a second separate report which covers the findings for the Higher Education sector.
Education Support Partnership conducted its first large-scale survey in this field last year, and the findings can be found in the report on its website1 “Health Survey 2017 – The mental health and wellbeing of education professionals in the UK”. Comparisons with the 2017 data have been made in order to baseline this Index2. It should be noted that the 2017 report included data from the Higher Education sector which, in order to ensure comparability with the 2018 Index (this report), has needed to be re-worked to consist solely of responses from staff working in the Primary, Secondary, Further, Adult and Vocational Education sectors. All findings have been shown in percentages.
This Index has been structured around four main themes:
u Section 1 – Understanding why people choose to work in the education sector to build a picture of what it means to work in education.
u Section 2 – Identifying aspects of the mental health and wellbeing of education professionals, with a focus on individual employees.
u Section 3 – Detailing how the impact of an individual employee’s mental health and wellbeing affects their students and others working in education.
u Section 4 – Describing the mental health and wellbeing guidance available to staff in the education sector.
1 https://www.educationsupportpartnership.org.uk/2 As a result of new GDPR legislation, all YouGov respondents in the 2018 research were given the option to opt-out of questions which gathered sensitive personal data, including questions which captured information about their health. In the analysis these were coded as “refused”, in addition to respondents who selected the “prefer not to say” option. Where Index comparisons with 2017 have been made, the figures are based on those who responded to the question (ie excluding “refused” and “prefer not to say”).
About the report
ABOUT THE REPORT
13
Section 1: Working in the education sector – building a picture of staffing

14
a) What professionals love about working in educationEducation professionals gave many different reasons for why they love working in education – with the main reasons being wanting to work with children/young people and make a difference, or an impact, on their lives. They want to teach them and help them learn, achieve and progress. Many replies indicated respondents had a very strong passion for the job, which they found rewarding. They valued the variation where every day is different and the “lightbulb” moments when learners suddenly understood a concept or realised a link between subjects. Many also valued the opportunity to work with like-minded colleagues, and the longer holidays to recuperate.
Those working with younger children noted the importance of building relationships, with parents,
families, and the wider community, and to provide inspiration. Those working with older students often expressed the importance of the subject they teach and saw their role in terms of empowering students for the next stage in their lives, often seen as further training, university or employment.
A word cloud has been prepared from the 1,076 open responses received to this question (41 from the Early Years’ sector, 436 from the Primary sector, 463 from the Secondary sector and 136 from the Further/Adult/Vocational sector). Only those areas achieving more than four responses have been shown. The text size relates to the frequency of occurrence so that the responses can easily be visualised. A more detailed selection of answers to illustrate this can be found in Appendix B.
This section seeks to build a picture of why people choose to work in the education sector and what it is like. It defines what they love and dislike about working in education, their levels of happiness, satisfaction, anxiety and stress, sources of support they may access, working hours and how this may affect their work/life balance.
SECTION 1
The children
Teaching
Achievement
My colleagues
Progression
Working with children
Holidays
Working with young people
My subject
Development
Variation
The students
Rewarding
The kids
Building relationships
Enjoyment
Inspiration
"Lightbulb" moments
SuccessLearning
Challenge
Working with young people
Helping children
Enthusiasm
Creativity
Fun SEN/SEND
Improvement
Changing lives
Engagement
Interaction
Excitement
Working with studentsKnowledge/skills
Being in the classroom
Own learning
Never boring
Laughter
Watching children grow
Understanding
Team working
Good results
The young people
Contact with families
Safe environment
Being with children
Working with pupils
Satisfaction
Motivation
Nurturing
Working with kids
Develop

15
b) What professionals dislike about working in educationEducation professionals gave a variety of reasons of what they disliked about working in education – with the overwhelming reason being ‘workload’. The second and third major dislikes were completing paperwork which was seen as unnecessary and dealing with poor learner behaviour in class. Other dislikes included issues with parents, criticisms of Senior Leadership/Management Teams and the perceived nature of Government interference in education. They also disliked their pay, considering it to be too low/poor, especially in relation to the long hours they work and the pressure/stress they felt under. Target setting, and its use to drive many aspects of school/college life, was also heavily criticised.
Those working with younger children stressed the importance of the development of the whole child, which is not always in line with expectations. Those working with older students highlighted the prominence given to achieving results (often driven by target-setting) which takes no account of the learner or their educational context.
A word cloud has been prepared from the 1,041 open responses received to this question (41 from the Early Years’ sector, 412 from the Primary sector, 456 from the Secondary sector and 132 from the Further/Adult/Vocational sector). Again, only those areas achieving more than four responses have been shown and a selection of answers to illustrate the range of opinions can be found in Appendix B.
SECTION 1
WorkloadUnnecessary paperworkPoor children/pupil/student behaviour
Low/poor paySLT issues
Long hours
Parents
PressureGovernment interference
Stress
Excessive data use
Targets
Funding cuts
Ofsted
Marking
Bureaucracy
Constant change
Unnecessary administration tasks
Lack of respect
Feeling never good enough
Work/life balance
Tick-box culture
Curriculum change
Accountability
Red tape
Lack of resourcesObservations
Media issues (portrayal of teachers) Lack of funding
Politics
Lack of trust in teachers
Assessment
Exam culture
Feeling under scrutiny
Inspections
Testing
Bullying
Lack of appreciation
Exam Results
Underfunding
MeetingsPerception of long holidays
Management issues
Budget cuts
Deadlines
SATs
Lack of time
Politics
Scrutiny
Assessments
Deadlines
Underfunding
Academy Trusts
Reports
League tables
Lack of recognition
Book scrutines

16
c) Levels of general satisfaction, happiness and anxiety of education professionalsEducation professionals were both broadly satisfied and happy with their lives.
u More than three-quarters rated their satisfaction with their life and their current state of happiness at between 6-10, on a scale of 0-10 where 0 was not at all satisfied/happy and 10 was completely satisfied/happy. This was broadly consistent across both 2018 and 2017.
u While there were no major differences across job roles, or education sectors, staff working 60+ hours per week were generally less satisfied and less happy than those working less hours.
However their levels of anxiety were much higher.
u Almost three-quarters of education professionals rated their level of anxiety at between 3-10 (72% in 2018 compared with 76% in 2017).
u There were no major differences across education sectors, but those working in other roles were more likely rate their anxiety levels as zero.
2018 Base: All education professionals (n = 1,187)
2017 Base: All education professionals (n = 987)
Levels of anxiety felt
Levels of satisfaction felt with life Levels of happiness felt
2018 Base: All education professionals (n = 1,187)
2017 Base: All education professionals (n = 987)
0Not
at all
1 2 3 4 5 6 7 8 9 10Completely
8% 8%
6% 6%
3% 3%
10% 10%
13%
12%
13%
7% 7%
2018 2017
12%12%
11% 11%11%
14%
9%
4%
11%
0Not
at all
1 2 3 4 5 6 7 8 9 10Completely
1%1% 1%1%2%3% 3%
4% 4% 4%
8%9%
5% 5%
8%
15%
28%
24%
27% 27%
13%
8%
2018 2017
0Not
at all
1 2 3 4 5 6 7 8 9 10Completely
2018 2017
1% 1% 1%3%
4% 5%6% 6%6%8%
10%
13%15%
20% 20%
14%12%
6%5%
22% 22%
0%
SECTION 1
17
How the job has made education professionals feel in June/July 2018
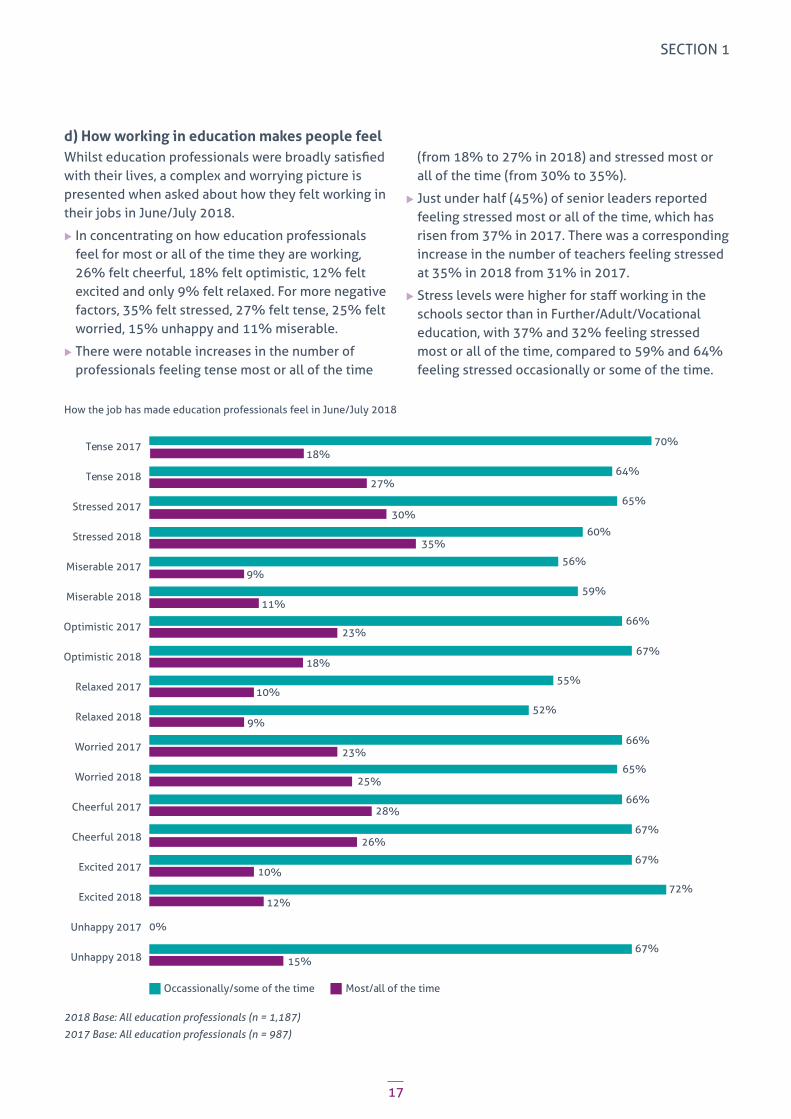
d) How working in education makes people feelWhilst education professionals were broadly satisfied with their lives, a complex and worrying picture is presented when asked about how they felt working in their jobs in June/July 2018.
u In concentrating on how education professionals feel for most or all of the time they are working, 26% felt cheerful, 18% felt optimistic, 12% felt excited and only 9% felt relaxed. For more negative factors, 35% felt stressed, 27% felt tense, 25% felt worried, 15% unhappy and 11% miserable.
u There were notable increases in the number of professionals feeling tense most or all of the time
(from 18% to 27% in 2018) and stressed most or all of the time (from 30% to 35%).
u Just under half (45%) of senior leaders reported feeling stressed most or all of the time, which has risen from 37% in 2017. There was a corresponding increase in the number of teachers feeling stressed at 35% in 2018 from 31% in 2017.
u Stress levels were higher for staff working in the schools sector than in Further/Adult/Vocational education, with 37% and 32% feeling stressed most or all of the time, compared to 59% and 64% feeling stressed occasionally or some of the time.
2018 Base: All education professionals (n = 1,187)
2017 Base: All education professionals (n = 987)
Tense 2017 70%
72%
55%
52%
66%
67%
67%
66%
65%
64%
65%
60%
56%
59%
66%
67%
18%
9%
11%
23%
23%
25%
28%
10%
12%
18%
10%
9%
27%
30%
35%
Tense 2018
Stressed 2017
Stressed 2018
Miserable 2017
Miserable 2018
Optimistic 2017
Optimistic 2018
Relaxed 2017
Relaxed 2018
Worried 2017
Worried 2018
Cheerful 2017
Cheerful 2018
Excited 2017
Excited 2018
Unhappy 2017
Unhappy 2018
Occassionally/some of the time Most/all of the time
67%15%
26%
0%
SECTION 1

18
e) Levels of stress working in the education sectorAs noted above, 35% of education professionals said they felt stressed when asked about their feelings in June/July 2018. Their overall levels of stress were also examined.
u In 2018 more than two thirds (67%) of education professionals described themselves as stressed at work, compared to 33% who said they were not.
u Stress levels were unchanged from 2017 (where 66% of education professionals described themselves as stressed and 33% said they were not).
u When looking across job roles, 80% of senior leaders responded they were stressed, compared to 64% of teachers and 62% of people working in other roles.
u Professionals working in the secondary schools sector report higher levels of stress than those working in other sectors.
2018 Base: All education professionals (n = 1,187); senior leaders (n = 229), teachers (n = 723); other staff (n = 79)
How education professionals describe their current level of stress at work 2018
SeniorLeaders
2018
20%
80%
Teachers2018
35%
64%
Other Roles2018
38%
62%
Stressed
Not stressed
SECTION 1

19
f) How education professionals deal with stress and its effect on their performance at workAs noted above, 67% of education professionals describe themselves as stressed. The ways that they coped with such stress were by eating food (47%), drinking alcohol (32%), and undertaking unnecessary spending (22%). Other ways were with the use of drugs (5%), gambling (3%) and other methods (3%). However, 35% of respondents did not use any of these methods. There are some differences in the use of these methods by job role:
u Senior leaders were more likely to cope with workplace stress or anxiety by turning to food, or alcohol than teachers or staff working in other roles.
u Senior leaders and teachers were more likely to cope by undertaking unnecessary spending compared to staff working in other roles.
The substances, or behaviours, which education professionals may have used to cope with workplace stress or anxiety could also positively or negatively affect a number of aspects in schools/colleges.
The largest aspect in which work performance was affected was the ability to plan lessons and mark students’ work, where it was considered to be negatively affected by 30% (with a small positive effect of 6%). It was also negatively affected the ability of professionals to manage poor classroom behaviour by 21% (positively affected by 8%), negatively impacted on the relationship with colleagues by 21% (positively affected by 11%), and had a negative impact on pupil learning of 15% (positively affected by 9%).
2018 Base: All education professionals (n = 1,150); senior leaders (n = 219), teachers (n = 707); other staff (n = 75)
2018 Base: All education professionals (n = 710)
How elements of work performance have been affected by using substances or behaviours to cope with workplace stress or anxiety
How education professionals in different job roles cope with workplace stress or anxiety in 2018
How education professionals cope with workplace stress or anxiety in 2018
Food/eating 47%
None of these
Alcohol
Unecessaryspending
Drugs
Other
Gambling
Don’t know/can’t remember
35%
32%
22%
5%
3%
3%
3%
Food/eating30%
8%
4%
4%
4%3%
3%1%
4%
2%
2%
4%6%
5%
27%23%
30%
30%
42%37%
35%
52%47%
46%None of these
Alcohol
Unecessaryspending
Drugs
Other
Gambling
Don’t know/can’t remember
Other roles Senior leaders only Teachers
Student/pupillearning
15%
30%
21% 21%
6% 8% 11%
Lesson planningand marking
Management ofpoor classroom
behaviour
Relationship withcolleagues
9%
SECTION 1

20
g) Sources of support accessed by those who experienced mental health issuesThose education professionals who had experienced mental health issues were asked to detail their sources of support. All sources of support showed an increase in 2018, compared to 2017, with the exception of accessing a counsellor/psychiatrist/psychologist. Specifically:
u Those education professionals who have experienced psychological, physical or behavioural problems as a result of work turn first to people outside of work such as family/friends, where an 8% increase has been noted (45% in 2018 compared with 37% in 2017).
u More than one third (40%) of education professionals would then turn to their partner/spouse.
u One fifth (20%) turn to their employer, line manager or senior staff member at work, where a 9% increase has been noted (20% in 2018 compared to 11% in 2017).
u One fifth (19%) did not speak to anyone about their problems.
u Staff with 1-5 years’ experience were more likely to turn to family/friends for advice.
Note: In 2017 family and friends were separate categories, so the mean has been used. The same applies for employer/line manager and senior staff member.
Only sources with more than 10% of responses have been shown above.
2018 Base: All education professionals (n = 883)
2017 Base: All education professionals (n = 757)
Sources of support accessed by those who experienced mental health issues
SECTION 1
Family/friends
A union
Partner/spouse
GP/NHS/health professionals
Peers/colleagues
None of these
Website/a general internet search
Counsellor/psychiatrist/psychologist
37%
33%34%
24%27%
40%40%
45%
2017 2018
11%20%
15%
15%
19%
14%
17%13%
9%12%

21
h) Working hours – contracted and workedLong working hours continue to be a reality in the education profession across all job roles, with many education professionals working for many more hours than they are contracted to.
u More than half (58%) of all education professionals work more than 41 hours per week (found both in 2018 and 2017).
u In 2018, 32% of all education professionals work more than 51 hours a week on average – compared to 35% in 2017.
u Senior leaders work much longer hours than they are contracted to do – only 5% are contracted to work 51+ hours per week and yet 59% do so.
u Teachers work longer hours than they are contracted to do as well – only 6% are contracted to work 41-50 hours per week but 25% do, and only 2% are contracted to work 51+ hours per week and yet 29% do.
u There are no staff working in other roles contracted to work more than 40 hours per week and yet 31% do so.
Working long hours and the feeling of stress appear to be closely linked. The highest levels of stress reported come from those professionals working more than 41 hours per week, whereas those working less than 40 hours per week were more likely to report not feeling stressed.
2018 Bases: Senior leaders (n = 229), Teachers (n = 723), other staff roles (n = 79)
2018 Base: All education professionals (n = 1,187)
Comparison of levels of stress felt from working with typical number of hours worked per week - 2018
Senior Leaders - Contracted hours versus hours typically worked per week in 2018
Teachers - Contracted hours versus hours typically worked per week in 2018
Other staff roles - Contracted hours versus hours typically worked per week in 2018
Lessthan 20
Other roles (contracted to work)
Other roles (typically work)
Hou
rs
21-30 31-40 41-50 51-60 60+
70%60%50%40%30%20%10%
0%
SECTION 1
Lessthan 20
21-30 31-40 41-50 51-60 60+
Stressed
Not stressed
16%
3%
20%
9%
29%
18% 18%
21%
28%
9%
24%
4%
Lessthan 20
Senior leaders (contracted to work)
Senior leaders (typically work)
Hou
rs
21-30 31-40 41-50 51-60 60+
70%
50%
30%
10%
0%
Lessthan 20
Teachers (contracted to work)
Teachers (typically work)
21-30 31-40 41-50 51-60 60+
70%
50%
30%
10%
0%
Hou
rs

22
i) Work/life balanceWorking long hours, it is difficult to achieve the right balance between home and work lives. Maintaining a healthy work/life balance is important to the profession in order to be able to attract and retain its staff.
u When asked about the extent to which various factors contribute to a negative work/life balance, education professionals most commonly indicated the inability to switch off and relax was the most important factor (74%), slightly less than 77% in 2017.
u Other issues which also negatively affected the balance were working long hours on weekdays by (71%), not finding time to be with family/friends (65%), working over the weekends (62%), and working during the holidays (60%).
u Conversely, 26% stated that family commitments were a factor in preventing them doing a good job at work.
u In all six factors noted below, senior leaders expressed these areas more negatively influenced their work/life balance, compared to teachers or those working in other roles.
2018 Base: All education professionals (n = 1,187)
2017 Base: All education professionals (n = 987)
Aspects of achieving a work/life balance are also addressed in Section 2 (reasons for leaving the profession) and Section 3 (Impact on individual’s mental health and wellbeing).
The next section will explore the impact of mental health and wellbeing on the individual.
Factors that contribute a great deal or somewhat to a negative work-life balance for education professionals
SECTION 1
Working long hours on weekdays
Working overthe weekends
Working during holidays
Family commitments preventing mefrom doing a good job at work
2017 2018
77%
74% 71% 65%
62% 60%
26%
72% 67%
67% 63%
25%
23
Section 2: The mental health and wellbeing of education professionals – the individual

24
In the last two years
In the last year
Irritability, mood swings
Tearfulness
Over-eating
Forgetfulness
Muscle tension
Recurring headaches/migraines
Dizziness
Changes to appetite
Panic attacks
None of these
Under-eating
High blood pressure
41%
36%
36%
41%
40%
56%
31%
33%
27%
27%
27%
28%
44%
42%
37%51%
12%
15%
14%
14%
14%
9%
12%
26%
24%21%21%
20%
a) The symptoms experienced and the signsEducation professionals reported experiencing a variety of symptoms tied to their mental health and wellbeing which could be assumed to have the potential impact on their working lives. They were asked a question about their symptoms both relating to this year and also reflecting back to the previous year at the same time.
u In the last year there had been a large increase in people suffering from many and varied symptoms. This included insomnia (41% to 56%), and a similar proportion suffering irritability or mood swings (37% to 51%).
u Other areas include tearfulness (31% to 44%), forgetfulness (27% to 41%) and difficulty concentrating (27% to 40%).
u Senior leaders were more likely to suffer from all these symptoms than teachers or professionals working in other roles.
u Staff working more than 60 hours per week experienced more symptoms than those working less than 60 hours per week.
u 51% of staff who have worked for between 21-30 years were more likely to suffer from insomnia. Otherwise there were no major links found between symptoms discovered and tenure.
u Those working in the school sector were more likely to suffer from panic attacks and under-eating, whereas those working in the Further/Adult/Voluntary sector were more likely to experience difficulty concentrating.
This section seeks to build a picture of the mental health and wellbeing of education professionals as individuals (Section 3 details the impact on other people). This includes what symptoms they may have experienced, and their signs. It also includes data relating to any mental health issues experienced in the last year, including those related to work, and how these, and personal issues, were alleviated. Mention is made of threats some education professionals face, and the reasons detailed why some staff might have wanted to leave the profession during the last two years.
2018 Base: All education professionals, in the last year (n = 1,085) in the last two years (n = 836)
Note: A reflective question, asking respondents in 2018 for their perceptions relating to both 2018 and 2017 (in 2017 there was a large category of respondents who refused to answer the question)
Symptoms experienced by education professionals in the last 1-2 years
SECTION 2
25
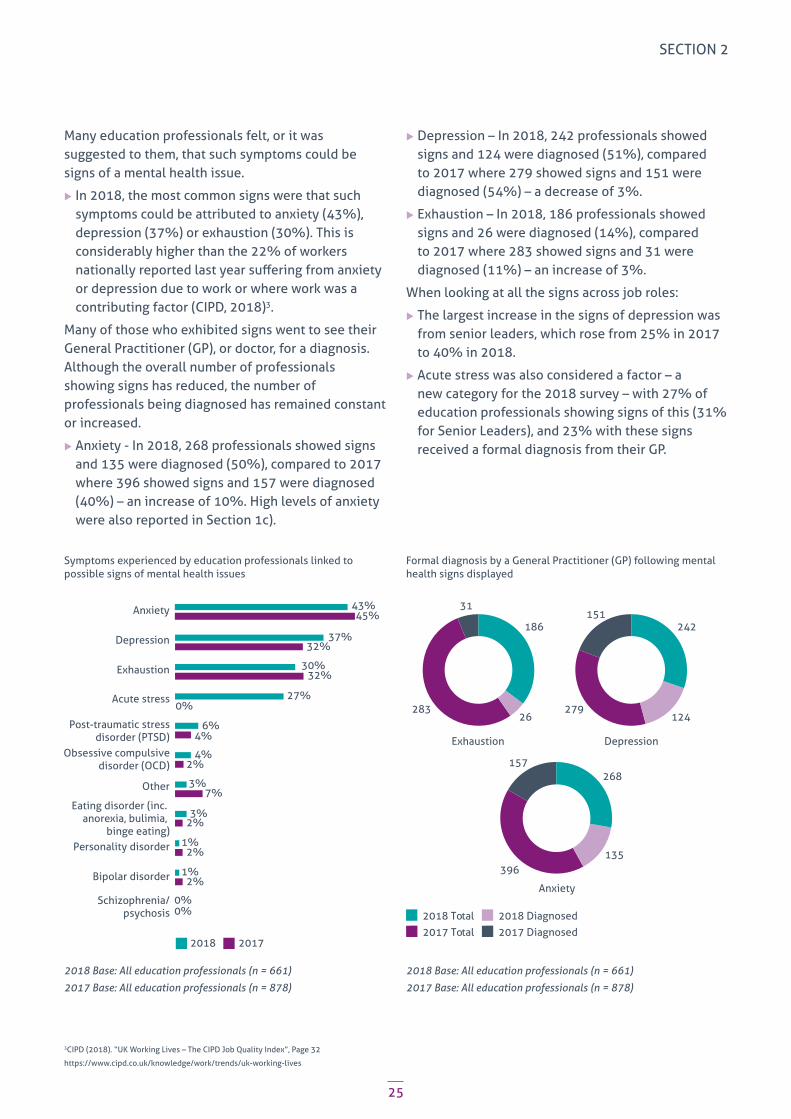
Many education professionals felt, or it was suggested to them, that such symptoms could be signs of a mental health issue.
u In 2018, the most common signs were that such symptoms could be attributed to anxiety (43%), depression (37%) or exhaustion (30%). This is considerably higher than the 22% of workers nationally reported last year suffering from anxiety or depression due to work or where work was a contributing factor (CIPD, 2018)3.
Many of those who exhibited signs went to see their General Practitioner (GP), or doctor, for a diagnosis. Although the overall number of professionals showing signs has reduced, the number of professionals being diagnosed has remained constant or increased.
u Anxiety - In 2018, 268 professionals showed signs and 135 were diagnosed (50%), compared to 2017 where 396 showed signs and 157 were diagnosed (40%) – an increase of 10%. High levels of anxiety were also reported in Section 1c).
u Depression – In 2018, 242 professionals showed signs and 124 were diagnosed (51%), compared to 2017 where 279 showed signs and 151 were diagnosed (54%) – a decrease of 3%.
u Exhaustion – In 2018, 186 professionals showed signs and 26 were diagnosed (14%), compared to 2017 where 283 showed signs and 31 were diagnosed (11%) – an increase of 3%.
When looking at all the signs across job roles:
u The largest increase in the signs of depression was from senior leaders, which rose from 25% in 2017 to 40% in 2018.
u Acute stress was also considered a factor – a new category for the 2018 survey – with 27% of education professionals showing signs of this (31% for Senior Leaders), and 23% with these signs received a formal diagnosis from their GP.
3CIPD (2018). “UK Working Lives – The CIPD Job Quality Index”, Page 32
https://www.cipd.co.uk/knowledge/work/trends/uk-working-lives
2018 Base: All education professionals (n = 661)
2017 Base: All education professionals (n = 878)
2018 Base: All education professionals (n = 661)
2017 Base: All education professionals (n = 878)
Symptoms experienced by education professionals linked to possible signs of mental health issues
Formal diagnosis by a General Practitioner (GP) following mental health signs displayed
Exhaustion
Anxiety
Depression
2018 Total 2018 Diagnosed
2017 Total 2017 Diagnosed
283
396
268157
135
279
186 242
31151
26 124
SECTION 2
Anxiety
Depression
Exhaustion
Acute stress
Post-traumatic stressdisorder (PTSD)
Obsessive compulsivedisorder (OCD)
Other
Eating disorder (inc. anorexia, bulimia,
binge eating)Personality disorder
Bipolar disorder
Schizophrenia/psychosis
6%4%
4%2%
2%
3%
2%
2%
3%
7%
27%0%
30%32%
32%37%
1%
1%
0%0%
2018 2017
43%45%

26
b) Mental health issues experienced in the last year
u In 2018, nearly one-third (31%) of education professionals (33% of teachers and 31% of senior leaders) stated they had experienced mental health issues in the past academic year, 65% have not, and 4% preferred not to answer the question.
u Of those who reported they had experienced a mental health issue, 30% attributed this to work (which was higher among senior leaders), 54% to both work and home issues and 13% to their personal life.
u Staff with up to 5 years’ service reported the most mental health issues.
u Those staff working more than 41 hours per week were more likely to attribute their mental health issues to work (45% for those working 60 hours or more, 40% for those working 41-60 hours, compared to 13% for those working less than 40 hours).
u Staff working in other roles (74%) were less likely to have experienced mental health issues than those working as a teacher (66%).
c) Mental health issues experienced by education professionals due to workMany education professionals disclosed that they have faced physical and mental health issues which they attribute to their work.
u In 2018, 76% of education professionals reported they experienced at least one symptom related to work.
u Just over half (58%) say they experienced behavioural changes, half (50%) physical symptoms and just under half (47%) psychological symptoms related to work.
u Senior leaders were more likely to have experienced behaviour and physical symptoms, compared with teachers and staff working in other roles.
u Staff working more than 60 hours per week were more likely to have experienced all symptoms than those working less than 60 hours per week.
Last year there was a 35% increase in teachers accessing the Education Support Partnership’s free and confidential emotional support helpline, run by trained and accredited counsellors. In total, 8,668 cases were managed.
2018 Base: All education professionals (n = 1,187)
Education professionals experiencing mental health issues in 2018
When compared to the UK workforce overall4, education professionals report higher levels of all symptoms due to work.
u 76% of education professionals have experienced at least one symptom compared with 60% of UK employees.
u Education professionals also experience higher levels of behavioural and physical symptoms than other UK employees.
4BITC (2017). “Mental Health at Work Report 2017”, Page 5.
https://wellbeing.bitc.org.uk/all-resources/research-articles/mental-health-work-report-2017
Yes
Refused
No
Prefer not to say
65%31%
3% 1%
SECTION 2

27
2018 Base: All education professionals (n = 1,163)
2017 Base: All education professionals (n = 987)
2018 Base: All education professionals (n = 1,163)
UK Employees Base: Unknown
Symptoms ever experienced by education professionals due to work where work was a contributing factor
Symptoms ever experienced due to work or where work was a contributing factor - in comparison with the UK workforce overall
SECTION 2
2018 2017
Net: any symptom
Behavioural (e.g. changes to appetite,irritability, procrastination, mood swings)
Physical symptoms (e.g. raised blood pressure, muscle tension, sweating,
dizziness,headaches or migraines)
Psychological symptoms(e.g. depression, anxiety, panic attacks)
None of the above
76%75%
58%57%
50%52%
47%50%
24%22%
UK Employee: BITC (2017) Mental Health at Work
Teacher Wellbeing Index 2018
Net: any symptom
Behavioural (e.g. changes to appetite,irritability, procrastination, mood swings)
Physical symptoms (e.g. raised blood pressure, muscle tension, sweating,
dizziness,headaches or migraines)
Psychological symptoms(e.g. depression, anxiety, panic attacks)
None of the above
60%76%
37%58%
37%50%
40%47%
38%24%

28
For those education professionals who had experienced symptoms where work was a contributing factor:
u Excessive workload emerged as the top cause of poor mental health, with more than two-thirds (69%) of education professionals reporting this. This links to the finding in Section 1b) of this report, where workload was the major dislike of working in education. However, workload as an issue did reduce in importance when compared with the 2017 data (79% to 69%).
u School leaders were more likely to cite workload issues than teachers and staff working in other roles in both 2017 and 2018.
u Work/life balance was another top cause by more than two-thirds (68%) of education professionals, and this was noted equally by both senior leaders and teachers in 2018. However, like workload, this has reduced from 2018 to 2017 (73% to 68%).
u The difficulty with managing students’ behaviour increased significantly in 2018 from 34% to 43%.
u Redundancy/restructure was more likely to be noted by those members of staff working in other roles (50%), than by teachers (20%) or by senior leaders (14%).
u Bullying was also more likely to be noted by members of staff working in other roles (45%), compared to teachers and senior members of staff (20% each).
u Receiving a low income remained a constant factor across both years.
u The rapid pace of change dropped sharply (from 50% in 2017 to 29% in 2018), no doubt because the changes required to National Curriculum subjects have now largely been implemented.
u From feedback received, three new categories were introduced in 2018, relating to lack of trust from managers (noted by 28%), inspections (28%), and lack of opportunities to work independently (14%).
2018 Base: All education professionals (n = 314)
2017 Base: All education professionals (n = 124)
Work issues that symptoms were related to for education professionals
2018 2017
Excessive workload
Lack of trust from managers
Inspections
Problems with students’ parents
Bullying by colleagues
Redundancy/restructure
Lack of opportunities towork independently
Discrimination
Retirement
Work-life balance
Students’ behaviour
Low income
Unreasonable demandsfrom manager
Rapid pace of change(e.g. National Curriculum)
69%
3%1%
8%5%
14%
29%
28%0%
0%
28%
26%
24%
20%
20%21%
20%
0%
49%
50%
43%
43%41%
41%
34%
68%73%
79%
SECTION 2

29
d) Threats experienced by education professionals at workAll education institutions owe their staff a duty of care to protect them from threats and violence at work and to maintain a safe and healthy workplace.
u During their time working in educational institutions, 42% of professionals have felt threatened in some way (51% have not felt threatened, 4% don’t know/can’t remember and 2% preferred not to answer this question).
u Senior leaders in schools were more likely to feel threatened (51%), compared to teachers (42%) or those working in other roles (35%).
u Of those who felt threatened, threats from students were the most common group (60%), followed by parents of a student (50%), the leadership team/a member of the leadership team (36%), a line manager (26%) and a colleague (20%).
u The most common type of threats, to those who felt threatened, were harassment or intimidation (58%), followed by bullying (44%), physical harm or injury (38%), and a formal complaint to a senior staff member/administration (37%).
e) Mental health issues experienced by education professionals due to personal reasonsEducation professionals could also experience mental health issues due to personal reasons:
u The main three personal issues were family issues (experienced by 48% in 2018, compared to 55% in 2017); financial worries (experienced by 45% in 2018, compared to 53% in 2017) and health concerns (experienced by 32% in 2018, compared to 40% in 2017).
u Those staff members working in the Further/Adult/Vocational sectors were more likely to report personal health concerns than those working in the schools’ sector.
u Staff with 1-5 years of service were more likely to report problems with housing.
2018 Base: All education professionals (n = 314)
2017 Base: All education professionals (n = 124)
Symptoms and their relationship to personal issues
Last year there was a 42% increase in applications to the Education Support Partnership’s financial grants’ programme. The most prevalent issue was housing.
SECTION 2
2017 2018
Family issues
Fanancial worries
Health concerns
Bereavement
None of these
Trauma
Other
Housing problems
Problems with neighbours
55%
4%7%
12%14%
10%12%
19%13%
13%5%
18%19%
40%32%
48%
53%45%
30
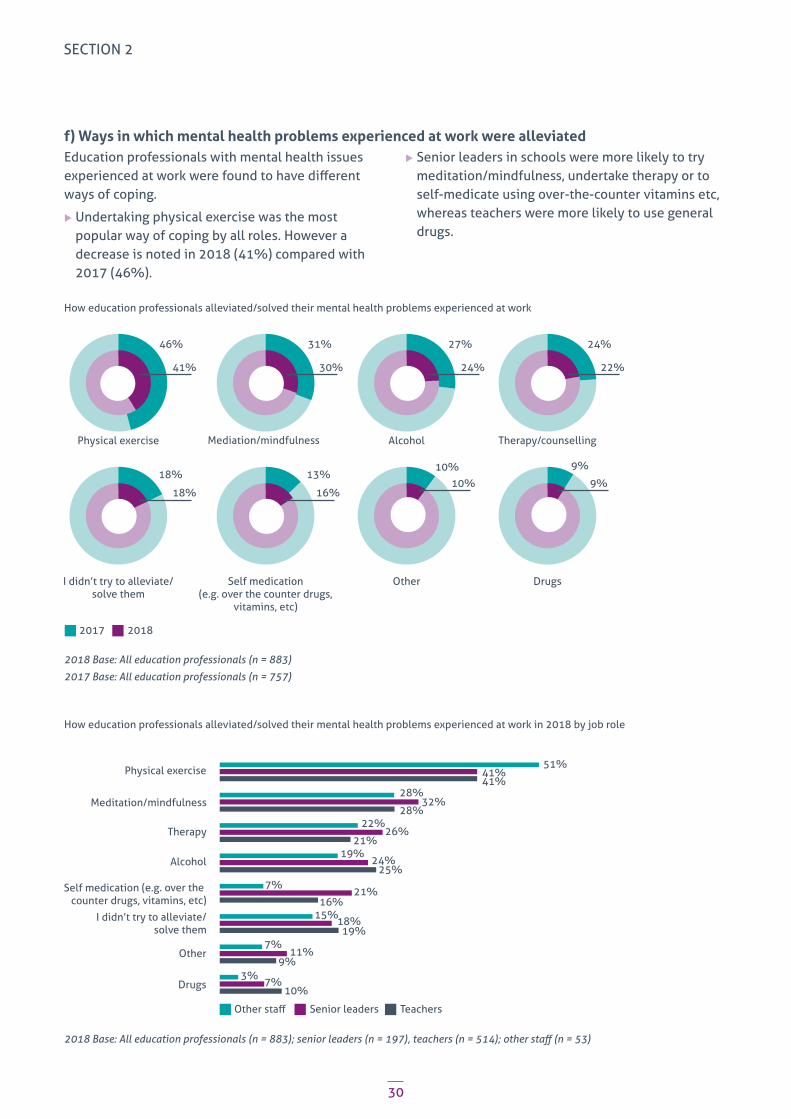
f) Ways in which mental health problems experienced at work were alleviatedEducation professionals with mental health issues experienced at work were found to have different ways of coping.
u Undertaking physical exercise was the most popular way of coping by all roles. However a decrease is noted in 2018 (41%) compared with 2017 (46%).
u Senior leaders in schools were more likely to try meditation/mindfulness, undertake therapy or to self-medicate using over-the-counter vitamins etc, whereas teachers were more likely to use general drugs.
2018 Base: All education professionals (n = 883)
2017 Base: All education professionals (n = 757)
2018 Base: All education professionals (n = 883); senior leaders (n = 197), teachers (n = 514); other staff (n = 53)
How education professionals alleviated/solved their mental health problems experienced at work
How education professionals alleviated/solved their mental health problems experienced at work in 2018 by job role
Senior leaders Teachers
Physical exercise
Other
Drugs
Meditation/mindfulness
Therapy
Alcohol
Self medication (e.g. over the counter drugs, vitamins, etc)
I didn’t try to alleviate/solve them
51%
10%3%
9%
7%
7%
11%
18%19%
15%
7%21%
16%
24%25%
19%
22%
21%26%
41%41%
28%32%
28%
Mediation/mindfulnessPhysical exercise
I didn’t try to alleviate/solve them
Self medication(e.g. over the counter drugs,
vitamins, etc)
Alcohol
Other Drugs
2017 2018
46%
41%
31% 27% 24%
18% 13%10% 9%
18% 16%10% 9%
30% 24% 22%
SECTION 2

31
g) Education professionals who have considered leaving the profession due to health and wellbeing issues in the last two years
u As a result of health pressures, more than half of all education professionals (57%) in 2018 have considered leaving the profession in the last two years (compared to 56% in 2017).
u Senior leaders were more likely than those in teaching or other roles to have considered leaving – 63%, compared with 58% and 49% respectively.
u Those professionals working 60+ hours per week were more likely to consider leaving than those who did not.
Retaining teachers and other staff working in education is of high importance in order to ensure schools and colleges are well and appropriately staffed. In order to understand this in detail, respondents completed both a closed question (requiring them to indicate such reasons, which allowed comparison with 2017) and an open free-response question.
2018 Base: All education professionals with health pressures (n = 675)
2018 Base: All education professionals (n = 675)
2017 Base: All education professionals (n = 549)
Reasons given for considering leaving the education profession in the last two years by staff who have experienced pressures on their health and wellbeing (Closed Responses)
Education professionals who have considered leaving the sector in the past 2 years due to pressures on their health and wellbeing
2017 2018
Student behaviour
Mental health concerns
Seeking higher pay
Physical health concerns
Other
Retiring fromprofession/sector
Rapid pace oforganisational change
Volume of workload
Unreasonable demandsfrom managers
Seeking better work/life balance
78%
5%
7%
7%
6%
23%27%
35%30%
31%24%
41%38%
40%
72%
77%68%
58%55%
33%
SECTION 2
NoYes
57%
41%

32
u Workload is a continuing theme found throughout this Index report. If a comparison is made to other professionals in the same socio-economic group (B) of the workforce, which also includes other professions such as the police, where 35% consider their workload to be far too high, 57% about right, and 8% to little or far too little, then education professionals experiencing such high workload issues becomes important (CIPD, 20175).
u The pressure and stress that staff felt was the other major factor in the open responses.
u Many staff felt that they were unsupported in their roles, considered they received low pay and experienced problems with their work/life balance (both of which were often linked to workload). Handling difficult student behaviour, and not being supported in this by their management was another key issue. These were all recurring themes reported in this Index.
u Volume of workload was the major reason given for leaving the profession, with 72% of education professionals citing this.
u There were two reasons in 2018 which were rated higher than in 2017, namely aspects to do with student behaviour (increased from 33% to 40%, also referenced in 2c) relating to work issues which contribute towards symptoms of mental health) and wishing to seek higher pay (increased from 24% to 31%). The percentage answers to all other pre-selected reasons showed a reduced response in 2018 when compared to 2017.
There were 1,171 open responses received to the same question, which when analysed contained 620 suggestions which were grouped into 23 discreet categories.
u Again, workload was the main answer given to both questions. In Section 2c) this was the main self-reported mental health symptom.
5UK CIPD (2018). “UK Working Lives – The CIPD Job Quality Index”, Page 21
https://www.cipd.co.uk/knowledge/work/trends/uk-working-lives
2018 Base: All education professionals (n = 1,171)
The next section will explore the impact of mental health and wellbeing on others studying and working in the education sector.
Reasons given for considering leaving the education profession in the last two years by staff who have experienced pressures on their health and wellbeing (Open Responses)
Pressure/stress at workWorkload
RetirementLack of career progression
Children with Special Needs (issues)Accountability (increased)
Unhappiness (feeling useless, miserable etc)Criticism (general and in the media)
Lack of SLT supportPay (low)
Impact on home/work balance
Health problems (all)Data (for assessment and monitoring)
Exams/testingConstant change (curriculum)
Bullying/racismInspections (Ofsted, and school monitoring)
MarkingDealing with parents/their expectations
21%18%
9%8%8%
6%4%
4%3%3%3%2%2%
2%2%2%
1%1%
1%1%1%0%0%
SECTION 2

Section 3: The impact of an individual’s mental health and wellbeing on others studying and working in the education sector
34
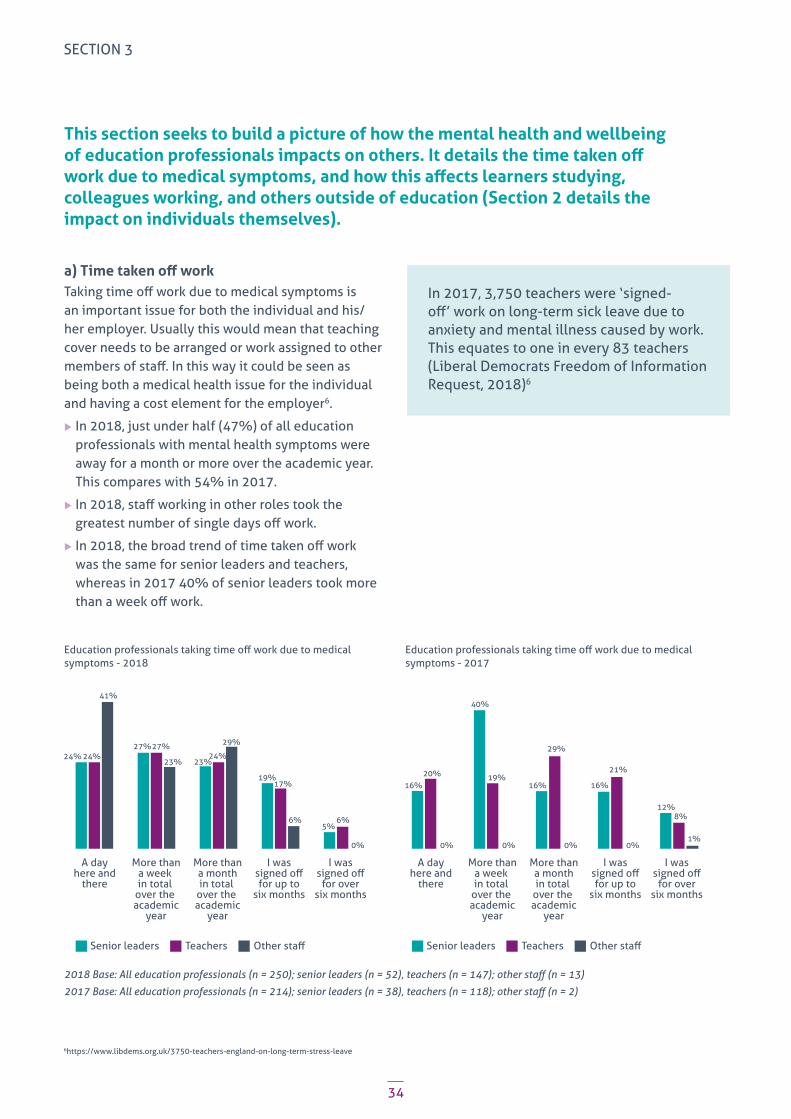
a) Time taken off workTaking time off work due to medical symptoms is an important issue for both the individual and his/her employer. Usually this would mean that teaching cover needs to be arranged or work assigned to other members of staff. In this way it could be seen as being both a medical health issue for the individual and having a cost element for the employer6.
u In 2018, just under half (47%) of all education professionals with mental health symptoms were away for a month or more over the academic year. This compares with 54% in 2017.
u In 2018, staff working in other roles took the greatest number of single days off work.
u In 2018, the broad trend of time taken off work was the same for senior leaders and teachers, whereas in 2017 40% of senior leaders took more than a week off work.
This section seeks to build a picture of how the mental health and wellbeing of education professionals impacts on others. It details the time taken off work due to medical symptoms, and how this affects learners studying, colleagues working, and others outside of education (Section 2 details the impact on individuals themselves).
2018 Base: All education professionals (n = 250); senior leaders (n = 52), teachers (n = 147); other staff (n = 13)
2017 Base: All education professionals (n = 214); senior leaders (n = 38), teachers (n = 118); other staff (n = 2)
In 2017, 3,750 teachers were ‘signed-off’ work on long-term sick leave due to anxiety and mental illness caused by work. This equates to one in every 83 teachers (Liberal Democrats Freedom of Information Request, 2018)6
6https://www.libdems.org.uk/3750-teachers-england-on-long-term-stress-leave
Education professionals taking time off work due to medical symptoms - 2017
Education professionals taking time off work due to medical symptoms - 2018
A dayhere and
there
24%
6% 6%
0%
5%
19%17%
24%27% 29%27%
23% 23%
41%
24%
More thana week in total
over the academic
year
More thana monthin total
over the academic
year
Senior leaders Teachers
A dayhere and
there
16%
12%8%
16% 16%
1%0% 0% 0% 0%
40%
29%
20% 21%19%
More thana week in total
over the academic
year
More thana monthin total
over the academic
year
Senior leaders Teachers
SECTION 3

35
b) Impact on students u In 2018, the impact on students of education professionals taking time off work due to mental health symptoms was 36% negatively on students’ studies, 15% negatively on their results and 9% negatively on education professionals own mental health. No impact was judged by 41%. The picture was similar for 2018 and 2017. However, differences were found in perception by job role:
– Senior leaders and teachers were more likely to consider such absence would have a negative effect on students’ studies (both 40%) than colleagues working in other roles, and also their results (19% of senior leaders compared to 15% of teachers).
– In 2018, teachers working in the school sector were more likely to report that taking time off due to mental health symptoms had a negative effect on their students’ studies (40%) compared to staff working in the Further/Adult/Voluntary sector (30%).
– Staff working 60+ hours per week were more likely to answer that it would impact students’ studies and results.
2018 Base: All education professionals (n = 885)
2017 Base: All education professionals (n = 757)
Note: only sources with more than 2% of the responses are shown (ie education professionals were given the opportunity to say it could have had a positive impact, but these were all 2% or less)
The impact on students of edutcation professionals taking time off due to mental health symptoms - 2018 by job role
The impact on students of education professionals taking time off due to mental health symptoms
No impact
0%
37%
9% 10% 10%
19%16%
7%
40% 40%
62%
36%
Negativeimpacton theirstudies
Negativeimpacton theirresults
Negativeimpacton their
own mentalhealth
Senior leaders Teachers
SECTION 3

36
c) Impact on colleaguesThe 2018 survey recognised that education professionals, particularly senior leaders and teachers who have to provide cover, usually work in teams, and so taking time off work would have an impact on their colleagues too.
u As with the impact on students above, taking time off work for mental health issues was generally seen to have either no impact, or a negative impact on others – a similar picture for both 2018 and 2017.
u A third of education professionals (35%) thought there would be no impact, whereas 29% thought there would be a negative impact on working relationships, 15% on team morale and 11% on their own performance.
u Senior leaders and teachers were more likely to think that it would have a negative impact on working relationships (35% and 30% respectively) compared to staff working in other roles (20%).
2018 Base: All education professionals (n = 885)
The impact on colleagues of education professionals taking time off work due to mental health symptoms - 2018
No impact Negativeimpact on
our workingrelationship(s)
Positiveimpact on
our workingrelationship(s)
Negativeimpact onour teammorale
Positiveimpact onour teammorale
Negativeimpact on
our their ownperformance
Positiveimpact on
our their ownperformance
29%
2% 1% 1%2%0% 0% 0% 0% 0%
35%37%
35%33% 32%
31%30%
20%
13%10% 11%
Senior leaders Teachers
SECTION 3
37
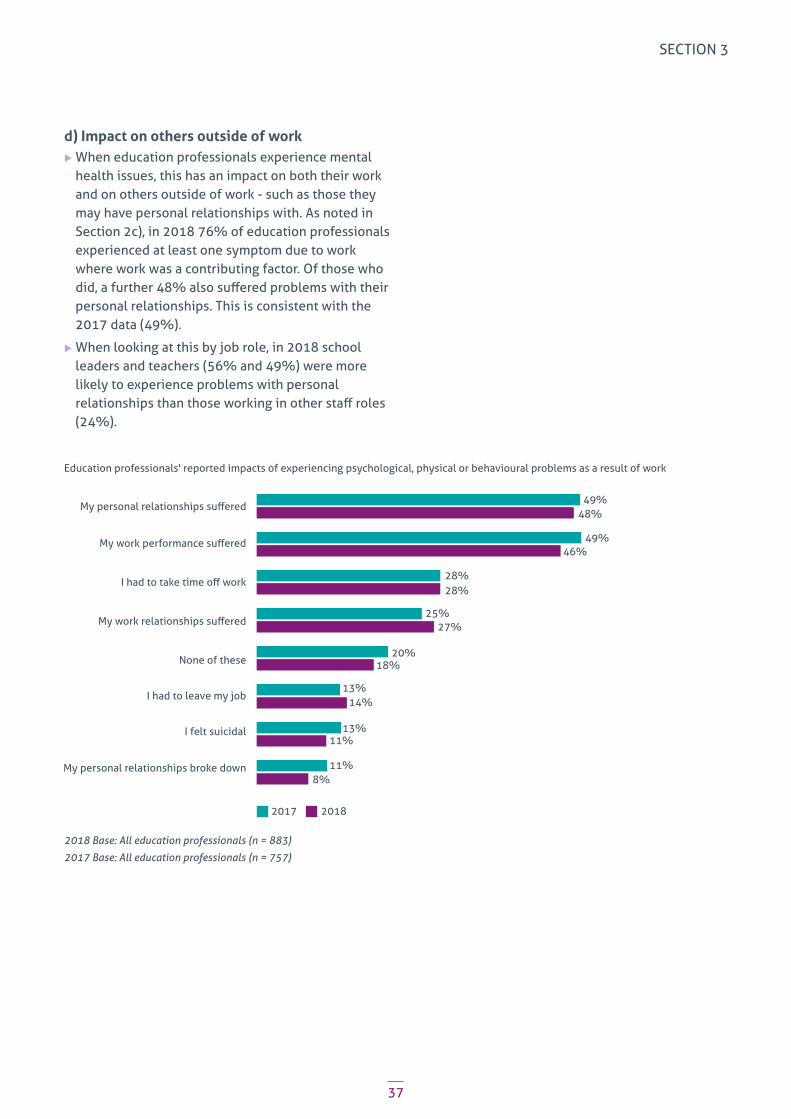
d) Impact on others outside of work u When education professionals experience mental health issues, this has an impact on both their work and on others outside of work - such as those they may have personal relationships with. As noted in Section 2c), in 2018 76% of education professionals experienced at least one symptom due to work where work was a contributing factor. Of those who did, a further 48% also suffered problems with their personal relationships. This is consistent with the 2017 data (49%).
u When looking at this by job role, in 2018 school leaders and teachers (56% and 49%) were more likely to experience problems with personal relationships than those working in other staff roles (24%).
2018 Base: All education professionals (n = 883)
2017 Base: All education professionals (n = 757)
Education professionals' reported impacts of experiencing psychological, physical or behavioural problems as a result of work
2017 2018
None of these
I had to leave my job
I felt suicidal
My personal relationships broke down
49%
8%
11%
11%
13%
13%
14%
20%18%
28%28%
27%25%
49%
48%
46%
SECTION 3

38
2018 Base: All education professionals (n = 873); senior leaders (n = 196), teachers (n = 507); other staff (n = 53)
In the period April 2017 to March 2018 Education Support Partnership had 357 callers to its helpline identified as being at risk of suicide. Between April to August 2018 there have been 163 callers so far.
u School leaders and teachers (49% and 48%) were also more likely to feel that their work performance suffered than those working in other roles (28%).
u Staff working more than 41 hours per week were more likely to suffer with their personal relationships than those working 40 hours per week or less.
u A more serious impact is that one sixth, or 16%, of senior leaders who experienced psychological, physical or behavioural problems as a result of work reported they felt suicidal in 2018, compared with 10% in 2017, or felt they had to leave their job in 2018 (13%), compared to 6% in 2017.
Education professionals' reported impacts of experiencing psychological, physical or behavioural problems as a result of work - 2018 by job role
The next section will explore the mental health and wellbeing guidance available to staff working in the education sector.
Others Teachers Senior leaders
None of these
I had to leave my job
I felt suicidal
My personal relationships broke down
24%
12%8%
7%
11%
13%
13%
30%18%
16%
16%
10%1%
24%
28%
29%
27%
26%
26%
25%
49%
49%48%
56%
SECTION 3
39
Section 4: The mental health and wellbeing guidance available to staff working in the education sector

40
a) Who education professionals would speak to first at work about mental health issues
u In 2018, a third of education professionals (32%) would turn to somebody outside of work first if they experienced mental health issues. Thereafter they would speak to a colleague (25%) or their line manager (12%). However, a quarter (26%) of respondents would not speak to anybody about it.
u Teachers (25%) were found to be more likely to turn colleagues for advice than those in other roles (17%), whereas those in other roles were more likely to turn to HR/central office for advice (7% compared to 1% of teachers).
u The main reasons given in 2018 by those education professionals who said they would not speak to anyone at work were that they felt they would see it as a sign of weakness (36%), they would not be supportive (24%), or that they preferred to seek support from people outside of work (23%).
u Senior leaders were more concerned than teachers or staff working in other roles that by speaking to someone else it would be negatively affect their perception of him/her.
This section focuses on what support education professionals who have experienced mental health issues accessed and their perceptions of the wider support on offer. Areas covered are who they talk to first about any issues, how confident they feel in sharing their concerns at work, the guidance/help which is available, if the use made by staff is monitored, what is wanted and if this is affected by their perception of available education budgets.
2018 Base: All education professionals (n = 885)
2017 Base: All education professionals (n = 757)
2018 Base: All education professionals (n = 48)
2017 Base: All education professionals (n = 49)
Who education professionals who experienced mental health issues at work spoke to first
Education professionals who said they did not speak to anyone at work - why that was
2017 2018
I did not speakto anybody about it
Somebody outsideof work
Colleague
Line manager
Other
36%
3%3%
12%8%
25%
26%
27%
24%
32%
SECTION 4
2017 2018
They wouldn’tbe supportive
Other
No one talks about theirproblems at work
I prefer to seek support frompeople outside of work
Don’t know
I would be worried about losing my job
19%
12%11%
13%
15%
17%
17%
17%17%
19%
30%
36%36%
23%
23%
24%
They would see it asa sign of weakness

41
b) Confidence in sharing mental health issues at work u Overall, 65% of education professionals were not confident in disclosing unmanageable stress or mental health problems to their employer – these findings were consistent across 2018 and 2017.
u In Education Support Partnership’s Health Survey 2017, it was noted that this lack of confidence in being able to disclose issues was higher in the education sector than for the workforce as a whole (CIPD, 2017)7.
u For those who did share their mental issues (either at work or out of work) the largest benefit felt was to give the person a perspective and help them realise they were not alone (48%). However, a decrease of 6% in this benefit has been noted from 2017 (54%).
u The second highest benefit was the restoration of confidence in their abilities (30%), which showed no change from 20177.
2018 Base: All education professionals (n = 1,187)
2017 Base: All education professionals (n = 987)
2018 Base: All education professionals (n = 657)
2017 Base: All education professionals (n = 572)
How confident education professionals were in disclosing unmanageable stress or mental health to their employer
Education professionals who spoke to someone at work or outside work and how this helped
7CIPD (2017). Employee Outlook, Spring 2017, Page 21
https://www.cipd.co.uk/knowledge/fundamentals/relations/engagement/employee-outlook-reports
SECTION 4
30%30%
25%
2017 2018
I gained permissionto seek help/it
removed the stigma
It equipped me withpractical advice
It enabled me toseek professional
support
I don’t thinkit helped
54%
48%
22%
17%
19%
13%
11%
11%
9%
It gave me perspective and
helped me realise I am not alone
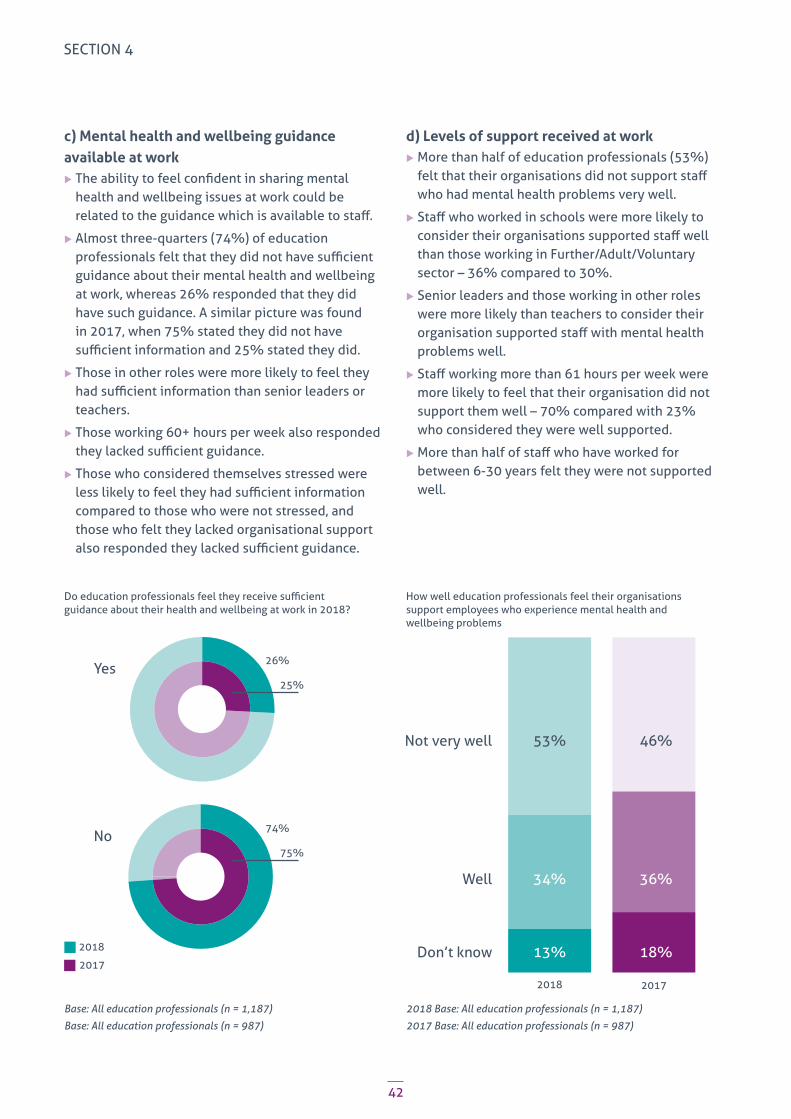
42
c) Mental health and wellbeing guidance available at work
u The ability to feel confident in sharing mental health and wellbeing issues at work could be related to the guidance which is available to staff.
u Almost three-quarters (74%) of education professionals felt that they did not have sufficient guidance about their mental health and wellbeing at work, whereas 26% responded that they did have such guidance. A similar picture was found in 2017, when 75% stated they did not have sufficient information and 25% stated they did.
u Those in other roles were more likely to feel they had sufficient information than senior leaders or teachers.
u Those working 60+ hours per week also responded they lacked sufficient guidance.
u Those who considered themselves stressed were less likely to feel they had sufficient information compared to those who were not stressed, and those who felt they lacked organisational support also responded they lacked sufficient guidance.
d) Levels of support received at work u More than half of education professionals (53%) felt that their organisations did not support staff who had mental health problems very well.
u Staff who worked in schools were more likely to consider their organisations supported staff well than those working in Further/Adult/Voluntary sector – 36% compared to 30%.
u Senior leaders and those working in other roles were more likely than teachers to consider their organisation supported staff with mental health problems well.
u Staff working more than 61 hours per week were more likely to feel that their organisation did not support them well – 70% compared with 23% who considered they were well supported.
u More than half of staff who have worked for between 6-30 years felt they were not supported well.
Base: All education professionals (n = 1,187)
Base: All education professionals (n = 987)
2018 Base: All education professionals (n = 1,187)
2017 Base: All education professionals (n = 987)
Do education professionals feel they receive sufficient guidance about their health and wellbeing at work in 2018?
How well education professionals feel their organisations support employees who experience mental health and wellbeing problems
2018 2017
Don’t know
Well
Not very well
13%
34%
53%
18%
36%
46%
SECTION 4
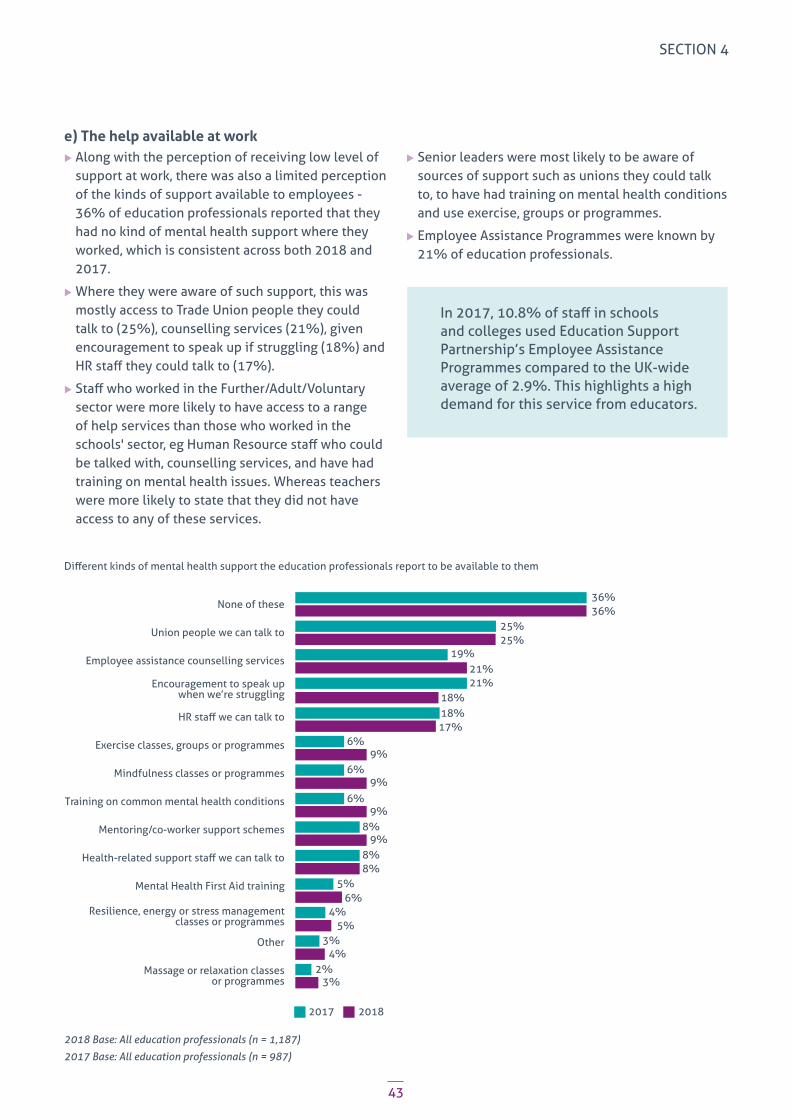
43
e) The help available at work u Along with the perception of receiving low level of support at work, there was also a limited perception of the kinds of support available to employees - 36% of education professionals reported that they had no kind of mental health support where they worked, which is consistent across both 2018 and 2017.
u Where they were aware of such support, this was mostly access to Trade Union people they could talk to (25%), counselling services (21%), given encouragement to speak up if struggling (18%) and HR staff they could talk to (17%).
u Staff who worked in the Further/Adult/Voluntary sector were more likely to have access to a range of help services than those who worked in the schools' sector, eg Human Resource staff who could be talked with, counselling services, and have had training on mental health issues. Whereas teachers were more likely to state that they did not have access to any of these services.
u Senior leaders were most likely to be aware of sources of support such as unions they could talk to, to have had training on mental health conditions and use exercise, groups or programmes.
u Employee Assistance Programmes were known by 21% of education professionals.
2018 Base: All education professionals (n = 1,187)
2017 Base: All education professionals (n = 987)
In 2017, 10.8% of staff in schools and colleges used Education Support Partnership’s Employee Assistance Programmes compared to the UK-wide average of 2.9%. This highlights a high demand for this service from educators.
Different kinds of mental health support the education professionals report to be available to them
SECTION 4
2017 2018
None of these
Union people we can talk to
Employee assistance counselling services
Encouragement to speak upwhen we’re struggling
Exercise classes, groups or programmes
Mindfulness classes or programmes
Training on common mental health conditions
Mentoring/co-worker support schemes
Mental Health First Aid training
Resilience, energy or stress managementclasses or programmes
Other
Massage or relaxation classesor programmes
36%
6%9%
6%9%
6%9%
8%
8%8%
5%
5%4%
3%
3%2%
4%
6%
9%
21%21%
19%
18%18%17%
36%25%25%

44
f) The help employees want at work u Education professionals were asked, in an open question, what types of mental health support was actually wanted. The 767 open responses were analysed, which contained 875 suggestions and 29 discreet categories.
u The six top ways were found to be having a reduction in workload/allowing staff to take breaks (15%), Senior Leadership Team (SLT) having open/clear communications with its staff (12%), having a pay rise/reduction in working hours (8%), having a trained counsellor, psychotherapist or independent staff member to talk to (7%), SLT offering respect/trust/understanding to its employees (6%), offering more resources/funding (6%).
2018 Base: All education professionals (n = 767)
Note: Only sources with more than 4% of the responses have been shown
The support which would most improve/enhance employee wellbeing
SECTION 4
Pay raise/reductionin working hours
More resources/funding
Reduction in bureaucracy/data gathering/administrative task reduction
Flexible working practices
Student behaviour improvement
15%
12%
8%
7%
6%
6%
4%
4%
4%
4%

45
g) How educational institutions could improve the mental health and wellbeing of their workforceWhen asked how the mental health and wellbeing of the workforce could be improved, the issue of high workload was again highlighted by more than half of education professionals (53%), which was consistent with the 2017 findings (54%). The other main areas in 2018 were that they suggested better communication with their managers regarding change (35%), the leadership team to be more approachable (29%) and to have a well-implemented pupil/student behaviour policy (29%).
2018 Base: All education professionals (n = 1,187)
Note: Only sources with 21%+ of the responses have been shown
How educational institutions could improve the mental health and wellbeing of their workforce
SECTION 4
2017 2018
My employer having a well-implementedpupil/student behaviour policy
The leadership team beingmore approachable
54%
31%
32%
29%
30%
29%
27%
25%
25%
24%
19%21%
21%
26%
28%
29%
35%
53%
My employer making us more aware of the support available (e.g. Employee
Assistance Programme)
Colleagues being more understanding and accommodating of each other's
needs and feelings
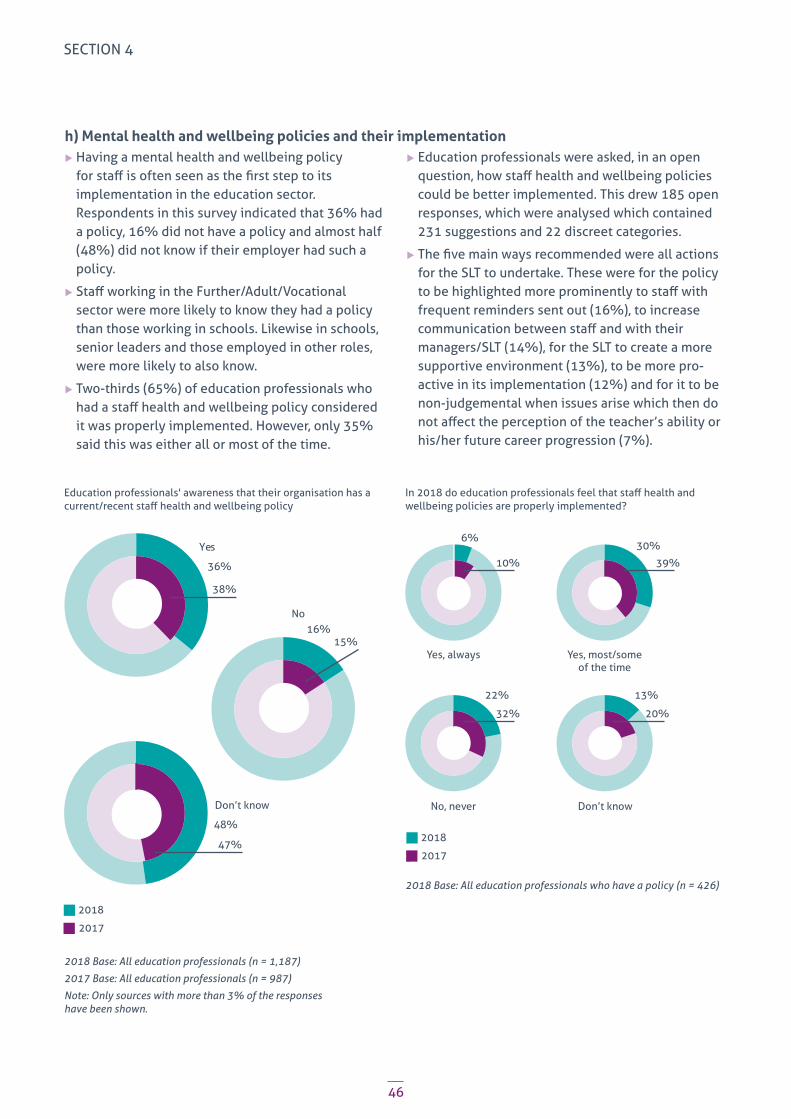
46
h) Mental health and wellbeing policies and their implementation u Having a mental health and wellbeing policy for staff is often seen as the first step to its implementation in the education sector. Respondents in this survey indicated that 36% had a policy, 16% did not have a policy and almost half (48%) did not know if their employer had such a policy.
u Staff working in the Further/Adult/Vocational sector were more likely to know they had a policy than those working in schools. Likewise in schools, senior leaders and those employed in other roles, were more likely to also know.
u Two-thirds (65%) of education professionals who had a staff health and wellbeing policy considered it was properly implemented. However, only 35% said this was either all or most of the time.
u Education professionals were asked, in an open question, how staff health and wellbeing policies could be better implemented. This drew 185 open responses, which were analysed which contained 231 suggestions and 22 discreet categories.
u The five main ways recommended were all actions for the SLT to undertake. These were for the policy to be highlighted more prominently to staff with frequent reminders sent out (16%), to increase communication between staff and with their managers/SLT (14%), for the SLT to create a more supportive environment (13%), to be more pro-active in its implementation (12%) and for it to be non-judgemental when issues arise which then do not affect the perception of the teacher’s ability or his/her future career progression (7%).
2018 Base: All education professionals (n = 1,187)
2017 Base: All education professionals (n = 987)
Note: Only sources with more than 3% of the responses have been shown.
2018 Base: All education professionals who have a policy (n = 426)
In 2018 do education professionals feel that staff health and wellbeing policies are properly implemented?
Education professionals' awareness that their organisation has a current/recent staff health and wellbeing policy
SECTION 4
6%
2018
2017
Yes, always Yes, most/someof the time
No, never Don’t know
10%
22%
32%
13%
20%
30%
39%
2018
2017
36%
38%
48%
47%
16%15%
Yes
No
Don’t know
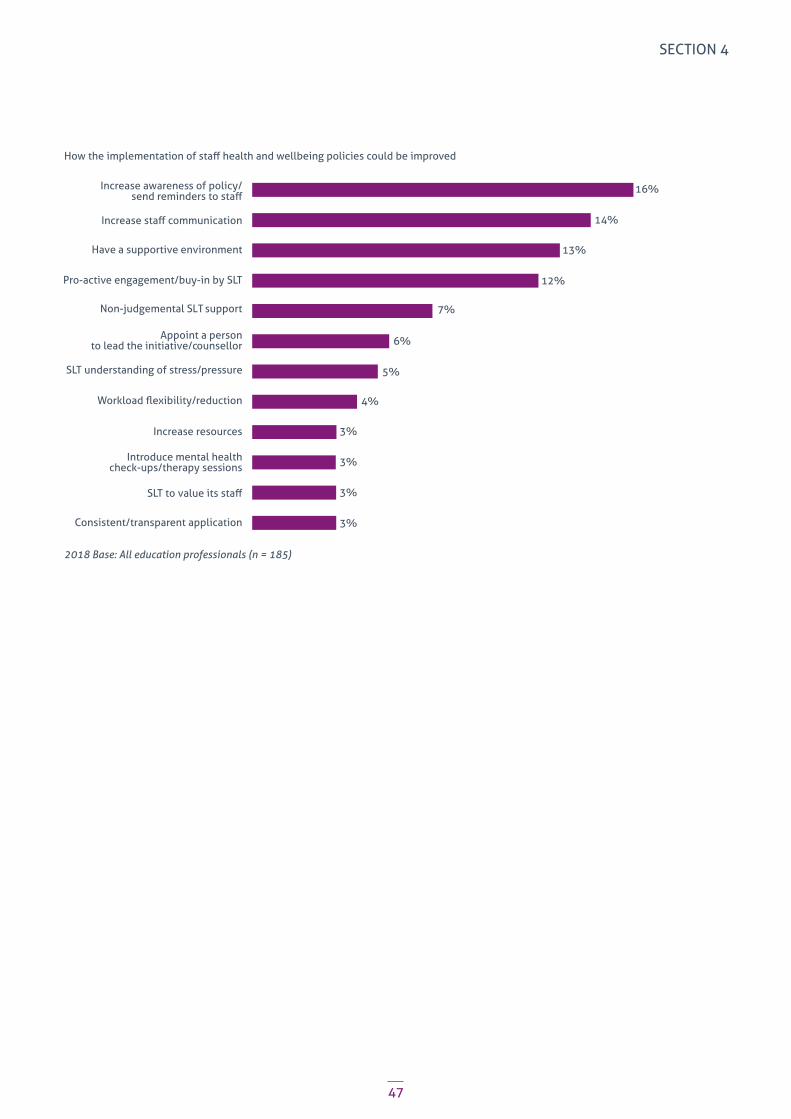
47
2018 Base: All education professionals (n = 185)
How the implementation of staff health and wellbeing policies could be improved
SECTION 4
Have a supportive environment
Pro-active engagement/buy-in by SLT
Non-judgemental SLT support
Appoint a personto lead the initiative/counsellor
SLT understanding of stress/pressure
Increase resources
Consistent/transparent application
Introduce mental healthcheck-ups/therapy sessions
16%
5%
4%
3%
3%
3%
3%
12%
7%
6%
14%
13%

48
i) How educational institutions monitor their staff mental health and wellbeing
u Only one quarter (24%) of education professionals responded that their education institutions regularly survey their staff to establish levels of employee wellbeing, with 64% saying that they did not and 12% did not know.
u Comparable data is unavailable for 2017.
j) The perceived financial resources available to help staff mental health and wellbeingMany schools and colleges were operating in a context of restricted budgets. This was noted in answers to many of the open response questions. When asked if education institutions had the budgets/resources which could be used for staff wellbeing, the picture is unclear – 48% said they did not know, 16% said there were resources available and 36% that there were no financial resources for this.
2018 Base: All education professionals (n = 1,187) 2018 Base: All education professionals (n = 1,187)
Education institutions having budgets/resources which could be used for staff wellbeing
Education professionals' perception of whether their institution regularly surveys staff to establish levels of employee wellbeing
Yes
Don’t know
No
64%
24%
12%
Yes
Don’t know
No
48%
16%
36%
SECTION 4

49
Conclusions and recommendations

50
Three key issues which have been highlighted multiple times across this Index:
a) High Workload By far this is the one factor which education professionals dislike about working in education, and its reduction is the main issue which would most improve/enhance employee wellbeing.
b) High levels of stress More than two-thirds (67%) of education professionals describe themselves as stressed.
c) The need for a better work/life balance More than half of education professionals (58%) typically work more than their contracted hours and experience difficulty with achieving a good work versus out-of-work balance.
This Index has generated a great deal of data to tell the story of the mental health and wellbeing of education professionals working primarily in schools and colleges in 2018. It has built on the findings of our “Health Survey 2017” which was published last year and will act as a benchmark to analyse findings in the educational sector over time.
Although many education professionals are broadly satisfied and happy with their lives, a worrying 76% have disclosed they have experienced a range of symptoms where work was a contributing factor (75% in 2017). Rising levels of insomnia and irritability/mood swings over the last year are the most common features.
These three factors, often interlinked, contribute towards mental health symptoms experienced by those working in the education sector and need to be urgently addressed if we are to retain our education professionals especially when we have discovered that more than half (57%) have considered leaving the profession in the last two years.
Conclusions
CONCLUSIONS & RECOMMENDATIONS

51
1 Mandatory provision of personal mental health and wellbeing guidance within Initial Teacher Training
2 Regulators to prioritise staff wellbeing in their assessments and measure this against an evidence-based framework
3 Annual staff surveys to become statutory in all schools and colleges; with senior leaders acting on the issues identified in an open and transparent way
4 Increased awareness, knowledge and signposting to external support services
5 Access to an externally provided Employee Assistance Programme for all staff in schools and colleges
6 Access to facilitated peer support programmes for all leaders in schools and colleges
This report has been written by Dr Carol Savill-Smith.
We would like to thank colleagues at the Education Support Partnership for all their help and assistance with this report. Particular thanks also goes to Elaine Odlin for the design of this report.
And finally, we would like to thank Ian Neale, Laura Piggott and Jane Rowe at YouGov for their helpful input with the survey design and data collection.
Recommendations
Acknowledgements
CONCLUSIONS & RECOMMENDATIONS
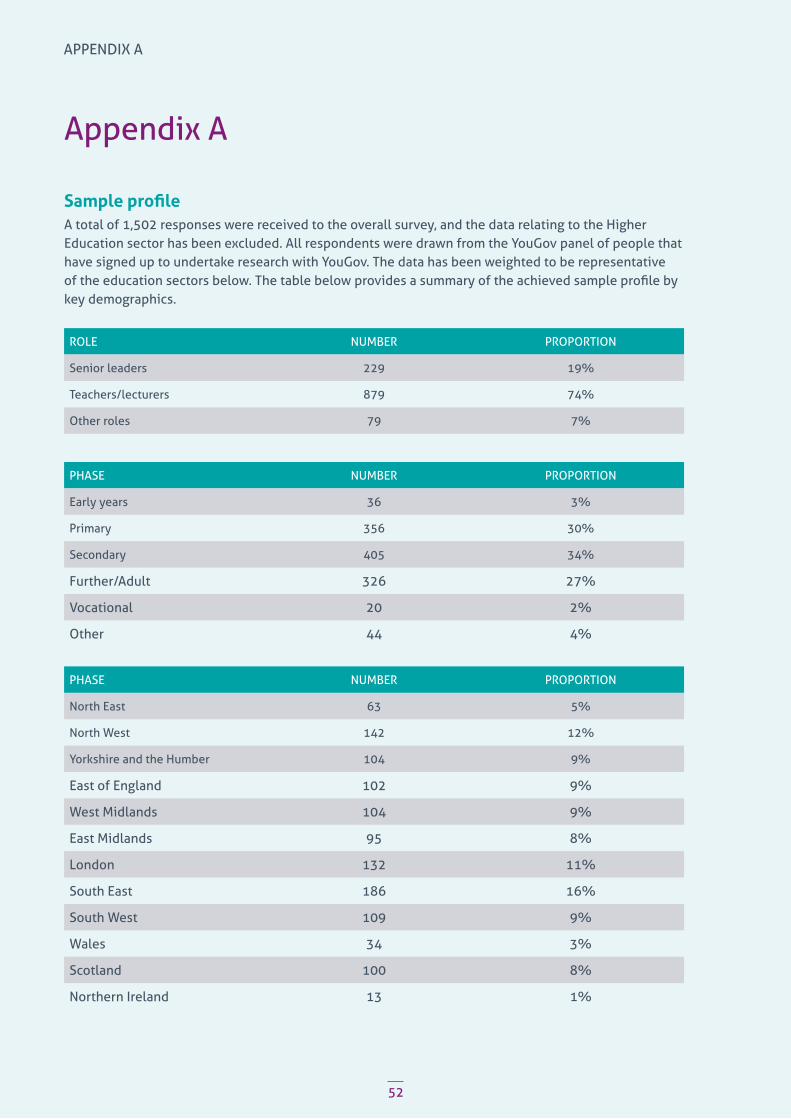
Appendix A
Sample profileA total of 1,502 responses were received to the overall survey, and the data relating to the Higher Education sector has been excluded. All respondents were drawn from the YouGov panel of people that have signed up to undertake research with YouGov. The data has been weighted to be representative of the education sectors below. The table below provides a summary of the achieved sample profile by key demographics.
ROLE NUMBER PROPORTION
Senior leaders 229 19%
Teachers/lecturers 879 74%
Other roles 79 7%
PHASE NUMBER PROPORTION
Early years 36 3%
Primary 356 30%
Secondary 405 34%
Further/Adult 326 27%
Vocational 20 2%
Other 44 4%
PHASE NUMBER PROPORTION
North East 63 5%
North West 142 12%
Yorkshire and the Humber 104 9%
East of England 102 9%
West Midlands 104 9%
East Midlands 95 8%
London 132 11%
South East 186 16%
South West 109 9%
Wales 34 3%
Scotland 100 8%
Northern Ireland 13 1%
APPENDIX A
52
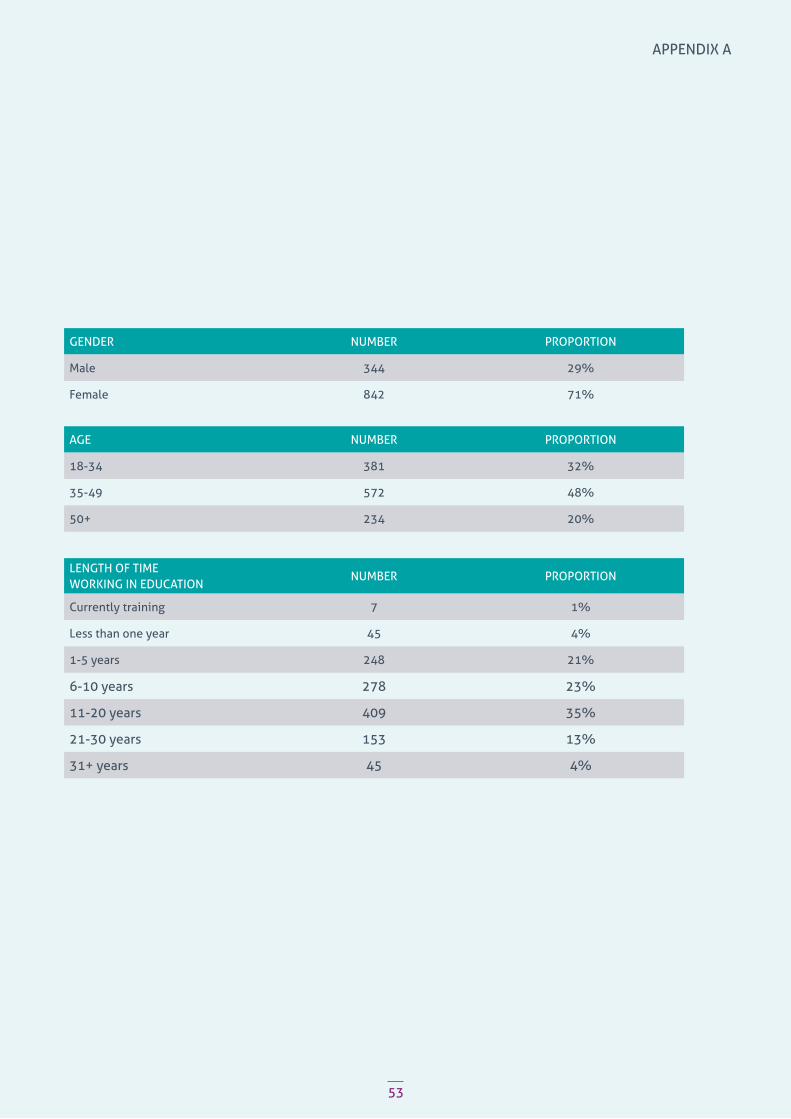
53
GENDER NUMBER PROPORTION
Male 344 29%
Female 842 71%
AGE NUMBER PROPORTION
18-34 381 32%
35-49 572 48%
50+ 234 20%
LENGTH OF TIME WORKING IN EDUCATION
NUMBER PROPORTION
Currently training 7 1%
Less than one year 45 4%
1-5 years 248 21%
6-10 years 278 23%
11-20 years 409 35%
21-30 years 153 13%
31+ years 45 4%
APPENDIX A

54
Appendix B
Sample comments made by education professionals which illustrate what they love and dislike about working in education.
What they love
Early Years (n = 41)
“I love seeing the 'light bulb' moment when a child gets it! I love seeing them grow and their characters developing” (Ref 396)
“Watching children grow and develop during their time with me. Relationships with children. Generally, love the company of children - they are amazing!” (Ref 456)
“The children grasping what they previously couldn’t understand. Seeing the pride in their achievements, helping those children reach out and learn, trust and understand” (Ref 527)
“Working with children helping them to be the best they can and inspiring and motivating them to learn” (Ref 931)
“Each day is something different. You're inspiring the future generation. You provide support and attention and love to children who don't have that at home. I'm passionate about learning. I love working with children. A very rewarding and satisfying job” (Ref 1310)
Primary sector (n = 436)
“Seeing the children begin to cope with all the things that are thrown at them and develop emotional language” (Ref 44)
“Being able to support children with their learning and personal development. Supporting families. Being able to have a creative flair. Having the opportunity to implement any good ideas I have” (Ref 126)
“Working with children and helping them to develop socially and academically. Inspiring a love of learning about the world around them” (Ref 257)
“Interacting with the children, seeing them taking steps forward, knowing I am helping them and feel I am making a difference” (Ref 540)
“Every day something will makes me smile and laugh. No two days are the same, or predictable. Seeing pupils gaining confidence and trust in you. Nice to work with like-minded adults, everyone working as a team to achieve same end” (Ref 607)
“Seeing a child progress and develop throughout the year... seeing them take those first steps and learn the lessons they need for life” (Ref 794)
“Seeing children sparkle and improve, gaining in confidence and succeeding. Great workplace environment, lots of fun and fabulous people to work with. Exceptionally supportive Head Teacher” (Ref 965)
APPENDIX B

55
Secondary sector (n = 463)
“Working to help students reach their potential and achieve their goals. Helping students with their mental health and wellbeing. It's rewarding and there's huge job satisfaction” (Ref 9)
“I love working with vulnerable young people and helping them to feel safe, valued and seen at school. I love sharing my knowledge and enthusiasm with my students. I love the culture of support and team work amongst rank and file teachers” (Ref 96)
“Working with young people and being a part of their development into adulthood” (Ref 99)
“I love seeing pupils develop, working with other staff to work out how best to support pupils through their anxieties and seeing the pupils achieve things they thought they wouldn't” (Ref 298)
“Teaching my subject; training other teachers; sharing good practice; learning and trying out new teaching strategies” (Ref 639)
“Very rewarding working with young people with mental health and behavioural needs, forming trust and rapport with them and seeing them develop and make positive changes in their lives” (Ref 713)
“Every day is different. It's never boring. I love that I'm still learning new things myself and I get to teach about a subject I love. I also love being a form tutor” (Ref 935)
“I find it so rewarding to be teaching the next generation and developing their minds ready for the big wide world. I love the appreciation I get from my students, and colleagues for the work that I do. It’s a very, very rewarding job” (Ref 1029)
Further/Adult/Vocational sector (n = 136)
“The achievements of my learners. I believe in them and help them to believe in themselves” (Ref 23)
“Changing the lives, prospects and opportunities of learners” (Ref 118)
“Seeing learners improve in skills and confidence. Being part of a learners journey” (Ref 323 – is the only vocational quote)
“Making a difference to young peoples’ lives. Creating opportunities for them to succeed and develop their skills and knowledge to meet employers’ needs. Real life skills. Supporting and motivating them to succeed, empowerment” (Ref 428)
“Working with the young people. Going the extra mile and seeing the difference it can make to the life of a young person and their family” (Ref 532)
“Dealing with the students, watching them succeed and overcome their barriers and limitations. The sense of satisfaction on the completion of a course, and when a student gains employment as a result” (Ref 545)
“Working with students to achieve their potential and seeing their progression into university and apprenticeships” (Ref 934)
APPENDIX B
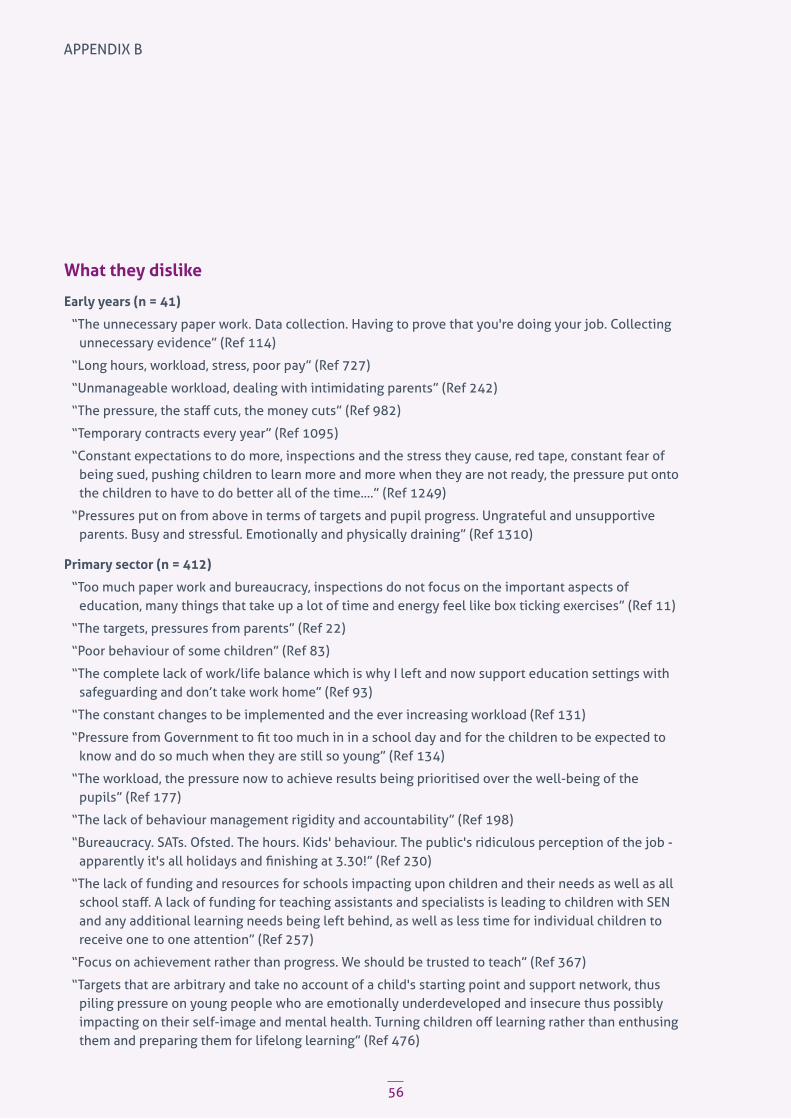
56
What they dislike
Early years (n = 41)
“The unnecessary paper work. Data collection. Having to prove that you're doing your job. Collecting unnecessary evidence” (Ref 114)
“Long hours, workload, stress, poor pay” (Ref 727)
“Unmanageable workload, dealing with intimidating parents” (Ref 242)
“The pressure, the staff cuts, the money cuts” (Ref 982)
“Temporary contracts every year” (Ref 1095)
“Constant expectations to do more, inspections and the stress they cause, red tape, constant fear of being sued, pushing children to learn more and more when they are not ready, the pressure put onto the children to have to do better all of the time....” (Ref 1249)
“Pressures put on from above in terms of targets and pupil progress. Ungrateful and unsupportive parents. Busy and stressful. Emotionally and physically draining” (Ref 1310)
Primary sector (n = 412)
“Too much paper work and bureaucracy, inspections do not focus on the important aspects of education, many things that take up a lot of time and energy feel like box ticking exercises” (Ref 11)
“The targets, pressures from parents” (Ref 22)
“Poor behaviour of some children” (Ref 83)
“The complete lack of work/life balance which is why I left and now support education settings with safeguarding and don’t take work home” (Ref 93)
“The constant changes to be implemented and the ever increasing workload (Ref 131)
“Pressure from Government to fit too much in in a school day and for the children to be expected to know and do so much when they are still so young” (Ref 134)
“The workload, the pressure now to achieve results being prioritised over the well-being of the pupils” (Ref 177)
“The lack of behaviour management rigidity and accountability” (Ref 198)
“Bureaucracy. SATs. Ofsted. The hours. Kids' behaviour. The public's ridiculous perception of the job - apparently it's all holidays and finishing at 3.30!” (Ref 230)
“The lack of funding and resources for schools impacting upon children and their needs as well as all school staff. A lack of funding for teaching assistants and specialists is leading to children with SEN and any additional learning needs being left behind, as well as less time for individual children to receive one to one attention” (Ref 257)
“Focus on achievement rather than progress. We should be trusted to teach” (Ref 367)
“Targets that are arbitrary and take no account of a child's starting point and support network, thus piling pressure on young people who are emotionally underdeveloped and insecure thus possibly impacting on their self-image and mental health. Turning children off learning rather than enthusing them and preparing them for lifelong learning” (Ref 476)
APPENDIX B

57
Secondary sector (n = 456)
“Unreasonable demands placed on the education sector by the government, underpaid work, underfunded schools“ (Ref 13)
“The workload, expectations of marking, the constant assessment and 'quality assurance' of teaching, learning walks, work scrutinies, department reviews, over-long training sessions, number of meetings, the encroaching corporate mind-set on management...” (Ref 73)
“Workload, poor student behaviour, rudeness from parents, excessive demands on teachers” (Ref 75)
“High workload and stress levels, low pay, expectation to work hours unpaid” (Ref 109)
“Needless bureaucracy, too much expected by management, constant change introduced by SQA, EdScot, ScotGov, Council and line managers” (Ref 156)
“Pressure to get results, unworkable marking policies and being an exam factory” (Ref 185)
“Constant rapid changes, bureaucracy, pressure of inspections, unrealistic expectations, over-accountability, not enough prep[aration] time” (Ref 324)
“Workload, increased pressure from government, poor pay, lack of parental support caused by the media slandering my profession” (Ref 557)
“Marking. Ofsted. Marking. Unsupportive parents. Marking. Government imposed changes. Marking. New assessment requirements. Marking. Rising class sizes. Marking. Shrinking budgets. Marking” (Ref 664)
Further/Adult/Vocational sector (n = 132)
“Obsession with exams at the expense of real learning. Pressures from the management to get results at any cost” (Ref 72)
“Lack of autonomy. Not being treated as a professional. School's not listening to Ofsted about workload guidelines and still stacking on top of already huge work load” (Ref 87)
“Workload, targets, accountability, poor management, underfunding, government policy, worsening pay and conditions, lack of professional autonomy, lack of respect/recognition” (Ref 203)
“Workload; heavy responsibility; safeguarding responsibilities” (Ref 299)
“Poor pay. Constant drive to cut costs in the short term but SMT unable to see impact on staff and student experience” (Ref 532)
“It is not a 9-5 type of job. I do find that I need to work many more hours outside my 'contracted hours' in order to prepare and get ready for my lessons. Also as a lecturer we are being asked to take on more roles i.e. guidance” (Ref 1270)
“Government policy, Ofsted’s self-perpetuating pressure, lack of autonomy, needless reform, continual cuts, pay freeze, lack of career progression” (Ref 1273)
APPENDIX B

58


You can learn more about our work at edsupport.org.ukor by calling 0207 697 2750
Education Support Partnership40A Drayton ParkLondon N5 1EW
+44 (0) 20 7697 2750
Registered Charity No. 1161436
© 2018 Education Support Partnership
If we are to retain our latest generation of talented teachers, leaders and others we must work together to make their mental health and wellbeing a priority.
YouGov is an international full-service market research agency. Our core offering of opinion data is derived from our highly participative panel of 4 million people worldwide. We combine this continuous stream of data with our deep research expertise and broad industry experience into a systematic research and marketing platform. The YouGov public services team, who led this research, are experienced in delivering robust and actionable insights for clients across the education sector. Our data is trusted and the results we deliver valued by clients in the work they deliver.