Embed Size (px)
Citation preview
The Pennsylvania State University
The Graduate School
College of Education
EXAMINING THE RELATIONSHIPS BETWEEN STUDENT ACHIEVEMENT
AND TEACHER MONITORING AND EVALUATION IN LOWER SECONDARY
AND SECONDARY SCHOOLS: A MULTINATIONAL STUDY
A Dissertation in
Educational Theory and Policy
by
Gulab Khan
© 2013 Gulab Khan
Submitted in Partial Fulfillment
of the Requirements
for the Degree of
Doctor of Philosophy
December 2013
ii
The dissertation of Gulab Khan was reviewed and approved* by the following:
Mindy L. Kornhaber
Associate Professor of Education
Dissertation Co-Adviser
Co-Chair of Committee
Liang Zhang
Associate Professor of Education and Labor Studies
Dissertation Co-Adviser
Co-Chair of Committee
Hoi Suen
Distinguished Professor of Educational Psychology
Soo-yong Byun
Assistant Professor of Education
Gerald LeTendre
Professor of Education
Department Head, Education Policy Studies
*Signatures are on file in the Graduate School
iii
ABSTRACT
Teacher quality is a significant determinant of student achievement in schools. One
way through which schools endeavor to improve the quality of their teachers, and hence
student achievement, is by evaluating them, identifying their professional needs, and making
them accountable for the quality of their practice. While there is a general agreement that
teachers should be monitored and evaluated, there is variation in the approaches and purposes
of the process across schools and educational contexts. This dissertation responds to the
research question, “How do teacher monitoring and evaluation practices and purposes
associate with student achievement in mathematics, science, and reading in lower secondary
and secondary schools.” The study employs Ordinary Least Squares as it analytical approach
and uses data and information in 21 countries from the Program for International Student
Assessment (PISA) and Teaching and Learning International Survey (TALIS).
Findings show that the developmental approaches to teacher evaluation in the form of
evaluative focus in principals’ pedagogical role that include classroom observations,
suggesting teachers for improvement, and informing teachers about possibilities for updating
their knowledge and skills do not associate significantly with student achievement in all three
subjects. Schools’ use of student data for instructional improvement also does not associate
significantly with student achievement in all three subjects. Monitoring of teachers using
student achievement and principal and staff observations relate positively to student
achievement in reading. The study finds mixed results for high-stakes approaches to teacher
evaluation. Public accountability establishes a positive relationship with student achievement
in all three subjects. However, the use of student assessments for teacher evaluation and
judging teacher effectiveness do not relate significantly to student achievement in
mathematics. In reading and science, such uses of student assessments associate negatively
iv
with student achievement. The tracking of student assessments by an administrative authority
develops a negative but insignificant relationship with student achievement in mathematics
and reading, and an insignificant positive relationship in science.
The evidence in this study only confirms the complexity of teacher monitoring and
evaluation practices and purposes while exploring their potential in raising student
achievement in schools. The study suggests that the use of student assessments as an
evidence of teacher performance should be avoided especially in high-stakes approaches to
teacher evaluation. The study further suggests that the right mix of developmental and high-
stakes approaches and purposes to monitoring and evaluating teachers should be driven by
evidence obtained through rigorous research in indigenous settings.
v
Table of Contents
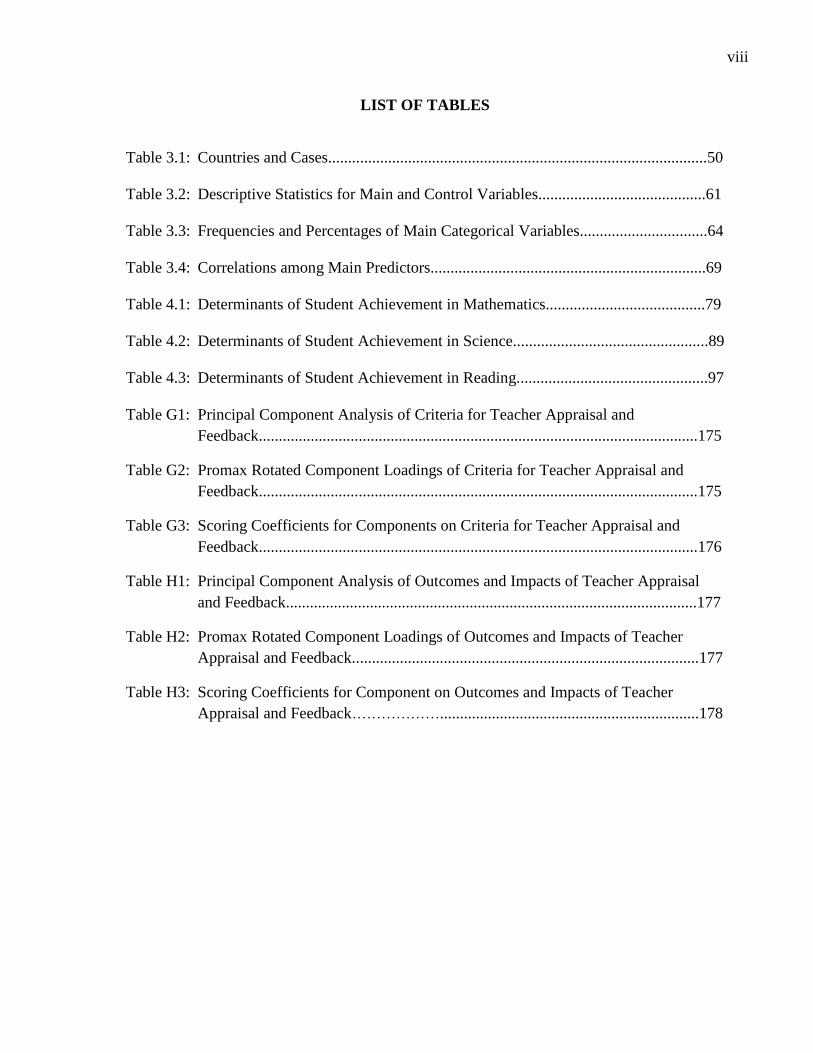
LIST OF TABLES ................................................................................................................. viii
ACKNOWLEDGEMENTS ..................................................................................................... ix
Chapter 1. INTRODUCTION ................................................................................................... 1
Statement of Purpose ............................................................................................................. 2
Significance of the Study ....................................................................................................... 4
Research Questions ................................................................................................................ 6
Teacher Evaluation: Unpacking the Constructs .................................................................... 7
Evaluation and assessment. ................................................................................................ 7
Evaluation and monitoring. ................................................................................................ 7
Evaluation and supervision. ............................................................................................... 8
Evaluation and accountability. ........................................................................................... 9
Teacher Evaluation: Purposes, Approaches, and Outcomes ............................................... 10
Instruments and Evaluators .................................................................................................. 11
Student achievement. ....................................................................................................... 11
Teacher peer reviews. ...................................................................................................... 12
Classroom observations. .................................................................................................. 12
Evaluators. ........................................................................................................................ 13
Chapter 2. LITERATURE REVIEW, CONCEPTUAL FRAMEWORK, AND
RESEARCH HYPOTHESES .................................................................................................. 15
Teacher Monitoring and Evaluation in Cross-National Perspectives .................................. 15
Teacher evaluation as covered in the OECD project 2002-04. ........................................ 16
Teacher evaluation: Findings from the PISA 2009. ......................................................... 18
Teacher evaluation: Findings from the TALIS 2008. ...................................................... 21
Teacher Evaluation: Empirical Evidence ............................................................................ 25
Developmental teacher evaluation and student achievement. ......................................... 26
High-stakes teacher evaluation and student achievement. ............................................... 34
Interactions and student achievement. ............................................................................. 40
Conceptual Framework and Research Hypotheses .............................................................. 42
Chapter 3. DATA AND METHODS ...................................................................................... 46
Datasets ................................................................................................................................ 46
vi
Sample and Sampling Strategy ............................................................................................ 48
Variables and Missing Data Management ........................................................................... 51
Developmental. ................................................................................................................ 52
High-stakes. ...................................................................................................................... 55
Interactions ....................................................................................................................... 56
Control variables at student, school, and country levels .................................................. 58
Missing data management. ............................................................................................... 59
Descriptive statistics. ....................................................................................................... 60
Data Reduction .................................................................................................................... 71
Methods ............................................................................................................................... 75
Chapter 4. RESULTS AND ANALYSES .............................................................................. 78
Determinants of Student Achievement in Mathematics ...................................................... 78
Developmental and high-stakes approaches to teacher evaluation .................................. 78
Control variables in models 2 and 3 in mathematics ....................................................... 84
Determinants of Student Achievement in Science .............................................................. 88
Developmental and high-stakes approaches to teacher evaluation .................................. 88
Control variables in models 2 and 3 in science ................................................................ 94
Determinants of Student Achievement in Reading ............................................................. 95
Developmental and high-stakes approaches to teacher evaluation .................................. 96
Control variables in models 2 and 3 in reading ............................................................. 101
Chapter 5. DISCUSSION, IMPLICATIONS, AND CONCLUSIONS ................................ 104
Developmental Approaches to Teacher Evaluation .......................................................... 106
Monitoring in test language. .......................................................................................... 106
Principals’ pedagogical role. .......................................................................................... 108
Use of student assessment for instructional improvement. ............................................ 111
High-Stakes Approaches to Teacher Evaluation ............................................................... 115
Public accountability. ..................................................................................................... 115
Use of student assessments to evaluate and judge teachers, and administrative tracking.
........................................................................................................................................ 117
Interactions ........................................................................................................................ 119
Teacher Evaluation: Country Variables ............................................................................. 121
vii
Policy Implications and Recommendations ....................................................................... 123
Limitations of the Study .................................................................................................... 128
Recommendations for Further Research ........................................................................... 130
Conclusions........................................................................................................................ 132
References ............................................................................................................................. 136
Appendix A: Teacher Evaluations in Public Schools (2002) ................................................ 151
Appendix B: How School Systems use Student Assessments .............................................. 162
Appendix C: Criteria for Teacher Appraisal and Feedback (2007-08) ................................. 163
Appendix D: Impact of Teacher Appraisal and Feedback upon Teaching (2007-08) .......... 166
Appendix E: Outcomes of Teacher Appraisal and Feedback (2007-08) ............................... 168
Appendix F: Variable Definitions and Measurements .......................................................... 170
Appendix G: Principal Component Analysis of Criteria for Teacher Appraisal and
Feedback ................................................................................................................................ 175
Appendix H: Principal Component Analysis of Outcomes and Impacts of Teacher
Appraisal and Feedback ........................................................................................................ 177
viii
LIST OF TABLES
Table 3.1: Countries and Cases...............................................................................................50
Table 3.2: Descriptive Statistics for Main and Control Variables..........................................61
Table 3.3: Frequencies and Percentages of Main Categorical Variables................................64
Table 3.4: Correlations among Main Predictors.....................................................................69
Table 4.1: Determinants of Student Achievement in Mathematics........................................79
Table 4.2: Determinants of Student Achievement in Science.................................................89
Table 4.3: Determinants of Student Achievement in Reading................................................97
Table G1: Principal Component Analysis of Criteria for Teacher Appraisal and
Feedback..............................................................................................................175
Table G2: Promax Rotated Component Loadings of Criteria for Teacher Appraisal and
Feedback..............................................................................................................175
Table G3: Scoring Coefficients for Components on Criteria for Teacher Appraisal and
Feedback..............................................................................................................176
Table H1: Principal Component Analysis of Outcomes and Impacts of Teacher Appraisal
and Feedback.......................................................................................................177
Table H2: Promax Rotated Component Loadings of Outcomes and Impacts of Teacher
Appraisal and Feedback.......................................................................................177
Table H3: Scoring Coefficients for Component on Outcomes and Impacts of Teacher
Appraisal and Feedback……………….................................................................178
ix
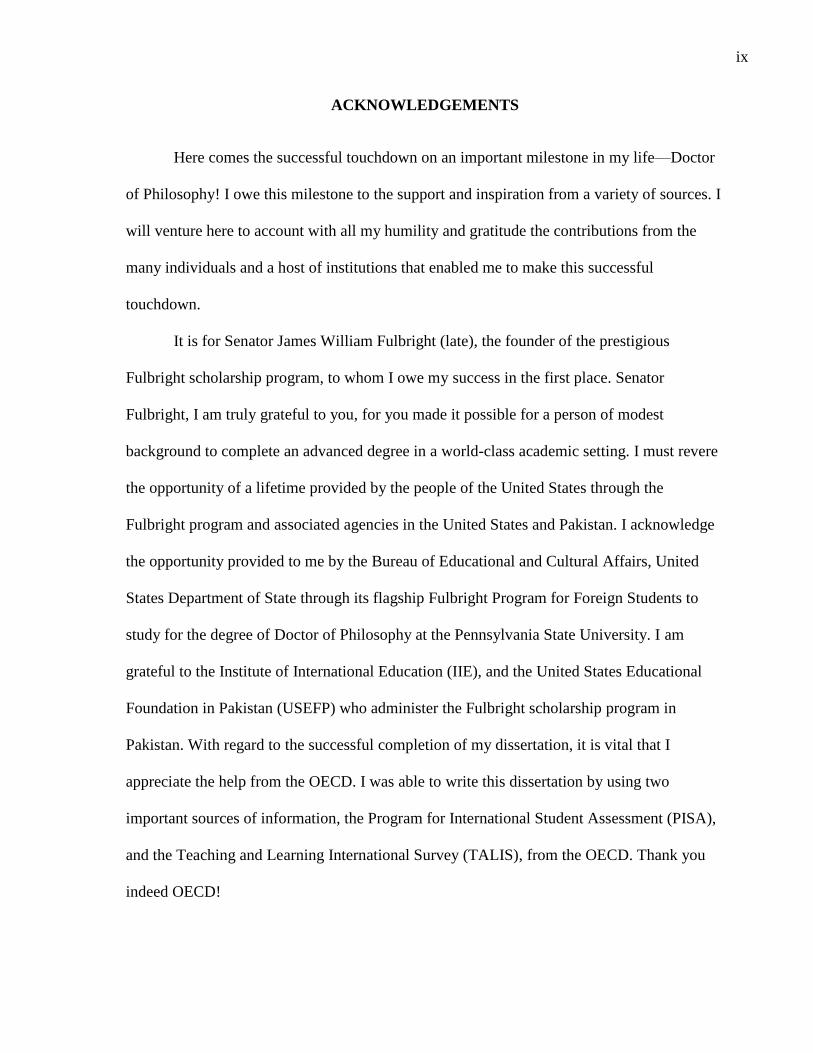
ACKNOWLEDGEMENTS
Here comes the successful touchdown on an important milestone in my life—Doctor
of Philosophy! I owe this milestone to the support and inspiration from a variety of sources. I
will venture here to account with all my humility and gratitude the contributions from the
many individuals and a host of institutions that enabled me to make this successful
touchdown.
It is for Senator James William Fulbright (late), the founder of the prestigious
Fulbright scholarship program, to whom I owe my success in the first place. Senator
Fulbright, I am truly grateful to you, for you made it possible for a person of modest
background to complete an advanced degree in a world-class academic setting. I must revere
the opportunity of a lifetime provided by the people of the United States through the
Fulbright program and associated agencies in the United States and Pakistan. I acknowledge
the opportunity provided to me by the Bureau of Educational and Cultural Affairs, United
States Department of State through its flagship Fulbright Program for Foreign Students to
study for the degree of Doctor of Philosophy at the Pennsylvania State University. I am
grateful to the Institute of International Education (IIE), and the United States Educational
Foundation in Pakistan (USEFP) who administer the Fulbright scholarship program in
Pakistan. With regard to the successful completion of my dissertation, it is vital that I
appreciate the help from the OECD. I was able to write this dissertation by using two
important sources of information, the Program for International Student Assessment (PISA),
and the Teaching and Learning International Survey (TALIS), from the OECD. Thank you
indeed OECD!

x
My candid thanks and appreciation go to the faculty and staff at the College of
Education, Pennsylvania State University for their compassionate mentoring, and academic
and administrative support throughout. My reverence and utmost gratitude go to my research
advisors and supervisors Professors Liang Zhang, and Mindy L. Kornhaber. Your caring and
professional support provided the necessary spur and guidance, thereby enabling me to
navigate in a smooth fashion all along, leading to the completion of all the requirements for
the degree of Doctor of Philosophy. Any of my future graduate student colleagues who will
have the opportunity to work with you will testify to the fact that you are some awesome
advisors at the College of Education! My gratitude and thanks to you Professors Hoi K. Suen
and Soo-yong Byun, my doctoral dissertation committee members, for your reassurances and
support in my research pursuits as related to my dissertation; critical and rigorous feedback
of yours bumped-up my research to higher levels of intellectual rigor.
My gratitude is also owed to Dr. Jan-e-Alam Khaki (my Master of Education research
supervisor at the Aga Khan University, Institute for Educational Development [AKU-IED])
who sanguinely kept pushing me to pursue further studies in a foreign setting. Thank you Dr.
Khaki for your optimism in my capacity to take on such a rigorous task in life. Thank you
also for providing the reference letters as and when needed all along in my pursuits for a
doctoral program. You were always available with your candid assessment of my abilities
through these reference letters. Speaking of reference letters, I am also grateful to Dr. John
Retallick (my ex-teacher at the AKU-IED), Ms. Khadija Khan, General Manager, AKES, P
in Gilgit-Baltistan, and Mr. Jan Madad, Ex-GM AKES, P in Gilgit-Baltistan for your time
and effort in writing and submitting reference letters in support of my applications for the
Fulbright scholarship and elsewhere. I am also indebted to the senior management at the Aga

xi
Khan Education Service, Pakistan for their approval of a study leave. I owe so much of my
professional career to the AKES, P!
My appreciation and thanks go to all my colleagues and friends here at Penn State for
your company, support, and guidance. Thank you Mehnaz Jehan for your generous support in
taking on some of the first shocks of settling during my initial days and months in State
College. Thank you Jessica Irene Ouédraogo and Cyrille Ouédraogo for your support
whenever I requested. Armend Tahirsylaj, thank you for allowing me to use some of your
computing resources. Haram Jeon, Kristina Brezicha, Pablo Fraser, Saki Ikoma, Sunny
Madahar, and Will Smith, thank you all for your critical feedback on my presentation for the
dissertation defense. Your feedback significantly contributed in making my defense meeting
a success. Thank you Adrienne Henck, Saki Ikoma, Steve Kotok, and Tian Fu for your
suggestions whenever I requested, especially in Facebook chats!
Mr. Ibrahim Shah (Ex-Mukhi Central Jamatkhana, Gilgit, Pakistan), thank you for
providing your unconditional financial guarantee, an important requirement from IIE for my
wife’s travel to and stay in the United States. In the same vein, I am truly grateful to my dear
friend Ghulam Muhammad Shah who provided financial guarantees for my wife’s travel to
and stay in the US. Thank you all my dear friends, especially Ghulam Muhammad Shah, Piar
Karim, Iqbal Barcha, Shams-ul-Haq and many others who provided moral support in times
when I felt most burdened by the challenges of my studies here at Penn State.
My dear brother Shukrullah Baig, and sisters Yasmin Bano, Nasreen Akhtar, Tahira
Parveen, Bibi Salimah, Murad Begum, Waqar-un-Nissa, Meher-un-Nissa, Razia Sultana,
Rohila Aman, and all my loving and lovable nieces and nephews and other members in the
family (all the in-laws and cousins), I love you all and thank you for your sustained support,

xii
prayers, and good wishes for my success. You all are my strength and my finest hope! I
thank you grandfather, Mustajab Shah (late), for your far-sighted vision for your family.
Although I never saw you in person, I believe your decision to migrate to Gilgit from Hunza
has been a significant contribution in what I am today. Your vision has placed me at a
position where I can play my due role in this world efficiently and effectively. I pray for your
salvation and peace. My dear mother and father, Khair-Un-Nissa and Abdullah Khan, I love
you both very much and respect and revere your prayers, the sacrifices, and the pains that
you endured all along to nurture and give comfort to your children. You are one of those
special parents who, though not literate themselves, aspire and struggle to make their
children literate and responsible citizens of this world. I will always be in need of your
prayers and good wishes to be able to live a meaningful life all along.
Even with such tremendous support from the many individuals, my extended family,
and many sources, it would have been clearly beyond my reach to achieve this important
milestone in my life had it not been for one critical source of love and care—my Bibi! I thank
you for your support, encouragement, prods, the uplifting smiles, and for being a great source
of energy and hope to keep me afloat amid the most exacting phases in my life!
xiii
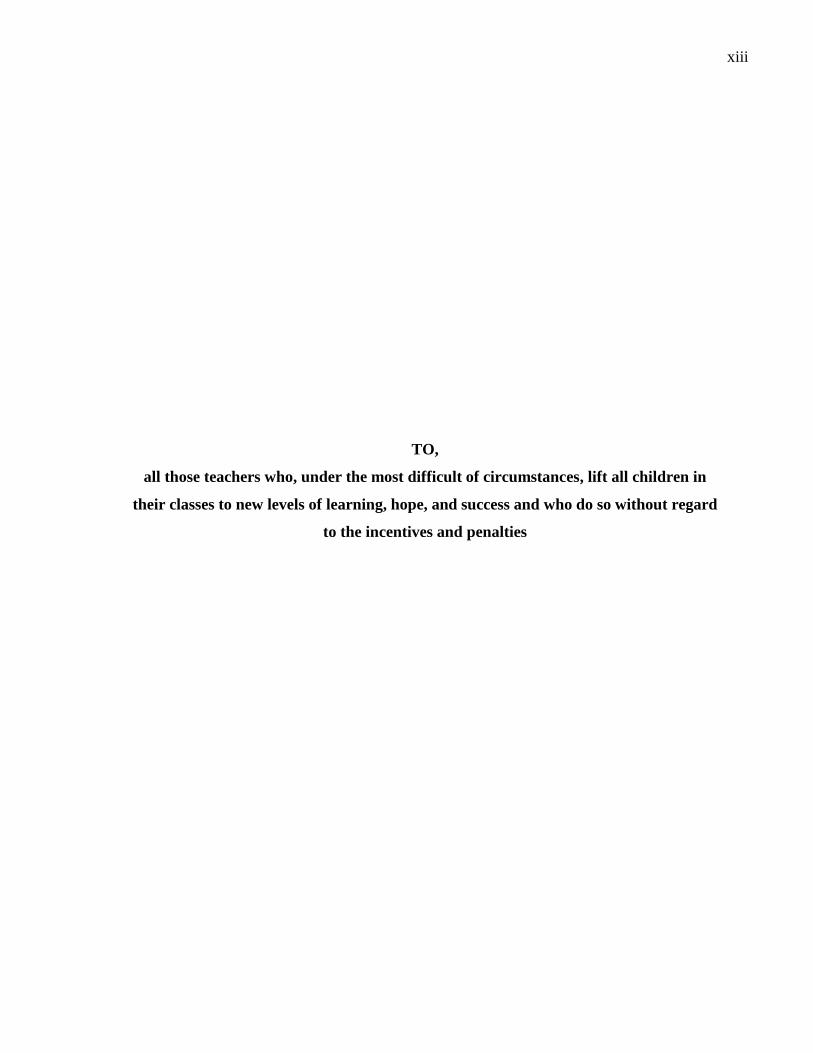
TO,
all those teachers who, under the most difficult of circumstances, lift all children in
their classes to new levels of learning, hope, and success and who do so without regard
to the incentives and penalties
1
Chapter 1. INTRODUCTION
The primary goal of schools is to improve student achievement for all students.
Schools endeavor to achieve this goal by identifying and improving factors that are
significant in relation to student achievement. Evidence shows that teacher quality plays a
critical role in improving student achievement in schools (Barber & Mourshed, 2007;
Borman & Kimball, 2005; Hanushek, 1992, 2003; Hanushek, Kain, Brien, & Rivkin, 2005;
Organization for Economic Cooperation and Development [OECD], 2009a; Rivkin,
Hanushek, & Kain, 2005; Rockoff, 2004; Wright, Horn, & Sanders, 1997). Therefore,
teacher quality has become a driving theme worldwide in educational policy development
and analysis. One way schools can improve the quality of their teachers is by evaluating
them so as to identify their strengths and weakness, develop them professionally, and make
them accountable for their practice (Isoré, 2009; McGreal, 1988; Nolan & Hoover, 2008).
Scholars and policymakers (e.g., Ribas, 2005; Taylor & Tyler, 2011; Toch, 2008)
believe that teacher evaluation is one of the significant approaches to enhance the quality of
education for all students. This belief in the efficacy of evaluating teachers for their
improvement coupled with a push for teacher accountability from various stakeholders has
thrown teacher evaluation into the spotlight of policy-making and practice in recent decades
(Donaldson, 2009; Isoré, 2009; OECD, 2010a; Wößmann, Lüdemann, Schütz, & West,
2007). It is in this context that this dissertation probes the relationships between student
achievement and teacher monitoring and evaluation in 21 countries.
2
Statement of Purpose
As stated above, the quality of teachers is of paramount significance with regard to
improving student achievement (Barber & Mourshed, 2007; Borman & Kimball, 2005).
This means that if teachers are one of the most significant determinants in schooling,
enhancing their impact on student achievement becomes a relevant educational and
scholarly pursuit. In the same vein, teacher evaluation as a strategy to enhance teacher
impact on student achievement renders itself for scholarly scrutiny. In other words, how
teacher evaluation practices and purposes correlate with student achievement becomes a
legitimate concern and area of interest for the larger public, parents, legislators, researchers,
and policymakers. It is in this regard that this study explores teacher evaluation practices in
select Organization for Economic Cooperation and Development (OECD) and non-OECD
countries with the intent to identify nuances of practices and purposes of assessing teachers
and how these practices and purposes relate to student achievement as reflected in student
test scores in mathematics, science, and reading.1
Teacher evaluation, which is synonymous with teacher appraisal (the two terms will
be used interchangeably throughout this study), can be construed of as performance reviews
conducted in schools by personnel such as principal, administrator, supervisor, senior staff,
or a person authorized as evaluator by an external agency such as a ministry of education.
“The results of appraisals may be used formatively to identify specific needs for
1 In the context of this study, student achievement as a dependent variable should be
construed as student test scores in the Program for International Student Assessment (PISA)
in the three subjects of mathematics, science, and reading.
3
professional development, or summatively for decisions related to promotion, rewards or
sanctions” (Looney, 2011, p. 442).
Within schools, principals and peers play a significant role in teacher evaluation.
They evaluate teachers using instruments such as classroom observations and student
achievement including student test scores and give feedback and arrange for reflective
sessions to deliberate on successes or failures of observed lessons and lesson plans.
Accordingly, an improvement strategy is prepared. Externally, the external evaluator may
conduct teacher evaluation using a variety of tools and means such as student test scores and
classroom observations. This type of evaluation has mostly an “accountability” focus
(Looney, 2011).
Thus, teacher monitoring and evaluation has two broad purposes: 1) developmental
purposes to develop teachers professionally, and 2) high-stakes purposes to make teachers
accountable for the quality of their practice (Danielson & McGreal, 2000). This study
explores the relationships between these two distinct but overlapping approaches of teacher
evaluation and student achievement as reflected in the Program for International Student
Assessment (PISA) test scores in mathematics, science, and reading in lower secondary and
secondary schools in 21 countries. These countries are Australia, Austria, Belgium (Fl.),
Brazil, Bulgaria, Denmark, Estonia, Hungary, Iceland, Ireland, Italy, Korea, Lithuania,
Mexico, Norway, Poland, Portugal, Slovak Republic, Slovenia, Spain, and Turkey. As will
be described in the section on sample in chapter 3, these countries make up the bulk of the
sample in the Teaching and Learning International Survey (TALIS) with three non-OECD
and 18 OECD countries. The study takes stock of the principals’ classroom observation
practices as part of her/his pedagogical roles and responsibilities as well as formal and
4
informal approaches of monitoring and evaluating teachers in schools. It focuses on other
means of monitoring and evaluating teachers such as through peer reviews, public
accountability and recognition, and by using student assessments and achievement. The
study also explores the relationships between consequences of teacher evaluation practices
for teachers and how these consequences relate to student achievement.
Significance of the Study
This study is significant for three reasons. First, it adds to the evolving
understanding of the factors that are critical in affecting student achievement in important
ways. The enormity of the task to establish all causal factors notwithstanding, significant
efforts have been made in identifying key factors associated with student achievement in
schools. Various studies have explored student achievement using predictors related to
individual students, their home and family backgrounds, and schools. Be it quality of
educational resources (Demir, Ünal, & Kılıç, 2010), student, family, and school
characteristics (Beese & Liang, 2010; Fuchs & Wößmann, 2007; Wößmann, 2003), or
immigration status of students (Zhang & Lee, 2011), researchers have uncovered important
dynamics that undergird student achievement in key subject areas of science, mathematics,
and reading. Among the plethora of factors, teacher monitoring and evaluation with
different purposes and approaches has been found to relate to and/or affect student
achievement in significant ways. Specific studies (e.g., Holtzapple, 2003; Milanowski,
2004; Taylor & Tyler, 2011; Schütz, West, & Wößmann, 2007; Wößmann et al., 2007) have
found correlations and causal connections among different aspects of teacher evaluation and
student achievement. Previous studies (e.g. Schütz, West, & Wößmann, 2007; Wößmann et
al., 2007) have used older PISA datasets and have explored teacher monitoring and
5
evaluation from an accountability perspective. This dissertation adds to the body of research
on teacher monitoring and evaluation practices using the latest PISA dataset available in the
public domain. It focuses on both the developmental and high-stakes approaches to teacher
monitoring and evaluation by operationalizing key constructs of the process in the light of
relevant theoretical and empirical literature.
Second, the study is unique in one key aspect. It uses PISA in combination with
information from the TALIS 2008 published by the OECD. The study uses secondary
findings as country variables from the TALIS 2008 as reported by the OECD in
combination with student and school level variables from the PISA 2009. The combination
of the two surveys generates a rigorous dataset that takes into account perspectives from
both the principals and teachers on teacher monitoring and evaluation practices in the
sample countries. More on this combination of the two surveys is discussed in the section on
datasets in the methods chapter.
Third, the study is significant because teacher evaluation and accountability are
gaining momentum in schools around the world as means to promote educational
excellence. With this push for evaluation and accountability, differences have surfaced
where key stakeholders such as teachers, policymakers, and administrators, though agreeing
that teachers should be evaluated in schools, are at odds with each other “over” or “about”
how best to do so in ways that can garner optimal student achievement.2 Thus, in the
2 Teachers protesting over bargaining issues in contracts in Chicago in 2012
(http://www.chicagotribune.com/news/local/breaking/chi-strike-updates-pickets-up-as-
more-talks-scheduled-20120910,0,3326359,full.story), and educators boycotting
6
atmosphere of current debates on and endeavors to improving teacher monitoring and
evaluation systems, identifying best practices to effectively monitor and evaluate teachers
has been a key concern for countries around the world (Isoré, 2009; OECD, 2010a). The
evidence gathered through this study provides additional insights to inform such debates
where key stakeholders are engaged in designing the best alternatives for monitoring and
evaluating teachers in their respective contexts.
Research Questions
This study explores the relationships between student achievement and teacher
monitoring and evaluation practices and purposes in 21 countries. The study specifically
attempts to answer the research question: How do teacher monitoring and evaluation
practices and purposes associate with student achievement in mathematics, science, and
reading in lower secondary and secondary schools? In particular, the study focuses on the
following three sub-questions:
RQ1: What is the relationship between the developmental approaches of teacher
monitoring and evaluation and student achievement?
RQ2: What is the relationship between the high-stakes approaches to teacher
evaluation and student achievement?
RQ3: How do teacher evaluation approaches interact with the other aspects of
schooling in relation to student achievement?
standardizing testing in Seattle (http://www.fairtest.org/seattle-teachers-boycott-tests) in
early 2013 are an illustration of that difference.
7
Teacher Evaluation: Unpacking the Constructs
Teacher evaluation is an eclectic term entailing a number of constructs, concepts and
approaches. The term “evaluation,” like many other value-laden constructs, is characterized
by various misperceptions that emanate from a host of synonymous but often different
concepts and processes. For example, some of the processes that may be confused with
evaluation are “assessment,” “supervision,” “accountability,” and “monitoring.” However,
the terms are different in scope and focus. Anomalies in the use and understanding of these
terms arise due to the fact that these concepts and processes share many similarities, but
they do not necessarily lead to similar outcomes. In this regard, it will be relevant to include
here an explanation of the distinctions and similarities among evaluation, assessment,
monitoring, supervision, and accountability.
Evaluation and assessment. Evaluation and assessment are related but different
processes with different purposes. Both processes involve elements of measurement.
However, “Assessment involves merely the measurement of an input, process, or outcome”
(Carlson & Park, 1976, p. 6). Evaluation also involves measurement of an input, a process
or an outcome, but more than measurement it leads to a value judgment of how well and to
what extent the input, process, or outcome has achieved its anticipated objective. In other
words, evaluation leads to an action that is intended “…to maintain, change, increase, or
decrease a behavior…” (Carlson & Park, 1976, p. 6). Evaluation leads to a change in the
elements of inputs, processes, outcomes, or a combination of these so as to create optimal
conditions where the desired behavior or output is maximized.
Evaluation and monitoring. Evaluation and monitoring, like evaluation and
assessment, are two related and overlapping processes in an organization. Monitoring,
8
almost invariably, is a process that accompanies evaluation and has a largely developmental
purpose attached to the process. Monitoring is the ongoing analysis of a process in relation
to set goals and objectives. United Nations Development Program (UNDP) defines
monitoring “…as the ongoing process by which stakeholders obtain regular feedback on the
progress being made towards achieving their goals and objectives” (p. 8). Thus, monitoring
involves tracking the progress and developing strategies to create the optimum momentum
to achieve best results around set goals and objectives (UNDP, 2009). In other words,
monitoring is an ongoing process whereby the data is systematically collected and analyzed
for making necessary adjustments on the way (Development Assistance Committee [DAC],
n.d.). On the other hand, evaluations are periodic reviews (mostly mid-term or end of term)
and analysis of the effectiveness of how a process or program has achieved its intended
objectives. Evaluations are followed by significant adjustments as per the outcomes of
evaluation. It needs to be noted that evaluations make significant use of the data and
findings from the monitoring activities. In sum, monitoring, like evaluation, involves
decision-making albeit in an ongoing and developmental fashion. In this sense, monitoring
is a “developmental” activity and it has been considered accordingly in the context of this
study.
Evaluation and supervision. These two processes can be considered in terms of the
management of personnel by a principal in a formal organization like school. Supervision
broadly entails administration of a unit of organizational activity where the purpose is to
ensure behavior of the supervisees as per the organizational goals, standards, and
procedures. At the same time, more than just overseeing a unit of organizational activity,
supervision entails “…cheer-leading, facilitating, and problem solving” (Saphier, 1993, p.
9
9). Evaluation is an added responsibility of the “cheer-leader” whereby s/he not only
oversees and monitors, but s/he also makes decisions on the efficacy of the behavior and
sometimes remediates and dismisses if need be (Saphier, 1993). Principals observing
classes, giving feedback to teachers, facilitating teachers to grow professionally, and making
decisions on staffing and other administrative matters, are some of the approaches through
which the former deliver their role as internal evaluators in schools. It is with these
theoretical underpinnings that this study explores principals’ evaluative focus in their
pedagogical roles as a category under the “developmental” approaches to monitoring and
evaluating teachers.
Evaluation and accountability. As defined above, evaluation is a judgment or
valuation of an input, a process, or an outcome. Accountability involves the additional step
of informing relevant stakeholders on the efficacy of an intended outcome. Accountability
aims at holding answerable those who are responsible for the outcome. Bovens (2005)
counts accountability as an obligation in a social setting wherein one actor is responsible for
his/her conduct in relation to another through a binding contract. In this sense,
accountability connotes answerability of one stakeholder (a group of actors and/or the whole
organization) to another with direct consequences in the process (Levitt, Janta, & Wegrich,
2008). Thus, accountability leads to an action leading to positive or negative consequences
as per the behavior of the actor(s) involved (Levin, 1974; Levitt et al., 2008). These
consequences are often high-stakes in nature where one’s services, remuneration, and
professional image are on the line.
10
Teacher Evaluation: Purposes, Approaches, and Outcomes
Teacher evaluation in plain terms is measuring and judging the value of teacher
effectiveness and taking steps so as to maximize positive effects of teachers and teaching on
student learning. Broadly speaking, teacher evaluation has two main purposes— formative
or developmental purpose and high-stakes or accountability purposes (Danielson &
McGreal, 2000; Haefele, 1993). The high-stakes purposes of evaluation have the intended
objective of holding teachers answerable for the quality of their professional practice
(Haefele, 1993; Isoré, 2009). This focus of evaluation is also concerned with critical
decisions on a person’s employability, career advancement or, in extreme cases, relieving
someone of his/her services for a lack of needed competencies (Scriven, 1981).
In contrast, the developmental purposes of teacher evaluation, including monitoring
as explained above, aim to identify professional training needs of the evaluated teachers so
as to improve their practice (Haefele, 1993; Latham & WexIey, 1982). Such professional
development aspects may include:
…regular feedback by the principal and experienced…to identify priorities for both
teacher and school improvement. Results from this kind of teachers' assessment can
be used to identify teaching needs and contribute to the definition of the school plan
in order to improve the teaching process within the school. (Faubert, 2009, p. 29)
It needs to be noted that while teacher evaluation with a developmental focus has its
ultimate purpose as improving instructional practice of teachers, schools may use insights
gained through such evaluations for high-stakes decisions as well (Isoré, 2009). Also,
schools may institute a developmental evaluation system to ensure proper implementation of
a school’s policies as regards instructional objectives such as attaining best results in
11
standardized tests by making teachers teach aspects of the curriculum that can promote
higher scores for students. Thus, the two purposes of evaluation may not always be cut-and-
dried, working in isolation. Both may interact in complex ways with each other and with the
other aspects of schooling depending upon the goals of a particular school and the overall
policy-environment at the local, regional, national, and even international levels.
Instruments and Evaluators
Schools evaluate teachers using a variety of instruments, evaluators, and approaches.
Instruments may consist of classroom observations with simple to complex checklists and
rubrics, teacher portfolios, peer reviews, teacher tests and interviews, student achievement,
and questionnaires and surveys (Isoré, 2009). A discussion encapsulating the whole range of
evaluation instruments and approaches will be too exhaustive and beyond the scope of this
study since the study limits itself to only those evaluation instruments that are covered in the
PISA 2009 survey. Therefore, I will include here only a discussion of classroom
observations, peer reviews, and student achievement data as used by different evaluators as
measures of teacher monitoring and evaluation. It needs to be noted that this description is
not a critique of these instruments or evaluators. It is, rather, an attempt to explain what
these instruments and evaluators are and how they are used in schools for teacher evaluation
purposes.
Student achievement. As the name suggests, student performance in various types
of assessments (internal and external—standardized or unstandardized) provide a
convenient form of evidence to assess the value-added into student learning by teacher(s).
Student achievement data can be described in a variety of ways such as averages,
percentages, subject means, class means, and overall school means and so on and so forth
12
(Peterson, 2000). One use of the achievement data in any evaluation approach is through the
Value Added Models (VAMs) that claim to tease-out individual teacher contributions in a
students’ learning by clearing out the noise in the data after controlling for a student’s
previous background and various other teacher and school characteristics (Stronge &
Tucker, 2000). Other less sophisticated uses of student achievement may be in the form of
averages and percentages at the subject, classroom, school, regional, and national levels.
Teacher peer reviews. This category consists of the assessments by subject
colleagues who may or may not work in the same school, may observe classes, give
feedback, and have review and reflective sessions with teachers so as to offer suggestions
for improvement (Looney, 2011). This may also consist of review of materials “…in which
teachers…examine and report on instructional materials, classroom artifacts, and student
work assembled by a teacher” (Peterson, 2000, p. 94). Peer reviews can be used for
developmental purposes or as adjuncts to the formal evaluations for high-stakes purposes
(Looney, 2011).
Classroom observations. Peterson (2000) calls classroom observations as
“systematic observations” where the purpose is to document the instructional processes in
classrooms which can then be turned into “…numerical summaries of distributions,
graphical displays, and prose descriptions” (p. 96). Highlighting the developmental utility of
classroom observations, Evertson and Holley (1981) note that classroom observations “help
in understanding and ultimately in improving instruction…” (p. 90) by providing the
opportunity to observe the interactions between teachers and students that are significant in
determining what goes into student learning. Classroom observations also allow seeing if
“…the teacher adopts adequate practices in his more usual workplace: the classroom
13
(United Nations Educational, Scientific and Cultural Organization [UNESCO], 2007 cited in
Isoré, 2009). In terms of its prevalence, Isoré (2009) shows in her review of literature that
classroom observation is the most used source of evidence in teacher evaluation across
OECD countries. Likewise, for its ubiquity in schools, Danielson and McGreal (2000) liken
classroom observation to teacher evaluation and count it as “…the best, and the only, setting
in which to witness essential aspects of teaching—for example, the interaction between
teacher and students and among students” (p. 47).
Evaluators. Like the evaluation instruments, there are numerous evaluators that
carry out the function of evaluations in schools. For the purposes of this study, two forms of
evaluations are significant: internal and external. Internal evaluations which Isoré (2009)
also calls internal reviews in OECD contexts, are mostly carried out by principals or senior
personnel (by senior teachers or other administrators) within schools (Peterson, 2000). In
most of the OECD countries, internal evaluations are carried out by the principal or senior
staff (Isoré, 2009). External evaluations or external reviews, on the contrary, are carried out
by personnel from outside the school who may come from other schools or an education
agency external to the school. These external evaluators may exclusively be “external” or
may also include school principals as part of the panel depending upon the country and its
policies (Isoré, 2009).
This dissertation is divided into five chapters. Chapter 2 gives a detailed review of
literature that essentially delineates teacher evaluation practices in different countries (with a
special focus on OECD countries) and synthesizes empirical evidence on the relationships
between teacher evaluation and student achievement. The chapter closes with a description
of the theoretical framework and hypotheses of the study. Chapter 3 describes the methods
14
and the datasets used in the study. It describes and explains data management, processing
and analysis. In the fourth chapter, results and findings of the study have been presented.
The last chapter consists of a discussion of the major findings of the study. The chapter ends
with a discussion of the limitations of the study, policy implications, and recommendations
for future research.
15
Chapter 2. LITERATURE REVIEW, CONCEPTUAL FRAMEWORK, AND
RESEARCH HYPOTHESES
This chapter is divided into three sections. Section 1 lays-out an outline of teacher
evaluation in OECD and non-OECD countries. Since a significant portion of the sample of
this study consists of OECD countries, it is plausible to describe teacher evaluation scenario
as captured in the various reports from the OECD. Section 2 describes and explains
empirical evidence relating to the relationships between student achievement and teacher
evaluation practices and purposes. Building on prior evidence, the Section 3 gives a
conceptual framework and research hypotheses of the study.
Teacher Monitoring and Evaluation in Cross-National Perspectives
Various studies and reports from OECD show that there is variation both within and
among countries as regards teacher monitoring and evaluation practices (OECD, 2005,
2009a, 2009b, 2010a). This variation can be seen in the purposes and practices of teacher
evaluations (OECD, 2010a). The variation is also marked by a shift in several countries
towards teacher evaluations that have a predominant focus on teacher development and in-
service trainings (Faubert, 2009; OECD, 2005).
With regard to variations across countries, teachers are held accountable as teams
(e.g., in Scotland and Sweden), and sometimes as individuals to incentivize them (e.g., in
Hungary) by using pupil achievement as an evidence of teacher performance in internal
and/or external evaluations of teachers (Faubert, 2009). Finland, like Greece and Israel, does
not have a state-mandated evaluation system thereby rendering a greater degree of
autonomy to the principal who is solely responsible for school affairs including teacher
monitoring and evaluation (UNESCO, 2007 cited in Isoré, 2009). The United States, on the
16
other hand, has a variety of internal and external teacher evaluation practices such as the
National Board for Professional Teaching Standards (NBPTS) certification, and Praxis III
examinations (OECD, 2009a). These practices include developmental approaches such as
classroom observations, teacher portfolio reviews, teacher interviews, and assessment of
content and pedagogical knowledge. These evaluations also have high-stakes aims such as
to judge teachers for their eligibility for tenure or certification (OECD, 2009a). Examples of
such evaluations can be found in states like North Carolina, Connecticut, and California
(Larsen, 2005). In Chicago, principals use observation check-lists to rate teachers’
performance and to identify strengths as well as areas for improvement with an end of year
rating of teacher performance (Sartain et al., 2011).
We find similar approaches to evaluation in specific regions in Canada, England, and
Australia. In Ontario, classroom teachers who are experienced are evaluated using
descriptors of teaching skills, content knowledge, and requisite attitudes towards teaching.
These evaluations normally consist of classroom observations by principals and discussion
sessions before and after the classroom observations (Larsen, 2005). In addition to the
classroom observations, other sources of evidence on teacher performance such as lesson
plans, student records, self-assessment reports, and parental and student surveys make-up
the whole gamut of teacher evaluation package (Larsen, 2005).
Teacher evaluation as covered in the OECD project 2002-04. The OECD
conducted a study in 2002-04 to give country backgrounds on various educational policies
including teacher evaluation.3 Appendix A gives a summary of the evaluation scene in the
3 Contents in this section are adapted from OECD (2005).
17
26 countries involved in the project. The findings show that, as of 2002-04, the OECD
countries employed a range of teacher evaluation systems with varied criteria, tools,
purposes, and consequences (OECD, 2005). According to the OECD report on the project,
around half of the countries had “…periodic evaluation as part of their regular work”
(OECD, 2005, p. 188). Six of the twenty-six countries had no developmental focus in
teacher evaluations. Nine countries had active teacher evaluation systems having links with
teachers’ professional development. The remaining countries had varied responses
depending upon the type of evaluation and incentive system as well as the location within
the country. For example, in Chile, three of the four evaluation systems had professional
development as one of their purposes. The report also identifies Chile as a more progressive
member in the list of countries in implementing a variety of teacher evaluation systems
having both the developmental and high-stakes purposes. In the United States, compulsory
training was observed as a general trend in evaluation schemes. In the countries that had
links between teacher evaluation and professional development had some consequences for
ineffective teachers. These consequences included implementation of an improvement plan
and deferral of promotion or loss of salary. Countries like Austria, Canada (Quebec),
Denmark, Finland, Germany, Greece, Israel, Italy, and Spain had teacher evaluations mostly
conducted for non-tenured teachers. Ireland, Norway, and Sweden were characterized by
school evaluation more than teacher evaluation. Hungarian schools had most of the
responsibility for teacher evaluation left with the school principal while Mexico had
voluntary teacher evaluations (OECD, 2005).
18
Teacher evaluation: Findings from the PISA 2009. The PISA 2009 survey
included a number of items related to evaluations in schools.4 While most of these items
sought information on the uses of student assessment and achievement data from an overall
school perspective, a few items specifically asked principals about using student assessment
and achievement data for instructional purposes, to monitor and evaluate teachers, and for
accountability purposes. Responses were recorded on a range of options such as informing
parents about their children’s progress, identifying areas for improvement in the curriculum
or teaching methods, and judging teacher effectiveness (in test language).5 The survey also
asked principals about their management roles that included if and how often they observed
teachers in classroom, if they suggested teachers for professional improvement, and if they
informed teachers of opportunities for updating their knowledge and skills. All these aspects
of principals’ role carry the elements of internal school evaluations with a developmental
purpose attached to the process.
The report shows that countries varied greatly in terms of the purposes of uses of
student assessments and achievements. Items related directly to teacher evaluation and
accountability included use of achievement data for the purposes of monitoring teachers and
4 Contents in this section are adapted from OECD (2010a).
5 According to PISA standards for language of testing, “The PISA test is administered to
a student in a language of instruction provided by the sampled school to that sampled
student in the major domain (Reading) of the test” (PISA, 2012, p. 370). Therefore, in the
remainder of this dissertation, language of instruction in reading is referred to as “test
language” to keep the term consistent with the PISA.
19
judging their effectiveness. According to OECD (2010a), on average, 59% of students
across OECD countries studied in schools that used student achievement to monitor
teachers. Countries like Poland, Israel, the United Kingdom, Turkey, Mexico, Austria, and
the United States reported having 80% of the students attending such schools. A number of
countries used student achievement data in combination with internal assessments by
principals, peers, senior staff, and/or external evaluators. Finland had much less internal
assessments and observations of teachers and external evaluation was almost non-existent
(only 2% students studied in schools having external evaluations).
A second item on the developmental uses of student achievement data included
identifying aspects of instruction or curriculum for improvement purposes. Though this item
did not specifically ask principals if the use was for improving teachers’ instructional
practice, it can be implied that “instruction” being the main job of teachers, it covered
aspects related to professional development of teachers. The report showed that schools
using this practice had an average of 77% of students enrolled across OECD countries. New
Zealand, the United States, the United Kingdom, Iceland and many other countries had a
much higher prevalence: more than 90% students were enrolled in schools that used this
practice. Greece and Switzerland had less prevalence of this practice.
Some of the indirect measures of teacher evaluation and accountability related to the
overall (as teams or school) accountability and evaluation processes in schools. Such
indirect high-stakes purposes of teacher evaluation included public accountability,
informing parents, comparisons and benchmarking across schools and districts and at
national level, and administrative tracking by an external authority. On public
accountability, OECD (2010a) reported that an average of 37% students attended schools
20
that had public accountability. Such public accountability included making student
achievement data open to the public through media, organizational websites and other
channels. In Belgium, Finland, Switzerland, Japan, Austria, and Spain, this practice was far
less common. The United States and the United Kingdom had over 80% students in schools
with public accountability practices.
A related but different aspect of teacher accountability was sharing of student
progress with parents. On average, 52% of students across OECD countries studied in
schools where parents were provided with information on their children’s academic
performance. Countries like Austria, Italy, and the Netherlands had 80% students studying
in such schools. Administrative tracking of student achievement was in place in OECD
countries with an average of 66% of students attending schools with this practice. The
United States, the United Kingdom, and New Zealand were exceptional in this case as more
than 90% of students came from schools having this practice.
Using achievement data for instructional resource allocation was found in schools
having 33% of student population across OECD countries. This figure was 70% for Israel,
Chile, and the United States and less than 10% in Iceland, Greece, Japan, the Czech
Republic, and Finland.
In addition to providing description of evaluation and accountability in schools in
countries covered by the PISA 2009 survey, OECD (2010a) also classified countries into
four categories. It used principals’ responses on various aspects of their schools’ evaluation
and accountability practices and purposes and, through a “latent country profile analysis,”
classified countries on the basis of use of achievement data for “benchmarking and
information purposes,” and if the data were used for various types of “decision-making in

21
schools.” Appendix B gives the details of these categorizations. In this profile analysis,
countries that heavily monitored teachers’ practice (such as Australia, Canada, and Chile)
also had arrangements for sizeable public accountability, administrative tracking, and
monitoring yearly progress. Sixty-five percent of the use of student performance and
assessment was for monitoring teachers in these countries. In contrast, countries with least
emphasis on teacher monitoring also had less emphasis on public accountability,
administrative tracking, and informing parents about their children’s progress. These
countries included Austria, Belgium, Finland, Germany, and Greece. Countries with lesser
monitoring of teachers included Hungary, Norway, Turkey, Montenegro, Tunisia, and
Slovenia. These countries, however, had a higher focus on high-stakes consequences such as
public accountability and other external accountability measures in schools. Like Australia,
Canada, and Chile, countries such as Denmark, Italy, Japan, Spain, Argentina, Macao-
China, Chinese Taipei, and Uruguay frequently used achievement data to monitor teachers’
practice. However, these countries had lesser external accountability focus unlike Australia,
Canada, and Chile.
Teacher evaluation: Findings from the TALIS 2008. A cross-national review of
teacher evaluation systems provided so far is based on two key OECD reports published in
2005 and 2010. These two sources exclude perspectives of the key target of monitoring and
evaluation who are teachers in the context of this study. This, somehow, leads to an
incomplete scenario of teacher evaluation in schools as captured by the two sources.
However, a more comprehensive picture of teacher monitoring and evaluation emerges from
the TALIS that was conducted by the OECD in 2008. This survey was administered both to
the teachers and principals in lower secondary schools in the participating countries. The
22
TALIS is comprehensive in its coverage on key aspects of teacher evaluation practices that
are significant in terms of developmental and high-stakes purposes of the process.6 For
example, the report gives detailed analyses of how performance appraisal and feedback are
built into the evaluation systems, how much emphasis is placed on professional
development in teacher appraisal and feedback, and how important is a given evaluation
criterion, for example student test scores, in teacher appraisal in each TALIS country. The
report also shows how internal and external evaluations are conducted in schools in these
countries.
A key finding of the survey is the nature of internal and external evaluation and
feedback in the TALIS countries. On internal and external evaluation and feedback, the
TALIS shows that the sources of appraisal and feedback are usually found within schools
since more than 50% of teachers reported not having experienced external evaluation and
feedback in the last five years. This indicates that teacher evaluation is situated
predominantly within schools across the OECD countries thereby making internal
evaluation practices (such as by principals and peers) an important element to probe.
According to OECD (2009b), majority of the countries covered in the TALIS 2008
used student test scores as criteria for teacher appraisal and feedback. Across the TALIS
countries, more than 50% of the criteria for teacher appraisal and feedback consisted of
student test scores (see Appendix C). Few countries had this criterion at less than 50% with
Denmark having about 29% of the teacher appraisal and feedback criteria consisting of
student test scores. With slight variations, countries having lesser focus on student test
6 Contents in this section are adapted from OECD (2009b).
23
scores also had lesser emphasis on innovative methods in teaching. On average, teachers
accorded highest importance (73%) to within classroom processes as criteria in their
evaluations.
One of the significant aspects of any teacher evaluation mechanism is the end result
of it. The end result can be seen through how much a teacher evaluation process is having an
impact on classroom teaching and other aspects of teachers’ professional lives. The TALIS
2008 survey captured information on these important elements of appraisal and feedback
(see Appendices D & E). In terms of the impact of teacher appraisal on teaching in TALIS
countries, teachers reported on the extent to which their appraisal changed various aspects of
their lives in schools (see Appendix D). Teacher responses showed that the greatest
emphasis (an average of 41%) was placed on raising student achievement in the form of
student test scores. Australia, Brazil, Bulgaria, Ireland, and Italy were some of the countries
with a heavy emphasis on student test scores in teacher appraisal systems. In addition,
classroom management, instructional practices, and developing professional development
plans were the next areas that teachers showed as receiving the highest impact in their
appraisals. In countries like Australia, Belgium (Fl.), Bulgaria, Hungary, Ireland, Mexico,
Norway, Slovenia, and Spain, teachers reported classroom management as one of the most
affected areas of their work (OECD, 2009b).
The TALIS 2008 gives insights into outcomes of teacher appraisal and feedback (see
Appendix E). In addition to the impact on teaching practices and skills, teachers also
reported on how their appraisal changed their service and salary structures. Some of the
outcomes that the OECD (2009b) report mentions are a change in financial incentives,
opportunities for professional development, and change in responsibilities. Analysis of such
24
outcomes shows that few teachers reported any direct monetary outcomes or long term
career advancement as a result of their appraisals. On professional development as an
outcome of teacher appraisal, Bulgaria, Lithuania, Poland, and Slovenia showed a greater
focus on the developmental purposes of teacher evaluation. Mexico, Bulgaria, Brazil,
Poland, and Lithuania were some of the countries where teachers reported that teacher
appraisal and feedback had a higher impact on their teaching practice. At the same time,
these countries also had teachers in higher percentages who emphasized improving student
test scores in their teaching. Countries like Denmark, Austria, and Belgium (FL) had much
less emphasis (around or less than 20%) on improving student test scores in their teaching
and a development plan for improving practice. One of the least affected areas of their
service was a change in salary and if any financial bonus was awarded to teachers. For
example, only 0.4% of the teachers in Flemish Belgium reported that their appraisal led to a
moderate or large change in their salary. In contrast, 33% teachers in Malaysia reported a
moderate to large change in their salary as a result of their appraisal. There was a high
correlation between how teacher appraisal affected teachers’ salary and financial rewards or
bonuses. The highest impact of teacher appraisal on any aspect of teachers’ lives as reported
by teachers was observed in Malaysia. Countries like Australia, Austria, Belgium (Fl), and
Malta, on average, showed lesser change in any aspects of teachers’ lives as a result of
appraisal and feedback.
According to OECD (2009b), 62% of the principals in TALIS countries shared
results of appraisals with teachers. In Australia, Austria, Belgium, Bulgaria, Estonia,
Hungary, Poland, and the Slovak Republic, over 75% of the teachers worked in schools
where principals reported that they communicated results of the appraisals to teachers most
25
of the time. This percentage was 32 in Korea and 25 in Turkey. Furthermore, on average in
TALIS countries, most of the teacher appraisal happened within schools with very limited
reporting of underperformance to an outside authority. Only in Austria, Mexico, and Brazil
was such a reporting more common with 21%, 47%, and 27% respectively. Principals who
reported that they never established an improvement plan in case of identification of a
weakness ranged from 11% in Poland and Estonia, to 23% in Austria.
While this section has set a background to teacher evaluation practices and purposes
in the OECD countries, the next two sections provide empirical evidence on how teacher
evaluation is linked to student achievement in schools.
Teacher Evaluation: Empirical Evidence
As Isoré (2009) mentions, teacher evaluation purposes—developmental or high-
stakes—do not always work in isolation. A teacher evaluation system may simultaneously
carry both the “developmental” and “high-stakes” purposes. Also, schools use insights
gained through the “high-stakes” approaches for “developmental” purposes and vice versa.
This crisscrossing of teacher evaluation purposes and practices offers an immense challenge
when categorizing literature into distinct themes of purposes and practices. However, as an
arbitrary arrangement and for the sake of simplicity, I have categorized empirical evidence
on teacher evaluation into two streams based on how evidence on teacher performance is
gathered in schools. If, in a given piece of empirical literature, the predominant mode of
gathering evidence on teacher performance was through instruments such as classroom
observations focusing on within-classroom “processes,” and if teachers received feedback as
part of their evaluations, I have included that piece of literature under the discussion on the
“developmental” approaches. On the contrary, if the predominant approach to gathering
26
evidence on teacher performance was through student achievement chiefly in the form of
test scores with the purpose of making teachers accountable for their practice, I have
grouped such literature under the “high-stakes” approaches to teacher evaluation.
Thus, this literature review presents empirical evidence on teacher evaluation in two
broad streams. The first stream (e.g., Goe, Bell, & Little, 2008; Sartain et al., 2011;
Wenglinsky, 2002) consists of studies that explore standards-based approaches such as
classroom observation instruments and rubrics as well as subjective modes of teacher
evaluation. This stream explores standards-based and subjective teacher evaluation practices
with or without student test scores as measures of teacher performance. The second stream
(e.g., Goldhaber & Hansen, 2010; Sanders & Horn, 1994; Stronge & Tucker, 2000) consists
of literature on teacher evaluation approaches that use student test scores as a primary
measure of teacher performance. These teacher evaluation approaches may not necessarily
carry “developmental” aspects and almost always carry high-stakes purposes to make
schools and teachers accountable for their performance. Additionally, a limited amount of
empirical evidence also discusses effects on student achievement of interactions between the
different teacher evaluation approaches and other schooling aspects.
Developmental teacher evaluation and student achievement. Teaching is a
complex social process and accordingly it requires complex approaches to assessing its
quality. In this regard, a substantial amount of empirical evidence explores standards-based
(and subjective evaluations), developmental approaches to evaluate teachers.
Emphasizing the importance of teacher evaluations for teacher development and
mainly responding to the issue of smaller school effects in quantitative studies on student
achievement compared to student background effects, Wenglinsky (2002) posits that the
27
quantitative research has often lagged behind in tapping into the huge potential of
explanatory power of the processes going on in classrooms. In this regard, to the extent of
the void in quantitative realm of educational research around what happens in classrooms,
Wenglinsky’s (2002) study is a significant step forward in driving quantitative research to
explore complex processes of assessing teachers’ practice and identifying their professional
development needs. His study was made feasible, as he mentions, by the availability of a
large database—the National Assessment of Educational Progress (NAEP)—that consists of
information covering aspects of classroom practices along with student, teacher, and school
level characteristics. His primary objective was to test the generalizability of insights that
the qualitative research provided on such subtle aspects of teaching and learning as
understanding and thinking skills of students. He refers to only two sources of literature
(National Center for Education Statistics [NCES], 1996; Cohen & Hill, 2000) that discussed
within-classroom aspects of teaching and learning using quantitative analysis of a large
dataset NELS:88. Building on these earlier studies and using a multi-structural equation
modeling (MSEM) approach, he finds that the effects of teaching quality as reflected in a
teacher’s classroom practices such as a focus on higher order thinking skills and pushing the
bar up for students were as strong, if not more, as other school level factors. Thus, his study
appears to be a significant push for quantitative studies that focus on teacher evaluation
approaches that are developmental in nature and that are deeply connected to classrooms
through such instruments as classroom observations. Following Wenglinsky (2002), we see
many studies (Kimball, White, Milanowski, & Borman, 2004; Holtzapple, 2003;
Milanowski, 2004; Sartain et al., 2011; White, 2004) that explore teacher evaluation
28
practices that focus on within-classroom processes with the purposes of assessing and
developing teachers’ practice so as to improve student achievement.
Kimball, White, Milanowski, and Borman (2004) studied the relationship between
standards-based teacher evaluation scores awarded on the basis of the Danielson’s
Framework of Teaching and student achievement. Teacher evaluation based on Danielson’s
framework can be considered as one of the many approaches that can be used to formatively
evaluate teachers in order to improve their professional practice. This framework consists of
four domains: planning and preparation, classroom environment, instruction, and
professional responsibilities (Danielson, 1996). Each domain further carries 22 components
that describe teaching competencies required of a teacher. The framework rates teacher
performance at four levels: unsatisfactory, basic, proficient, and distinguished. Kimball et al.
(2004) found in their multilevel statistical modeling that though there were positive
significant relationships between teacher evaluation ratings and student achievement in all
subjects and grades that they tested, coefficients were not statistically significant in all
cases. However, only for reading in fourth grade and for each test in fifth grade, they found
positive significant coefficients. They conjecture that this situation may have resulted from a
mismatch between what is taught and what is examined in schools, in addition to the very
limited number of variables (only 7 out of 23) that they used as teacher evaluation scores in
their study. As the authors hint, this may have led to missing important information on
teacher performance in all teacher evaluations measures.
In contrast, Milanowski (2004), found small to moderate positive correlations in
each of the tested subject. His study was similar to Kimball et al. (2004) in the use of the
Danielson Teaching Framework. Though the relationships were at best moderately positive,
29
he still considered them significant given that measuring teacher effectiveness using
standards-based evaluation rubrics may be noisy and influenced by a number of other
confounding factors. These relationships represented the significance of teachers’ practice in
relation to student learning and hence, teacher evaluation using standards-based evaluation
frameworks were a viable alternative to evaluating teachers. Furthermore, a combined
analysis of studies conducted at three sites by Milanowski, Kimball, and White (2004)
showed that the standards-based teacher evaluations have “…substantial positive
relationship with the achievement of the evaluated teachers’ students” (p. 19). All this meant
that the developmental purposes of teacher evaluations were significant in improving quality
of learning for students.
On standards based approaches to teacher evaluation, Holtzapple (2003) carried out
his own analyses of the links between teacher evaluation scores in Cincinnati’s Teacher
Evaluation System (TES) and found similar results as that of Milanowski (2004). TES is an
adapted version of the Danielson’s framework (see Danielson, 1996) consisting of only 16
standards in the four domains of teaching (Holtzapple, 2003). However, Holtzapple’s
analysis showed that though the evaluation system successfully predicted performance at the
extremes of the ratings (unsatisfactory and distinguished), it did not effectively predict
student achievement at the middle (proficient and basic) level of teacher evaluation ratings.
Holtzapple (2003) used teachers’ evaluation score in the “Teaching for Learning” domain or
a composite of scores in all the four domains of the teaching standards. His analyses of
student gains and teacher evaluation scores showed that if teachers received “unsatisfactory”
and “basic” ratings on “Teaching and Learning Domain,” it negatively reflected on student
achievement as shown by a lower score relative to predicted score on the basis of prior
30
year’s achievement. Students taught by the “distinguished” teachers performed at the
expected level. He further mentioned that the TES was important in teachers’ professional
development as district providers aligned their training activities in line with the TES
standards and requirements. Also, teachers showed a change in their professional behavior
as they started reflecting on their practice in preparation for the TES. These are the aspects
of teacher evaluation that incorporate developmental purposes of teacher evaluation
(Danielson & McGreal, 2000).
Continuing the line of research on standards-based teacher evaluations, Sartain et al.
(2011) reported results for Chicago’s Excellence in Teaching Pilot, a program launched in
2008 to rebuild an effective teacher evaluation system. The program aimed at improving the
instructional quality by evaluating teachers’ performance and giving them constructive
feedback that targeted teachers’ professional development. Like the earlier studies on the
developmental approaches to teacher evaluations, school principals and external evaluators
in the pilot program observed teachers’ practice by using the Danielson Framework for
Teaching, and arranged for conferences to share with the teachers the outcomes of
evaluations. Their data consisted of extensive classroom observations by principals and
external evaluators (499 classroom observations for reliability check and 955 classroom
observations by principals alone for validity check), student achievement in value-added
frameworks, and interviews with teachers and principals on various aspects of teacher
evaluations including classroom observations. They found that the teachers who were
evaluated showed significant gains in the achievement of students whom they taught.
Teachers who participated in the qualitative part of the study also agreed that the evaluation

31
system had become more reflective, thereby leading to a significant improvement in their
practice.
Other studies (e.g., Taylor & Tyler, 2011; Tyler, Taylor, Kane, & Wooten, 2010)
focused on how classroom observations as instruments in developmental approaches to
teacher evaluation affected student achievement. These studies show that the classroom
observations (by observers such as principals, peers, and external evaluators) significantly
relate to student achievement. As Tyler, Taylor, Kane, and Wooten (2010) emphatically
stated:
…some of the strongest evidence to date that classroom observation measures
capture elements of teaching that are related to student achievement….moving from,
for example, an overall TES rating of “Basic” to “Proficient” or from “Proficient” to
“Distinguished” is associated with student achievement gains of about one-sixth to
one-fifth of a standard deviation. (p. 259)
Regarding the effects of classroom observations, Tyler et al. (2010) go deeper into
the dynamics of how various aspects of classroom observations predicted mathematics and
reading achievement. In their study, at a micro-level, a teacher who was able to manage a
better classroom environment compared to focusing on teaching practices showed increased
student performance by 0.25 standard deviation (SD) in mathematics and 0.15 SD in
reading. Their study also showed that a teacher who focused more on inquiry based teaching
compared to a teacher who focused on content produced larger gains in mathematics but no
effects in reading. Based on their findings, they posit that teachers may be making trade-offs
between various instructional objectives, as captured in various components of the
developmental evaluations of teachers. Thus, their study is significant in terms of the
32
elements of teaching that are important in raising student achievement in mathematics and
reading. Considering classroom observations mostly as part of the developmental teacher
evaluation practices and purposes, similar results appear in the analysis conducted by Schütz
et al. (2007) where they found that classroom observations by principal or senior staff
showed positive associations with student achievement.
Findings in Taylor and Tyler (2011) suggested that a student was predicted to score
higher (10% of an SD) in mathematics compared to a similar student who would have been
taught by the same teacher before the latter’s evaluation. One of the significant strength of
their design was the association that they established between a given teacher who was
evaluated before and after the year of evaluation rendering a higher internal validity to their
research design. They also controlled for various other factors important at student and
teacher levels such as a teacher experience, student gender and ethnicity, and previous
achievement. One interesting result that is particularly important for my study is their
finding that the effects of evaluation through a standards-based evaluation approach was not
the same across all the evaluated teachers. Teachers who received a lower score before
evaluation showed higher student performance after evaluation suggesting a potential
“developmental teacher evaluation” relationship that may be associated with incentives and
consequences in the evaluation system itself or the critical feedback that teachers received
during their evaluations. Taylor and Tyler (2011) indicate that the exact dynamics
undergirding such relations between student achievement and teacher evaluation were not
clearly manifest in their study. However, they associated the gain in student achievement to
the particular developmental features of evaluation system where teachers are provided
feedback on the skills that can have positive associations with student achievement. This
33
suggests potential benefits of the developmental teacher evaluation to enhance student
learning thereby rendering credibility and logic to the studies such as this one that aim to
explore the relationships between different evaluation purposes and approaches and student
achievement.
Wößmann et al. (2007) explored monitoring by principals, external observers, and
peers in mathematics. While I am analyzing these variables with a “developmental” lens
given the closer theoretical relevance of “monitoring” as a developmental activity (UNDP,
2009) in the larger teacher evaluation systems in schools, Wößmann et al. (2007) used more
of an accountability lens in analyzing findings around monitoring teachers in mathematics.
In their cross-countries accountability analysis, they found positive but insignificant
relationships of such monitoring with student achievement. However, such monitoring of
lessons turned significantly positive at school-level accountability at various significance
levels. In this regard, coefficients of monitoring by principals were more pronounced than
that of monitoring by an external authority, depicting a necessity to further probe principal’s
observation of teachers and resultant associations with student achievement. Wößmann et al.
(2007) show that the principals observing teachers’ lessons had positive associations with
student achievement with significant effects coming into play at 10.5% significance level.
Classroom observation and monitoring by external evaluators showed positive relations with
student achievement in some instances after controlling for principals’ monitoring of
lessons.
Gallagher (2004) explored a teacher evaluation system that had both the elements of
developmental and high-stakes approaches to assessing teacher effectiveness. A
predominant focus of the teacher evaluation system at his research site was assessing
34
within-classroom processes followed by feedback. Evaluators used a variety of approaches
to gathering evidence on teacher performance such as classroom observations, student work,
and lesson plans. The author mentions that while student work was sometimes used to
ensure documentation on teachers’ work, student achievement was not part of the formal
evaluation of teachers. In his study, Gallagher (2004) found strong and statistically
significant relationships between teacher evaluation scores and student achievement in
reading. The findings for mathematics were positive but statistically insignificant. Last but
not the least, Rockoff and Speroni (2010) studied subjective and objective measures of
evaluating teachers. They studied teacher evaluations conducted by professional mentors
who worked with the new teachers and who made evaluations based on student achievement
as a result of first year of teaching of these new teachers. Findings in their study showed
significant connection between student achievement and the evaluated teachers. Thus, in
sum, there is ample evidence that shows that the developmental approaches to teacher
evaluation can have significant positive associations with student achievement though some
studies also show statistical insignificance of such associations.
High-stakes teacher evaluation and student achievement. As stated previously,
one of the main purposes of high-stakes teacher evaluations is to judge teacher effectiveness
and make “consequential decisions” (Danielson & McGreal, 2000) relating to, for example,
personnel matters including hiring, firing, salary adjustment, and accountability. While there
is no literature that discusses high-stakes and developmental teacher evaluations in a
mutually exclusive fashion, the type of evidence used to assess teachers can be used as a
proxy to study such approaches in teacher evaluations. As described in the introductory
chapter, evidence of teacher performance can come in a variety of ways such as student test
35
scores, teacher peer reviews, and principal and staff observations. In the high-stakes
evaluations, a main source of evidence has been in the form of how well students perform in
various assessments. Student assessment and performance may come in a variety of forms
such as school-based tests and external standardized examinations.
Proponents (e.g., Sanders & Horn, 1994; Stronge & Tucker, 2000) contend that
student assessments as an evidence of teacher effectiveness offer good tradeoffs for their
objectivity. These proponents suggest using VAMs that apply pretest-posttest designs to
statistically isolate teacher effects on student achievement from other confounding factors
that emanate at student, school, and family levels (Astin, 1982; Sanders & Horn, 1994).
According to Astin (1982), the VAM approach,
….unlike traditional measures such as the reputational view, the resources view, or
the outcomes view, promotes equity because it diverts attention away from mere
acquisition of resources and focuses instead on their effective utilization. Any school
is capable of attaining a significant degree of "excellence" through this method.
(Astin, 1982, Abstract)
To explore the efficacy of student test scores as measures of teacher effectiveness,
Bingham, Heywood, and White (1991) studied student performance in a large school system
with around 100,000 students. They explored student performance of fifth graders to see if it
could be used as a measure to evaluate teachers in high-stakes evaluations. They examined
over 500 independent variables that could potentially be related to student performance in
different ways. Through a residual and step-wise regression analysis they identified the
schools wherein teachers had added value to the students whom they taught. They conclude
that student performance can be used to evaluate teachers since their experiment showed
36
that teachers could be differentiated on the basis of how well they added value in student
learning. They state, however, that their approach could identify only the best and the worst
teachers. As they conducted their study in an experimental setting, they provided the caveat
that replicating findings in the real world would require robust data. They also
recommended that once the worst and the best teachers have been identified using their
method, efforts should be made to identify the best practices for replication in other
classrooms. Thus, these researchers propose that student performance renders itself as a
viable evidence for high-stakes teacher evaluations.
Following Bingham et al. (1991), Wright, Horn, and Sanders (1997) explored
teacher effects on student performance. Given the arguments that non-random assignment of
students leads to a skewed assessment of teacher effectiveness in favor of those who receive
brighter students in their classes, they used a longitudinal dataset and gave special care in
their analyses to intra-class heterogeneity. They applied a mixed-model analysis of variance
to study the teacher effects on student achievement. In 20 of the 30 analyses that they
conducted, they found teacher effects to be larger than any other effects. Based on their
findings, they recommended using student achievement data to assess teachers. Wright et al.
(1997) stated that the “Differences in teacher effectiveness were found to be the dominant
factor in student academic gain…. The use of student achievement data from an
appropriately drawn standardized testing program administered longitudinally and
appropriately analyzed can fulfill these requirements” (p. 66).
Wößmann et al. (2007), employing multi-level modeling techniques on the PISA
2003 dataset, reconfirmed findings from the earlier studies (e.g., from Bishop, 1997, 1999)
and asserted that the external exit exams had positive relationships with student achievement
37
as measured by test scores after controlling for student, family, school, and country level
factors. Their study revealed that the schools using external exit exams in accountability
measures had students performing significantly better than otherwise. Wößmann et al.
(2007) contend that, these relationships, however, were indirect in the case of teachers and
schools, unlike students for whom there were direct incentives such as peer pressure for
learning.
OECD (2010a) found that schools that used standards-based external examinations,
which may be considered as a summative evidence of teacher performance in a high-stakes
evaluation, lead to enhanced (16 points higher) student achievement as measured by test
scores compared to schools that did not use such examinations. The same report states that
standardized tests conducted by schools had no discernible connection with student
performance, something which is true with regard to school performance in many countries.
Using student achievement data for accountability to the public such as through posting in
the media, informing parents about children’s progress, making decisions related to
allocation of resources, or tracking by administrative authorities had mixed relationships
with student performance. Another use of student achievement in the high-stakes
evaluations is in making comparisons across schools. School level accountability measures
such as comparing a school’s performance with district or national performance showed
positive relationships with student achievement (OECD, 2010a). OECD (2010a) also shows
that standardized examinations in combination with external exit exams as evidence of
teacher performance in high-stakes evaluations yielded positive associations with student
achievement. These aspects of accountability and use of achievement data were largely
summative in nature and were, on average, positively related to student achievement in
38
schools (OECD, 2010a). Based on its analyses, OECD (2010a) suggested that schools can
work with their accountability mechanisms to identify the best possible composition for
their accountability systems for optimal student learning outcomes.
Similarly, Goldhaber and Hansen (2010), using administrative data on teachers and
students (grades 4 or 5) showed that employing student test scores as evidence of teacher
performance in decisions relating to tenure (a high-stakes outcome) had significantly
positive effects on student achievement. Restricting their analyses to those teachers whose
performance was observed before and after the tenure, teachers who were not selected for
tenure had student achievement, on average, more than 11% of an SD lower than teachers
who were selected for the tenure. They conclude that using student test scores to measure
teacher effectiveness is a rational method to predict student achievement, and therefore is a
better alternative to assess teacher quality than using observable characteristics such as
holding a bachelor’s or master’s degree. They caution, however, owing to a restricted
sample in many senses, against generalizing the findings to the entire teacher workforce and
designing policies around such high-stakes decisions as granting tenure and retention.
At the same time, mixed or counter evidence and arguments also exist where high-
stakes approaches such as public accountability is either having a mixed effect (e.g., West &
Peterson, 2006), or is considered counterproductive (e.g., Wiggins & Tymms, 2002). West
and Peterson (2006) studied two accountability systems in Florida as parts of Florida’s A+
Plan and No Child Left Behind (NCLB) act. They found that Florida’s A+ Plan was more
effective compared to the NCLB at raising student achievement in schools labeled as “F”
and “D.” The authors attribute this effect to the targeted approach embedded in the A+ plan
where the lowest performing 10% of the schools were labeled as “F” and “D” and the lowest
39
2% schools with the threat of the voucher. For the lowest 2%, the authors argue, the stigma
attached as a failing school worked over and above the threat of the voucher. In contrast, the
NCLB’s accountability approach with its dichotomous categorization of schools as making
or not making adequate yearly progress (AYP) had no significant impact on student
achievement. The authors argue that the NCLB with its less targeted approach where a
relatively large percentage of schools may be labeled as “needing improvement” did not
entail as greater a threat of voucher or stigma of being labeled as low performing. Similarly,
Wiggins and Tymms (2002) studied accountability systems in English and Scottish primary
schools wherein the former published performance indicators in league tables while the
latter did not. They surveyed randomly selected schools in both the education systems to see
the perceptions of the key stakeholders on respective performance management systems.
They found that the English schools perceived their accountability systems more
dysfunctional than the Scottish schools. Also, in the case of English system, schools pursued
narrow targets in the curriculum by focusing more on those students who could potentially
improve schools’ position in the league tables. This showed that a public accountability
approach such as through publishing of league tables as a single proxy indicator of school
performance may have unintended negative implications for teaching and student learning.
The authors argue that these single proxy indicators do not work in isolation in schools.
Various other educational processes such as the pay system, the testing method, and various
cultural elements may interact with each other in complex ways thereby giving rise to
sometimes unwanted outcomes in an otherwise well-intended accountability system. In
other words, it can be imagined that a given system of accountability may or may not be
40
effective contingent upon the type of incentives (high-stakes) involved and particular social
and cultural contexts in which the schools are operating.
In brief, a significant amount of empirical evidence supports the view that attaching
high-stakes consequences to teacher performance may raise student achievement chiefly in
the form of student test scores. However, high-stakes approaches can only serve limited
purposes of evaluation without offering much leeway to schools to improve teachers’
professional practice. Also, as it turns out, simplistic conceptions of measuring teacher
effectiveness using student test scores does not come clear of pit-falls. Scholars (e.g.,
Ravitch, 2010; Darling-Hammond, Amrein-Beardsley, Haertel, & Rothstein, 2012) caution
over relying exclusively on summative outcomes such as student test scores in assessing and
judging teacher effectiveness. According to such perspectives attaching only high-stakes
consequences in teacher evaluations may lead to challenges as regards improving student
achievement. In this connection, some scholars suggest using summative evidence in the
form of student test scores as only one measure in the overall evaluation systems (Baker et
al., 2010; Glazerman et al., 2010; Goe et al., 2008; Mathis, 2012; Rothstein, 2010). These
scholars propose using additional measures in teacher evaluations such as standards-based
approaches including standard instruments of classroom observations, rubrics, and artifacts
of teacher work.
Interactions and student achievement. As stated earlier, high-stakes (and
accountability) and developmental purposes and practices do not always function in
isolation (Isoré, 2009; Looney, 2011). It so happens that in the complex interplay of
processes within schools, different aspects and purposes of teacher evaluation interact with
41
each other and with the other aspects of schooling in complex ways to generate significant
associations with student achievement.
For example, in the study by Wößmann et al. (2007), some of the findings showed
significant interactions where some aspects of schools’ governance such as “autonomy in
formulating budget” turned significantly positive, which independently were not positive,
when they interacted with accountability aspects of schools. Also, autonomy in establishing
salaries standing alone showed negative relations with student achievement while it showed
positive when combined with external exit exams. Similar results appeared in their analysis
when accountability was combined with autonomy in determining course content but the
relationship remained statistically insignificant. Wößmann et al. (2007) associated these
interactions to schools’ opportunistic behavior where an absence of accountability and
presence of autonomy lead to negative implications for student achievement. In contrast,
when school autonomy was combined with some form of incentive through an
accountability system, schools avoided opportunistic behavior and took steps that led to
improved student achievement. On the part of students, standardized examinations standing
alone led to negative relations with student achievement depicting an absence of incentive
for students to perform. However, when standardized examinations were combined with
external exit exams, the interaction turned significantly positive on student achievement.
This leads one to imagine that placement of an incentive along with an accountability
measure in an evaluation system bears positive associations with student achievement.
Schütz et al. (2007) in their study on autonomy, choice, and equity in student
performance showed that some of the accountability measures such as external exit exams
interacted with certain other features such as the socioeconomic (SES) status of students.
42
They found that external exit exams associated with an increase (37.42 beta coefficient) in
student achievement. This coefficient significantly decreased but still remained significant
(3.66 beta coefficient) when external exit exams were combined with students’ SES thereby
suggesting relations of other accountability measures with student achievement (Schütz et
al., 2007). Thus, while there is limited evidence on how various evaluation instruments,
approaches, and purposes interact with each other and with the other facets of schooling, it
can be argued, as does this study, that the different purposes of teacher evaluation do not
work in isolation. Therefore, this study also looks at various interactions as they relate to
different purposes and approaches of teacher evaluations in target countries.
Conceptual Framework and Research Hypotheses
The Figure 1 presents the conceptual framework for the study as well as hypotheses
therein. This framework draws heavily from the past literature as well as my own
understanding and experience of working as a teacher and principal for well over a decade
in a developing world context. It is proposed in the framework that student achievement is a
composite outcome of a mix of many direct and indirect factors at the student, school, and
country levels.
First, Wenglinsky (2002) in his study shows positive effects of classroom practices
on student achievement. This should mean that evaluating classroom practices with the
purpose to identify and to augment best practices should relate to improved student
achievement. In this regard, studies such as Taylor and Tyler (2011) show that teacher
evaluation systems with a focus on identifying best practices and enabling teachers to
improve their practice relate to improved student achievement in schools. Based on this, I
hypothesize that similar dynamics will operate in the 21 OECD countries included in this
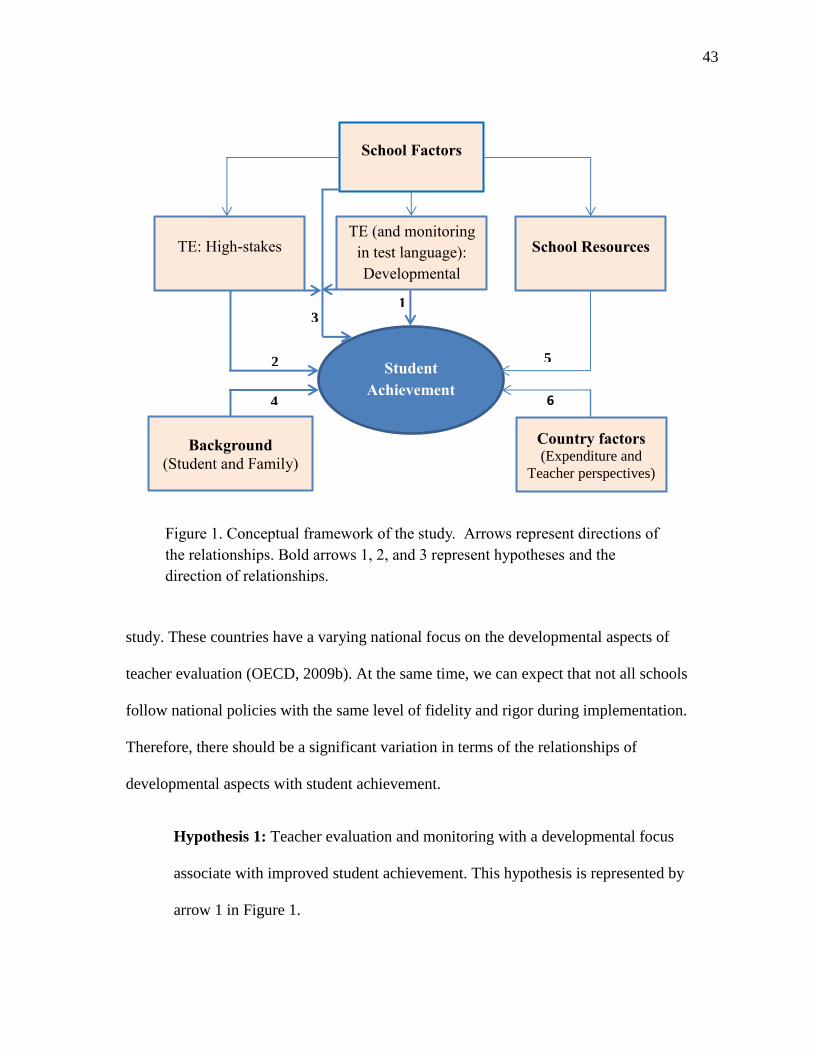
43
study. These countries have a varying national focus on the developmental aspects of
teacher evaluation (OECD, 2009b). At the same time, we can expect that not all schools
follow national policies with the same level of fidelity and rigor during implementation.
Therefore, there should be a significant variation in terms of the relationships of
developmental aspects with student achievement.
Hypothesis 1: Teacher evaluation and monitoring with a developmental focus
associate with improved student achievement. This hypothesis is represented by
arrow 1 in Figure 1.
TE: High-stakes
Student
Achievement
School Factors
School Resources
Country factors (Expenditure and
Teacher perspectives)
TE (and monitoring
in test language):
Developmental
Background
(Student and Family)
1
5
6
3
2
4
Figure 1. Conceptual framework of the study. Arrows represent directions of
the relationships. Bold arrows 1, 2, and 3 represent hypotheses and the
direction of relationships.
44
Second, evidence (e.g., Wößmann et al., 2007) shows that high-stakes teacher
evaluation with accountability purposes is associated with improved student achievement.
Wößmann et al. (2007) found that external exit exams, observations by external observers
and principals, and interactions between external exit exams and standardized tests
associated with improved student achievement in science and mathematics as measured in
the PISA 2003 survey. Evidence like this leads to the second hypothesis of the study. I
hypothesize that a focus on high-stakes in teacher evaluation with the purpose to make
teachers accountable and make critical decisions relating to, for example, financial
remuneration should lead teachers to work harder and perform better in schools. In other
words, teacher evaluation leading to high-stakes consequences should cause teachers to
work hard and raise student achievement.
Hypothesis 2: High-stakes teacher evaluation approaches associate with better
student achievement. This is represented by arrow 2 in Figure 1.
Third, teacher evaluation in schools is a complex phenomenon where various
purposes of evaluation crisscross, overlap, and interact with the other aspects of schooling.
For example, a teacher evaluation conducted for accountability purposes may also have
implications for teachers’ professional development (Looney, 2011). Similarly, previous
studies (Schütz et al., 2007; Wößmann et al., 2007) have shown that the different aspects of
teacher evaluations interact positively with other schooling features thereby creating
positive associations with student achievement. In the light of this evidence, for example, it
can be imagined that the principal’s role in teacher evaluation and appraisal may be
influenced by the tensions generating due to external demands for accountability and
45
internal dynamics of teacher quality and improvement. In sum, we can expect interactions
between various aspects of teacher evaluation and schooling features and their significant
implications for student achievement. This leads to my third hypothesis in the study:
Hypothesis 3: Teacher evaluation practices interact with other schooling aspects
thereby producing positive associations with student achievement. This is
represented by arrow 3 in Figure 1.
Arrows 4, 5 and 6 show relationships between student achievement and different
control variables at student, school and country levels.
46
Chapter 3. DATA AND METHODS
This chapter discusses the datasets, the variables, and the methods of the study. It
describes the two datasets that I have used in this study. It presents and explains the
variables included in different models. It also gives rationale and empirical and theoretical
bases for the variables included in the various regression models. The chapter gives
descriptive statistics such as means, standard deviations, and percentages of the independent
and dependent variables of the study. The methods include discussions of how I have
managed the data such as missing cases and data reduction. The chapter closes with a
discussion of the methods and models employed.
Datasets
This study uses two sources of data. First, it uses part of the PISA survey conducted
by the OECD in 2009 in 65 countries. The PISA is a cross-national, large scale survey
instituted for the first time by the OECD in 2000. The survey is conducted every three years
and includes a paper-pencil test in the three subject areas of Mathematics, Science, and
Reading. In a given cycle, the PISA gives additional emphasis to one of the three subjects
by capturing supplementary information on the subject in the survey. The focus of the PISA
2009 survey was reading. In addition to the paper-pencil tests in the three subjects,
questionnaires on student background, climate, resources and management of the school,
and home learning environment including parental background are administered in the
survey. The student tests are given to a sample of 15-year olds in the sampled schools in
participating countries. An administrator in each test location ensures accurate distribution
of the test kits to the sampled students.

47
The student tests consist of two parts with a first two-hour session on cognitive skills
and knowledge in the three subjects and a half-hour session on background information on
students’ learning habits, attitudes, and motivation to learn. The knowledge and skills tests
explore how well students are able to connect their learning to real-life situations in living
environments. Thus, the tests are holistic: students do not only have to reproduce
knowledge, but they also are able to apply that knowledge in their lives. Therefore, being
holistic, extensive in its scope on educational outcomes, and being cross-national, the PISA
survey gives a detailed and comparative snapshot of how 15 year olds in participating
countries at the end of the compulsory education are ready to face the real world (OECD,
2012). This way, the PISA datasets make it possible for policymakers to identify optimal
factors that can garner higher standards of student performance in schools in cross-national
perspectives.
Second, the study uses information from OECD (2009b) report on the TALIS 2008.
Like the PISA survey, the TALIS is also a cross-sectional and cross-national survey
administered in 2008 to teachers and principals in 22 OECD and 2 partner countries. This
survey consists of extensive information on teachers in target schools. The survey provides
data related to work environment, beliefs, attitudes, and practices of teachers in participating
countries. One of the significant aspects of the TALIS is its extensive coverage of teacher
appraisal and feedback practices in lower secondary schools in the 24 countries. Principals
and teachers in the sampled schools furnish information on how teachers are evaluated in
schools, the criteria used, and the outcomes of teacher appraisal practices. Thus, unlike the
PISA survey which gives only principals’ responses on teacher evaluation practices, the
48
TALIS has a greater outreach by capturing teachers’ perspectives on teacher appraisal
practices.
While the PISA gives only principals’ perspectives on teacher evaluation practices,
the TALIS gives teachers’ perspectives, in addition to principals’, on teacher evaluation
practices and the effects of these practices on teachers’ professional lives. However, both the
surveys have their own downsides. One downside of the TALIS is the absence of student
level information especially student achievement in the survey. This absence of student
achievement data in the survey makes it difficult to draw inferences on how teacher
evaluation practices relate to student achievement in schools. On the other hand, PISA is
limited by an absence of teacher perspectives on how their lives are affected by teacher
evaluation practices and purposes. Therefore, in order to compensate to some degree for
these shortcomings in each survey’s data, I have ventured in this study to use the PISA and
TALIS in conjunction so as to create a robust dataset that can provide an enriched picture of
teacher evaluation practices and purposes in schools. It needs to be noted here that I am
using secondary information on the TALIS that are provided by an OECD report. The
OECD (2009b) report furnishes information in the form of teacher responses captured as
percentages against various items on teacher appraisal and feedback in the TALIS survey
(See Appendices C-E). I am using this information as part of country level variables in the
regression models to control for teachers’ perspectives on teacher appraisal and feedback
practices and purposes.
Sample and Sampling Strategy
The PISA and TALIS surveys consist of complex survey designs which are
multilevel in structure. Except for the Russian Federation, students in the PISA 2009 survey

49
were sampled through a two-stage sampling process with the first stage being the school and
the second stage being students within schools (OECD, 2012). In the case of Russia, the first
stage was region rather than school. Further stratification of the schools was based on
characteristics such as school type, funding, and location (urban/rural). A model assuming
bivariate normal distribution for propensity was used to ensure maximum inclusivity with
exclusion limited between 2-5% in the participating countries (OECD, 2012). A total
number of 475,460 students participated in the survey representing around 26 million young
children in schools in the participating countries and economies.
The study uses part of the PISA 2009 data consisting of 21 countries that make up
the bulk of the sample in the TALIS 2008. The remaining PISA countries have been
dropped from the sample for this study since they were not part of the TALIS 2008 survey
and hence the teacher perspectives could not be used for these countries. Malaysia, Malta,
and the Netherlands that are originally part of the TALIS 2008 survey have also been
dropped from the analysis for various reasons. Malaysia and Malta were not part of the
PISA 2009 survey and have been dropped from the analysis. Furthermore, according to
OECD (2010b), participation in the Netherlands was too low with an un-weighted
participation rate of 16.7% thereby making it impossible to draw parametric inferences
about the target population in the Netherlands. The Table 3.1 gives the number of cases
(212,955) in 8,116 schools in the sample with Iceland having the least (3,646) and Mexico
the most (38,250) number of cases.
As expected of a survey, missing cases were encountered in the sample. These
missing cases were dealt with by list-wise deletion in some cases and dummy coding along
with mean country mean substitutions in the others. List-wise deletion resulted in about
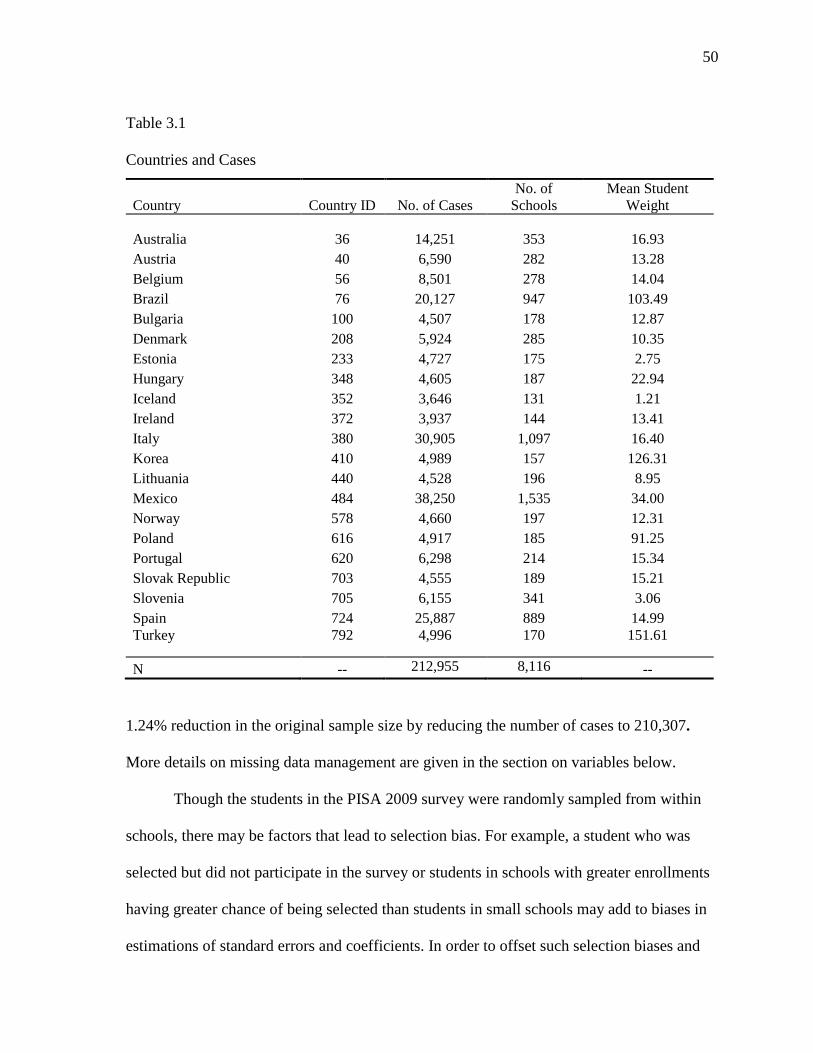
50
Table 3.1
Countries and Cases
Country Country ID No. of Cases
No. of
Schools
Mean Student
Weight
Australia 36 14,251 353 16.93
Austria 40 6,590 282 13.28
Belgium 56 8,501 278 14.04
Brazil 76 20,127 947 103.49
Bulgaria 100 4,507 178 12.87
Denmark 208 5,924 285 10.35
Estonia 233 4,727 175 2.75
Hungary 348 4,605 187 22.94
Iceland 352 3,646 131 1.21
Ireland 372 3,937 144 13.41
Italy 380 30,905 1,097 16.40
Korea 410 4,989 157 126.31
Lithuania 440 4,528 196 8.95
Mexico 484 38,250 1,535 34.00
Norway 578 4,660 197 12.31
Poland 616 4,917 185 91.25
Portugal 620 6,298 214 15.34
Slovak Republic 703 4,555 189 15.21
Slovenia 705 6,155 341 3.06
Spain 724 25,887 889 14.99
Turkey 792 4,996 170 151.61
N -- 212,955 8,116 --
1.24% reduction in the original sample size by reducing the number of cases to 210,307.
More details on missing data management are given in the section on variables below.
Though the students in the PISA 2009 survey were randomly sampled from within
schools, there may be factors that lead to selection bias. For example, a student who was
selected but did not participate in the survey or students in schools with greater enrollments
having greater chance of being selected than students in small schools may add to biases in
estimations of standard errors and coefficients. In order to offset such selection biases and
51
other sampling errors, the student level weights are introduced into the data files. These
student weights produce representative estimates for coefficients on continuous and
categorical variables (OECD, 2012). In the absence of these weights, the results will be
applicable only to the students who are part of the PISA 2009 survey and not to the entire
target population of students. Therefore, this study uses weights to ensure representativeness
to make meaningful and accurate inferences about the target population.
Variables and Missing Data Management
To make the models as parsimonious yet as rigorous as possible, I have selected only
those variables from the literature that had a strong relevance to student achievement. With
the outcome variables being student achievement in science, mathematics, and reading,
predictors are taken from three levels.
The outcome variables in this study are the student test scores in the three subjects of
mathematics, science, and reading. These test scores are based on knowledge and cognitive
tests administered to 15 year olds in the participating countries. Student performance in
these tests is reported as plausible values (PVs) in the PISA survey. Each student in a given
subject has a set of five PVs. Reading has additional PVs to assess students’ digital reading
abilities known as Digital Reading Assessment (DRA). Since not all countries in the study
sample participated in the DRA, this study uses only five PVs in reading which are based on
paper-pencil tests.
PVs are not the actual test scores of students. Instead, through standard procedures
of multiple imputations, a range of scores are generated that depict a range of points that a
student can possibly score. Putting simply, PVs are:
…a representation of the range of abilities that a student might reasonably have.
52
(…). Instead of directly estimating a student’s ability θ, a probability distribution for
a student’s θ, is estimated. That is, instead of obtaining a point estimate for θ…a
range of possible values for a student’s θ, with an associated probability for each of
these values is estimated. Plausible values are random draws from this (estimated)
distribution for a student’s θ. (Wu & Adams, 2002 quoted in OECD, 2009c, p. 43)
Thus, using these PVs as outcome variables, this study predicts student achievement
using main predictors that include principals’ responses to questions in the PISA survey
relating to teacher monitoring, evaluation, and accountability. I have grouped these
predictors into three main categories with the first category having two sub-categories. I will
first describe these categories followed by an account of the empirical bases for selecting
these variables as predictors in my study.
Developmental. This category is further divided into two sub-categories: monitoring
in test language, and principals’ pedagogical role and use of student assessments for
instructional improvement.
Monitoring in test language. The PISA 2009 survey gathered supplementary
information by placing additional emphasis on reading (mentioned here as test language). In
the context of this study, test language is considered to be the same as the language in
reading (see footnote 5 on page 18). The PISA 2009 survey asked principals about their
approaches to monitoring teachers of test language in their schools. They were asked about
the kind of evidence that their schools used to monitor teachers in test language. The set of
variables consisting of principals’ responses to this question have been categorized as
“monitoring in test language.” Principals recorded their responses in “yes/no” format if they
used or not used “student achievement,” “peer reviews,” “principal and staff observations,”
53
and “observations by an external authority” as sources and tools to monitors teachers in test
language. Principals’ “yes” response has been coded as 1.
Earlier studies show that these sources of evidence on teacher performance bear
significant relations with student achievement. Classroom observations by principals and
senior staff were found to relate positively with student achievement (Schütz et al., 2007).
Observations by principals, peers, and external observers have also been found to relate
positively but insignificantly in teacher monitoring practices with accountability purposes
(Wößmann et al., 2007). Wößmann et al. (2007), however, showed that monitoring by
principals was more pronounced than external monitoring where principals’ observations of
teachers became significant at 10.5% of alpha-levels. Only in few instances external
observations showed positive relations with student achievement after controlling for
observations by principals. While Wößmann et al. (2007) looked at teacher monitoring in
mathematics with an accountability lens, I have looked at this group of variables with a
“developmental” lens. As defined in the introductory chapter, “monitoring” is on-going
tracking of the progress towards set goals (DAC, n.d.; UNDP, 2009). This means that the
objective of monitoring is to assess the direction and mode of progress so as to make
necessary adjustments down the line to ensure goal achievement. In this sense, monitoring
has a developmental purpose more than accountability.
Principals’ pedagogical role and the use of student assessments for instructional
improvement. This category includes items that seek information from principals on
developmental approaches to assessing teachers and finding ways to improve teacher
practice. These items capture principals’ categorical responses to the question if student
assessments are used to improve instruction in their schools. Principals’ “yes” response is
54
coded as 1. It also consists of items that ask principals if s/he observes teachers in
classrooms and if s/he suggests teachers to develop professionally. In this category, the
predominant tools that are of interest are use of student assessments to improve instruction
and classroom observations by principals. Additionally, since classroom observations
should lead to an action by principals such as arranging for professional development of
teachers, two additional items have been included regarding principals’ role in teachers
professional development. These include principals suggesting teachers for improvement
and principals informing teachers about possibilities for updating their knowledge and skills.
Principals responded on a 4-point Likert scale as: 1=Never, 2=Seldom, 3=Quite often,
4=Very often. Responses 3 and 4 are linearly coded as 1.
Previous studies show that the items included in the developmental category have
been found to relate significantly to student achievement. For example, Feldman and Tung
(2001) studied Data Based Inquiry and Decision Making (DBDM) in six schools. They
found that the use of student data by teachers and schools related positively with student
achievement in these schools. Wayman and Stringfield (2006) also found that the use of
technology in making sense of student data resulted in improved student performance.
These studies indicate the educational utility of using student achievement data in
educational decision making. This utility can also be construed of as important in evaluating
teacher performance in schools. Furthermore, classroom observations in standards-based
teacher evaluations have been found to relate positively to student achievement. For
example, Kimball et al. (2004) in their study found positive and significant relationships
between teacher evaluation ratings and student achievement. However, such relationships
were not significant in all grades. Coefficients were positive only in reading in grade 4 and
55
in all tests in grade 5. Other studies found moderately positive relations between student
achievement and teacher evaluation using standards measures such as classroom
observations based on pre-defined rubrics (e.g., Kimball et al., 2004; Milanowski, 2004;
Milanowski et al., 2004; Sartain et al., 2011; Taylor & Tyler, 2011; Tyler et al., 2010).
While these studies showed positive links between standard measures of teacher
performance and student achievement, Holtzapple (2003) highlights that teacher evaluations
involving classroom observations through standard rubrics successfully predicted
performance only at the extremes (unsatisfactory and distinguished) of the ratings. In the
middle ranges of the performance ratings the approach was not as effective (Holtzapple,
2003). Thus, there is significant empirical base that identifies positive though at best mixed
relations between student achievement and the developmental approaches to evaluating
teachers.
High-stakes. This category includes items such as the use of student assessments to
evaluate teachers and to judge their effectiveness, if student assessments are tracked by an
external authority, and if such assessments are posted publicly. Principals’ “yes” response is
coded as 1. Theoretically, and in most cases practically, such uses of student assessments
carry high-stakes outcomes for teachers in their evaluations. Therefore, this category has
been named as “high-stakes.” Studies show that the use of student achievement and
assessments as evidence of teacher performance in teacher evaluations associate positively
with student achievement (Bingham, Heywood, & White, 1991; Goldhaber & Hansen,
2010; OECD, 2010a; Wößmann et al., 2007). There is also evidence that such use of student
assessments does not always lead to positive relations OECD (2010a). According to OECD
(2010a), external exams had positive effects on student test scores whereas standardized
56
tests conducted internally by schools had no noticeable relationship with student test scores.
In their study of students of grades 4 and 5, Goldhaber and Hansen (2010) find that student
test scores used as evidence of teacher performance in high-stakes teacher evaluations
showed significantly positive relations with student achievement. Similarly, accountability,
including public accountability as an approach in evaluations in schools has been found to
have mixed effects OECD (2010a). Furthermore, mixed or counter evidence and arguments
have also been suggested in other studies where the use of accountability in general does not
always lead to improved student achievement or expected outcomes (e.g., West & Peterson,
2006; Wiggins & Tymms, 2002).
Interactions: As Looney (2011) mentions, high-stakes purposes of teacher
evaluation function in a crisscross fashion with the developmental purposes of it. Also,
various schooling features have been found to interact with each other to produce positive
relations with student achievement (Schütz et al., 2007; Wößmann et al., 2007). Thus, in the
light of such empirical evidence, I have produced three interaction terms with the
assumption that teacher evaluation practices will create meaningful interactions with other
schooling features.
The first interaction term is created between the relative importance of classroom
observations as a tool in teacher appraisal and feedback and parents being informed about
the progress of their children. Research (e.g., Fan & Chen, 2001; Hoover-Dempsey &
Sandler, 1997; Ingram, Wolfe, & Lieberman, 2007; Jeynes, 2012; Sui-Chu & Willms, 1996)
suggests that parents play a significant role in the education of their children. Parents
involve themselves in schooling of their children for different reasons. These reasons may
include their belief about parental role in children’s education, parents’ sense of efficacy in
57
enabling children to succeed, parents’ belief that parental involvement will improve
children’s performance, and parents’ perceptions of the way children and schools like them
to get involved in schooling (Hoover-Dempsey & Sandler, 1997). Empirical evidence also
suggests that parental role establishes positive relationships with student achievement in
different school settings (e.g., Fan & Chen, 2001; Ingram et al., 2007; Jeynes, 2012; Sui-
Chu & Willms, 1996). It is with this theoretical and empirical grounding that this interaction
term scrutinizes if informing parents, as one form of accountability of teacher performance,
had any link with classroom observations becoming more important in teacher appraisal
practices in schools. Classroom observations are a predominant tool in teacher evaluations
across countries (Isoré (2009). Classroom observations are also considered to be one of the
most effective tools in probing within-classroom processes and interactions (Danielson &
McGreal, 2000). Therefore, I assume that when parents are involved in the education of
their children and when such an involvement also includes aspects of accountability, it
should lead principals to be mindful of the quality of teaching practices in classrooms.
Principals would be closely monitoring teachers so that their schools are able to present to
parents quality reports regarding the performance of their children.
The second interaction term is created between importance of classroom observation
as a tool in teacher appraisal and feedback and principal being responsible for making salary
changes. Wößmann et al. (2007) found positive interactions between “autonomy in
formulating budget” and accountability practices in schools. They also found that principals’
autonomy in schools interacted positively with external exits exams. This interaction points
towards a possible underlying dimension where principals’ authority to make changes in
teachers’ salaries may convey a “high-stakes” message to the teachers. This “high-stake”
58
may play in the form of classroom observations becoming a tool to push teachers for
working hard to produce better student achievement. Accordingly, teachers may resort to
classroom practices that can produce better student achievement and hence a favorable
outcome in their evaluations. Therefore, this interaction explores any relationship between
classroom observations being significant in terms of student achievement when principals in
schools hold some level of authority involving high-stakes implications for teachers. In
other words, this term explores any effect(s) of principals having a significant authority in
making changes in teachers’ salaries and if this factor is important in making classroom
observations an effective teacher evaluation tool in relation to student achievement.
The third interaction term consists of principals observing classes “often” and “very
often” and school type being “private.” OECD (2010a) shows that while there is no
significant relationship between reading performance and governance type after controlling
for socioeconomic factors, there is a significant difference in the index of school principals’
leadership between public and private schools. The index of school leadership evaluates
principal’s pedagogical role in improving quality of instruction and overall learning
environment in schools. Therefore, the aim of this interaction is to uncover any relationship
between principals’ observations of teachers in classes as a teacher development tool and
school type being private with the underlying assumption that principals are more assertive
as reflected in a higher index for their leadership in private schools compared to the public
schools.
Control variables at student, school, and country levels. This study uses a number
of controlling factors that are significant with respect to student achievement. At the student
level, student’s family background such as socioeconomic status, individual background
59
such as gender, grade (Fuchs & Wößmann, 2007), home language if it is other than test
language, and immigration status whether the student is a first generation immigrant (Zhang
& Lee, 2011) have been included in the study models. School level control variables include
school type, student teacher ratio (Demir, Kılıç, & Ünal, 2010; Zhang & Lee, 2011),
percentage of girls, proportion of qualified teachers, and percentage of computers connected
with the internet, and shortage of teachers (Zhang & Lee, 2011). At the country level,
dollars spent on education (obtained as a product of GDP and percent expenditure on
education) and teacher evaluation criteria and outcomes have been included in the models.
The teacher evaluation criteria and outcomes include 8 and 6 variables respectively that are
based on information from the OECD (2009b) report on the TALIS 2008 (see Appendices
C, D, & E). These criteria and outcomes are converted into three components through
principal component analysis. Indices are created through regressions scores (See the
section on data reduction below). Complete details on measurement, definitions, and coding
schemes can be found in Appendix F for all the variables included in the study.
Missing data management. Like any survey, the PISA survey also suffers from
issues of missing cases. The PISA 2009 being a representative survey of the target
population, this study assumes these missing cases to be MCAR (Missing Completely at
Random). With this assumption, this study approached missing cases in two ways. First,
missing cases in small proportions in control variables were dropped from the analysis
through a list-wise deletion to keep the balance in the sample design. All other missing cases
were first managed through Multiple Imputations (MIs). While every missing data
management approach has its own pros and cons, MI has benefits over other approaches
such as list-wise deletions. MIs give a number of plausible values for missing cases based
60
on the number of imputations. These plausible values carry the uncertainty and errors
associated with the missing values thereby giving more stable estimations (Rubin, 1987).
With these benefits of the MIs, I ran five imputations for each missing variable followed by
running the models containing five sets of multiply imputed datasets and recorded the
results. However, the MI approach did not work out for technical reasons. One drawback of
running the regression analyses on multiply imputed datasets using standard procedures
recommended by the OECD resulted in non-reporting of average r-square values in the
Stata® outputs. In order to deal with this issue, I followed a second approach to manage the
missing data. First, a total of 2,648 cases were dropped from the analysis. These missing
cases came from only two control variables—student grade (663 cases) and from index of
socioeconomic and cultural status of students (1,985 cases). This list-wise deletion of cases
reduced the original sample by 1.24%. In all other instances, dummy variables were created
for missing followed by country mean substitutions in the original missing cases. The
models were re-run using the new datasets. The results of both the approaches—MI and the
dummy variables and country mean substitutions—returned similar results in terms of the
direction and significance of the coefficients. However, the advantage with the dummy
variables and country mean substitutions was the retrieval of r-square statistic to see the fit
of the models. Therefore, only the results produced through dummy variables and country
mean substitution have been reported and discussed in this dissertation.
Descriptive statistics. The Table 3.2 gives weighted descriptive statistics such as
means and standard deviations for the dependent, main independent, and control variables.
The Table 3.2 shows in the first block the dependent variables which are student test scores
in the knowledge and cognitive tests administered in the PISA 2009 survey. According to
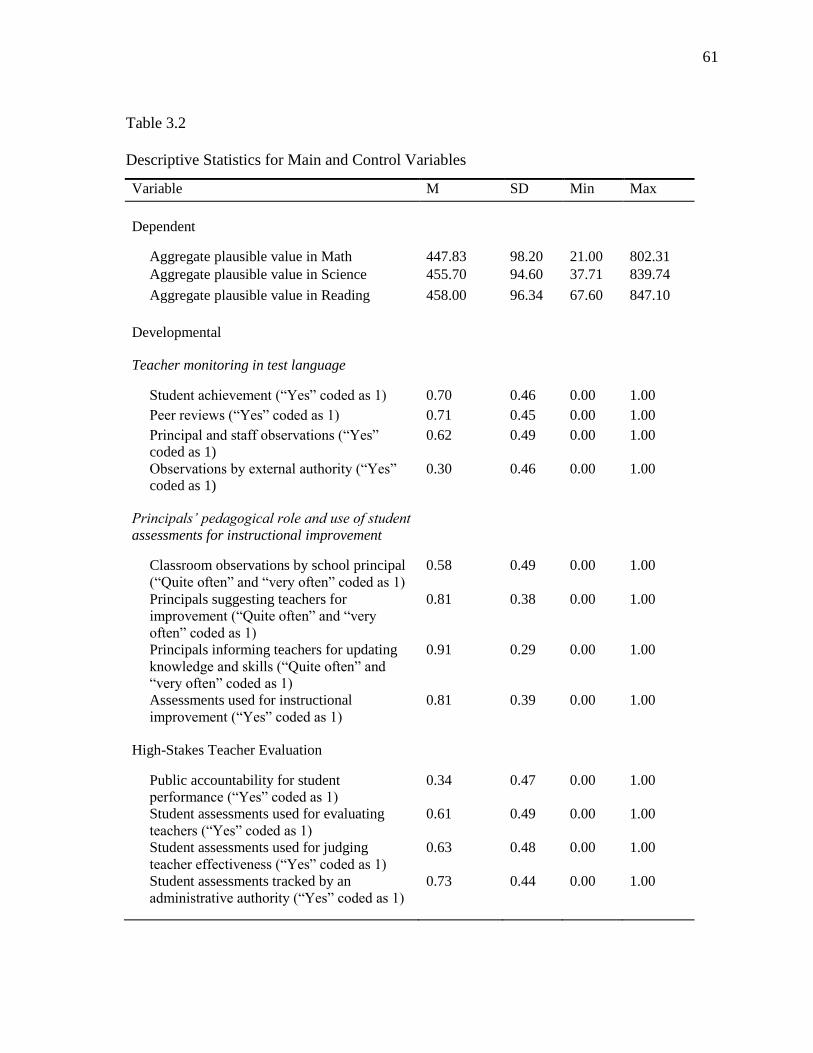
61
Table 3.2
Descriptive Statistics for Main and Control Variables
Variable M SD Min Max
Dependent
Aggregate plausible value in Math 447.83 98.20 21.00 802.31
Aggregate plausible value in Science 455.70 94.60 37.71 839.74
Aggregate plausible value in Reading 458.00 96.34 67.60 847.10
Developmental
Teacher monitoring in test language
Student achievement (“Yes” coded as 1) 0.70 0.46 0.00 1.00
Peer reviews (“Yes” coded as 1) 0.71 0.45 0.00 1.00
Principal and staff observations (“Yes”
coded as 1)
0.62 0.49 0.00 1.00
Observations by external authority (“Yes”
coded as 1)
0.30 0.46 0.00 1.00
Principals’ pedagogical role and use of student
assessments for instructional improvement
Classroom observations by school principal
(“Quite often” and “very often” coded as 1)
0.58 0.49 0.00 1.00
Principals suggesting teachers for
improvement (“Quite often” and “very
often” coded as 1)
0.81 0.38 0.00 1.00
Principals informing teachers for updating
knowledge and skills (“Quite often” and
“very often” coded as 1)
0.91 0.29 0.00 1.00
Assessments used for instructional
improvement (“Yes” coded as 1)
0.81 0.39 0.00 1.00
High-Stakes Teacher Evaluation
Public accountability for student
performance (“Yes” coded as 1)
0.34 0.47 0.00 1.00
Student assessments used for evaluating
teachers (“Yes” coded as 1)
0.61 0.49 0.00 1.00
Student assessments used for judging
teacher effectiveness (“Yes” coded as 1)
0.63 0.48 0.00 1.00
Student assessments tracked by an
administrative authority (“Yes” coded as 1)
0.73 0.44 0.00 1.00
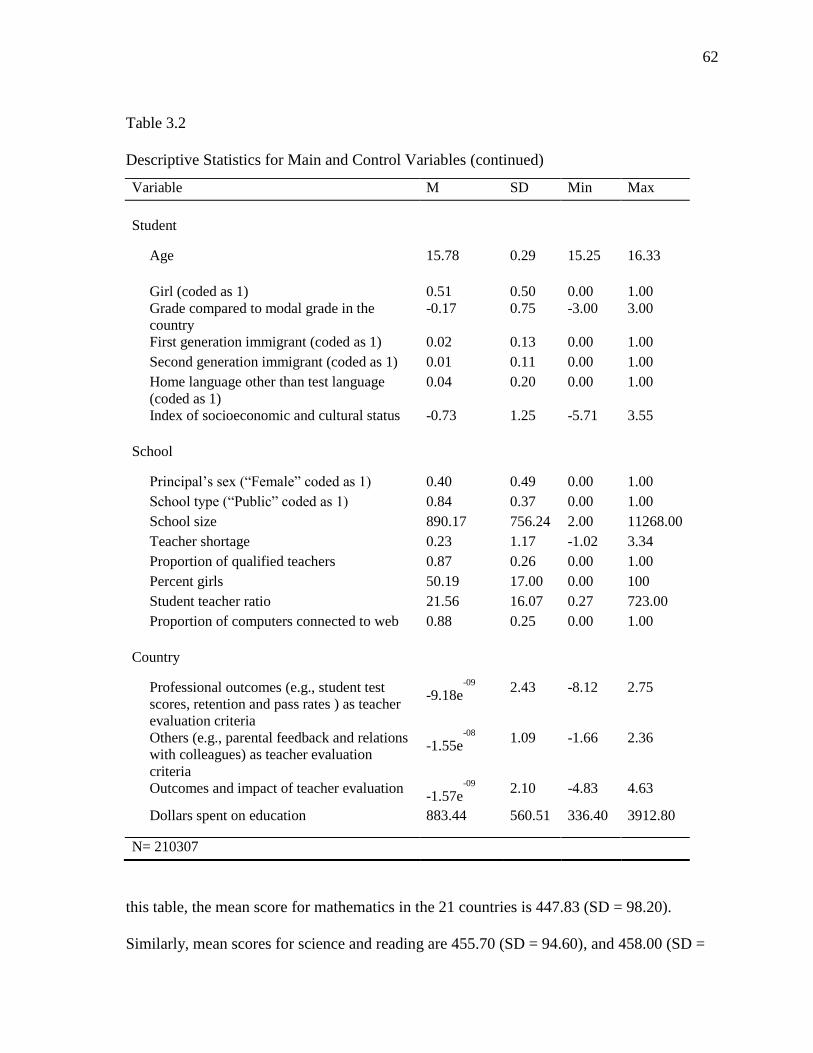
62
Table 3.2
Descriptive Statistics for Main and Control Variables (continued)
Variable M SD Min Max
Student
Age 15.78 0.29 15.25 16.33
Girl (coded as 1) 0.51 0.50 0.00 1.00
Grade compared to modal grade in the
country
-0.17 0.75 -3.00 3.00
First generation immigrant (coded as 1) 0.02 0.13 0.00 1.00
Second generation immigrant (coded as 1) 0.01 0.11 0.00 1.00
Home language other than test language
(coded as 1)
0.04 0.20 0.00 1.00
Index of socioeconomic and cultural status -0.73 1.25 -5.71 3.55
School
Principal’s sex (“Female” coded as 1) 0.40 0.49 0.00 1.00
School type (“Public” coded as 1) 0.84 0.37 0.00 1.00
School size 890.17 756.24 2.00 11268.00
Teacher shortage 0.23 1.17 -1.02 3.34
Proportion of qualified teachers 0.87 0.26 0.00 1.00
Percent girls 50.19 17.00 0.00 100
Student teacher ratio 21.56 16.07 0.27 723.00
Proportion of computers connected to web 0.88 0.25 0.00 1.00
Country
Professional outcomes (e.g., student test
scores, retention and pass rates ) as teacher
evaluation criteria
-9.18e-09
2.43 -8.12 2.75
Others (e.g., parental feedback and relations
with colleagues) as teacher evaluation
criteria
-1.55e-08
1.09 -1.66 2.36
Outcomes and impact of teacher evaluation -1.57e
-09
2.10 -4.83 4.63
Dollars spent on education 883.44 560.51 336.40 3912.80
N= 210307
this table, the mean score for mathematics in the 21 countries is 447.83 (SD = 98.20).
Similarly, mean scores for science and reading are 455.70 (SD = 94.60), and 458.00 (SD =
63
96.34) respectively. These descriptive statistics have been obtained on the aggregate means
of all five plausible values for all students in each of the tested subject.
The first sub-category under the “developmental” block in the Tables 3.2 and 3.3
consists of the independent variables that seek evidence on teacher performance in
monitoring the practice of teachers in test language. A good majority of students was
enrolled in schools where principals (M = 0.70, SD = 0.46) responded as having used
student achievement data over the last year to monitor teachers in test language. The least
used approach (M = 0.30, SD = 0.46) was observations by external authority. As the Table
3.3 shows, 69.96% of students were enrolled in schools that used student achievement data
in teacher evaluations as against only 30.26% students enrolled in schools with observations
by an external authority as a means to monitor teachers in test language. Schools using peer
reviews and principal and staff observations had 71.30% and 62.07% (SD = 0.49) students
enrolled respectively (see Table 3.3).
The second sub-category under the “developmental” blocks in Tables 3.2 and 3.3
shows the descriptive statistics on principals’ pedagogical role as it relates to teacher
evaluation and use of student assessments for instructional improvement. On average,
57.65% of the students studied in schools where principals observed teachers in classes
“often” or “very often” (Table 3.3). On the contrary, only 6.94% students were enrolled in
schools where principals never observed teachers in classes. This shows classroom
observation as somewhat a favorite mode that principals use to assess teachers’ performance
in classes, and to use information from such observations to evaluate teachers and possibly
to arrange and suggest teachers for professional development. Principals were also found to
often suggest teachers for improvement in the latter’s practice with a mean response of 0.81
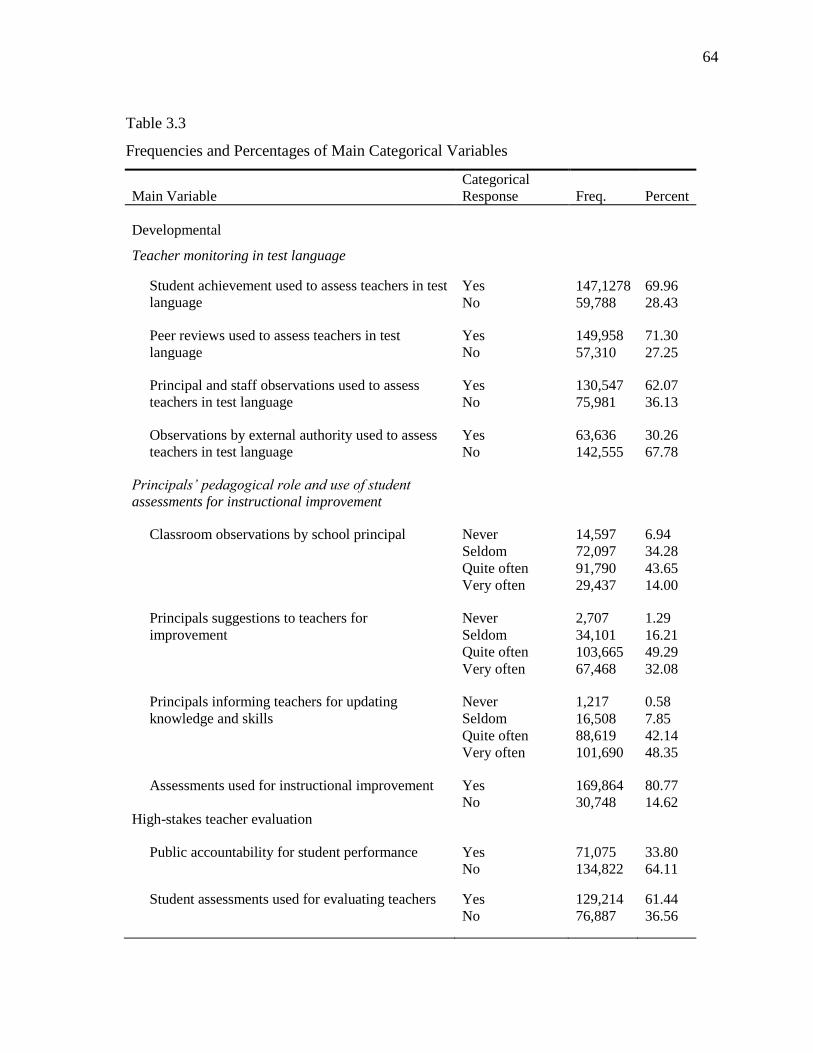
64
Table 3.3
Frequencies and Percentages of Main Categorical Variables
Main Variable
Categorical
Response Freq. Percent
Developmental
Teacher monitoring in test language
Student achievement used to assess teachers in test
language
Yes 147,1278 69.96
No 59,788 28.43
Peer reviews used to assess teachers in test
language
Yes 149,958 71.30
No 57,310 27.25
Principal and staff observations used to assess
teachers in test language
Yes 130,547 62.07
No 75,981 36.13
Observations by external authority used to assess
teachers in test language
Yes 63,636 30.26
No 142,555 67.78
Principals’ pedagogical role and use of student
assessments for instructional improvement
Classroom observations by school principal Never 14,597 6.94
Seldom 72,097 34.28
Quite often 91,790 43.65
Very often 29,437 14.00
Principals suggestions to teachers for
improvement
Never 2,707 1.29
Seldom 34,101 16.21
Quite often 103,665 49.29
Very often 67,468 32.08
Principals informing teachers for updating
knowledge and skills
Never 1,217 0.58
Seldom 16,508 7.85
Quite often 88,619 42.14
Very often 101,690 48.35
Assessments used for instructional improvement Yes 169,864 80.77
No 30,748 14.62
High-stakes teacher evaluation
Public accountability for student performance Yes 71,075 33.80
No 134,822 64.11
Student assessments used for evaluating teachers Yes 129,214 61.44
No 76,887 36.56
65
Table 3.3
Frequencies and Percentages of Main Categorical Variables (Continued)
Main Variable
Categorical
Response Freq. Percent
Student assessments used for judging teacher
effectiveness
Yes 132,391 62.95
No 67,064 31.89
Student assessments tracked by an administrative
authority Yes
153,685 73.08
No 51,277 24.38
Note: Frequencies for missing cases have been omitted from Table 3.3.
(SD = 0.38) as shown in the Table 3.2. This mean reflects in 81.37% of the students enrolled
in schools where principals often or very often suggested teachers for improvement.
Similarly, 90.49% (M = 0.91, SD = 0.29) students were enrolled in schools where principals
often or very often informed teachers about possibilities for updating their knowledge and
skills. Regarding the use of student assessments for instructional purposes which may
essentially has a developmental focus from teacher evaluation perspectives, 80.77% (M =
0.81, SD = 0.39) of the students studied in schools where principals claimed that they used
student assessments for instructional purposes (see Tables 3.2 and 3.3). This highlights a
predominance of developmental approaches to teacher evaluation in schools in 21 countries.
The third blocks in Tables 3.2 and 3.3 give descriptive information on high-stakes
approaches to teacher evaluation in the 21 countries. Relatively fewer students (33.80%)
were enrolled in schools with public accountability in place. Accordingly, the mean
response for this categorical variable stood at 0.34 (SD = 0.47). On the contrary, the
predominant modes of high-stakes approaches to teacher evaluation were through the use of
assessments for teacher evaluation (M = 0.61, SD = 0.49), tracking of assessments by an
66
administrative authority (M = 0.73, SD = 0.44), and judging teacher effectiveness (M =
0.63, SD = 0.48). Student enrollment in schools with these practices remained 61.44%,
73.08% and 62.95% respectively for each of the high-stakes teacher evaluation approach.
Blocks 5, 6, and 7 in Table 3.2 show means and standard deviations for the
independent control variables at student, school, and country levels. As the Table 3.2 shows,
mean student age in years in the 21 countries is 15.78 (SD = 0.29). Girls, coded as 1,
slightly outnumber boys by a margin of 1 percent (M = 0.51, SD = 0.50). Mean modal grade
for these countries comes out to be -0.17. Modal grade was computed as an index to capture
between country variations (OECD, 2012). A mean of -0.17 (SD = 0.75) shows that the
average modal grade for students in the 21 countries was below the expected modal grade
which is given a value of 0 on the modal grade index. The index of socioeconomic and
cultural status shows a mean of -0.73 (SD = 1.25). Immigration status of students was coded
as 1 if they were first generation immigrants. Similarly, second generation immigrant status
was also coded as 1. Regarding immigration status, 2% (SD = 0.13) of students were first
generation immigrants in the 21 countries. These immigrant students and their parents both
were born outside the country in which students took the PISA tests. In addition, 1% (SD =
0.11) of students had second generation immigrant status, meaning that these students, and
not their parents, were born in the country of assessment. Home language, if it was other
than test language, was coded as 1. For 4% (SD = 0.2) of students, home language was other
than the test language.
As the Table 3.2 shows, the large majority (84%, SD = 0.37) of students is enrolled
in public schools. Schools with a female principal enrolled 40% (SD = 0.49) of students.
Sex of the principal when it was female was coded as 1. Similarly, school type being public
67
was also coded as 1. The school size shows a huge variation with a mean enrollment of 890
students. With this average enrollment, average student teacher ratio stands at a 21.56 (SD =
16.07). The PISA 2009 survey asked principals about other aspects of schooling as well
such as teacher shortage. Teacher shortage measured on an index showed a mean of 0.23
(SD = 1.17) suggesting only a moderate shortage of teachers in the sampled schools. Eighty-
seven percent (SD = 0.26) of the students were enrolled in schools where teachers had
qualifications equivalent to International Standard Classification of Education (ISCED) 5A
level.7 With respect to the technological resources, 88% (SD = 0.25) of students studied in
schools where computers were connected to the Internet.
As the Table 3.2 shows, there are four country control variables. Three of the four
variables are derived as components through exploratory Principal Component Analysis (see
the next section on data reduction). These components are formed using findings on teacher
responses on items related to teacher appraisal criteria and outcomes in the TALIS 2008 as
reported in OECD (2009b). Indices have been generated for all three components through
regression after running the component analysis. The first component has been named as
“professional outcomes” that includes such teacher evaluation criteria as student test scores
and retention and pass rates. The second component has been named as “others.” This
7 Proportion of qualified teachers is defined as teachers having ISCED 5A level of
qualifications. ISCED 5A qualifications are equivalent to bachelors, masters or equivalent
qualifications designed to provide theoretical grounding to students in subjects of their
interest so as to enable them to gain entry to more advanced, research oriented tertiary level
of education.
68
component carries two teacher evaluation criteria namely feedback from parents and
relations with colleagues. The third component has been named as “teacher evaluation
outcomes and impact” that captures information on such “high-stakes” consequences as
changes in teachers’ salaries and advancement in their careers. The last variable shows that
an average of 883.44 (SD = 560.51) dollars per capita income per child was spent on
education in these countries.
The Table 3.4 gives correlations among the main categorical predictors of the study.
The table shows low to moderate correlations among different predictors. The two variables
that are least correlated (r = -.03) are principals informing teachers for updating knowledge
and skills and observations by external authority in monitoring teachers of test language. On
the contrary, the two most correlated (r = .41) variables are the student assessments used for
evaluating teachers and judging teacher effectiveness. These two variables also moderately
correlate with student achievement used as an evidence in monitoring of teachers in test
language with correlations of .33 and .31 respectively. This is intuitive since in all these
approaches of monitoring and evaluation, the primary source of evidence for teacher
performance is student performance in different types of assessments. With these moderate
values we can still keep these predictors in the models for data analysis.
Similarly, principals observing teachers in classes shows moderate positive
correlations with principals suggesting teachers for improvement (r = .33) and principals
informing teachers about updating knowledge and skills (r = .22). Likewise, principals
suggesting teachers for improvement and informing them about possibilities for updating
their knowledge also have a moderately positive correlation (r = .38). Another moderate
correlation (r = .40) can be seen between principals observing classes often and very often
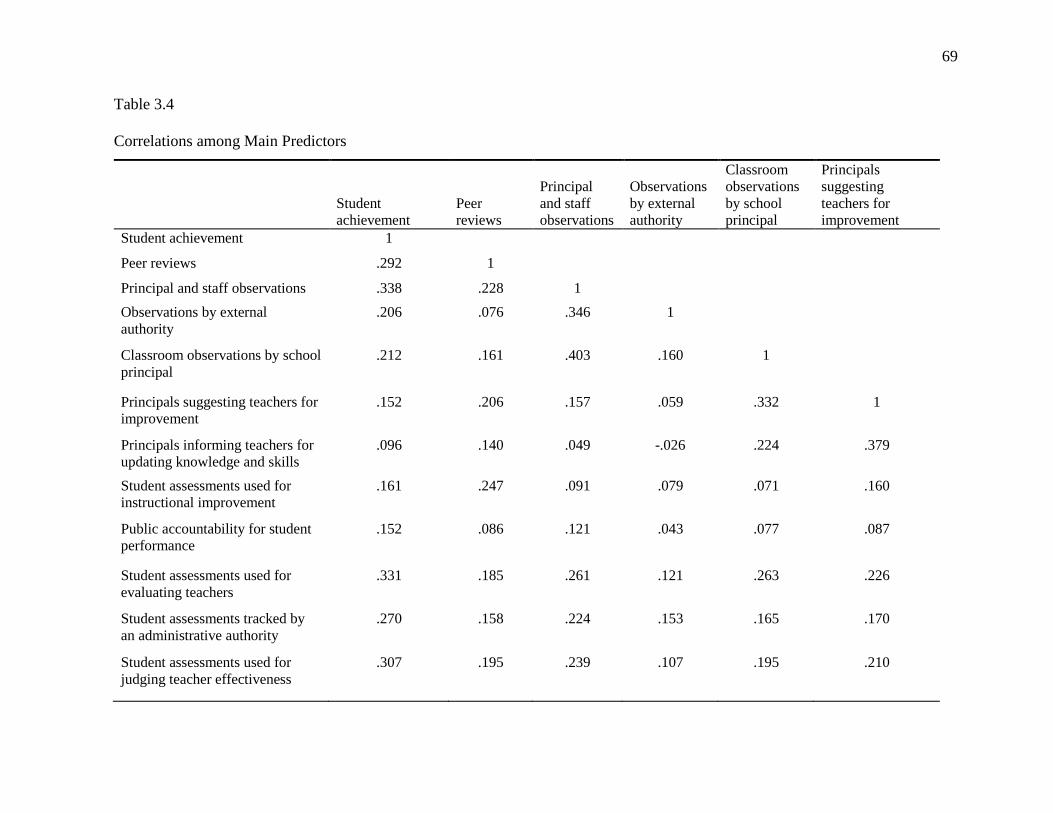
69
Table 3.4
Correlations among Main Predictors
Student
achievement
Peer
reviews
Principal
and staff
observations
Observations
by external
authority
Classroom
observations
by school
principal
Principals
suggesting
teachers for
improvement
Student achievement 1
Peer reviews .292 1
Principal and staff observations .338 .228 1
Observations by external
authority
.206 .076 .346 1
Classroom observations by school
principal
.212 .161 .403 .160 1
Principals suggesting teachers for
improvement
.152 .206 .157 .059 .332 1
Principals informing teachers for
updating knowledge and skills
.096 .140 .049 -.026 .224 .379
Student assessments used for
instructional improvement
.161 .247 .091 .079 .071 .160
Public accountability for student
performance
.152 .086 .121 .043 .077 .087
Student assessments used for
evaluating teachers
.331 .185 .261 .121 .263 .226
Student assessments tracked by
an administrative authority
.270 .158 .224 .153 .165 .170
Student assessments used for
judging teacher effectiveness
.307 .195 .239 .107 .195 .210
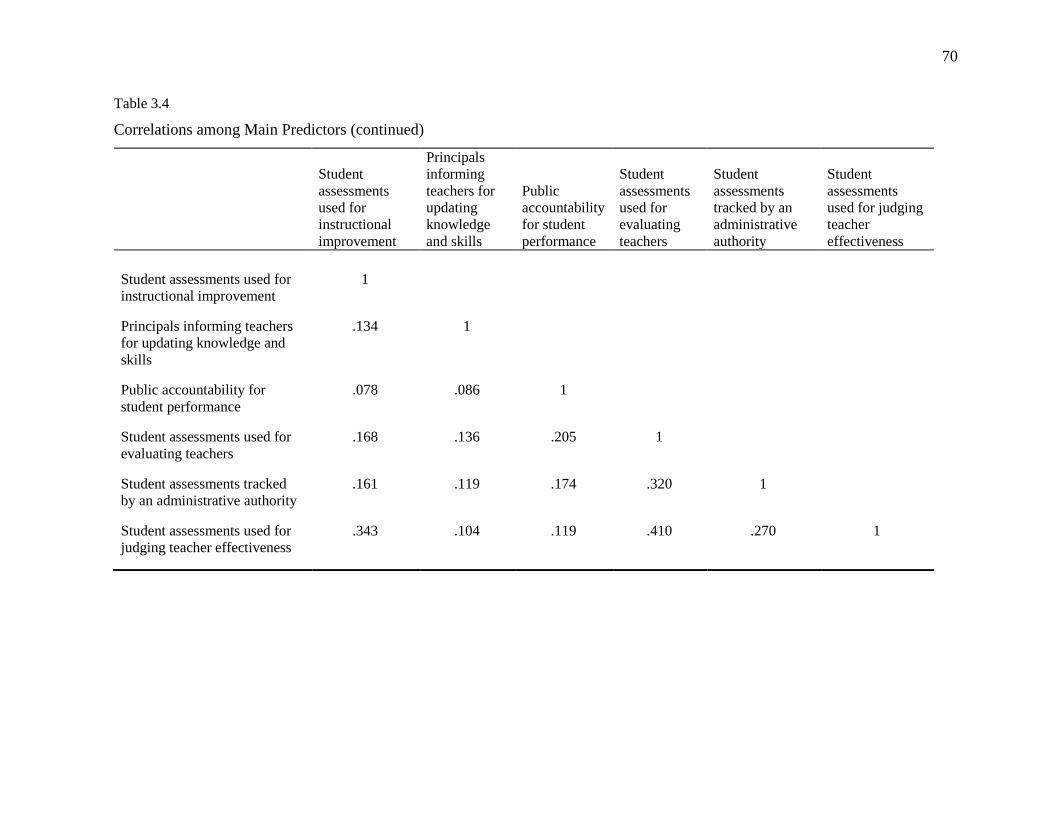
70
Table 3.4
Correlations among Main Predictors (continued)
Student
assessments
used for
instructional
improvement
Principals
informing
teachers for
updating
knowledge
and skills
Public
accountability
for student
performance
Student
assessments
used for
evaluating
teachers
Student
assessments
tracked by an
administrative
authority
Student
assessments
used for judging
teacher
effectiveness
Student assessments used for
instructional improvement
1
Principals informing teachers
for updating knowledge and
skills
.134 1
Public accountability for
student performance
.078 .086 1
Student assessments used for
evaluating teachers
.168 .136 .205 1
Student assessments tracked
by an administrative authority
.161 .119 .174 .320 1
Student assessments used for
judging teacher effectiveness
.343 .104 .119 .410 .270 1
71
and principals and staff observing classes in monitoring practice of test language teachers.
This suggests that principals who frequently observe classes may do so in general for all
subjects including reading. Another important moderate correlation is found between
student assessments used for instructional improvement and student assessments used for
judging teacher effectiveness. These two variables establish a correlation of .34 with one
another. The tracking of student assessments also establishes moderate correlations with the
use of student assessments for evaluating teachers (r = .32) and student assessments used for
judging teacher effectiveness (r = .27).
Based on these moderate correlations, it is logical to include these variables in the
regression models of this study. All these correlations have been kept under Variance
Inflation Factor (VIF) check for any multicollinearity issues. No significant
multicollinearity issues were noted with a mean VIF of 2.21.
Data Reduction
As can be seen in the Appendices C-E, the information taken from the TALIS 2008
to represent country level constructs of teacher evaluation falls into some 30 variables. It
can be imagined that a number of variables may be measuring the same phenomenon as
regards teachers’ appraisals and feedback suggesting underlying dimensions that cut across
this full range of items. Such an assumption holds valid in the real life of a school where
various aspects of teacher evaluation in schools often do not work in isolation. Complexity
of the school environment allows us to imagine many of these aspects to be correlated in
significant ways. Such underlying dimensions can be uncovered through a factor or
component analysis (Thomson, 2004). This study uses principal component analysis to see
any theme(s) cutting across this long list of variables coming from the TALIS 2008. The
72
purpose of the component analysis was also to reduce the number variables into viable
components that can then be used within the available degrees of freedom in the regression
analyses so as to make more logical connections between teacher appraisal practices and
student achievement. Two separate principal component analyses were carried out followed
by score generation for each component.
The first component analysis and score generation was run on teacher appraisal
criteria wherein 15 teacher evaluation criteria (see Appendix C) were subjected to this
procedure. The TALIS 2008 originally asked teachers on 17 criteria used for their appraisal
and feedback. However, I dropped two criteria “teaching students with special learning
needs,” and “teaching in a multicultural setting” from the component analysis for the reason
that OECD (2009b) reported that these two variables received relatively low importance in
teacher appraisal and feedback. The TALIS 2008 asked teachers how important were the 15
criteria when they received their appraisal and/or feedback. Teachers responded on a scale
of 1-5 with 1 representing “I do not know if it was considered” and 5 representing
“considered with high importance.” OECD (2009b) gives the last two responses “considered
with moderate importance,” and “considered with high importance” as percentages of
teachers who reported so.
Before carrying out the component analysis, I ran a simple correlation on these
variables which showed that some items were highly correlated with one another. This
meant that the information captured by one variable was essentially the same as captured by
the second variable in the highly correlated pair. This also meant that keeping both the
highly correlated variables in the analysis would lead to inflation of variance explained by
these variables as well as redundancy of the information contained in the resulting
73
components. Therefore, one variable from each pair of the variables consisting of
correlations greater than .95 have been dropped from further component analysis. This gave
to a total of 8 variables in criteria on teacher appraisal and component analysis has been run
accordingly.
The Appendix G gives the results of component analysis and score generation for
these variables. As the Table G1 in Appendix G shows, two components gave Eigen values
(EV) greater than 1. The first component carried an EV of 5.97 while the second carried an
EV of 1.15. Cumulatively, these two components explained 89% of the variance attributed
to the 8 variables in teacher appraisal criteria and outcomes. These components were
subjected to promax factor rotation. The Table G2 shows the factor rotations of the 8 criteria
that teachers rated as important or highly important in their evaluations. Six of these criteria
were loaded onto the first component with component loadings varying between 0.34 and
0.39. These criteria included student test scores, retention and pass rates, other student
learning outcomes, direct appraisal of classes, innovation in teaching, and professional
development undertaken by the teachers. A close scrutiny of these criteria reveals that these
are mostly counted as professional outcomes that teachers are supposed to show in their
performance appraisals. Therefore, I have named this component as “professional
outcomes” as evidence of teacher performance in teacher appraisals and feedback.
The second component consists of parental feedback on teaching and relations with
colleagues. Since these criteria are not directly related to professional outcomes expected of
a teacher, I have named them as “others.” The component loadings showed as 0.56 and 0.51
for the two criteria respectively. The Table G3 in Appendix G gives scores for each variable
in the two components. These scores were predicted through regression.
74
The second component analysis was run on outcomes of teacher evaluation reported
as teacher percentages in OECD (2009b). A total of 13 variables (see Appendices D-E) were
subjected to this procedure. I dropped two variables—teaching students with special
learning needs and teaching in a multicultural setting—for the reason that I mentioned in the
first component analysis on teacher appraisal criteria and feedback. The TALIS 2008 asked
teachers as to what extent their appraisal and feedback directly led to or involved changes in
the 13 aspects of their professional lives. These included such aspects as their salary,
financial rewards, and teaching knowledge and skills. Teachers responded on a scale of 1-5
with 1 representing “no change” and 5 representing “a large change.” OECD (2009b) gives
the last two responses, “a moderate change” and “a large change” as percentages of teachers
who reported so. Before running the component analysis, a simple correlation was run on
these variables. Like the high correlations among some variables in the teacher appraisal
criteria, results on teacher evaluation outcomes also showed some of the variables as highly
correlated with each other. Therefore, 7 of the 13 variables were dropped and component
analysis was run on only six variables capturing information on teacher appraisal outcomes
and impact.
The Table H1 in Appendix H gives results of the principal component analysis for
these variables. One component is retained that carried an EV of 4.41 with 74% of the
variance explained by all the six variables. The Table H2 in Appendix H gives factor
rotations for the retained component. The Table H2 shows that the variables loaded
differently with loadings ranged between 0.34 and 0.45. These variables include how
teacher appraisal and feedback impacted teachers with respect to the emphasis placed on
improving student test scores, a change in salary, career advancement, public recognition,

75
professional development opportunities, and teachers’ role in school development. This
component has been named as “outcomes and impacts of teacher evaluation.” The Table H3
gives scores predicted through regression.
Methods
This study employs Ordinary Least Squares (OLS) as the method of analyzing the
data. Originally, the study was conceived as a 2 and 3-level modeling using the statistical
software package Stata®. However, some logistical issues related to computing resources
and technicalities hindered the use of multilevel modeling in the software in which the
researcher was trained. One of the alternatives was to use the OLS but it had its own
challenges.
PISA being a large scale international survey has a sample with multilevel structure,
and therefore poses challenges as regards meeting the basic assumption of the independence
of observations. The OLS can give unbiased estimates with correct standard errors only
when we have a truly random sample and that observations are independent. Thus, one
possible caveat of using OLS could have been the dependence of observations due to the
multilevel structure of the data where the observations within a strata (e.g., school) may be
dependent in some aspects. This would have violated the independence of observations.
However, the OLS can still give unbiased estimates by applying special procedures
suggested by OECD (2009c). In their study that makes use of the PISA 2006 dataset, Zhang
and Lee (2011) also propose that the OLS can give unbiased estimates by using weights.
Therefore, the OLS as a choice in this dissertation with necessary weight inclusions was a
logical approach within the limitations of the study but with the needed provision of the
robustness to the models employed.
76
Since the PISA 2009 has a two-level sampling structure, the student sample is not
proportional to population of the same age group in the sample countries. Balanced
Repeated Replication (BRR) method accounts for such technical issues by including
weights at the student and school levels. According to OECD (2009c), “a replicate sample is
formed simply through a transformation of the full sample weights according to an
algorithm specific to the replication method. These methods therefore can be applied to any
estimators – means, medians, percentiles, correlations, regression coefficients…” (p. 74).8
With this provision of BRR, I ran the OLS models using the PVs within the standard
guidelines provided by the OECD (2009c). As mentioned previously, the PVs are five
scores representing five possible values for student performance in each of the three tested
subjects. Since PVs are not the actual student scores, using just a mean of the PVs could
inflate the true statistical parameter of interest. Therefore, to avoid these eventualities, the
statistics of interest which in this case are regression coefficients, are separately calculated
for each of the five PVs in each subject. The reported coefficients are the average of
individual regressions. This gives unbiased estimators of population variance and statistics
(OECD, 2009c).
With all the predictors and interactions described earlier, models were run using
standard procedures recommended by the OECD (2009c). Equations 1-3 below represent
the models that I ran for the three subjects separately:
yi = α0 + α1[Monitoring in Test Language] + α2[Developmental] + α3[High-stakes]
+ ei…………………………………………………………………………...(1)
8 For more on this, read OECD (2009c).
77
yi = α0 + α1[Monitoring in Test Language] + α2[Developmental] + α3[High-stakes]
+ ∑βiXi + ∑δiYi + ∑ηiZi + ei ………………………………………………..(2)
yi = α0 + α1[Monitoring in Test Language] + α2[Developmental] + α3[High-stakes]
+ α4[Interactions] + ∑βiXi + ∑δiYi + ∑ηiZi + ei ……………………………(3)
In the equations above, y is the predicted score for student i in mathematics, science, and
reading. The parenthetical terms represent the main variables that are labeled as “monitoring
in test language,” “developmental,” and “high-stakes.” These terms represent the main
variables that capture teacher monitoring and evaluation practices and purposes in schools.
The variables covering “monitoring in test language” are included only with reading and are
not part of the models for mathematics and science. “ei” shows the error terms associated
with the entire model at the outcome level.
Equation 2 represents model 2 that carries control variables at the student, school,
and country levels in addition to the main variables. The terms ∑βiXi, ∑δiYi, and ∑ηiZi give
sums of coefficients of the control predictors from the three levels. One significant feature
of the models employed is the use of the interaction terms. Equation 3 represents model 3
that carries one additional set of interaction terms in addition to the main and control
variables.
78
Chapter 4. RESULTS AND ANALYSES
In this chapter, I will present results of the study which are based on various
regression models used for the three subjects of mathematics, science, and reading. There
are three different models in each subject. The first model carries only the main predictors.
Model 2 consists of control variables for student, school, and country characteristics in
addition to the main predictors. Model 3 in each subject carries an additional set of
interaction terms along with the main predictors and control variables.
Determinants of Student Achievement in Mathematics
Table 4.1 gives regression results for all the three models in mathematics.
Developmental and high-stakes approaches to teacher evaluation.
Developmental and high-stakes approaches to teacher evaluation in mathematics consisted
of eight variables. According to the Table 4.1, in the absence of control variables, teacher
evaluation with a developmental focus showed a largely negative correlation with student
achievement in mathematics. Principals observing teachers in their classrooms related
negatively (b = -1.456, p = .704) with student achievement. However, this relationship was
not significant. The coefficient for principals suggesting teachers for improvement showed a
large negative coefficient (b = -21.235, p < .001). Similarly, principals informing teachers
for updating their knowledge and skills also showed a relatively large and significant
negative coefficient (b = -14.179, p < .05). Assessments used for improvement in instruction
related positively and significantly to student achievement in mathematics. Student
achievement, in schools using assessments for instructional improvement, associated with
12.393 (p < .01) score point increase in individual student test scores in mathematics in the
absence of interactions and control variables.
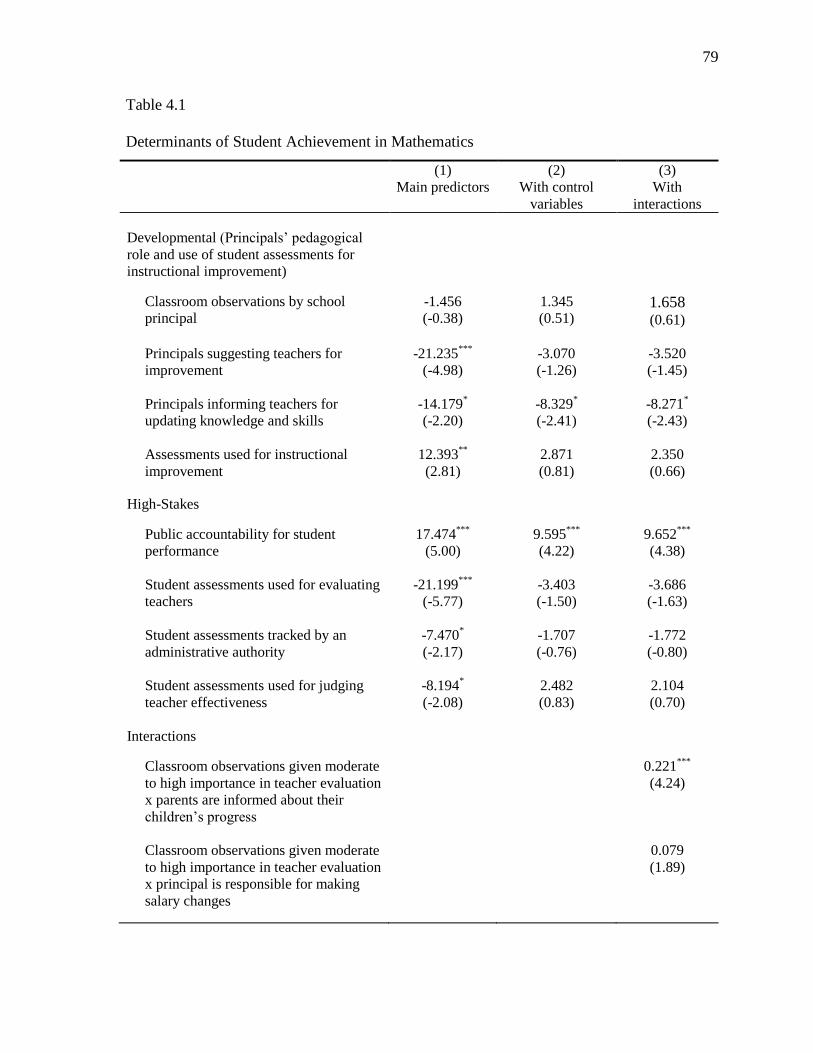
79
Table 4.1
Determinants of Student Achievement in Mathematics
(1) (2) (3)
Main predictors With control
variables
With
interactions
Developmental (Principals’ pedagogical
role and use of student assessments for
instructional improvement)
Classroom observations by school
principal
-1.456
(-0.38)
1.345
(0.51) 1.658 (0.61)
Principals suggesting teachers for
improvement
-21.235***
(-4.98)
-3.070
(-1.26)
-3.520
(-1.45)
Principals informing teachers for
updating knowledge and skills
-14.179*
(-2.20)
-8.329*
(-2.41)
-8.271*
(-2.43)
Assessments used for instructional
improvement
12.393**
(2.81)
2.871
(0.81)
2.350
(0.66)
High-Stakes
Public accountability for student
performance
17.474***
(5.00)
9.595***
(4.22)
9.652***
(4.38)
Student assessments used for evaluating
teachers
-21.199***
(-5.77)
-3.403
(-1.50)
-3.686
(-1.63)
Student assessments tracked by an
administrative authority
-7.470*
(-2.17)
-1.707
(-0.76)
-1.772
(-0.80)
Student assessments used for judging
teacher effectiveness
-8.194*
(-2.08)
2.482
(0.83)
2.104
(0.70)
Interactions
Classroom observations given moderate
to high importance in teacher evaluation
x parents are informed about their
children’s progress
0.221***
(4.24)
Classroom observations given moderate
to high importance in teacher evaluation
x principal is responsible for making
salary changes
0.079
(1.89)
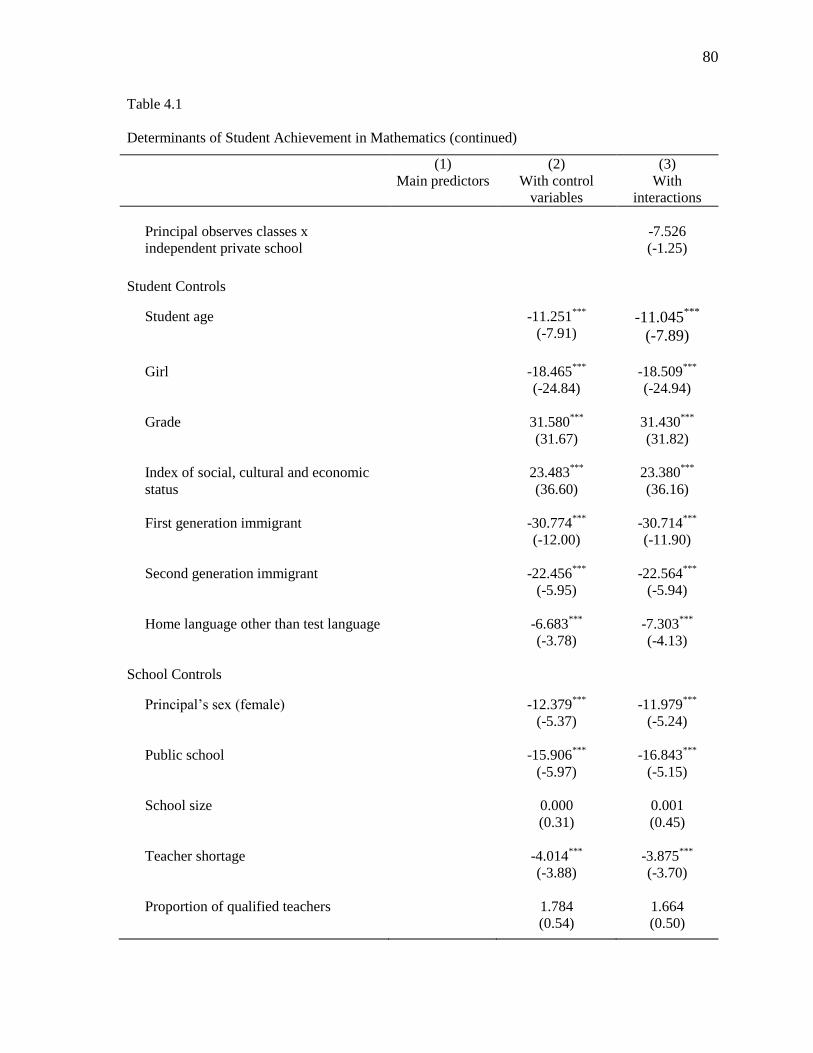
80
Table 4.1
Determinants of Student Achievement in Mathematics (continued)
(1) (2) (3)
Main predictors With control
variables
With
interactions
Principal observes classes x
independent private school
-7.526
(-1.25)
Student Controls
Student age -11.251***
(-7.91) -11.045
***
(-7.89)
Girl -18.465***
(-24.84)
-18.509***
(-24.94)
Grade 31.580***
(31.67)
31.430***
(31.82)
Index of social, cultural and economic
status
23.483***
(36.60)
23.380***
(36.16)
First generation immigrant -30.774***
(-12.00)
-30.714***
(-11.90)
Second generation immigrant -22.456***
(-5.95)
-22.564***
(-5.94)
Home language other than test language -6.683***
(-3.78)
-7.303***
(-4.13)
School Controls
Principal’s sex (female) -12.379***
(-5.37)
-11.979***
(-5.24)
Public school -15.906***
(-5.97)
-16.843***
(-5.15)
School size 0.000
(0.31)
0.001
(0.45)
Teacher shortage -4.014***
(-3.88)
-3.875***
(-3.70)
Proportion of qualified teachers 1.784
(0.54)
1.664
(0.50)
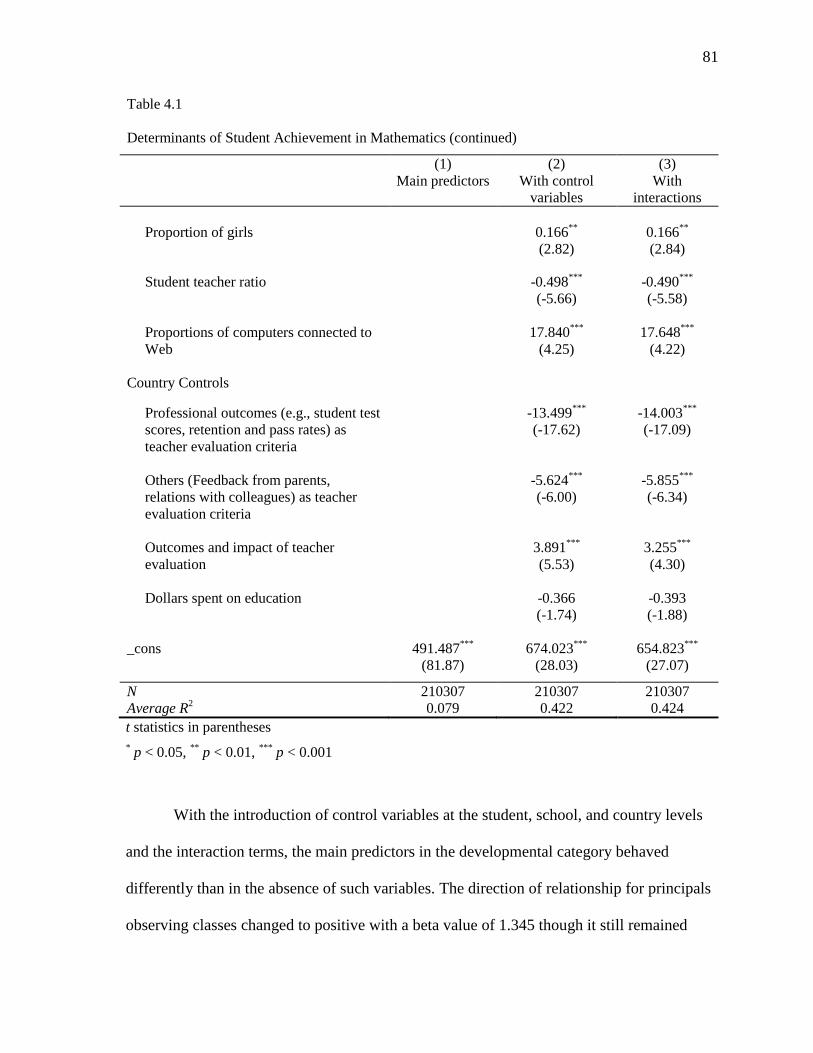
81
Table 4.1
Determinants of Student Achievement in Mathematics (continued)
(1) (2) (3)
Main predictors With control
variables
With
interactions
Proportion of girls 0.166**
(2.82)
0.166**
(2.84)
Student teacher ratio -0.498***
(-5.66)
-0.490***
(-5.58)
Proportions of computers connected to
Web
17.840***
(4.25)
17.648***
(4.22)
Country Controls
Professional outcomes (e.g., student test
scores, retention and pass rates) as
teacher evaluation criteria
-13.499***
(-17.62)
-14.003***
(-17.09)
Others (Feedback from parents,
relations with colleagues) as teacher
evaluation criteria
-5.624***
(-6.00)
-5.855***
(-6.34)
Outcomes and impact of teacher
evaluation
3.891***
(5.53)
3.255***
(4.30)
Dollars spent on education -0.366
(-1.74)
-0.393
(-1.88)
_cons 491.487***
(81.87)
674.023***
(28.03)
654.823***
(27.07)
N 210307 210307 210307
Average R2 0.079 0.422 0.424
t statistics in parentheses
* p < 0.05,
** p < 0.01,
*** p < 0.001
With the introduction of control variables at the student, school, and country levels
and the interaction terms, the main predictors in the developmental category behaved
differently than in the absence of such variables. The direction of relationship for principals
observing classes changed to positive with a beta value of 1.345 though it still remained
82
insignificant (p = .613). With the interaction terms in model 3, this variable remained almost
unchanged (b = 1.658, p = .543). Principals suggesting teachers for improvement reduced to
an insignificant negative correlation in the presence of control variables in model 2 (b = -
3.070, p = .211) and with the interactions in model 3 (b = -3.520, p = .152). The variable
that captured information on the use of assessments for instructional improvement also
reduced to a small positive coefficient of 2.871 (p = .420) in model 2 with control variables
and with a coefficient of 2.350 (p = .511) with the interaction terms in model 3. The
direction of the relationship for principals informing teachers for updating their knowledge
and skills remained negative and significant with a reduced negative coefficient (b = -8.329,
p < .05) compared to the model 1. With the interaction terms in the model 3, the coefficient
remained significant (b = -8.271, p < .05) at 5% level.
With regard to high-stakes approaches to teacher evaluation, all but one variable
related negatively with student achievement in mathematics in the absence of control
variables and interaction terms. Table 4.1 shows that public accountability such as
publishing student performance in the media and other outlets associated with a higher
student achievement. It associated with an increase of 17.474 (p < .001) score points in
student achievement in mathematics. However, student assessments as used for evaluating
teachers (as in formal evaluations), tracking of student assessment by administrative
authorities, and judging teacher effectiveness did not relate positively with student
achievement. Using student assessments for teacher evaluation resulted in a negative
relation (b= -21.199, p < .001) as did tracking of assessments by an administrative authority
(b = -7.470, p < .05), and using student assessments for judging teacher effectiveness (b = -
8.194, p < .05).
83
Like the change in behavior of the variables in the developmental category, the high-
stakes approaches to teacher evaluation also recorded a change when control variables and
interaction terms were added successively in models 2 and 3. After controlling for the
background factors at the student, school, and country levels, public accountability still
remained a significant and positive relation with student achievement in mathematics but the
effect size reduced significantly with a coefficient of 9.595 (p < .001). The negative
coefficients in the use of student assessments for evaluating teachers (b = -3.403) and
tracking of student assessments by an administrative authority (b = -1.707) reduced in their
sizes and turned insignificant with p-values of .136 and .447 respectively. Using student
assessments for judging teacher effectiveness turned positive (b = 2.482) but remained
insignificant (p = .411) when controlled for background factors.
With further introduction of the interaction terms and after controlling for the
background factors, public accountability persisted as a significant predictor with a
coefficient of 9.652 (p < .001) at 0.1% level of significance. The use of student assessments
for evaluating teachers showed a negative but insignificant relation with student
achievement in mathematics with a beta coefficient of -3.686 (p = .110). Similarly, tracking
of student assessments by an administrative authority also returned a statistically
insignificant negative coefficient of -1.772 (p = .424). Student assessments used for judging
teacher effectiveness showed a positive (b = 2.104) but insignificant (p = .489) coefficient.
Model 3 also explored three important interaction terms. It explored how a higher
importance given to classroom observations in teacher evaluation interacted with informing
parents about the progress of their children, and with the principal being able to make
changes in teachers’ salaries. These two interactions were cross-level interactions with one
84
level being the school and the other being the country. The model also analyzed interaction
between principals’ observation of classes and school being private. Results show that a
higher importance placed on classroom observations in combination with informing parents
about the progress of their children carried a significant coefficient of 0.221 (p < .001) after
controlling for factors at the student, school and country levels. Higher importance given to
the classroom observations in teacher appraisals interacted positively with principals’
authority to make changes in teachers’ salaries with a coefficient of 0.079 (p = .062).
However, given the large size of the sample, this coefficient is treated as statistically
insignificant in the context of this study. Principals observing teachers in their classes
interacted negatively (b = -7.526) with the school type being independent private. This
relationship remained insignificant with a p-value of .216.
Control variables in models 2 and 3 in mathematics. As stated earlier, models 2
and 3 carried control variables at the student, school, and country levels in addition to the
main predictors. The Table 4.1 gives coefficients for these control variables in mathematics.
As expected, all control variables except for age behaved similarly as in previous studies
(e.g., Demir, Kılıç, & Ünal, 2010; Fuchs & Wößmann, 2007; Zhang & Lee, 2011). Age
related negatively with student achievement in mathematics with coefficients of -11.251 (p
< .001) in model 2 and -11.045 (p < .001) in model 3. Age turned negative only when grade
and other control variables are added into the model. This anomalous behavior requires
further probing of the relationships of age with student achievement. Being a girl appeared
to be a disadvantage in mathematics. The negative relationship is consistent across the two
models with almost the same coefficient sizes of around -18.500 (p < .001) at 0.1%
significance levels. Grade associated positively with student achievement with coefficients
85
of about 31 (p < .001) in the two models. Similarly, socioeconomic status also associated
strongly and positively with student achievement across the two models with coefficients of
23.483 (p < .001) and 23.380 (p < .001) in models 2 and 3 respectively. First and second
generation immigrant statuses as well as home language being other than test language
showed consistent negative relations with student achievement in mathematics. First
generation immigration status produced a coefficient of -30.774 (p < .001) and -30.714 (p <
.001) in models 2 and 3 respectively. Second generation immigrant status showed similar
disadvantages for students in terms of their achievement in mathematics. The relationship
was somewhat less intense compared to the first generation immigrant status with
coefficients of around -22 at 0.1% significance levels in models 2 and 3. If the language at
home was different than the test language, it related negatively to student achievement in
mathematics by a factor of about 7 (p < .001) points.
Results on various school attributes attested to the earlier findings from various
studies (Demir, Kılıç, & Ünal, 2010; Fuchs & Wößmann, 2007; Zhang & Lee, 2011). Being
in a public school appeared as a disadvantage in model 2 (b = -15.906, p < .001) and model
3 (b = -16.843, p < .001). Similarly, student achievement in schools with a female principal
reflected in coefficients of -12.379 (p < .001) and -11.979 (p < .001) in models 2 and 3
respectively suggesting a net disadvantage for students in terms of their achievement. Size
of the school also mattered significantly but with a small effect size across the two models.
A unit increase in school enrollment associated with an increase of 0.001 (p < .001) score
point in student achievement in mathematics. Teacher shortage showed negative and
significant coefficients in both the models. A shortage of teachers associated with a decrease
of about 4 (p < .001) score points in student achievement in mathematics. The proportion of
86
qualified teachers associated positively but with insignificant coefficients of 1.784 (p =
.592) and 1.664 (p = .617) in models 2 and 3 respectively. This finding, though insignificant
but positive, somewhat supports the previous evidence on positive association of teacher
quality with student achievement (Darling-Hammond, 2000). However, some evidence also
shows that teacher quality in the form of observable characteristics is not associated with
higher student achievement (Buddin & Zamarro, 2009; Hanushek et al., 2005; Harris &
Sass, 2011). These studies suggest that while teacher quality is an important determinant in
student achievement, observable characteristics such as an advanced diploma does not relate
positively to student achievement. Thus, this coefficient somewhat goes in line with the
former evidence (e.g. Darling-Hammond, 2000) suggesting that having ISCED level 5A
qualification is associated positively, though statistically insignificantly, with better student
achievement. A higher proportion of girls carried a positive coefficient of 0.166 (p < .01) in
both the models 2 and 3. This runs counter to the earlier coefficient where girls scored less
than boys in mathematics by which it should mean that a higher proportion of girls should
relate negatively with student achievement in mathematics. This result may be construed of
as an outcome of an environment where boys and girls may enter into competition with each
other for better scores which may then be resulting in an overall increase in student
achievement in mathematics. A higher student-teacher ratio resulted in a decrease in student
achievement suggesting a somewhat negative effect of large class sizes. A school that had a
higher proportion of computers connected to the Internet experienced a positive student
achievement with coefficients of about 18 (p < .001) after controlling for background factors
at the student, school, and country levels.
87
Models 2 and 3 also carried 4 control variables at country level in addition to the
main predictors and the interactions. Dollars spent on education associated with a decrease
of about 0.4 (p < .1) score point in student achievement for every 100 dollar increase in
spending on education per capita income. However, this relationship was not significant
within the context of this study. This could possibly be a result of the non-random sample of
countries where the countries were selected on pre-defined criterion which was based on
their participation in the TALIS 2008 survey. As described in the sections on the variables
and data reduction in chapter 3, three country variables were created using information on
teacher appraisal and feedback practices from the OECD (2009b) report on the TALIS 2008.
The first component of teacher evaluation which is named as “professional outcomes” was
associated negatively with student achievement with coefficients of -13.499 (p < .001) in
model 2 and -14.003 (p < .001) in model 3. This negative association raises important
questions and concerns with regard to the use of student test scores and retention and pass
rates as evidence of teacher performance in teacher evaluations. The second component
which is named as “others” showed significant negative coefficients of -5.624 (p < .001) and
-5.855 (p < .001) in models 2 and 3 respectively. This negative association may possibly be
due to a potential mismatch between the relative emphases that teachers and evaluators
place on these criteria in teacher appraisals. For example, teachers may value their relations
with colleagues as a highly important criterion in their appraisals but principals and other
evaluators may have a different opinion on this. This difference in the relative importance of
teacher evaluation criteria between teachers and evaluators may give rise to conflicts of
interest leading to an overall negative impact on student test scores. However, the
underlying dynamics may be much more complex than such a straightforward explanation.
88
Along with these two components as control variables for teacher evaluation criteria,
one component on teacher evaluation outcomes was used as a country variable to control for
teacher perspectives on the subject. This component is named as the “outcomes and impact
of teacher evaluation.” It showed a significant positive association with student achievement
in mathematics with coefficients of 3.891 (p < .001) in model 2 and 3.255 (p < .001) in
model 3. This positive association suggests a “high-stakes” effect in mathematics at play
where teachers see that their salaries are at stake in their evaluations. This could also mean
that a better performance in the form of student test scores could secure advancement in
career and a spot in a professional development opportunity and hence a positive incentive
for teachers to work harder to produce better student test scores.
Determinants of Student Achievement in Science
Like mathematics, student achievement in science was subjected to the same
regression analyses using the three models as specified in mathematics. The results are
similar across the two subjects with some exceptions. The Table 4.2 gives regression results
for all three models in science.
Developmental and high-stakes approaches to teacher evaluation.
Developmental approaches to teacher evaluation repeat similar behavior as in mathematics.
Principals observing teachers in their classrooms related negatively though insignificantly (b
= -1.999, p = .555) with student achievement in science. The coefficient for principals
suggesting teachers for improvement showed a negative but a larger coefficient (b = -
17.897, p < .001) than in mathematics. Similarly, principals informing teachers about
possibilities for updating their knowledge and skills also showed a negative relation with
student achievement though with a smaller and insignificant coefficient (b = -7.287, p =
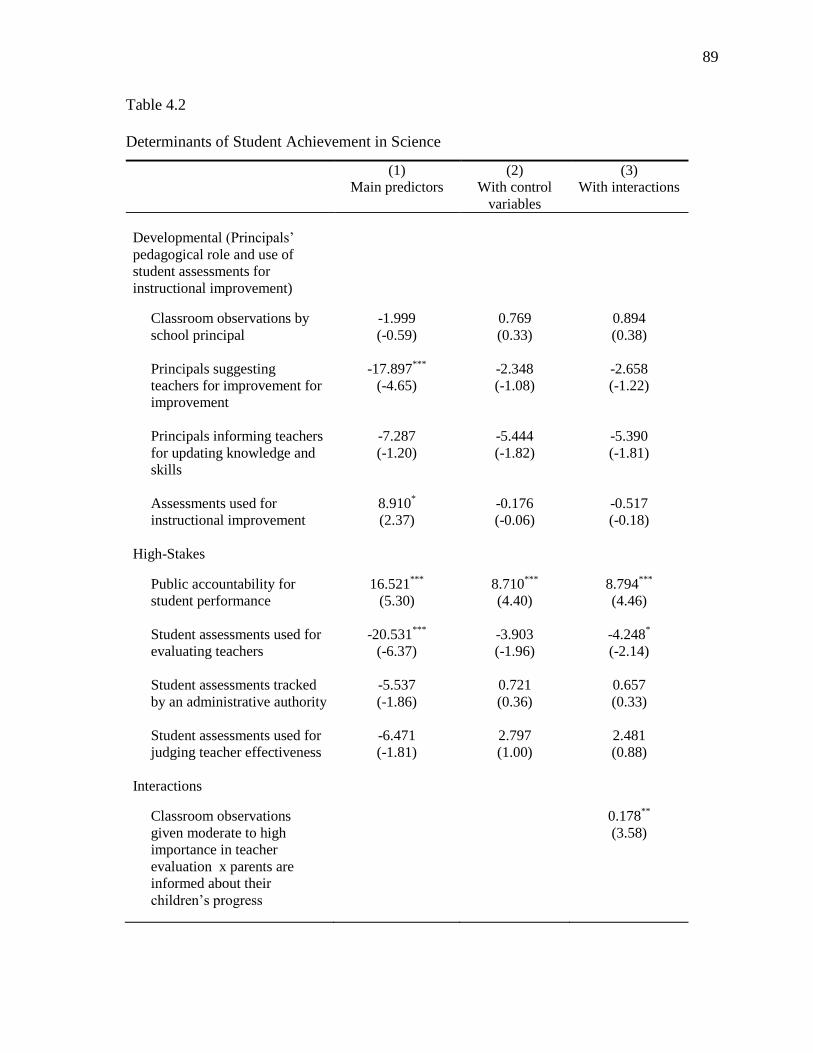
89
Table 4.2
Determinants of Student Achievement in Science
(1) (2) (3)
Main predictors With control
variables
With interactions
Developmental (Principals’
pedagogical role and use of
student assessments for
instructional improvement)
Classroom observations by
school principal
-1.999
(-0.59)
0.769
(0.33)
0.894
(0.38)
Principals suggesting
teachers for improvement for
improvement
-17.897***
(-4.65)
-2.348
(-1.08)
-2.658
(-1.22)
Principals informing teachers
for updating knowledge and
skills
-7.287
(-1.20)
-5.444
(-1.82)
-5.390
(-1.81)
Assessments used for
instructional improvement
8.910*
(2.37)
-0.176
(-0.06)
-0.517
(-0.18)
High-Stakes
Public accountability for
student performance
16.521***
(5.30)
8.710***
(4.40)
8.794***
(4.46)
Student assessments used for
evaluating teachers
-20.531***
(-6.37)
-3.903
(-1.96)
-4.248*
(-2.14)
Student assessments tracked
by an administrative authority
-5.537
(-1.86)
0.721
(0.36)
0.657
(0.33)
Student assessments used for
judging teacher effectiveness
-6.471
(-1.81)
2.797
(1.00)
2.481
(0.88)
Interactions
Classroom observations
given moderate to high
importance in teacher
evaluation x parents are
informed about their
children’s progress
0.178**
(3.58)
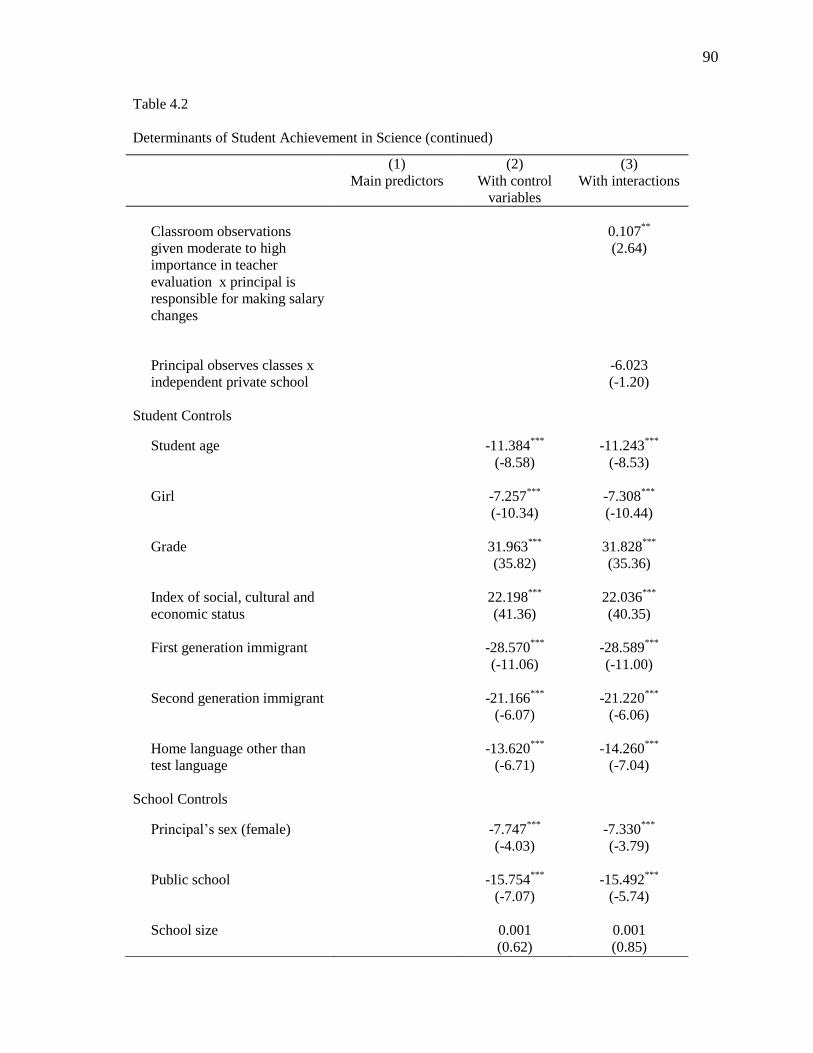
90
Table 4.2
Determinants of Student Achievement in Science (continued)
(1) (2) (3)
Main predictors With control
variables
With interactions
Classroom observations
given moderate to high
importance in teacher
evaluation x principal is
responsible for making salary
changes
0.107**
(2.64)
Principal observes classes x
independent private school
-6.023
(-1.20)
Student Controls
Student age
-11.384***
(-8.58)
-11.243***
(-8.53)
Girl
-7.257***
(-10.34)
-7.308***
(-10.44)
Grade
31.963***
(35.82)
31.828***
(35.36)
Index of social, cultural and
economic status
22.198***
(41.36)
22.036***
(40.35)
First generation immigrant -28.570***
(-11.06)
-28.589***
(-11.00)
Second generation immigrant -21.166***
(-6.07)
-21.220***
(-6.06)
Home language other than
test language
-13.620***
(-6.71)
-14.260***
(-7.04)
School Controls
Principal’s sex (female) -7.747***
(-4.03)
-7.330***
(-3.79)
Public school -15.754***
(-7.07)
-15.492***
(-5.74)
School size 0.001
(0.62)
0.001
(0.85)
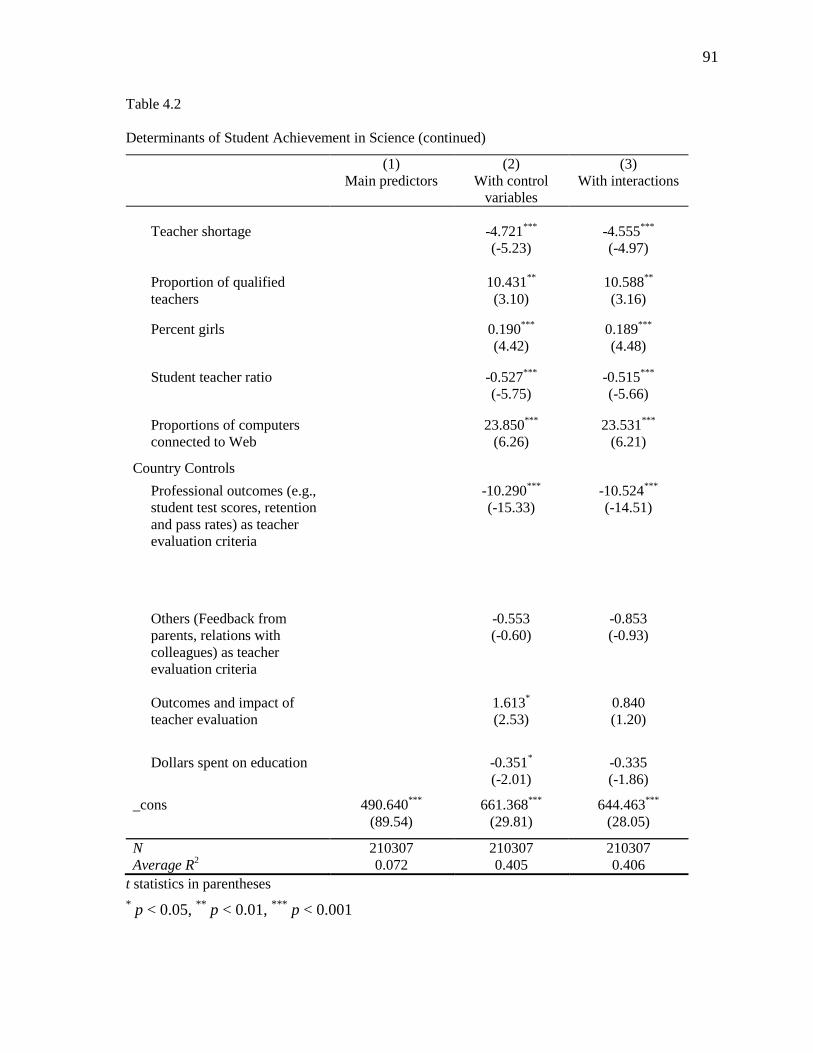
91
Table 4.2
Determinants of Student Achievement in Science (continued)
(1) (2) (3)
Main predictors With control
variables
With interactions
Teacher shortage -4.721***
(-5.23)
-4.555***
(-4.97)
Proportion of qualified
teachers
10.431**
(3.10)
10.588**
(3.16)
Percent girls 0.190***
(4.42)
0.189***
(4.48)
Student teacher ratio -0.527***
(-5.75)
-0.515***
(-5.66)
Proportions of computers
connected to Web
23.850***
(6.26)
23.531***
(6.21)
Country Controls
Professional outcomes (e.g.,
student test scores, retention
and pass rates) as teacher
evaluation criteria
-10.290***
(-15.33)
-10.524***
(-14.51)
Others (Feedback from
parents, relations with
colleagues) as teacher
evaluation criteria
-0.553
(-0.60)
-0.853
(-0.93)
Outcomes and impact of
teacher evaluation
1.613*
(2.53)
0.840
(1.20)
Dollars spent on education -0.351*
(-2.01)
-0.335
(-1.86)
_cons 490.640***
(89.54)
661.368***
(29.81)
644.463***
(28.05)
N 210307 210307 210307
Average R2 0.072 0.405 0.406
t statistics in parentheses
* p < 0.05,
** p < 0.01,
*** p < 0.001
92
.232). The fourth variable, assessments used for improvement in instruction, related
positively and significantly to achievement in science with a coefficient of 8.910 (p < .05).
Change of behavior in the main predictors in Model 2 was similar to that in
mathematics when control variables were introduced into the model specifications. In the
developmental category of teacher evaluation, direction of relationship in principals
observing classes shifted to positive but remained insignificant with a beta value of 0.769 (p
= .741). Principals suggesting teachers for improvement showed a negative and statistically
insignificant (b = -2.348, p = .283) correlation with student achievement in science.
Principals informing teachers for updating their knowledge and skills remained negative (b
= -5.444, p = .072) and insignificant. Furthermore, the use of assessments for instructional
improvement also showed negative and insignificant (b = -0.176, p = .950). Introduction of
interaction terms in model 3 resulted in no major difference in coefficients in the main
predictors in developmental teacher evaluation. Classroom observations by principals still
showed as insignificant (b = 0.894, p = .703). Principals informing teachers for updating
their knowledge and skills remained negative (b = -5.390) and statistically insignificant (p =
.074). Similarly, principals suggesting teachers for improvement (b = -2.658, p = .225), and
using assessments for instructional improvement (b = -0.517, p = .854) also showed
negative and insignificant associations with student achievement in science.
In the absence of control variables, the category consisting of the high-stakes
approaches to teacher evaluation in model 1 repeated a similar behavior as in mathematics.
As the Table 4.2 shows, public accountability related positively with student achievement in
science with a coefficient of 16.521 (p < .001) which is almost the same as in model 1 in
mathematics. The different uses of student assessments resulted in negative correlations
93
with achievement in science. The use of student assessment for teacher evaluation showed a
negative relation (b= -20.531, p < .001) with student achievement. On the contrary, tracking
of student assessments by administrative authority (b = -5.537, p = .067) and using student
assessments for judging teacher effectiveness (b = -6.471, p = .074) remained statistically
insignificant.
Upon introduction of control variables in model 2, public accountability persisted as
a significant and positive relation with student achievement in science and, like
mathematics, delivered a reduced effect size with a coefficient of 8.710 (p < .001). A
negative and insignificant coefficient was observed in the use of student assessments for
evaluating teachers (b = -3.903, p = .054). Tracking of student assessments by an
administrative authority (b = 0.721, p = .717) and using student assessments for judging
teacher effectiveness turned positive (b = 2.797, p = .321) but still remained insignificant.
Interaction terms did not greatly affect the direction and size of any relationships in
science. With further introduction of interactions in model 3, public accountability related
significantly with student achievement in science with a coefficient of 8.794 (p < .001). The
use of student assessments for evaluating teachers reflected in a negative relation with a
significant beta coefficient of -4.248 (p < .05). Administrative tracking of student
assessments produced a coefficient of 0.657 (p = .741) whereas judging teacher
effectiveness through student assessments showed positive (b = 2.481, p = .381) but
insignificant associations with student achievement in science in model 3.
With regard to the interaction terms, results indicated that the four interaction terms
behaved similarly as in model 3 in mathematics. Classroom observations being important as
a criteria in teacher appraisal carried a significant coefficient of 0.178 (p < .01) when
94
interacted with parents being informed about the progress of their children. In a similar vein,
higher importance given to classroom observations in teacher evaluation criteria showed a
positive interaction with principals’ ability to make changes in teachers’ salaries by giving a
coefficient of 0.107 (p < .01). In contrast, principals’ observation of teachers delivered a
negative but insignificant interaction with school type being private by producing a
coefficient of -6.023 (p = .235).
Control variables in models 2 and 3 in science. The Table 4.2 gives coefficients
for control variables in science. All control variables behaved in a similar fashion as in
mathematics. Coefficient sizes were in the same range as in mathematics with only few
exceptions. Being a girl still remained a disadvantage but the size of the negative coefficient
reduced significantly. The effect size remained consistent across the two models with almost
the same coefficient sizes of about -7 (p < .001) as in mathematics. First and second
generation immigrant statuses as well as home language being other than test language
showed consistent negative relation with student achievement in science. A second
exception in terms of size of coefficients was observed in home language being other than
test language. A student who spoke a language at home different than the test language
suffered a negative consequence as reflected in a coefficient of -14.260 (p < .001) in the
model 3. This coefficient was larger in size (almost double) in science than in mathematics.
The school level control variables also behaved similarly as in mathematics with few
exceptions. Having a female as a school principal showed as somewhat less strongly as a
negative association compared to mathematics. The coefficient showed as -7.330 (p < .001)
in model 3 which was about 5 points less than in mathematics. Proportion of qualified
teachers associated positively with student achievement with significant coefficients unlike
95
mathematics where the coefficients were positive but insignificant. This variable associated
with a 10.588 (p < .01) score point increase in individual student test scores in science. A
higher proportion of girls showed a positive coefficient of about 0.19 (p < .001) in both the
models. The size of coefficient for proportion of computers showed a stronger correlation
compared to mathematics by a factor of about 4 points at 0.1% significance level.
In terms of the country control variables, the relationships were similar as in
mathematics. “Professional outcomes” as a country control variable for teacher evaluation
criteria showed as negatively associated with student achievement but with a reduced
coefficient as compared to the same coefficient in mathematics. This coefficient showed as -
10.290 (p < .001) in model 2 and as -10.524 (p < .001) in model 3 which was about 4 points
less than the same coefficients in mathematics. The second variable consisting of parental
feedback on teaching and relations with colleagues showed an insignificant (b = -0.853, p =
.357) association with student achievement in science in the model with the control
variables and the interaction terms. The third country control variable “outcomes and impact
of teacher evaluation” resulted in a positive but insignificant association (b = 0.840, p =
.235) with student achievement in science. Like mathematics, dollars spent on education
also showed a negative insignificant association with student achievement in science with a
coefficient of -0.335 (p = .066).
Determinants of Student Achievement in Reading
The only stark difference in terms of model specifications between reading and the
prior two subjects was the inclusion of a set of main predictors covering teacher monitoring
in test language. Given the additional emphasis placed in the PISA 2009 survey on reading,
the first model in reading consisted of additional four variables on practices in teacher
96
monitoring in test language. Regression analyses in reading were similar as in mathematics
and science with some exceptions. The Table 4.3 gives regression results for all three
models in reading.
Developmental and high-stakes approaches to teacher evaluation. The first block
in Table 4.3 shows four approaches to gathering and using evidence in monitoring teachers
in test language. These approaches included student achievement, peer reviews, principal
and staff observations, and observations by an external authority.
Results indicated that using student achievement as an evidence of teacher
performance in teacher monitoring established a positive relation with student achievement
in reading. The significance level of the coefficient became progressively stronger across the
three models. However, the size of the coefficient dropped slightly between models 1 and 3
as control variables and interaction terms were introduced in successive models. In model 1
without control variables, it showed a value of 8.411 (p < .05). This value dropped to 7.455
(p < .01) when background factors were controlled in model 2. The coefficient registered a
further marginal drop in model 3 when interactions were introduced (b = 7.421, p < .01) into
the model. Similarly, teacher peer reviews also carried a positive relation with student
achievement in reading with coefficients of 6.841 (p = .065), 2.549 (p = .392), and 2.603 (p
= .388) in models 1, 2, and 3 respectively. This relationship showed as statistically
insignificant across the three models. Principal and staff observations showed significant at
α-level of 0.1% with large positive relationship (b = 13.478, p < .001) with student
achievement in reading in the absence of control variables and interactions. With the
introduction of control variables in model 2, this relationship dropped significantly in size
with a coefficient of 6.931 (p < .01) in model 2 with control variables. When the interaction
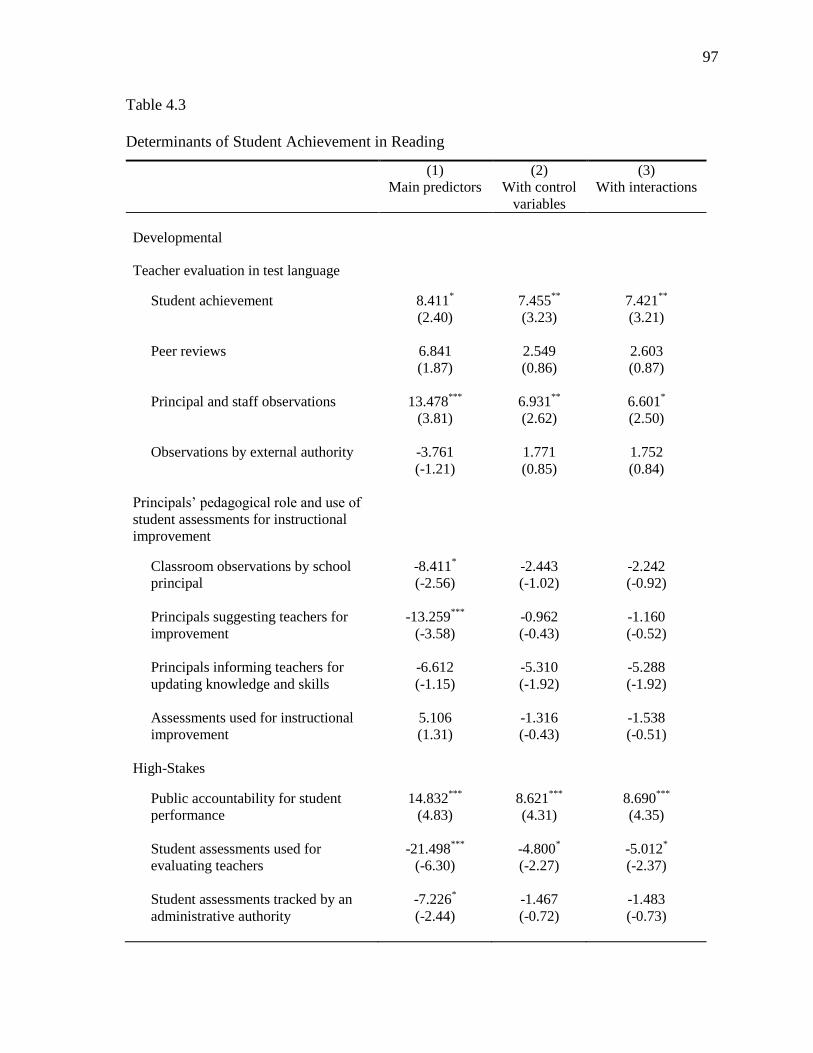
97
Table 4.3
Determinants of Student Achievement in Reading
(1) (2) (3)
Main predictors With control
variables
With interactions
Developmental
Teacher evaluation in test language
Student achievement 8.411*
(2.40)
7.455**
(3.23)
7.421**
(3.21)
Peer reviews
6.841
(1.87)
2.549
(0.86)
2.603
(0.87)
Principal and staff observations
13.478***
(3.81)
6.931**
(2.62)
6.601*
(2.50)
Observations by external authority -3.761
(-1.21)
1.771
(0.85)
1.752
(0.84)
Principals’ pedagogical role and use of
student assessments for instructional
improvement
Classroom observations by school
principal
-8.411*
(-2.56)
-2.443
(-1.02)
-2.242
(-0.92)
Principals suggesting teachers for
improvement
-13.259***
(-3.58)
-0.962
(-0.43)
-1.160
(-0.52)
Principals informing teachers for
updating knowledge and skills
-6.612
(-1.15)
-5.310
(-1.92)
-5.288
(-1.92)
Assessments used for instructional
improvement
5.106
(1.31)
-1.316
(-0.43)
-1.538
(-0.51)
High-Stakes
Public accountability for student
performance
14.832***
(4.83)
8.621***
(4.31)
8.690***
(4.35)
Student assessments used for
evaluating teachers
-21.498***
(-6.30)
-4.800*
(-2.27)
-5.012*
(-2.37)
Student assessments tracked by an
administrative authority
-7.226*
(-2.44)
-1.467
(-0.72)
-1.483
(-0.73)
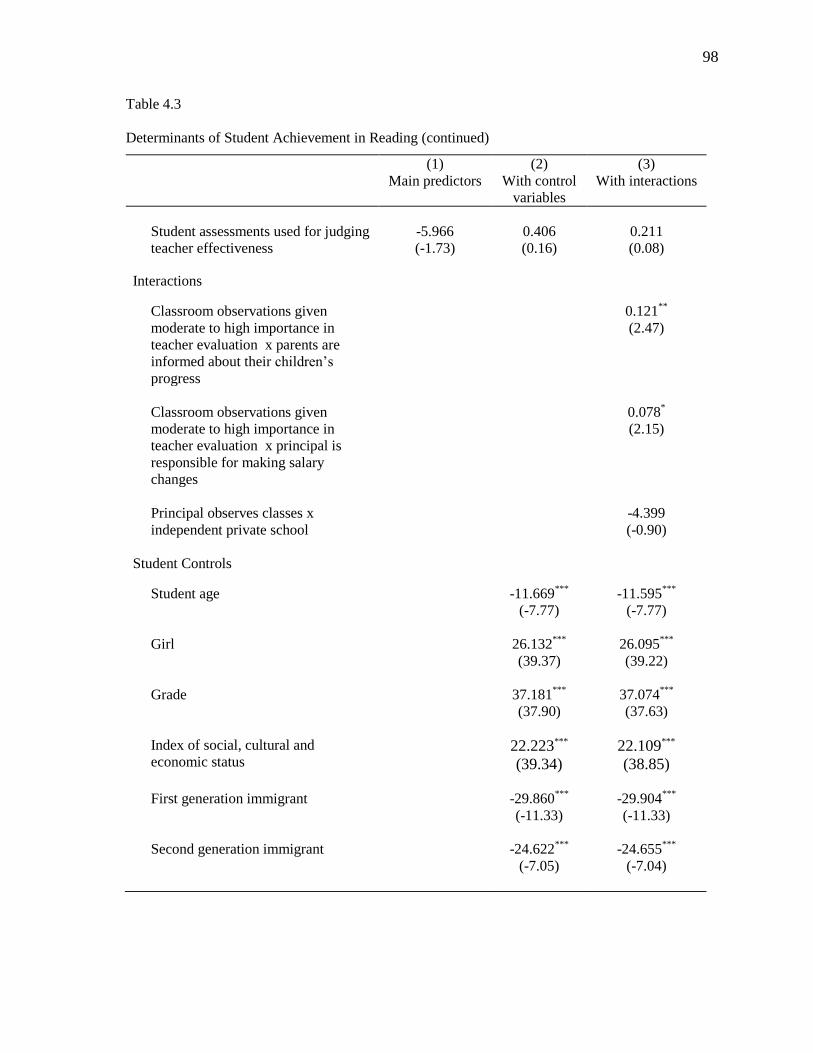
98
Table 4.3
Determinants of Student Achievement in Reading (continued)
(1) (2) (3)
Main predictors With control
variables
With interactions
Student assessments used for judging
teacher effectiveness
-5.966
(-1.73)
0.406
(0.16)
0.211
(0.08)
Interactions
Classroom observations given
moderate to high importance in
teacher evaluation x parents are
informed about their children’s
progress
0.121**
(2.47)
Classroom observations given
moderate to high importance in
teacher evaluation x principal is
responsible for making salary
changes
0.078*
(2.15)
Principal observes classes x
independent private school
-4.399
(-0.90)
Student Controls
Student age
-11.669***
(-7.77)
-11.595***
(-7.77)
Girl
26.132***
(39.37)
26.095***
(39.22)
Grade
37.181***
(37.90)
37.074***
(37.63)
Index of social, cultural and
economic status
22.223***
(39.34)
22.109***
(38.85)
First generation immigrant -29.860***
(-11.33)
-29.904***
(-11.33)
Second generation immigrant -24.622***
(-7.05)
-24.655***
(-7.04)
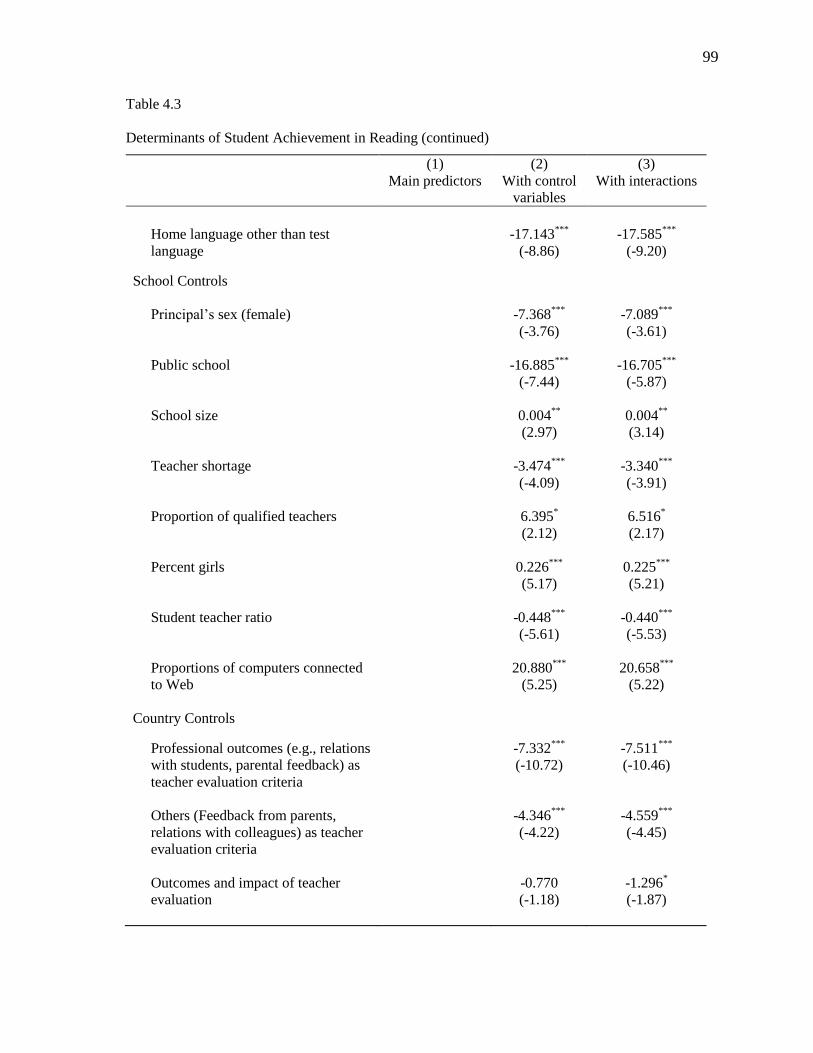
99
Table 4.3
Determinants of Student Achievement in Reading (continued)
(1) (2) (3)
Main predictors With control
variables
With interactions
Home language other than test
language
-17.143***
(-8.86)
-17.585***
(-9.20)
School Controls
Principal’s sex (female)
-7.368***
(-3.76)
-7.089***
(-3.61)
Public school
-16.885***
(-7.44)
-16.705***
(-5.87)
School size 0.004**
(2.97)
0.004**
(3.14)
Teacher shortage -3.474***
(-4.09)
-3.340***
(-3.91)
Proportion of qualified teachers 6.395*
(2.12)
6.516*
(2.17)
Percent girls 0.226***
(5.17)
0.225***
(5.21)
Student teacher ratio -0.448***
(-5.61)
-0.440***
(-5.53)
Proportions of computers connected
to Web
20.880***
(5.25)
20.658***
(5.22)
Country Controls
Professional outcomes (e.g., relations
with students, parental feedback) as
teacher evaluation criteria
-7.332***
(-10.72)
-7.511***
(-10.46)
Others (Feedback from parents,
relations with colleagues) as teacher
evaluation criteria
-4.346***
(-4.22)
-4.559***
(-4.45)
Outcomes and impact of teacher
evaluation
-0.770
(-1.18)
-1.296*
(-1.87)
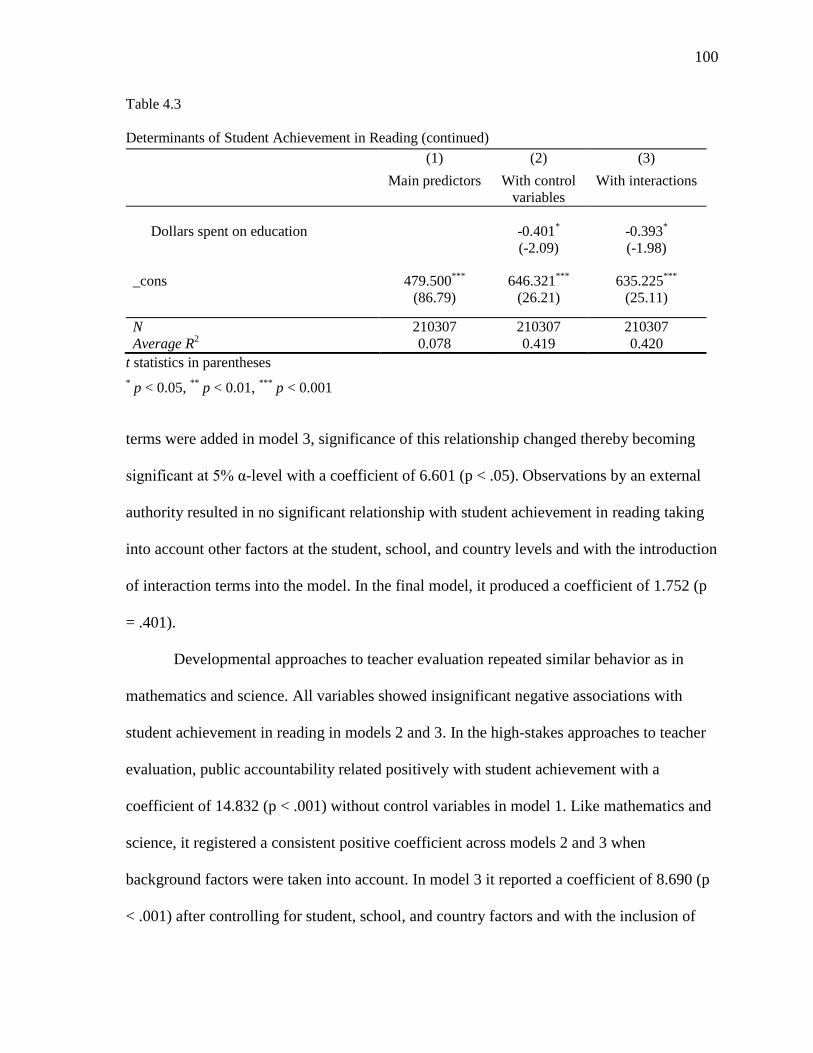
100
Table 4.3
Determinants of Student Achievement in Reading (continued)
(1) (2) (3)
Main predictors With control
variables
With interactions
Dollars spent on education
-0.401*
(-2.09)
-0.393*
(-1.98)
_cons 479.500***
(86.79)
646.321***
(26.21)
635.225***
(25.11)
N 210307 210307 210307
Average R2 0.078 0.419 0.420
t statistics in parentheses
* p < 0.05,
** p < 0.01,
*** p < 0.001
terms were added in model 3, significance of this relationship changed thereby becoming
significant at 5% α-level with a coefficient of 6.601 (p < .05). Observations by an external
authority resulted in no significant relationship with student achievement in reading taking
into account other factors at the student, school, and country levels and with the introduction
of interaction terms into the model. In the final model, it produced a coefficient of 1.752 (p
= .401).
Developmental approaches to teacher evaluation repeated similar behavior as in
mathematics and science. All variables showed insignificant negative associations with
student achievement in reading in models 2 and 3. In the high-stakes approaches to teacher
evaluation, public accountability related positively with student achievement with a
coefficient of 14.832 (p < .001) without control variables in model 1. Like mathematics and
science, it registered a consistent positive coefficient across models 2 and 3 when
background factors were taken into account. In model 3 it reported a coefficient of 8.690 (p
< .001) after controlling for student, school, and country factors and with the inclusion of
101
the interactions. Similarly, different uses of student assessments resulted in negative
correlations with achievement in reading at different significance levels. Using student
assessment for teacher evaluation developed a negative association with student
achievement in reading in all three models. In model 3, it showed a negative beta of -5.012
(p < .05). Administrative tracking of student assessments also showed a negative coefficient
in all three models but it remained insignificant with a p-vale of .469 in the presence of
control variables and interaction terms in the model. The use of student assessments for
judging teacher effectiveness also remained statistically insignificant in model 3.
Relationships between the interaction terms and student achievement in reading
remained similar as in mathematics and science. Classroom observations being important as
criteria in teacher appraisal interacted positively with parents being informed about the
progress of their children. This interaction showed a significant coefficient of 0.121 (p <
.01). Similarly, interaction between classroom observations given moderate to high
importance in teacher evaluation criteria also showed a positive correlation (b = 0.078, p <
.05) with student achievement in reading when interacted with principals’ authority in
making changes in teachers’ salaries. Like mathematics and science, the third interaction
term consisting of principals’ observation of classes and school type being private returned
an insignificant negative association.
Control variables in models 2 and 3 in reading. The Table 4.3 gives coefficients
for the control variables in reading. All control variables at different levels behaved in a
similar fashion as in mathematics and science with coefficient sizes in similar ranges and
directions with only few exceptions. The exception was seen in student sex where being a
girl turned into a big advantage with strong positive coefficients in both the models 2 and 3.
102
In model 3, the coefficient delivered as 26.095 (p < .001). Student grade also showed a
significantly larger association with achievement in reading compared to science and
mathematics. The coefficient for grade (b = 37.074, p < .001) in reading was about 6 points
higher than in mathematics and science. Immigration statuses and home language being
other than test language returned similar results as in mathematics and science. Student
achievement related negatively to these attributes of students with large negative
coefficients turning significant at 0.1% significance levels in all three variables.
In school level control variables, principal’s sex persisted as a disadvantage for
students with a coefficient of -7.089 (p < .001) in model 3. Other school characteristics such
as proportion of qualified teachers, proportion of girls, student teacher ratio, and proportion
of computers connected to the Internet all repeated similar behaviors as in mathematics and
science with slight variations in the sizes of the coefficients.
Country control variables also followed similar patterns as in mathematics and
science. For example, dollars spent on education returned a coefficient with a value of -
0.393 (p < .05) in model 3. However, unlike mathematics and science, this association
showed significant at 5% significance level. Similarly, “professional outcomes” showed a
coefficient of -7.332 (p < .001) in model 2 and -7.511 (p < .001) in model 3. Like in
mathematics, the second component “others” as country control variable showed negative
and significant in models 2 and 3. However, unlike mathematics and science, “outcomes and
impact of teacher evaluation” as a country variable showed as negative (b = -1.296, p < .05)
and significant at 5% of α-level.
In conclusion, these findings have implications for the hypotheses that this study
aimed to examine. The study did not find sufficient evidence to clearly refute any of the
103
three null hypotheses. As findings show, hypothesis 1 received mixed results.
Developmental approaches to teacher evaluation that included principals’ observation of
classes, principals suggesting teachers for improvement, principals informing teachers about
possibilities for updating their knowledge, and the use of student assessments for
instructional improvement did not relate significantly with student achievement in all three
subjects. At the same time, use of student achievement and principal and staff observations
to monitor teachers in test language showed as positively associated with student
achievement in reading.
Second, with regard to hypothesis 2, only public accountability showed a significant
positive association with student achievement in all three subjects after controlling for
socioeconomic and other background factors. The other three approaches to teacher
evaluation in this category did not relate significantly with student achievement in
mathematics. In science and reading, using student assessments for evaluating teachers
showed a significant negative association with student achievement at 5% significance level.
Similarly, hypothesis 3 is also only partially supported by the findings of the study.
Interaction between observations of classes being important in teacher appraisals interacted
positively and significantly with parents being informed of the progress of their children
across all three subjects. In contrast, in reading and science only, classroom observations
being important in teacher appraisals interacted positively and significantly with principals’
authority in making changes in teachers’ salaries. This interaction remained statistically
insignificant in mathematics. Classroom observations by principals showed insignificant
negative interaction with school type being private across all three subjects.
104
Chapter 5. DISCUSSION, IMPLICATIONS, AND CONCLUSIONS
The issue of how best to monitor and evaluate teachers to achieve optimal student
learning outcomes for all students has been a subject of sustained and heated debates and
policy-making around the world. The intensity of such debates only gains momentum when
conflicting evidence on alternative approaches to monitor and evaluate teachers comes forth
in different studies and from varied schools of thought. For example, objective measures of
teacher performance in the form of summative evidence such as student test scores in VAM
approaches are considered to offer better tradeoffs in terms of their objectivity (Goldhaber &
Hansen, 2010; Sanders & Horn, 1994; Stronge & Tucker, 2000). On the contrary, evidence
on the subjective as well as standardized approaches to measuring teacher effectiveness
highlights the importance of quality of classroom processes as plausible measures of teacher
performance in schools (Kimball et al., 2004; Holtzapple, 2003; Milanowski, 2004; Sartain
et al., 2011; Wenglinsky, 2002; White, 2004). This latter body of evidence proposes that the
developmental approaches to monitoring and evaluation enable educators to deeply reflect
on their practice, identify areas that need improvement, and hence produce better learning
outcomes for students. This study has only added to the growing body of evidence on the
subject without presenting any conclusive standpoint on the efficacy of either approach to
monitoring and evaluating teachers.
In this chapter, I will discuss the findings of the study in the light of prior evidence. I
will also discuss policy implications for current debates on alternative forms of teacher
monitoring and evaluation, explain limitations of the study, and present recommendations
for further research.
105
Before discussing the findings of the study, it is important to expose at the outset
some limitations of the study to enable the readers to make meaningful generalizations
beyond the scope of this study. While I will discuss in detail these limitations near the end
of the chapter, I will briefly mention here that there are two major limitations of the study.
First, the study looks at student achievement only in the form of student test scores as
reflected in the PISA tests on reading, mathematics, and science. Since student learning is
an all-encompassing concept, student achievement only in the form of student test scores
presents a limited view of student learning. Student test scores preclude a holistic view of
student learning by focusing only on the cognitive domains and ignoring others such as
social and emotional domains. Therefore, any relation between student achievement and
teacher monitoring and evaluation practices and purposes should be looked at only in the
form of student test scores as reflected in the PISA tests in the three subjects of
mathematics, science, and reading. The second major limitation of the study stems from the
study models. The study has explored relationships between student achievement and
teacher monitoring and evaluation purposes and practices in a pooled sample of 21 countries
at one level—student. It needs to be noted that having an aggregate sample may be tricky
given the complex sampling structure in the PISA 2009 survey. The one-level model
explores variation only among students and overlooks variation among schools and
countries. It is with these major limitations that this study hopes to add to the increasing
evidence on the subject by discussing the pay-offs of alternative forms of teacher evaluation
in cross-national perspectives.
106
Developmental Approaches to Teacher Evaluation
This study examined teacher monitoring and evaluation with developmental
purposes in three main dimensions. First, it analyzed how teacher monitoring in test
language relates to student achievement in reading. Second, it explored how a principal’s
evaluative focus as a pedagogical leader relates to student achievement in the three subjects.
Third, the study looked at how the use of student assessments for instructional improvement
relates to student achievement in the three subjects.
Monitoring in test language. This study analyzed monitoring practices and their
relations with student achievement in reading as a developmental approach in the larger
framework of teacher evaluation. As defined in the introductory chapter, monitoring is an
on-going process of collecting and analyzing information to assess the progress being made
towards set goals and objectives and to take remedial steps. It also allows the stakeholders to
see how best to optimize progress towards achieving set goals and objectives.
The PISA 2009 asked school principals if teachers in test language were monitored
using student achievement, peer reviews, principal and staff observations, and observations
by an administrative authority. The findings showed that the use of student achievement and
observations by principals and staff for monitoring purposes in test language related
significantly and positively with student achievement. Peer reviews and observations by an
external authority remained positive but statistically insignificant when controlled for other
factors at the student, school, and country levels.
The positive relations between student achievement and the two approaches to
monitoring teachers in test language—student achievement and principal and staff
observations—show developmental utility of at least some of the monitoring activities in
107
reading. These findings go in line with the body of literature that emphasizes the importance
of developmental approaches to teacher monitoring and evaluation (e.g., Rockoff &
Speroni, 2010; Sartain et al., 2011; Taylor & Tyler, 2011; Wenglinsky, 2002). The positive
associations in this study mean that if the information obtained through monitoring activities
is utilized for informing teacher practice and making necessary adjustments in instructional
strategies, the implications for student achievement become significantly positive. This
takes the discussion back to the UNDP’s emphasis on the ‘feedback’ aspect of monitoring.
The UNDP states that through ‘monitoring’ activities, stakeholders, who in this case are
teachers, receive regular feedback on their practice so as to align their efforts to achieve
their teaching goals and objectives. A positive relation of monitoring practices with student
achievement shows that, at least in reading, teachers and principals are able to effectively
respond to the questions, “Are we taking the actions we said we would take?” (UNDP,
2002, p. 8), and “Are we making progress on achieving the results that we said we wanted to
achieve?” This on-going analysis of teacher practice and student learning provides teachers,
principals, and students the opportunity to reflect upon the outcomes and make necessary
adjustments in strategies accordingly. It means that principals and schools, who set a
developmental objective in monitoring the practice of teachers in test language, and for that
matter in any subject, may experience an improved student achievement by identifying and
working on aspects of instruction that need to be improved. In this sense, monitoring should
not aim at penalizing any teacher for a lack of ability to show better student test scores. It
should aim at enabling teachers to identify their professional skills that need improvement
and also to identify individual student learning needs that teachers would want to address in
their pedagogical approaches. Such approaches in teacher monitoring will not only create an
108
environment for reflection and collaboration, it will also lead to an improvement in the
overall instructional quality in schools and hence improved student learning including
improved student test scores.
Principals’ pedagogical role. Principals have a central role in ensuring quality in
teaching in schools. Principals fulfill this role through their pedagogical leadership wherein
they work with teachers to improve instructional environments in schools. Principals apply
various tools and strategies to meet this objective of improving teacher quality. Teacher
evaluation for developmental purposes is one approach that principals adopt to improve the
quality of their teaching workforce. In the words of Bossert, Dwyer, Rowan, and Lee
(1982), “One instructional management strategy that a principal can use…is to work directly
with a teacher in order to analyze classroom problems and prescribe specific changes in
features of the instructional organization that will improve student learning” (p. 41).
Furthermore, as per the findings in a recent study conducted by Donaldson (2011), teacher
evaluation seemed to be the only tool through which principals can identify strengths and
weaknesses in teaching and accordingly plan for improving instruction in classes. It was
with this perspective that in the study models employed here, three variables with a
developmental focus in teacher evaluations consisted of principal’s pedagogical role of
observing teachers, suggesting teachers for professional improvement, and informing
teachers about the opportunities for updating their knowledge and skills. These roles of the
principals can be construed as ‘evaluative’ in the sense that they set-forth for the principal
the logic of evaluating teachers and taking remedial steps to improve their practice.
There are consistent results across the models and subjects that the principals’
observation of teachers in classes and principals suggesting teachers how to improve their
109
practice bear insignificant relationships with student achievement in mathematics, science,
and reading. Principals informing teachers about possibilities for updating their knowledge
and skills also bear insignificant relationships with student achievement in reading and
science but significant negative relationship in mathematics. This is rather counter-intuitive
given the evidence from earlier studies where classroom observations and other
standardized as well as subjective approaches to assessing teachers were found to have a
positive associations with student achievement (e.g., Rockoff & Speroni, 2010; Sartain et
al., 2011; Taylor & Tyler, 2011; Tyler et al., 2010).
This anomaly can be looked at from different dimensions. It needs to be noted that
the data sources in my study were different from most of the cited evidence. None of these
studies used the PISA 2009 dataset to explore the relationships between principals’
pedagogical roles and student achievement. Even the studies that used the previous PISA
datasets did not specifically explore principals’ pedagogical roles related to teacher
monitoring and evaluation. For example, Sartain et al. (2011) used data from a pilot
program named Chicago’s Excellence in Teaching, a program launched in 2008. The
specific purpose of this program was to improve instructional quality through a process of
evaluating teachers followed by feedback and a program for teachers’ professional
development. Other studies (Taylor & Tyler, 2011; Tyler et al., 2010) also used evidence
from teacher evaluation programs that were in place and functioning in different educational
settings. Thus, the educational settings and hence the nature of the data in my study were not
the same as other cited studies. Therefore, it can be expected that findings in my study may
or may not concur with the prior evidence. But, what does this anomaly between findings in
110
my study and prior evidence suggest about principals’ pedagogical role in apprising teachers
with a developmental focus?
First, the insignificance of the results may be due to insignificant variation in the
frequency with which principals observed teachers in classes. This could also mean that
principals’ approaches to observing teachers and associated activities in the larger teacher
evaluation frameworks in schools may need careful planning and preparation. In the studies
cited above, classroom observations as instruments were used by evaluators including
principals in a highly structured fashion. In some studies, these evaluators had undergone
intensive training in conducting evaluations before actually doing any teacher evaluations
(e.g., in Taylor & Tyler, 2011). This means that an effective teacher evaluation conducted
for developmental purposes needs to establish clear standards and procedures as well as
rigorously trained evaluators (principals in the context of this discussion) in order to identify
nuances of teaching quality that are important in improving teachers’ professional practice.
In this sense, school principals must use classroom observations in a professional manner
such that they are able to work with individual teachers in their classrooms, identify their
professional development needs, and develop and implement plans that will help teachers
improve their practice.
Second, the anomaly also points towards the complex world of principals who are in
the midst of a plethora of tasks that they are supposed to carry out on a daily basis as school
leaders. In other words, in the real world of schooling, principals are not normally able to
spend time with every teacher in classroom and give feedback and follow-up on
professional improvement of individual teachers (Bossert, Dwyer, Rowan, & Lee, 1982). If
we look at the descriptive statistics on variables that capture principals’ pedagogical role in
111
schools, it appears that principals are not able to spend sufficient time with all teachers in
classrooms in the pooled sample of 21 countries. This is reflected in about 41% of students
enrolled in schools where principals only “seldom” observe teachers in classes. In contrast,
the majority of the principals appear to be suggesting teachers for professional improvement
and informing teachers about possibilities for updating their knowledge and skills. This is
reflected in 75% students enrolled in schools where principals reported that they suggested
teachers for improvement and over 90% students enrolled in schools where principals
informed teachers about possibilities for updating their knowledge and skills. Thus, while a
large majority of principals were suggesting teachers for improvement and informing them
about possibilities for updating their knowledge and skills, they seemed to do so with a
limited amount of time that they spent with teachers in classrooms as around 50% of
students were enrolled in schools where principals seldom or never observed teachers in
classes. However, because principals are heavily loaded with many of their administrative
and other tasks in schools (Bossert, Dwyer, Rowan & Lee, 1982), finding quality time to
spend with individual teachers in classes appears to be a challenge for principals across the
pooled sample of 21 countries. While all these explanations are at best speculative in nature,
the insignificant findings in this category suggest that principals’ pedagogical role as related
to teacher evaluation is not associated with improved student achievement in the form of
student test scores.
Use of student assessment for instructional improvement. Using student
assessments for instructional improvement as part of the developmental approaches to
teacher evaluation was found to be insignificant in all the three subjects. This finding runs
counter to the evidence from earlier empirical studies where positive correlations have been
112
found between the use of student assessments for instructional improvement and student
achievement. This insignificance of the use of student data for instructional improvement
and hence student achievement may result from many possible scenarios. First, there may
just not be enough variation associated with this practice and hence insignificant results.
This could also mean that in the pooled sample of 21 countries, the use of student
information for the purposes of improving instructional practice may be suffering from
issues of focus across schools.
A discussion of focus on using student assessments for improving instruction takes
us back to Wenglinsky (2002) who emphasized the importance of classroom dynamics in
relation to student learning and achievement. Wenglinsky (2002) found that teaching quality
was as strong a factor for student achievement as any other important school level factor.
Furthermore, using authentic student assessment can uncover dynamics in student learning
that are important for developing higher-order critical thinking approaches among students.
Information from such authentic assessments can be used in a deliberative fashion where
teachers are engaged in reflection and collaboration, as was the case in the study by
Wayman and Stringfield (2006), leading to improved student learning outcomes. Wayman
and Stringfield (2006) suggest a holistic focus of the use of student data where the purpose
is to explore and improve factors in classroom practices and processes that aim at promoting
higher order thinking skills of students.
Since a large majority (83.25%) of students was enrolled in schools where student
assessments (standardized tests, teacher developed tests, teachers’ judgmental ratings,
student portfolios, and student assignments/project/homework) were used for the purposes
of improving aspects of instruction and curriculum, an insignificant relation between this
113
practice and student achievement may be attributed to a narrow focus on the objectives of
this practice in these schools. A ‘teaching to the test’ effect may also come into play when
high-stakes are attached to student assessments. In order to maneuver around those high-
stakes, schools and teachers may resort to practices that result in narrowing of the
curriculum (e.g., Berliner, 2011; Crocco & Costigan, 2007; Klein, Hamilton, McCaffrey, &
Stecher, 2000; Jerald, 2006; Koretz, 2002, 2008; Linn, 2000; Menken, 2006; Reid, 2012). If
the schools are having a narrow focus on just improving student test scores in a given
subject on a regional, state or national test, this may reflect in negative implications for
student learning when the outcome variable in my study—standardized PISA tests with a
holistic approach to assessment of student learning—demands a holistic coverage of the
taught content and student learning objectives. The PISA is comprehensive in its coverage
of the taught curriculum where the purpose is to assess if a student is able to apply learning
in his/her real life. The negative and insignificant findings hint at the possibility that schools
are using student information including achievement data to prepare them for specific
content, test format, or both.
The issue could also be a result of lack of training of teachers in the proper use of
student data for making instructional decisions. Sharkey and Murnane (2005) highlight the
need to develop necessary skills in meaningful handling of the student data. They emphasize
that such use of the student data should focus on meaningful, correct assessment, and
understanding of the data. Teachers should be able to effectively use technological support,
participate in group conversations and collaborate on tackling sensitive issues and adopt a
developmental approach to the use of student data. In order for schools to be able to make
effective and constructive use of data to improve instruction, Skarkey and Murnane (2005)
114
argue that the authorities in central offices need to play a major role in providing necessary
support and training to teachers and schools. Furthermore, in their discussion of effective
and efficient use of the student data, Boudett, Murnane, City, and Moody (2005) suggest
that teachers should be able to “1) identify patterns in data, 2) choose pattern to explore, 3)
dig deeper, 4) agree on problem, 5) ask why, 6) examine current practices, 7) develop action
plan, 8) implement action plan, and 9) assess action plan” (Boudett, Murnane, City, &
Moody, 2005, p. 701). They further suggest using technological tools to assist educators in
thinking “…about data in structured ways…” and collaborate on action plans based on the
findings from the data. Thus, Boudett and colleagues emphasize on enabling educators to
get the real feel of the structure of the data, contextualize the information that the data
carries, and think and collaborate to come up with effective instructional alternatives. They
stress on the importance of generating deep conversations among colleagues in ways that
such conversations lead to improved instructional effectiveness for all teachers. Seen in this
perspective, the use of student data for instructional improvement should not just focus on
how best to teach curriculum for better student test scores. Such use of student data should
also involve critical analysis of student performance to identify student learning needs and
develop strategies to meet those needs through careful planning of instruction.
Feldman and Tung (2001) who studied six schools that practiced Data Based Inquiry
and Decision Making (DBDM) found that teachers in these schools used student results to
reflect upon their practices and make recommendations to the wider school on how to
improve student performance. The reflective and collaborative culture associated with the
use of student data was important for improving teachers’ professional competencies and
skills and hence carried potential for improving student achievement in the six schools that
115
they studied. Similarly, Wayman and Stringfield (2006) explored the use of technology in
making sense of student data and found that the use of student data through efficient
technology and proper administrative support resulted in teacher collaboration and improved
classroom practices. Such studies indicate the instructional utility of the developmental use
of student assessments. It can be proposed based on these prior studies that the use of
student data for improving instructional quality in schools should lead to improved student
achievement. The insignificance of the findings in this study may stem from the one-level
analysis while the variation may become significant only when multi-level analyses are
carried out.
High-Stakes Approaches to Teacher Evaluation
This study explored relations between high-stakes approaches to evaluating teachers
and student achievement. As explained in the chapter on literature review, some of the
frequently used approaches in high-stakes teacher evaluation systems are public
accountability, use of student assessments to evaluate and judge teachers, and tracking of
student assessments by an administrative authority.
Public accountability. Public disclosure of teacher performance in the form of
student test scores and control through government is considered to be public accountability
with high-stakes outcomes. In this approach, student performance is shared with students,
teachers, administrators, parents, and the larger public through various means (Hooge,
Burns, Wilkoszewski, & Harald, 2012). Results in this study indicate that public
accountability related positively and significantly with student achievement in all three
subjects. These results are consistent with findings in prior studies that explored relations
116
between student achievement and accountability (e.g., Hanushek & Raymond, 2005; Jürges,
Richter, & Schneider, 2005; Levacic, 2004; West & Peterson, 2006).
According to Hanushek and Raymond (2005) public accountability just through
posting of student achievement data for public use without any consequence attached does
not yield improved student achievement. Based on their findings, they posit that
accountability may lead to improved student achievement when a high-stakes outcome is
attached to the process. Similarly, Jürges, Richter, and Schneider (2005) in their
comparative study of the states in Germany found that using Central Exit Exams (CEEs) for
benchmarking purposes raised student achievement. They attributed this raise in student
achievement to non-monetary aspects of public accountability where teachers put in extra
effort to safeguard their reputation. Thus, findings in my study highlight the aspects of
public accountability wherein different high-stakes such as a change in salary or
professional reputation are becoming important extrinsic motivating factors for teachers to
cause them to put in additional effort to raise student achievement in the form of student test
scores.
However, this positive relation of public accountability with high-stakes purposes
needs to be interpreted with caution since it also entails other consequences that are
unintended and in some instances detrimental to the overall educational goals of schools.
The unintended consequences may come in the form of dissipation of teacher morale and
deterioration of a culture of collaboration among teachers (Farrell & Morris, 2004), a
narrowing of focus in content and curriculum (Berliner, 2011), and harmful effects such as
dropouts for students particularly from disadvantaged backgrounds (McNeil & Valenzuela,
2001; McNeil, Coppola, Radigan, & Vasquez Heilig, 2008).
117
Use of student assessments to evaluate and judge teachers, and administrative
tracking. The findings show that the use of student assessments to evaluate and judge
teachers and administrative tracking of student assessments bear overall negative though in
most cases insignificant relationships with student achievement in the three subjects. In the
case of science and reading, the use of student assessments for evaluating teachers showed a
significant negative association with student achievement.
These results are largely consistent with findings from OECD (2010a) that showed
that internal student assessments carried out by schools did not bear a discernible connection
with student achievement. OECD (2010a) found that tracking of achievement data by an
administrative authority lead to a statistically insignificant and negative change in score (Δ=
-1.4) in reading performance when there were no control variables in the models. The
change in score turned positive but still remained statistically insignificant when additional
measures were placed in the models at the student, schools, and country levels.
On the contrary, my study’s findings conflict what Schütz et al. (2007) and
Wößmann et al. (2007) found in their analyses. They found that achievement tracked by
administrative authority remained positive and statistically significant in their analyses.
These researchers, however, used the PISA 2003 dataset to explore cross-country variations
with multilevel weighted least square regressions in their analyses. This difference in
models points towards the possibility that the tracking of student assessments by an
administrative authority as a national policy may have a fixed effect on all schools within
the country which is not strong enough to be observed in student level analyses. The
variance appears to become effective and significant only when multilevel modeling
approaches are used to analyze the PISA dataset which is multistage and complex in nature.
118
All in all, results in this study challenge the proposition wherein student test scores
are offered as effective measures of teacher performance in high-stakes teacher evaluation
systems (e.g., Goldhaber & Hansen, 2010; Sanders & Horn, 1994; Stronge & Tucker, 2000;
Wright et al., 1997). In essence, the overall findings of the study on the use of student
assessments in teacher evaluations are in line with the assertions from scholars who caution
over using student assessments as the sole measures of teacher performance (e.g., Baker et
al., 2010; Darling-Hammond, Amrein-Beardsley, Haertel, & Rothstein, 2012; Mathis, 2012;
Rosenkvist, 2010). The findings also raise flags in terms of negative consequences of high-
stakes teacher evaluations. Suen and Yu (2006) in their analysis of the Chinese examination
system Keju emphatically assert that any testing and assessment system with high-stakes
attached to it will lead to “social consequences” that will render validity of such measures
problematic. The social consequences could be long lasting that include “rote
memorization,” “cheating,” “focus on test-taking skills,” and “psychopathological effects on
the examinee.” While they studied these social consequences from students’ perspectives
who are subjected to high-stakes testing, the “social consequences” could well be associated
with teachers as well who may experience similar consequences as results of high-stakes in
their evaluations. Suen and Lu’s (2006) suggestion that the issues of assessment validity
emanating from these social consequences can most effectively be addressed by detaching
some of the high-stakes from testing and assessments. The same suggestion may hold true
for teacher evaluation with high-stakes as well. Thus, it can be suggested that using student
assessments for evaluating and judging teacher effectiveness is a strategy with potential
negative fall-outs for teachers’ practice and student learning.
119
Interactions
This study looked at three interactions as products of school level factors and teacher
evaluation practices. The study hypothesized that classrooms observations should become
important and significant when parents are informed about the progress of their children,
principals having authority to make salary changes, and school type being private. I will
discuss here only two interactions that appeared significant in the analyses.
Though the classroom observations by principals as a main predictor showed a
negative association with student achievement in the models consisting of principals’
pedagogical roles, teachers reporting classroom observations as “important” and “highly
important” in their appraisals showed a positive and significant association with student
achievement when it interacted with parents being informed about the progress of their
children. Similarly, classroom observations being “important” and “highly important” as
criteria in teacher appraisals showed positive and significant interactions with principals’
authority in making changes in teachers’ salaries in science and reading.
This is in consonance with the findings from Wößmann et al. (2007) wherein
interactions between “autonomy in formulating school budget” and “accountability” aspects
of schools showed as positive and significant in relation to student achievement. In this
sense, looking at the phenomenon closely, informing parents about the progress of their
children makes principals and teachers accountable in front of parents in terms of their
personal professional reputation and hence career prospects in schools. The positive
interaction between classroom observations as important criteria in teacher evaluations and
informing parents about the progress of their children also confirms previous research and
scholarly evidence on the important and significant role of parents in schools (e.g.,
120
Henderson, 1987, 1988; Fan & Chen, 2001). The earlier evidence on the effects and
relations of parental involvement in schools overwhelmingly suggests a positive association
with student achievement (Fan & Chen, 2001; Ingram, Wolfe, & Lieberman, 2007; Jeynes,
2012; Sui-Chu & Willms, 1996). While parents have different reasons to involve themselves
in the schools where their children are enrolled, the findings in this study show that parental
involvement plays over and above those reasons in relation to student achievement. Parental
involvement through the disclosure of their children’s progress appears to be leading the
principals to make their classroom observations effective at raising student achievement.
This suggests that making teachers more accountable for their performance while at the
same time having a developmental purpose attached to teacher evaluation can have
significantly positive implications for student achievement.
The same logic can be extended to the significant positive interaction between
classroom observations being “important” and “highly important” as criteria in teacher
appraisals and principals authority in making changes in teachers’ salaries. When teachers
are held accountable for the quality of their practice through principals’ authority to make
changes in their salaries, it appears to make classroom observations effective at raising
student achievement. Teachers and principals appear to be producing meaningful
interactions through classroom observations that lead both to work towards the intended
goals of improving classroom practices and hence student achievement. This could also
mean that principals are able to assert their authority and push teachers to follow the school
goals of raising student achievement in the form of student test scores.
121
Teacher Evaluation: Country Variables
As described in the methods section, 8 variables at the country level were reduced to
two components namely “professional outcomes” and “others.” The first component showed
a negative and significant association with student achievement in all three subjects. The
negative association with student achievement goes in line with the body of literature that
cautions against using such measures as student tests scores as the sole measures of
teachers’ performance (e.g. Darling-Hammond, Amrein-Beardsley, Haertel, & Rothstein,
2012; Mathis, 2012; Rosenkvist, 2010). At the same time, while the relationship is found to
be negative for this component which also consists of some developmental criteria in
teacher evaluations, earlier studies such as Wenglinsky (2002) and Taylor and Tyler (2011)
show the efficacy of developmental approaches to teacher evaluation such as direct
appraisal of classes, innovation in teaching, and professional development undertaken. This
discrepancy in findings of this study necessitates further probing of the effects of individual
country level variables as used in this study. The mismatch between findings in my study
and earlier studies also opens up avenues for exploring opportunities and challenges of
combining the two important international datasets—PISA and TALIS—for statistical
analyses on complex classroom processes.
The second component on criteria for teacher appraisals, “others,” included feedback
from parents and relations with colleagues. The results showed that this component related
negatively to student achievement in mathematics and reading. The component showed a
negative but insignificant association with student achievement in science. This suggests
that while parental involvement is a strategy in the right direction as regards raising student
achievement for all students, using parental feedback as a criterion in teacher appraisals is
122
not associated with positive outcomes for student achievement. Similarly, positive relations
with colleagues can contribute significantly in generating a synergy and an atmosphere of
collaboration among teachers, using this as a criterion for teacher appraisal appears to be an
ineffective strategy in teacher evaluations.
The third component consisted of outcomes and impact of teacher evaluation on
various aspects of teachers’ professional lives. This component showed a positive
significant association with student achievement in mathematics. In science it showed as
insignificant and positive while in reading it delivered a significant negative association
with student achievement; thus, this component at best showed mixed results. A closer look
at these variables shows that many of these are high-stakes in nature involving significant
effects on teachers’ career and employability. In the case of mathematics, these findings
point towards the assertions from earlier studies (e.g., Schütz et al., 2007; Wößmann et al.,
2007) that highlight the importance of attaching high-stakes outcomes to teacher evaluation.
Furthermore, positive association in mathematics, an insignificant positive
association in science, and a significant negative association in reading point toward a
complex dynamic that appears to be at play with regard to the relative importance of these
subjects in schools. Given the general observation that mathematics and science receive
greater attention in schools as “key” or “important” subjects, in the case of mathematics, this
might well be a result of a disproportionate importance accorded to teachers of mathematics
and to some extent to the teachers of science. Teachers of mathematics may be expected to
place a greater emphasis on student test scores and accordingly they may be able produce
better results compared to teachers in reading thereby leading to a differential award in
terms of monetary incentives, public recognition, a greater role in school development, and
123
more opportunities for professional development for teachers of mathematics. In reading,
these aspects may run against the subject teachers by not receiving, for example, as much a
share of the incentives as teachers in mathematics and science and hence may appear as a
demotivating factor for teachers in this subject.
Following this line of argument, it may be relevant to propose to offer differential
incentives to teachers based on their performance. However, such a proposition suffers
challenges in the light of evidence from other studies where incentives such as pay-for-
performance approaches suggest negative (e.g., Fryer, 2013), weak, or at best mixed effects
on student achievement (e.g., Springer et al., 2012). Also, as stated earlier, teacher
evaluations with high-stakes consequences have been found to have other negative social
effects such as a decline in teacher collaboration (e.g., Farrell & Morris, 2004), narrowing of
curriculum (Menken, 2006), and other social consequences which are detrimental in nature
(Suen & Lu, 2006). As far as findings of this study go, a high-stakes effect is visible in
teacher evaluation practices in relation to student achievement in mathematics, and to some
extent in science. Teachers of mathematics appear to be making additional efforts in helping
students to score better in their assessments. This association appears to be a result of
extrinsic incentives to safeguard professional reputation, secure a positive change in salary,
and/or a change in work responsibilities in schools.
Policy Implications and Recommendations
In the light of the findings of the study and how these findings are situated within the
larger body of prior evidence and literature on the subject, some key policy implications and
recommendations are suggested here.
124
Given that the schools across OECD countries rely heavily on classroom
observations to assess and evaluate teachers (Isoré, 2009), when it comes to evaluating and
developing quality of teaching workforce, it becomes paramount to look at ways through
which this tool can be made effective in the hands of principals and other observers in
schools. As Danielson and McGreal (2000) liken classroom observation to teacher
evaluation counting it as the most effective way to witness the interactions between teachers
and students, schools need to identify ways through which this tool can be effectively
utilized in classrooms. Because teacher evaluation mostly happens internally in schools
(OECD, 2009b), classroom observations by principals need to be looked into for their
efficacy. This also becomes necessary to improve efficacy of classroom observations to
improve teachers and teaching since 73% of the teachers accorded highest importance to
classroom observations as criteria in their appraisals (OECD, 2009b). In contrast to this high
majority of teachers according high importance to classroom observations as criteria in their
appraisals, about 50% of the students were enrolled in schools where principals seldom or
never observed teachers in classes. This exposes somewhat a mismatch between what
teachers consider as important in their appraisal criteria and principals’ administrative and
pedagogical focus in schools. In the light of this mismatch in the focus on the part of school
principals and teachers’ expectations of their appraisal criteria, it would be important for the
former to assess their roles as pedagogical leaders in schools. Such an assessment should
lead principals to give quality time to individual teachers in their classrooms to guide them
towards improving instructional practices. Principals should develop an enriched picture of
teachers’ practices in classes, assess their skills based on this enriched picture, and devise
effective strategies for teachers’ development tailored to the individual needs of teachers. In
125
this regard, it would be a wise policy to develop principals as effective pedagogical leaders
who are using classroom observations and other developmental approaches to assess
teachers’ effectiveness, and who are working closely with individual teachers to improve
instruction for the optimal learning outcomes for all students.
Second, teacher monitoring in test language and for that matter in any other subject
has the potential to raise student achievement. If schools are able to effectively utilize this
approach to identify strengths and weaknesses in teachers’ practice and accordingly plan for
adjustment of progress towards achieving instructional goals and objectives, teacher
monitoring can be an effective tool for raising student achievement.
Third, using student assessments for making high-stakes decisions in teacher
evaluations have important policy implications. Student assessments as used for teacher
evaluation and for administrative tracking, which often come with high-stakes
consequences, show negative and in some cases significant associations with student
achievement. In the light of this, it can be suggested that student assessments as criteria for
teacher evaluation and tracking of the same by an administrative authority need careful
examination. It will be in the hands of the schools to decide if and how much of a share
should be given to student assessments as criteria in teacher evaluation mechanisms.
Schools will have to carefully note that the use of student assessments in high-stakes teacher
evaluations entail the danger of spiraling the instructional processes into what is commonly
known as “teaching to the test” effect while producing other negative social consequences as
prior evidence suggests (Berliner, 2011; Crocco & Costigan, 2007; Klein, Hamilton,
McCaffrey, & Stecher, 2000; Jerald, 2006; Koretz, 2002, 2008; Menken, 2006; Suen & Lu,
2006). Therefore, it appears a relevant and important strategy and policy for schools to cut
126
down on the share of student assessments in teacher evaluations with high-stakes
consequences. Schools can use other valid measures such as standards-based classroom
observations and rubrics that have greater developmental potential. Also, schools may
seriously re-look into their practice of using student test scores as the sole measures of
teacher performance. Rosenkvist (2010) asserts, using evidence from earlier studies on the
subject, that using student test results as the sole measure of teacher performance for making
high-stakes decisions about teachers is inadequate. Mathis (2012) also warns of using
student test scores as the only measures of assessing teachers in high-stakes evaluations. He
posits:
While such summative evaluations can be useful, lawmakers should be wary of
approaches based in large part on test scores: the error in the measurements is
large—which results in many teachers being incorrectly labeled as effective or
ineffective; relevant test scores are not available for the students taught by most
teachers, given that only certain grade levels and subject areas are tested; and the
incentives created by high-stakes use of test scores drive undesirable teaching
practices such as curriculum narrowing and teaching to the test. (p. 1)
In the light of this and the fact that across TALIS countries, with few exceptions, more than
50% of the criteria for teacher appraisal is in the form of student test scores (OECD, 2009b),
schools and policymakers may need to review their strategies on using student performance
as an evidence of teacher performance in their teacher evaluation systems.
Fourth, public accountability offers potential pay-offs with regard to raising student
achievement in the form of student test scores. Schools can assess their local situations and
accountability environments and devise strategies on how effective it could be for them to
127
make student performance public. However, caution should be practiced in the use of this
approach since attaching a high-stakes consequence almost invariably produces unintended
consequences. Teacher morale, collaboration, teacher-student relations, and a number of
other contextual and cultural factors may be negatively affected because of this practice
leading to long term harmful effects. Schools will have to carefully analyze the tradeoffs
between having this practice and the potential long-term gains. As far as findings of this
study go, public accountability establishes a positive link with student test scores in
mathematics, science, and reading.
Fifth, the positive interactions between classroom observations and informing
parents about their children’s progress and principals having authority in making changes in
teachers’ salaries lead to two important policy recommendations. First, parental involvement
in schools shows as important with reference to one key process—classroom observations.
It is widely understood that parental involvement is important if the purpose is to enhance
student learning outcomes (Fan & Chen, 2001; Ingram, Wolfe, & Lieberman, 2007; Jeynes,
2012). Similarly, when schools and teachers are made accountable to parents, it reflects
positively in enhancing efficacy of within-school processes such as classroom observations.
Therefore, it would be important for policymakers and educators to enhance parental
involvement in schools. Parental involvement undoubtedly brings its own challenges.
However, the potential pay-offs seem to far outweigh the challenges. Parents can bring in
aspects of student learning that schools and educators may not independently grasp. Parents
can assist educators to identify and meet individual student needs which otherwise may go
undetected when there is a gap between educators and parents. All these positive aspects of
parental involvement have significant potential to ultimately raise student achievement for
128
all students. At the same time, while parental involvement should be promoted, their
feedback on teaching as a criterion for teacher appraisal should be avoided given that this
variable returned a negative relation with student achievement in this study. Secondly,
principals’ authority to make changes in teachers’ salaries may be promoted as part of
reforms aimed at school-based management. However, once again, attaching high-stakes
consequences may show short term gains in student achievement, they may not be effective
in the long run and that student learning may suffer from issues of watering-down of
curriculum leading to a “teaching to the test” effect.
Last but not the least, evidence on the variation in student and school level
constructs shows that student achievement is overwhelmingly influenced by issues
surrounding students’ socioeconomic backgrounds, educational resources in schools, and
other demographic factors. Policies of teacher evaluation and other educational processes
would not likely succeed when there is an inadequate supply of direly needed educational
resources, when there are huge income disparities across different socioeconomic strata, and
when there are dichotomies in educational systems that lead to different outcomes for
children from different socioeconomic backgrounds. It will be paramount for effective
policy development in schools to equalize all these key background and school level factors
thereby providing a level playing field for all students in all classes.
Limitations of the Study
As I stated at the outset of this chapter, the study suffers from some limitations that
need to be considered before generalizing the findings beyond the target population of
countries from which the sample is drawn. First, the study looks at student achievement only
in the form of student test scores as reflected in the PISA tests on mathematics, science, and
129
reading. Many scholars have singled out the limitations of using student achievement in the
form of student test scores in a monolithic fashion to assess teacher effectiveness (Baker et
al., 2010; Darling-Hammond et al., 2012; Klein et al., 2000; Koretz, 2008; Kornhaber,
2004a; Mathis, 2012; Rosenkvist, 2010). They rightly assert that the student test scores
present a limited view of student learning and that using this limited information to make
consequential decisions about tenure, teacher salaries, and other key matters related to
teachers are likely to lead to inflated scores without commensurate gains in students’
knowledge and skills. Thus, findings in this study should be looked at in relation to
effectiveness or otherwise of teacher evaluation practices and purposes in raising student
achievement only in the form of student test scores.
The second major limitation of the study stems from the specifications of the study
models. The study has explored relationships between student achievement and teacher
monitoring and evaluation at one level i.e., student level in a pooled sample of 21 countries.
It needs to be noted that having an aggregate sample and employing one-level cross-country
analysis may be problematic given the complex sampling structure in the PISA 2009 survey.
Such a cross-country analysis at one level may distort or curtail the true picture of the
variation across different levels. Some of the variation that can be attributed to country level
may be making its way down to student level thereby giving an inflated picture of the
between-subjects variance. Also, some of the relationships that appear insignificant in an
aggregate sample may appear significant in multi-level analyses since one-level analyses at
student level assumes fixed effects across countries. Some of these limitations have been
offset by creating interaction terms between different levels of the data as described earlier
in the methods on variables. However, the issue may still persist since we know that
130
countries, and in many cases schools within a country, differ in terms of their evaluation
practices and purposes. It is expected that these between-country and between-school
variations, wherever significant and applicable, will not greatly compromise the findings in
this study since the OLS models employed here make use of student weights in combination
with all five plausible values using the standard procedures suggested by OECD (2009c).
A third possible limitation of the study arises from the very focus and content of the
PISA 2009 survey. PISA 2009 sought information from principals on teacher evaluation and
appraisal practices in a highly structured fashion. Except for the items covering principals’
pedagogical role in teacher evaluations, all main variables in this study that related to
teacher evaluation and appraisal were structured on a “Yes/No” basis. This may have
resulted in a loss of important information as regards intricate details of teacher monitoring
and evaluation practices in schools. Thus, while teacher monitoring and evaluation are
complicated processes with huge variation across countries and even within countries across
schools and systems, the “Yes/No” format in the survey does not cover the full range of the
complex dynamics of the process. Some of this limitation has been allayed by combining
information from the TALIS 2008 that presents multidimensional and more detailed
information on teacher evaluation practices and purposes by incorporating teachers’ views
and experiences on the subject.
Recommendations for Further Research
The study offers some recommendations for future research around teacher
monitoring and evaluation. First, studies involving multilevel mixed (random and fixed)
models around different approaches and purposes of teacher monitoring and evaluation
using both the datasets—PISA and TALIS—in conjunction will be a valuable scholarly
131
pursuit. Since there is variation in teacher evaluation practices and purposes across schools
as well as across countries, the multilevel models should look at between school and cross-
country variations separately to identify differences in practices at the level of schools and
countries. In such analyses, it would be relevant to use the primary TALIS dataset in
conjunction with the primary PISA dataset. However, combining both the datasets may pose
technical challenges since there is no common identifier in the datasets at the school and
student levels to enable researchers to merge the two datasets. Therefore, a more relevant
recommendation for the PISA and TALIS surveys would be to combine school, teacher, and
student information in one survey, thereby covering a whole range of teacher monitoring
and evaluation in schools.
The study also recommends exploring teacher evaluation practices in quasi-
experimental settings to uncover dynamics that are making classroom observations effective
when combined with parental involvement and principals’ authority in making changes in
teachers’ salaries. The finding that classroom observations given high importance in schools
establishes significant positive relations with student achievement when interacted with
parental involvement and principals’ authority in making changes in teacher salaries, it will
be an important scholarly pursuit to explore dynamics undergirding such interactions. For
example, how parents are causing principals’ observations of teachers to become effective
when they are informed of the progress of their children would constitute as an important
study to highlight the subtleties of this relationship in schools.
Case studies of select groups of countries with radically different approaches in
teacher evaluation systems would also be a fruitful area to explore. For example, Finland is
a top performing PISA country yet it has minimal teacher evaluations in schools. On the
132
other hand, Chile has high activity around teacher evaluations but its performance in the
PISA assessments is not as promising. A significant portion of teacher evaluation in Chile
leads to high-stakes consequences including financial rewards and in some cases dismissal
from service. Thus, it would be academically and policy-wise a relevant pursuit to single out
countries at the extremes of student performance and teacher evaluation approaches to see
what aspects of teacher evaluations are really important when it comes to raising student
achievement.
Conclusions
Teacher quality is one of the most significant determinants of student achievement in
schools. A quality teaching workforce delivering high-quality instruction for the benefit of
all students in schools has been found to be a key policy ingredient of some of the world’s
top performing education systems. In their study of world’s high-performing school
systems, Barber and Mourshed (2007) emphatically put forward that:
…high-performing school systems, though strikingly different in construct and
context, maintained a strong focus on improving instruction because of its direct
impact upon student achievement. To improve instruction, these high-performing
school systems consistently do three things well:
- They get the right people to become teachers (the quality of an education system
cannot exceed the quality of its teachers).
- They develop these people into effective instructors (the only way to improve
outcomes is to improve instruction).
133
- They put in place systems and targeted support to ensure that every child is able
to benefit from excellent instruction (the only way for the system to reach the
highest performance is to raise the standard for every student). (p. 13)
In the light of such convincing arguments on the critical place that instruction and teacher
quality assume in the world of schooling, reforming and improving teacher monitoring and
evaluation appear to be relevant policy pursuits. Schools can use teacher monitoring and
evaluation as tools to improve teacher effectiveness for improving student learning
outcomes including student test scores.
This study looked at teacher monitoring and evaluation practices and purposes and
their relationships with student achievement in the form of student test scores captured by
the PISA 2009 survey. As the findings of this study as well as prior evidence suggest,
teacher monitoring and evaluation are multifaceted approaches with different purposes and
outcomes. The evidence in this study has only confirmed the complexity of the process
while exploring its potential utility in raising achievement for all students. The study
suggests that while it is important to assess teachers in order to improve their quality, there
is no one unified approach that is eclectic in terms of its efficacy in raising student
achievement in different educational contexts across the globe. Thus, devising a feasible
teacher monitoring and evaluation system for a specific educational context will largely
remain with the policymakers at each level of governance to work in congruence to come up
with the best design that can be effective in local conditions of each school system.
However, some of the findings of this study that remained in conflict with prior evidence
suggest that policymakers, educators, and school leaders must base their policies on rigorous
research. The evidence should mostly come from studies conducted in the context in which
134
the teacher evaluation policies are meant to be applied. Findings from studies in other
educational contexts should only serve as spurs to generate meaningful conversations
among key stakeholders around viable policy alternatives.
The bottom line of all this discussion can be summed up in the words of Kornhaber
(2004b):
There are many purposes and forms of assessment. However, there should be just
one motivation: assessment should serve as a tool to enhance all students’
knowledge, skills and understanding so that they can function at the highest possible
level in the wider world. (p. 91)
Extrapolating Kornhaber’s argument to teacher monitoring and evaluation and paraphrasing
her statement to suit the subject matter, it would be logical to suggest that the purpose of any
teacher monitoring and evaluation system should have just one motivation: it should serve
to enhance teachers’ capacities, skills, and knowledge and understanding so that they can
function at the highest possible level of their professional capacity to enable all students to
function at the highest possible level in the wider world. Policymakers can achieve this goal
by striking a balance between developmental and high-stakes approaches to teacher
monitoring and evaluation. The study suggests that teacher monitoring and evaluation must
be used only as means to achieve an end. Teacher evaluation must not become an end, and
for that matter a punitive one, in itself with the end being improved quality in instruction
and hence optimal student learning outcomes for all students. Last but not the least,
governments and policymakers need to equalize educational opportunity for all students by
removing the barriers associated with the socioeconomic disparities. If these barriers persist,
135
students will be limited in their ability to optimally benefit from otherwise well-intended
policy reforms including reforms to improve teacher monitoring and evaluation practices.
136
References
Astin, A.W. (1982). Excellence and equity in American education. Washington, DC:
National Commission on Excellence in Education. Retrieved from ERIC Database.
(ED 227098)
Baker, E. L., Barton, P. E., Darling-Hammond, L., Haertel, E., Ladd, H. F., Linn, R. L., …
Shepard, L. A. (2010). Problems with the use of student test scores to evaluate
teachers (Briefing Paper No. 278). Washington, DC: Economic Policy Institute.
Retrieved from ERIC database. (ED516803)
Barber, M., & Mourshed, M. (2007). How the world’s best school-systems come out on top?
McKinsey&Company. Retrieved May 20, 2012 from
http://mckinseyonsociety.com/downloads/reports/Education/Worlds_School_Systems
_Final.pdf
Beese, J., & Liang, X. (2010). Do resources matter? PISA science achievement comparisons
between students in the United States, Canada and Finland. Improving Schools, 13(3),
266–279. doi:10.1177/1365480210390554
Berliner, D. (2011). Rational responses to high-stakes testing: The case of curriculum
narrowing and the harm that follows. Cambridge Journal of Education, 41(3), 287–
302.
Bingham, R. D., Heywood, J. S., & White, S. B. (1991). Evaluating schools and teachers
based on student performance: Testing and alternative methodology. Evaluation
Review, 15(2), 191–218.
Bishop, J. H. (1997). The effect of national standards and curriculum-based exams on
achievement. American Economic Review, 87(2), 260-264.
137
Bishop, J. H. (1999). Are national exit examinations important for educational efficiency?
Swedish Economic Policy Review, 6 (2), 349-398.
Borman, G. D., & Kimball, S. M. (2005). Teacher quality and educational equality: Do
teachers with higher standards-based evaluation ratings close student achievement
gaps? The Elementary School Journal, 106(1), 3–20.
Bossert, S. T., Dwyer, D. C., Rowan, B., & Lee, G. V. (1982). The instructional
management role of the principal. Educational Administration Quarterly, 18(3), 34–64.
doi:10.1177/0013161X82018003004
Boudett, K. P., Murnane, R. J., City, E., & Moody, L. (2005). Teaching educators how to
use student assessment data to improve instruction. The Phi Delta Kappan, 86(9), 700-
706.
Bovens, M. (2005). Public accountability. In Ferlie, E., Lynn, L. E., & C. Pollitt (Eds.), The
Oxford Handbook of Public Management (pp. 182-208). Oxford: Oxford University
Press.
Buddin, R., & Zamarro, G. (2009). Teacher qualifications and student achievement in urban
elementary schools. Journal of Urban Economics, 66(2), 103–115.
doi:10.1016/j.jue.2009.05.001
Carlson, R. V., & Park, R. (1976). Teacher evaluation: Relevant concepts and procedures.
Retrieved from Eric Database. (ED 129 739)
Cohen, D. K., & Hill, H. C. (2000). Instructional policy and classroom performance: The
mathematics reform in California. Teachers College Record, 102(2), 294-343.
138
Crocco, M. S., & Costigan, A. T. (2007). The narrowing of curriculum and pedagogy in the
age of accountability: Urban educators speak out. Urban Education, 42(6), 512–535.
doi:10.1177/0042085907304964
Danielson, C. (1996). Enhancing professional practice: A framework for teaching.
Alexandria, VA: Association for Supervision and Curriculum Development.
Danielson, C., & McGreal, T. L. (2000). Teacher evaluation to enhance professional
practice. Alexandria, VA: Association for Supervision and Curriculum
Development.
Darling-Hammond, B. L., Amrein-Beardsley, A., Haertel, E., & Rothstein, J. (2012).
Evaluating teacher evaluation. Phi Dalta Kappan, 93(06), 8-15.
Darling-Hammond, L. (2000). Teacher quality and student achievement: A review of state
policy evidence. Education Policy Archives, 8(1), 1–44.
Demir, İ., Kılıç, S., & Ünal, H. (2010). Effects of students’ and schools’ characteristics on
mathematics achievement: Findings from PISA 2006. Procedia - Social and
Behavioral Sciences, 2(2), 3099–3103. doi:10.1016/j.sbspro.2010.03.472
Demir, İ., Ünal, H., & Kılıç, S. (2010). The effect of quality of educational resources on
mathematics achievement: Turkish case from PISA-2006. Procedia - Social and
Behavioral Sciences, 2(2), 1855–1859. doi:10.1016/j.sbspro.2010.03.998
Development Assistance Committee [DAC] (n.d.). Glossary of key terms in evaluation and
results based management. Retrieved from Organization for Economic Cooperation
and Development [OECD] website: http://www.oecd.org/dac/evaluation/18074294.pdf
Donaldson, M. L. (2009). So Long, Lake Wobegon ? Using teacher evaluation to raise
teacher quality. Retrieved from Center for American Progress website:
139
http://www.americanprogress.org/issues/education/report/2009/06/25/6243/so-long-
lake-wobegon/
Donaldson, M. L. (2011). Principals’ approaches to developing teacher quality: Constraints
and opportunities in hiring, assigning, evaluating, and developing teachers. Retrieved
from Center for American website:
http://www.americanprogress.org/issues/2011/02/pdf/principal_report.pdf
Evertson, C. M., & Holley, F. M. (1981). Classroom observation. In J. Millman (Ed.),
Handbook of Teacher Evaluation (pp. 90-109). Beverly Hills: Sage Publications.
Fan, X., & Chen, M. (2001). Parental involvement and students’ academic achievement : A
meta-analysis. Educational Psychology Review, 13(1), 1–23.
Farrell, C., & Morris, J. (2004). Resigned compliance: Teacher attitudes towards
performance-related pay in schools. Educational Management Administration &
Leadership, 32(1), 81–104.
Faubert, V. (2009). School evaluation: Current practices in OECD countries and a
literature review, OECD Education Working Papers, No. 42, OECD Publishing.
http://dx.doi.org/10.1787/218816547156
Feldman, J., & Tung, R. (2001). Using data-based inquiry and decision making to improve
instruction. ERS Spectrum, 19(03), 10–19.
Fryer, R. G. (2013). Teacher incentives and student achievement: Evidence from New York
City Public Schools. Journal of Labor Economics, 31(2), 373–407.
doi:10.1086/667757
140
Fuchs, T., & Wößmann, L. (2007). What accounts for international differences in student
performance? A re-examination using PISA data. Empirical Economics, 32(02), 433-
464. DOI 10.1007/s00181-006-0087-0
Gallagher, H. A. (2004). Vaughn Elementary’s Innovative Teacher Evaluation System: Are
teacher evaluation scores related to growth in student achievement? Peabody Journal
of Education, 79(4), 79–107.
Glazerman, S., Loeb, S., Goldhaber, D., Staiger, D., Raudenbush, S., & Whitehurst, G.
(2010). Evaluating teachers: The important role of value-added. Retrieved from
Brown Center of Education Policy at Brookings website:
http://www.brookings.edu/research/reports/2010/11/17-evaluating-teachers
Goe, L., Bell, C., & Little, O. (2008). Approaches to evaluating teacher effectiveness : A
research synthesis. Retrieved from National Comprehensive Center for Teacher
Quality website: www.tqsource.org/publications/EvaluatingTeachEffectiveness.pdf
Goldhaber, D., & Hansen, M. (2010). Using performance on the job to inform teacher tenure
decisions. American Economic Review, 100(2), 250–255.
Haefele, D. L. (1993). Evaluating teachers: A call for change. Journal of Personnel
Evaluation in Education, 7(1), 21–31. doi:10.1007/BF00972346
Hanushek, E. A. (1992). The trade-off between child quantity and quality. Journal of
Political Economy, 100(1), 84–117.
Hanushek, E. A. (2003). The failure of input-based schooling policies. The Economic
Journal, 113(485), F64–F98.
141
Hanushek, E. A., Kain, J. F., Brien, D. M. O., & Rivkin, S. G. (2005). The market for
teacher quality (Working Paper No. 11154). Retrieved from National Bureau of
Economic Research website: http://www.nber.org/papers/w11154
Hanushek, E. A., & M. E. Raymond (2005). Does school accountability lead to improved
student performance? Journal of Policy Analysis and Management, 24(2), 297-328.
Harris, D. N., & Sass, T. R. (2011). Teacher training, teacher quality and student
achievement. Journal of Public Economics, 95(7-8), 798–812.
doi:10.1016/j.jpubeco.2010.11.009
Henderson, A. (1987). The evidence continues to grow: Parent involvement improves
student achievement. Columbia, MD: National Committee for Citizens in Education.
Henderson, A. T. (1988). Parents are a school’s best friends. The Phi, 70(2), 148–153.
Holtzapple, E. (2003). Criterion-related validity evidence for a standards-based teacher
evaluation system. Journal of Personnel Evaluation in Education, 17(03), 207–219.
Hooge, E., Burns, T., & H. Wilkoszewski (2012). Looking beyond the numbers:
Stakeholders and multiple school accountability (Working Paper No. 85). Retrieved
from OECD website: http://dx.doi.org/10.1787/5k91dl7ct6q6-en
Hoover-Dempsey, K. V, & Sandler, H. M. (1997). Why do parents become involved in their
children’s education? Review of Educational Research, 67(1), 3–42.
Ingram, M., Wolfe, R. B., & Lieberman, J. M. (2007). The role of parents in high-achieving
schools serving low-income, at-risk populations. Education and Urban Society, 39(4),
479–497.
142
Isoré, M. (2009). Teacher Evaluation: Current Practices in OECD Countries and a
Literature Review (Working Paper, No. 23). Retrieved from OECD website:
http://dx.doi.org/10.1787/223283631428
Jerald, B. C. D. (2006, August). The hidden costs of curriculum narrowing. Washington,
DC: The Center for Comprehensive School Reform and Improvement. Retrieved
from ERIC database. (ED494088)
Jeynes, W. (2012). A meta-analysis of the efficacy of different types of parental
involvement programs for urban students. Urban Education, 47(4), 706–742.
doi:10.1177/0042085912445643
Jürges, H., Richter, W. F., & Schneider, K. (2005). Teacher quality and incentives:
Theoretical and empirical effects of standards on teacher quality.
FinanzArchiv/Public Finance Analysis, 61(3), 298–326.
Kimball, S. M., White, B., Milanowski, A. T., & Borman, G. (2004). Examining the
relationship between teacher evaluation and student assessment results in Washoe
County. Peabody Journal of Education, 79(4), 54–78.
Klein, S. P., Hamilton, L. S., Mccaffrey, D. F., & Stecher, B. M. (2000). What do test scores
in Texas tell us? Education Policy Analysis Archives, 8(49), 1–22.
Koretz, D. M. (2002). Limitations in the use of achievement tests as measures of educators’
productivity. The Journal of Human Resources, 37(4), 752–777.
Koretz, D. M. (2008). Measuring up: What educational testing really tells us. Cambridge,
MA: Harvard University Press.
Kornhaber, M. L. (2004a). Appropriate and inappropriate forms of testing, assessment, and
accountability. Educational Policy, 18(1), 45–70. doi:10.1177/0895904803260024
143
Kornhaber, M. L. (2004b). Assessment, standards, and equity. In J. A. Banks & C. A. M.
Banks (Eds.), Handbook of research on multicultural education (2nd ed., pp. 91–109).
San Francisco, CA: Jossey-Bass.
Larsen, M. A. (2005). A critical analysis of teacher evaluation policy trends. Australian
Journal of Education, 49(3), 292–305.
Latham, G., & Wexley, K. (1982). Increasing productivity through performance appraisal.
Monterey, CA: Brooks/Cole.
Levacic, R. (2004). Competition and the performance of English secondary schools: Further
evidence. Education Economics, 12(2), 177-193.
Levin, H. M. (1974). A conceptual framework for accountability in education. The School
Review, 82(3), 363–391.
Levitt, R., Janta, B., & Wegrich, K. (2008). Accountability of teachers: Literature review.
Retrieved from RAND Corporation website:
http://www.rand.org/pubs/technical_reports/TR606.html
Linn, R. L. (2000). Assessments and accountability. Educational Researcher, 29(2), 4–16.
Looney, J. (2011). Developing high-quality teachers: Teacher evaluation for improvement,
European Journal of Education, 46(4), 440–455.
Mathis, W. (2012). Research-based options for education policy making. Retrieved from
National Education Policy Center website: http://nepc.colorado.edu
McGreal, T. L. (1988). Evaluation for enhancing instruction: Linking teacher evaluation and
staff development. In S. J. Stanely, & W. J. Popham (Eds.), Teacher evaluation: Six
prescriptions for success (pp. 1-29). Alexandria, VA: Association for Supervision
and Curriculum Development.
144
McNeil, L. M. & Valenzuela, A. (2001). The harmful impact of the TAAS system of testing
in Texas: Beneath the accountability rhetoric. In M. Kornhaber & G. Orfield (Eds.),
Raising standards or raising barriers? Inequity and high-stakes testing in public
education (pp. 127-150). New York: Century Foundation.
McNeil, L. M., Coppola, E., Radigan, J., & Vasquez Heilig, J. (2008). Avoidable losses:
High-stakes accountability and the dropout Crisis. Education Policy Analysis Archives,
16(3). Retrieved from Policy Analysis Archives website:
http://epaa.asu.edu/epaa/v16n3/
Menken, K. (2006). Teaching to the test: How No Child Left Behind impacts language
policy, curriculum, and instruction for English language learners. Bilingual Research
Journal, 30(2), 521–546.
Milanowski, A. (2004). The relationship between teacher performance evaluation scores and
student achievement : Evidence from Cincinnati. Peabody Journal of Education,
79(4), 33-53.
Milanowski, A. T., Kimball, S. M., & White, B. (2004). The relationship between
standards-based teacher evaluation scores and student achievement: Replication and
extensions at three sites. Retrieved from Consortium for Policy Research in Education
website: www.cpre-wisconsin.org/papers/3site_long_TE_SA_AERA04TE.pdf
National Center for Education Statistics [NCES]. (1996). High school seniors' instructional
experiences in science and mathematics. Washington, DC: U.S Government Printing
Office.
Nolan, J. F., & Hoover, L. A. (2008). Teacher supervision and evaluation: Theory into
practice (2nd ed.). Hoboken, N.J: John Wiley & Sons Inc.
145
Organization for Economic Cooperation and Development. (2005). Teachers matter:
Attracting, developing and retaining effective teachers. Retrieved from Organization
for Economic Cooperation and Development website:
http://dx.doi.org/10.1787/9789264018044-en
Organization for Economic Cooperation and Development. (2009a). Evaluating and
rewarding the quality of teachers: International practices. Retrieved from
Organization for Economic Cooperation and Development website:
http://dx.doi.org/10.1787/9789264034358-en
Organization for Economic Cooperation and Development. (2009b). Creating effective
teaching and learning environments: First results from TALIS Retrieved from
Organization for Economic Cooperation and Development website:
http://www.oecd.org/edu/school/43023606.pdf
Organization for Economic Cooperation and Development. (2009c). PISA data analysis
manual: SPSS (2nd ed.). Paris: Organization for Economic Cooperation and
Development.
Organization for Economic Cooperation and Development. (2010a). PISA 2009 results:
What makes a school successful? Resources, policies and practices (Volume IV).
Retrieved from Organization for Economic Cooperation and Development website:
http://dx.doi.org/10.1787/9789264091559-en
Organization for Economic Cooperation and Development. (2010b). TALIS 2008 technical
report. Retrieved from Organization for Economic Cooperation and Development
website: http://www.oecd-ilibrary.org/education/talis-2008-technical-
report_9789264079861-en
146
Organization for Economic Cooperation and Development. (2012). PISA 2009 technical
report. Retrieved from Organization for Economic Cooperation and Development
website: http://dx.doi.org/10.1787/9789264167872-en
Peterson, K. D. (2000). Teacher evaluation: A comprehensive guide to new directions and
practices (2nd ed.). Thousand Oaks, CA: Corwin Press Inc.
Ravitch, D. (2010). The death and life of the great American school system: How testing
and choice are undermining education. New York, NY: Basic Books.
Reid, L. N. (2012). The unintended consequences of narrowing secondary curriculum in
response to low standardized test scores (Doctoral dissertation). Retrieved from
Dissertations and Theses database. (UMI No. 3535729)
Ribas, W. B. (2005). Teacher evaluation that works (2nd ed.). Westwood, MA: Ribas
Publications.
Rivkin, S. G., Hanushek, E. A., & Kain, J. F. (2005). Teachers, schools, and academic
achievement. Econometrica, 73(2), 417–458.
Rockoff, J. E. (2004). The impact of individual teachers on student achievement: Evidence
from panel data. American Economic Review, 94(2), 247–252.
doi:10.1257/0002828041302244
Rockoff, J. E., & Speroni, C. (2010). Subjective and objective evaluations of teacher
effectiveness. American Economic Review, 100(2), 261–266.
Rosenkvist, M. A. (2010). Using student test results for accountability and improvement: A
literature review (Working Paper, No. 54). Retrieved from OECD website:
http://dx.doi.org/10.1787/5km4htwzbv30-en
147
Rothstein, J. (2010). Teacher quality in educational production: Tracking, decay, and
student achievement. The Quarterly Journal of Economics, 125(1), 175–215.
Rubin, D.B. (1987). Multiple imputation for nonresponse in surveys. New York: John Wiley
& Sons, Inc.
Sanders, W. L., & Horn, S. P. (1994). The Tennessee value-added assessment system
(TVAAS): Mixed-model methodology in educational assessment. Journal of Personnel
Evaluation in Education, 8(3), 299–311. doi:10.1007/BF00973726
Saphier, J. (1993). How to make supervision and evaluation really work. Acton, MA:
Research for Better Teaching, Inc.
Sartain, L., Stoelinga, S. R., Brown, E. R., Luppescu, S., Matsko, K. K., Miller, F. K., &
Durwood, C. E. (2011). Rethinking Teacher Evaluation in Chicago: Lessons learned
from classroom observations, principal-teacher conferences, and district
implementation. Retrieved from Consortium on Chicago School Research website:
http://ccsr.uchicago.edu/sites/default/files/publications/Teacher%20Eval%20Report%2
0FINAL.pdf
Schütz, G., West, M. R., & Wößmann, L. (2007). Autonomy, choice, and the equity of
student achievement: International evidence from PISA 2003. Retrieved from OECD
website: http://dx.doi.org/10.1787/246374511832
Scriven, M. (1981). Summative teacher evaluation. In J. Millman (Ed.), Handbook of
teacher evaluation (pp. 244-271). Beverly Hills: Sage Publications.
Sharkey, N. S., & Murnane, R. J. (2005). Roles for the district central office. In K. P.
Boudett, E. A. City, & R. J. Murnane (Eds.), Data wise: A step-by-step guide to using
148
assessment results to improve teaching and learning (pp. 179-188). Cambridge, MA:
Harvard Education Press.
Springer, M. G., Pane, J. F., Le, V.-N., McCaffrey, D. F., Burns, S. F., Hamilton, L. S., &
Stecher, B. (2012). Team Pay for performance: Experimental evidence from the
Round Rock Pilot Project on team incentives. Educational Evaluation and Policy
Analysis, 34(4), 367–390. doi:10.3102/0162373712439094
Stronge, J. H., & Tucker, P. D. (2000). Teacher evaluation and student achievement.
Washington, DC: National Education Association.
Suen, H. K., & Yu, L. (2006). Chronic consequences of high-stakes testing? Lessons from
the Chinese civil service exam. Comparative Education Review, 50(1), 46–65.
doi:10.1086/498328
Sui-Chu, E. H., & Willms, J. D. (1996). Effects of parental involvement on eighth-grade
achievement. Sociology of Education, 69(2), 126-141. doi:10.2307/2112802
Taylor, E. S., & Tyler, J. H. (2011). The effect of evaluation on performance: Evidence from
longitudinal student achievement data of mid-career teachers (Working Paper No.
16877). Retrieved from National Bureau of Economic Research website:
http://www.nber.org/papers/w16877
Thomson, B. (2004). Exploratory and confirmatory factor analysis: Understanding
concepts and applications. Washington, DC: American Psychological Association.
Toch, T. (2008). Fixing teacher evaluation: Evaluations pay large dividends when they
improve teaching practices. Educational Leadership, 66(02), 32–37.
149
Tyler, B. J. H., Taylor, E. S., Kane, T. J., & Wooten, A. L. (2010). Using student
performance data to identify effective classroom practices. American Economic
Review, 100(02), 256–260. doi:10.1257/aer.100.2.256
UNDP (2009). Handbook on planning, monitoring and evaluating for development results.
Retrieved from the United Nations Development Program website:
http://web.undp.org/evaluation/handbook/documents/english/pme-handbook.pdf
UNESCO (2007) Evaluación del Desempeño y Carrera Profesional Docente: Una
panorámica de América y Europa, Oficina Regional de Educación para américa
Latina y el Caribe, UNESCO Santiago, 2007.
Wayman, J. C., & Stringfield, S. (2006). Technology-supported involvement of entire
faculties in examination of student data for instructional improvement. American
Journal of Education, 112(4), 549–571.
Wenglinsky, H. (2002). How schools matter: The link between teacher classroom practices
and student academic performance. Education Policy Analysis Archives, 10(12), 1–30.
West, M. R., & Peterson, P. E. (2006). The efficacy of choice threats within school
accountability systems: Results from legislatively induced experiments. The
Economic Journal, 116 (510), C46–C62.
White, B. (2004). The relationship between teacher evaluation scores and student
achievement: Evidence from Coventry, RI. Retrieved from Consortium for Policy
Research in Education website: cpre.wceruw.org/papers/CoventryAERA04.pdf
Wiggins, A., & P. Tymms (2002). Dysfunctional effects of public performance indicator
systems: A comparison between English and Scottish primary schools. Public Money
and Management, 22(1), 43-48.
150
Wößmann, L (2003). Schooling resources, educational institutions and student performance:
the international evidence. Oxford Bulletin of Economics and Statistics, 65(02), 117-
170.
Wößmann, L., Lüdemann, E., Schütz, G., & West, M. R. (2007). School accountability,
autonomy, choice, and the level of student achievement: International evidence from
PISA 2003. doi: http://dx.doi.org/10.1787/19939019
Wright, S. P., Horn, S. P., & Sanders, W. L. (1997). Teacher and classroom context effects
on student achievement: Implications for teacher evaluation. Journal of Personnel
Evaluation in Education, 11(1), 57-67.
Zhang, L. & Lee, K. A. (2011). Decomposing achievement gaps among OECD countries.
Asia Pacific Education Review, 12(3), 463–474. DOI 10.1007/s12564-011-9151-3.
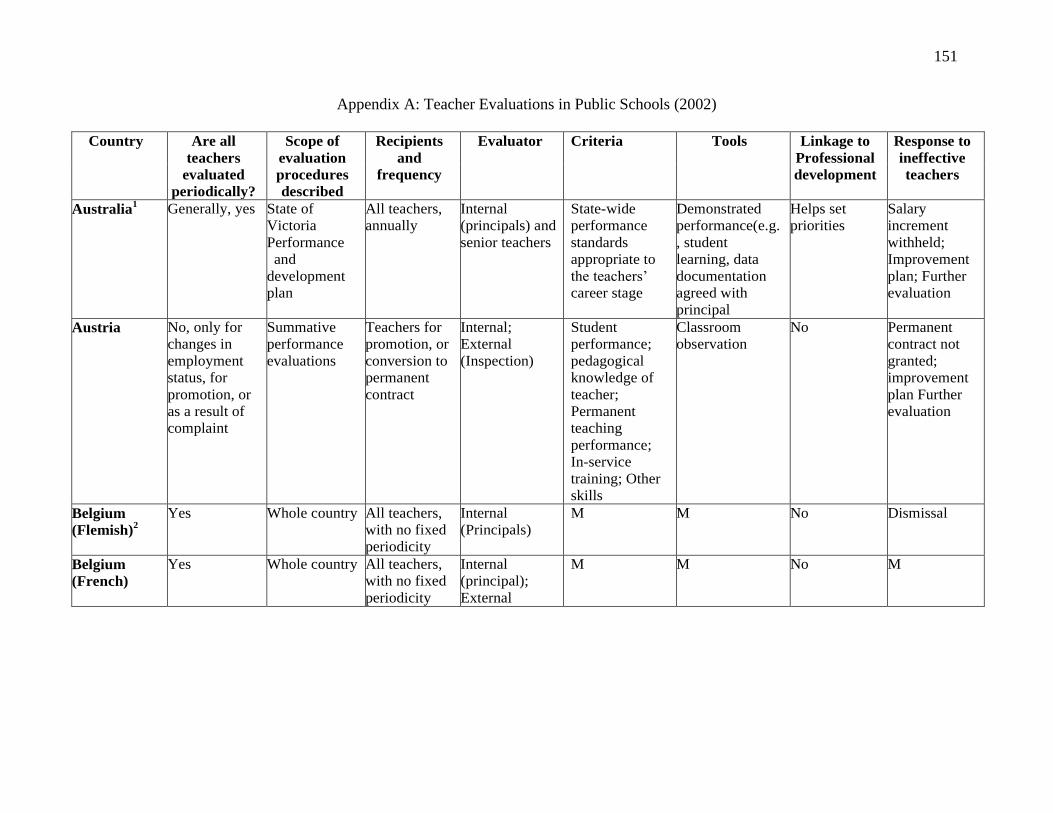
151
Appendix A: Teacher Evaluations in Public Schools (2002)
Country Are all
teachers
evaluated
periodically?
Scope of
evaluation
procedures
described
Recipients
and
frequency
Evaluator
Criteria Tools Linkage to
Professional
development
Response to
ineffective
teachers
Australia1 Generally, yes State of
Victoria
Performance
and
development
plan
All teachers,
annually
Internal
(principals) and
senior teachers
State-wide
performance
standards
appropriate to
the teachers’
career stage
Demonstrated
performance(e.g.
, student
learning, data
documentation
agreed with
principal
Helps set
priorities
Salary
increment
withheld;
Improvement
plan; Further
evaluation
Austria No, only for
changes in
employment
status, for
promotion, or
as a result of
complaint
Summative
performance
evaluations
Teachers for
promotion, or
conversion to
permanent
contract
Internal;
External
(Inspection)
Student
performance;
pedagogical
knowledge of
teacher;
Permanent
teaching
performance;
In-service
training; Other
skills
Classroom
observation
No Permanent
contract not
granted;
improvement
plan Further
evaluation
Belgium
(Flemish)2
Yes Whole country All teachers,
with no fixed
periodicity
Internal
(Principals)
M M No Dismissal
Belgium
(French)
Yes Whole country All teachers,
with no fixed
periodicity
Internal
(principal);
External
M M No M
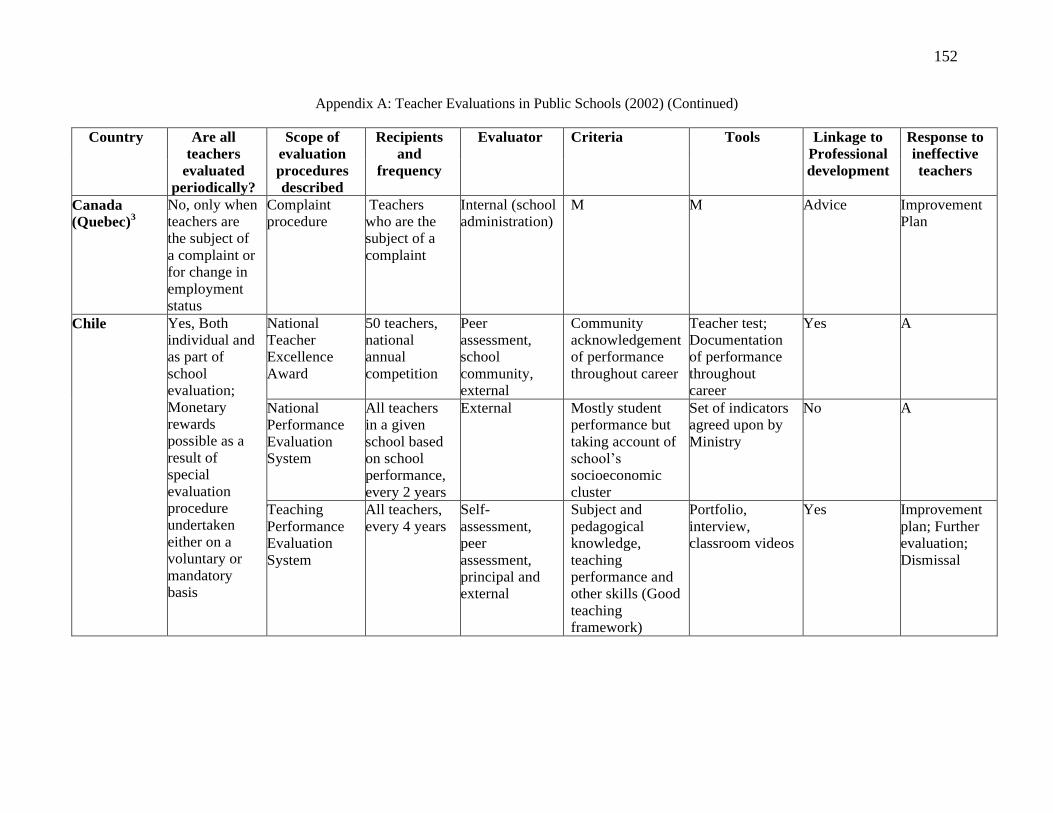
152
Appendix A: Teacher Evaluations in Public Schools (2002) (Continued)
Country Are all
teachers
evaluated
periodically?
Scope of
evaluation
procedures
described
Recipients
and
frequency
Evaluator
Criteria Tools Linkage to
Professional
development
Response to
ineffective
teachers
Canada
(Quebec)3
No, only when
teachers are
the subject of
a complaint or
for change in
employment
status
Complaint
procedure
Teachers
who are the
subject of a
complaint
Internal (school
administration)
M M Advice Improvement
Plan
Chile Yes, Both
individual and
as part of
school
evaluation;
Monetary
rewards
possible as a
result of
special
evaluation
procedure
undertaken
either on a
voluntary or
mandatory
basis
National
Teacher
Excellence
Award
50 teachers,
national
annual
competition
Peer
assessment,
school
community,
external
Community
acknowledgement
of performance
throughout career
Teacher test;
Documentation
of performance
throughout
career
Yes A
National
Performance
Evaluation
System
All teachers
in a given
school based
on school
performance,
every 2 years
External Mostly student
performance but
taking account of
school’s
socioeconomic
cluster
Set of indicators
agreed upon by
Ministry
No A
Teaching
Performance
Evaluation
System
All teachers,
every 4 years
Self-
assessment,
peer
assessment,
principal and
external
Subject and
pedagogical
knowledge,
teaching
performance and
other skills (Good
teaching
framework)
Portfolio,
interview,
classroom videos
Yes Improvement
plan; Further
evaluation;
Dismissal
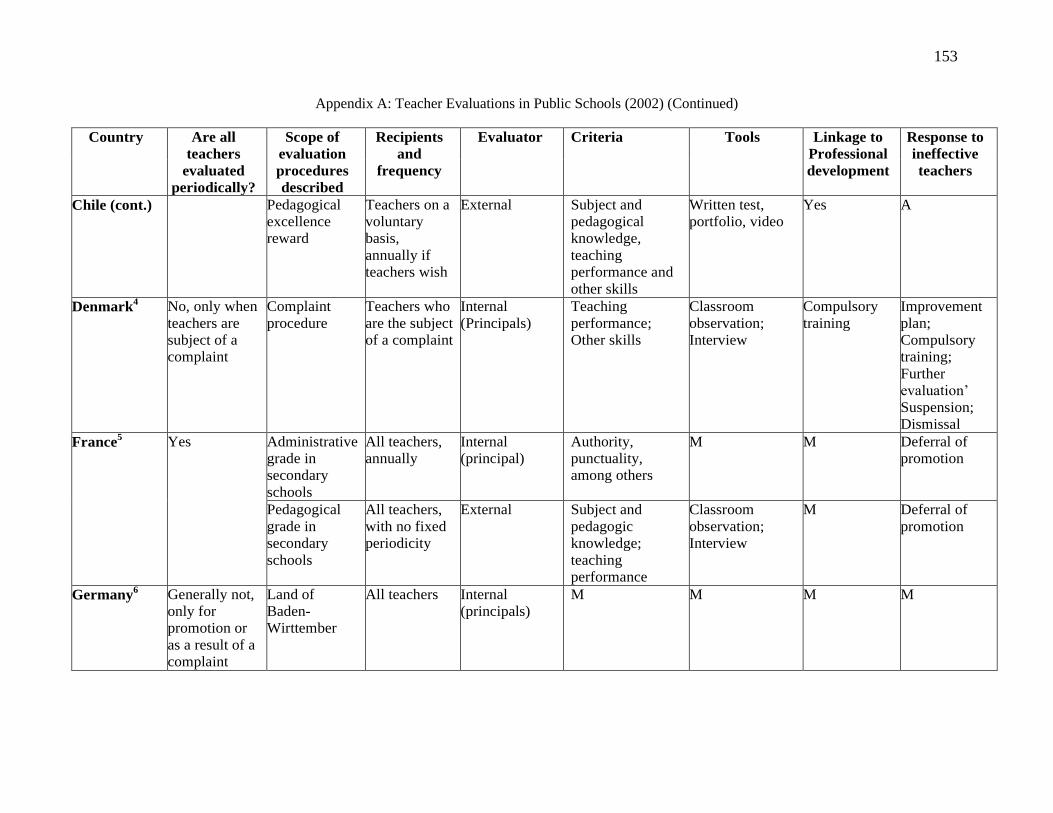
153
Appendix A: Teacher Evaluations in Public Schools (2002) (Continued)
Country Are all
teachers
evaluated
periodically?
Scope of
evaluation
procedures
described
Recipients
and
frequency
Evaluator
Criteria Tools Linkage to
Professional
development
Response to
ineffective
teachers
Chile (cont.) Pedagogical
excellence
reward
Teachers on a
voluntary
basis,
annually if
teachers wish
External Subject and
pedagogical
knowledge,
teaching
performance and
other skills
Written test,
portfolio, video
Yes A
Denmark4 No, only when
teachers are
subject of a
complaint
Complaint
procedure
Teachers who
are the subject
of a complaint
Internal
(Principals)
Teaching
performance;
Other skills
Classroom
observation;
Interview
Compulsory
training
Improvement
plan;
Compulsory
training;
Further
evaluation’
Suspension;
Dismissal
France5 Yes Administrative
grade in
secondary
schools
All teachers,
annually
Internal
(principal)
Authority,
punctuality,
among others
M M Deferral of
promotion
Pedagogical
grade in
secondary
schools
All teachers,
with no fixed
periodicity
External Subject and
pedagogic
knowledge;
teaching
performance
Classroom
observation;
Interview
M Deferral of
promotion
Germany6 Generally not,
only for
promotion or
as a result of a
complaint
Land of
Baden-
Wirttember
All teachers Internal
(principals)
M M M M
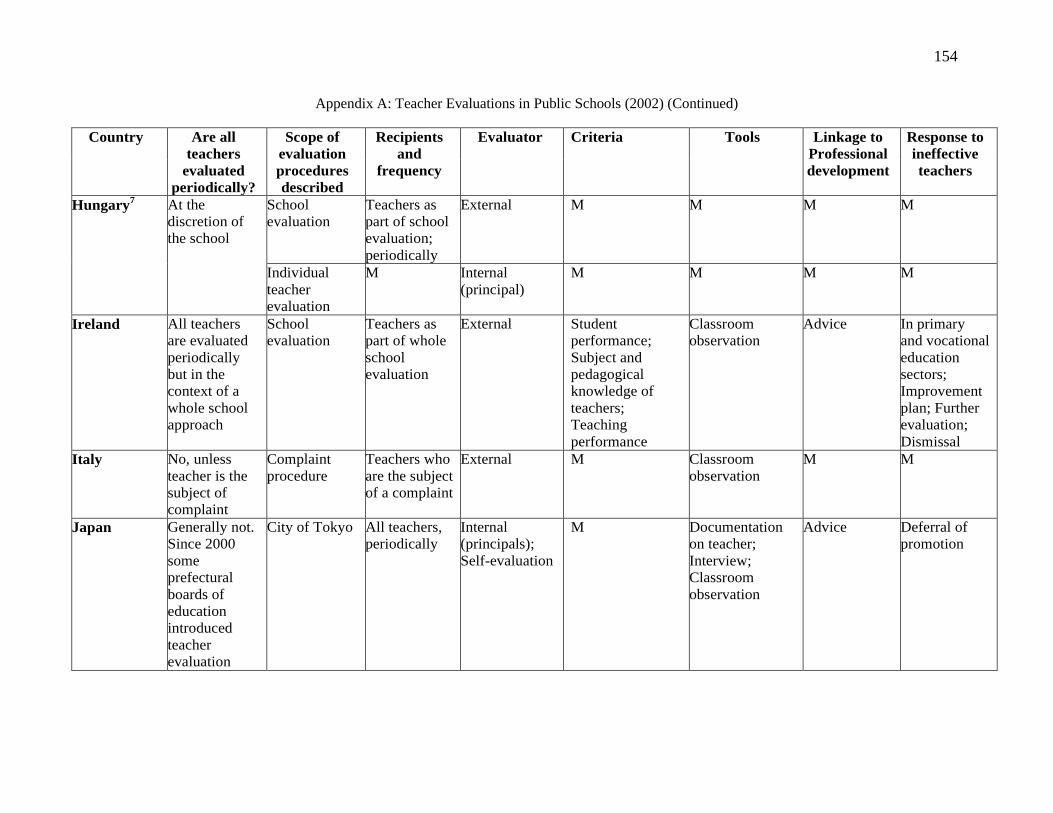
154
Appendix A: Teacher Evaluations in Public Schools (2002) (Continued)
Country Are all
teachers
evaluated
periodically?
Scope of
evaluation
procedures
described
Recipients
and
frequency
Evaluator
Criteria Tools Linkage to
Professional
development
Response to
ineffective
teachers
Hungary7
At the
discretion of
the school
School
evaluation
Teachers as
part of school
evaluation;
periodically
External M M M M
Individual
teacher
evaluation
M Internal
(principal)
M M M M
Ireland All teachers
are evaluated
periodically
but in the
context of a
whole school
approach
School
evaluation
Teachers as
part of whole
school
evaluation
External Student
performance;
Subject and
pedagogical
knowledge of
teachers;
Teaching
performance
Classroom
observation
Advice In primary
and vocational
education
sectors;
Improvement
plan; Further
evaluation;
Dismissal
Italy No, unless
teacher is the
subject of
complaint
Complaint
procedure
Teachers who
are the subject
of a complaint
External M Classroom
observation
M M
Japan Generally not.
Since 2000
some
prefectural
boards of
education
introduced
teacher
evaluation
City of Tokyo All teachers,
periodically
Internal
(principals);
Self-evaluation
M Documentation
on teacher;
Interview;
Classroom
observation
Advice Deferral of
promotion
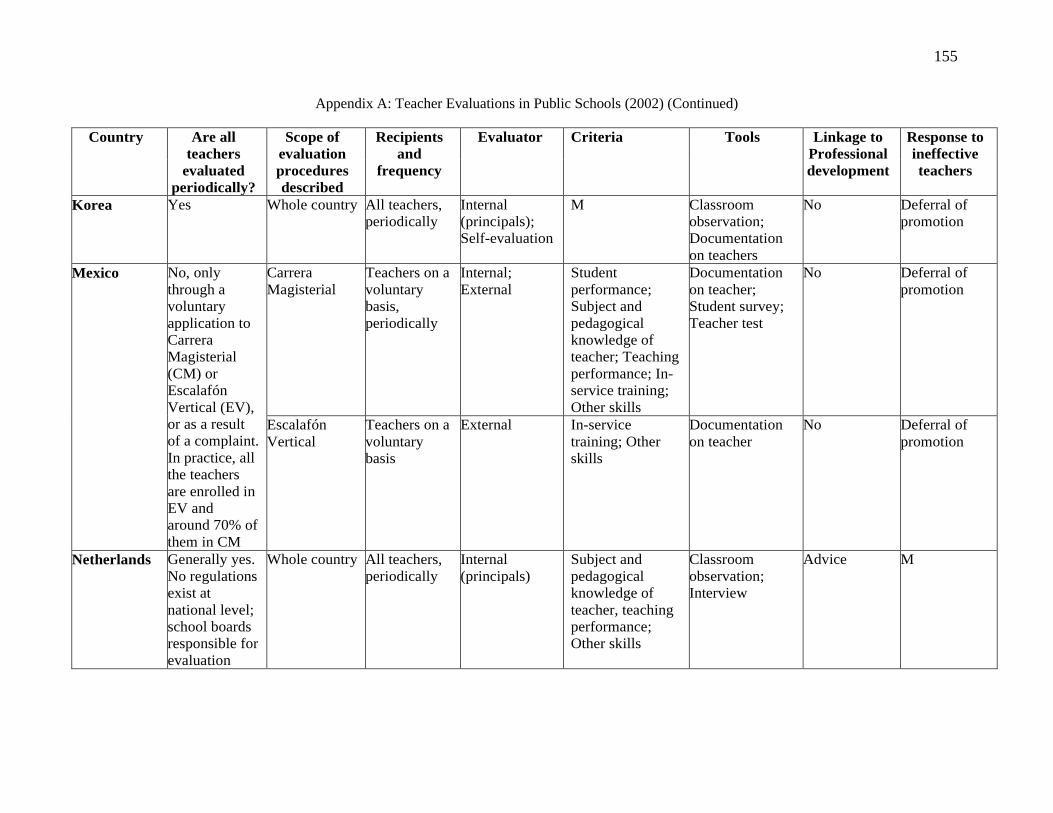
155
Appendix A: Teacher Evaluations in Public Schools (2002) (Continued)
Country Are all
teachers
evaluated
periodically?
Scope of
evaluation
procedures
described
Recipients
and
frequency
Evaluator
Criteria Tools Linkage to
Professional
development
Response to
ineffective
teachers
Korea Yes Whole country All teachers,
periodically
Internal
(principals);
Self-evaluation
M Classroom
observation;
Documentation
on teachers
No Deferral of
promotion
Mexico No, only
through a
voluntary
application to
Carrera
Magisterial
(CM) or
Escalafón
Vertical (EV),
or as a result
of a complaint.
In practice, all
the teachers
are enrolled in
EV and
around 70% of
them in CM
Carrera
Magisterial
Teachers on a
voluntary
basis,
periodically
Internal;
External
Student
performance;
Subject and
pedagogical
knowledge of
teacher; Teaching
performance; In-
service training;
Other skills
Documentation
on teacher;
Student survey;
Teacher test
No Deferral of
promotion
Escalafón
Vertical
Teachers on a
voluntary
basis
External In-service
training; Other
skills
Documentation
on teacher
No Deferral of
promotion
Netherlands Generally yes.
No regulations
exist at
national level;
school boards
responsible for
evaluation
Whole country All teachers,
periodically
Internal
(principals)
Subject and
pedagogical
knowledge of
teacher, teaching
performance;
Other skills
Classroom
observation;
Interview
Advice M
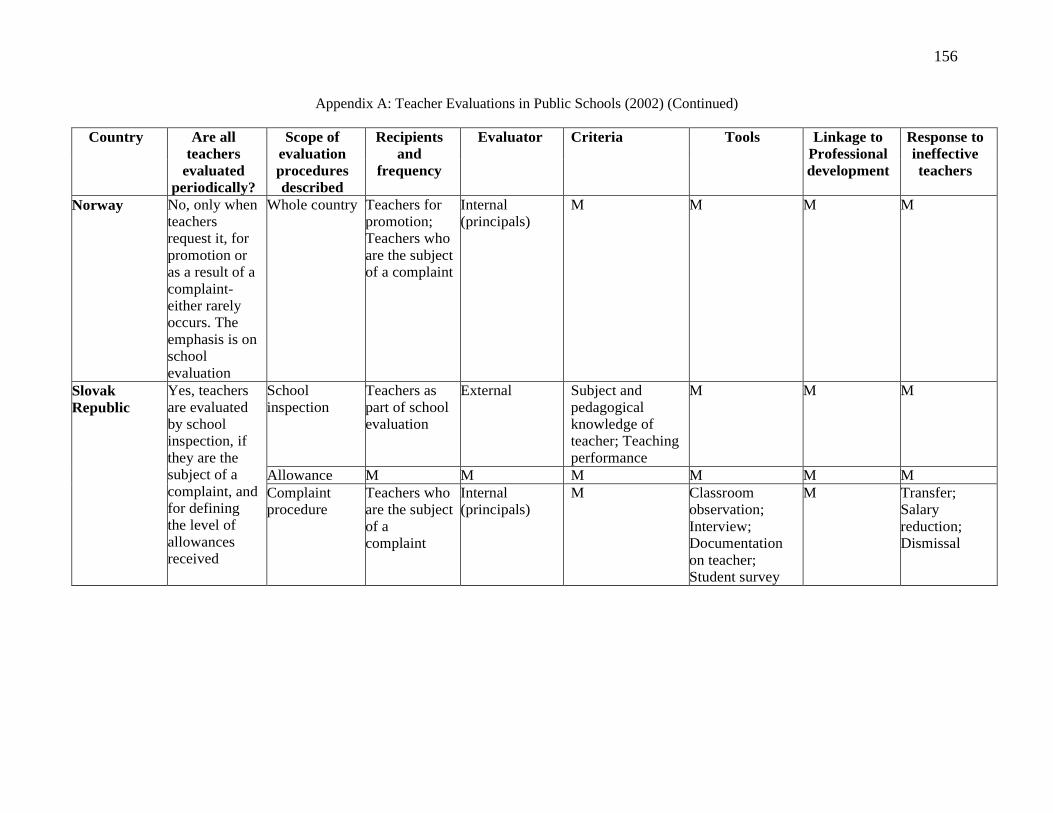
156
Appendix A: Teacher Evaluations in Public Schools (2002) (Continued)
Country Are all
teachers
evaluated
periodically?
Scope of
evaluation
procedures
described
Recipients
and
frequency
Evaluator
Criteria Tools Linkage to
Professional
development
Response to
ineffective
teachers
Norway No, only when
teachers
request it, for
promotion or
as a result of a
complaint-
either rarely
occurs. The
emphasis is on
school
evaluation
Whole country Teachers for
promotion;
Teachers who
are the subject
of a complaint
Internal
(principals)
M M M M
Slovak
Republic
Yes, teachers
are evaluated
by school
inspection, if
they are the
subject of a
complaint, and
for defining
the level of
allowances
received
School
inspection
Teachers as
part of school
evaluation
External Subject and
pedagogical
knowledge of
teacher; Teaching
performance
M M M
Allowance M M M M M M
Complaint
procedure
Teachers who
are the subject
of a
complaint
Internal
(principals)
M Classroom
observation;
Interview;
Documentation
on teacher;
Student survey
M Transfer;
Salary
reduction;
Dismissal
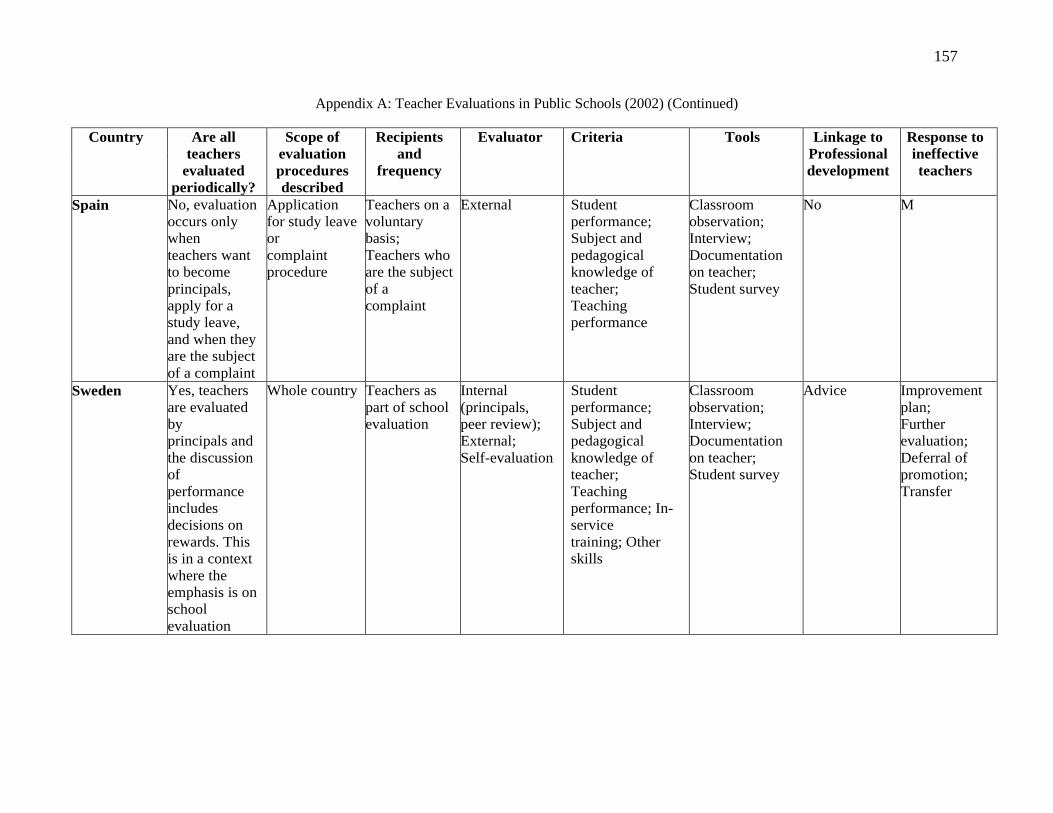
157
Appendix A: Teacher Evaluations in Public Schools (2002) (Continued)
Country Are all
teachers
evaluated
periodically?
Scope of
evaluation
procedures
described
Recipients
and
frequency
Evaluator
Criteria Tools Linkage to
Professional
development
Response to
ineffective
teachers
Spain No, evaluation
occurs only
when
teachers want
to become
principals,
apply for a
study leave,
and when they
are the subject
of a complaint
Application
for study leave
or
complaint
procedure
Teachers on a
voluntary
basis;
Teachers who
are the subject
of a
complaint
External Student
performance;
Subject and
pedagogical
knowledge of
teacher;
Teaching
performance
Classroom
observation;
Interview;
Documentation
on teacher;
Student survey
No M
Sweden Yes, teachers
are evaluated
by
principals and
the discussion
of
performance
includes
decisions on
rewards. This
is in a context
where the
emphasis is on
school
evaluation
Whole country Teachers as
part of school
evaluation
Internal
(principals,
peer review);
External;
Self-evaluation
Student
performance;
Subject and
pedagogical
knowledge of
teacher;
Teaching
performance; In-
service
training; Other
skills
Classroom
observation;
Interview;
Documentation
on teacher;
Student survey
Advice Improvement
plan;
Further
evaluation;
Deferral of
promotion;
Transfer
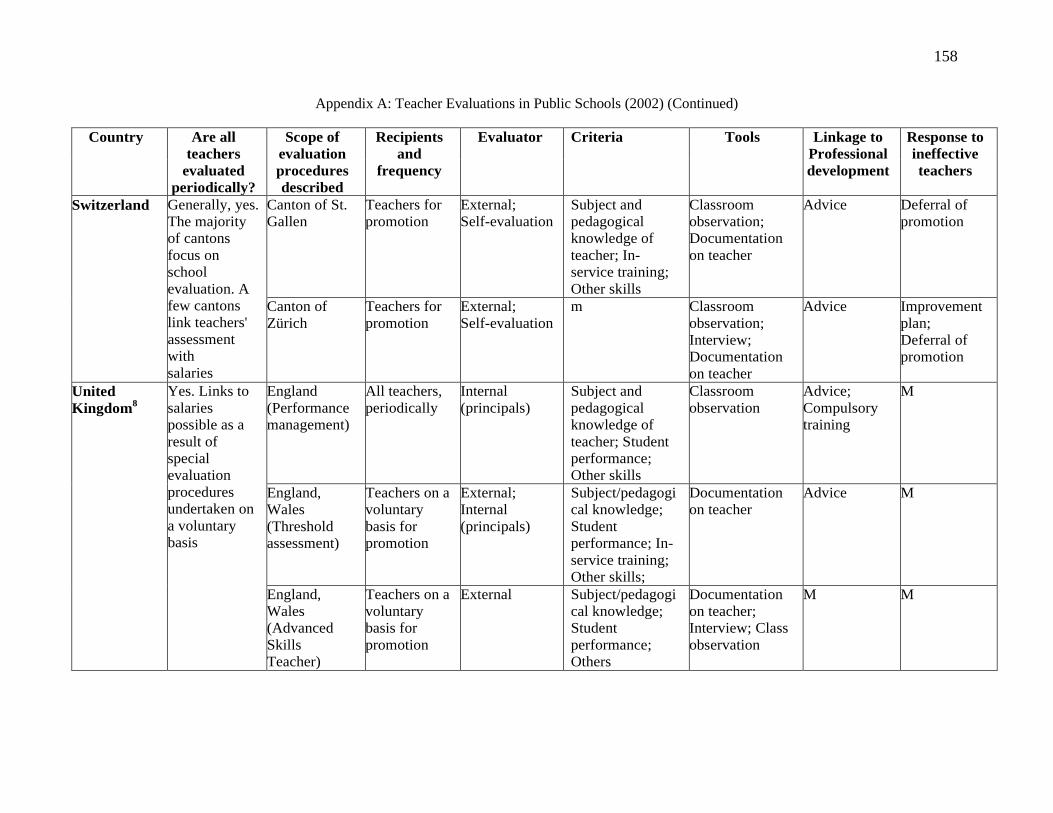
158
Appendix A: Teacher Evaluations in Public Schools (2002) (Continued)
Country Are all
teachers
evaluated
periodically?
Scope of
evaluation
procedures
described
Recipients
and
frequency
Evaluator
Criteria Tools Linkage to
Professional
development
Response to
ineffective
teachers
Switzerland Generally, yes.
The majority
of cantons
focus on
school
evaluation. A
few cantons
link teachers'
assessment
with
salaries
Canton of St.
Gallen
Teachers for
promotion
External;
Self-evaluation
Subject and
pedagogical
knowledge of
teacher; In-
service training;
Other skills
Classroom
observation;
Documentation
on teacher
Advice Deferral of
promotion
Canton of
Zürich
Teachers for
promotion
External;
Self-evaluation
m Classroom
observation;
Interview;
Documentation
on teacher
Advice Improvement
plan;
Deferral of
promotion
United
Kingdom8
Yes. Links to
salaries
possible as a
result of
special
evaluation
procedures
undertaken on
a voluntary
basis
England
(Performance
management)
All teachers,
periodically
Internal
(principals)
Subject and
pedagogical
knowledge of
teacher; Student
performance;
Other skills
Classroom
observation
Advice;
Compulsory
training
M
England,
Wales
(Threshold
assessment)
Teachers on a
voluntary
basis for
promotion
External;
Internal
(principals)
Subject/pedagogi
cal knowledge;
Student
performance; In-
service training;
Other skills;
Documentation
on teacher
Advice M
England,
Wales
(Advanced
Skills
Teacher)
Teachers on a
voluntary
basis for
promotion
External Subject/pedagogi
cal knowledge;
Student
performance;
Others
Documentation
on teacher;
Interview; Class
observation
M M
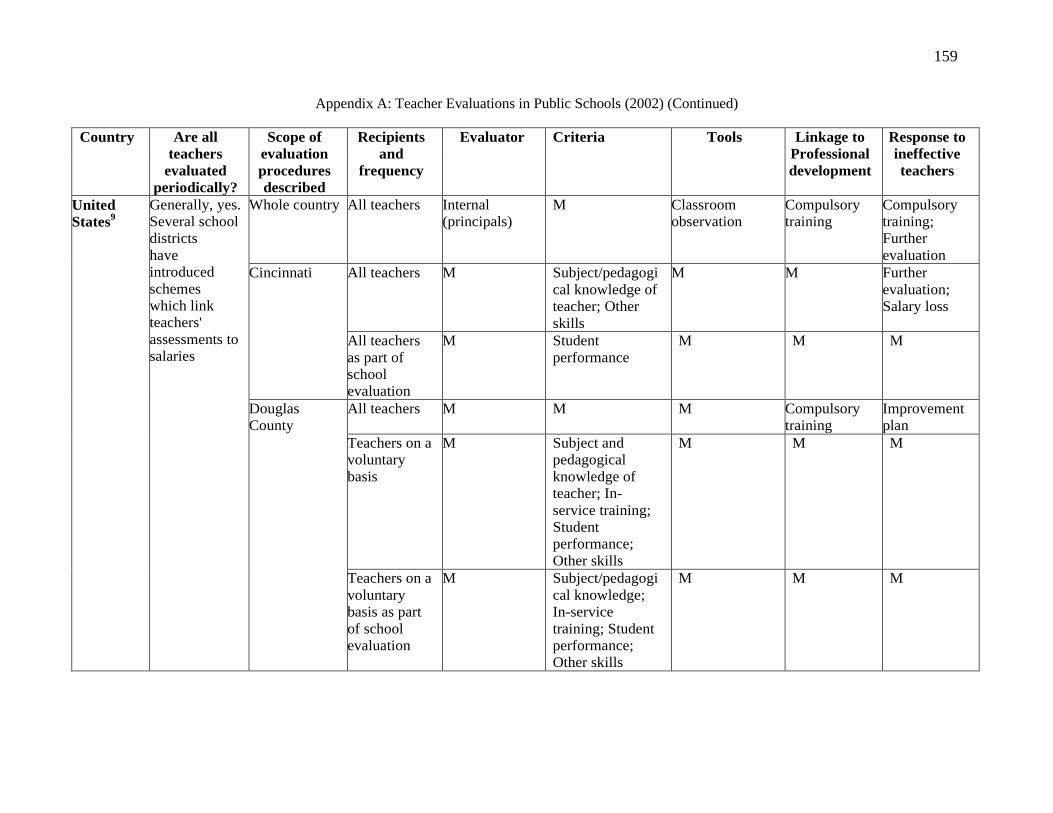
159
Appendix A: Teacher Evaluations in Public Schools (2002) (Continued)
Country Are all
teachers
evaluated
periodically?
Scope of
evaluation
procedures
described
Recipients
and
frequency
Evaluator
Criteria Tools Linkage to
Professional
development
Response to
ineffective
teachers
United
States9
Generally, yes.
Several school
districts
have
introduced
schemes
which link
teachers'
assessments to
salaries
Whole country All teachers Internal
(principals)
M Classroom
observation
Compulsory
training
Compulsory
training;
Further
evaluation
Cincinnati All teachers M Subject/pedagogi
cal knowledge of
teacher; Other
skills
M M Further
evaluation;
Salary loss
All teachers
as part of
school
evaluation
M Student
performance
M M M
Douglas
County
All teachers M M M Compulsory
training
Improvement
plan
Teachers on a
voluntary
basis
M Subject and
pedagogical
knowledge of
teacher; In-
service training;
Student
performance;
Other skills
M M M
Teachers on a
voluntary
basis as part
of school
evaluation
M Subject/pedagogi
cal knowledge;
In-service
training; Student
performance;
Other skills
M M M
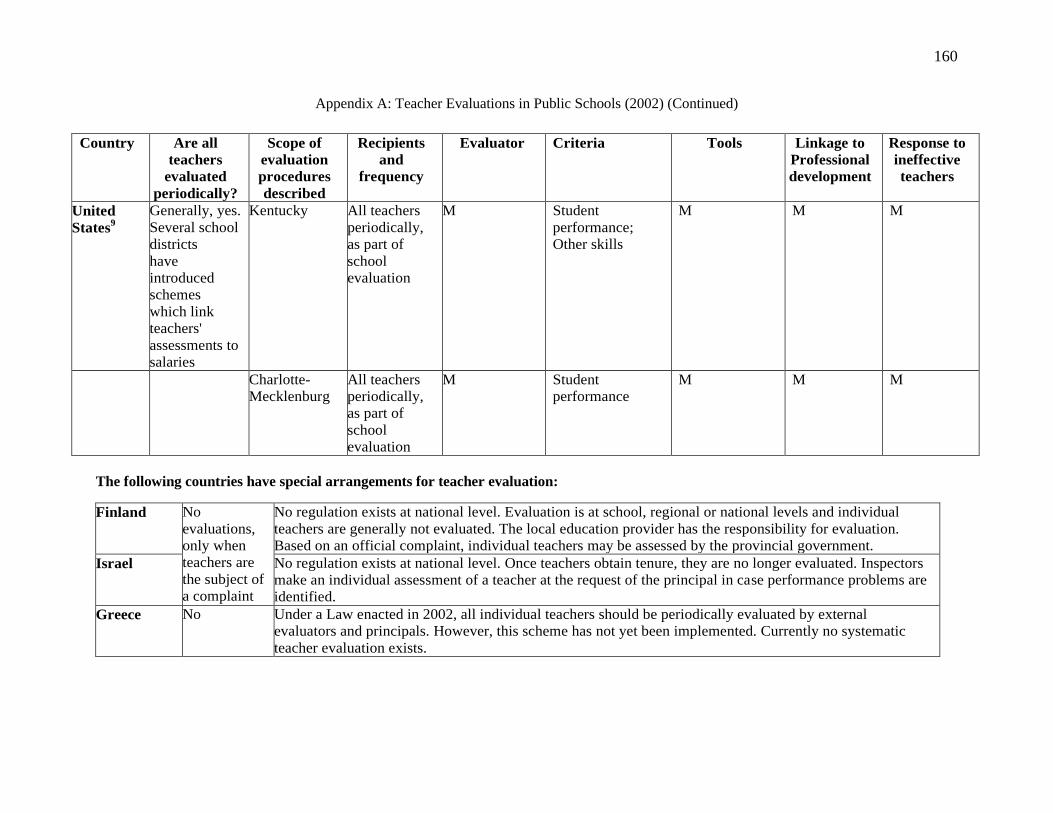
160
Appendix A: Teacher Evaluations in Public Schools (2002) (Continued)
Country Are all
teachers
evaluated
periodically?
Scope of
evaluation
procedures
described
Recipients
and
frequency
Evaluator
Criteria Tools Linkage to
Professional
development
Response to
ineffective
teachers
United
States9
Generally, yes.
Several school
districts
have
introduced
schemes
which link
teachers'
assessments to
salaries
Kentucky All teachers
periodically,
as part of
school
evaluation
M Student
performance;
Other skills
M M M
Charlotte-
Mecklenburg
All teachers
periodically,
as part of
school
evaluation
M Student
performance
M M M
The following countries have special arrangements for teacher evaluation:
Finland No
evaluations,
only when
teachers are
the subject of
a complaint
No regulation exists at national level. Evaluation is at school, regional or national levels and individual
teachers are generally not evaluated. The local education provider has the responsibility for evaluation.
Based on an official complaint, individual teachers may be assessed by the provincial government.
Israel No regulation exists at national level. Once teachers obtain tenure, they are no longer evaluated. Inspectors
make an individual assessment of a teacher at the request of the principal in case performance problems are
identified.
Greece No Under a Law enacted in 2002, all individual teachers should be periodically evaluated by external
evaluators and principals. However, this scheme has not yet been implemented. Currently no systematic
teacher evaluation exists.
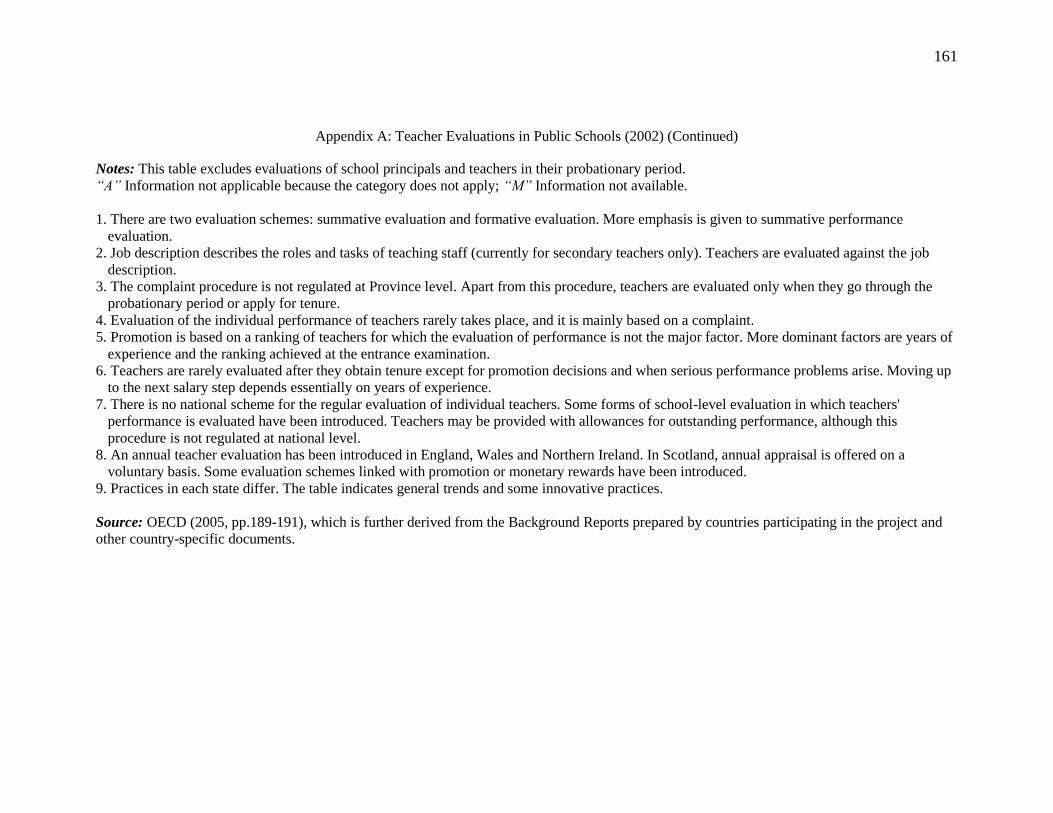
161
Appendix A: Teacher Evaluations in Public Schools (2002) (Continued)
Notes: This table excludes evaluations of school principals and teachers in their probationary period.
“A” Information not applicable because the category does not apply; “M” Information not available.
1. There are two evaluation schemes: summative evaluation and formative evaluation. More emphasis is given to summative performance
evaluation.
2. Job description describes the roles and tasks of teaching staff (currently for secondary teachers only). Teachers are evaluated against the job
description.
3. The complaint procedure is not regulated at Province level. Apart from this procedure, teachers are evaluated only when they go through the
probationary period or apply for tenure.
4. Evaluation of the individual performance of teachers rarely takes place, and it is mainly based on a complaint.
5. Promotion is based on a ranking of teachers for which the evaluation of performance is not the major factor. More dominant factors are years of
experience and the ranking achieved at the entrance examination.
6. Teachers are rarely evaluated after they obtain tenure except for promotion decisions and when serious performance problems arise. Moving up
to the next salary step depends essentially on years of experience.
7. There is no national scheme for the regular evaluation of individual teachers. Some forms of school-level evaluation in which teachers'
performance is evaluated have been introduced. Teachers may be provided with allowances for outstanding performance, although this
procedure is not regulated at national level.
8. An annual teacher evaluation has been introduced in England, Wales and Northern Ireland. In Scotland, annual appraisal is offered on a
voluntary basis. Some evaluation schemes linked with promotion or monetary rewards have been introduced.
9. Practices in each state differ. The table indicates general trends and some innovative practices.
Source: OECD (2005, pp.189-191), which is further derived from the Background Reports prepared by countries participating in the project and
other country-specific documents.
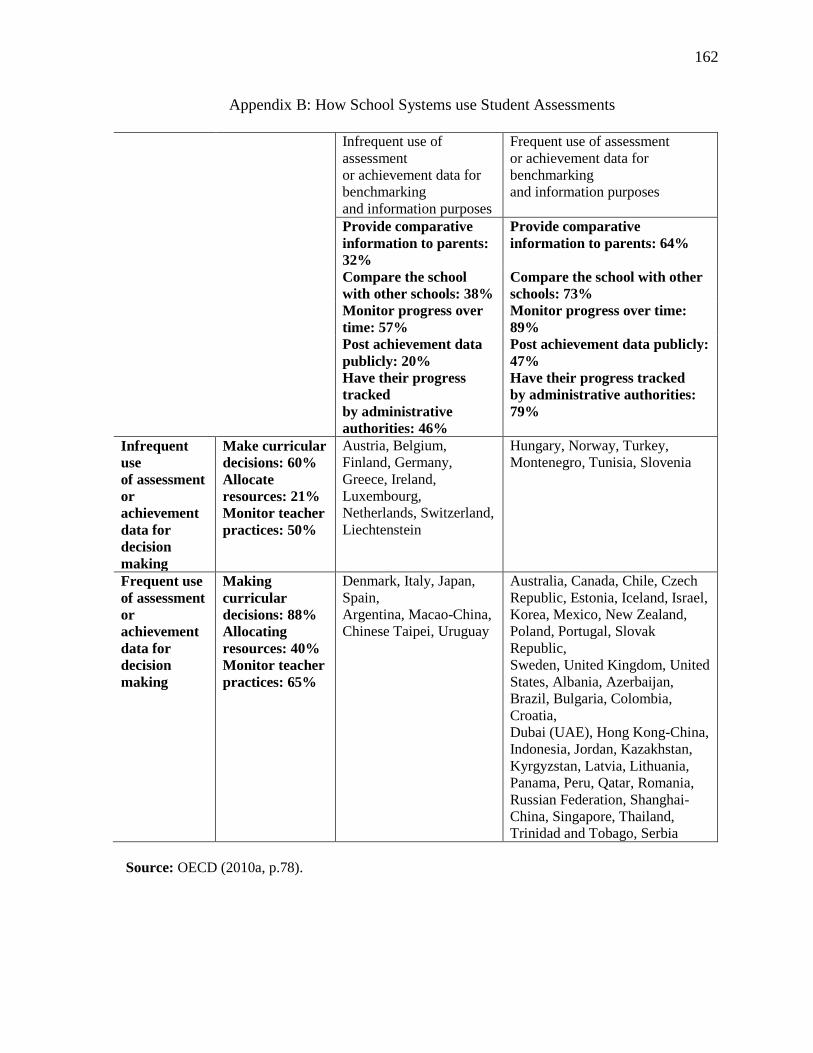
162
Appendix B: How School Systems use Student Assessments
Infrequent use of
assessment
or achievement data for
benchmarking
and information purposes
Frequent use of assessment
or achievement data for
benchmarking
and information purposes
Provide comparative
information to parents:
32%
Provide comparative
information to parents: 64%
Compare the school
with other schools: 38%
Compare the school with other
schools: 73% Monitor progress over
time: 57%
Monitor progress over time:
89% Post achievement data
publicly: 20%
Post achievement data publicly:
47% Have their progress
tracked
by administrative
authorities: 46%
Have their progress tracked
by administrative authorities:
79%
Infrequent
use
of assessment
or
achievement
data for
decision
making
Make curricular
decisions: 60%
Allocate
resources: 21%
Monitor teacher
practices: 50%
Austria, Belgium,
Finland, Germany,
Greece, Ireland,
Luxembourg,
Netherlands, Switzerland,
Liechtenstein
Hungary, Norway, Turkey,
Montenegro, Tunisia, Slovenia
Frequent use
of assessment
or
achievement
data for
decision
making
Making
curricular
decisions: 88%
Allocating
resources: 40%
Monitor teacher
practices: 65%
Denmark, Italy, Japan,
Spain,
Argentina, Macao-China,
Chinese Taipei, Uruguay
Australia, Canada, Chile, Czech
Republic, Estonia, Iceland, Israel,
Korea, Mexico, New Zealand,
Poland, Portugal, Slovak
Republic,
Sweden, United Kingdom, United
States, Albania, Azerbaijan,
Brazil, Bulgaria, Colombia,
Croatia,
Dubai (UAE), Hong Kong-China,
Indonesia, Jordan, Kazakhstan,
Kyrgyzstan, Latvia, Lithuania,
Panama, Peru, Qatar, Romania,
Russian Federation, Shanghai-
China, Singapore, Thailand,
Trinidad and Tobago, Serbia
Source: OECD (2010a, p.78).
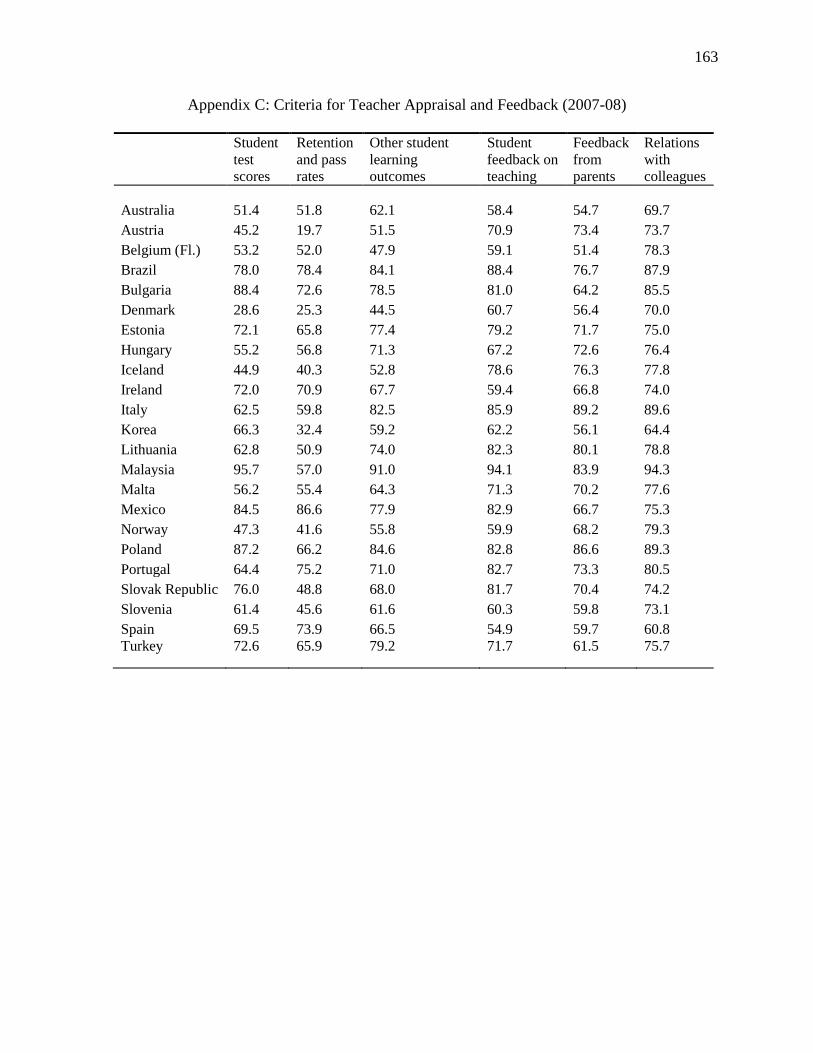
163
Appendix C: Criteria for Teacher Appraisal and Feedback (2007-08)
Student
test
scores
Retention
and pass
rates
Other student
learning
outcomes
Student
feedback on
teaching
Feedback
from
parents
Relations
with
colleagues
Australia 51.4 51.8 62.1 58.4 54.7 69.7
Austria 45.2 19.7 51.5 70.9 73.4 73.7
Belgium (Fl.) 53.2 52.0 47.9 59.1 51.4 78.3
Brazil 78.0 78.4 84.1 88.4 76.7 87.9
Bulgaria 88.4 72.6 78.5 81.0 64.2 85.5
Denmark 28.6 25.3 44.5 60.7 56.4 70.0
Estonia 72.1 65.8 77.4 79.2 71.7 75.0
Hungary 55.2 56.8 71.3 67.2 72.6 76.4
Iceland 44.9 40.3 52.8 78.6 76.3 77.8
Ireland 72.0 70.9 67.7 59.4 66.8 74.0
Italy 62.5 59.8 82.5 85.9 89.2 89.6
Korea 66.3 32.4 59.2 62.2 56.1 64.4
Lithuania 62.8 50.9 74.0 82.3 80.1 78.8
Malaysia 95.7 57.0 91.0 94.1 83.9 94.3
Malta 56.2 55.4 64.3 71.3 70.2 77.6
Mexico 84.5 86.6 77.9 82.9 66.7 75.3
Norway 47.3 41.6 55.8 59.9 68.2 79.3
Poland 87.2 66.2 84.6 82.8 86.6 89.3
Portugal 64.4 75.2 71.0 82.7 73.3 80.5
Slovak Republic 76.0 48.8 68.0 81.7 70.4 74.2
Slovenia 61.4 45.6 61.6 60.3 59.8 73.1
Spain 69.5 73.9 66.5 54.9 59.7 60.8
Turkey 72.6 65.9 79.2 71.7 61.5 75.7
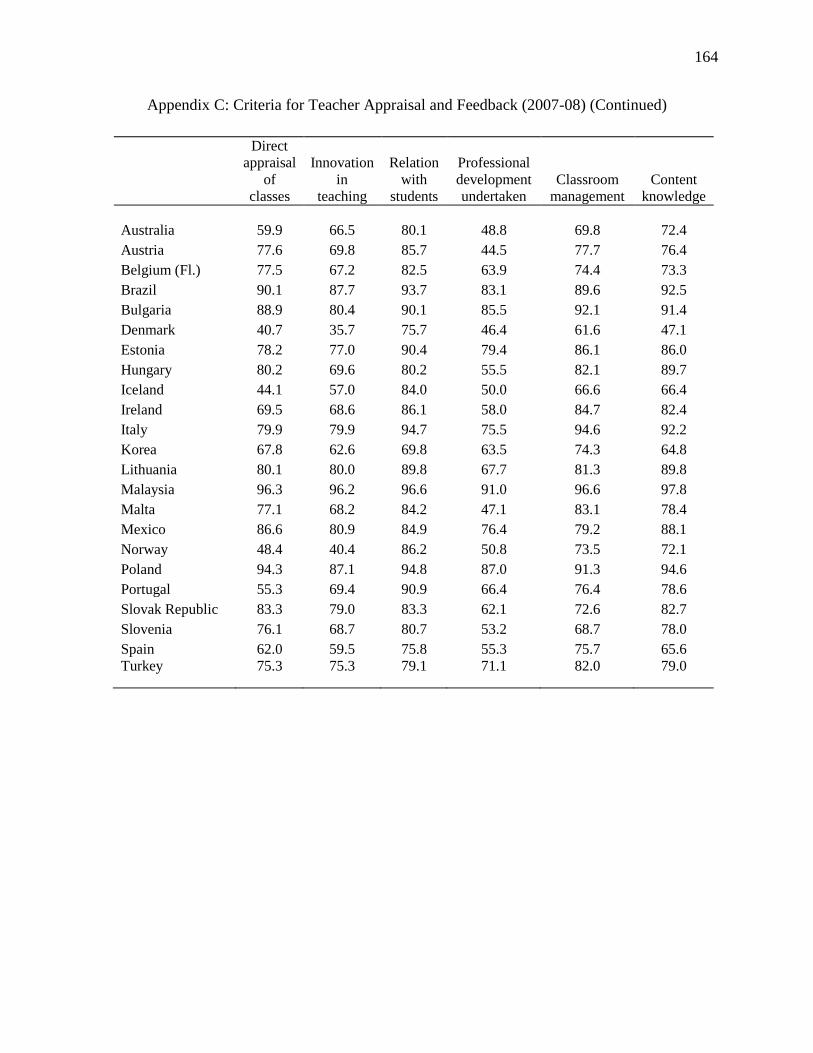
164
Appendix C: Criteria for Teacher Appraisal and Feedback (2007-08) (Continued)
Direct
appraisal
of
classes
Innovation
in
teaching
Relation
with
students
Professional
development
undertaken
Classroom
management
Content
knowledge
Australia 59.9 66.5 80.1 48.8 69.8 72.4
Austria 77.6 69.8 85.7 44.5 77.7 76.4
Belgium (Fl.) 77.5 67.2 82.5 63.9 74.4 73.3
Brazil 90.1 87.7 93.7 83.1 89.6 92.5
Bulgaria 88.9 80.4 90.1 85.5 92.1 91.4
Denmark 40.7 35.7 75.7 46.4 61.6 47.1
Estonia 78.2 77.0 90.4 79.4 86.1 86.0
Hungary 80.2 69.6 80.2 55.5 82.1 89.7
Iceland 44.1 57.0 84.0 50.0 66.6 66.4
Ireland 69.5 68.6 86.1 58.0 84.7 82.4
Italy 79.9 79.9 94.7 75.5 94.6 92.2
Korea 67.8 62.6 69.8 63.5 74.3 64.8
Lithuania 80.1 80.0 89.8 67.7 81.3 89.8
Malaysia 96.3 96.2 96.6 91.0 96.6 97.8
Malta 77.1 68.2 84.2 47.1 83.1 78.4
Mexico 86.6 80.9 84.9 76.4 79.2 88.1
Norway 48.4 40.4 86.2 50.8 73.5 72.1
Poland 94.3 87.1 94.8 87.0 91.3 94.6
Portugal 55.3 69.4 90.9 66.4 76.4 78.6
Slovak Republic 83.3 79.0 83.3 62.1 72.6 82.7
Slovenia 76.1 68.7 80.7 53.2 68.7 78.0
Spain 62.0 59.5 75.8 55.3 75.7 65.6
Turkey 75.3 75.3 79.1 71.1 82.0 79.0
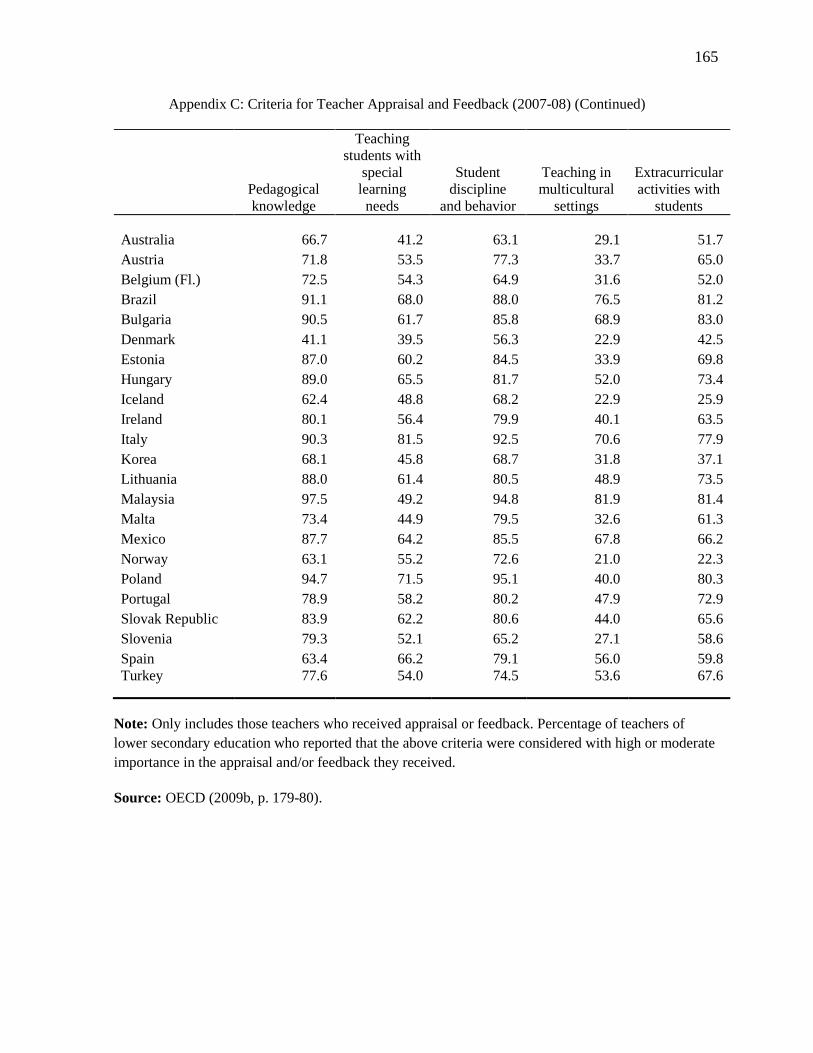
165
Appendix C: Criteria for Teacher Appraisal and Feedback (2007-08) (Continued)
Pedagogical
knowledge
Teaching
students with
special
learning
needs
Student
discipline
and behavior
Teaching in
multicultural
settings
Extracurricular
activities with
students
Australia 66.7 41.2 63.1 29.1 51.7
Austria 71.8 53.5 77.3 33.7 65.0
Belgium (Fl.) 72.5 54.3 64.9 31.6 52.0
Brazil 91.1 68.0 88.0 76.5 81.2
Bulgaria 90.5 61.7 85.8 68.9 83.0
Denmark 41.1 39.5 56.3 22.9 42.5
Estonia 87.0 60.2 84.5 33.9 69.8
Hungary 89.0 65.5 81.7 52.0 73.4
Iceland 62.4 48.8 68.2 22.9 25.9
Ireland 80.1 56.4 79.9 40.1 63.5
Italy 90.3 81.5 92.5 70.6 77.9
Korea 68.1 45.8 68.7 31.8 37.1
Lithuania 88.0 61.4 80.5 48.9 73.5
Malaysia 97.5 49.2 94.8 81.9 81.4
Malta 73.4 44.9 79.5 32.6 61.3
Mexico 87.7 64.2 85.5 67.8 66.2
Norway 63.1 55.2 72.6 21.0 22.3
Poland 94.7 71.5 95.1 40.0 80.3
Portugal 78.9 58.2 80.2 47.9 72.9
Slovak Republic 83.9 62.2 80.6 44.0 65.6
Slovenia 79.3 52.1 65.2 27.1 58.6
Spain 63.4 66.2 79.1 56.0 59.8
Turkey 77.6 54.0 74.5 53.6 67.6
Note: Only includes those teachers who received appraisal or feedback. Percentage of teachers of
lower secondary education who reported that the above criteria were considered with high or moderate
importance in the appraisal and/or feedback they received.
Source: OECD (2009b, p. 179-80).
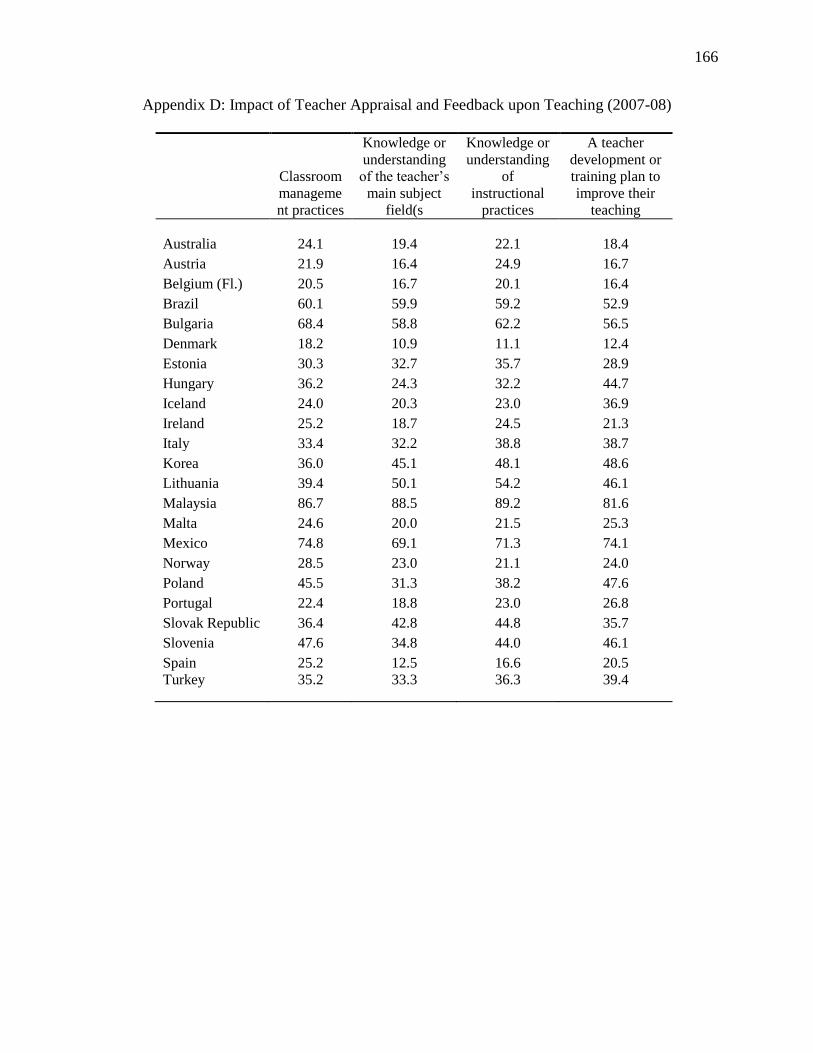
166
Appendix D: Impact of Teacher Appraisal and Feedback upon Teaching (2007-08)
Classroom
manageme
nt practices
Knowledge or
understanding
of the teacher’s
main subject
field(s
Knowledge or
understanding
of
instructional
practices
A teacher
development or
training plan to
improve their
teaching
Australia 24.1 19.4 22.1 18.4
Austria 21.9 16.4 24.9 16.7
Belgium (Fl.) 20.5 16.7 20.1 16.4
Brazil 60.1 59.9 59.2 52.9
Bulgaria 68.4 58.8 62.2 56.5
Denmark 18.2 10.9 11.1 12.4
Estonia 30.3 32.7 35.7 28.9
Hungary 36.2 24.3 32.2 44.7
Iceland 24.0 20.3 23.0 36.9
Ireland 25.2 18.7 24.5 21.3
Italy 33.4 32.2 38.8 38.7
Korea 36.0 45.1 48.1 48.6
Lithuania 39.4 50.1 54.2 46.1
Malaysia 86.7 88.5 89.2 81.6
Malta 24.6 20.0 21.5 25.3
Mexico 74.8 69.1 71.3 74.1
Norway 28.5 23.0 21.1 24.0
Poland 45.5 31.3 38.2 47.6
Portugal 22.4 18.8 23.0 26.8
Slovak Republic 36.4 42.8 44.8 35.7
Slovenia 47.6 34.8 44.0 46.1
Spain 25.2 12.5 16.6 20.5
Turkey 35.2 33.3 36.3 39.4
167
Appendix D: Impact of Teacher Appraisal and Feedback upon Teaching (2007-08) (Continued)
Teaching
students with
special
learning needs
Student
discipline
and
behavior
Teaching in
multicultural
settings
The emphasis placed
on improving
student test scores in
teaching
Australia 14.2 21.0 8.1 24.7
Austria 18.6 20.4 8.3 19.5
Belgium (Fl.) 19.1 20.1 8.2 19.6
Brazil 26.8 53.7 44.0 65.6
Bulgaria 41.5 63.3 44.1 74.5
Denmark 13.9 19.5 6.3 19.3
Estonia 19.4 26.9 10.8 30.4
Hungary 32.2 32.4 19.8 30.4
Iceland 22.8 30.0 12.6 26.6
Ireland 19.3 23.4 12.0 26.7
Italy 37.2 36.9 29.5 44.0
Korea 33.5 47.0 21.4 39.7
Lithuania 32.2 43.7 23.0 46.7
Malaysia 45.7 83.9 73.9 91.5
Malta 17.7 25.7 9.6 31.3
Mexico 42.0 67.1 53.1 76.7
Norway 24.2 28.6 7.0 25.7
Poland 26.4 31.9 10.8 53.9
Portugal 21.4 26.9 14.7 35.5
Slovak Republic 31.3 26.9 18.9 41.1
Slovenia 38.3 45.8 15.2 52.1
Spain 22.9 27.2 17.0 24.6
Turkey 25.9 40.0 26.7 43.0
Note: Only includes those teachers who received appraisal or feedback. Percentage of teachers of
lower secondary education who reported that the appraisal and/or feedback they received directly
led to or involved moderate or large changes in the above.
Source: OECD (2009b, p. 187).
168
Appendix E: Outcomes of Teacher Appraisal and Feedback (2007-08)
A change in
salary
Financial reward
or bonus
Career
advancement
Public
recognition
Australia 5.6 1.6 16.9 24.1
Austria 1.1 1.7 4.7 27.1
Belgium (Fl.) 0.4 0.1 3.7 20.7
Brazil 8.2 5.5 25.6 47.8
Bulgaria 26.2 24.2 11.6 64.9
Denmark 2.2 2.7 4.7 25.3
Estonia 14.3 19.8 10.5 39.6
Hungary 9.4 25.1 10.7 40.2
Iceland 7.5 9.3 8.6 18.3
Ireland 3.5 1.4 13.3 24.8
Italy 2.0 4.0 4.9 46.4
Korea 5.2 8.3 12.7 31.0
Lithuania 17.3 22.0 14.3 55.4
Malaysia 33.0 29.0 58.2 58.6
Malta 1.7 1.2) 8.2 19.3
Mexico 10.6 7.3 28.6 33.4
Norway 7.0 3.0 6.9 25.6
Poland 14.5 26.5 39.2 55.7
Portugal 1.7 0.6 6.2 26.3
Slovak Republic 19.7 37.3 20.8 40.7
Slovenia 14.2 19.4 39.4 43.3
Spain 1.8 1.6 8.6 25.1
Turkey 2.2 3.6 13.5 42.6
169
Appendix E: Outcomes of Teacher Appraisal and Feedback (2007-08) (Continued)
Professional development
opportunity
Change in work
responsibility
Role in school
development initiative
Australia 16.7 17.4 24.1
Austria 8.0 14.7 17.2
Belgium (Fl.) 7.1 11.9 10.1
Brazil 27.8 47.7 41.6
Bulgaria 42.4 28.2 49.5
Denmark 25.6 19.0 16.3
Estonia 35.6 21.7 31.3
Hungary 22.8 12.3 28.7
Iceland 20.5 18.1 19.2
Ireland 13.4 16.0 23.2
Italy 19.2 27.1 38.3
Korea 17.1 24.1 24.9
Lithuania 42.4 39.9 42.8
Malaysia 50.8 76.4 64.1
Malta 7.8 15.1 16.7
Mexico 27.2 55.9 34.4
Norway 21.3 14.5 22.4
Poland 38.2 24.6 42.1
Portugal 11.3 25.3 25.3
Slovak Republic 28.7 30.0 35.9
Slovenia 36.2 24.5 28.7
Spain 13.2 16.9 20.7
Turkey 12.1 33.7 24.4
Note: Only includes those teachers who received appraisal or feedback. Percentage of teachers of
lower secondary education who reported that the appraisal and/or feedback they received led to a
moderate or large change in the above aspects of their work and careers.
Source: OECD (2009b, p. 181).
170
Appendix F: Variable Definitions and Measurements
Variables (original in
parenthesis) Definition Measurement
Developmental
Monitoring in Test-
Language
1) Student achievement
(stachvmnt)
2) Peer reviews
(trprvw)
3) Principal and staff
observations
(prstffobs)
4) External
observations (extob)
Principals’ pedagogical
role and use of student
assessments for
improving instruction
5) Principals’
observation of
classes (obsclsspisa)
6) Principals’
suggesting teachers
for improvement
(sggsttrs)
7) Principals informing
teachers about
possibilities for
updating their
Student achievement used to evaluate teachers in test language
Teacher peer reviews used to evaluate teachers in test language
Principal and staff observations used to evaluate teachers in test
language
External observations used to evaluate teachers in test language
I observe instruction in classrooms
I give teachers suggestions as to how they can improve their
teaching
I inform teachers about possibilities for updating their knowledge
and skills
Assessments of students used to identify aspects of instruction or the
curriculum that could be improved
Categorical: For each of the variables 1-4,
principals were asked if any of the following
approaches were used to monitor practice of
teachers in test language. Response measured
as Yes=1, No=2. ‘Yes’ dummy coded as 1.
Categorical: Variables 5-7 seek principals’
responses to the item “Below you can find
statements about your management of this
school. Please indicate the frequency of the
following activities and behaviors in your
school during the last school year.” Responses
recorded as 1=Never, 2=Seldom, 3=Quite
often, 4=Very often. Response 3 and 4
dummy coded as 1.
Variable 8 seeks principals’ responses to the
item: “In your school, are assessments of
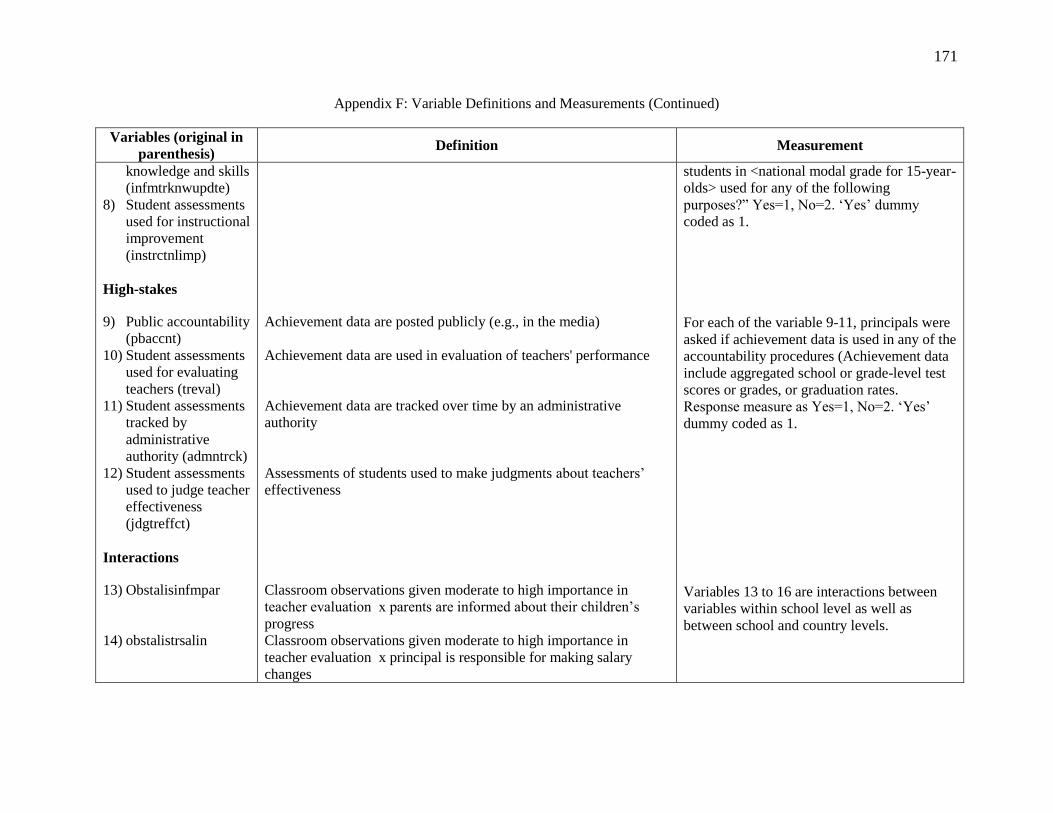
171
Appendix F: Variable Definitions and Measurements (Continued)
Variables (original in
parenthesis) Definition Measurement
knowledge and skills
(infmtrknwupdte)
8) Student assessments
used for instructional
improvement
(instrctnlimp)
High-stakes
9) Public accountability
(pbaccnt)
10) Student assessments
used for evaluating
teachers (treval)
11) Student assessments
tracked by
administrative
authority (admntrck)
12) Student assessments
used to judge teacher
effectiveness
(jdgtreffct)
Interactions
13) Obstalisinfmpar
14) obstalistrsalin
Achievement data are posted publicly (e.g., in the media)
Achievement data are used in evaluation of teachers' performance
Achievement data are tracked over time by an administrative
authority
Assessments of students used to make judgments about teachers’
effectiveness
Classroom observations given moderate to high importance in
teacher evaluation x parents are informed about their children’s
progress
Classroom observations given moderate to high importance in
teacher evaluation x principal is responsible for making salary
changes
students in <national modal grade for 15-year-
olds> used for any of the following
purposes?” Yes=1, No=2. ‘Yes’ dummy
coded as 1.
For each of the variable 9-11, principals were
asked if achievement data is used in any of the
accountability procedures (Achievement data
include aggregated school or grade-level test
scores or grades, or graduation rates.
Response measure as Yes=1, No=2. ‘Yes’
dummy coded as 1.
Variables 13 to 16 are interactions between
variables within school level as well as
between school and country levels.
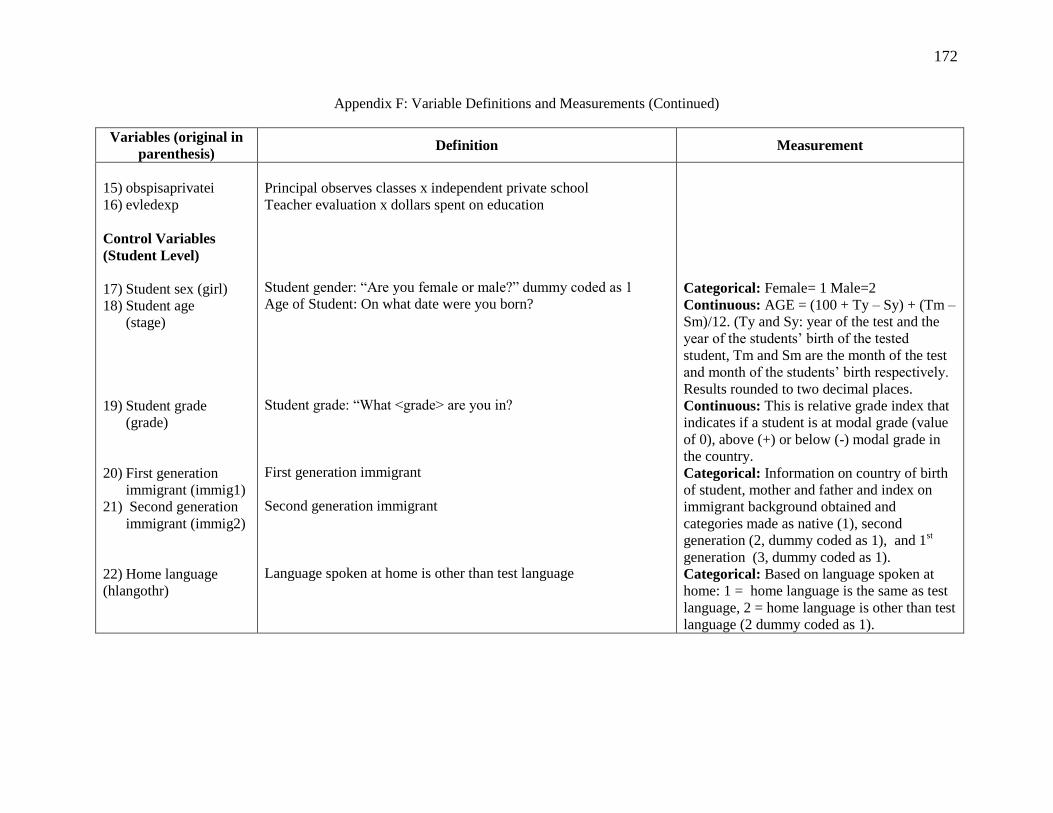
172
Appendix F: Variable Definitions and Measurements (Continued)
Variables (original in
parenthesis) Definition Measurement
15) obspisaprivatei
16) evledexp
Control Variables
(Student Level)
17) Student sex (girl)
18) Student age
(stage)
19) Student grade
(grade)
20) First generation
immigrant (immig1)
21) Second generation
immigrant (immig2)
22) Home language
(hlangothr)
Principal observes classes x independent private school
Teacher evaluation x dollars spent on education
Student gender: “Are you female or male?” dummy coded as 1
Age of Student: On what date were you born?
Student grade: “What <grade> are you in?
First generation immigrant
Second generation immigrant
Language spoken at home is other than test language
Categorical: Female= 1 Male=2
Continuous: AGE = (100 + Ty – Sy) + (Tm –
Sm)/12. (Ty and Sy: year of the test and the
year of the students’ birth of the tested
student, Tm and Sm are the month of the test
and month of the students’ birth respectively.
Results rounded to two decimal places.
Continuous: This is relative grade index that
indicates if a student is at modal grade (value
of 0), above (+) or below (-) modal grade in
the country.
Categorical: Information on country of birth
of student, mother and father and index on
immigrant background obtained and
categories made as native (1), second
generation (2, dummy coded as 1), and 1st
generation (3, dummy coded as 1).
Categorical: Based on language spoken at
home: 1 = home language is the same as test
language, 2 = home language is other than test
language (2 dummy coded as 1).
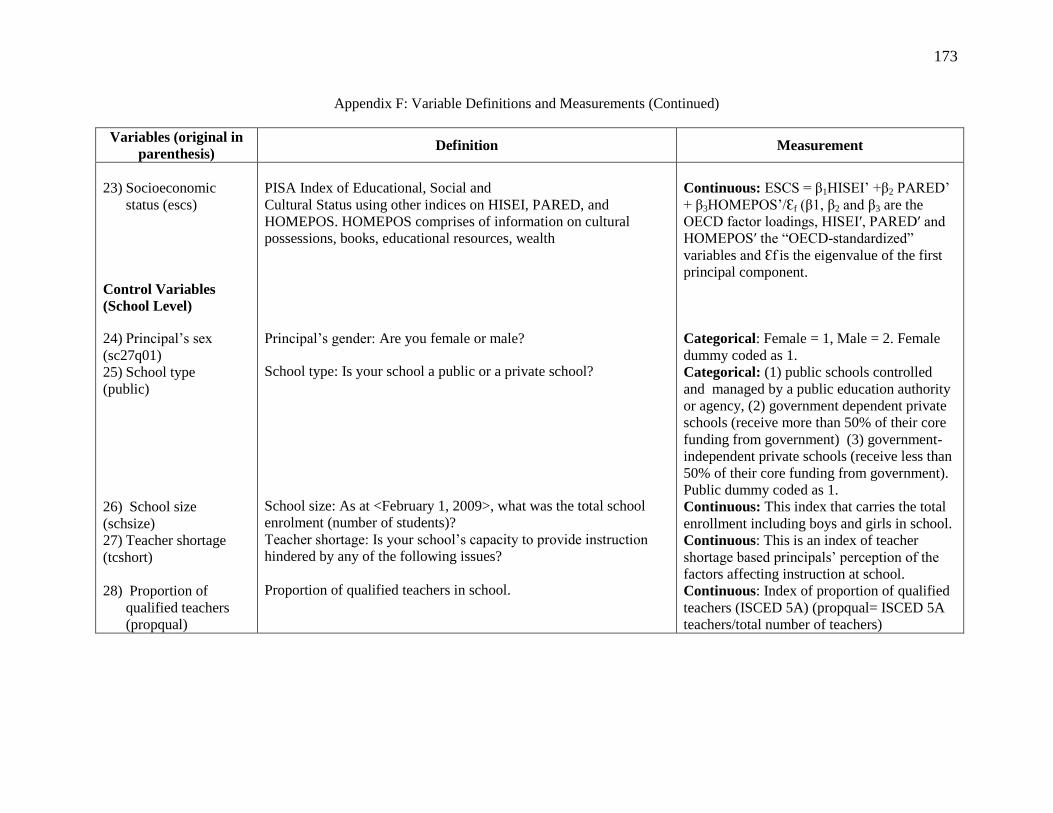
173
Appendix F: Variable Definitions and Measurements (Continued)
Variables (original in
parenthesis) Definition Measurement
23) Socioeconomic
status (escs)
Control Variables
(School Level)
24) Principal’s sex
(sc27q01)
25) School type
(public)
26) School size
(schsize)
27) Teacher shortage
(tcshort)
28) Proportion of
qualified teachers
(propqual)
PISA Index of Educational, Social and
Cultural Status using other indices on HISEI, PARED, and
HOMEPOS. HOMEPOS comprises of information on cultural
possessions, books, educational resources, wealth
Principal’s gender: Are you female or male?
School type: Is your school a public or a private school?
School size: As at <February 1, 2009>, what was the total school
enrolment (number of students)?
Teacher shortage: Is your school’s capacity to provide instruction
hindered by any of the following issues?
Proportion of qualified teachers in school.
Continuous: ESCS = β1HISEI’ +β2 PARED’
+ β3HOMEPOS’/Ɛf (β1, β2 and β3 are the
OECD factor loadings, HISEIʹ, PAREDʹ and
HOMEPOSʹ the “OECD-standardized”
variables and Ɛf is the eigenvalue of the first
principal component.
Categorical: Female = 1, Male = 2. Female
dummy coded as 1.
Categorical: (1) public schools controlled
and managed by a public education authority
or agency, (2) government dependent private
schools (receive more than 50% of their core
funding from government) (3) government-
independent private schools (receive less than
50% of their core funding from government).
Public dummy coded as 1.
Continuous: This index that carries the total
enrollment including boys and girls in school.
Continuous: This is an index of teacher
shortage based principals’ perception of the
factors affecting instruction at school.
Continuous: Index of proportion of qualified
teachers (ISCED 5A) (propqual= ISCED 5A
teachers/total number of teachers)
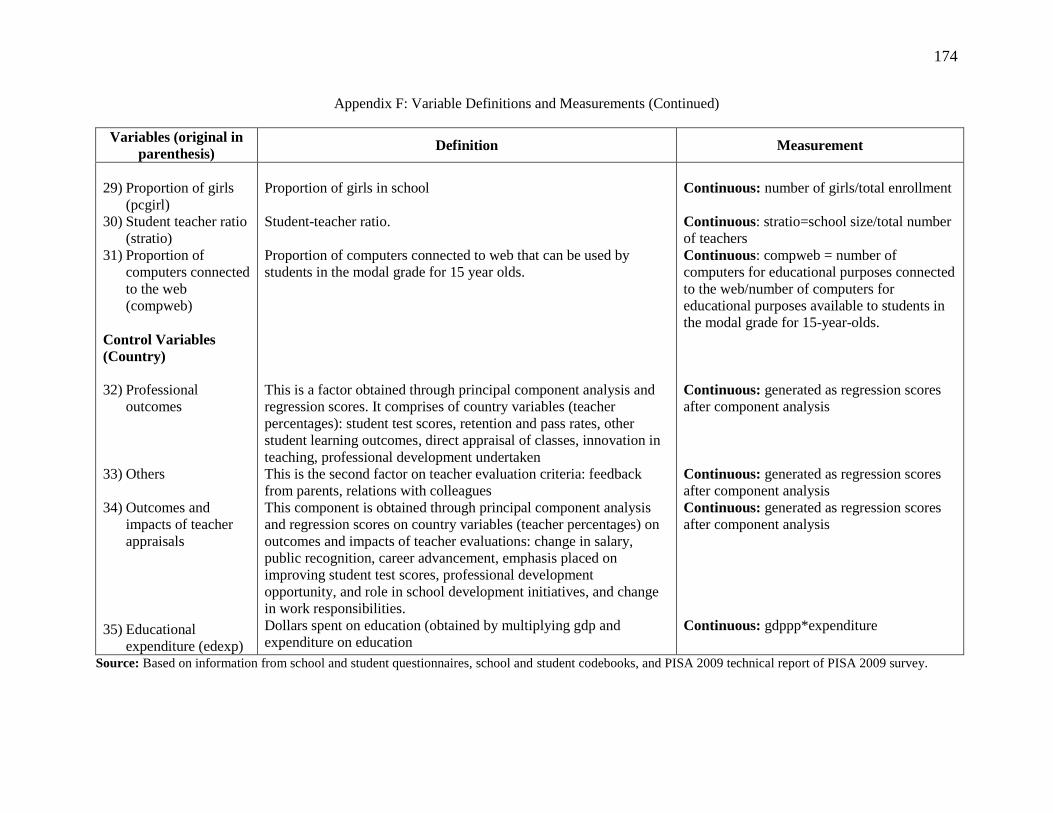
174
Appendix F: Variable Definitions and Measurements (Continued)
Variables (original in
parenthesis) Definition Measurement
29) Proportion of girls
(pcgirl)
30) Student teacher ratio
(stratio)
31) Proportion of
computers connected
to the web
(compweb)
Control Variables
(Country)
32) Professional
outcomes
33) Others
34) Outcomes and
impacts of teacher
appraisals
35) Educational
expenditure (edexp)
Proportion of girls in school
Student-teacher ratio.
Proportion of computers connected to web that can be used by
students in the modal grade for 15 year olds.
This is a factor obtained through principal component analysis and
regression scores. It comprises of country variables (teacher
percentages): student test scores, retention and pass rates, other
student learning outcomes, direct appraisal of classes, innovation in
teaching, professional development undertaken
This is the second factor on teacher evaluation criteria: feedback
from parents, relations with colleagues
This component is obtained through principal component analysis
and regression scores on country variables (teacher percentages) on
outcomes and impacts of teacher evaluations: change in salary,
public recognition, career advancement, emphasis placed on
improving student test scores, professional development
opportunity, and role in school development initiatives, and change
in work responsibilities.
Dollars spent on education (obtained by multiplying gdp and
expenditure on education
Continuous: number of girls/total enrollment
Continuous: stratio=school size/total number
of teachers
Continuous: compweb = number of
computers for educational purposes connected
to the web/number of computers for
educational purposes available to students in
the modal grade for 15-year-olds.
Continuous: generated as regression scores
after component analysis
Continuous: generated as regression scores
after component analysis
Continuous: generated as regression scores
after component analysis
Continuous: gdppp*expenditure
Source: Based on information from school and student questionnaires, school and student codebooks, and PISA 2009 technical report of PISA 2009 survey.
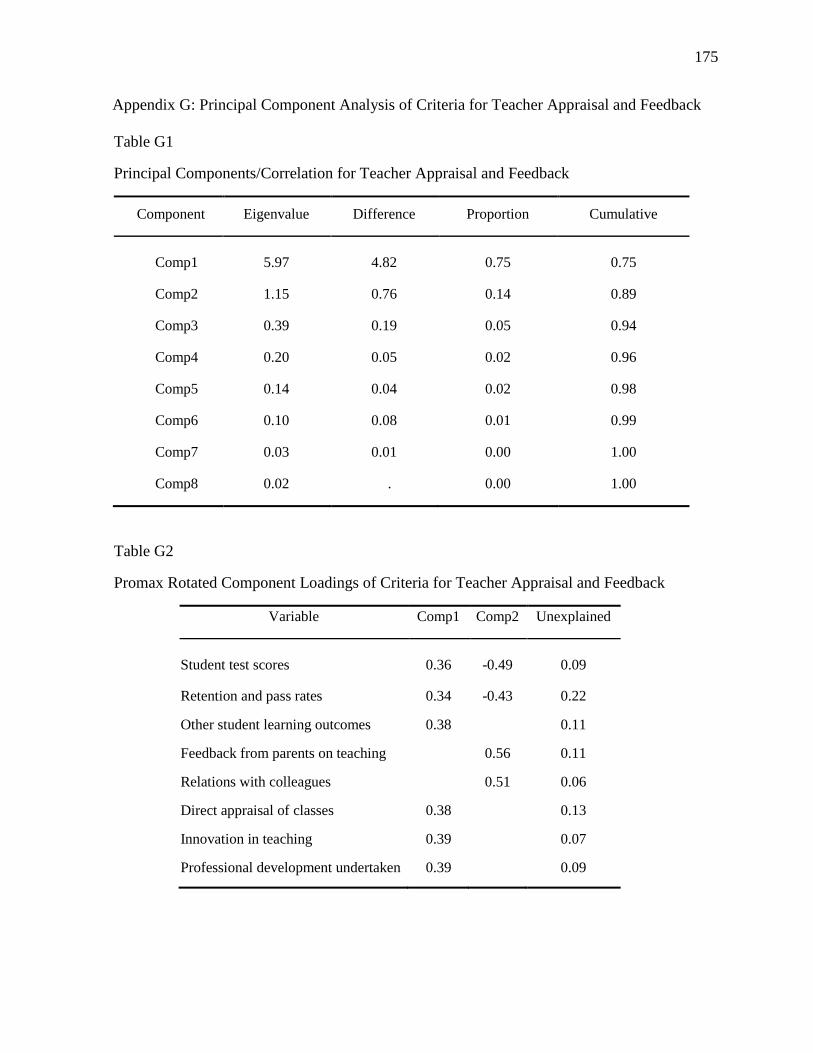
175
Appendix G: Principal Component Analysis of Criteria for Teacher Appraisal and Feedback
Table G1
Principal Components/Correlation for Teacher Appraisal and Feedback
Component Eigenvalue Difference Proportion Cumulative
Comp1 5.97 4.82 0.75 0.75
Comp2 1.15 0.76 0.14 0.89
Comp3 0.39 0.19 0.05 0.94
Comp4 0.20 0.05 0.02 0.96
Comp5 0.14 0.04 0.02 0.98
Comp6 0.10 0.08 0.01 0.99
Comp7 0.03 0.01 0.00 1.00
Comp8 0.02 . 0.00 1.00
Table G2
Promax Rotated Component Loadings of Criteria for Teacher Appraisal and Feedback
Variable Comp1 Comp2 Unexplained
Student test scores 0.36 -0.49 0.09
Retention and pass rates 0.34 -0.43 0.22
Other student learning outcomes 0.38 0.11
Feedback from parents on teaching 0.56 0.11
Relations with colleagues 0.51 0.06
Direct appraisal of classes 0.38 0.13
Innovation in teaching 0.39 0.07
Professional development undertaken 0.39 0.09
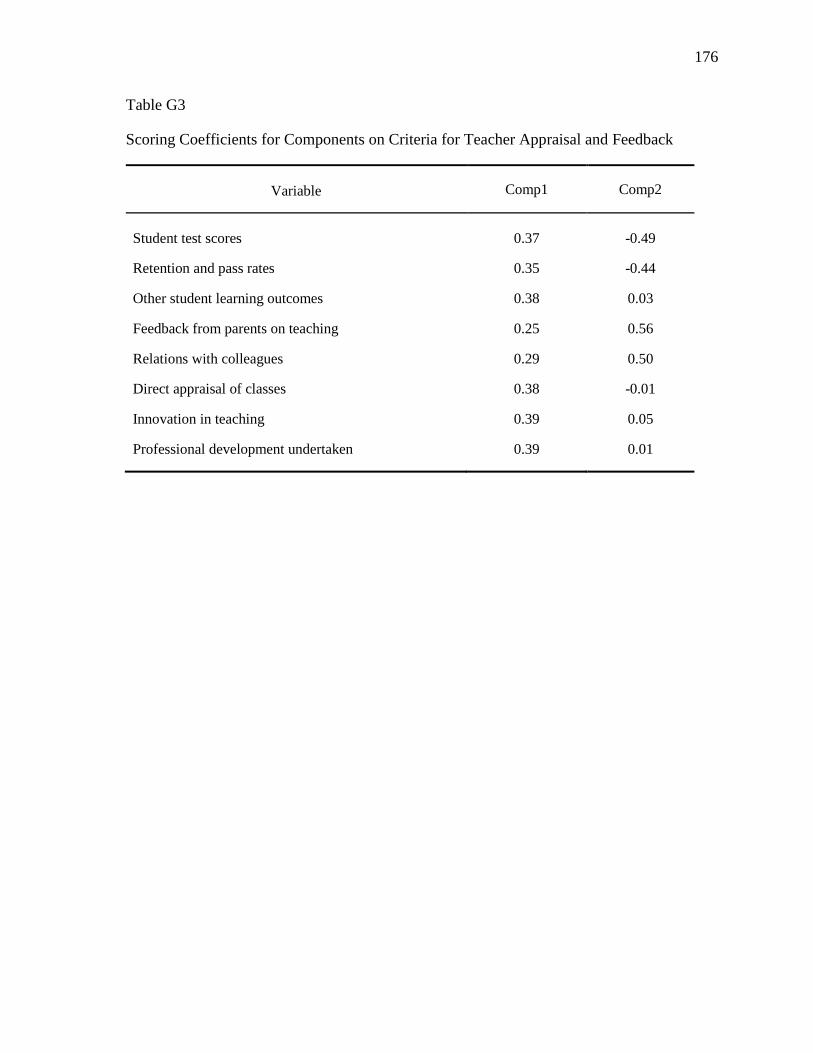
176
Table G3
Scoring Coefficients for Components on Criteria for Teacher Appraisal and Feedback
Variable Comp1 Comp2
Student test scores 0.37 -0.49
Retention and pass rates 0.35 -0.44
Other student learning outcomes 0.38 0.03
Feedback from parents on teaching 0.25 0.56
Relations with colleagues 0.29 0.50
Direct appraisal of classes 0.38 -0.01
Innovation in teaching 0.39 0.05
Professional development undertaken 0.39 0.01
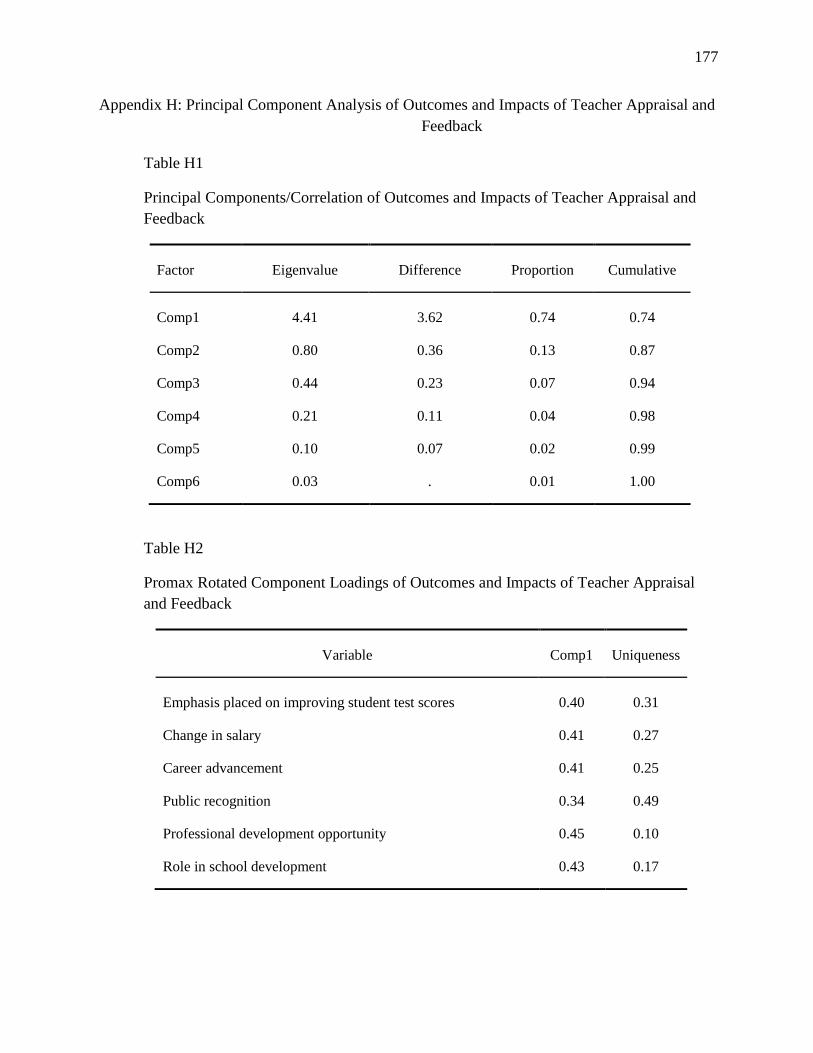
177
Appendix H: Principal Component Analysis of Outcomes and Impacts of Teacher Appraisal and
Feedback
Table H1
Principal Components/Correlation of Outcomes and Impacts of Teacher Appraisal and
Feedback
Factor Eigenvalue Difference Proportion Cumulative
Comp1 4.41 3.62 0.74 0.74
Comp2 0.80 0.36 0.13 0.87
Comp3 0.44 0.23 0.07 0.94
Comp4 0.21 0.11 0.04 0.98
Comp5 0.10 0.07 0.02 0.99
Comp6 0.03 . 0.01 1.00
Table H2
Promax Rotated Component Loadings of Outcomes and Impacts of Teacher Appraisal
and Feedback
Variable Comp1 Uniqueness
Emphasis placed on improving student test scores 0.40 0.31
Change in salary 0.41 0.27
Career advancement 0.41 0.25
Public recognition 0.34 0.49
Professional development opportunity 0.45 0.10
Role in school development 0.43 0.17
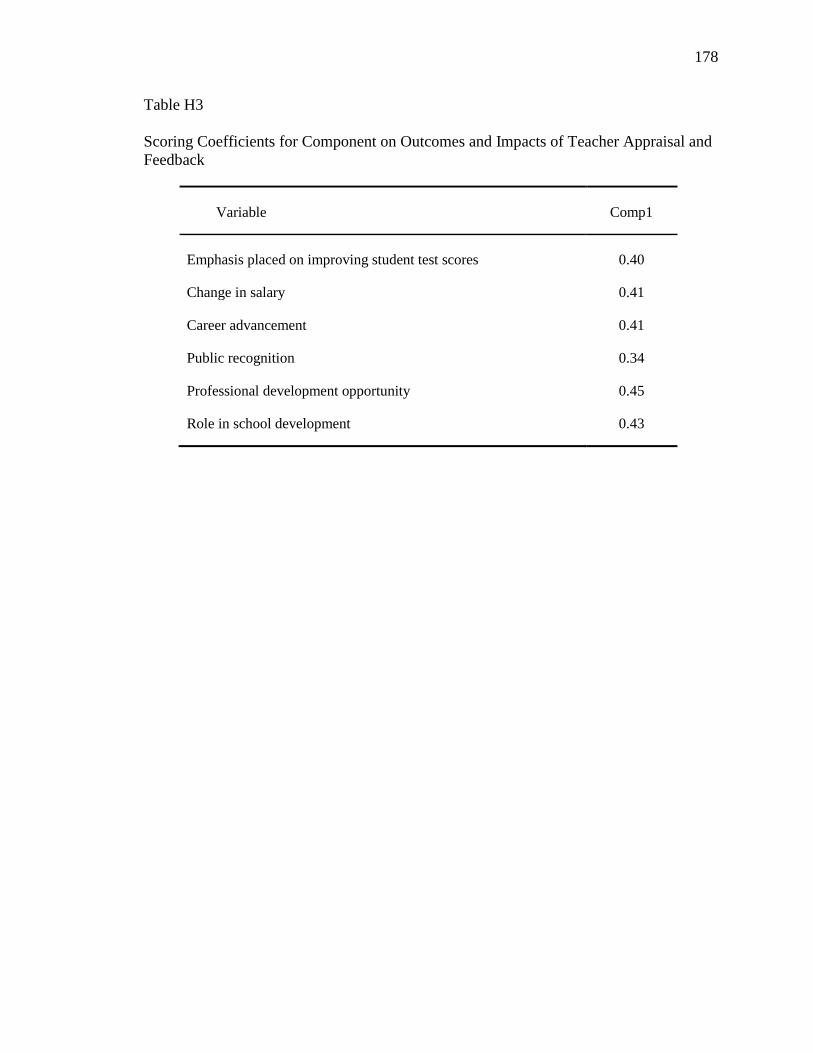
178
Table H3
Scoring Coefficients for Component on Outcomes and Impacts of Teacher Appraisal and
Feedback
Variable Comp1
Emphasis placed on improving student test scores 0.40
Change in salary 0.41
Career advancement 0.41
Public recognition 0.34
Professional development opportunity 0.45
Role in school development 0.43
CURRICULUM VITAE
Gulab Khan
Education
2013 Doctor of Philosophy, Educational Theory and Policy
College of Education, Pennsylvania State University, University Park, United
States
2005 Master of Education, Educational Leadership and Management
Aga Khan University, Institute for Educational Development, Karachi, Pakistan
1999 Master of Science, Chemistry
Quaid-i-Azam University, Islamabad, Pakistan
1996 Bachelor of Science
University of the Punjab, Lahore, Pakistan
Experience
2010-2013 Head of Monitoring, Evaluation and Research (Currently on study leave)
Aga Khan Education Service, Pakistan
2008 Academic Coordinator
Aga Khan Education Service, Pakistan
2006-2010 Principal
Aga Khan Education Service, Pakistan
2005-2006 Vice/Acting Principal
Aga Khan Education Service, Pakistan
1999-2005 Lecturer Chemistry
Aga Khan Education Service, Pakistan
Publications/Research
Khan, G. (2010). Exploring principal-student relationships in a private secondary school in
Pakistan. In Khaki, J. A., & Safdar, Q. (Eds). Educational leadership in Pakistan: Ideals and
Realities (pp. 129-150). Karachi: Oxford University Press.
Khan, G. (2008). Lost sailor gets ashore. In Bashiruddin, A., & Retallick, J. (Eds.) (2008).
Becoming a teacher in the developing world. A monograph. AKU-IED Publications.
Zhang, L., Khan, G., Tahirsylaj, A. (Work in progress). Student Performance, School
Differentiation, and World Cultures: Evidence from PISA 2009.


![[OECD. Published by OECD Publishing] Regionalism(BookFi.org)](https://img.pdfslide.us/doc/110x75/55cf9387550346f57b9dbc6c/oecd-published-by-oecd-publishing-regionalismbookfiorg.jpg)