Embed Size (px)
Citation preview
http://rer.aera.netResearch
Review of Educational
http://rer.sagepub.com/content/73/1/89The online version of this article can be found at:
DOI: 10.3102/00346543073001089
2003 73: 89REVIEW OF EDUCATIONAL RESEARCHAndrew J. Wayne and Peter Youngs
Teacher Characteristics and Student Achievement Gains: A Review
Published on behalf of
American Educational Research Association
and
http://www.sagepublications.com
can be found at:Review of Educational ResearchAdditional services and information for
http://rer.aera.net/alertsEmail Alerts:
http://rer.aera.net/subscriptionsSubscriptions:
http://www.aera.net/reprintsReprints:
http://www.aera.net/permissionsPermissions:
http://rer.sagepub.com/content/73/1/89.refs.htmlCitations:
What is This?
- Jan 1, 2003Version of Record >>
at TEXAS SOUTHERN UNIVERSITY on October 18, 2014http://rer.aera.netDownloaded from at TEXAS SOUTHERN UNIVERSITY on October 18, 2014http://rer.aera.netDownloaded from
Review of Educational ResearchSpring 2003, Vol. 73, No. 1, pp. 89–122
Teacher Characteristics and Student Achievement Gains: A Review
Andrew J. WayneSRI InternationalPeter Youngs
Stanford University
A large body of studies exists that examines the relationship between studentachievement gains and the characteristics of teachers. To help policymakersand researchers use and build on this body of studies, this article reviews thestudies systematically and synthesizes their results with deliberate considera-tion of each study’s qualities. Determinate relationships are described for fourcategories of teacher characteristics: college ratings, test scores, degrees andcoursework, and certification status. The review details the implications ofthese relationships in light of study limitations and proposes directions forfuture research.
KEYWORDS: academic achievement, alternative teacher certification, educationalquality, outcomes of education, performance factors, teacher characteristics, teachereffectiveness.
For policymakers and researchers looking for ways to improve K–12 education,one enduring approach has been to focus on teachers. Teachers are the system’sprincipal resource. Their salaries occupy the largest share of K–12 education bud-gets. And both intuition and empirical research tell us that the achievement ofschoolchildren depends substantially on the teachers they are assigned.1 Recently,issues related to teacher supply have captured national attention as a result of con-cerns about the aging of the teaching force and the need for new teachers. A varietyof researchers, policymakers, and national organizations have been scrutinizing theissue since the landmark report published by the National Commission for Teach-ing and America’s Future (1996). More recently, a National Research Council panelinvestigated teacher quality and assessment (Mitchell et al., 2001), and U.S. Secre-tary of Education Rod Paige issued a high-profile report on teacher quality (U.S.Department of Education, 2002).
Seeking results that might inform policymakers’ thinking, researchers haveundertaken studies and written syntheses that focus on different aspects of teacherpolicy. Some focus purely on teacher quantity, asking, for instance, how many teach-ers will be needed and how many leave the profession each year (e.g., Hussar, 1999).The present review targets teacher quality. A large body of studies exists thatexamines the characteristics of effective teachers. In their attempts to draw on this
89
at TEXAS SOUTHERN UNIVERSITY on October 18, 2014http://rer.aera.netDownloaded from
body of studies, researchers and analysts have arrived at markedly different inter-pretations, perhaps because of the difficulty of systematic review.2 The present effortattempts to use more systematic methods to make the results of this research onteacher characteristics available to policymakers and researchers.
Findings about the relationship between teacher characteristics and studentachievement gains are very applicable to discussions of teacher policy. States gen-erally specify requirements for teachers in terms of degrees, coursework, and testscores.3 Another way that knowledge about the relationship between teacher char-acteristics and student achievement gains figures into policy discussions is in theidentification of trends in teacher quality or in the identification of problems to besolved. Low-income students may have fewer teachers with certain characteristics,for instance (see, e.g., Ingersoll, 1996; Wayne, 2002). The knowledge contained inthe present body of student achievement studies is therefore especially important.
It is important to note that, as reflected in state policy, conceptions of effectiveteaching in the United States have changed significantly over time. For most of the20th century, candidates were eligible for certification as long they completed astate-approved teacher preparation program. States influenced the nature of teacherpreparation by prescribing coursework in subject matter and/or education and byestablishing student teaching requirements. But state policies rarely promoted spe-cific approaches to instructional practice. This changed in the 1980s as several statesimplemented performance assessments for use with beginning teachers. Many ofthese assessments were based on process-product research on teaching and focusedon a uniform set of teaching behaviors regardless of the content area or grade leveltaught.
Over the past 10 years, many states have adopted standards from the InterstateNew Teacher Assessment and Support Consortium and the National Council forAccreditation of Teacher Education for use in making decisions about licensure andaccreditation. These standards reflect conceptions of teaching that differ signifi-cantly from those previously embedded in state policies. In particular, these con-ceptions emphasize the context-specific nature of teaching and the need for teachersto integrate knowledge of subject matter, students, and context in making instructionaldecisions, engaging students in active learning, and reflecting on practice (Youngs,Odden, & Porter, in press).
To organize this review, we first describe our review methods, which include ourcriteria for including studies in the review, the interpretation of individual studies,and our approach to synthesizing the results obtained from the various studies. Thenext section then uses these methods to review the research on whether teacherswith certain characteristics have a greater impact on their students’ standardized testscores than teachers without these characteristics. It discusses findings and impli-cations for four categories of teacher characteristics: ratings of teachers’ colleges,teachers’ test scores, teachers’ degrees and coursework, and teachers’ certificationstatus. The concluding section discusses general implications for policymakers andresearchers.
Methods
Our objective in this review was to create a clear interpretation of the research forpolicymakers and researchers interested in the relationship between teacher charac-
Wayne and Youngs
90
at TEXAS SOUTHERN UNIVERSITY on October 18, 2014http://rer.aera.netDownloaded from
teristics and student achievement gains. That objective informed our methods in sev-eral ways. This section discusses the following features of our methods: the scope ofthe review, the interpretation of individual studies, and the synthesis of results.
Scope of the Review
Studies meeting the criteria for inclusion numbered only 21 at the time of thisreview. Our search began with an examination of electronic databases and existingreviews. We used the following meta-analyses and reviews: Darling-Hammond(1999a); Greenwald, Hedges, and Laine (1996); Hanushek (1997); and Wilson,Floden, and Ferrini-Mundy (2001). In addition, three electronic databases weresearched for the years 1975–2002: (a) the ERIC database, which indexes journals andtechnical resources from Resources in Education and Current Index to Journals inEducation; (b) PsychLit, which houses the American Psychological Association’sPsychological Abstracts; and (c) EconLit, which corresponds to the American Eco-nomic Association’s Journal of Economic Literature and the Index of Economic Arti-cles. These databases were searched using the following terms: (a) teach* assess*,(b) teach* certificat*, (c) teach* characteristics, (d) teach* licens*, (e) teach* qual*,and (f) teach* test*.
Although we included most material that appears in print, which includes somebooks and other materials that were not peer reviewed, for practical reasons weexcluded conference papers and dissertations.4 Having identified the universe ofstudies typically treated in reviews of student achievement studies, we then applieda set of study design criteria. The remainder of this section describes those fourcriteria.
First, it should already be clear that this review focuses on studies that observeteachers’ characteristics as well as the standardized test scores of these teachers’ stu-dents. It is also important to consider the relationships between teacher characteris-tics and other student outcomes such as graduation rates, attendance at postsecondaryinstitutions, and the acquisition of knowledge and skills not easily measured by stan-dardized tests. In the 1990s, for example, Kentucky, Maryland, Vermont, and otherstates developed innovative assessment systems that measured student achievementin relation to performance standards and featured assessment methods other thanmultiple-choice questions. At the time of this review, however, there were no studiesthat both (a) included such student outcomes and (b) met the remaining criteria forinclusion in the review.
Second, the review limits its scope to the achievement of students in the UnitedStates, since the review aims to inform researchers and policymakers in the UnitedStates. We are aware of only one study excluded by this criterion (Hanushek, Gomes-Neto, & Harbison, 1996).
The two remaining criteria are intended to keep the focus on findings that are com-pelling as opposed to being merely suggestive. These two criteria are (a) that thestudy design accounts for prior achievement, which excludes numerous studies, and(b) that the design accounts for students’ socioeconomic status. The latter criterionexcludes only a few of the remaining studies.5
Accounting for both prior achievement and socioeconomic status makes a study’sfindings more compelling because the question “Do students learn more from teach-ers with this characteristic?” pertains to a causal relationship. There are many studiesthat examine end-of-year student test scores and teacher qualifications. But in order
Teacher Characteristics and Student Achievement Gains
91
at TEXAS SOUTHERN UNIVERSITY on October 18, 2014http://rer.aera.netDownloaded from
to attribute any observed student achievement differences to teacher characteristics,one must rule out alternative explanations. Randomized assignment to treatment andcontrol groups can rule out alternative explanations, but such designs have rarelybeen used in research on teacher characteristics. The designs that have been used andhave proven sufficiently convincing are nonrandomized (quasi-)experimental designs.To reject alternative explanations absent randomization, these designs employ a the-ory of the determinants of student achievement. Refinement efforts persist (see, e.g.,Grissmer & Flanagan, 2000; Ludwig & Bassi, 1999; Rowan, 2002; Turner, 2000),but researchers generally agree that (a) prior achievement test scores and (b) studentbackground characteristics are required in order to minimally reduce the potential foralternative explanations of student achievement differences (see generally Ehrenberget al., 2001; Ferguson, 1996; Rowan, 2002). Such student achievement models arecalled “value-added” because they assume that teachers add to students’ progressduring the period between pretest and posttest.
Although this approach to establishing the existence of a causal relationshipclearly calls for longitudinal data, a few studies successfully exploit cross-sectionaldata by subtracting the achievement of a group of students from one grade level fromthat of a group of students in the same school at the same time but at a higher gradelevel. These studies are regarded as convincing here and are therefore included,although studies that use longitudinal data clearly face fewer threats to validity.
In summary, the four criteria for inclusion in this review are as follows:
1. The data collected address teachers’ characteristics as well as the standardizedtest scores of the teachers’ students.
2. The data were collected in the United States.3. The design accounts for prior achievement.4. The design accounts for students’ socioeconomic status.
Interpretation of Individual Studies
Another aspect of our review methods that helps us create a clear understandingof the findings from this body of research involves our interpretation of findings fromindividual studies. This section identifies several technical considerations associatedwith the interpretation of individual studies and explains how these considerationsaffected our translation of study results.
As noted above, the studies included in this review all use a theory of the deter-minants of student achievement. That theory takes the form of a student achievementequation. The data collection feeds that equation: Data must include student back-ground characteristics and pretest scores, in addition to posttest scores and teacherquality information. Usually, the data include additional school- or program-levelfactors that could plausibly affect student achievement (e.g., class size).
The student achievement equation always proves at least partly correct. That is,its variables jointly explain some proportion of the variation in student achievement.Statistical methods then enable us to isolate the contributions of individual variables,using the student achievement model to rule out the observable influences known tobe at work.
The statistical test to determine whether a particular teacher qualification con-tributes to student achievement poses the research question in the negative (the nullhypothesis): Could the observed student achievement patterns have occurred even if
Wayne and Youngs
92
at TEXAS SOUTHERN UNIVERSITY on October 18, 2014http://rer.aera.netDownloaded from
the teacher qualification being studied had not influenced student achievement? A“no” answer (rejecting the null hypothesis) translates as a positive relationship. Itmeans that students learned more from teachers with that particular qualification,after controlling for the other variables.
But it is important to realize that a “yes” answer (failing to reject the null hy-pothesis) does not rule out a relationship. Perhaps the study’s sample size was toosmall—or the measurement error too great—to provide statistical confirmation. Theseproblems prevent rejection of the possibility that differences occurred randomly, evenwhen the qualification being studied does influence student achievement.
Another reason statistical methods might not detect an existing relationship is thatthe teacher quality variable might strongly correlate with the model’s variables forstudent characteristics, which also influence student achievement (see, e.g., Dewey,Husted, & Kenny, 2000). This phenomenon, termed multicollinearity, makes it moredifficult for statistical methods to discern relationships.
For these reasons, when translating results from individual studies, we assumethat studies may establish that an observed teacher quality indicator matters but can-not convincingly show that an observed teacher quality indicator does not matter.One could show that an indicator was unimportant by using large samples, keepingmeasurement error low, and establishing that multicollinearity was not a problem.But no such examples appear in the literature.
When statistical methods seem to establish that a particular quality indicator influ-ences student achievement, readers still must draw conclusions cautiously. Theorygenerates alternative explanations that statistical methods must reject, so a positivefinding is only as strong as the theory undergirding the analysis. If the theory isincomplete—or data on the plausible determinants of student achievement areincomplete—the untheorized or unavailable determinants of student achievementcould potentially correlate with the teacher quality variable (i.e., correlation betweenthe error term and the teacher quality variable). Thus, student achievement differ-ences that appear connected to teacher qualifications might in truth originate in omit-ted variables. Bias due to omitted variables can influence effect size estimates bothpositively and negatively (see Ludwig & Bassi, 1999), so reported estimates of effectsize are usually regarded as biased.
Of particular importance for the interpretation of positive findings are omittedteacher quality variables. Suppose a data set contains only one teacher quality vari-able: whether the teacher has a master’s degree. Statistical methods may show thatthe master’s degree matters, but another plausible explanation for that finding exists.It is likely that teachers with a master’s degree have more teaching experience. Thus,what appears attributable to a master’s degree may instead be attributable to experi-ence. Studies that assess multiple teacher characteristics simultaneously are there-fore more readily interpreted.
A related concern is lagged effects. Value-added models usually assume that astudent’s prior test score captures the effects of all previous educational experiences.However, it is likely that the effects of educational experiences may not manifestthemselves immediately. To the extent that the sources of lagged effects are in anyway connected to the likelihood that students will have certain teachers, estimatesof the effect of having teachers with particular characteristics may be biased.
One last concern in interpreting positive findings is termed aggregation bias. Inhis earlier review of student achievement studies, Hanushek (1997) showed that
Teacher Characteristics and Student Achievement Gains
93
at TEXAS SOUTHERN UNIVERSITY on October 18, 2014http://rer.aera.netDownloaded from
studies that aggregate data into larger units of analysis (e.g., school- or district-levelaverages rather than individual student data) are more likely to show positive effects.Thus, positive findings that emerge from studies that use higher levels of aggrega-tion may result from aggregation bias. This review gives less weight to studies withhigher levels of aggregation and excludes studies that aggregate to the state level.The only study excluded by this criterion had no determinate results regarding theinfluence of teacher characteristics.6
In summary, while quasi-experimental studies of student achievement deserveattention, interpretations must be guarded. First, researchers have not used thesemethods to prove that any particular teacher characteristic does not matter. Accord-ingly, we treat indeterminate findings as just that—indeterminate. Second, whenstudies do find relationships, we weight studies according to design features used toguard against spurious findings. Finally, it is clear that reported effect sizes areunlikely to be unbiased, and we cannot predict whether actual effects are larger orsmaller. Accordingly, this review does not attempt to discuss observed effect sizes.
Synthesis of Results
Faced with hundreds of student achievement studies, researchers have employedtwo basic approaches to the synthesis of results. One approach draws conclusions bytallying the studies’ results; thus, for each school input of interest (e.g., class size), thereviewer computes the numbers of positive, negative, and insignificant results thathave appeared in the literature. The second approach to synthesis is formal meta-analysis, which attempts to pool the statistical power of many small studies that focuson the same school input.
Arguably, however, neither of these two approaches fits the present task,which involves a relatively small number of studies. The strength of the standardapproaches is that they enable researchers to quickly summarize results fromlarge numbers of studies (hundreds) and for multiple types of school inputs (notonly teacher characteristics).
The approach used here avoids two pitfalls shared by the standard approaches.First, synthesis requires some judgments about the strengths and weaknesses of indi-vidual studies. The subsection above explained that determinate findings are some-times not reliable; the more trustworthy findings are those arising from studies thatanalyze individual students and their teachers and include a thorough set of controlsfor other potential determinants of student achievement. Thus, some studies deservemore weight than others and may even refute the findings of others.
An additional limitation of the standard approaches is that they necessarily abstractdetails that are important to users of the findings. For example, reviews commonlylump together all studies that involve a teacher test score. But policymakers face deci-sions about what to test (e.g., basic academic skills, subject matter knowledge) andwho should be tested (e.g., only secondary teachers or all teachers).
For these reasons, the present review employs an alternative approach to synthe-sis. It begins by considering groups of studies that focus on a particular teacher char-acteristic. It then explicitly describes each study, focusing on the features that affectthe inferences that can be drawn. Finally, with due consideration of those quality fea-tures, it renders a joint interpretation.
For those accustomed to the standard approaches, this method may seem less sci-entific. But it is arguably better suited to the treatment of smaller numbers of studies
Wayne and Youngs
94
at TEXAS SOUTHERN UNIVERSITY on October 18, 2014http://rer.aera.netDownloaded from
and for clearly communicating results to policymakers and the research community.Moreover, it maintains a solidly scientific character. The following three features ofscientific inquiry identified by King, Keohane, and Verba (1994, pp. 8–9) are all pre-sent: The approach makes clear what the evidence is; it explicitly treats uncertainty;and it can be replicated by other researchers.
A final note is necessary here to discuss a commonly recognized source of biasto which both the present approach and the standard approaches are susceptible. Thetypical standard in social science research is that a relationship is considered deter-minate only if there is less than a 1-in-20 chance that it occurred randomly. Thus,if there are 20 studies, and all are indeterminate except for one, a reviewer cannotclaim to have found a relationship. Moreover, because large and statistically sig-nificant effects are considered most interesting by publication outlets, it is likely thatthe universe of published studies is not representative of all analyses that have beenundertaken. Determinate findings with large effect sizes are more likely to reach theliterature than indeterminate findings. Termed “publication bias,” this phenomenonaffects both effect size estimates and judgments about whether results are statisti-cally significant. This review does not address effect size, but its conclusions aboutthe relationships that exist are subject to publication bias.
Findings
This section presents the findings from our review. For each teacher characteristicfor which evidence exists, we (a) describe all relevant studies and findings, (b) ren-der joint interpretations, and (c) consider implications for policy and future research.
The subsections to follow correspond to five categories of teacher characteris-tics: teachers’ college ratings, test scores, course taking and degrees, certificationstatus, and all other characteristics. Conclusive evidence is available only for thefirst four. The fifth category acknowledges other characteristics for which existingevidence is not conclusive.
In describing relevant studies and findings, we present results at a level of detailintended to balance content with readability. Relatively more detail is provided forthe studies that yielded determinate findings. For easy access to key technical infor-mation for each study, the Appendix provides a table with the following informa-tion for all 21 studies: (a) a description of the student achievement data and sample;(b) exact specifications of teacher quality variables; (c) a list of controls, includingsocioeconomic status; and (d) a list of other important study features.
Ratings of Teachers’ Undergraduate Institutions
Relevant Studies and FindingsOnly three research efforts have sought to determine whether students learn more
from teachers who graduated from better-rated undergraduate institutions. The first,Summers and Wolfe (1975a, 1977), was a set of studies undertaken in Philadelphiaduring the 1970–1971 school year, using samples of students in the 6th, 8th, and12th grades during that year. School records included scores for the 1970–1971 yearand some earlier years, so the authors were able to observe each student’s gains overtime. The three analyses examined gains from 3rd to 6th grade, 6th to 8th grade, and9th to 12th grade.
Whereas most studies to date had treated school inputs as school-level averages,Summers and Wolfe used data specific to each student. School records contained
Teacher Characteristics and Student Achievement Gains
95
at TEXAS SOUTHERN UNIVERSITY on October 18, 2014http://rer.aera.netDownloaded from
information on students’ current and previous teachers, including teachers’ scoreson the National Teacher’s Examination, teachers’ years of experience, and theGourman rating of each teacher’s undergraduate institution. According to Summersand Wolfe, the Gourman report utilized information from the institution’s and othersources on each institution’s facilities, departments, administration, faculty, servicesfor students, alumni support, and other general areas.
The analyses of 6th graders used 627 students’ Iowa Test of Basic Skills (ITBS)composite scores. The authors found that Gourman ratings associated with 6th-gradeteachers were important. The authors also tried aggregating the Gourman ratings andall other school inputs into school-level averages and found no relationships—a some-what counterintuitive result given the typical direction of aggregation bias.
The analyses of 8th-grade students also examined composite ITBS score gainsand used information on students’ English, math, and social studies teachers. Usinga sample of 553 students, the authors found that the only determinate relationshipbetween student achievement and Gourman ratings was a positive relationship asso-ciated with 8th-grade social studies teachers.
The analysis of 12th-grade students used 716 students’ scores from the Califor-nia Aptitude Test and the Comprehensive Test of Basic Skills. Focusing on readingscore gains, the authors used teacher quality data on the students’ English teachersonly. Unlike the results for the 6th and 8th grades, no determinate relationships werefound among the 12th-grade students.
Murnane and Phillips (1981) conducted the second of the three studies involv-ing college ratings. A welfare reform experiment in Gary, Indiana, in the early 1970sprovided achievement data on several hundred Black elementary school students,mostly from low-income families. When the authors linked the students to theirindividual teachers and controlled for several other teacher characteristics, theycould not discern any relationship between students’ ITBS vocabulary score gainsand teachers’ college ratings. The study provided no information about the collegerating system used.
The only other study of whether students learn more from teachers from better-rated undergraduate institutions was conducted by Ehrenberg and Brewer (1994).The authors used the High School and Beyond (HS&B) data set, which tested a sam-ple of 10th graders in 1980 and then retested them as 12th graders in 1982. The mea-sure of student achievement was a composite score combining mathematics,reading, and vocabulary skills.
The original HS&B data collection did not contain teacher data, but a follow-upsurvey of 25 teachers at each of about 320 public schools allowed Ehrenberg andBrewer to examine whether individual students learned more when their schools’average teacher quality was higher. Teacher quality variables included the percent-ages of teachers with master’s degrees and with 10 or more years of experience. Foreach school, the authors also calculated the average rating of teachers’ undergrad-uate institutions using Barron’s six-category selectivity rating system. This ratingsystem reportedly examines the entering class’s entrance examination scores andhigh school records, in addition to the percentage of applicants admitted.
The authors performed their analyses separately on students in different race/ethnicity categories. They found that with White students and Black students,teachers from better-rated undergraduate institutions were more effective. Findingswere indeterminate for Hispanic students.
Wayne and Youngs
96
at TEXAS SOUTHERN UNIVERSITY on October 18, 2014http://rer.aera.netDownloaded from
Joint InterpretationAlthough implications may differ by rating system, as discussed below, the proper
joint interpretation of the three studies is that some relationship exists between col-lege ratings and student achievement gains, as noted earlier. Researchers were notalways able to discern a relationship, but those relationships that were found werepositive. Furthermore, the two studies showing positive relationships had differentstrengths. As is detailed in the Appendix, the controls used by Ehrenberg and Brewerfor students’ socioeconomic status were student-level controls and were extensive(parents’ education, family income, family structure, and family size). Ehrenberg andBrewer also adjusted their analysis to correct for students’ dropout behaviors andattempted to address bias due to omitted variables using a technique called instru-mental variables.
By contrast, the strengths of Summers and Wolfe’s study were that all analysiswas done at the student level and that the authors controlled for a large number ofschooling factors, including student attendance, peer group measures, school struc-ture and disciplinary atmosphere, and other inputs. Also, in their analyses of gainsfrom 6th to 8th grade and 9th to 12th grade, Summers and Wolfe controlled for athird test score, from an even earlier school year, to provide additional assurance.
ImplicationsAlthough the findings encourage researchers to further examine characteristics
associated with teachers’ undergraduate institutions, the implications for policy-makers differ depending on which rating system is involved. In the case of Barron’sselectivity ratings, the finding suggests that policymakers should encourage betterscreening of prospective teachers. The traditional screening tool for state policy-makers has been licensure tests, not college selectivity ratings. The next section dis-cusses licensure tests more fully.
In the case of the Gourman report ratings, the ratings apparently intended to cap-ture institutional quality, broadly defined. Insofar as institutional quality may be atplay, policymakers may wish to require that teachers hold degrees from institutionswith particular quality characteristics. Third-party accreditation is the typical pol-icy instrument by which institutional quality is assured. Researchers seeking toinform policy might therefore examine the relative effectiveness of teachers frominstitutions with different accreditation statuses.
Test Scores7
Relevant Studies and FindingsSeven sophisticated studies of student achievement have assessed the importance
of teachers’ scores on tests of verbal skills and other tests. For organizational pur-poses, this subsection describes them in three groups: (a) studies involving teacherlicensure examination scores, (b) subsequent student achievement studies involv-ing tests of teachers’ verbal skills, and (c) more recent studies involving other testscore measures.
Teacher licensure examination scores. Two student achievement studies haveexamined whether students learn more from teachers who performed better onteacher licensure examinations. The two studies employed scores from the National
Teacher Characteristics and Student Achievement Gains
97
at TEXAS SOUTHERN UNIVERSITY on October 18, 2014http://rer.aera.netDownloaded from
Teachers Examination (NTE) and from the Texas Examination of Current Admin-istrators and Teachers (TECAT).
The use of teacher tests in making licensure decisions was rare until the 1980s.During that decade, the number of states employing tests of verbal skills, contentknowledge, and/or professional knowledge for licensure dramatically increased, tomore than 40. As of 2002, 41 states used tests in one or more of these areas to makedecisions about admission to teacher education programs or initial licensure.
The NTE was developed by the Educational Testing Service (ETS) in the 1940s,and by the 1970s it was being used by some states in making licensure decisions(see Haney, Madaus, & Kreitzer, 1987). As teacher testing increased in the 1980s,it became the most widely used licensing examination. Specialized teachers tookthe NTE Area Examination, covering both content and teaching methods specificto one of about 30 specialties. Other teachers took the NTE Common Examinations,which included the following four component tests: (a) general principles of peda-gogy and psychological and social foundations of education; (b) written Englishexpression; (c) social studies, literature, and fine arts; and (d) science and mathe-matics. The NTE remained the most prevalent licensing exam until ETS replaced itwith Praxis in the 1990s.8
The one qualifying student achievement study that involved teachers’ NTEscores was conducted by Summers and Wolfe (1975a, 1977) using students inPhiladelphia schools in 1971, as described above.9 Among the 627 sixth graders intheir elementary school sample, students learned less when their teachers scoredhigher on the NTE Common Examinations. The junior high and senior high schoolsamples employed teachers’ NTE Area Examination scores and yielded indetermi-nate results.10
The only other study to employ scores from an actual licensure examination usedthe TECAT, a test that evaluated reading and writing skills, integrating contentrelated to professional knowledge. Ferguson (1991, 1998) took advantage of TECATscores available for Texas teachers tested in statewide teacher testing in 1986 (seeKain & Singleton, 1996). He focused his analysis on reading scores, which measuredteachers’ reading skills and professional knowledge.11
Ferguson computed mean teacher TECAT scores for each Texas school districtfrom which data could be obtained.12 Data on students were also aggregated to thedistrict level. Students’ reading and math scores came from the 1986 Texas Edu-cational Assessment of Minimum Skills (TEAMS) exams, which were multiple-choice tests administered to students in the 1st, 3rd, 5th, 7th, 9th, and 11th grades.
Analyzing data from almost 900 school districts, Ferguson computed the differ-ence for each district between the mean achievement scores of 1st, 3rd, 5th, and7th graders in 1986 and the mean scores of 5th, 7th, 9th, and 11th graders in 1990—the same cohorts of students assuming that student migration is negligible. He foundthat districts where teachers had higher TECAT scores were more likely to havehigher gains in student test scores in reading, especially between 3rd and 7th grades.Ferguson later reinforced these findings (see Ferguson, 1998) by showing that thegains of each district’s elementary students differed from the gains of its secondarystudents, depending on the TECAT score differences between the district’s elemen-tary teachers and its secondary teachers.
Verbal skills. Three subsequent student achievement studies employed tests ofteachers’ verbal skills and used relatively old data. One reanalyzed the data from the
Wayne and Youngs
98
at TEXAS SOUTHERN UNIVERSITY on October 18, 2014http://rer.aera.netDownloaded from
Equality of Educational Opportunity study (Coleman et al., 1966), a very large cross-sectional study conducted in the mid-1960s. In their reanalysis, Ehrenberg andBrewer (1995) constructed synthetic gain scores by subtracting schools’ lower-grade-level achievement averages from their higher-grade-level achievement averages.Specifically, the authors subtracted the average achievement scores of 3rd-grade stu-dents in 969 elementary schools from those of 6th-grade students in the same schoolsand subtracted the average achievement scores of 9th-grade students in 256 sec-ondary schools from those of 12th-grade students in the same schools.
After teachers’ experience and graduate education had been controlled, teachers’scores on a short verbal facility test explained some school-to-school variation in thegain scores. Furthermore, the authors’ attempt to use the technique of instrumentalvariables to address bias due to omitted variables did not change the findings.
The remaining two studies involving teachers’ verbal skills both analyzed datafrom the Gary Income Maintenance Experiment, a welfare reform experiment con-ducted in Gary, Indiana, in the early 1970s that, as mentioned earlier, providedachievement data on several hundred Black elementary school students. The data setincluded a variety of data on students’ teachers, including scores on a test labeled“Quick Word Test.”
In their analysis, Murnane and Phillips (1981) focused on students’ ITBS vocab-ulary scores. Controlling for several other teacher characteristics, including race, sex,experience, possession of a master’s degree, and the rating of the teachers’ under-graduate institution, they found no relationship between the teachers’ word test scoresand student achievement gains. However, when they disaggregated the students bygrade level, they found that the 6th-grade students learned less when their teachershad higher scores on the word test. They rejected this finding as spurious “because alarge number of teachers used aids in completing the test” (pp. 97–98).
Hanushek (1992) examined the same data, but his dependent variables werechanges in achievement on both the ITBS reading and the ITBS vocabulary tests.He examined changes among 2nd- through 6th-grade students across a single gradelevel (e.g., achievement growth from the end of 2nd through the end of 3rd grade).Hanushek reported that teachers’ performance on the word tests affected their stu-dents’ reading score gains but not their vocabulary score gains. Unlike Murnaneand Phillips, Hanushek did not control for ratings of the teachers’ undergraduateinstitutions.
Recent studies. Two additional studies appeared recently. The first study took advan-tage of teachers’ responses to a single multiple-choice mathematics test item. Rowan,Chiang, and Miller (1997) analyzed nationally representative achievement datafrom the National Educational Longitudinal Study of 1988 (NELS:88). Individualstudents were tested in mathematics in the spring of Grades 8 and 10, and the surveygiven to their 10th-grade teachers included a single, high school–level mathematicstest item. The researchers found that students whose teachers answered the item cor-rectly posted larger mathematics gains between 8th and 10th grades, even after con-trolling for whether teachers held mathematics-related degrees.13 This study carriesmuch less weight, however, than it would have if teachers had completed more testitems or an entire mathematics test.
A second recent study capitalized on Alabama personnel records, some of whichcontained teachers’ ACT college entrance examination test scores. Ferguson and
Teacher Characteristics and Student Achievement Gains
99
at TEXAS SOUTHERN UNIVERSITY on October 18, 2014http://rer.aera.netDownloaded from
Ladd (1996) used composite ACT scores. These scores combined English, mathe-matics, social studies reading, and natural sciences reading components (AmericanCollege Testing, 1989). Their initial analysis showed that student reading score gainsfrom 3rd grade to 4th grade were positively related to the average teacher ACT scoreat the students’ schools. The relationship was unclear for mathematics score gains.
Ferguson and Ladd also analyzed district-level averages from 127 Alabamaschool districts. The authors created artificial gain scores using achievement datafrom 3rd and 4th graders, and 8th and 9th graders, for the 1990–1991 school year.The average differences in each district between the mathematics scores of youngerstudents and older students were positively related to the average teacher ACT scorein the district. Both the school-level analysis and the district-level analysis con-trolled for teacher experience and whether teachers had master’s degrees.
Joint InterpretationExamined jointly, the seven studies involving teacher test scores yielded some-
what divergent findings: Determinate findings included five positives and two neg-atives. Several explanations for this divergence were considered.
That these seven determinate findings could have occurred randomly—and thatthere is in fact no relationship between student achievement and teacher test scores—is very unlikely. And although one might instead attempt to conclude that the twonegative findings were random occurrences, that explanation also seems implausi-ble given that the negative findings come from strong studies: Both used individualstudent-level data, and Summers and Wolfe in particular controlled for an extensiveset of schooling factors.
Another potential method of reconciling the studies, which did not point to clearconclusions, involves the content of the student and teacher tests featured in thesestudies. For example, with regard to the student tests, Hanushek (1992) found thatteachers’ performance on word tests affected their students’ ITBS reading scoregains but not their ITBS vocabulary score gains. This is consistent with Murnaneand Phillips (1981), who reported no relationship between teachers’ word test scoresand student achievement gains. Future work may discover that the relationshipbetween student gains and teacher assessment scores depends upon alignment of theunderlying instruments, but the set of studies that exists today is insufficient to makesuch claims.
In the end, the most plausible explanation for the divergent findings emergedthrough examination of the controls used in each of the seven studies. Specifically,the two studies that generated negative findings both controlled for college ratings.In contrast, none of the studies yielding positive findings for teachers’ test scores con-trolled for college ratings. The negative findings reflect the effect of test scores aftercontrolling for the effects of college ratings, which are likely to capture a dimensionof teacher quality similar to that captured by test scores. Thus, the negative findingsmay support the five positive findings—that students learn more from teachers withhigher test scores. Test scores matter, if college ratings have not already been takeninto account.
ImplicationsAlthough the finding that students learn more from teachers with higher test scores
certainly militates in favor of rigorous licensure examinations for teachers, it is
Wayne and Youngs
100
at TEXAS SOUTHERN UNIVERSITY on October 18, 2014http://rer.aera.netDownloaded from
important to remember that policymakers face a range of different types of licensuretests. As of 1999–2000, 34 states required teaching candidates to pass tests of basicliteracy and numeracy skills. In addition, 30 states required candidates to pass testsof subject matter knowledge, and 25 states required them to pass tests of pedagogi-cal knowledge (Youngs, Odden, & Porter, 2001). The synthesis of existing studiesdoes not permit us to conclude which types of knowledge ought to be tested.
To provide further guidance to policymakers, there is also a need for research onthe relationship between student achievement and teachers’ performance on testscurrently in use (as opposed to the teacher tests featured in the studies in this review,none of which remain in use). Today, many states have implemented ETS’s Praxis Ibasic skills tests, Praxis II tests of subject matter knowledge, and/or Praxis II testsof pedagogical knowledge (all developed by ETS in the 1990s). Other states havecreated their own tests or contracted with companies other than ETS to developsuch tests.
Finally, researchers should also take note of the recent implementation of newapproaches to teacher performance assessment in Connecticut, North Carolina,Ohio, and other states. These assessments were designed to improve on existingpencil and paper tests. Student achievement studies that use such assessments wouldbe informative to those considering these options (see, e.g., Pecheone, Rogers, &Moirs, 2001).
These various recommendations resonate with those offered in the final reportof a panel recently convened by the National Research Council to examine theissues of teacher licensure examinations and teacher quality. The panel’s 2001report called for “a multi-discipline, multiple methods research program” that would“examine licensure testing, beginning teacher performance, and student learning”(National Research Council Committee on Assessment and Teacher Quality, 2001,p. 29). Hopefully, this review can inform the initiation of such a research program.
Degrees and Coursework
Relevant Studies and FindingsUntil recently, lack of data prevented researchers from determining whether stu-
dents learned more from teachers with particular degrees or coursework. The avail-able data sets contained information on teachers’ degree level (e.g., bachelor’s,master’s, etc.), and results were mixed. Most studies were indeterminate (Harnisch,1987; Hanushek, 1992; Link & Ratledge, 1979; Murnane, 1975; Murnane & Phillips,1981; Rivkin, Hanushek, & Kain, 2001; Summers & Wolfe, 1975a, 1977), and thefour determinate findings were both positive (Ferguson & Ladd, 1996) and negative(Eberts & Stone, 1984; Ehrenberg & Brewer, 1994; Kiesling, 1984). Close exami-nation of the four determinate studies does not permit reconciliation of their findings.Although three suggest a negative influence on student learning, the positive resultsreported by Ferguson and Ladd (1996) are convincing. Moreover, as is clear fromthe information presented in the Appendix, neither differences in controls nor dif-ferences in the specification of degree level could explain the divergence. As a result,no conclusions were possible.
The recent improvement in data collection on degrees and coursework led toresults that make apparent that the earlier, mixed results for degree level were at leastpartly attributable to the failure of those studies to identify whether the additionaldegree was related to the subject being taught. This finding has been documented
Teacher Characteristics and Student Achievement Gains
101
at TEXAS SOUTHERN UNIVERSITY on October 18, 2014http://rer.aera.netDownloaded from
most clearly by researchers using NELS:88, which was briefly discussed in the pre-ceding section on teachers’ test scores. NELS:88 is a nationally representative sur-vey of about 24,000 Grade 8 students conducted in the spring of 1988. A subset ofthese students was surveyed again in the spring of 10th (1990) and 12th (1992)grades. At the time of each survey, students took one or more subject-based tests inmathematics, science, English/writing, and history. Therefore, the NELS:88 follow-up data sets permit longitudinal analyses of growth in student achievement from 8thto 10th grade, 10th to 12th grade, and 8th to 12th grade in particular subjects. TheNELS:88 data also include information on relevant student, teacher, and schoolcharacteristics.
Three analyses take advantage of the detailed teacher data in NELS:88 on degrees.The analysis by Goldhaber and Brewer (1997a) illustrates the key finding mostclearly. No differences were evident when the authors examined whether 10th-grademathematics students scored better when their teachers had master’s degrees. How-ever, introducing information about the subject of the teachers’ degrees producedsignificant results. Mathematics students whose teachers had master’s degrees inmathematics had higher achievement gains than those whose teachers had either noadvanced degrees or advanced degrees in nonmathematics subjects. In addition, stu-dents whose teachers had bachelor’s degrees in mathematics learned more thanstudents whose teachers had bachelor’s degrees in nonmathematics subjects. Thecontributions of these two indicators of subject preparation were independent of sev-eral other teacher characteristics; the student achievement model controlled for cer-tification, mathematics certification, and years of high school teaching experience.
The two other analyses of the NELS:88 data replicated this finding, again formathematics, but with slight variations. Goldhaber and Brewer (2000) used the12th- rather than 10th-grade students and again found that students learned morefrom teachers with mathematics majors and from teachers with master’s degrees inmathematics. Rowan, Chiang, and Miller (1997) used a single variable to indicatewhether the teacher had an undergraduate or graduate degree in mathematics. Inaddition, as described earlier, they added a crude control for teachers’ test scores inmathematics knowledge.
If having a degree in mathematics makes a teacher more effective, one mightexpect that measures of coursework in mathematics would also predict effective-ness. Two studies used such measures. Eberts and Stone (1984) recorded the num-ber of college-level, mathematics-related courses taken by teachers in the previous3 years. No relationship to 4th graders’ mathematics achievement was apparent.
The second study employing measures of teachers’ mathematics course taking didconclude that some relationships existed. Monk and King (1994) used achievementdata from the Longitudinal Survey of American Youth (LSAY), a study that followeda national probability sample of 2,831 public school 10th graders from fall 1987 intotheir senior year. Students took math and science tests each fall from 1987 to 1989that were based on the National Assessment of Educational Progress (NAEP).
The LSAY identified the science and mathematics teachers of each student, anda survey captured teachers’ experience and course taking. To develop the coursetaking measure, the authors pooled all undergraduate and graduate courses intothree categories: mathematics, life science, and physical science.
Although the study by Monk and King yielded many indeterminate findings,they noted a handful of positive relationships between mathematics gains and course
Wayne and Youngs
102
at TEXAS SOUTHERN UNIVERSITY on October 18, 2014http://rer.aera.netDownloaded from
taking in mathematics. First, controlling for teacher experience, the 10th-grade stu-dents who performed well in the fall test posted higher 1-year gains when theirmathematics teachers had more mathematics courses. Second, observing the gainbetween 1987 and 1989, the authors found that students learned more mathematicswhen their 10th-grade and 11th-grade mathematics teachers had taken more math-ematics courses.
The results of another study based on data from the LSAY (Monk, 1994) areoften cited in discussions of student achievement and teacher characteristics. How-ever, these results were excluded from this review owing to the absence of controlsfor students’ socioeconomic status.14
In mathematics, then, degrees and coursework appear related to teacher effec-tiveness, but what about other subjects? In other subjects, student achievement resultshave been indeterminate or inconsistent. Goldhaber and Brewer (1997a) performedadditional analyses for science, English, and history. The authors discerned positiveeffects on 10th graders’ achievement gains for science teachers’ bachelor’s degrees,but they did not report any other relationships. In their later analysis of 12th-gradestudents’ gains (Goldhaber & Brewer, 2000), the authors again found positive effectsin science, but this time the results were not statistically significant. Monk and King(1994) also examined science achievement gains and generated only one determi-nate result: The juniors in their sample learned less from teachers with more physi-cal science coursework.
Joint InterpretationTo join these various findings, it is reasonable to treat each subject separately. In
history and English, with no determinate findings, this review cannot draw any con-clusions about the importance of degrees and coursework. In science, we confrontonly two determinate findings, and they point in opposite directions. Science includesboth physical and life science, so one plausible explanation for the contradiction isthat measurement of degrees, course taking, and teaching within science is not yetsufficiently specific. Research with more fine-grained data collection strategies isnecessary when science achievement is studied.
In mathematics, all determinate findings were positive, so it is possible to assertthat students learn more from teachers with more mathematics-related courseworkand degrees. However, all of the positive determinate findings focus on high schoolstudents. The indeterminate finding by Eberts and Stone (1984) involved elemen-tary school students. Therefore, this review can conclude that high school studentslearn more mathematics when their mathematics teachers have additional degreesor coursework in mathematics. More evidence would be needed to make that asser-tion for elementary school students.
ImplicationsAlmost without exception, U.S. school districts’ teacher compensation systems
reward teachers for holding advanced degrees. The student achievement studiesreviewed above do not refute the possibility that such a policy is wise, but it is cer-tainly clear in the case of mathematics that alignment between degree content andsubject assignment is important.
Another relevant leverage point for policymakers is their power to specify course-work and degree requirements for different assignments. Many states have such
Teacher Characteristics and Student Achievement Gains
103
at TEXAS SOUTHERN UNIVERSITY on October 18, 2014http://rer.aera.netDownloaded from
requirements. The research reviewed here indicates that increased requirementsaccompanied by increased compensation would likely have payoffs in terms of stu-dent achievement, at least in the case of mathematics. Whether these payoffs occurwill ultimately depend on the costs to prospective teachers of completing theserequirements as well as the relationship’s effect size, which remains unclear forthe reasons given above in the Methods section.
Finally, it is interesting to note that these studies leave some uncertainty withrespect to whether students learn more from teachers with subject-related educationdegrees (e.g., mathematics education, as opposed to mathematics). None of theNELS:88 teacher surveys included such response categories. Those with subject-related education degrees probably selected “education,” but it is likely that at leastsome would have chosen the subject to which their degree was related. Monk andKing (1994) did not report how they handled the distinction.15 Eberts and Stone(1984) labeled their course counts as courses “related to teaching mathematics” andtherefore probably included both mathematics courses and mathematics educationcourses. In sum, studies have not been sufficiently aggressive about distinguishingthe two. For researchers, these findings leave a clear roadmap for future research.Studies that use subject-specific measures of teacher preparation and that distin-guish between subject preparation and preparation in the methods of teaching a sub-ject would provide valuable new information.
Certification Status
Relevant Studies and FindingsAs was true for teacher degrees, the effects of teacher certification appear only
when teachers have certification for the subject taught, and these findings have beenin mathematics. Only two studies meeting this review’s design standards—both byGoldhaber and Brewer (1997, 2000)—have examined certification; other studiesreported in the literature either are not longitudinal or do not control for students’socioeconomic status.16
In their first study, described in more detail above, Goldhaber and Brewer (1997a)tested two certification indicators. The first simply asked whether the teacher wascertified, without reference to any particular subject, and yielded only one determi-nate relationship: Students taking English classes appeared to learn less from Englishteachers who held certification.
The second model used by Goldhaber and Brewer (1997a) added informationabout the particular subject in which teachers claimed certification. The results forEnglish became indeterminate, suggesting that the earlier negative finding wascaused by English teachers holding certification outside of English. Results forhistory were also indeterminate. However, the authors reported that mathematicsstudents had higher achievement gains when their teachers held certification inmathematics as compared with holding no mathematics certification—which includesteachers who hold no certification at all and teachers who hold certification to teachin other areas. The same comparison applied to science achievement gains alsorevealed a positive relationship.
Notably, this study did not report how differences in certification type weretreated. For a given subject, most states offer a variety of types of certification, andthere is uncertainty among researchers and policymakers about the comparativeeffectiveness of teachers whose certification is of a nonstandard type (e.g., emer-
Wayne and Youngs
104
at TEXAS SOUTHERN UNIVERSITY on October 18, 2014http://rer.aera.netDownloaded from
gency, provisional, temporary). Proponents of “alternative certification” argue thatsome trimming down of the standards attracts persons with greater qualities by reduc-ing entry barriers.
In a second study that employed subject-specific teacher certification variables,Goldhaber and Brewer explicitly addressed differences in certification type. Asdescribed earlier, Goldhaber and Brewer (2000) focused on the gains made by theNELS:88 students between the 10th and 12th grades. The survey administered tothe teachers of 12th-grade students included an item that asked about certificationtype in mathematics and certification type in science. The authors therefore exam-ined certification type in connection with mathematics and science achievementgains only. The determinate finding from their analysis was that students’ mathe-matics gains were higher when their mathematics teachers held standard certifica-tion in mathematics, as compared with the gains of those whose teachers held either(a) no certification in mathematics (which includes teachers certified in other fieldsas well as teachers with no certification in any subject) or (b) private school certi-fication in mathematics.
This study also included further analysis of certification type, which spawnedadditional dialogue (see Darling-Hammond et al., 2001; Goldhaber & Brewer,2001). Goldhaber and Brewer (2000) compared the mathematics gains of studentswhose teachers held standard certification in mathematics with those who hadchecked a certification type labeled as follows: “temporary, provisional, or emer-gency certification (requires additional coursework before regular certification canbe obtained).” Controlling for the other variables in their model, the authors were notable to discern differences and interpreted this indeterminate finding as a sugges-tion that the teachers in this comparison were equally effective. However, the con-servative standard adopted by this review precludes drawing a firm conclusion onthe basis of an indeterminate finding.17
Finally, another study some analysts will characterize as relevant to the debateabout certification type was conducted by Raymond, Fletcher, and Luque (2001).This study used data from the Houston Independent School District to addresswhether students learn more from teachers who secured their jobs through Teachfor America (TFA). However, the comparison made in their study was not onebetween TFA teachers and teachers with standard certification for their subjects.Instead, the study compared the effectiveness of TFA teachers against all otherbeginning teachers, controlling for other factors. Those beginning teachers includedsome with standard certification in their subjects, some with nonstandard certifica-tion types, and some with no certification whatsoever. The study therefore informsthe decision by the Houston school district regarding whether or not to accept TFAteachers but does not allow generalizations about certification type.
Joint InterpretationThe study descriptions presented in the Appendix show that these two studies
have reasonably strong design features. Both are individual-level analyses, and bothuse a substantial set of socioeconomic status controls. Controls for other schoolinputs and other teacher variables were less extensive than in some other studies butnevertheless present. Because the first study left unclear how certification type wastreated and the second study was able to draw conclusions about standard certifica-tion only, we conclude that mathematics students learn more when their teachers
Teacher Characteristics and Student Achievement Gains
105
at TEXAS SOUTHERN UNIVERSITY on October 18, 2014http://rer.aera.netDownloaded from
have standard mathematics certification (as compared with private school mathe-matics certification or no mathematics certification).
ImplicationsThe findings for certification mirror those for degrees and coursework. In short,
subject-specific measures matter. The finding that math teachers with standard math-ematics certification outperform those with no mathematics-related certification indi-cates that states’ teaching standards in mathematics are, on average, meaningful.
In drawing policy inferences from this finding, one must not lose sight of the factthat each state has its own requirements that must be met in order to achieve standardcertification in mathematics (e.g., subject-related coursework, passage of licensuretests, etc.). The finding does not point us to the specific requirements that are impor-tant. Whether streamlining these requirements would result in changes in quality isnot answered by existing research.
To produce findings with greater clarity in regard to certification, researchersneed to design studies that take into consideration the particular requirements asso-ciated with particular certification types used in individual states. The Schools andStaffing Survey, a federally funded study that describes patterns of certification butdoes not measure student achievement, recently began to elicit somewhat moredetailed information about teacher preparation.18 For the purposes of studying stu-dent achievement and certification, one solution would be to focus on particularstates or small numbers of states that share common definitions and requirementsfor terms such as probationary certification, emergency certification, and so forth.
In addition, because the goal of reforms to certification systems would be toincrease the average quality of the teachers who supply themselves to the profes-sion, parallel research efforts are needed to examine differences in retention ratesamong teachers with different types of certification. These recommendations areconsistent with those offered by others who have produced related analyses.19
Other Characteristics
The characteristics addressed in the sections above on college ratings, test scores,degrees and coursework, and certification are those characteristics for which researchhas proven sufficiently conclusive to inform policymakers. In the case of many othercharacteristics, research either does not exist or has not resulted in clear findings. Thissection identifies those characteristics and discusses each briefly.
Perhaps the most conspicuous characteristic absent from this review is teacherexperience. Of the 21 qualifying student achievement studies, 19 used informationabout how many years teachers had been teaching, and most of the determinateresults were positive. However, for reasons first identified by Murnane and Phillips(1981, pp. 94–97), we decided that findings regarding experience were too difficultto interpret. First, experience necessarily captures the effect of whether teacherswere hired during a shortage or a surplus. Therefore, meaningful generalizationwould require controls for shortage and surplus conditions for each possible yearof hire.
Second, experience measures capture differences in teacher motivation result-ing from time constraints on parents during years when child rearing requires moreattention. Meaningful generalization would require knowing whether the teacherhad dependent children at the time.
Wayne and Youngs
106
at TEXAS SOUTHERN UNIVERSITY on October 18, 2014http://rer.aera.netDownloaded from
Finally, if there are differences in effectiveness between those who leave the pro-fession and those who stay, experience measures would capture those as well, andsuch differences are probably dynamic—changing with cultural trends as well aslabor market conditions. Thus, while the myriad effects captured by experience makeit a valuable control variable, the relationships that emerge between experience andstudent achievement are difficult to interpret.
Another teacher characteristic not discussed in this review was teacher race.Race was excluded from this review in order to maintain focus on clear findings.The findings on teacher race—and specifically on whether students learn more fromteachers of their own race or ethnicity—have been mixed (see Ferguson, 1998). Ifclear findings are ever achieved, drawing implications from those findings willrequire careful analysis.
This review also did not discuss the importance of holding degrees in education.Studies have not explicitly distinguished between degrees in subjects and degreesin the teaching of particular subjects, nor have they distinguished between degreesin the teaching of particular subjects and general degrees in teaching or education.Studies that make these distinctions would fill an important gap in the literature.
While student achievement studies have not yet assessed the importance of thecharacteristics identified in this section, theory and intuition suggest that they maybe important. Therefore, studies that find relationships with other teacher character-istics and use these characteristics as controls would be more conclusive than thosethat do not.
Conclusion
We approached the task of review in a way that would create a clear interpretationof the research for policymakers and researchers interested in the relationship betweenteacher characteristics and student achievement gains. Our methods were systematicand transparent. More specifically, (a) our scope focused us on compelling findings;(b) we considered each relevant study’s unique strengths and weaknesses; and (c) wereconciled findings and joined them together through deliberate reasoning.
The interpretations rendered by this review are easily summarized. The stud-ies confirm that students learn more from teachers with certain characteristics. Inthe case of teachers’ college ratings and test scores, positive relationships existand should be investigated further to learn about the relative importance of spe-cific college characteristics and tested skills and knowledge. In the case of degrees,coursework, and certification, findings have been inconclusive except in mathe-matics, where high school students clearly learn more from teachers with certifi-cation in mathematics, degrees related to mathematics, and coursework related tomathematics.
Although this added confirmation is meaningful in policy debates, there are manyimportant questions that remain unanswered. It is possible, for instance, that resultswould differ if outcomes such as graduation rates or future earnings were examined.In addition, for many potentially salient teacher characteristics—such as experience,race, and study of teaching methods—studies that use convincing research designssimply do not exist or have not been conclusive. Furthermore, it is also important toconsider unobservable changes in the composition of the teaching force over time.The makeup of the teaching force is certainly influenced by many factors and haschanged considerably during the past three decades.20
Teacher Characteristics and Student Achievement Gains
107
at TEXAS SOUTHERN UNIVERSITY on October 18, 2014http://rer.aera.netDownloaded from
Finally, for those characteristics found to be related to student achievement gains,existing studies do not offer convincing indications of effect sizes. What if thoseeffect sizes are extremely small? Much remains open to policymakers’ intuition.
Effect size estimates are in fact central to the current debate in teacher policy. Animportant school of thought in policy-making on teacher quality holds that usingteacher characteristics in policy design is a bad idea because most of the variation inteacher quality is unseen. In other words, teachers differ greatly in their effective-ness, but teachers with and without different qualifications differ only a little. There-fore, according to this school of thought, policies that emphasize motivating principalsand increasing their discretion over hiring should replace policies that require par-ticular qualifications.
The only study that has explicitly addressed itself to generating accurate esti-mates of effect size is Rivkin, Hanushek, and Kain (2001). Using student achieve-ment at more than two points in time, the authors attempt to remove the influencesof particular students and schools that do not vary over time. This method promisesto better isolate the effects of teachers but should be considered developmental untilthe research community has an opportunity to evaluate it. Another promisingapproach to generating better estimates of effect size is research involving randomassignment. For instance, a new effort under way to study TFA utilizes randomassignment of students to TFA and non-TFA teachers (Decker & Mayer, 2002).Such designs are not without their own difficulties (see Ehrenberg et al., 2001). Theyare, however, more transparent than quasi-experimental studies, and the perspec-tive yielded on effect sizes would do much to advance debates on teacher policy.
Notes
Some of the findings presented in this article appear in an introductory chapter ofWayne (2000), a doctoral dissertation. Although the responsibility for errors belongssolely to the authors, we would like to thank Dale Ballou, Linda Darling-Hammond,William Galston, Daniel Goldhaber, Willis Hawley, Mark Lopez, and two anonymousreviewers for helpful comments on earlier versions.
1 The empirical research that supports this claim is a body of student achievementstudies that ignore the particular characteristics of teachers and focus instead on variationsin student achievement gains from one teacher to another. See Goldhaber and Brewer(1997b); Jordan, Mendro, and Weerasinghe (1997); Hanushek (1971, 1992); Murnane(1975); Murnane and Phillips (1981); Rivkin, Hanushek, and Kain (2001); Sanders andRivers (1996); and Wright, Horn, and Sanders (1997).
2 Differences in interpretation are evident in several recent treatments, including Ballouand Podgursky (1999, 2000); Darling-Hammond (1999b, 2001); Darling-Hammond,Berry, and Thoreson (2001); Goldhaber and Brewer (2001); and Walsh (2001).
3 Certification requirements vary considerably across states. In most states, candidatesfor teaching must earn a minimum grade point average and/or achieve a minimum scoreon tests of basic skills, general academic ability, or general knowledge in order to beadmitted to teacher education or gain a credential. In addition, candidates in many statesmust complete a major or minor in the subject(s) to be taught and/or pass a subject mat-ter test, take specific courses in education, and/or pass a test of teaching knowledge andskill. In 2001–2002, 37 states required candidates to pass tests of basic skills or generalknowledge, 33 states required candidates to pass tests of content knowledge, and 26required candidates to pass tests of pedagogy.
Wayne and Youngs
108
at TEXAS SOUTHERN UNIVERSITY on October 18, 2014http://rer.aera.netDownloaded from
4 The payoff to trying to identify relevant conference papers and dissertations is quitesmall relative to the effort required, especially given the time required to obtain suchdocuments, and one would expect that good work would eventually appear as regularpublications.
5 Readers interested in learning more about the studies that were excluded should con-sult the appendices available in Greenwald, Hedges, and Laine (1996) as well as Mitchellet al. (2001).
6 The study is Grissmer et al. (2000), which analyzed trends in states’ averageNAEP scores. Another study of state NAEP averages by Darling-Hammond (1999a)had already been excluded because it examined averages at a point in time rather thanlongitudinally.
7 Early work on this section was completed by Andrew J. Wayne while working atthe National Partnership for Excellence and Accountability in Teaching, which wasfunded through the U.S. Department of Education, Office of Educational Research andImprovement, under Contract RD97124001.
8 Several researchers have noted the discriminatory impact of teacher tests on minoritycandidates, particularly in southern states (Goertz & Pitcher, 1985; Graham, 1987; Smith,Miller, & Joy, 1988; Ludlow, 2001). The use of tests developed by National EvaluationSystems for Alabama was prohibited in the 1980s owing to psychometric reasons relatedto their discriminatory impact on African American candidates (Ludlow, 2001).
9 Strauss and Sawyer (1986) also examined the relationship between student achieve-ment and NTE scores. That study was excluded, however, because it did not use pretestscores.
10 There is a potential for confusion and, perhaps, debate on this point as a result of athird publication by the authors, Summers and Wolfe (1975b). That publication notestwo positive findings not noted in the other publications: 8th graders learned more fromsocial studies teachers with higher NTE social studies scores, and 12th graders withabove average achievement scores learned more from English teachers with higher NTEEnglish scores. Still, we believe it is appropriate to summarize these results as simply“indeterminate,” which we note is consistent with the treatment in Summers and Wolfe(1975a), a more academically oriented analysis of the results for NTE scores across allthree grade levels. That publication does not discuss the relationship of NTE area scoresamong its significant findings. Of course, whether ours is the best possible summary ofthe results for NTE area scores is of minor importance, given the interpretation reachedlater in this article regarding test scores.
11 To clarify the areas of knowledge and skills measured by the TECAT, we contactedofficials at the Texas Education Agency and the Texas State Board for Educator Certifi-cation and examined the registration bulletin and study guide for the TECAT. We con-cluded that while this test evaluates reading and writing skills, it clearly also integratesprofessional knowledge into these items. In addition, we contacted Ron Ferguson in 1998,and we learned that his analyses used TECAT reading scores specifically. Therefore, weinterpret the Ferguson results as applicable to a test that measured teachers’ reading skillsand professional knowledge.
12 Ferguson analyzed data from almost 900 school districts in Texas, out of more than1,000 districts in the state. Most of the districts omitted from the study owing to miss-ing data were very small. In addition, Dallas and Houston were not included in the analy-sis because the weighting scheme in the estimate procedure would have given these twodistricts too much influence over the results.
Teacher Characteristics and Student Achievement Gains
109
at TEXAS SOUTHERN UNIVERSITY on October 18, 2014http://rer.aera.netDownloaded from
13 Readers will note that this study models a student’s 2-year gain as a function of thequality of a teacher who teaches the student for less than 1 year. Although a noticeablyincomplete model, it is nevertheless sufficient. The exposure to teachers of unknownquality introduces measurement error, which in regression models would make it moredifficult to discern a statistically significant relationship between the independent anddependent variables. A relationship appears in this study and others that use the samedata set despite the added measurement error.
14 The Monk (1994) study contains no mention of any controls for socioeconomic sta-tus, and in a personal communication Monk confirmed that no such controls were used.Had it been admissible, it would have helped to confirm the conclusion reached in thissection that mathematics-related preparation improves the effectiveness of mathematicsteachers.
15 The Monk (1994) study, which was excluded as a result of the absence of controlsfor socioeconomic status, explicitly separated education-related courses in a subject fromother courses in a subject.
16 Readers may be familiar with a study by Hawk, Coble, and Swanson (1985) thatconcluded that students learn more from certified teachers. That study did not controlfor student socioeconomic status and was therefore excluded from this review. The studyby Fetler (1999) is often cited as well, but it was excluded owing to the fact that it didnot use pretest scores.
17 As a result of space limitations, we are not able to summarize all areas of agreementand disagreement between Goldhaber and Brewer (2000) and Darling-Hammond et al.(2001), but it is important to note that they are in agreement that the teachers in the studywith nonstandard certification otherwise had qualifications that were on average quitesimilar to those of the teachers with standard certification. This fact raises importantquestions about the measure used to distinguish teachers and thus gives us reason toawait further research before drawing conclusions about certification type.
18 Documentation on the Schools and Staffing Survey, including the instrumentsgiven to teachers, is available online at www.nces.ed.gov/surveys/sass.
19 We are in agreement with Goldhaber and Brewer (2001) and Darling-Hammondet al. (2001) that research on certification status and student achievement is complicatedbecause (a) certification is defined differently in different states and (b) definitions of cer-tification within a single state often change over time. Further, both groups of researchersprovide useful recommendations for future research on teacher certification policy. Inparticular, Goldhaber and Brewer call for “more detailed information on the specific date,location, and content of an individual teacher’s certification experience and more com-prehensive information on how state licensing policy has changed over time” (2000,p. 141). For their part, Darling-Hammond et al. recommend a research agenda thatincludes efforts “to understand how different teacher certification strategies encourage ordiscourage the construction of programs that produce well prepared teachers who stay inthe profession, and how state policies distribute well prepared teachers equitably to allchildren in the state, regardless of race and income” (2001, p. 71).
20 Since the 1970s, women and racial minorities have had many more professionalopportunities outside of education. There were relatively few teaching positions avail-able in the 1970s, owing to student and teacher demographics, which also affected col-lege students’ attitudes about teaching. See generally Warren (1989) and Sedlak andSchlossman (1986). In addition, there is an ongoing debate about the academic qual-ifications of prospective teachers. See Gitomer, Latham, and Ziomek (1999) and Henke,Chen, and Geis (2000).
Wayne and Youngs
110
at TEXAS SOUTHERN UNIVERSITY on October 18, 2014http://rer.aera.netDownloaded from
ReferencesAmerican College Testing. (1989). The enhanced ACT assessment: Using concordance
tables. Iowa City, IA: Author.Ballou, D., & Podgursky, M. (1999, October 13). Reforming teacher preparation and
licensing: What is the evidence? Teachers College Record. Retrieved December 7,1999, from http://www.tcrecord.org
Ballou, D., & Podgursky, M. (2000, May). Reforming teacher preparation and licens-ing: Continuing the debate. Teachers College Record. Retrieved June 15, 2000, fromhttp://www.tcrecord.org
Coleman, J. S. (1966). Equality of educational opportunity. Washington, DC: Officeof Education, U.S. Department of Health, Education, and Welfare.
Darling-Hammond, L. (1999a). Teacher quality and student achievement: A review ofstate policy evidence. Seattle: Center for the Study of Teaching and Policy, Univer-sity of Washington.
Darling-Hammond, L. (1999b, October 13). Reforming teacher preparation and licens-ing: Debating the evidence. Teachers College Record. Retrieved December 7, 1999,from http://www.tcrecord.org
Darling-Hammond, L. (2001). The research and rhetoric on teacher certification: Aresponse to “Teacher certification reconsidered.” New York: National Commissionon Teaching and America’s Future.
Darling-Hammond, L., Berry, B., & Thoreson, A. (2001). Does teacher certification mat-ter? Evaluating the evidence. Educational Evaluation and Policy Analysis, 23, 57–77.
Decker, P., & Mayer, D. (2002). Studying alternative certification using randomassignment. Paper presented at the annual meeting of the American EducationalResearch Association, New Orleans, LA.
Dewey, J., Husted, T. A., & Kenny, L. W. (2000). The ineffectiveness of school inputs:A product of misspecification? Economics of Education Review, 19, 27–45.
Eberts, R. W., & Stone, J. A. (1984). Unions and public schools: The effect of collec-tive bargaining on American education. Lexington, MA: Heath.
Ehrenberg, R. G., & Brewer, D. J. (1994). Do school and teacher characteristics matter?Evidence from high school and beyond. Economics of Education Review, 13, 1–17.
Ehrenberg, R. G., & Brewer, D. J. (1995). Did teachers’ verbal ability and race matterin the 1960s? Coleman revisited. Economics of Education Review, 14, 1–21.
Ehrenberg, R. G., Brewer, D. J., Gamoran, A., & Wilms, J. D. (2001). Class size andstudent achievement. Psychological Science in the Public Interest, 2(1), 1–30.
Ehrenberg, R. G., Goldhaber, D. D., & Brewer, D. J. (1995). Do teachers’ race, gen-der, and ethnicity matter? Evidence from the National Educational LongitudinalStudy of 1988. Industrial and Labor Relations Review, 48, 547–561.
Ferguson, R. F. (1991). Paying for public education: New evidence on how and whymoney matters. Harvard Journal on Legislation, 28, 465–498.
Ferguson, R. F. (1998). Can schools narrow the Black-White test score gap? In C. Jencks& M. Phillips (Eds.), The Black-White test score gap (pp. 318–374). Washington, DC:Brookings Institution.
Ferguson, R. F., & Ladd, H. F. (1996). How and why money matters: An analysis ofAlabama schools. In H. F. Ladd (Ed.), Holding schools accountable: Performance-based reform in education (pp. 265–298). Washington, DC: Brookings Institution.
Fetler, M. (1999). High school staff characteristics and mathematics test results. Edu-cation Policy Analysis Archives, 7(9). Retrieved March 3, 2000, from http://epaa.asu.edu/epaa/v7n9.html
Gitomer, D. H., Latham, A. S., & Ziomek, R. (1999). The academic quality of prospec-tive teachers: The impact of admissions and licensure testing. Princeton, NJ: Edu-cational Testing Service.
111
at TEXAS SOUTHERN UNIVERSITY on October 18, 2014http://rer.aera.netDownloaded from
Goertz, M. E., & Pitcher, B. (1985). The impact of NTE use by states on teacher selec-tion. Princeton, NJ: Educational Testing Service.
Goldhaber, D. D., & Brewer, D. J. (1997a). Evaluating the effect of teacher degree levelon educational performance. In W. J. Fowler (Ed.), Developments in school finance,1996 (pp. 197–210). Washington, DC: National Center for Education Statistics, U.S.Department of Education.
Goldhaber, D. D., & Brewer, D. J. (1997b). Why don’t schools and teachers seem tomatter? Assessing the impact of unobservables on educational productivity. Journalof Human Resources, 32, 505–523.
Goldhaber, D. D., & Brewer, D. J. (2000). Does teacher certification matter? Highschool certification status and student achievement. Educational Evaluation andPolicy Analysis, 22, 129–146.
Goldhaber, D. D., & Brewer, D. J. (2001). Evaluating the evidence on teacher certifi-cation: A rejoinder. Educational Evaluation and Policy Analysis, 23, 79–86.
Graham, P. A. (1987). Black teachers: A drastically scarce resource. Phi Delta Kappan,68, 598–605.
Greenwald, R., Hedges, L. V., & Laine, R. D. (1996). The effect of school resourceson student achievement. Review of Educational Research, 66, 361–396.
Grissmer, D. W., & Flanagan, A. (2000). Moving educational research toward scientificconsensus. In D. W. Grissmer & J. M. Ross (Eds.), Analytic issues in the assessmentof student achievement (pp. 43–90). Washington, DC: U.S. Department of Education.
Grissmer, D. W., Flanagan, A., Kawata, J., & Williamson, S. (2000). Improving stu-dent achievement: What state NAEP test scores tell us. Santa Monica: RAND.
Haney, W., Madaus, G., & Kreitzer, A. (1987). Charms talismanic: Testing teachers forthe improvement of American education. In E. Z. Rothkopf (Ed.), Review of researchin education (Vol. 14). Washington, DC: American Educational Research Association.
Hanushek, E. A. (1971). Teacher characteristics and gains in student achievement:Estimation using micro-data. American Economic Review, 61, 280–288.
Hanushek, E. A. (1992). The trade-off between child quantity and quality. Journal ofPolitical Economy, 100, 85–117.
Hanushek, E. A. (1997). Assessing the effects of school resources on student perfor-mance: An update. Educational Evaluation and Policy Analysis, 19, 141–164.
Hanushek, E. A., Gomes-Neto, J. B., & Harbison, R. W. (1996). Efficiency-enhancinginvestments in school quality. In N. Birdsall & R. H. Sabot (Eds.), Opportunity fore-gone: Education in Brazil (pp. 385–424). Washington, DC: Inter-American Devel-opment Bank/Johns Hopkins University Press.
Harnisch, D. L. (1987). Characteristics associated with effective public high schools.Journal of Educational Research, 80, 233–241.
Hawk, P., Coble, C. R., & Swanson, M. (1985). Certification: It does matter. Journalof Teacher Education, 36(3), 13–15.
Henke, R. R., Chen, X., & Geis, S. (2000). Progress through the teacher pipeline:1992–93 college graduates and elementary/secondary school teaching as of 1997.Washington, DC: U.S. Department of Education, National Center for EducationStatistics.
Hussar, W. J. (1999). Predicting the need for newly hired teachers in the United Statesto 2008–09. Washington, DC: U.S. Department of Education, National Center forEducation Statistics.
Ingersoll, R. M. (1996). Out-of-field teaching and educational equity. Washington, DC:U.S. Department of Education.
Jordan, H. R., Mendro, R., & Weerasinghe, D. (1997). Teacher effects on longitudinalstudent achievement. Paper presented at the annual meeting of the Center for Researchon Educational Accountability and Teacher Education, Indianapolis, IN.
Wayne and Youngs
112
at TEXAS SOUTHERN UNIVERSITY on October 18, 2014http://rer.aera.netDownloaded from
Kain, J. F., & Singleton, K. (1996, May–June). Equality of educational opportunityrevisited. New England Economic Review, pp. 87–111.
Kiesling, H. J. (1984). Assignment practices and the relationship of instructional timeto the reading performance of elementary school children. Economics of EducationReview, 3, 341–350.
King, G., Keohane, R. O., & Verba, S. (1994). Designing social inquiry: Scientificinference in qualitative research. Princeton, NJ: Princeton University.
Link, C. R., & Mulligan, J. G. (1986). The merits of a longer school day. Economics ofEducation Review, 5, 373–381.
Link, C. R., & Ratledge, E. C. (1979). Student perceptions, I.Q. and achievement. Jour-nal of Human Resources, 14, 98–111.
Ludlow, L. (2001). Teacher test accountability: From Alabama to Massachusetts. Edu-cation Policy Analysis Archives, 9(6). Retrieved April 6, 2002, from http://epaa.asu.edu/epaa/v9n6.html
Ludwig, J., & Bassi, L. J. (1999). The puzzling case of school resources and studentachievement. Educational Evaluation and Policy Analysis, 21, 385–403.
Maynard, R., & Crawford, D. (1976). School performance. In D. L. Bawden &W. S. Harrar (Eds.), Rural income maintenance experiment: Final report (Vol. VI,Part II, pp. 1–104). Madison: University of Wisconsin, Institute for Research onPoverty.
Mitchell, K. J., Robinson, D. Z., Plake, B. S., & Knowles, K. T. (2001). Testing teachercandidates: The role of licensure tests in improving teacher quality. Washington,DC: National Academy Press.
Monk, D. H. (1994). Subject area preparation of secondary math and science teachersand student achievement. Economics of Education Review, 13, 125–145.
Monk, D. H., & King, J. (1994). Multilevel teacher resource effects on pupil perfor-mance in secondary mathematics and science: The case of teacher subject-matterpreparation. In R. Ehrenberg (Ed.), Contemporary policy issues: Choices and con-sequences in education (pp. 29–58). Ithaca, NY: ILR.
Murnane, R. J. (1975). The impact of school resources on the learning of inner citychildren. Cambridge, MA: Ballinger.
Murnane, R. J., & Phillips, B. R. (1981). What do effective teachers of inner-city chil-dren have in common? Social Science Research, 10, 83–100.
Pecheone, R., Rogers, J., & Moirs, K. (2001). A beginning teacher survey study: A policy-practice perspective. Paper presented at the annual meeting of the American Educa-tional Research Association, Seattle, WA.
Raymond, M., Fletcher, S. H., & Luque, J. (2001). Teach for America: An evaluationof teacher differences and student outcomes in Houston, Texas. Stanford, CA: Cen-ter for Research on Education Outcomes.
Rivkin, S. G., Hanushek, E. A., & Kain, J. F. (2001). Teachers, schools, and academicachievement. Amherst, MA: Amherst College.
Rowan, B. (2002). What large scale survey research tells us about teacher effects onstudent achievement: Insights from the Prospects study of elementary schools. AnnArbor: University of Michigan.
Rowan, B., Chiang, F.-S., & Miller, R. J. (1997). Using research on employees’ per-formance to study the effects of teachers on students’ achievement. Sociology ofEducation, 70, 256–284.
Sanders, W. L., & Rivers, J. C. (1996). Cumulative and residual effects of teachers onfuture academic achievement. Knoxville: University of Tennessee Value-AddedResearch and Assessment Center.
Sedlak, M., & Schlossman, S. (1986). Who will teach? Historical perspectives on thechanging appeal of teaching as a profession. Santa Monica, CA: Rand.
Teacher Characteristics and Student Achievement Gains
113
at TEXAS SOUTHERN UNIVERSITY on October 18, 2014http://rer.aera.netDownloaded from
Smith, G. P., Miller, M. C., & Joy, J. (1988). A case study of the impact of performance-based testing on the supply of minority teachers. Journal of Teacher Education, 39(4),45–53.
Strauss, R. P., & Sawyer, E. A. (1986). Some new evidence on teacher and studentcompetencies. Economics of Education Review, 5, 41–48.
Summers, A. A., & Wolfe, B. L. (1975a). Equality of educational opportunity quantified:A production function approach. Philadelphia: Federal Reserve Bank of Philadelphia,Department of Research.
Summers, A. A., & Wolfe, B. L. (1975b). Which school resources help learning? Effi-ciency and equity in Philadelphia public schools. Philadelphia: Federal ReserveBank of Philadelphia.
Summers, A. A., & Wolfe, B. L. (1977). Do schools make a difference? American Eco-nomic Review, 67, 639–652.
Turner, S. E. (2000). A comment on “Poor school funding, child poverty, and mathe-matics achievement.” Educational Researcher, 29(5), 15–18.
U.S. Department of Education. (2002). Meeting the highly qualified teachers challenge.Washington, DC: Author.
Walsh, K. (2001). Teacher certification reconsidered: Stumbling for quality. Balti-more: Abell Foundation.
Warren, D. (1989). American teachers: Histories of a profession at work. New York:Macmillan.
Wayne, A. J. (2000a). Federal policies to improve teacher quality for low-income stu-dents. Unpublished doctoral dissertation, University of Maryland, College Park.
Wayne, A. (2000b). Teacher supply and demand: Surprises from primary research.Education Policy Analysis Archives, 8(47). Retrieved September 19, 2000, fromhttp://epaa.asu.edu/epaa/v8n47/
Wayne, A. (2002). Teacher inequality: New evidence on disparities in teachers’ aca-demic skills. Education Policy Analysis Archives, 10(30). Retrieved June 30, 2002,from http://epaa.asu.edu/epaa/v10n30/
Wilson, S. M., Floden, R. E., & Ferrini-Mundy, J. (2001). Teacher preparation research:Current knowledge, gaps, and recommendations. Seattle, WA: Center for the Study ofTeaching and Policy.
Wright, S. P., Horn, S. P., & Sanders, W. L. (1997). Teacher and classroom contexteffects on student achievement: Implications for teacher evaluation. Journal of Per-sonnel Evaluation in Education, 11, 57–67.
Youngs, P., Odden, A., & Porter, A. C. (2001). State leadership in teacher licensure.Paper presented at the annual meeting of the American Educational Research Asso-ciation, Seattle, WA.
Youngs, P., Odden, A., & Porter, A. C. (in press). State policy related to teacher licen-sure. Educational Policy.
AuthorsANDREW J. WAYNE is an Education Researcher at SRI International, 1100 Wilson Blvd.,
Suite 2800, Arlington, VA 22209-3915; e-mail [email protected]. His areas of spe-cialization are teacher quality and educational technology.
PETER YOUNGS is a Research Associate at Stanford University, School of Education,CERAS Building, Room 109-O, Stanford, CA 94305; e-mail [email protected]. Hisarea of specialization is state policy related to teacher education, licensure, and induction.
Wayne and Youngs
114
at TEXAS SOUTHERN UNIVERSITY on October 18, 2014http://rer.aera.netDownloaded from
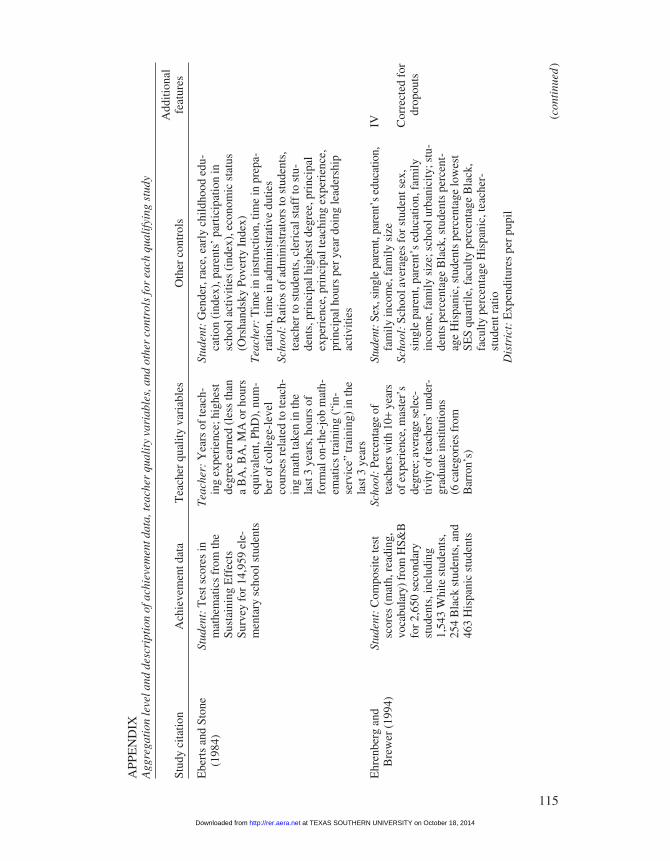
115
APP
EN
DIX
Agg
rega
tion
leve
l and
des
crip
tion
of a
chie
vem
ent d
ata,
teac
her
qual
ity
vari
able
s, a
nd o
ther
con
trol
s fo
r ea
ch q
uali
fyin
g st
udy
Add
ition
alSt
udy
cita
tion
Ach
ieve
men
t dat
aT
each
er q
ualit
y va
riab
les
Oth
er c
ontr
ols
feat
ures
Ebe
rts
and
Ston
e (1
984)
Ehr
enbe
rg a
nd
Bre
wer
(19
94)
Stud
ent:
Tes
t sco
res
inm
athe
mat
ics
from
the
Sust
aini
ng E
ffec
ts
Surv
ey f
or 1
4,95
9 el
e-m
enta
ry s
choo
l stu
dent
s
Stud
ent:
Com
posi
te te
stsc
ores
(m
ath,
rea
ding
,vo
cabu
lary
) fro
m H
S&B
for
2,65
0 se
cond
ary
stud
ents
, inc
ludi
ng1,
543
Whi
te s
tude
nts,
254
Bla
ck s
tude
nts,
and
463
His
pani
c st
uden
ts
Tea
cher
:Y
ears
of
teac
h-in
g ex
peri
ence
; hig
hest
degr
ee e
arne
d (l
ess
than
a B
A, B
A, M
A o
r ho
urs
equi
vale
nt, P
hD),
num
-be
r of
col
lege
-lev
elco
urse
s re
late
d to
teac
h-in
g m
ath
take
n in
the
last
3 y
ears
, hou
rs o
ffo
rmal
on-
the-
job
mat
h-em
atic
s tr
aini
ng (
“in-
serv
ice”
trai
ning
) in
the
last
3 y
ears
Scho
ol:
Perc
enta
ge o
fte
ache
rs w
ith 1
0+ye
ars
of e
xper
ienc
e, m
aste
r’s
degr
ee; a
vera
ge s
elec
-tiv
ity o
f tea
cher
s’ u
nder
-gr
adua
te in
stitu
tions
(6
cat
egor
ies
from
B
arro
n’s)
Stud
ent:
Gen
der,
rac
e, e
arly
chi
ldho
od e
du-
catio
n (i
ndex
), p
aren
ts’
part
icip
atio
n in
scho
ol a
ctiv
ities
(in
dex)
, eco
nom
ic s
tatu
s(O
rsha
ndsk
y Po
vert
y In
dex)
Tea
cher
:T
ime
in in
stru
ctio
n, ti
me
in p
repa
-ra
tion,
tim
e in
adm
inis
trat
ive
dutie
sSc
hool
:R
atio
s of
adm
inis
trat
ors
to s
tude
nts,
teac
her
to s
tude
nts,
cle
rica
l sta
ff to
stu
-de
nts,
pri
ncip
al h
ighe
st d
egre
e, p
rinc
ipal
expe
rien
ce, p
rinc
ipal
teac
hing
exp
erie
nce,
prin
cipa
l hou
rs p
er y
ear
doin
g le
ader
ship
activ
ities
Stud
ent:
Sex,
sin
gle
pare
nt, p
aren
t’s
educ
atio
n,fa
mily
inco
me,
fam
ily s
ize
Scho
ol:
Scho
ol a
vera
ges
for
stud
ent s
ex,
sing
le p
aren
t, pa
rent
’s e
duca
tion,
fam
ilyin
com
e, f
amily
siz
e; s
choo
l urb
anic
ity; s
tu-
dent
s pe
rcen
tage
Bla
ck, s
tude
nts
perc
ent-
age
His
pani
c, s
tude
nts
perc
enta
ge lo
wes
tSE
S qu
artil
e, f
acul
ty p
erce
ntag
e B
lack
,fa
culty
per
cent
age
His
pani
c, te
ache
r-st
uden
t rat
ioD
istr
ict:
Exp
endi
ture
s pe
r pu
pil
IV Cor
rect
ed f
ordr
opou
ts
(con
tinu
ed)
at TEXAS SOUTHERN UNIVERSITY on October 18, 2014http://rer.aera.netDownloaded from
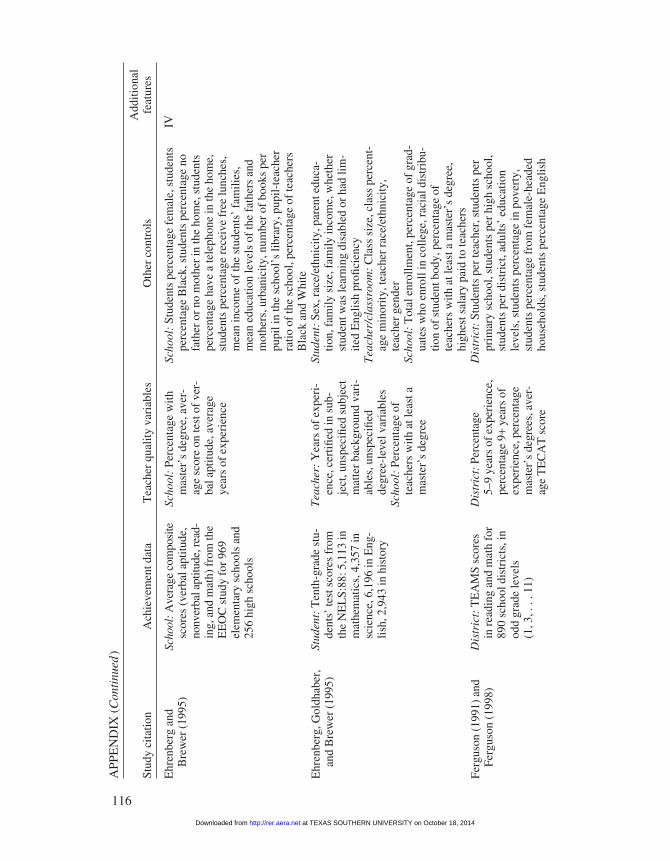
116
APP
EN
DIX
(C
onti
nued
)
Add
ition
alSt
udy
cita
tion
Ach
ieve
men
t dat
aT
each
er q
ualit
y va
riab
les
Oth
er c
ontr
ols
feat
ures
Scho
ol:A
vera
ge c
ompo
site
scor
es (
verb
al a
ptitu
de,
nonv
erba
l apt
itude
, rea
d-in
g, a
nd m
ath)
fro
m th
eE
EO
C s
tudy
for
969
elem
enta
ry s
choo
ls a
nd25
6 hi
gh s
choo
ls
Stud
ent:
Ten
th-g
rade
stu
-de
nts’
test
sco
res
from
the
NE
LS:
88: 5
,113
inm
athe
mat
ics,
4,3
57 in
scie
nce,
6,1
96 in
Eng
-lis
h, 2
,943
in h
isto
ry
Dis
tric
t:T
EA
MS
scor
esin
rea
ding
and
mat
h fo
r89
0 sc
hool
dis
tric
ts, i
nod
d gr
ade
leve
ls
(1, 3
, ...
11)
Ehr
enbe
rg a
nd
Bre
wer
(19
95)
Ehr
enbe
rg, G
oldh
aber
, an
d B
rew
er (
1995
)
Ferg
uson
(19
91)
and
Ferg
uson
(19
98)
Scho
ol:
Perc
enta
ge w
ithm
aste
r’s
degr
ee, a
ver-
age
scor
e on
test
of
ver-
bal a
ptitu
de, a
vera
geye
ars
of e
xper
ienc
e
Tea
cher
:Y
ears
of
expe
ri-
ence
, cer
tified
in s
ub-
ject
, uns
peci
fied
subj
ect
mat
ter
back
grou
nd v
ari-
able
s, u
nspe
cifie
dde
gree
-lev
el v
aria
bles
Scho
ol:
Perc
enta
ge o
fte
ache
rs w
ith a
t lea
st a
mas
ter’
s de
gree
Dis
tric
t:Pe
rcen
tage
5–
9 ye
ars
of e
xper
ienc
e,pe
rcen
tage
9+
year
s of
expe
rien
ce, p
erce
ntag
em
aste
r’s
degr
ees,
ave
r-ag
e T
EC
AT
sco
re
Scho
ol:
Stud
ents
per
cent
age
fem
ale,
stu
dent
spe
rcen
tage
Bla
ck, s
tude
nts
perc
enta
ge n
ofa
ther
or
no m
othe
r in
the
hom
e, s
tude
nts
perc
enta
ge h
ave
a te
leph
one
in th
e ho
me,
stud
ents
per
cent
age
rece
ive
free
lunc
hes,
mea
n in
com
e of
the
stud
ents
’ fa
mili
es,
mea
n ed
ucat
ion
leve
ls o
f th
e fa
ther
s an
dm
othe
rs, u
rban
icity
, num
ber
of b
ooks
per
pupi
l in
the
scho
ol’s
libr
ary,
pup
il-te
ache
rra
tio o
f th
e sc
hool
, per
cent
age
of te
ache
rsB
lack
and
Whi
teSt
uden
t:Se
x, r
ace/
ethn
icity
, par
ent e
duca
-tio
n, f
amily
siz
e, f
amily
inco
me,
whe
ther
stud
ent w
as le
arni
ng d
isab
led
or h
ad li
m-
ited
Eng
lish
profi
cien
cyT
each
er/c
lass
room
:C
lass
siz
e, c
lass
per
cent
-ag
e m
inor
ity, t
each
er r
ace/
ethn
icity
,te
ache
r ge
nder
Scho
ol:
Tot
al e
nrol
lmen
t, pe
rcen
tage
of
grad
-ua
tes
who
enr
oll i
n co
llege
, rac
ial d
istr
ibu-
tion
of s
tude
nt b
ody,
per
cent
age
ofte
ache
rs w
ith a
t lea
st a
mas
ter’
s de
gree
,hi
ghes
t sal
ary
paid
to te
ache
rsD
istr
ict:
Stud
ents
per
teac
her,
stu
dent
s pe
rpr
imar
y sc
hool
, stu
dent
s pe
r hi
gh s
choo
l,st
uden
ts p
er d
istr
ict,
adul
ts’
educ
atio
n le
vels
, stu
dent
s pe
rcen
tage
in p
over
ty,
stud
ents
per
cent
age
from
fem
ale-
head
edho
useh
olds
, stu
dent
s pe
rcen
tage
Eng
lish
IV
at TEXAS SOUTHERN UNIVERSITY on October 18, 2014http://rer.aera.netDownloaded from
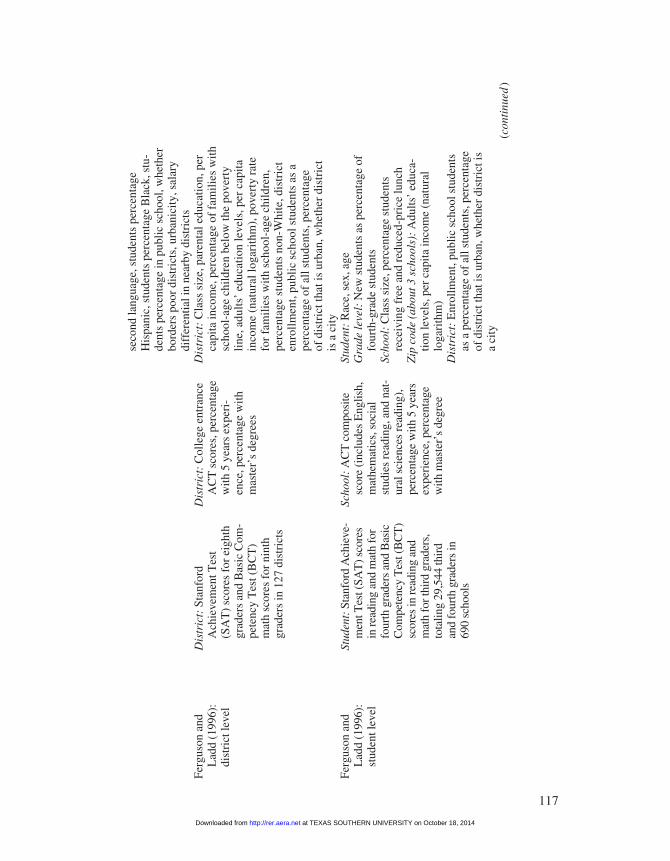
117
Dis
tric
t:St
anfo
rdA
chie
vem
ent T
est
(SA
T)
scor
es f
or e
ight
hgr
ader
s an
d B
asic
Com
-pe
tenc
y T
est (
BC
T)
mat
h sc
ores
for
nin
thgr
ader
s in
127
dis
tric
ts
Stud
ent:
Stan
ford
Ach
ieve
-m
ent T
est (
SAT
) sco
res
in re
adin
g an
d m
ath
for
four
th g
rade
rs a
nd B
asic
Com
pete
ncy
Tes
t (B
CT
)sc
ores
in re
adin
g an
dm
ath
for t
hird
gra
ders
,to
talin
g 29
,544
thir
d an
d fo
urth
gra
ders
in69
0 sc
hool
s
Ferg
uson
and
L
add
(199
6):
dist
rict
leve
l
Ferg
uson
and
L
add
(199
6):
stud
ent l
evel
Dis
tric
t:C
olle
ge e
ntra
nce
AC
T s
core
s, p
erce
ntag
ew
ith 5
yea
rs e
xper
i-en
ce, p
erce
ntag
e w
ithm
aste
r’s
degr
ees
Scho
ol:
AC
T c
ompo
site
scor
e (i
nclu
des
Eng
lish,
mat
hem
atic
s, s
ocia
lst
udie
s re
adin
g, a
nd n
at-
ural
sci
ence
s re
adin
g),
perc
enta
ge w
ith 5
yea
rsex
peri
ence
, per
cent
age
with
mas
ter’
s de
gree
seco
nd la
ngua
ge, s
tude
nts
perc
enta
ge
His
pani
c, s
tude
nts
perc
enta
ge B
lack
, stu
-de
nts
perc
enta
ge in
pub
lic s
choo
l, w
heth
erbo
rder
s po
or d
istr
icts
, urb
anic
ity, s
alar
ydi
ffer
entia
l in
near
by d
istr
icts
Dis
tric
t:C
lass
siz
e, p
aren
tal e
duca
tion
, per
capi
ta in
com
e, p
erce
ntag
e of
fam
ilie
s w
ith
scho
ol-a
ge c
hild
ren
belo
w th
e po
vert
yli
ne, a
dult
s’ e
duca
tion
leve
ls, p
er c
apit
ain
com
e (n
atur
al lo
gari
thm
), p
over
ty r
ate
for
fam
ilie
s w
ith
scho
ol-a
ge c
hild
ren,
pe
rcen
tage
stu
dent
s no
n-W
hite
, dis
tric
ten
roll
men
t, pu
blic
sch
ool s
tude
nts
as a
perc
enta
ge o
f al
l stu
dent
s, p
erce
ntag
e of
dis
tric
t tha
t is
urba
n, w
heth
er d
istr
ict
is a
cit
ySt
uden
t:R
ace,
sex
, age
Gra
de le
vel:
New
stu
dent
s as
per
cent
age
offo
urth
-gra
de s
tude
nts
Scho
ol:
Cla
ss s
ize,
per
cent
age
stud
ents
rece
ivin
g fr
ee a
nd r
educ
ed-p
rice
lunc
hZ
ip c
ode
(abo
ut 3
sch
ools
):A
dults
’ ed
uca-
tion
leve
ls, p
er c
apita
inco
me
(nat
ural
lo
gari
thm
)D
istr
ict:
Enr
ollm
ent,
publ
ic s
choo
l stu
dent
sas
a p
erce
ntag
e of
all
stud
ents
, per
cent
age
of d
istr
ict t
hat i
s ur
ban,
whe
ther
dis
tric
t is
a ci
ty(c
onti
nued
)
at TEXAS SOUTHERN UNIVERSITY on October 18, 2014http://rer.aera.netDownloaded from
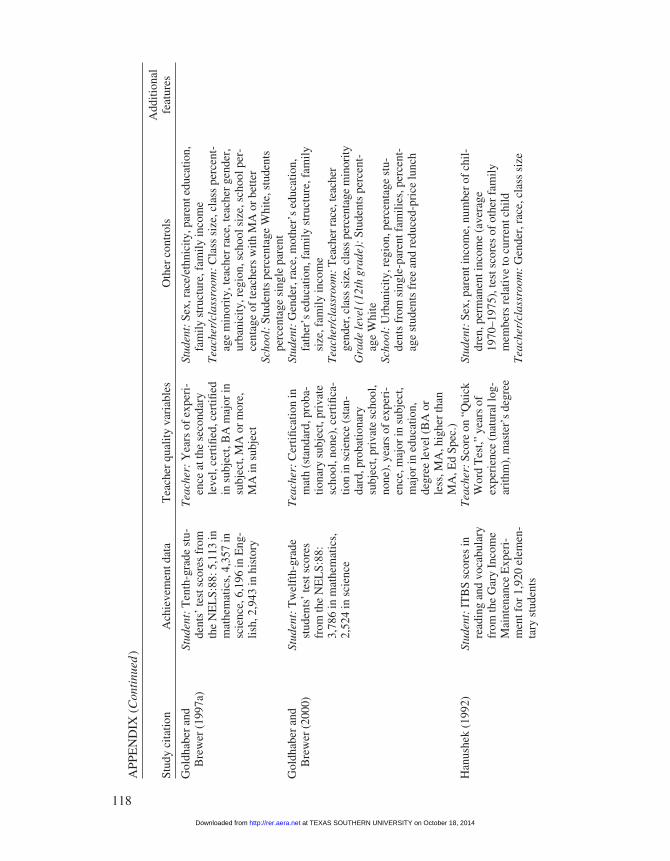
118
APP
EN
DIX
(C
onti
nued
)
Add
ition
alSt
udy
cita
tion
Ach
ieve
men
t dat
aT
each
er q
ualit
y va
riab
les
Oth
er c
ontr
ols
feat
ures
Stud
ent:
Ten
th-g
rade
stu
-de
nts’
test
sco
res
from
the
NE
LS:
88: 5
,113
inm
athe
mat
ics,
4,3
57 in
scie
nce,
6,1
96 in
Eng
-lis
h, 2
,943
in h
isto
ry
Stud
ent:
Tw
elft
h-gr
ade
stud
ents
’ te
st s
core
sfr
om th
e N
EL
S:88
:3,
786
in m
athe
mat
ics,
2,52
4 in
sci
ence
Stud
ent:
ITB
S sc
ores
inre
adin
g an
d vo
cabu
lary
from
the
Gar
y In
com
eM
aint
enan
ce E
xper
i-m
ent f
or 1
,920
ele
men
-ta
ry s
tude
nts
Gol
dhab
er a
nd
Bre
wer
(19
97a)
Gol
dhab
er a
nd
Bre
wer
(20
00)
Han
ushe
k (1
992)
Tea
cher
:Y
ears
of
expe
ri-
ence
at t
he s
econ
dary
leve
l, ce
rtifi
ed, c
ertifi
edin
sub
ject
, BA
maj
or in
subj
ect,
MA
or
mor
e,M
A in
sub
ject
Tea
cher
:C
ertifi
catio
n in
mat
h (s
tand
ard,
pro
ba-
tiona
ry s
ubje
ct, p
riva
tesc
hool
, non
e), c
ertifi
ca-
tion
in s
cien
ce (
stan
-da
rd, p
roba
tiona
rysu
bjec
t, pr
ivat
e sc
hool
,no
ne),
yea
rs o
f ex
peri
-en
ce, m
ajor
in s
ubje
ct,
maj
or in
edu
catio
n,de
gree
leve
l (B
A o
rle
ss, M
A, h
ighe
r th
anM
A, E
d Sp
ec.)
Tea
cher
:Sc
ore
on “
Qui
ckW
ord
Tes
t,” y
ears
of
expe
rien
ce (
natu
ral l
og-
arith
m),
mas
ter’
s de
gree
Stud
ent:
Sex,
rac
e/et
hnic
ity, p
aren
t edu
catio
n,fa
mily
str
uctu
re, f
amily
inco
me
Tea
cher
/cla
ssro
om:
Cla
ss s
ize,
cla
ss p
erce
nt-
age
min
ority
, tea
cher
rac
e, te
ache
r ge
nder
,ur
bani
city
, reg
ion,
sch
ool s
ize,
sch
ool p
er-
cent
age
of te
ache
rs w
ith M
A o
r be
tter
Scho
ol:
Stud
ents
per
cent
age
Whi
te, s
tude
nts
perc
enta
ge s
ingl
e pa
rent
Stud
ent:
Gen
der,
rac
e, m
othe
r’s
educ
atio
n,fa
ther
’s e
duca
tion,
fam
ily s
truc
ture
, fam
ilysi
ze, f
amily
inco
me
Teac
her/
clas
sroo
m:
Tea
cher
race
, tea
cher
gend
er, c
lass
siz
e, c
lass
per
cent
age
min
ority
Gra
de le
vel (
12th
gra
de):
Stud
ents
per
cent
-ag
e W
hite
Scho
ol:
Urb
anic
ity, r
egio
n, p
erce
ntag
e st
u-de
nts
from
sin
gle-
pare
nt f
amili
es, p
erce
nt-
age
stud
ents
fre
e an
d re
duce
d-pr
ice
lunc
h
Stud
ent:
Sex,
par
ent i
ncom
e, n
umbe
r of
chi
l-dr
en, p
erm
anen
t inc
ome
(ave
rage
1970
–197
5), t
est s
core
s of
oth
er f
amily
mem
bers
rel
ativ
e to
cur
rent
chi
ldT
each
er/c
lass
room
:G
ende
r, r
ace,
cla
ss s
ize
at TEXAS SOUTHERN UNIVERSITY on October 18, 2014http://rer.aera.netDownloaded from
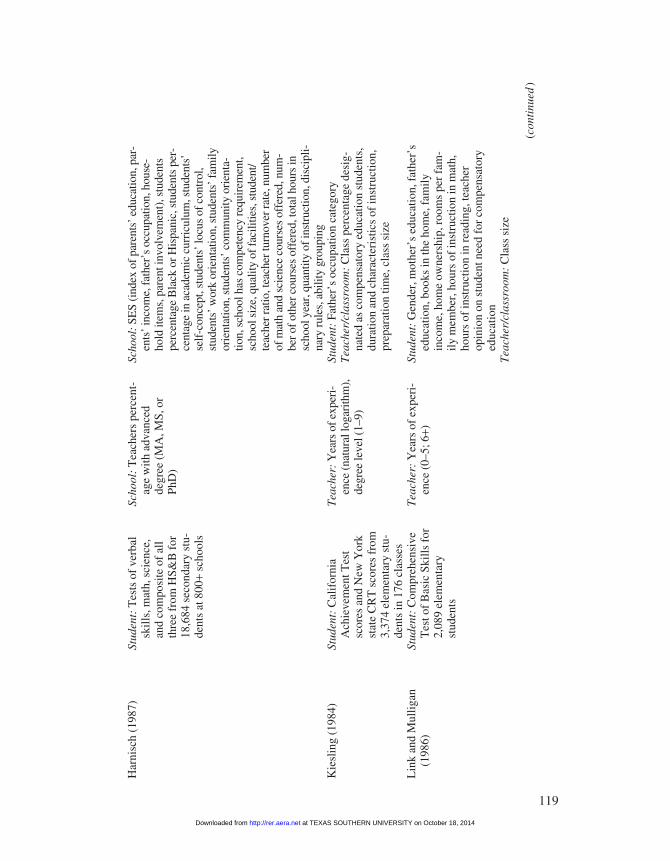
119
Stud
ent:
Tes
ts o
f ve
rbal
skill
s, m
ath,
sci
ence
,an
d co
mpo
site
of
all
thre
e fr
om H
S&B
for
18,6
84 s
econ
dary
stu
-de
nts
at 8
00+
scho
ols
Stud
ent:
Cal
ifor
nia
Ach
ieve
men
t Tes
tsc
ores
and
New
Yor
kst
ate
CR
T s
core
s fr
om3,
374
elem
enta
ry s
tu-
dent
s in
176
cla
sses
Stud
ent:
Com
preh
ensi
veT
est o
f B
asic
Ski
lls f
or2,
089
elem
enta
ry
stud
ents
Har
nisc
h (1
987)
Kie
slin
g (1
984)
Lin
k an
d M
ullig
an
(198
6)
Scho
ol:
Tea
cher
s pe
rcen
t-ag
e w
ith a
dvan
ced
degr
ee (
MA
, MS,
or
PhD
)
Teac
her:
Yea
rs o
f exp
eri-
ence
(nat
ural
loga
rith
m),
degr
ee le
vel (
1–9)
Tea
cher
:Y
ears
of
expe
ri-
ence
(0–
5; 6
+)
Scho
ol:
SES
(ind
ex o
f par
ents
’ edu
catio
n, p
ar-
ents
’ inc
ome,
fath
er’s
occ
upat
ion,
hou
se-
hold
item
s, p
aren
t inv
olve
men
t), s
tude
nts
perc
enta
ge B
lack
or H
ispa
nic,
stu
dent
s pe
r-ce
ntag
e in
aca
dem
ic c
urri
culu
m, s
tude
nts’
self
-con
cept
, stu
dent
s’ lo
cus
of c
ontr
ol,
stud
ents
’ wor
k or
ient
atio
n, s
tude
nts’
fam
ilyor
ient
atio
n, s
tude
nts’
com
mun
ity o
rien
ta-
tion,
sch
ool h
as c
ompe
tenc
y re
quir
emen
t,sc
hool
siz
e, q
ualit
y of
faci
litie
s, s
tude
nt/
teac
her r
atio
, tea
cher
turn
over
rate
, num
ber
of m
ath
and
scie
nce
cour
ses
offe
red,
num
-be
r of o
ther
cou
rses
off
ered
, tot
al h
ours
insc
hool
yea
r, q
uant
ity o
f ins
truc
tion,
dis
cipl
i-na
ry ru
les,
abi
lity
grou
ping
Stud
ent:
Fath
er’s
occ
upat
ion
cate
gory
Tea
cher
/cla
ssro
om:
Cla
ss p
erce
ntag
e de
sig-
nate
d as
com
pens
ator
y ed
ucat
ion
stud
ents
,du
ratio
n an
d ch
arac
teri
stic
s of
inst
ruct
ion,
prep
arat
ion
time,
cla
ss s
ize
Stud
ent:
Gen
der,
mot
her’
s ed
ucat
ion,
fat
her’
sed
ucat
ion,
boo
ks in
the
hom
e, f
amily
inco
me,
hom
e ow
ners
hip,
roo
ms
per
fam
-ily
mem
ber,
hou
rs o
f in
stru
ctio
n in
mat
h,ho
urs
of in
stru
ctio
n in
rea
ding
, tea
cher
opin
ion
on s
tude
nt n
eed
for
com
pens
ator
yed
ucat
ion
Tea
cher
/cla
ssro
om:
Cla
ss s
ize
(con
tinu
ed)
at TEXAS SOUTHERN UNIVERSITY on October 18, 2014http://rer.aera.netDownloaded from
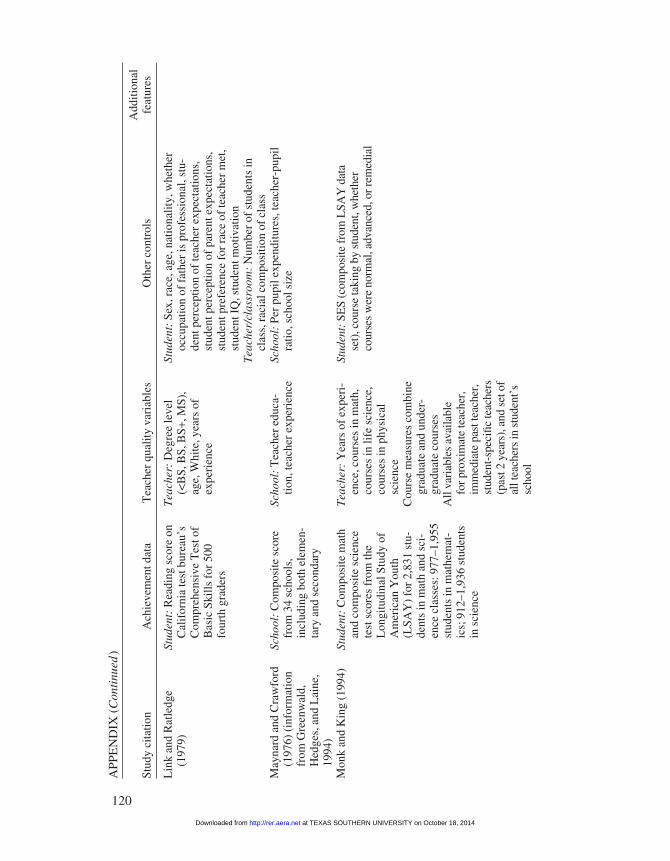
120
APP
EN
DIX
(C
onti
nued
)
Add
ition
alSt
udy
cita
tion
Ach
ieve
men
t dat
aT
each
er q
ualit
y va
riab
les
Oth
er c
ontr
ols
feat
ures
Stud
ent:
Rea
ding
sco
re o
nC
alif
orni
a te
st b
urea
u’s
Com
preh
ensi
ve T
est o
fB
asic
Ski
lls f
or 5
00fo
urth
gra
ders
Scho
ol:
Com
posi
te s
core
from
34
scho
ols,
incl
udin
g bo
th e
lem
en-
tary
and
sec
onda
ry
Stud
ent:
Com
posi
te m
ath
and
com
posi
te s
cien
cete
st s
core
s fr
om th
eL
ongi
tudi
nal S
tudy
of
Am
eric
an Y
outh
(LSA
Y)
for
2,83
1 st
u-de
nts
in m
ath
and
sci-
ence
cla
sses
: 977
–1,9
55st
uden
ts in
mat
hem
at-
ics;
912
–1,9
36 s
tude
nts
in s
cien
ce
Lin
k an
d R
atle
dge
(197
9)
May
nard
and
Cra
wfo
rd
(197
6) (
info
rmat
ion
from
Gre
enw
ald,
H
edge
s, a
nd L
aine
, 19
94)
Mon
k an
d K
ing
(199
4)
Tea
cher
:D
egre
e le
vel
(<B
S, B
S, B
S+, M
S),
age,
Whi
te, y
ears
of
expe
rien
ce
Scho
ol:
Tea
cher
edu
ca-
tion,
teac
her
expe
rien
ce
Tea
cher
:Y
ears
of
expe
ri-
ence
, cou
rses
in m
ath,
cour
ses
in li
fe s
cien
ce,
cour
ses
in p
hysi
cal
scie
nce
Cou
rse
mea
sure
s co
mbi
negr
adua
te a
nd u
nder
-gr
adua
te c
ours
esA
ll va
riab
les
avai
labl
e fo
r pro
xim
ate
teac
her,
imm
edia
te p
ast t
each
er,
stud
ent-
spec
ific
teac
hers
(pas
t 2 y
ears
), a
nd s
et o
fal
l tea
cher
s in
stu
dent
’ssc
hool
Stud
ent:
Sex,
rac
e, a
ge, n
atio
nalit
y, w
heth
eroc
cupa
tion
of f
athe
r is
pro
fess
iona
l, st
u-de
nt p
erce
ptio
n of
teac
her
expe
ctat
ions
,st
uden
t per
cept
ion
of p
aren
t exp
ecta
tions
,st
uden
t pre
fere
nce
for
race
of
teac
her
met
,st
uden
t IQ
, stu
dent
mot
ivat
ion
Tea
cher
/cla
ssro
om:
Num
ber
of s
tude
nts
incl
ass,
rac
ial c
ompo
sitio
n of
cla
ssSc
hool
:Pe
r pu
pil e
xpen
ditu
res,
teac
her-
pupi
lra
tio, s
choo
l siz
e
Stud
ent:
SES
(com
posi
te fr
om L
SAY
dat
ase
t), c
ours
e ta
king
by
stud
ent,
whe
ther
cour
ses
wer
e no
rmal
, adv
ance
d, o
r rem
edia
l
at TEXAS SOUTHERN UNIVERSITY on October 18, 2014http://rer.aera.netDownloaded from
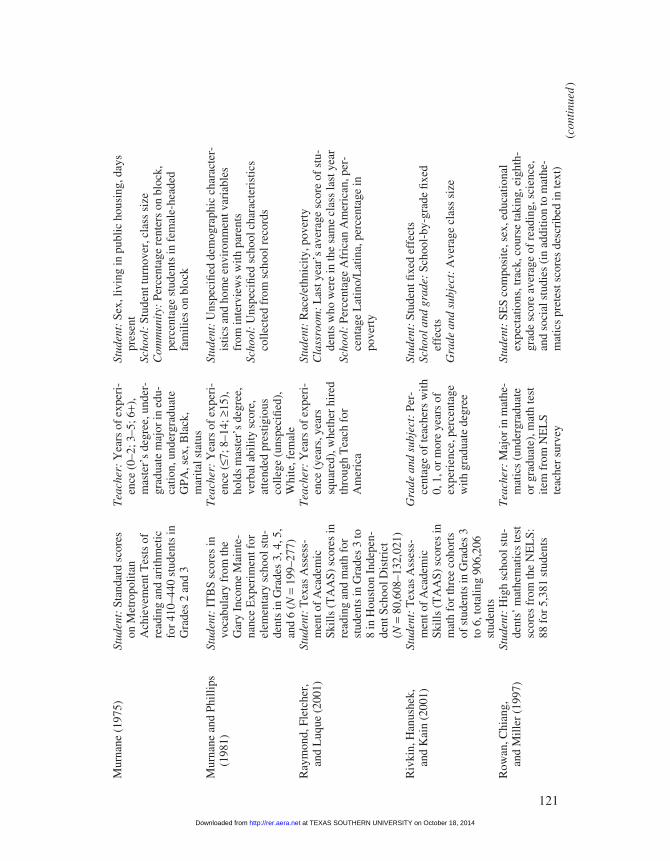
121
Stud
ent:
Stan
dard
sco
res
on M
etro
polit
anA
chie
vem
ent T
ests
of
read
ing
and
arith
met
icfo
r 41
0–44
0 st
uden
ts in
Gra
des
2 an
d 3
Stud
ent:
ITB
S sc
ores
invo
cabu
lary
fro
m th
eG
ary
Inco
me
Mai
nte-
nanc
e E
xper
imen
t for
elem
enta
ry s
choo
l stu
-de
nts
in G
rade
s 3,
4, 5
,an
d 6
(N=
199–
277)
Stud
ent:
Tex
as A
sses
s-m
ent o
f A
cade
mic
Skill
s (T
AA
S) s
core
s in
read
ing
and
mat
h fo
rst
uden
ts in
Gra
des
3 to
8 in
Hou
ston
Ind
epen
-de
nt S
choo
l Dis
tric
t (N
=80
,608
–132
,021
)St
uden
t:T
exas
Ass
ess-
men
t of
Aca
dem
icSk
ills
(TA
AS)
sco
res
inm
ath
for
thre
e co
hort
sof
stu
dent
s in
Gra
des
3to
6, t
otal
ing
906,
206
stud
ents
Stud
ent:
Hig
h sc
hool
stu
-de
nts’
mat
hem
atic
s te
stsc
ores
fro
m th
e N
EL
S:88
for
5,3
81 s
tude
nts
Mur
nane
(19
75)
Mur
nane
and
Phi
llips
(1
981)
Ray
mon
d, F
letc
her,
an
d L
uque
(20
01)
Riv
kin,
Han
ushe
k,
and
Kai
n (2
001)
Row
an, C
hian
g,
and
Mill
er (
1997
)
Tea
cher
:Y
ears
of
expe
ri-
ence
(0–
2; 3
–5; 6
+),
mas
ter’
s de
gree
, und
er-
grad
uate
maj
or in
edu
-ca
tion,
und
ergr
adua
teG
PA, s
ex, B
lack
, m
arita
l sta
tus
Tea
cher
:Y
ears
of
expe
ri-
ence
(≤7
; 8–1
4; ≥
15),
hold
s m
aste
r’s
degr
ee,
verb
al a
bilit
y sc
ore,
atte
nded
pre
stig
ious
colle
ge (
unsp
ecifi
ed),
Whi
te, f
emal
eT
each
er:
Yea
rs o
f ex
peri
-en
ce (
year
s, y
ears
squa
red)
, whe
ther
hir
edth
roug
h T
each
for
Am
eric
a
Gra
de a
nd s
ubje
ct:
Per-
cent
age
of te
ache
rs w
ith0,
1, o
r m
ore
year
s of
expe
rien
ce, p
erce
ntag
ew
ith g
radu
ate
degr
ee
Tea
cher
:M
ajor
in m
athe
-m
atic
s (u
nder
grad
uate
or g
radu
ate)
, mat
h te
stite
m f
rom
NE
LS
teac
her
surv
ey
Stud
ent:
Sex,
livi
ng in
pub
lic h
ousi
ng, d
ays
pres
ent
Scho
ol:
Stud
ent t
urno
ver,
cla
ss s
ize
Com
mun
ity:
Perc
enta
ge r
ente
rs o
n bl
ock,
perc
enta
ge s
tude
nts
in f
emal
e-he
aded
fa
mili
es o
n bl
ock
Stud
ent:
Uns
peci
fied
dem
ogra
phic
cha
ract
er-
istic
s an
d ho
me
envi
ronm
ent v
aria
bles
from
inte
rvie
ws
with
par
ents
Scho
ol:
Uns
peci
fied
scho
ol c
hara
cter
istic
sco
llect
ed f
rom
sch
ool r
ecor
ds
Stud
ent:
Rac
e/et
hnic
ity, p
over
tyC
lass
room
:L
ast y
ear’
s av
erag
e sc
ore
of s
tu-
dent
s w
ho w
ere
in th
e sa
me
clas
s la
st y
ear
Scho
ol:
Perc
enta
ge A
fric
an A
mer
ican
, per
-ce
ntag
e L
atin
o/L
atin
a, p
erce
ntag
e in
pove
rty
Stud
ent:
Stud
ent fi
xed
effe
cts
Scho
ol a
nd g
rade
:Sc
hool
-by-
grad
e fix
edef
fect
sG
rade
and
sub
ject
:A
vera
ge c
lass
siz
e
Stud
ent:
SES
com
posi
te, s
ex, e
duca
tiona
lex
pect
atio
ns, t
rack
, cou
rse
taki
ng, e
ight
h-gr
ade
scor
e av
erag
e of
rea
ding
, sci
ence
,an
d so
cial
stu
dies
(in
add
ition
to m
athe
-m
atic
s pr
etes
t sco
res
desc
ribe
d in
text
)(c
onti
nued
)
at TEXAS SOUTHERN UNIVERSITY on October 18, 2014http://rer.aera.netDownloaded from
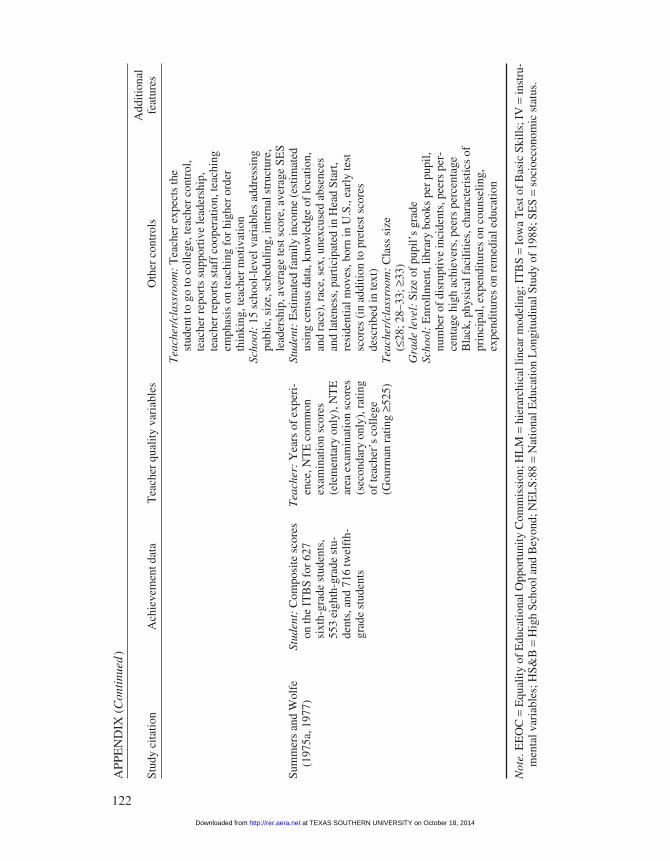
122
Sum
mer
s an
d W
olfe
(1
975a
, 197
7)
Not
e.E
EO
C =
Equ
ality
of
Edu
catio
nal O
ppor
tuni
ty C
omm
issi
on; H
LM
=hi
erar
chic
al li
near
mod
elin
g; I
TB
S =
Iow
a T
est o
f B
asic
Ski
lls; I
V =
inst
ru-
men
tal v
aria
bles
; HS&
B =
Hig
h Sc
hool
and
Bey
ond;
NE
LS:
88 =
Nat
iona
l Edu
catio
n L
ongi
tudi
nal S
tudy
of
1988
; SE
S =
soci
oeco
nom
ic s
tatu
s.
Stud
ent:
Com
posi
te s
core
son
the
ITB
S fo
r 62
7si
xth-
grad
e st
uden
ts,
553
eigh
th-g
rade
stu
-de
nts,
and
716
twel
fth-
grad
e st
uden
ts
Tea
cher
:Y
ears
of
expe
ri-
ence
, NT
E c
omm
onex
amin
atio
n sc
ores
(ele
men
tary
onl
y), N
TE
area
exa
min
atio
n sc
ores
(sec
onda
ry o
nly)
, rat
ing
of te
ache
r’s
colle
ge(G
ourm
an r
atin
g ≥5
25)
Tea
cher
/cla
ssro
om:
Tea
cher
exp
ects
the
stud
ent t
o go
to c
olle
ge, t
each
er c
ontr
ol,
teac
her
repo
rts
supp
ortiv
e le
ader
ship
,te
ache
r re
port
s st
aff
coop
erat
ion,
teac
hing
emph
asis
on
teac
hing
for
hig
her
orde
rth
inki
ng, t
each
er m
otiv
atio
nSc
hool
:15
sch
ool-
leve
l var
iabl
es a
ddre
ssin
gpu
blic
, siz
e, s
ched
ulin
g, in
tern
al s
truc
ture
,le
ader
ship
, ave
rage
test
sco
re, a
vera
ge S
ES
Stud
ent:
Est
imat
ed f
amily
inco
me
(est
imat
edus
ing
cens
us d
ata,
kno
wle
dge
of lo
catio
n,an
d ra
ce),
rac
e, s
ex, u
nexc
used
abs
ence
san
d la
tene
ss, p
artic
ipat
ed in
Hea
d St
art,
resi
dent
ial m
oves
, bor
n in
U.S
., ea
rly
test
scor
es (
in a
dditi
on to
pre
test
sco
res
desc
ribe
d in
text
)T
each
er/c
lass
room
:C
lass
siz
e (≤
28; 2
8–33
; ≥33
)G
rade
leve
l:Si
ze o
f pu
pil’
s gr
ade
Scho
ol:
Enr
ollm
ent,
libra
ry b
ooks
per
pup
il,nu
mbe
r of
dis
rupt
ive
inci
dent
s, p
eers
per
-ce
ntag
e hi
gh a
chie
vers
, pee
rs p
erce
ntag
eB
lack
, phy
sica
l fac
ilitie
s, c
hara
cter
istic
s of
prin
cipa
l, ex
pend
iture
s on
cou
nsel
ing,
expe
nditu
res
on r
emed
ial e
duca
tion
APP
EN
DIX
(C
onti
nued
)
Add
ition
alSt
udy
cita
tion
Ach
ieve
men
t dat
aT
each
er q
ualit
y va
riab
les
Oth
er c
ontr
ols
feat
ures
at TEXAS SOUTHERN UNIVERSITY on October 18, 2014http://rer.aera.netDownloaded from