Embed Size (px)
Citation preview
TEACHER ALLOCATION AND UTILIZATION IN AFRICA
MAY 2016
IIEP
Pô
le
de
Dak
ar
WORKING PAPER
2
Contents 1. Overview of the Issue ...................................................................................................................... 3
2. Quantitative Analysis of Teacher Allocation ................................................................................... 4
2.1. Teacher Allocation in Primary Education ................................................................................ 4
2.2. Teacher Allocation in Secondary Education .......................................................................... 11
3. Highly Variable National Teacher Allocation Practices ................................................................. 14
4. Questions to be Addressed ........................................................................................................... 15
International Institute for Educational Planning/Pôle de Dakar (IIEP - UNESCO)
The IIEP/Pôle de Dakar is a platform of expertise in education sector policy analysis. Founded in 2001, it has been providing expertise to African governments for over 15 years. The Pôle de Dakar’s activities contribute to UNESCO’s support for the development of effective, feasible, equitable and endogenous education policies in Africa.
The ideas and opinions expressed in this document are those of the authors; they do not necessarily reflect the
points of view of UNESCO or IIEP.
3
1. Overview of the Issue
Among the many challenges education systems in African countries are confronted with, achieving
equitable and efficient teacher allocation to schools is of considerable importance. The issue of teacher
allocation is inextricably linked to their actual utilization within schools, the ultimate objective being
to ascertain that everything is done to ensure pupils receive the number of contact hours required
throughout the school year, in favorable learning conditions.
Sector analyses carried out over recent years in many African countries reveal some serious equity
issues regarding teacher allocation. The Country Status Report (CSR) for Chad published in 2014 points
to the fact that public primary schools with approximately 600 pupils have between 3 and 15 teachers;
similarly, among schools with six teachers, enrollment can vary from 100 to 750 pupils. This situation,
which raises questions about teacher deployment and its consequences on the quality of learning, is
unfortunately common to several countries and has been persisting for decades.
As regards the actual utilization of teachers allocated to schools, only few teachers succeed in covering
the number of yearly pupil contact hours required. In Benin for example, a study of teaching time
carried out in 2012 in the primary cycle concluded that due to teacher strikes and other factors
disrupting the normal organization of the school year, teachers only managed to deliver 50 percent of
the number of contact hours expected of them (CSR Benin, 2012). Another study conducted a few
years earlier in 2006/07 on teaching time in Burkina Faso concluded that 40 percent of the statutory
number of lower secondary contact hours had not actually been dispensed (Study on the Effectiveness
of Academic Year 2006/07 – Monitoring the School Calendar). Furthermore, beyond these figures at
the national level, disparities between geographical areas and schools in some cases can be
considerable. The frequently criticized “ghost” teacher phenomenon, whereby teachers are
theoretically posted to a school but are not there in reality, contributes to a reduction in the
effectiveness of teacher allocation and the poor utilization of teachers, the consequence being the
inefficient use of public education expenditure.
In a context where the 2030 Agenda for education, in the framework of the Sustainable Development
goals (SDGs), sets the goal of “ensuring inclusive, equitable and quality education for all by 2030,” it is
crucial for teacher deployment to be driven by a quest for equity, effectiveness and efficiency to ensure
that no child be deprived of learning opportunities as a result of their area of residence or the school
they attend. Moreover, in a context where teachers account for the greatest proportion of recurrent
education expenditure (81 percent for primary education and 62 percent for lower secondary
education in Africa, on average), and are one of the keys to success of the 2030 Agenda, their equitable
and effective deployment seems necessary to limit further recruitment costs while rationalizing public
education expenditure.
The aim of this working paper is to outline the current situation with regard to teacher allocation and
utilization in the education systems of African countries. It examines current teacher allocation
practices (over-allocation, shortages, disparities), procedures currently used by countries to determine
teacher needs and the way in which education authorities address them. This paper also looks into the
hurdles which prevent the achievement of equitable allocation. Finally, it raises questions worthy of
debate so as to provide key information to policy makers, and which are useful to consider when
undertaking any attempt to amend teacher allocation procedures.
4
2. Quantitative Analysis of Teacher Allocation
This section aims to provide an overview of teacher allocation to schools in African countries based on
quantitative data on teachers in primary and secondary education (pupils, pedagogical groups and so
forth). The analysis takes into account only those teachers who are managed by and allocated to public
schools by government authorities. This section contains two parts, one for primary education and the
other for secondary education. Due to a lack of data on preprimary education, this sub-sector could
not be analyzed.
2.1. Teacher Allocation in Primary Education
Analysis of Pupil-Teacher Ratios (PTR)
Pupil-teacher ratios (PTR) for primary education are obtained by simply dividing the number of pupils
in the cycle by the number of teachers working in this cycle.1
Primary PTRs enable the analysis of at least two facets of teacher allocation:
i) The first is whether there are a sufficient number of government-managed teachers to
meet the demand for public education at the national level. Indeed, the calculation of the
PTR at the national level enables to determine the number of pupils per teacher in the
country at large and to observe whether governments have a sufficient number of
teachers relative to national standards. The PTR can of course be analyzed in terms of
teacher status, qualifications and preservice training if this data is available.
ii) Beyond this analysis at the national level (which tends to indicate a country’s capacity to
address teacher needs on a globally theoretical level), the second facet is to determine at
the deconcentrated level (by province, district, community and school) whether in view of
the average national PTR, teachers are allocated in a relatively equitable way throughout
the country, or whether there are major disparities by province, district, community,
school and so on. Equity in the distribution of teaching personnel is a crucial factor in the
effective use of public expenditure in the education sector.
At the national level, it is possible to see whether the number of government-managed teachers
allocated to public schools is sufficient for the country at large in view of education policy targets set
by the country’s policy makers. If the PTR is lower or equal to the set target, there is a sufficient number
of teachers (without taking into consideration teacher qualifications and training). On the other hand,
if the PTR is higher than the target set for the education system, there is a lack of teachers and the
education system should recruit more staff. Figure 1 presents the average national PTRs in public
primary education for some African countries.
1 Only teachers effectively in class are considered here, generally referred to as “chalk in hand” teachers.
5
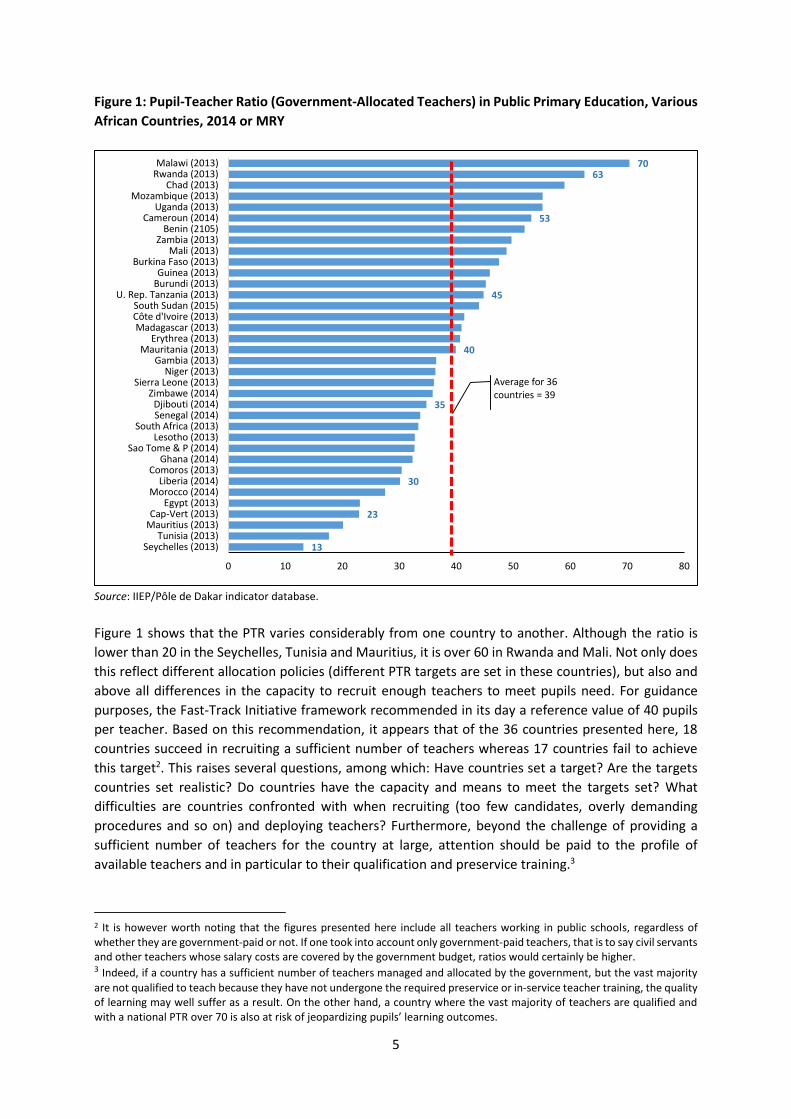
Figure 1: Pupil-Teacher Ratio (Government-Allocated Teachers) in Public Primary Education, Various
African Countries, 2014 or MRY
Source: IIEP/Pôle de Dakar indicator database.
Figure 1 shows that the PTR varies considerably from one country to another. Although the ratio is
lower than 20 in the Seychelles, Tunisia and Mauritius, it is over 60 in Rwanda and Mali. Not only does
this reflect different allocation policies (different PTR targets are set in these countries), but also and
above all differences in the capacity to recruit enough teachers to meet pupils need. For guidance
purposes, the Fast-Track Initiative framework recommended in its day a reference value of 40 pupils
per teacher. Based on this recommendation, it appears that of the 36 countries presented here, 18
countries succeed in recruiting a sufficient number of teachers whereas 17 countries fail to achieve
this target2. This raises several questions, among which: Have countries set a target? Are the targets
countries set realistic? Do countries have the capacity and means to meet the targets set? What
difficulties are countries confronted with when recruiting (too few candidates, overly demanding
procedures and so on) and deploying teachers? Furthermore, beyond the challenge of providing a
sufficient number of teachers for the country at large, attention should be paid to the profile of
available teachers and in particular to their qualification and preservice training.3
2 It is however worth noting that the figures presented here include all teachers working in public schools, regardless of whether they are government-paid or not. If one took into account only government-paid teachers, that is to say civil servants and other teachers whose salary costs are covered by the government budget, ratios would certainly be higher. 3 Indeed, if a country has a sufficient number of teachers managed and allocated by the government, but the vast majority
are not qualified to teach because they have not undergone the required preservice or in-service teacher training, the quality of learning may well suffer as a result. On the other hand, a country where the vast majority of teachers are qualified and with a national PTR over 70 is also at risk of jeopardizing pupils’ learning outcomes.
13
23
30
35
40
45
53
6370
0 10 20 30 40 50 60 70 80
Seychelles (2013)Tunisia (2013)
Mauritius (2013)Cap-Vert (2013)
Egypt (2013)Morocco (2014)
Liberia (2014)Comoros (2013)
Ghana (2014)Sao Tome & P (2014)
Lesotho (2013)South Africa (2013)
Senegal (2014)Djibouti (2014)
Zimbawe (2014)Sierra Leone (2013)
Niger (2013)Gambia (2013)
Mauritania (2013)Erythrea (2013)
Madagascar (2013)Côte d'Ivoire (2013)South Sudan (2015)
U. Rep. Tanzania (2013)Burundi (2013)Guinea (2013)
Burkina Faso (2013)Mali (2013)
Zambia (2013)Benin (2105)
Cameroun (2014)Uganda (2013)
Mozambique (2013)Chad (2013)
Rwanda (2013)Malawi (2013)
Average for 36 countries = 39
6
At sub-national level, other disparities in teacher allocation may appear. Indeed, a sufficient number
of teachers in the education system does not necessarily mean that their allocation among provinces,
districts, communities and schools is equitable. The average PTR at the national level can conceal
considerable disparities from one school to another, some schools being over-staffed (with PTRs
considerably lower than the national average), while others have a shortage of teachers (with PTRs
considerably higher than the national average). It thus suffices to calculate the PTR per geographical
area or per school to realize to what extent the values resemble or differ from the national average.
Table 1 presents the case of Uganda.
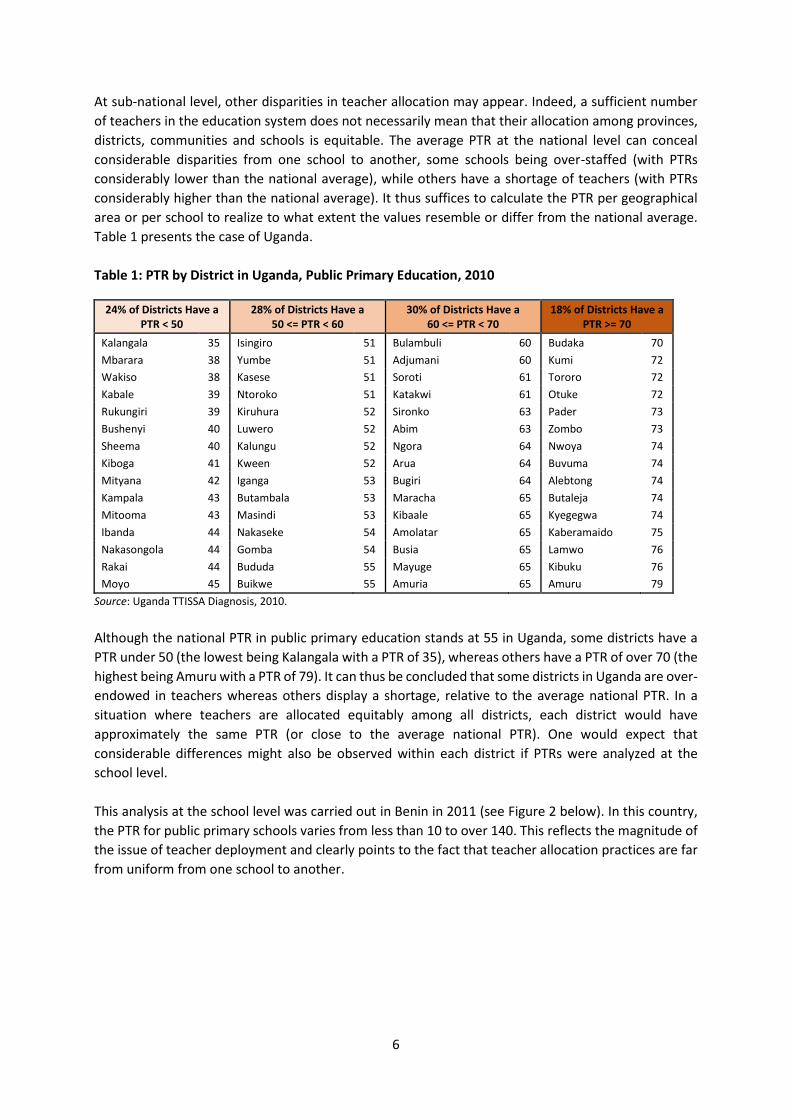
Table 1: PTR by District in Uganda, Public Primary Education, 2010
24% of Districts Have a PTR < 50
28% of Districts Have a 50 <= PTR < 60
30% of Districts Have a 60 <= PTR < 70
18% of Districts Have a PTR >= 70
Kalangala 35 Isingiro 51 Bulambuli 60 Budaka 70
Mbarara 38 Yumbe 51 Adjumani 60 Kumi 72
Wakiso 38 Kasese 51 Soroti 61 Tororo 72
Kabale 39 Ntoroko 51 Katakwi 61 Otuke 72
Rukungiri 39 Kiruhura 52 Sironko 63 Pader 73
Bushenyi 40 Luwero 52 Abim 63 Zombo 73
Sheema 40 Kalungu 52 Ngora 64 Nwoya 74
Kiboga 41 Kween 52 Arua 64 Buvuma 74
Mityana 42 Iganga 53 Bugiri 64 Alebtong 74
Kampala 43 Butambala 53 Maracha 65 Butaleja 74
Mitooma 43 Masindi 53 Kibaale 65 Kyegegwa 74
Ibanda 44 Nakaseke 54 Amolatar 65 Kaberamaido 75
Nakasongola 44 Gomba 54 Busia 65 Lamwo 76
Rakai 44 Bududa 55 Mayuge 65 Kibuku 76
Moyo 45 Buikwe 55 Amuria 65 Amuru 79
Source: Uganda TTISSA Diagnosis, 2010.
Although the national PTR in public primary education stands at 55 in Uganda, some districts have a
PTR under 50 (the lowest being Kalangala with a PTR of 35), whereas others have a PTR of over 70 (the
highest being Amuru with a PTR of 79). It can thus be concluded that some districts in Uganda are over-
endowed in teachers whereas others display a shortage, relative to the average national PTR. In a
situation where teachers are allocated equitably among all districts, each district would have
approximately the same PTR (or close to the average national PTR). One would expect that
considerable differences might also be observed within each district if PTRs were analyzed at the
school level.
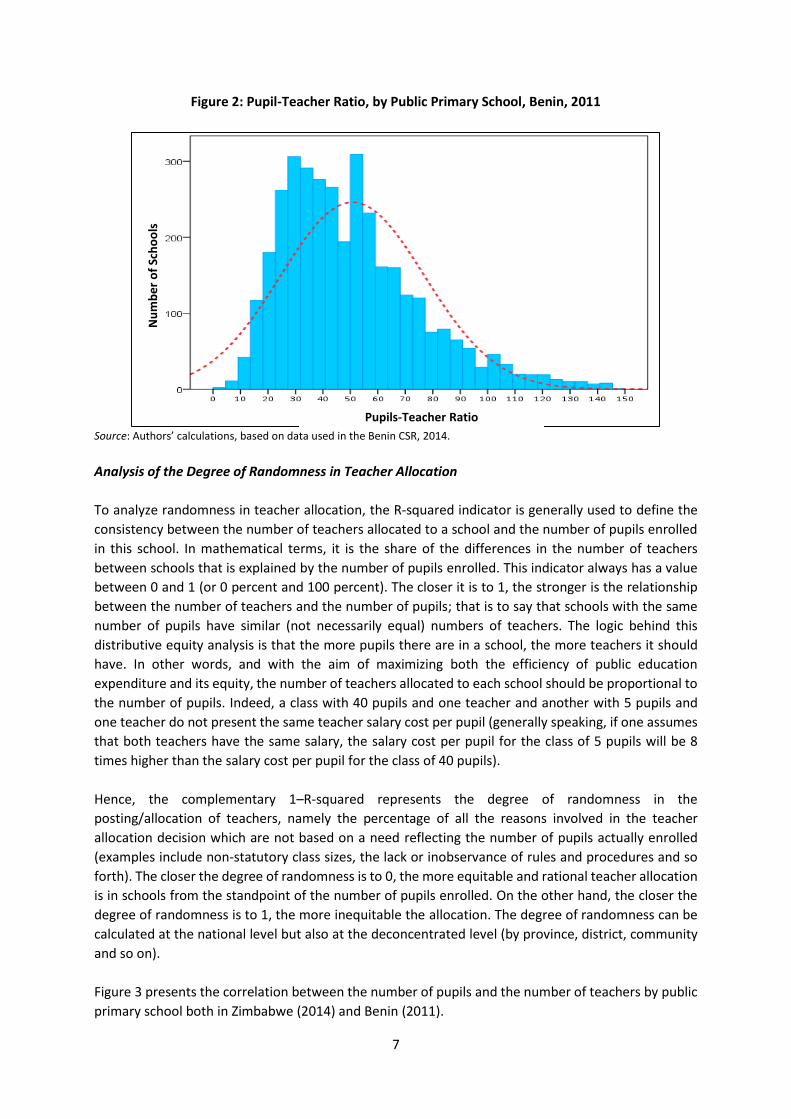
This analysis at the school level was carried out in Benin in 2011 (see Figure 2 below). In this country,
the PTR for public primary schools varies from less than 10 to over 140. This reflects the magnitude of
the issue of teacher deployment and clearly points to the fact that teacher allocation practices are far
from uniform from one school to another.
7
Figure 2: Pupil-Teacher Ratio, by Public Primary School, Benin, 2011
Source: Authors’ calculations, based on data used in the Benin CSR, 2014.
Analysis of the Degree of Randomness in Teacher Allocation
To analyze randomness in teacher allocation, the R-squared indicator is generally used to define the
consistency between the number of teachers allocated to a school and the number of pupils enrolled
in this school. In mathematical terms, it is the share of the differences in the number of teachers
between schools that is explained by the number of pupils enrolled. This indicator always has a value
between 0 and 1 (or 0 percent and 100 percent). The closer it is to 1, the stronger is the relationship
between the number of teachers and the number of pupils; that is to say that schools with the same
number of pupils have similar (not necessarily equal) numbers of teachers. The logic behind this
distributive equity analysis is that the more pupils there are in a school, the more teachers it should
have. In other words, and with the aim of maximizing both the efficiency of public education
expenditure and its equity, the number of teachers allocated to each school should be proportional to
the number of pupils. Indeed, a class with 40 pupils and one teacher and another with 5 pupils and
one teacher do not present the same teacher salary cost per pupil (generally speaking, if one assumes
that both teachers have the same salary, the salary cost per pupil for the class of 5 pupils will be 8
times higher than the salary cost per pupil for the class of 40 pupils).
Hence, the complementary 1–R-squared represents the degree of randomness in the
posting/allocation of teachers, namely the percentage of all the reasons involved in the teacher
allocation decision which are not based on a need reflecting the number of pupils actually enrolled
(examples include non-statutory class sizes, the lack or inobservance of rules and procedures and so
forth). The closer the degree of randomness is to 0, the more equitable and rational teacher allocation
is in schools from the standpoint of the number of pupils enrolled. On the other hand, the closer the
degree of randomness is to 1, the more inequitable the allocation. The degree of randomness can be
calculated at the national level but also at the deconcentrated level (by province, district, community
and so on).
Figure 3 presents the correlation between the number of pupils and the number of teachers by public
primary school both in Zimbabwe (2014) and Benin (2011).
Pupils-Teacher Ratio
Nu
mb
er
of
Sch
oo
ls
8
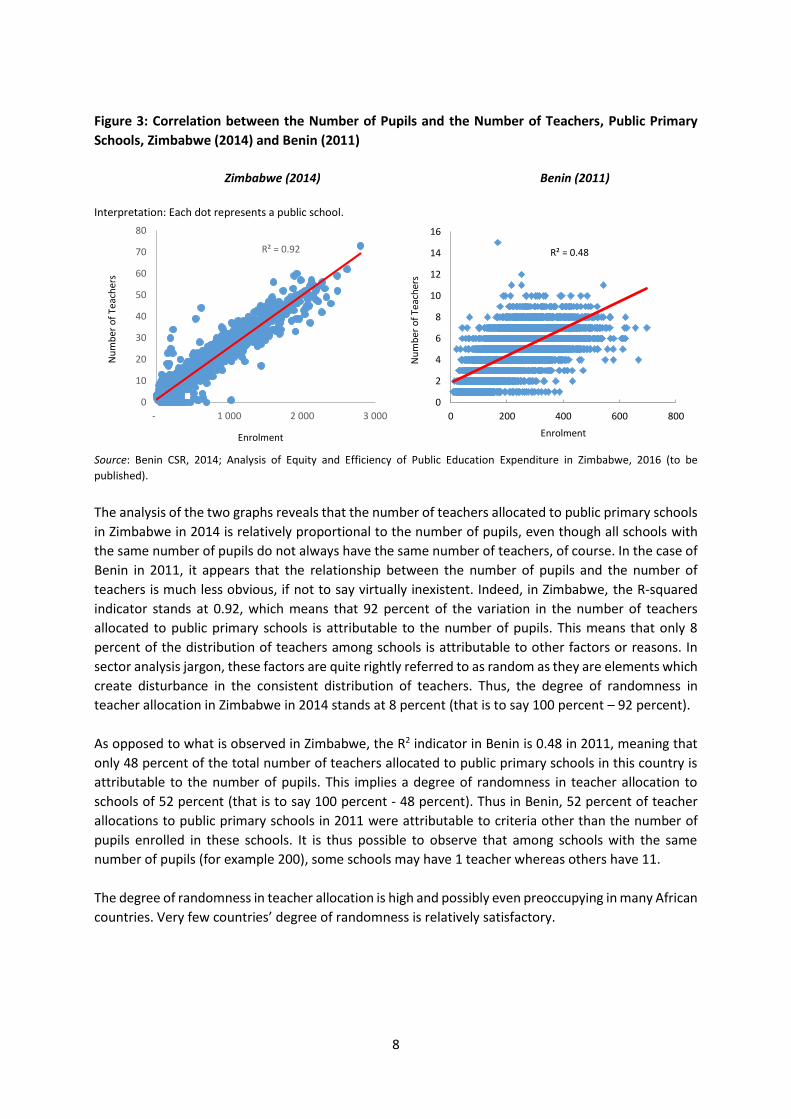
Figure 3: Correlation between the Number of Pupils and the Number of Teachers, Public Primary
Schools, Zimbabwe (2014) and Benin (2011)
Zimbabwe (2014) Benin (2011)
Interpretation: Each dot represents a public school.
Source: Benin CSR, 2014; Analysis of Equity and Efficiency of Public Education Expenditure in Zimbabwe, 2016 (to be
published).
The analysis of the two graphs reveals that the number of teachers allocated to public primary schools
in Zimbabwe in 2014 is relatively proportional to the number of pupils, even though all schools with
the same number of pupils do not always have the same number of teachers, of course. In the case of
Benin in 2011, it appears that the relationship between the number of pupils and the number of
teachers is much less obvious, if not to say virtually inexistent. Indeed, in Zimbabwe, the R-squared
indicator stands at 0.92, which means that 92 percent of the variation in the number of teachers
allocated to public primary schools is attributable to the number of pupils. This means that only 8
percent of the distribution of teachers among schools is attributable to other factors or reasons. In
sector analysis jargon, these factors are quite rightly referred to as random as they are elements which
create disturbance in the consistent distribution of teachers. Thus, the degree of randomness in
teacher allocation in Zimbabwe in 2014 stands at 8 percent (that is to say 100 percent – 92 percent).
As opposed to what is observed in Zimbabwe, the R2 indicator in Benin is 0.48 in 2011, meaning that
only 48 percent of the total number of teachers allocated to public primary schools in this country is
attributable to the number of pupils. This implies a degree of randomness in teacher allocation to
schools of 52 percent (that is to say 100 percent - 48 percent). Thus in Benin, 52 percent of teacher
allocations to public primary schools in 2011 were attributable to criteria other than the number of
pupils enrolled in these schools. It is thus possible to observe that among schools with the same
number of pupils (for example 200), some schools may have 1 teacher whereas others have 11.
The degree of randomness in teacher allocation is high and possibly even preoccupying in many African
countries. Very few countries’ degree of randomness is relatively satisfactory.
R² = 0.92
0
10
20
30
40
50
60
70
80
- 1 000 2 000 3 000
Nu
mb
ero
f Te
ach
ers
Enrolment
R² = 0.48
0
2
4
6
8
10
12
14
16
0 200 400 600 800N
um
ber
of
Teac
her
s
Enrolment
9
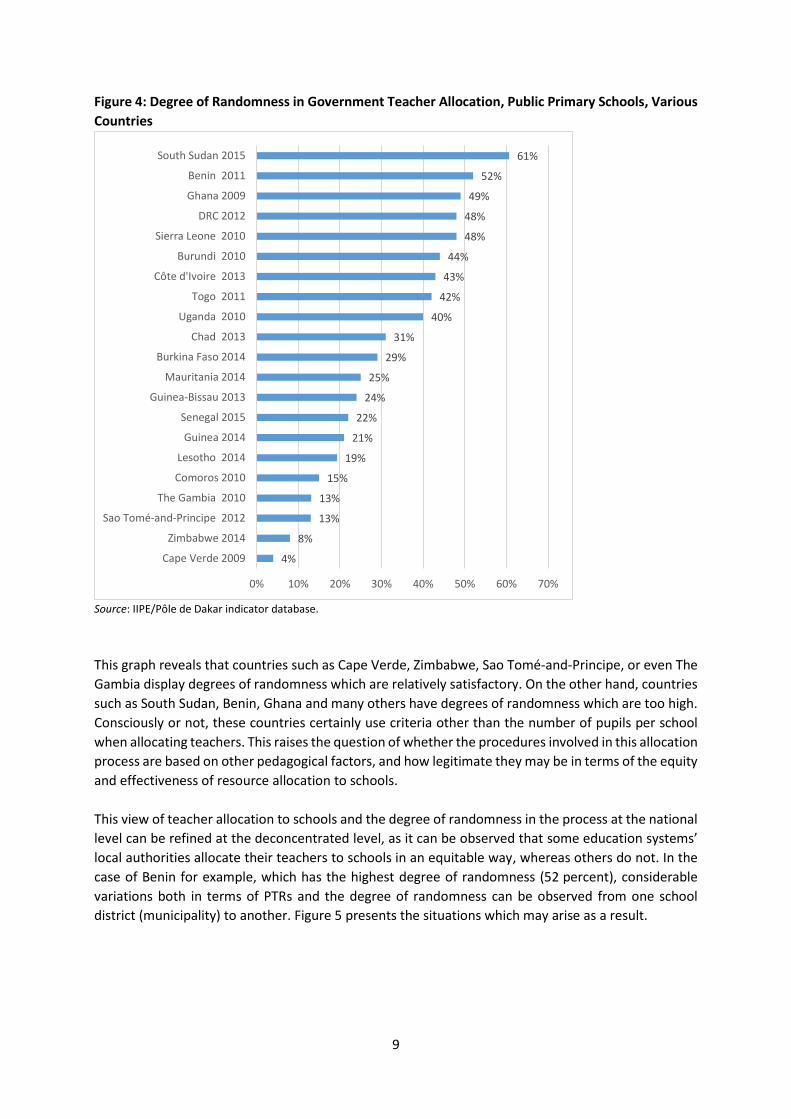
Figure 4: Degree of Randomness in Government Teacher Allocation, Public Primary Schools, Various
Countries
Source: IIPE/Pôle de Dakar indicator database.
This graph reveals that countries such as Cape Verde, Zimbabwe, Sao Tomé-and-Principe, or even The
Gambia display degrees of randomness which are relatively satisfactory. On the other hand, countries
such as South Sudan, Benin, Ghana and many others have degrees of randomness which are too high.
Consciously or not, these countries certainly use criteria other than the number of pupils per school
when allocating teachers. This raises the question of whether the procedures involved in this allocation
process are based on other pedagogical factors, and how legitimate they may be in terms of the equity
and effectiveness of resource allocation to schools.
This view of teacher allocation to schools and the degree of randomness in the process at the national
level can be refined at the deconcentrated level, as it can be observed that some education systems’
local authorities allocate their teachers to schools in an equitable way, whereas others do not. In the
case of Benin for example, which has the highest degree of randomness (52 percent), considerable
variations both in terms of PTRs and the degree of randomness can be observed from one school
district (municipality) to another. Figure 5 presents the situations which may arise as a result.
4%
8%
13%
13%
15%
19%
21%
22%
24%
25%
29%
31%
40%
42%
43%
44%
48%
48%
49%
52%
61%
0% 10% 20% 30% 40% 50% 60% 70%
Cape Verde 2009
Zimbabwe 2014
Sao Tomé-and-Principe 2012
The Gambia 2010
Comoros 2010
Lesotho 2014
Guinea 2014
Senegal 2015
Guinea-Bissau 2013
Mauritania 2014
Burkina Faso 2014
Chad 2013
Uganda 2010
Togo 2011
Côte d'Ivoire 2013
Burundi 2010
Sierra Leone 2010
DRC 2012
Ghana 2009
Benin 2011
South Sudan 2015
10
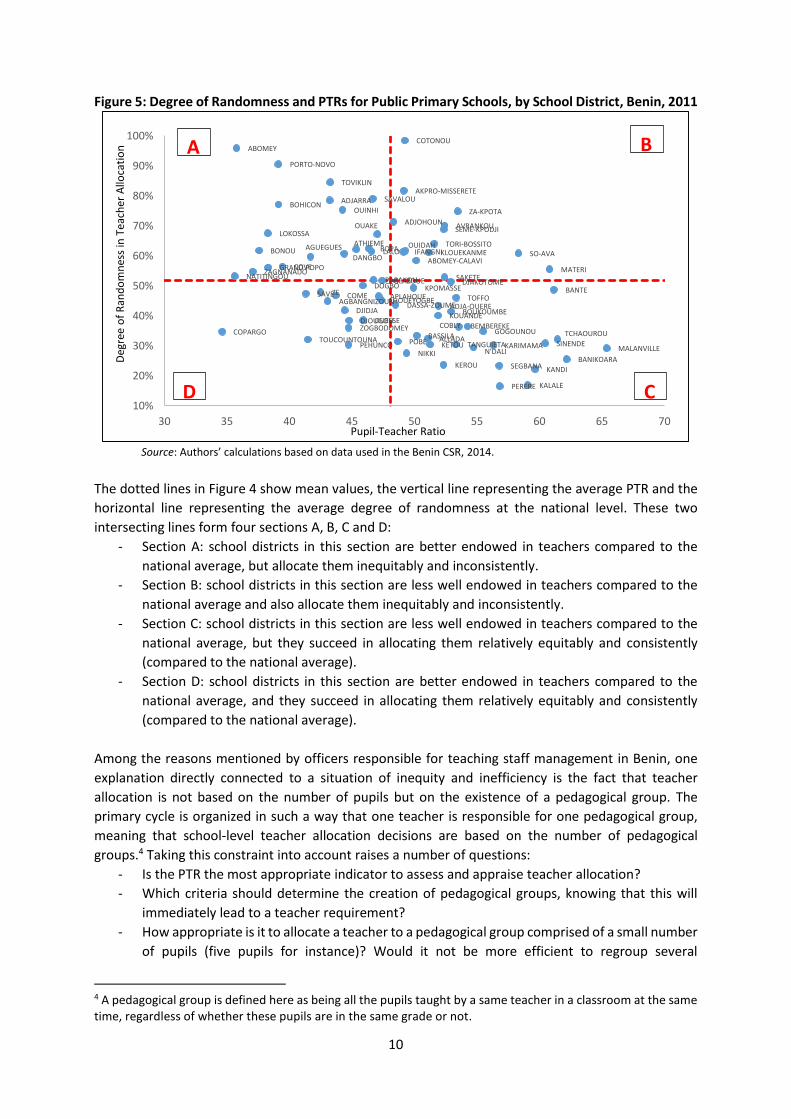
Figure 5: Degree of Randomness and PTRs for Public Primary Schools, by School District, Benin, 2011
Source: Authors’ calculations based on data used in the Benin CSR, 2014.
The dotted lines in Figure 4 show mean values, the vertical line representing the average PTR and the
horizontal line representing the average degree of randomness at the national level. These two
intersecting lines form four sections A, B, C and D:
- Section A: school districts in this section are better endowed in teachers compared to the
national average, but allocate them inequitably and inconsistently.
- Section B: school districts in this section are less well endowed in teachers compared to the
national average and also allocate them inequitably and inconsistently.
- Section C: school districts in this section are less well endowed in teachers compared to the
national average, but they succeed in allocating them relatively equitably and consistently
(compared to the national average).
- Section D: school districts in this section are better endowed in teachers compared to the
national average, and they succeed in allocating them relatively equitably and consistently
(compared to the national average).
Among the reasons mentioned by officers responsible for teaching staff management in Benin, one
explanation directly connected to a situation of inequity and inefficiency is the fact that teacher
allocation is not based on the number of pupils but on the existence of a pedagogical group. The
primary cycle is organized in such a way that one teacher is responsible for one pedagogical group,
meaning that school-level teacher allocation decisions are based on the number of pedagogical
groups.4 Taking this constraint into account raises a number of questions:
- Is the PTR the most appropriate indicator to assess and appraise teacher allocation?
- Which criteria should determine the creation of pedagogical groups, knowing that this will
immediately lead to a teacher requirement?
- How appropriate is it to allocate a teacher to a pedagogical group comprised of a small number
of pupils (five pupils for instance)? Would it not be more efficient to regroup several
4 A pedagogical group is defined here as being all the pupils taught by a same teacher in a classroom at the same time, regardless of whether these pupils are in the same grade or not.
ABOMEY
ABOMEY-CALAVI
ADJA-OUERE
ADJARRA
ADJOHOUN
AGBANGNIZOUN
AGUEGUES
AKPRO-MISSERETE
ALLADA
APLAHOUE
ATHIEME
AVRANKOU
BANIKOARA
BANTE
BASSILABEMBEREKE
BOHICON
BONOU BOPA
BOUKOUMBE
COBLY
COME
COPARGO
COTONOU
COVEDANGBO
DASSA-ZOUME
DJAKOTOME
DJIDJA
DJOUGOU
DOGBOGLAZOUE
GOGOUNOU
GRAND POPO
HOUEYOGBE
IFANGNI
KALALE
KANDI
KARIMAMA
KEROU
KETOU
KLOUEKANME
KOUANDE
KPOMASSE
LALO
LOKOSSA
MALANVILLE
MATERINATITINGOU
N'DALINIKKI
OUAKE
OUESSE
OUIDAH
OUINHI
PARAKOU
PEHUNCO
PERERE
POBE
PORTO-NOVO
SAKETE
SAVALOU
SAVE
SEGBANA
SEME-KPODJI
SINENDE
SO-AVA
TANGUIETA
TCHAOUROU
TOFFO
TORI-BOSSITO
TOUCOUNTOUNA
TOVIKLIN
ZAGNANADO
ZA-KPOTA
ZE
ZOGBODOMEY
10%
20%
30%
40%
50%
60%
70%
80%
90%
100%
30 35 40 45 50 55 60 65 70
A B
Deg
ree
of
Ran
do
mn
ess
in T
each
er A
lloca
tio
n
Pupil-Teacher Ratio
CD
11
pedagogical groups with few pupils, so as to create one single class with one single teacher,
especially in sparsely populated rural areas?
Addressing the issue of the criteria used to create one class with one teacher based on a pedagogical
group takes on even greater importance when it is noted for example that in Chad in 2014, schools
with the same number of pupils do not have the same number of pedagogical groups, and thus do not
formulate the same teacher requirements.
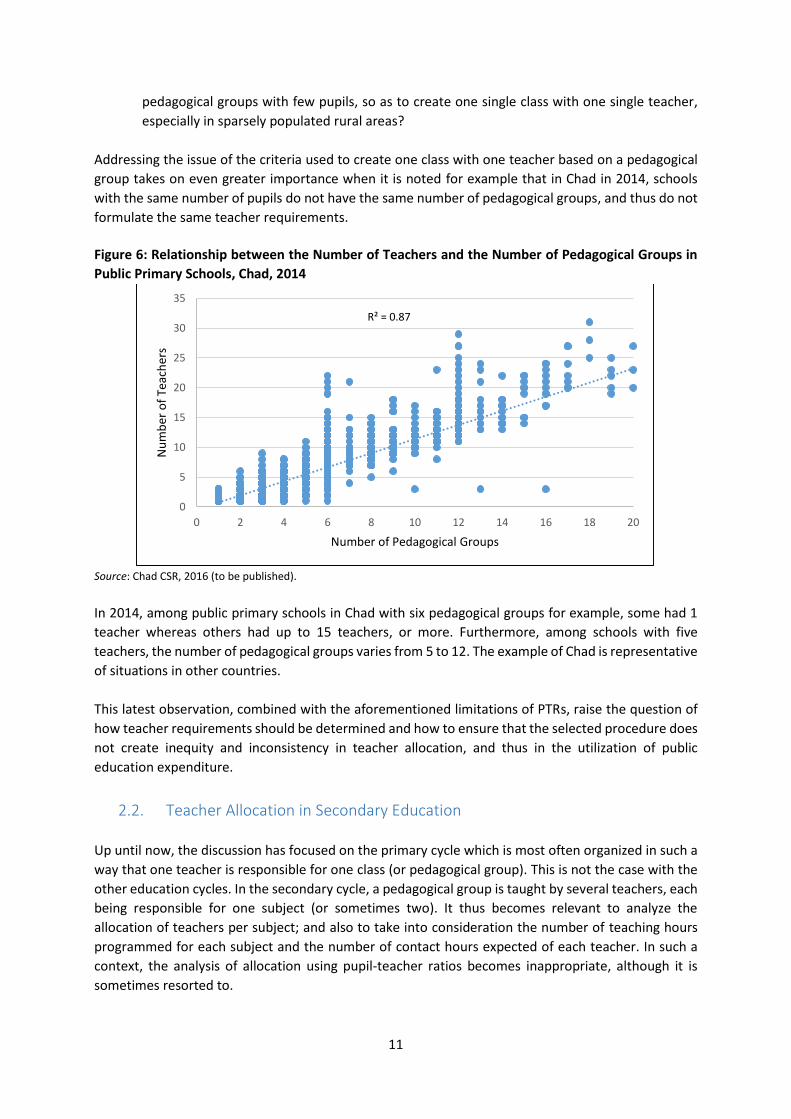
Figure 6: Relationship between the Number of Teachers and the Number of Pedagogical Groups in
Public Primary Schools, Chad, 2014
Source: Chad CSR, 2016 (to be published).
In 2014, among public primary schools in Chad with six pedagogical groups for example, some had 1
teacher whereas others had up to 15 teachers, or more. Furthermore, among schools with five
teachers, the number of pedagogical groups varies from 5 to 12. The example of Chad is representative
of situations in other countries.
This latest observation, combined with the aforementioned limitations of PTRs, raise the question of
how teacher requirements should be determined and how to ensure that the selected procedure does
not create inequity and inconsistency in teacher allocation, and thus in the utilization of public
education expenditure.
2.2. Teacher Allocation in Secondary Education
Up until now, the discussion has focused on the primary cycle which is most often organized in such a
way that one teacher is responsible for one class (or pedagogical group). This is not the case with the
other education cycles. In the secondary cycle, a pedagogical group is taught by several teachers, each
being responsible for one subject (or sometimes two). It thus becomes relevant to analyze the
allocation of teachers per subject; and also to take into consideration the number of teaching hours
programmed for each subject and the number of contact hours expected of each teacher. In such a
context, the analysis of allocation using pupil-teacher ratios becomes inappropriate, although it is
sometimes resorted to.
R² = 0.87
0
5
10
15
20
25
30
35
0 2 4 6 8 10 12 14 16 18 20
Nu
mb
er o
f Te
ach
ers
Number of Pedagogical Groups
12
An approach which seems more appropriate for the analysis of teacher allocation in the secondary
cycle is to compare whether the total number of teaching hours that teachers can deliver succeeds in
covering the number of contact hours pedagogical groups are entitled to in each subject. Here again,
the analysis is often difficult to conduct due to the fact that adequate data is not often collected. At
best, it is possible to examine whether the total number of teaching hours covers the total number of
contact hours due to pupils (and more precisely to pedagogical groups), all subjects combined. Table
2 illustrates the situation in three countries: Chad, Côte d’Ivoire and Uganda.
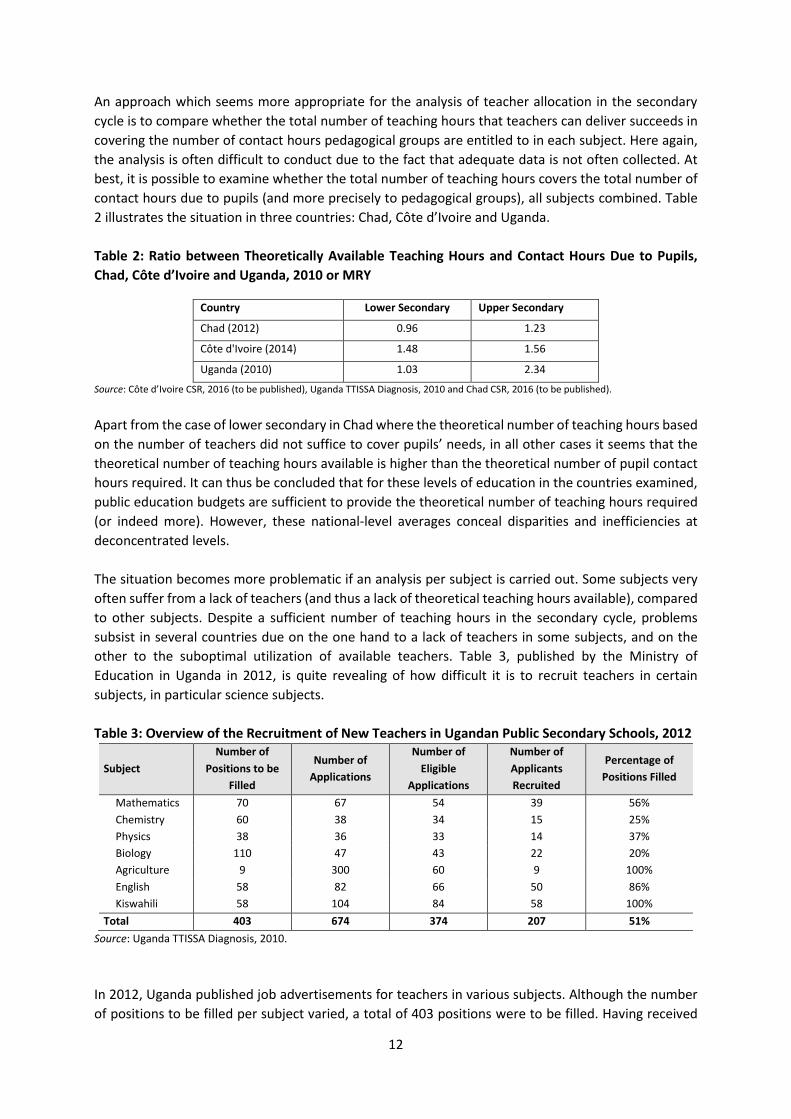
Table 2: Ratio between Theoretically Available Teaching Hours and Contact Hours Due to Pupils,
Chad, Côte d’Ivoire and Uganda, 2010 or MRY
Country Lower Secondary Upper Secondary
Chad (2012) 0.96 1.23
Côte d'Ivoire (2014) 1.48 1.56
Uganda (2010) 1.03 2.34
Source: Côte d’Ivoire CSR, 2016 (to be published), Uganda TTISSA Diagnosis, 2010 and Chad CSR, 2016 (to be published).
Apart from the case of lower secondary in Chad where the theoretical number of teaching hours based
on the number of teachers did not suffice to cover pupils’ needs, in all other cases it seems that the
theoretical number of teaching hours available is higher than the theoretical number of pupil contact
hours required. It can thus be concluded that for these levels of education in the countries examined,
public education budgets are sufficient to provide the theoretical number of teaching hours required
(or indeed more). However, these national-level averages conceal disparities and inefficiencies at
deconcentrated levels.
The situation becomes more problematic if an analysis per subject is carried out. Some subjects very
often suffer from a lack of teachers (and thus a lack of theoretical teaching hours available), compared
to other subjects. Despite a sufficient number of teaching hours in the secondary cycle, problems
subsist in several countries due on the one hand to a lack of teachers in some subjects, and on the
other to the suboptimal utilization of available teachers. Table 3, published by the Ministry of
Education in Uganda in 2012, is quite revealing of how difficult it is to recruit teachers in certain
subjects, in particular science subjects.
Table 3: Overview of the Recruitment of New Teachers in Ugandan Public Secondary Schools, 2012
Subject
Number of
Positions to be
Filled
Number of
Applications
Number of
Eligible
Applications
Number of
Applicants
Recruited
Percentage of
Positions Filled
Mathematics 70 67 54 39 56%
Chemistry 60 38 34 15 25%
Physics 38 36 33 14 37%
Biology 110 47 43 22 20%
Agriculture 9 300 60 9 100%
English 58 82 66 50 86%
Kiswahili 58 104 84 58 100%
Total 403 674 374 207 51%
Source: Uganda TTISSA Diagnosis, 2010.
In 2012, Uganda published job advertisements for teachers in various subjects. Although the number
of positions to be filled per subject varied, a total of 403 positions were to be filled. Having received
13
applications (674 in total), analyzed these applications to identify eligible candidates (374 in total) and
interviewed the latter, only 270 positions could be filled (hence 51 percent). Apart from Agriculture
and Kiswahili for which 100 percent of the positions were filled, positions remained vacant in all the
other subjects. Although for literary subjects the number of eligible applicants was greater than the
number of positions, for science subjects the number of eligible applicants was lower than the number
of positions to be filled.
In such a context of teacher scarcity in certain subjects, it is highly likely that disparities will occur in
terms of deployment (measured here by the R2 between the number of theoretical teaching hours and
the number of required pupil contact hours). Figure 7 shows the degree of randomness in teacher
allocation in public secondary education in Togo.
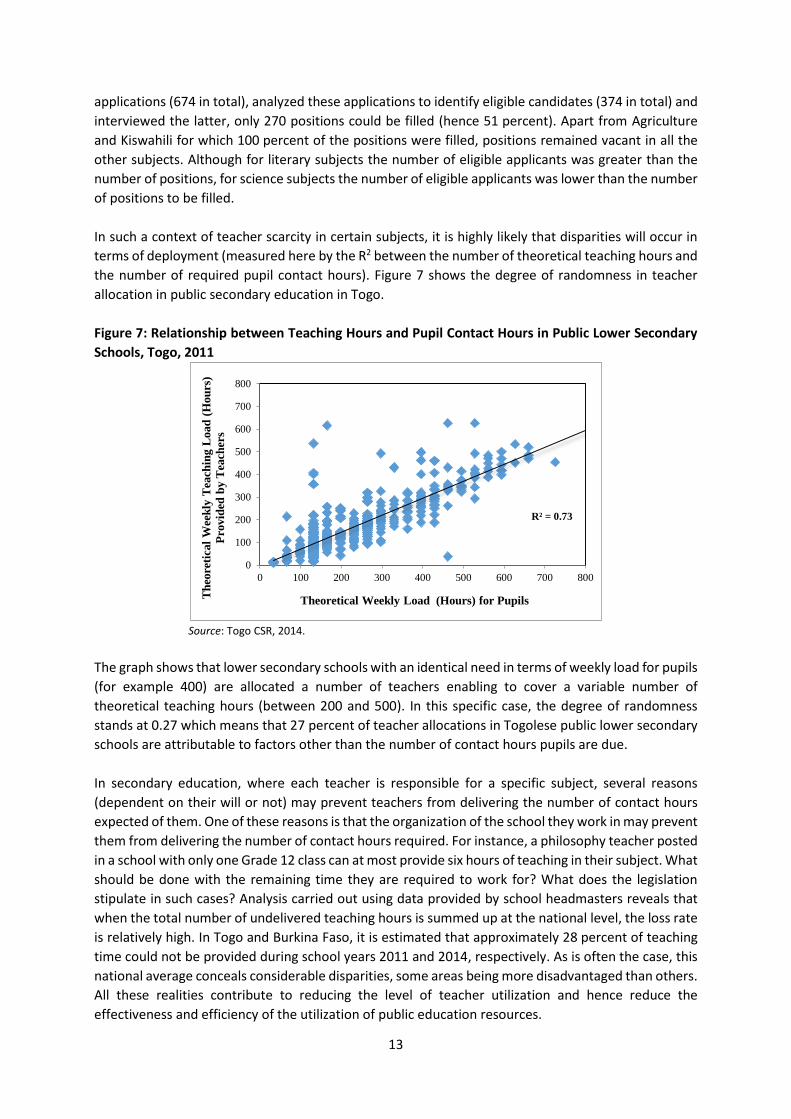
Figure 7: Relationship between Teaching Hours and Pupil Contact Hours in Public Lower Secondary
Schools, Togo, 2011
Source: Togo CSR, 2014.
The graph shows that lower secondary schools with an identical need in terms of weekly load for pupils
(for example 400) are allocated a number of teachers enabling to cover a variable number of
theoretical teaching hours (between 200 and 500). In this specific case, the degree of randomness
stands at 0.27 which means that 27 percent of teacher allocations in Togolese public lower secondary
schools are attributable to factors other than the number of contact hours pupils are due.
In secondary education, where each teacher is responsible for a specific subject, several reasons
(dependent on their will or not) may prevent teachers from delivering the number of contact hours
expected of them. One of these reasons is that the organization of the school they work in may prevent
them from delivering the number of contact hours required. For instance, a philosophy teacher posted
in a school with only one Grade 12 class can at most provide six hours of teaching in their subject. What
should be done with the remaining time they are required to work for? What does the legislation
stipulate in such cases? Analysis carried out using data provided by school headmasters reveals that
when the total number of undelivered teaching hours is summed up at the national level, the loss rate
is relatively high. In Togo and Burkina Faso, it is estimated that approximately 28 percent of teaching
time could not be provided during school years 2011 and 2014, respectively. As is often the case, this
national average conceals considerable disparities, some areas being more disadvantaged than others.
All these realities contribute to reducing the level of teacher utilization and hence reduce the
effectiveness and efficiency of the utilization of public education resources.
R² = 0.73
0
100
200
300
400
500
600
700
800
0 100 200 300 400 500 600 700 800
Theoretical Weekly Load (Hours) for PupilsTh
eore
tica
lW
eek
ly T
each
ing
Load
(H
ou
rs)
Pro
vid
ed b
y T
each
ers
14
3. Highly Variable National Teacher Allocation Practices
With more than 14 years’ experience in education sector analysis on the African continent, the
IIEP/Pôle de Dakar was able to observe certain differences in teacher allocation practices. In brief,
these differences fall into three categories: practices lacking rationality, rational practices and
intermediate practices:
Practices lacking rationality: this is the case of countries where there do not seem to be any
clear rules pertaining to the posting of teachers. In other words, the determination of teacher
requirements is based on declarations by education officers only. Current monitoring
procedures do not question the needs formulated. The drawback here is that this apparent
absence of rules means that players act as they see fit. In this way, two education officers faced
with the same situation may express different teacher requirements, which inevitably leads to
a lack of consistency in teacher allocation.
Rational practices: this is the case of countries where clear and precise rules and tools exist,
and are used and complied with. By applying these rules, anyone can calculate without
ambiguity how many teachers a school needs to function according to set standards. In these
situations, there is very often a fixed formula which education officers simply apply.
Furthermore, the practice is even stricter and cannot be circumvented when a teacher
allocation support tool is programmed strictly in compliance with this rule (for example:
posting a teacher to School A will not proceed and be approved if the tool does not confirm
the need for a teacher in School A).
Intermediate practices: this is the case of countries who do not fit into either of the previous
categories. In other words, rules exist, but their application leaves room for interpretation.
Thus, when faced with a same situation, two education officers could express different teacher
requirements. Or else, they may interpret the rules in the same way but the management tool
still allows the allocation of teachers to schools where they are not needed.
Depending on which of the three situations it finds itself in, each country shall have to take different
measures to bolster or correct teacher allocation procedures. When confronted with extreme and
widespread laxity, it would be appropriate to place emphasis both on the need to establish rules and
procedures which are shared with and understood by all stakeholders, as well as insist on their strict
application. If on the other hand rules and procedures exist but are only loosely applied, in-depth
analysis of the underlying reasons for these implementation difficulties should be carried out. It is
interesting to note the fact that comparisons of teacher allocation situations that should exist
considering statutory texts, and the effective allocation situations observed in the field frequently
reveal disparities. Figure 8 presents the case of Uganda in 2010.
15
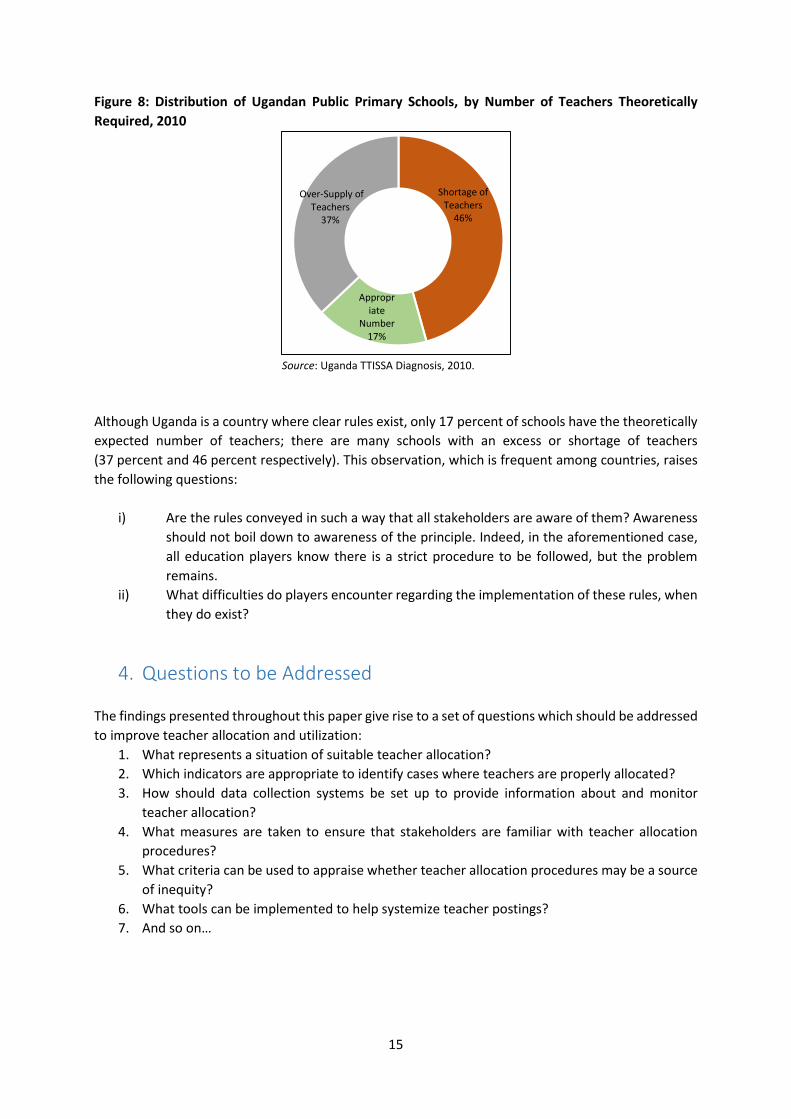
Figure 8: Distribution of Ugandan Public Primary Schools, by Number of Teachers Theoretically
Required, 2010
Source: Uganda TTISSA Diagnosis, 2010.
Although Uganda is a country where clear rules exist, only 17 percent of schools have the theoretically
expected number of teachers; there are many schools with an excess or shortage of teachers
(37 percent and 46 percent respectively). This observation, which is frequent among countries, raises
the following questions:
i) Are the rules conveyed in such a way that all stakeholders are aware of them? Awareness
should not boil down to awareness of the principle. Indeed, in the aforementioned case,
all education players know there is a strict procedure to be followed, but the problem
remains.
ii) What difficulties do players encounter regarding the implementation of these rules, when
they do exist?
4. Questions to be Addressed
The findings presented throughout this paper give rise to a set of questions which should be addressed
to improve teacher allocation and utilization:
1. What represents a situation of suitable teacher allocation?
2. Which indicators are appropriate to identify cases where teachers are properly allocated?
3. How should data collection systems be set up to provide information about and monitor
teacher allocation?
4. What measures are taken to ensure that stakeholders are familiar with teacher allocation
procedures?
5. What criteria can be used to appraise whether teacher allocation procedures may be a source
of inequity?
6. What tools can be implemented to help systemize teacher postings?
7. And so on…
Shortage of Teachers
46%
Appropriate
Number17%
Over-Supply of Teachers
37%