Embed Size (px)
Citation preview

— 1 —
T E A C H E R A C T i v i T i E s A n d L E s s o n sP A C K E T
“Transportation accounts for 45% of Santa Cruz County’s greenhouse gas emissions”
—2009 County Commission on the Environment
A Safe Routes to School Program of Ecology Action
- a local environmental non-profit in Santa Cruz since 1970.
http://www.ecoact.org/Programs/Transportation 831-426-5925 x144

— 2 —
Index
Mapping Your Route (Social Studies, Geography) .................................................... 3
Calculating Bicycling Benefits (Computer, Math) .................................................. 4
investigating Global Warming: a hands-on experiment (Science) ....................... 6
Figure Your Miles per Gallon and Co2 Emissions (Math) .................................... 8
Counting the Costs of Transportation (Math, Social Studies) ................................ 10
Trees, Cars, and Co2 (Science, Math) ................................................................. 12
sources & sinks: Energy Use and Global Climate (Science, Social Studies, Math) . 18

— 3 —
Mapping Your RouteStudents will learn how to map a route, read a scale, and compute route distance.
Choose a Safe Route: Choosing a safe cycling or walking route requires careful consideration. Explain to students that a route that is safest for cyclists and pedestrians often is not the most direct and may not be the way that they currently get to school. In planning a route for Bike ‘n Hike, have students look for streets with sidewalks, bike lanes, stops signs, crossing guards and lights. Encourage them to stay away from busy streets -- to choose streets less traveled by cars.
Map your route manually: Explain to the class how they can measure distance on a map using the scale; demonstrate with a string. Divide the class into groups and give each group a neighborhood map or use the large wall map we provide and some string. Have them find their house in relation to the school and mea-sure the distance with the string. Then, have them convert the distance to scale to obtain the actual distance between home and school. Students should write their “commute distance” on their mileage tracking sheets.
Map your route electronically at home: Instruct the students to use a web site to calculate the distance between home and school. All sites provide direction instructions, a map of the route, and the distance. Students can also view a satellite image of their map with their route imposed on the image – this is a fun, interactive tool. Here are some sites students can use:
• http://www.mapquest.com: use the “get directions” tab and include address, city and state
• http://maps.yahoo.com: use the “get map and directions” tab and include address, city, and state.
• http://maps.google.com: use the “get directions” tab and include the address, city, and state. You can also choose the ‘walking’ option in this window.
disCUssion:
Why is the scale on a map important?It allows you to calculate distance in the “real world.”
How might mapping manually be more accurate than mapping electronically?Mapping electronically does not account for each individual’s route.
Do the web sites all choose the same route? No. Sometimes each different web site chooses a unique route and reports different distances (even for the same route!).

— 4 —
Calculating Bicycling Benefits Students will develop computer skills by calculating the benefits of bicycling with online calculators.
Calculate the benefits of cycling online: Explain that there are many benefits of cycling (see the “Back-ground” section for more information). Ask the students to use the internet and use the “calculators” to quan-tify the benefits of bicycling using these sites. Have them record the data they entered and the calculations that were produced by the online calculator. The information will be the same for students that walk, except for calories burned. When walking, people burn roughly three times as many calories as biking per mile.
• Environmental and health benefits http://www.smarttrips.org/transportation/savingsCalculator.aspx Shows the carbon monoxide emissions spared and the calories burned by using different transportation
modes. On average, a 100- pound person walking at 3 mi/hr burns about 60 calories per mile. A 100-pound cyclist pedaling at 12 mi/hr burns about 22 calories per mile. Keep in mind that cyclists travel further faster and with less effort than walkers.
• Money saved http://www.commutesolutions.org/calc.htm Calculates the cost of driving based on distance, fuel price, toll/parking costs, and days driving per
month. Included in the calculations are depreciation, insurance, maintenance (direct costs) and road con-struction, CO
2 reduction, pollution damage (indirect costs).
— 5 —
disCUssion:
How do the calculations change if you modify the parameters? For example, if your car gets higher MPG, does it emit fewer pollutants?
How does the website calculate these values? How do we know they are reliable?
At the bottom on the money saved calculator, there is a reference button, have students go to this list of resources. Are all these sources reliable? Would they have reason to diminish the benefits of using alternative transportation?
What does the money saved calculator include in its calculation? Does it leave any-thing out? Could these calculators be used for walking as well?Yes. The environmental and financial calculations are still applicable if you input the amount of miles you walk because they are based on the cost of one’s car. The calories calculator might be a little different for walking;

— 6 —
Investigating Global Warming: a hands-on experimentAdapted from Safe Routes to School (SRTS) Department of Transportation (DOT) and Marin County SRTS
OBJECTIVE: Students will develop ability to understand and apply the scientific method; develop a hypothesis; use tools to perform a test, collect data, and display data; construct graphs; develop qualitative statements about relationships between variables; communicate results in written reports and oral presentations; recognize if evidence is consistent with proposed explanation.
overview: This exercise gives students an opportunity to experience the phenomenon of global warming. Clear plastic bottles containing soil and water represent the earth and our atmosphere. The heat lamps replicate the heat of the sun. Students ventilate half of the bottles, allowing the heat to escape; this mimics the way heat radiated from Earth before an insulating layer of pollution formed in the atmosphere. The other half of the bottles are left unventilated, demonstrating the way heat is now trapped in our environment, as evidenced by the conden-sation of moisture in the bottle. Moisture will not condense in the ventilated bottle
Before you begin: Explain that the upper atmosphere of the earth, or the ozone layer, is about as thick as two pennies. This ozone reflects radiation back into space, kind of like sunglasses for the earth. The lower atmosphere is 78% nitrogen, 21% oxygen and 1% carbon dioxide (CO
2), water vapor and other gases. This les-
son will focus on the 22% that relates to oxygen and CO2. Explain that CO
2 is one of many greenhouse gases
that occurs naturally in our atmosphere, but that in the last 250 years CO2 levels have increased exponentially
because people have released them through burning fossil fuels and cutting large portions of forests. This has resulted in temperature increases throughout the planet. Ask what effect this “greenhouse” effect is having on our planet (extreme hot and cold weather, severe storms: hurricanes, tsunamis, flooding). Describe the experiment and how it will demonstrate this “greenhouse” effect. Ask students to create a hypothesis of what will happen to the ventilated and unventilated bottles when exposed to heat.
Materials: For a class of 24, six stations are recommended. Students should take turns with tasks. Each station (including a demonstration station for the teacher) needs:
You can modify the experiment by having a 3rd category of bottles containing increased levels of CO2; these
bottles mimic the effects of rising CO2 levels in our atmosphere. To do this, include dry ice (frozen CO
2) in the
materials list. Add dry ice to some of the bottles without holes. The most moisture will condense in these bottles.
• Plastic container with 1/2 cup potting soil• Plastic container with 1.5 cup water• One plastic bottle (two liter)• One small bucket or other device to stand the
plastic bottle in (in order to catch excess dirt)• A funnel• A tarp or newspapers on the floor
• Heat lamp or a sunny spot• One inch square piece of aluminum foil• Clipboard, paper and pencil• Every other station will require a utility-knife• A heavy-duty extension cord and surge protected
power strip (if using heat lamp)

— 7 —
Procedure:1. Put the funnel into the bottle and pour in the dirt.2. Pour the water into the funnel so that it is in the bottle with the dirt.3. Place the tin foil tightly over the mouth of the bottle.4. Have half of the groups cut holes near the top of the bottle (three crescent shaped holes about two inches
long). Have helpers cut holes if students are too young. Explain that only half of the groups will be ventilat-ing their bottles; so that the class can compare them to the un-vented bottles.
5. Have all groups place their bottles under the heat lamp or in sunny spot. Ask who knows what percentage of the earth’s surface is covered in water (about 75 %). Explain that the bottles represent the earth because we have a ratio of about three-quarters water to soil (have the students convert the percentage to a fraction). The heat lamp represents the sun and the ventilated bottles represent the earth before the greenhouse effect.
6. Have students record what happens in the ventilated bottles and what happens in the non-ventilated bottles. These will be qualitative results.
discussion:
What happens to air pollution? Does it just float off into space? Air pollution stays in the earth’s atmosphere and has created an insulating blanket around the planet. This effect is called the greenhouse effect and contributes to global warming. While the greenhouse effect is normal (without it, the earth’s surface would be 30 ° C cooler!), the rapid rise in greenhouse gas emissions might cause the earth to get so warm that there will be negative effects that have broad-reaching consequences (i.e. melting ice caps, floods, drought, changing temperatures, etc.)
Which bottles represent the rise in greenhouse gases in the atmosphere: the ones with the holes or the ones without holes?The bottles without holes represent the rise in pollution because in these bottles the pollution is insulating the earth by trapping the heat from the sun, as seen by the condensation. Greenhouse gases in the atmosphere trap more heat (as seen in the unventilated bottles) and can cause the surface of the earth to get warmer. According to Marin County, there is a 3 degree Celsius temperature difference in the vented bottles and the bottles with increased CO
2.
What might happen to the earth if heat cannot escape?If heat cannot escape and the planet continues to get warmer, we may experience desertification, rising sea levels, and increased flooding in some areas. The impacts of these effects are wide-ranging: less drinking water, species extinction, crop failure
What are some of the major effects that pollution from cars may have on us and the planet? Transportation accounts for 45% of Santa Cruz County’s greenhouse gases according to the County Commission on the Environment. According to the EPA, every gallon of gas burned releases almost 20 pounds of carbon dioxide into the air. Additionally, cars cause air and water pollution which has direct health-related impacts on humans (ie. asthma, cancer, water contamination). To illustrate this, ask them how their breathing is affected when bicycling/walking where there is a lot of traffic.

— 8 —
Figuring Your Miles per Gallon and CO2 EmissionsActivity created by Smart Moves for Washington Schools
OBJECTIVE: Students will calculate gas mileage and auto emissions and compare the miles per gallon (MPG) used by different vehicles.
Background:Gas mileage means the number of miles a vehicle will travel on one gallon of gas. This figure significantly affects the amount of air pollution and carbon dioxide emissions produced by a vehicle. Using the following steps, help your students compute the gas mileage of their family’s car.
Procedure:1. Write down the odometer reading when the gas tank is filled up.2. The next time the gas tank is filled, write down how many gallons of gas it takes.3. Then write the odometer reading again.4. Subtract the first odometer reading (step 1) from the second odometer reading (step 3). This will tell you
the number of miles traveled between the two fill-ups.5. Divide the number of miles traveled (step 4) by the number of gallons of gas used (step 2). Presto! This
number will be the gas mileage of your family’s car.
Extensions:Compile the average (mean) and median gas mileage of the cars owned by the families in your class.- Is there a difference between the median and the mean? Why/why not?
Compare your class gas mileage to the U.S. DOT 2006 average of 22.4 MPG for passenger cars and 18 MPG for all vehicles (includes passenger vehicles, buses, and trucks):- By how many miles is the class average higher/lower? Why might this be?- What is the class average for just passenger cars? What is the average for SUVs minivans, and trucks?
Calculate the amount of carbon dioxide emitted by each car: - Divide 20 (pounds of CO
2 per gallon of gas) by the car’s MPG.
- Ex. 20 lb. CO2 ÷ 27 MPG = 0.74 lb. CO
2 per mile.
Compare emissions of a single-occupancy vehicle to a carpool: - If there is only one person in the car, that is 0.74 lb. CO
2 per mile per person.
- In a carpool with 4 people in the car, emissions per person are reduced to 0.74 lb. ÷ 4 people = 0.18 lb. CO
2 per person.
— 9 —
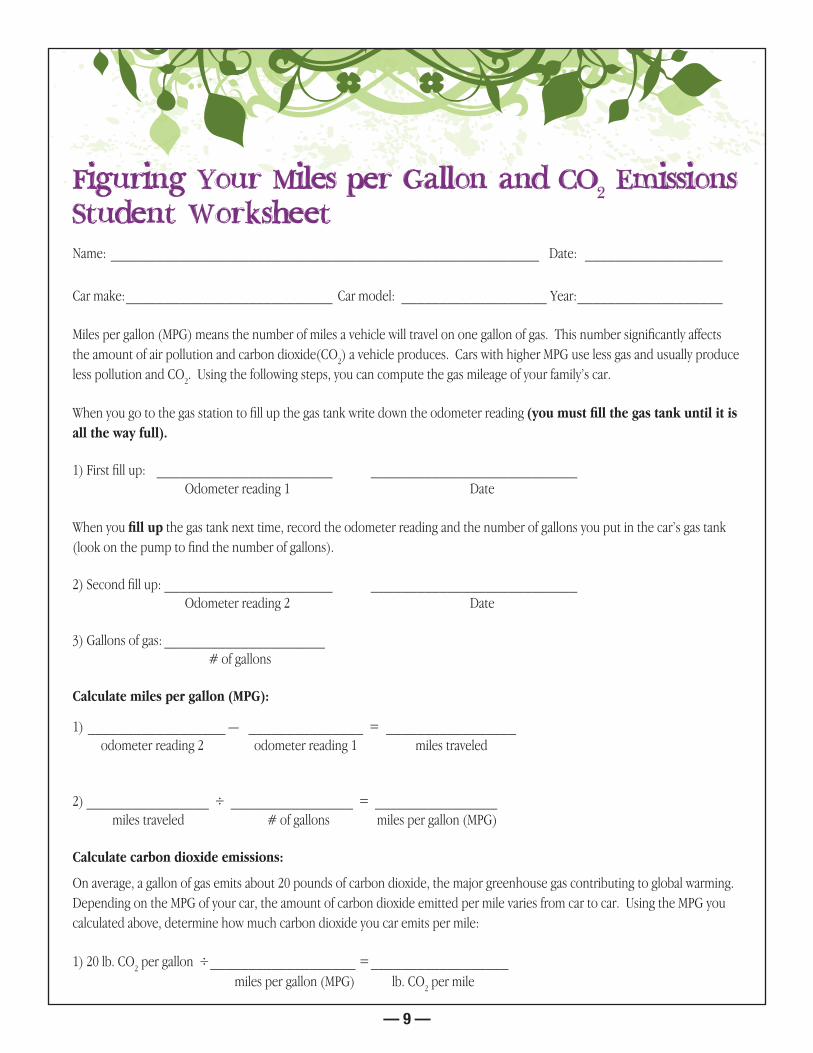
Figuring Your Miles per Gallon and CO2 Emissions Student WorksheetName: ________________________________________________________ Date: __________________
Car make: ___________________________ Car model: ___________________ Year: ___________________
Miles per gallon (MPG) means the number of miles a vehicle will travel on one gallon of gas. This number significantly affects the amount of air pollution and carbon dioxide(CO
2) a vehicle produces. Cars with higher MPG use less gas and usually produce
less pollution and CO2. Using the following steps, you can compute the gas mileage of your family’s car.
When you go to the gas station to fill up the gas tank write down the odometer reading (you must fill the gas tank until it is all the way full).
1) First fill up: _______________________ ___________________________ Odometer reading 1 Date
When you fill up the gas tank next time, record the odometer reading and the number of gallons you put in the car’s gas tank (look on the pump to find the number of gallons).
2) Second fill up: ______________________ ___________________________ Odometer reading 2 Date
3) Gallons of gas: _____________________ # of gallons
Calculate miles per gallon (MPG):
1) __________________ — _______________ = _________________ odometer reading 2 odometer reading 1 miles traveled
2) ________________ ÷ ________________ = ________________ miles traveled # of gallons miles per gallon (MPG)
Calculate carbon dioxide emissions:
On average, a gallon of gas emits about 20 pounds of carbon dioxide, the major greenhouse gas contributing to global warming. Depending on the MPG of your car, the amount of carbon dioxide emitted per mile varies from car to car. Using the MPG you calculated above, determine how much carbon dioxide you car emits per mile:
1) 20 lb. CO2 per gallon ÷ ___________________ = __________________
miles per gallon (MPG) lb. CO2 per mile

— 10 —
Counting the Costs of TransportationActivity created by smart Moves for Washington schools.
OBJECTIVE: Students will learn how to calculate the cost of driving a car by accounting for many factors such as the cost of acquiring a vehicles, fuel costs, and taxes.
Background:In the U.S., about 18% of average household expenses are for transportation. Of this, 94% or more of transportation expenses are vehicle related. (2007 Bureau of Labor Statistics)
Our transportation system has many costs, not all of which are easily assessed and many of which are not charged directly to the user. Some of the major costs that are not included in the price of travel are the environmental impacts. These kinds of costs are known as externalities, difficult if not impossible to price. Often these costs are passed on as subsidies that everyone pays – regardless of how, or how much they travel. Other times the costs remain unpaid causing our services, the environment, or social equity to decline. Economists use a number of terms to describe how costs work: internal (paid for directly by the user), exter-nal (paid for by someone else or left unpaid), variable (dependent on how much or how often something is done), and fixed (not varying with how much something is done.)
Activity:• Have students read the handout titled “Counting the Costs”.• Using the “Counting the Costs” worksheet, have students calculate the potential savings from using alternative
transportation.
discussion:Should society “charge” drivers for some of the external costs of driving? How could this be done?
What would be the benefit of charging drivers directly for the externalities they produce by driving?
Would you implement additional financial benefits for people who walk or bicycle, such as city-sponsored rebates on bicycles? Why?
Why is it difficult to put a monetary cost on externalities such as pollution, accidents, or lost time due to traffic congestion/delays? How could you measure these costs?

— 11 —
Counting the CostsName: __________________________________________________________________________
Transportation Cost Comparison (per person/per year) Average Car Bus/Transit* Bike** Walk**
Fuel Costs (gas, oil, food) $1068 per car 0 $670 $1675
Financing and depreciation costs $3756 0 $150 0
Insurance, registration, maintenance $4032 $420 $50 0& Other expenses
Total cost per year
Total cost per mile†
† Expenses calculated from commutesolutions.org/calc.htm. Assumes people drive 12,000 miles per year (EPA estimate), however, many people do not bus/bike/walk this far, so the cost might be less per mile. * Cost of riding the bus based on purchasing a Youth Santa Cruz Metro Bus pass ($35) every month of the year.** Typically, if you bike/walk you are using energy that you would need to sustain yourself anyway; it doesn’t take much more food to fuel walking and biking trips than it does to simply sustain yourself throughout the day. Also, the health benefits might provide lower medical costs in the future!
1) Fill in the “total cost per year” row for each type of transportation.
2) If the average person in the U.S. drives 12,000 miles per year, what is the cost per mile for each mode of transporta-tion? Fill in the “total cost per mile” row (Hint: you will need to divide).
The costs listed for each mode of transportation are all internal, meaning that the user pays the costs. Some examples of internal costs are the cost of fuel, the cost of purchasing the vehicle, or the cost of a bus pass. On the other hand, external costs are costs that are not paid directly by the user. External costs can be hard to quantify because they are paid for by the whole of society.
3) What are some external costs of driving?Ex. cost of accidents (taxpayers pay for hospitals and ambulances)Ex. cost of parking lot construction________________________________________________________________________________________________________________________________________________________________
4) Can you think of some of the benefits of using different types of transportation that are not financially related? Fill in the table.
societal or personal benefits of:
BICYClInG WAlkInG TAkInG PUBlIC TrAnSPOrTATIOn
1) ex. provides healthy exercise
2)
3)

— 12 —
Trees, Cars, and CO2Adapted from City of Portland “smartMoves” curriculum
Overview: Students learn that CO2 is emitted when gasoline is burned, that too much CO
2 is causing global warm-
ing, and that trees absorb CO2 and produce oxygen. Using simple arithmetic to figure the amount of CO
2 emissions
produced by their own travel, students discover why fuel-efficient cars are more environmentally friendly and consider alternative transportation.
Objectives:Students will be able to• Describe the impact of cars on air quality.• Understand the importance of trees to air quality.• Practice basic computation skills.• Apply math skills to understand real-life issues and problems.
Time: 1- 2 class periods
Materials:• Student Handout: There’s a Connection• Student Handout: Getting Warmer All the Time• Student Handouts: Go Figure 1• Teacher’s resources for Go Figure1 (preview before class)
Procedure:1. Distribute the There’s a Connection handout. Explain that one of just two words will complete each statement. Have the students, individually or as a group, read the statements and identify the words “car” and “tree” (or the plurals of these words). Briefly discuss the statements, explaining that CO
2 is an odorless, colorless gas released when burning
fossil fuels such as gasoline. Tell the students that they will explore the connection between cars, trees, and air quality while practicing their math skills.
2. Point out that we usually don’t connect cars with trees (unless we run into one), but that cars emit carbon dioxide that we can’t breathe and that trees (and other plants) absorb CO
2 and produce the oxygen that we must have to live.
This sounds like an ideal cycle, but if we have too much CO2 there are serious consequences. Ask students whether
they know about “global warming” or “the greenhouse effect.” Distribute the handout Getting Warmer All the Time. Explain – or have students explain – that most scientists believe that global warming has resulted from a build-up of CO
2 in the Earth’s atmosphere, partially caused by the increasing number of vehicles. Ask students why global warm-
ing is sometimes described as the “greenhouse effect.” If necessary, explain the effect by comparing CO2 to glass in a
greenhouse. More CO2 is the same as thicker glass. Light passes through easily and changes to heat, but heat does not
pass through the thicker glass easily and it builds up. Thicker glass/CO2 doesn’t stop much light, but thicker glass/CO
2
does block heat from escaping.

— 13 —
3. Now write on the board the following equation:
Less Car Emissions + More Tree Absorption = Better Air Quality
Have the class refer back to the handout There’s a Connection in order to explain why the equation is true and what actions could reduce CO
2 and improve air quality. Confirm that fewer cars, the same number of fuel
efficient cars, and more trees would have a positive effect on air quality.
4. Distribute the handout Go Figure. Depending on the students’ math skills, have them complete all or part of the handout individually, with a partner, or as a class. (Consult the Teacher’s resources for prompts, calcula-tions, answers, and additional resources.) Go over the students’ calculations and answers to the problems, and then facilitate a discussion around their responses to the three Go Figure questions about what they might do to promote better air quality.
Assessment opportunities:• Discussion of the equation: less Car Emissions + More Tree Absorption = Better Air Quality• Successful completion of the math problems (this would assess skills gained prior to the session) and ap-
plication of them to the problem of global warming• Answers to the Go Figure questions on the handout
Extensions:A Research ProjectHave students learn about the Cities for Climate Protection and how Santa Cruz City Council passed resolution nS 23,741 in 1998 and joined 500 local governments around the world to reduce emissions of greenhouse gases within their local jurisdictions or California State Assembly Bill 32, the Global Warming Solutions Act of 2006 that requires California to reduce its greenhouse gas emissions to 1990 levels by 2020.
A Community ProjectContact City of Santa Cruz for information about group volunteer tree planting, including plantings on school grounds or for tree-planting referrals throughout County.leslie keedy. Urban Forrester. 323 Church Street. Santa Cruz, California 95060 (831) 420-5246. Fax: (831) 420-5361. e-mail: [email protected]

— 14 —
HANDOUT: There’s a ConnectionOne of two words will complete the statements below. What are these two words?
• On the average, every gallon of gas used by a________________________________ releases about 20 pounds of carbon dioxide (CO
2) into the air.
• A single fully grown ______________________________________ can transform 13 pounds of carbon dioxide into life-giving oxygen every year.
• One acre of _______________________________ produces enough oxygen for 18 people every day.
• A Chevy Cavalier is a ___________________________________. It’s a top performer in its class, but it is estimated to emit 39.4 tons of carbon dioxide over its useful life of 120,000 miles.
• At the rate we’re currently going, in the year 2030, there will be double the number of _______________________ on the world’s streets and highways. So change your travel choices now!!

— 15 —
HANDOUT: Go Figure 1“Every gallon of gasoline releases about 20 lbs of CO
2 into the air.”
- US Environmental Protection Agency (EPA)
1. How much CO2 do YOU contribute to the atmosphere?
2. Estimate the number of trips you make in a car during one week.
3. Estimate how many miles you travel in a car during a week.
4. Estimate how many gallons of gasoline you use per week.
5. Calculate how many pounds of CO2 your car trips emit each week.
6. Go Figure Big Time: What could you do every week to decrease the amount of CO2 that you
are responsible for putting in the air by car travel?
Check it out:Calculate the number of trees it would take to offset carbon dioxide emissions for your family for a year with this great Climate Change Calculator:http://www.americanforests.org/resources/ccc/
http://www.fightglobalwarming.com/carboncalculator.cfm/ sponsored by the Environmental Defense Fund offers an interactive page where you can total up the amount of CO
2 you and/
or your family are producing through fuel consumption, including operating cars.

— 16 —
TEACHER’S RESOURCE: Go Figure 1How much Co2 do YoU contribute to the atmosphere?
1. Estimate the number of trips you make in a car during one week. Prompt students about trips to school, shopping, to sports events, visiting friends, going to religious services, etc.
2. Estimate how many miles you travel in a car during a week. To facilitate estimating, have on hand the mileage from the school to malls, theatres, and other places
where students are likely to ride in cars.
3. Estimate how many gallons of gasoline you use per week. Point out that miles per gallon depends upon the type of vehicle and can vary widely. You might offer these
examples as typical for city driving: compact: 30 miles per gallon: mid-sized: 20mpg, SUV: 15mpg; pick-up 18mpg.
4. Calculate how many pounds of CO2 your car trips emit each week.
Point out that the amount of CO2 emitted varies depending upon the year, make, model and condition of
the car engine. Twenty pounds of CO2 per gallon of gas burned is an average students can use. (Miles trav-
eled /miles per gallon) x 20 lbs. per gallon = 1 lbs. of CO2 per week.
Go Figure Big Time: What could you do every week to decrease the amount of CO2 that you are responsible
for putting in the air by car travel?
Actions could include:• reducing the number of trips by car• Taking alternative transportation• Taking the most fuel-efficient cars, especially if your family owns more than one vehicle• Helping parents and older brothers and sisters to remember to have their cars tuned and serviced
Check it outCalculate the number of trees it would take to offset carbon dioxide emissions for your family for a year with this great Climate Change Calculator http://www.americanforests.org/resources/ccc/
http://www.fightglobalwarming.com/carboncalculator.cfm/ sponsored by the Environmental Defense Fund offers an interactive page where you can total up the amount of CO
2 you and/or your family are
producing through fuel consumption, including operating cars.

— 17 —
Driving cars causes the earth’s temperature to rise!!
CO2 from gasoline causes an increase of the Earth’s
temperature called global warming.Global warming can cause:
• A rise in the sea level and flooding of coastal lands due to warming oceans and melting glaciers
• More floods, storms, and other extreme weather events• The spread of disease and other health problems• Severe stress on forests, wetlands, and other natural habitats• Dislocation of agriculture and commerce• Expansion of the Earth’s deserts• Extinction of many animal species
HANDOUT: Getting Warmer All the Time
— 18 —
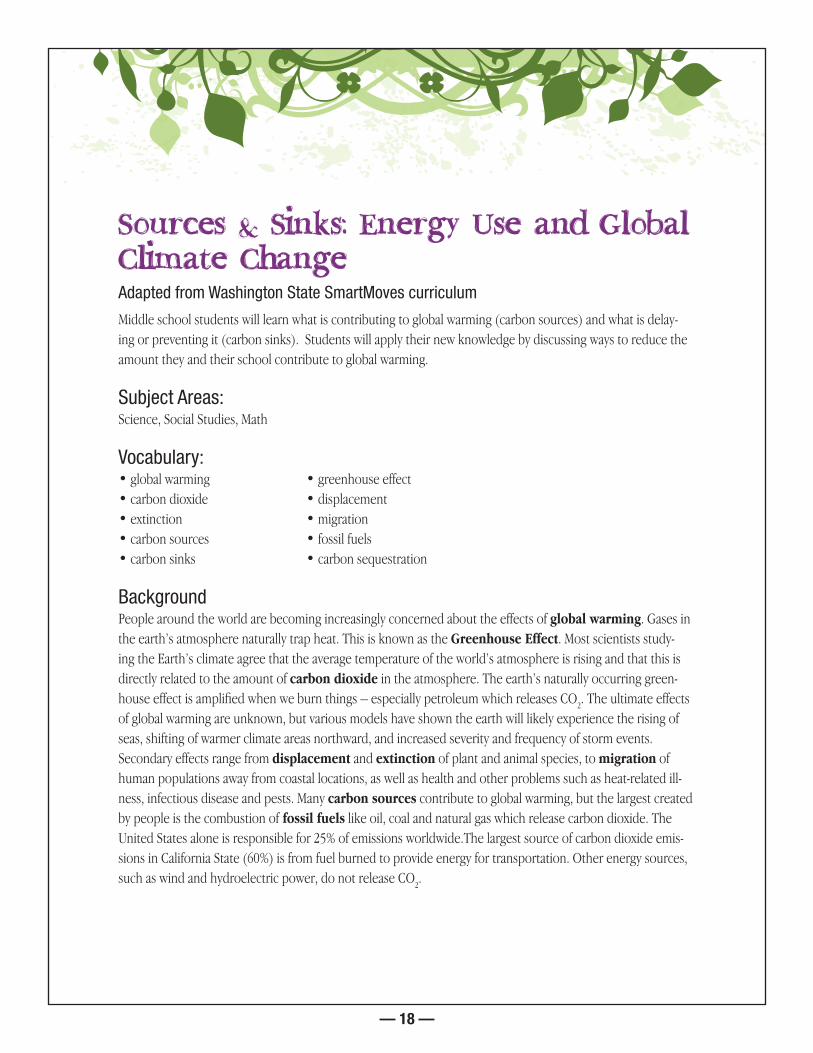
Sources & Sinks: Energy Use and Global Climate Change Adapted from Washington state smartMoves curriculum
Middle school students will learn what is contributing to global warming (carbon sources) and what is delay-ing or preventing it (carbon sinks). Students will apply their new knowledge by discussing ways to reduce the amount they and their school contribute to global warming.
subject Areas:Science, Social Studies, Math
vocabulary:• global warming • greenhouse effect• carbon dioxide • displacement• extinction • migration• carbon sources • fossil fuels• carbon sinks • carbon sequestration
BackgroundPeople around the world are becoming increasingly concerned about the effects of global warming. Gases in the earth’s atmosphere naturally trap heat. This is known as the Greenhouse Effect. Most scientists study-ing the Earth’s climate agree that the average temperature of the world’s atmosphere is rising and that this is directly related to the amount of carbon dioxide in the atmosphere. The earth’s naturally occurring green-house effect is amplified when we burn things – especially petroleum which releases CO
2. The ultimate effects
of global warming are unknown, but various models have shown the earth will likely experience the rising of seas, shifting of warmer climate areas northward, and increased severity and frequency of storm events. Secondary effects range from displacement and extinction of plant and animal species, to migration of human populations away from coastal locations, as well as health and other problems such as heat-related ill-ness, infectious disease and pests. Many carbon sources contribute to global warming, but the largest created by people is the combustion of fossil fuels like oil, coal and natural gas which release carbon dioxide. The United States alone is responsible for 25% of emissions worldwide.The largest source of carbon dioxide emis-sions in California State (60%) is from fuel burned to provide energy for transportation. Other energy sources, such as wind and hydroelectric power, do not release CO
2.

— 19 —
Carbon sinks are places or features in the environment that delay or prevent global warming by absorbing, holding or storing carbon from the atmosphere. Carbon sinks include trees, green plants, fungi, soils, rocks and oceans. One way to keep harmful levels of carbon from building up in the atmosphere is a process called carbon sequestration. Sequestration methods include planting more forests, boosting phytoplankton growth in oceans, improving tillage practices in soils, and injecting carbon into underground rock. There are many costs and benefits associated with the use of fossil fuels. The ultimate costs of global warming could be large in terms of property loss and the movement of human settlements due to adverse health impacts, chang-ing weather patterns and flooding.
ActivityCarbon Sources & SinksBased on a reading of the background material, have students think about and list various carbon sources and sinks either individually or as a group.
Ask: Which are sources we contribute to here at school? Which do you contribute to personally, either at school, at home, or throughout the day?
Ask: What are some ways that the school could reduce its emissions? In what waysmight you reduce your personal share of CO
2 emissions?
Using the Travel Facts, have students calculate how many trees would need to be planted to store or sequester the emissions produced from a single year of driving.

— 20 —
Travel Facts in our CountyCarbon SourcesAt these levels of automobile use and fuel consumption in Santa Cruz County, we emit 542,874 pounds of CO
2
every day or 988,030 tons of CO2 every year.
# of Vehicles registered in Santa Cruz County: .......................................................................................241,768# of residents 16 and over in Santa Cruz County: ...................................................................................215,558Daily Vehicle Miles Traveled on Average in Santa Cruz County: ........................................................ 5,428,740Daily Fuel Consumed on Average in Santa Cruz County (assumes 20mph): ............................ 271,437 gallonsAverage Daily Miles per registered Vehicle in Santa Cruz County: ........................................................23 miles
Carbon SinksEvery acre of forested land can, on average, absorb 1.25 tons of CO
2 per year, though estimates range from 1.1
to 5 tons per year. Santa Cruz County has 286,739 total acres, of these, 190,000 acres of public and private land are forested
Q: An acre of land is about 3/4 the size of a football field. How many acres of forested land are needed to offset the CO
2 emitted from Santa Cruz County’s vehicle emissions?
A: For every mile driven, approximately 1 lb of CO2 is released.
On average in SC County 5,428,740 total miles are driven each day, or 5,428,740 lbs of CO2 are released each day.
Calculate tons per day: 5,428,740 ÷2,000 = 2,714 tons of CO2 released each day
Figure tons per year: 2714 tons x 365 days = 990,610 tons per year of CO2.
Calculate acreage needed: 990,610 tons ÷ 1.25 tons of CO2 absorbed/acre = 792,488 acres needed
Calculate our sink deficit: 792,488 acres needed – 190,000 acres of forested land in SC County = 602,488 acres of additional forested acres we need to absorb the CO
2
emissions produced just by vehicles in SC County.

— 21 —
discussion questions
Q: Clearly, we now produce more CO2 in our county, just from driving, than we are able to absorb. What can
you do travel-wise to reduce your own emissions?
Q: What are some of the most effective ways of preventing global warming?
Q: What kinds of projects could we do at school to reduce our effects on global warming?
Carbon Sources & Sinks in Santa Cruz County(Tons emitted vs. tons absorbed)
CO2 levels in Tons 990,000 Tons emitted from
vehicles per year
890,000
780,000
690,000
590,000
490,000
390,000
290,000
190,000 Tons absorbed by sinks
90,000 Extensions:• For an image of carbon sources and sinks, see the book “Stormy Weather,” pp. 8-9, “Greenhouse Effect” or have students draw
their own depiction of global warming.
• Calculate the number of trees it would take to offset carbon dioxide emissions for your family for a year with the great Climate Change Calculator http://www.americanforests.org/resources/ccc/
What happens to the rest?

— 22 —
Souces and Sinks Student HandoutCarbon Sources1. What sources of CO
2 do we contribute to here at school? At home?
School Sources
Personal Sources
2. What are some ways we could reduce carbon dioxide emissions at school?
3. What are some ways you could reduce your personal share of CO2 emissions?
Carbon Sinks
4. Using the following formulas, calculate how many trees would need to be planted to store or sequester the emissions from a single year of driving:
SOUrCE lbs CO2 emitted per mi. x no. of mi. per year = total lbs CO
2 emitted x .0005 = tons per year per year
Car Exhaust 1 pound CO2 per mi. x 12,500 mi. per year = ____________ x .0005 = _________
SINK tons emitted per year ÷ lbs CO2 absorbed per acre/per year = acres needed to absorb emissions
from one yearTrees _____________ ÷ 1.25 tons per acre/per year = __________________________
5. How much forest is needed to absorb the carbon emitted each year by Santa Cruz County drivers?
6. What other ways can we reduce total CO2 output from our local area? Our state?