Embed Size (px)
Citation preview

COMMON CORE CORRELATION GUIDE FOR UNIT 7.4.g. 1
RST.
6–8.
1
RST.
6–8.
2
RST.
6–8.
4
RST.
6–8.
7
RST.
6–8.
8
RST.
6–8.
9
RST.
6–8.
10
WH
ST.6
–8.1
SL.7.
1
SL.7.
2California
Connections ✓ ✓ ✓ ✓ ✓
LE
SS
ON
S
1 ✓ ✓ ✓ ✓ ✓
2 ✓ ✓ ✓ ✓ ✓ ✓ ✓
3 ✓ ✓ ✓
4 ✓ ✓
5 ✓ ✓ ✓ ✓ ✓
6 ✓ ✓ ✓ ✓Traditional
Assessment ✓Alternative
Assessment ✓ ✓
C O M M O N C O R E S T A N D A R D S
Note: For your reference, the list of California Common Core State Standards abbreviations is on the following page.
7.4.g.—Extinction: Past and PresentThis unit encourages students to consider how evidence of past developments and extinction events in geological time can inform them about one of the biggest changes to natural systems the planet has ever seen: the Holocene Extinction Event. Through a series of lessons in which they interpret and analyze real data, students study how rates of extinction vary over geological time and learn that current extinction rates eclipse extinction rates of the past.
California Education and the Environment InitiativeTeacher’s Edition
Extinction: Past and Present
7Science Standard
7.4.g.
California Education and the Environment InitiativeIncreasing Environmental Literacy for K–12 Students… Because the Future is in Their Hands
TEACH COMMON CORE STANDARDS WITH THE EEI CURRICULUMCreated with your needs in mind, this document shows the correlation between the EEI Curriculum and the California Common Core State Standards. By teaching the EEI unit lessons in your classroom, you will be simultaneously addressing the Common Core standards depicted in this guide.
2 COMMON CORE CORRELATION GUIDE FOR UNIT 7.4.g.
Using the EEI-Common Core Correlation Matrix
The matrix on the front page identifies a number of Common Core standards that are supported by this EEI unit. However, the check marks in the matrix do not necessarily signify that the Common Core standards checked will be taught to mastery by using this EEI unit alone. Teachers are encouraged to select which Common Core standards they wish to emphasize, rather than teaching to every indicated standard. By spending more time on selected standards, students will move toward greater Common Core proficiency in comprehension, critical thinking and making reasoned arguments from evidence. Teaching this EEI unit will provide opportunities for teachers to implement the shift in instructional practice necessary for full Common Core implementation.
California Common Core State Standards Abbreviations
■ ■■ CCCSS: California Common Core State Standards
■ ■■ RST: Reading Standards for Literacy in Science and Technical Subjects
■ ■■ SL: Speaking and Listening Standards
■ ■■ WHST: Writing Standards for Literacy in History/Social Studies, Science, and Technical Subjects
Note: Since each Common Core standard includes a breadth of skills, in this correlation, the portion of the standard description that is featured in the Common Core Standards Applications is cited, using “…” to indicate omitted phrases. For a list of the complete standard descriptions, please see the Common Core Reference Pages located on page 15 of this document.
A Note about Common Core Speaking and Listening StandardsThroughout this unit, students participate in various learning structures and groups to analyze, discuss, and synthesize data, which supports the skill in Speaking and Listening Standard 1 “Participate effectively in a range of collaborative discussions (one-on-one, groups…) with diverse partners.” With prior instruction on collaborative discussions, these various groupings and the materials students examine lend themselves to prime discussion material for collaborative discussions. Learning structures with tasks for pairs and groups are in the following lessons:
■ ■■ Lesson 1: Whole class, small groups
■ ■■ Lesson 2: Whole class, small groups
■ ■■ Lesson 3: Whole class, pairs
■ ■■ Lesson 4: Whole class, small groups
■ ■■ Lesson 5: Whole class, pairs, groups of 8
■ ■■ Lesson 6: Whole class, small groups
National Geographic Resources
■ ■■ View from Space wall map (Lesson 1)

COMMON CORE CORRELATION GUIDE FOR UNIT 7.4.g. 3
Unit Assessment Options
Assessments Common Core Standards Applications
Traditional Assessment
Students answer 10 multiple-choice questions about information from the unit, then answer 6 short-answer questions relating to Geologic Timeline and extinction period.
RST.6–8.4: Determine the meaning of symbols, key terms, and other domain specific words and phrases as they are used in a specific scientific or technical context relevant to grades 6–8 text and topics.
Alternative Assessment
Students complete Extinction Charts (Alternative Unit Assessment Master) that compare extinction events. Students may use Geologic Timeline and their Student Workbook and Student Edition as resources.
RST.6–8.2: Determine the central ideas or conclusions of a text; provide an accurate summary of the text distinct from prior knowledge or opinions.
WHST.6–8.1: Write arguments focused on discipline-specific content.
c) Use words, phrases, and clauses to create cohesion and clarify the relationships among claim(s), counterclaims, reasons, and evidence.
e) Provide a concluding statement or section that follows from and supports the argument presented.

4 COMMON CORE CORRELATION GUIDE FOR UNIT 7.4.g.
Lesson 1: La Brea Tar Pits: A Case Study of Extinction
Students review a geologic timeline, identifying gradual and rapid changes in geologic time. They read about fossils found in the La Brea Tar Pits and use evidence to explain how rapid environmental change could have contributed to megafauna extinction in the Pleistocene.
Extinction: Past and Present
32 CALIFORNIA EDUCATION AND THE ENVIRONMENT INITIATIVE I Unit 7.4.g. I Extinction: Past and Present CALIFORNIA EDUCATION AND THE ENVIRONMENT INITIATIVE I Unit 7.4.g. I Extinction: Past and Present 33
Lesson 1
Lesson 1
La Brea Tar Pits: A Case Study of ExtinctionIn this lesson students apply their understanding of the causes of extinction to an exploration
of a case study of extinction from the distant past. To prepare to study events along the geologic timeline, students examine a timeline of Earth’s history. They learn about the relative nature of terms, such as “rapid” and “gradual” change in the context of vast lengths of time.
Next, students examine a certain span of time along the geologic timeline—the end of the Pleistocene epoch—to learn how scientists determine causes of extinctions that occurred in the past. Students read California Connections: Puzzle in the “Tar” Pits and evaluate what the fossil evidence reveals about biotic and abiotic changes in California
at the end of the Pleistocene; they then consider how this evidence supports the different hypotheses about the cause of the extinction of North American megafauna at the conclusion of the Pleistocene epoch.
BackgroundExtinction has occurred
throughout history; whether it
occurred yesterday or millions of years ago, the processes involved are the same. A species becomes extinct when it cannot survive environmental change. Such change can be biotic, such as the introduction of a new predator (including humans) or the loss of a food source, or it can be abiotic, such as alterations in climate;
Close-up of La Brea Tar Pits
changes in atmospheric, terrestrial, or aquatic chemistry; or the landing of a meteor.
Studying extinctions along the geologic timeline requires consideration of vast amounts of time. Scientists estimate that Earth was formed approximately 4.6 billion years ago. Writer John McPhee, in Basin and Range (1981, Farrar, Straus & Giroux), describes this incredible time span by explaining that if a person stretched his arms as far as he
could to represent all of Earth’s past and then took a nail file and scratched it across his fingernail, with that single motion he would remove all of human history. When scientists speak of rates of environmental change in geologic time, relative terms, such as “rapid” and “gradual” take on different meaning. Several hundred years represents just a blink in history, and gradual changes can last millions of years.
One notable rapid extinction occurred at the end of the Pleistocene, an epoch dated between 1.8 million and 10,000 years ago. During that time hundreds of species, mostly megafauna in the Americas and Australia, became extinct over just a few hundred years. Fossil evidence suggests that first large herbivores, and then large carnivores and scavengers, perished in this short time, a period that coincides with the first appearance of aboriginal humans in those regions. Scientists still debate the details of how the megafauna went extinct so rapidly. Some researchers are analyzing DNA evidence to support the hypothesis that disease killed off
these animals; others are hunting for fossil evidence that links human hunting with the extinction; still others are searching for microfossil evidence of climate change and its effects on various species.
Earth
| Key Vocabulary
Climate change: A long-term significant change in the weather patterns of Earth.
Crude oil: The oil before it has been refined and made into gasoline and other products.
Extinction: The death of all members of a species or other taxa.
Fossil: The remains of a plant or animal preserved in rock, another geological deposit, or petrified.
Megafauna: Large animals with long lifespans.
Microfossil: Fossils that are very small and usually must be studied using a microscope.
Pleistocene epoch: The geologic era that began 1.8 million years ago and ended about 12,000 BCE, often called the “ice age” because it was characterized by cold periods accompanied by widespread glaciers.
Sedimentary layers: Compacted and “cemented” hard beds or strata of rocks, typically formed where small pieces of minerals and rocks are deposited over a very long time.
| Learning Objectives
Identify changes to biotic and abiotic factors in natural systems that can result in the extinction of species.
Describe how natural systems can change gradually on a geologic time scale or rapidly (for example, changes to biogeochemical cycles, system processes, species composition, and capacity to yield ecosystem goods and ecosystem services).
National Geographic Resources:■ ■■ View from Space wall map
Use this correlation in conjunction with the Procedures located on pages 36–37 of the Teacher’s Edition. Only procedure steps with a Common Core correlation are included in the table below.
Student Tasks Common Core Standards Applications
Vocabulary Development: For depth of understanding, vocabulary may be featured within the context of the unit instead of or in addition to the beginning of the lesson.
Suggestion: Add these terms to a Word Wall or vocabulary book: formation, fossil, billion, evidence.
RST.6–8.4: Determine the meaning of symbols, key terms, and other domain-specific words and phrases as they are used in a specific scientific or technical context relevant to grades 6–8 text and topics.
Steps 2–4: Students refer to the Geologic Timeline on the wall to answer teacher-directed questions based on fossils and the age of the earth.
Students volunteer to place cards on the Geologic Timeline. Students discuss the Pleistocene epoch, looking at the View from Space wall map and identifying organisms that lived in what is modern-day Los Angeles 40,000 years ago. They compare modern-day plants and animals, and conclude what happened to the Pleistocene epoch’s organisms, plants, and animals.
Suggestion: This can be a give-one, get-one activity. Students can each find two people to share answers with and take two answers back to their table.
SL.7.1: Engage effectively in a range of collaborative discussions (one-on-one, in groups, and teacher led) with diverse partners…, building on others’ ideas and expressing their own clearly.
WHST.6–8.1e: Provide a concluding statement or section that follows from and supports the argument presented.
Steps 5–7: Students read California Connections: Puzzle in the “Tar” Pits (Student Edition, pages 2–5) and use this information to complete Evidence from the La Brea Tar Pits (Student Workbook, pages 2–5).
Suggestion: Refer to the Reading California Connections Using a Common Core Reading and Writing Focus on pages 10–14 to view specific suggestions for integrating Common Core standards while reading the selection not only for content, but for text structure as well.
Tip: If Student Workbooks need to be reused from year to year, students should not write in them. Some strategies teachers use to preserve the workbooks are:
■ ■■ Have students use binder paper or other lined or unlined paper.
■ ■■ Have students use a sheet protector over the page and write with a whiteboard marker.
■ ■■ Do together as a class on a projector or chart paper.
■ ■■ Project the digital fill-in version and do together as a class.
■ ■■ Students use digital devices to fill in the digital version found on the website.
■ ■■ Make student copies when necessary.
RST.6–8.1: Cite specific textual evidence to support analysis of science and technical texts.
RST.6–8.2: Determine the central ideas or conclusions of a text; provide an accurate summary of the text distinct from prior knowledge or opinions.
SL.7.1: Engage effectively in a range of collaborative discussions (one-on-one, in groups, and teacher led) with diverse partners…, building on others’ ideas and expressing their own clearly.

COMMON CORE CORRELATION GUIDE FOR UNIT 7.4.g. 5
Lesson 2: Change in Geologic Time
Students review gradual and rapid change and interpret data to complete a chart describing changes in different periods of geologic time. Students then add labels to the geologic timeline.
Extinction: Past and Present
50 CALIFORNIA EDUCATION AND THE ENVIRONMENT INITIATIVE I Unit 7.4.g. I Extinction: Past and Present CALIFORNIA EDUCATION AND THE ENVIRONMENT INITIATIVE I Unit 7.4.g. I Extinction: Past and Present 51
Lesson 2
Change in Geologic TimeIn this lesson students build on the previous lesson’s exploration of geologic time, examining
examples of both rapid and gradual change over the past 500 million years. Working in groups, they interpret a variety of data from graphs, maps, and text to create a chart summarizing the kinds of biogeochemical changes that have occurred in different eras and periods in geologic time.
Next, students examine the varying rates of change among different components of the environment, including biotic components (species composition)
and abiotic components, such as temperature and atmospheric gases, all of which inf luence extinction. After a whole-class discussion, students add
additional event labels to the geologic timeline on the wall and describe examples of both rapid and gradual change on the geologic timeline.
Ice age hunters
Lesson 2
BackgroundSpecies composition in natural
systems can change rapidly or gradually. Throughout most of Earth’s history, extinctions have occurred at slow and steady rates; however, scientists have identified six extinction events in which rapid losses of species occurred over short time periods. While extinction rates can vary, the evolution of new species generally occurs gradually. Even when a mass extinction opens an ecological niche for other species to thrive and diversify, these bursts of speciation take time. Scientists estimate that it takes about 10 million years after a mass extinction for an ecosystem to reach pre-extinction event levels of diversity.
Abiotic factors in natural systems also vary in their rates of change in geologic time. Climate has varied throughout Earth’s history, fluctuating between “ice house” periods, in which ice covers
the poles, and “hot house” periods, times in which alligators can survive at the North Pole and palm trees grow in Alaska (both climatic reality during the early Cenozoic). These changes between cool and warm periods often occur rapidly in geologic time. Atmospheric gases, such as oxygen, nitrogen, and carbon dioxide, all fluctuate rapidly throughout geologic time, due in part to the fluctuating composi-tion of species that use or produce
these gases. For example, atmospheric carbon dioxide dropped dramatically in the late Devonian, probably due to the fact that terrestrial plants—which consume and store carbon diox-ide—increased exponentially during this period. Oxygen levels increased correspondingly.
All of these changes occurred simultaneously with the constant, gradual movement of continents. The amount of land versus water on Earth affects how much of the Sun’s energy is absorbed, and the position of landmasses affects ocean currents, which distribute heat around the planet. Volcanism and the spreading of the ocean floor can also release gases into the atmosphere, affecting atmospheric processes that affect other aspects of the natural system. Taken together, these gradual and rapid abiotic changes can affect extinc-tion and speciation.
| Key Vocabulary
Extinction event: A major decrease in the number of species on Earth in a relatively short period of time.
Earth’s ocean currents
0 1,000 2,000 4,000 Miles
WARM CURRENT
COLD CURRENT
23.5°
0°
23.5°
23.5°
0°
23.5°
A R C T I C O C E A N
P A C I F I C O C E A N
A T L A N T I CO C E A N
I N D I A N
O C E A N
P A C I F I C O C E A N
EQUATOR
TROPIC OF CANCER
TROPIC OF CAPRICORN
WEST WIND DRIFTWEST WIND DRIFT
WEST WIND DRIFT
CA
LIFOR
NIA C
URRENT
HUMBOLDT CURRENT
NORTH ATLANTIC D RIFT
GREENLAND CURRENT
NORTH ATLANTIC DRIFT
NORTH PACIFIC DRIFT
NORTH EQUATORIAL CURRENT
PACIFIC EQUATORIAL COUNTERCURRENT
SOUTH PACIFIC EQUATORIAL CURRENT
GU
LF S
TREAM
ATLANTIC EQUATORIAL COUNTERCURRENT INDIAN EQUATORIAL
COUNTERCURRENT
P ACIFIC EQUATORIAL COUNTERCURRENT
| Learning Objective
Describe how natural systems can change gradually on a geologic time scale or rapidly (for example, changes to biogeochemical cycles, system processes, species composition, and capacity to yield ecosystem goods and ecosystem services).
Use this correlation in conjunction with the Procedures located on pages 54–55 of the Teacher’s Edition. Only procedure steps with a Common Core correlation are included in the table below.
Student Tasks Common Core Standards Applications
Vocabulary Development: For depth of understanding, vocabulary may be featured within the context of the unit instead of or in addition to the beginning of the lesson.
Suggestion: Add these terms to a Word Wall or vocabulary book: rapid, gradual, atmospheric, climate.
RST.6–8.4: Determine the meaning of symbols, key terms, and other domain-specific words and phrases as they are used in a specific scientific or technical context relevant to grades 6–8 text and topics.
Steps 2–6: In groups of 4, students analyze data from Data on Global Temperature (Student Edition, page 6), Data on Atmospheric CO2 (Student Edition, page 7), and Fossil Data by Era and Period (Student Edition, page 8). They use this data to complete Changes Across Time (Student Workbook, pages 6–7).
Suggestion: Put headings on chart paper, and have groups of 4 display evidence around the room. Then have groups present the evidence orally.
RST.6–8.1: Cite specific textual evidence to support analysis of science and technical texts.
RST.6–8.2: Determine the central ideas or conclusions of a text; provide an accurate summary of the text distinct from prior knowledge or opinions.
RST.6–8.10: By the end of grade 8, read and comprehend science/technical texts in the grades 6–8 text complexity band independently and proficiently.
SL.7.1: Engage effectively in a range of collaborative discussions (one-on-one, in groups, and teacher led) with diverse partners…, building on others’ ideas and expressing their own clearly.
Step 7: Students analyze Changes Across Time to determine when extinction events occurred. They then use Geologic Timeline Labels—Set 2 to attach extinction event labels on the class timeline.
Suggestion: Have students pair-share their reasons for placing their cards in particular places on the timeline. Sentence frame: I placed my card on the period because the evidence shows .
RST.6–8.7: Integrate quantitative or technical information expressed in words in a text with a version of that information expressed visually (e.g., in a flowchart, diagram, model, graph, or table).
RST.6–8.9: Compare and contrast the information gained from experiments, simulations, video, or multimedia sources with that gained from reading a text on the same topic.

6 COMMON CORE CORRELATION GUIDE FOR UNIT 7.4.g.
Lesson 3: Extinction: Rates and Possible Causes
Students work in pairs to read and discuss three case studies about organisms that became extinct. They complete a graphic organizer summarizing environmental changes, changes in species, and types and rates of extinctions. Students discuss their findings as a class.
Extinction: Past and Present
72 CALIFORNIA EDUCATION AND THE ENVIRONMENT INITIATIVE I Unit 7.4.g. I Extinction: Past and Present CALIFORNIA EDUCATION AND THE ENVIRONMENT INITIATIVE I Unit 7.4.g. I Extinction: Past and Present 73
Lesson 3
| Learning Objective
Explain how extinction occurs.
Mass extinctions occur rapidly. These extinction events coincide with rapid environmental change and affect species in most taxonomic groups. Five extinction events have occurred in geologic time and a sixth event is in progress. The dura-tion of each extinction event varies. Scientists believe the mass extinction of the dinosaurs and many other spe-cies at the end of the Cretaceous may have lasted mere months after the cat-astrophic impact of an asteroid with Earth. (Some scientists note that a more gradual decline may have led up to this event, but most agree that the collision of an extraterrestrial object with the planet led to a quick end for many species.) By contrast, the mass extinction at the end of the Permian, which brought the loss of more than 90% of all species, lasted an estimated 8,000 to 100,000 years. Although the end-Permian extinction event lasted longer than the end-Cretaceous event, even the 8,000 to 100,000 years of the former represents a relatively short period in geologic time.
Between these dramatic extinction events, a much lower background extinction rate brings
the ongoing, gradual loss of many species. Scientists estimate that anywhere between 10 and 100 species naturally go extinct every year. These extinctions result from gradual changes that alter ecosystems, such as the introduction of new competitors, evolution of new predators, or gradual movement of continents.
Estimates of extinction rates are only as reliable as the informa-tion found in the fossil record. The fossil record is inherently incomplete because all organisms do not fossil-ize equally well. Also, there frequently are only a few fossils for a particular species. Limited numbers of fossils may indicate that the species went extinct rapidly or may be a result of limited success in locating the fossils. If there are only a few examples of a species, it can appear that the organ-ism went extinct quickly. Further
research that subsequently dis-covers the same species in earlier or later layers could then significantly expand the estimated longevity of the species—decreasing the estimated rate of extinction for that species. Scientists are still conducting research into the causes of most mass extinc-tions and how rapidly they occurred.
Tyrannosaurus rex fossil
| Key Vocabulary
Background extinction rate: The relatively constant rate at which species become extinct over the course of geologic time.
Mass extinction: The extinction of many species at the same time.
Lesson 3
Extinction: Rates and Possible CausesAlthough extinction has always occurred, rates of extinction vary throughout geologic time.
In this lesson students examine the causes of extinction and how extinction rates vary. Students first discuss extinction and how it occurs.
Next, they study the differences between mass extinction and background extinction rates. They read and compare three extinction case studies that took place in three different periods on the geologic timescale. Students examine how different rates of environmental
change have influenced different rates of extinction and summarize their understanding of how extinc-tion occurs.
Lesson 3 prepares students for studying, in the culminating lesson of the unit, what many believe is the current Holocene Extinction Event.
BackgroundMore than 99% of species that
have ever lived on Earth have gone extinct—some in rapid mass extinctions resulting from rapid envi-ronmental change or catastrophic events, and others at a steady, low-level background extinction rate.
Ice age hunters killing woolly mammoth
Use this correlation in conjunction with the Procedures located on pages 76–77 of the Teacher’s Edition. Only procedure steps with a Common Core correlation are included in the table below.
Student Tasks Common Core Standards Applications
Vocabulary Development: For depth of understanding, vocabulary may be featured within the context of the unit instead of or in addition to the beginning of the lesson.
RST.6–8.4: Determine the meaning of symbols, key terms, and other domain-specific words and phrases as they are used in a specific scientific or technical context relevant to grades 6–8 text and topics.
Steps 2 and 3: Students answer questions about Extinction Rates (Visual Aid #7). They also use Geologic Timeline to answer questions about mass extinction orally.
SL.7.1: Engage effectively in a range of collaborative discussions (one-on-one, in groups, and teacher led) with diverse partners…, building on others’ ideas and expressing their own clearly.
Steps 4–6: Students use Extinction Case Studies (Student Edition, pages 9–11) to complete Cases and Causes of Extinction (Student Workbook, pages 9–10).
WHST.6–8.1: Write arguments focused on discipline-specific content.
c) Use words, phrases, and clauses to create cohesion and clarify the relationships among claim(s), counterclaims, reasons, and evidence.
e) Provide a concluding statement or section that follows from and supports the argument presented.
COMMON CORE CORRELATION GUIDE FOR UNIT 7.4.g. 7
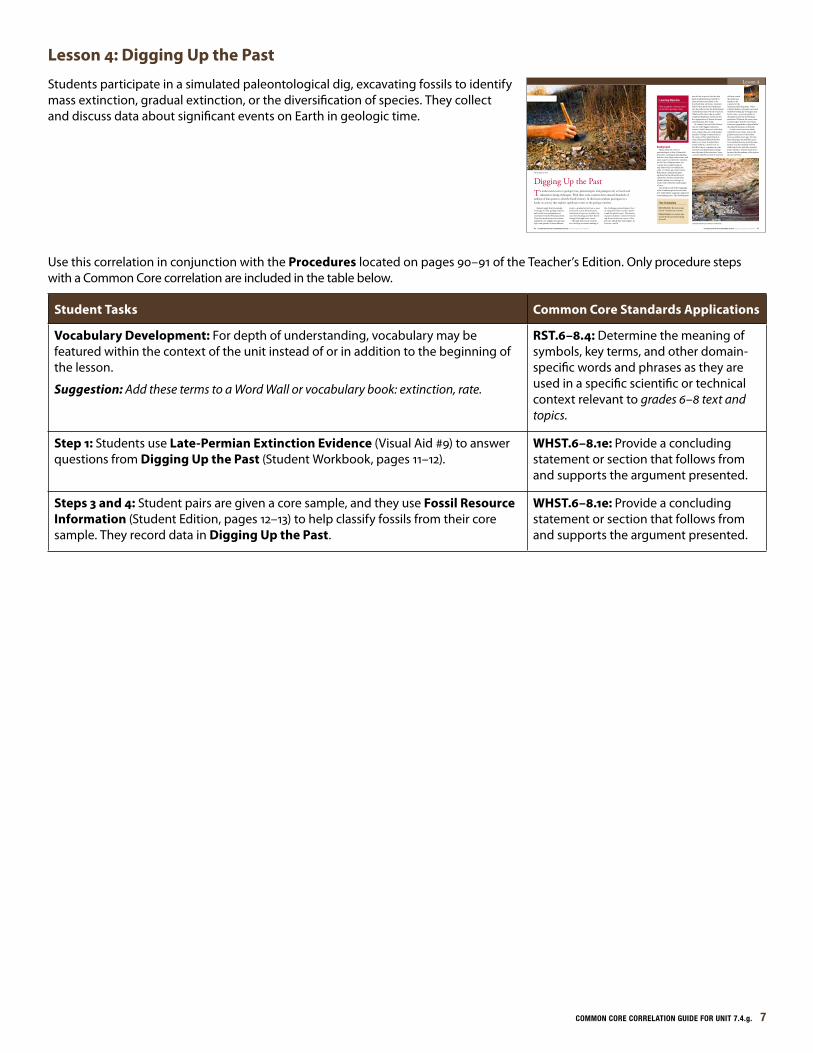
Lesson 4: Digging Up the Past
Students participate in a simulated paleontological dig, excavating fossils to identify mass extinction, gradual extinction, or the diversification of species. They collect and discuss data about significant events on Earth in geologic time.
Extinction: Past and Present
86 CALIFORNIA EDUCATION AND THE ENVIRONMENT INITIATIVE I Unit 7.4.g. I Extinction: Past and Present CALIFORNIA EDUCATION AND THE ENVIRONMENT INITIATIVE I Unit 7.4.g. I Extinction: Past and Present 87
Lesson 4
BackgroundMany liken the work of
paleontologists to that of homicide detectives: carrying on investigations with few clues, large crime scenes, and many suspects to interview. Scientists use the Law of Superposition, the concept that younger fossils sit atop older fossils, to establish the order, or relative age, of past events. Radiometric dating determines age based on the natural decay of radioactive isotopes and provides absolute dating, or actual ages, of fossils with a relatively small margin of error.
The fossil record of the beginning of the Cambrian period reveals that new multicellular organisms appeared at astonishing rates. This development
may be due in part to the fact that hard exoskeletons had evolved by then and were more likely to be fossilized than soft tissue. Scientists believe these hard outer shells may also have allowed for the development of additional types of body structures. Whatever the cause, this so-called Cambrian Explosion resulted in the first appearances of almost all major animal groups alive today.
By contrast, the end of the Triassic saw one of the biggest extinction events in Earth’s history. Fossils show a loss of more than 35% of all animal families. Geologic evidence hints at the causes of this rapid extinction event, which probably lasted fewer than 10,000 years. Scientists have found iridium, a metal rare on Earth but more common in some asteroids, in sediment layers dating near the time of the extinction. Some scientists hypothesize that an asteroid
collision caused the extinction, similar to the scenario for the extinction of the dinosaurs. Other scientists believe volcanism associated with the breaking up of Pangaea may be the cause—a concept similar to that proposed for the end-Permian extinction. Whatever the cause, most scientists agree that the end-Triassic extinction opened the ecological niche that allowed dinosaurs to flourish.
Fossils reveal even more about relatively recent events, such as the gradual extinction of the earliest horse 45 million years ago. The tiny hyracotherium, the probable ances-tor of modern horses, slowly became extinct as its descendants evolved with traits better suited for survival. Some call this a “pseudo extinction,” because the descendants of the extinct species survived.
Scientists searching for evidence of meteorites
| Key Vocabulary
Diversification: The increasing variety of species in a system.
Paleontologist: A scientist who studies Earth’s past by looking at fossils.
| Learning Objective
Give examples of extinctions on Earth in geologic time.
Lesson 4
Digging Up the Past
Students apply their knowledge of the age of rocks, geologic features, and fossils to an examination of rock layers from the Permian period. They then work in pairs to excavate simulated core samples that span geo-logic time periods of three different
events: a gradual extinction, a mass extinction, and a diversification (radiation) of species. Students dis-cuss their findings and how Earth changed through these events.
Through this lesson students also develop an understanding of
the challenges paleontologists face in using the fossil record to under-stand the planet’s past. This lesson expands students’ context for learn-ing about extinction events of the present, which they will explore in Lessons 5 and 6.
To understand events in geologic time, paleontologists and geologists rely on fossils and radiometric dating techniques. With these tools, scientists have amassed hundreds of
millions of data points to describe Earth’s history. In this lesson students participate in a hands-on activity that explores significant events on the geologic timeline.
Paleontologist at work
Use this correlation in conjunction with the Procedures located on pages 90–91 of the Teacher’s Edition. Only procedure steps with a Common Core correlation are included in the table below.
Student Tasks Common Core Standards Applications
Vocabulary Development: For depth of understanding, vocabulary may be featured within the context of the unit instead of or in addition to the beginning of the lesson.
Suggestion: Add these terms to a Word Wall or vocabulary book: extinction, rate.
RST.6–8.4: Determine the meaning of symbols, key terms, and other domain-specific words and phrases as they are used in a specific scientific or technical context relevant to grades 6–8 text and topics.
Step 1: Students use Late-Permian Extinction Evidence (Visual Aid #9) to answer questions from Digging Up the Past (Student Workbook, pages 11–12).
WHST.6–8.1e: Provide a concluding statement or section that follows from and supports the argument presented.
Steps 3 and 4: Student pairs are given a core sample, and they use Fossil Resource Information (Student Edition, pages 12–13) to help classify fossils from their core sample. They record data in Digging Up the Past.
WHST.6–8.1e: Provide a concluding statement or section that follows from and supports the argument presented.

8 COMMON CORE CORRELATION GUIDE FOR UNIT 7.4.g.
Lesson 5: Extinctions in the Present
Students think about human activities and how they can affect plant and animal life. As a class, they organize these ideas into categories. They read about endangered species in California and describe human activities that threaten the populations of these species.
Extinction: Past and Present
110 CALIFORNIA EDUCATION AND THE ENVIRONMENT INITIATIVE I Unit 7.4.g. I Extinction: Past and Present CALIFORNIA EDUCATION AND THE ENVIRONMENT INITIATIVE I Unit 7.4.g. I Extinction: Past and Present 111
Lesson 5
contributed to the extinction of numerous megafauna. Human activity influences rates of extinction in a variety of ways; conservation biologists summarize these ways with the acronym HIPPO (habitat destruction, introduced species, pollution, population growth, and overexploitation). Habitat destruc-tion occurs when humans alter ecosystems to create communities to support their populations; to obtain resources, such as timber, coal, or minerals; and to control water systems through the construction and maintenance of dams and canals. In California, human activities have resulted in the loss of approximately 75% of original habitat. Introduced, or nonnative species influence food webs, endangering native species
as both competitors and predators. Pollution, such as the pesticide DDT, which has nearly destroyed many bird populations, alters the biochemical composition of systems, making them uninhabitable for some species. Population growth stresses ecosys-tems as humans use more resources and land for their growing needs. Overexploitation—illegal wildlife trade, overfishing, and other forms of overconsumption—have threatened species for thousands of years.
Combined, HIPPO factors place extraordinary stress on California’s ecosystems and many species within them. Although scientists have tracked only a small percentage of species in California, data strongly supports the idea that rates of species endangerment and
extinction are rising rapidly, in conjunction with growing human populations. In California alone, 158 animal and 125 plant species are considered threatened or endangered by either state or federal agencies.
Scientists consider Mediterranean-type ecosystems, such as those found in California, to be among the most vulnerable to global climate change and other consequences of human activity. These experts warn that species may not be able to adapt to human-generated inf luences. Furthermore, significant habitat fragmentation makes it difficult for species to migrate in search of better conditions. If species cannot adapt or migrate, they risk extinction. The accumulation of all of these consequences of human activities may cause extinction rates in California to rise, a prediction many scientists have made about California’s immediate future.
| Key Vocabulary
Endangered: The legal status of a plant or animal species that is in danger of becoming extinct.
Habitat destruction: Damaging a habitat to the extent that it cannot meet the needs of organisms that live and meet their needs there.
HIPPO: An acronym for the phrase, “habitat destruction, introduced species, pollution, population growth, and overexploitation.”
Nonnative species: Organisms that were not originally found in an area but were transported there through human activity.
Nimbus Dam, Folsom, California
Lesson 5
Extinctions in the PresentExtinction events are not confined to the ancient past of geologic time; most scientists believe
we are currently living through a mass extinction event both in California and around the globe. This lesson addresses current and potential future extinctions in California, focusing on the role of humans in these real and hypothetical events.
In this lesson students engage in a discussion about how human activities alter the environments in which they live, and how these changes affect different types of life within these systems. In a whole-class discussion students organize their thoughts into categories of different types of human activities that can
influence extinction. Students then work in groups to read case studies of endangered species in California that have in the past experienced, or are currently experiencing, significant population changes. Next, students apply the class categories to an analysis of the factors that may have contributed to these changes.
This lesson prepares students to explore the current global Holocene Extinction Event in the culminating lesson of the unit.
BackgroundHumans have dramatically
changed natural systems since the Pleistocene, when they likely
Dry lake bed, Tule Valley, Utah
| Learning Objective
Provide examples of human activities, and the resulting byproducts, that can cause rapid and/or significant changes to plant and animal life that might result in extinction.
Use this correlation in conjunction with the Procedures located on pages 114–115 of the Teacher’s Edition. Only procedure steps with a Common Core correlation are included in the table below.
Student Tasks Common Core Standards Applications
Vocabulary Development: For depth of understanding, vocabulary may be featured within the context of the unit instead of or in addition to the beginning of the lesson.
Suggestion: Add these terms to a Word Wall or vocabulary book: endangered, habitat, HIPPO, species, non-native species.
RST.6–8.4: Determine the meaning of symbols, key terms, and other domain-specific words and phrases as they are used in a specific scientific or technical context relevant to grades 6–8 text and topics.
Step 3: Students fill in categories on the Human Activities and Extinction concept map (Visual Aid #13).
Suggestion: After completing Human Activities and Extinction, have students complete this sentence frame as an exit slip: Reasons for habitat destruction include .
WHST.6–8.1e: Provide a concluding statement or section that follows from and supports the argument presented.
Step 4: In groups of 8, students select a California Threatened and Endangered Species card (Information Cards, #14–21). Each group will read their card to the class. Groups will then complete the HIPPO in California: Endangering Species chart (Student Workbook, pages 13–15).
RST.6–8.1: Cite specific textual evidence to support analysis of science and technical texts.
RST.6–8.8: Distinguish among facts…
SL.7.1: Engage effectively in a range of collaborative discussions (one-on-one, in groups, and teacher led) with diverse partners…, building on others’ ideas and expressing their own clearly.

COMMON CORE CORRELATION GUIDE FOR UNIT 7.4.g. 9
Lesson 6: Holocene Extinction Event
Students use statistical data to identify a relationship between the scope of human-caused alterations to natural systems and the current rate of extinction. They calculate current extinction rates and discuss the effects of extinction on human societies.
Extinction: Past and Present
130 CALIFORNIA EDUCATION AND THE ENVIRONMENT INITIATIVE I Unit 7.4.g. I Extinction: Past and Present CALIFORNIA EDUCATION AND THE ENVIRONMENT INITIATIVE I Unit 7.4.g. I Extinction: Past and Present 131
Lesson 6
| Learning Objective
Describe the effects when natural systems cannot adjust to human-caused alterations and how these effects are influenced by the nature of the system, as well as the scope, scale, duration and byproducts of the activity.
become extinct in the next 30 years. The highest rates of extinction are believed to be taking place in Earth’s tropical rainforests. These projected extinctions parallel those of the mass extinctions of the past.
The Holocene Extinction Event differs from past mass extinctions in that it is the only one driven by a single species: humans. Habitat loss related to human activities is a predominant cause of this rapid
extinction. Introduced species, pollution, human population growth, and overconsumption have also contributed to current extinctions. Global climate change and rising temperatures may prove to be a significant factor. The changing climate alters habitats through changed weather patterns and rises in sea level. The loss of species predicted to occur in the next decades will have a profound effect on human societies. Ecosystem goods and ecosystem services from food, fiber, and medicine to water and air purification and crop pollination will be affected. These changes, in turn, will affect global economies and political systems as humans work to adapt to the depletion of resources. Although extinction is a natural process, the scope and scale of the loss of species predicted for this current extinction event will bring cumulative consequences, both to natural systems and human societies. Recovering pre-Holocene Extinction Event levels of diversity will take tens of thousands of human generations.
Melting iceberg
| Key Vocabulary
Ecosystem goods: Tangible materials, such as timber and food, produced by natural systems, that are essential to human life, economies, and cultures.
Ecosystem services: The functions and processes that occur in natural systems, such as pollination, that support or produce ecosystem goods and help sustain human life, economies, and cultures.
Lesson 6
Holocene Extinction EventThis lesson focuses on the current mass extinction, the Holocene Extinction Event—
perhaps one of the most rapid extinctions in Earth’s history. Students learn about how the extinction of species alive today could alter both the natural systems in which we live and the way human communities operate.
Students examine data on the scope and scale of human changes to natural habitats and data on current extinctions. They calculate the cur-rent extinction rate and compare it to the background extinction rate deter-mined from fossil evidence. They conclude the lesson by exploring the bigger question: Why should we care about extinction?
BackgroundScientists have pinpointed five
historical extinction events that mark the loss of large percentages of species. Most agree we are living through the sixth mass extinction, called the Holocene Extinction Event. Researchers believe modern extinction rates to be 100 to 11,000 times higher than the background extinction rates
of the past 500 million years. These estimates of extinction rates cover a wide range of years, because scientists do not know how many species exist. The health of the populations of fewer than 3% of identified species has been formally evaluated. Even with a wide range of uncertainty and limited data, most biologists believe that 20% to 50% of all species alive today may
Logged forest habitat
Use this correlation in conjunction with the Procedures located on pages 134–135 of the Teacher’s Edition. Only procedure steps with a Common Core correlation are included in the table below.
Student Tasks Common Core Standards Applications
Vocabulary Development: For depth of understanding, vocabulary may be featured within the context of the unit instead of or in addition to the beginning of the lesson.
Suggestion: Add these terms to a Word Wall or vocabulary book: ecosystem, evaluate, depletion, generations.
RST.6–8.4: Determine the meaning of symbols, key terms, and other domain specific words and phrases as they are used in a specific scientific or technical context relevant to grades 6–8 text and topics.
Step 3 Students complete Why Extinction Matters (Student Workbook, pages 16–18) as they listen to information being read from Extinction Cards (Teacher’s Masters, pages 6–13).
RST.6–8.1: Cite specific textual evidence to support analysis of science and technical texts.
SL.7.2: Analyze the main ideas and supporting details presented in diverse media and formats (e.g., visually, quantitatively, orally) and explain how the ideas clarify a topic, text, or issue under study.
Step 4: Students look at data from Human Influence on Earth’s Natural Systems (Visual Aid #14) and Holocene Extinction Statistics (Visual Aid #15).
SL.7.1: Engage effectively in a range of collaborative discussions (one-on-one, in groups, and teacher led) with diverse partners…, building on others’ ideas and expressing their own clearly.
Unit AssessmentRefer to the introduction pages at the front of this document for information regarding the Traditional and Alternative Assessments for this unit and their Common Core correlations.

10 COMMON CORE CORRELATION GUIDE FOR UNIT 7.4.g.
California Connections and Common Core
Reading California Connections using a Common Core Reading and Writing Focus
ReadingScience teachers can further enhance the teaching of Common Core Reading Literacy Standards by noting the suggestions below and in the following pages while reading the California Connections selection for content. Explicitly teach students to pay attention to the structure of the text by noting the following:
■ ■■ Note how the author cites evidence to support main points and analysis. (RST.6–8.1)
■ ■■ Note how the author sets up the central ideas or conclusions; provide an accurate summary of the text distinct from prior knowledge or opinions. (RST.6–8.2)
■ ■■ Analyze how the author describes a scientific process or a multi-step procedure. (RST.6–8.3)
■ ■■ Note how the author explains the meaning of key terms, symbols, domain specific words, and phrases. (RST.6–8.4)
■ ■■ Analyze the structure the author uses to organize the text, including how the major sections contribute to the whole and to an understanding of the topic. (RST.6–8.5)
■ ■■ Analyze the author’s purpose in providing an explanation or describing a procedure. (RST.6–8.6)
■ ■■ Note how the information in the California Connections text integrates with information provided visually throughout the unit in diverse formats, including tables, charts, graphs, diagrams, maps, and quantitative data. (RST.6–8.7)
■ ■■ Distinguish among facts, reasoned judgment based on research findings, and speculation in a text, noting the reasoning and evidence used to support the author’s claim. (RST.6–8.8)
■ ■■ When other documents or media sources are included, compare and contrast the information presented in the various formats and resources with that from the text, noting how the information contributes to a coherent understanding. (RST.6–8.9)
■ ■■ Note comprehension strategies for understanding the text. (RST.6–8.10)
Note: Standard descriptions from the Reading Standards for Literacy in Science and Technical Subjects are paraphrased and combined, using terminology that applies to reading a California Connections selection.
WritingMany California Connections selections can be used as a model for future student writing tasks applying the Writing Literacy Standards by noting how the author structures the text, organizes the ideas, and provides well-chosen relevant and sufficient facts, extended definitions, concrete details, quotations, or other information and examples.
Using the California Connections SelectionThe following pages note specific places where the California Connections selection provides examples for specific Writing Literacy Standards for Science and Technical subjects, using this selection as a writing model. They also provide suggestions for teaching students to analyze text structure using the Reading Literacy Standards for Science and Technical Subjects. Teachers can incorporate more suggestions from the list above. In addition, for teachers of self-contained classrooms, ELA standards are included.

COMMON CORE CORRELATION GUIDE FOR UNIT 7.4.g. 11
California Connections and Common Core
2 CALIFORNIA EDUCATION AND THE ENVIRONMENT INITIATIVE I Unit 7.4.g. I Extinction: Past and Present I Student Edition
Fitting the Pieces Together
The great number and variety of fossils at La Brea make it a unique site; the tar there has preserved the full spectrum of Pleistocene life. The millions of bones at La Brea come in all sizes: the pits contain microfossils too small to see with the naked eye, as well as bones from larger animals, or megafauna, such as the American mastodon, saber-toothed cat, and ancient bison. Using fossils as puzzle pieces, we can assemble a picture of climate, landscape, and plant and animal life in the Pleistocene. This picture includes evidence of climate change, biodiversity, and extinction.
Evidence of Climate Change
Modern-day Los Angeles experiences a warm, dry
Puzzle in the “Tar” PitsBuried in the heart of Los Angeles sits one of the world’s most impressive collections
of ice age fossils in the La Brea Tar Pits. These bubbling black pits contain a
snapshot of life from between 40,000 and 10,000 years ago. The Spanish word
la brea means “the tar,” but the sticky black ooze in these pits is like asphalt, with
which we pave some streets.
Pieces of a PuzzleThe ocean covered
Los Angeles more than 100,00 years ago. The plants and animals that lived there fell to the ocean floor when they died. Over time, they became part of the ocean’s sedimentary layers, where they turned into crude oil as a result of heat and the pressure of one layer building upon another. When the ocean receded, tar from this oil seeped out of the ground and formed pools. More than 100 pools, called pits, are found in Los Angeles, though not all are visible.
Tens of thousands of years ago, the sticky material trapped animals, especially during the warmer summer months when it softened and was hidden by a layer of dust and leaves that stuck
to its surface. The animals died and decayed there. Scientists believe that bones from other dead animals likely washed into the pits from nearby streams. When the tar hardened in the cooler winter months, the bones became sealed in the pits. When summer returned, the tar softened again, forming new traps. Today the pits contain millions of bones and other debris from plants and animals.
Scientists did not realize the significance of the fossils in the pits until approximately 100 years ago. The first excavations of the site began in 1901. Since then scientists have collected more than 3.5 million fossils belonging to more than 650 species of plants, animals, and insects from the late Pleistocene.
California Connections: Puzzle in the “Tar” Pits
Lesson 1 | page 1 of 4
RST.6–8.4: Determine the meaning of symbols, key terms, and other domain-specific words and phrases as they are used in a specific scientific or technical context to grades 6–8 texts and topics.
RST.6–8.1: Cite specific textual evidence to support analysis of science and technical texts.
SL.7.1a: Come to discussions prepared, having read or researched material under study; explicitly draw on that preparation by referring to evidence on the topic, text, or issue to probe and reflect ideas under discussion.

12 COMMON CORE CORRELATION GUIDE FOR UNIT 7.4.g.
California Connections and Common Core
CALIFORNIA EDUCATION AND THE ENVIRONMENT INITIATIVE I Unit 7.4.g. I Extinction: Past and Present I Student Edition 3
California Connections: Puzzle in the “Tar” Pits
Lesson 1 | page 2 of 4
climate. Microfossils reveal that the late Pleistocene climate was a little different. Although Southern California was not covered by a glacier during the last ice age, it was still cooler than it is today. Seeds from La Brea fossils include those of coast redwoods, incense cedars, and cottonwoods, all trees that need a steady
water supply throughout the year. The large numbers of fish, frog, and turtle fossils show that the climate must have been wet enough to support the streams and ponds these animals need to survive. In fact, the climate of Los Angeles during that period may have been much like the moist, cool climate of present-day San Francisco.
Water-loving plants and animals no longer live in Los Angeles. From fossil evidence, scientists estimate that the climate became warmer and drier between 18,000 and 11,500 years ago. Evidence of Biodiversity
Scientists continue to use fossils to reconstruct the entire ecosystem at La Brea. The collection includes microfossils, such as those of seeds or small insects, large plant eaters (herbivores), meat eaters (carnivores), and even scavengers. Using seed fossils, scientists have identified 158 different plant species. The fossil collection also includes more than one million invertebrates, such as grasshoppers, flies, and scorpions. Small vertebrate fossils from frogs, toads, salamanders, snakes, turtles, and fish number in the thousands. Most of these species still live in California today.
Scientists have discovered many large animals in the tar pits. They look at the shape of fossilized teeth and jawbones to figure out what these La Brea Tar Pits, Los Angeles, California
SL.7.1a: Come to discussions prepared, having read or researched material under study; explicitly draw on that preparation by referring to evidence on the topic, text, or issue to probe and reflect ideas under discussion.
RST.6–8.4: Determine the meaning of symbols, key terms, and other domain-specific words and phrases as they are used in a specific scientific or technical context to grades 6–8 texts and topics.

COMMON CORE CORRELATION GUIDE FOR UNIT 7.4.g. 13
California Connections and Common Core
4 CALIFORNIA EDUCATION AND THE ENVIRONMENT INITIATIVE I Unit 7.4.g. I Extinction: Past and Present I Student Edition
Hunter in the ice age
animals ate. For example, the broad, flat molars of the Columbian mammoth were ideal for grinding grasses. Its relative, the American mastodon, probably dined on leaves and twigs. Other herbivores in the tar include the ancient bison, western camel, and giant ground sloth.
Among the large fossils at La Brea, carnivores outnumbered herbivores almost nine to one. Scientists believe this ratio results from the fact that plant eaters trapped in the tar attracted meat eaters to the pits. The carnivores became trapped while feeding on the carcasses. Scavengers, in turn, also became stuck while feeding. The most common mammal fossil in the pits is a carnivore called the dire wolf. Scientists believe this wolf hunted in packs, as a result many of them got trapped at one time. Researchers have found other carnivore fossils too, including short-faced bears, American lions, and saber-toothed cats. Some types of carnivores found in the pit, such as the bobcat, coyote, and weasel, still live in California today.
Bird fossils are less common than fossils of many other animals because their bones are hollow and fragile, making them less likely to be preserved. Even so, scientists have discovered more than 100,000 bird fossils in La Brea’s tar, comprising one of the largest collections in the world. These remains include ancestors of birds, such as the California condor, that still live in California. Others, such as the Merriam’s
teratorn, are now extinct. The teratorn is the largest bird fossil pulled from La Brea; it stood more than two-feet tall with a wingspan of more than 10 feet.
Evidence of ExtinctionThe fossil record at La
Brea bears witness to the demise of many species at the end of the last ice age. Around 12,000 years ago many animals began dying out. Scientists know these animals died out
California Connections: Puzzle in the “Tar” Pits
Lesson 1 | page 3 of 4
RST.6–8.4: Determine the meaning of symbols, key terms, and other domain-specific words and phrases as they are used in a specific scientific or technical context to grades 6–8 texts and topics.

14 COMMON CORE CORRELATION GUIDE FOR UNIT 7.4.g.
California Connections and Common Core
CALIFORNIA EDUCATION AND THE ENVIRONMENT INITIATIVE I Unit 7.4.g. I Extinction: Past and Present I Student Edition 5
California Connections: Puzzle in the “Tar” Pits
Lesson 1 | page 4 of 4
then because there are no fossils of these animals in the youngest, uppermost parts of the tar pits. The most affected were large mammals. Large herbivores, such as the mammoth, mastodon, ground sloth, ancient bison, and western camel, disappeared. Carnivores like the dire wolf, short-faced bear, American lion, and saber-toothed cat also went extinct. Scientists believe one or more of three factors—disease, overkill by humans, and climate change—may explain this extinction event.
People brought diseases with them when they began
settling North America about 500 years ago. Some scientists think the pets of these settlers spread the diseases to vulnerable wild animals. The second possible factor, nicknamed the “overkill theory,” suggests that humans caused extinctions through hunting too much. Perhaps humans killed large herbivores for food, starving the predators that ate the herbivores? Scientists at La Brea do not have much evidence for these theories, especially because they have found only one human skeleton there. At other fossil sites in North America, scientists have found sharpened stone points they believe were used for hunting. Scientists wonder about a connection between the extinctions and the arrival of humans because the two events happened at around the same time.
Scientists who believe the third factor, climate change, is responsible for extinctions think that as the climate warmed, streams and ponds dried up. The plants near the water died or adapted
to a more arid environment. A chain reaction went all the way up the food web, starting with the herbivores. As the herbivores struggled to survive, the carnivores had fewer prey to hunt. Some scientists believe a combination of all three factors contributed to the extinctions. What Does This Mean for the Future?
The La Brea Tar Pits offer a unique glimpse of changes around the end of the last the ice age. The fossil record excavated from the tar pits helps us understand climate change during Earth’s past. Scientists can apply this knowledge to their study of current climate changes. Dr. Blaire Van Valkenburgh, a UCLA researcher, describes how understanding the ice age climate can help scientists predict the influence of present-day global climate change. “When environmental change happens very rapidly, animals cannot adapt. They have nowhere to move and competition becomes fierce. Some will become extinct.”Mammoth and Mastodon
RST.6–8.1: Cite specific textual evidence to support analysis of science and technical texts.
RST.6–8.4: Determine the meaning of symbols, key terms, and other domain-specific words and phrases as they are used in a specific scientific or technical context to grades 6–8 texts and topics.
RST.6–8.2: Determine the central ideas or conclusions of a text; provide an accurate summary of the text distinct from prior knowledge or opinions.
WHST.6–8.1: Provide a concluding statement or section that follows from and supports the argument presented.

COMMON CORE CORRELATION GUIDE FOR UNIT 7.4.g. 15
California Common Core State Standards Descriptions
Reading Standards for Literacy in Science and Technical Subjects■ ■■ RST.6–8.1: Cite specific textual evidence to support analysis of science and technical texts.
■ ■■ RST.6–8.2: Determine the central ideas or conclusions of a text; provide an accurate summary of the text distinct from prior knowledge or opinions.
■ ■■ RST.6–8.4: Determine the meaning of symbols, key terms, and other domain-specific words and phrases as they are used in a specific scientific or technical context relevant to grades 6–8 texts and topics.
■ ■■ RST.6–8.7: Integrate quantitative or technical information expressed in words in a text with a version of that information expressed visually (e.g., in a flowchart, diagram, model, graph, or table).
■ ■■ RST.6–8.8: Distinguish among facts, reasoned judgment based on research findings, and speculation in a text.
■ ■■ RST.6–8.9: Compare and contrast the information gained from experiments, simulations, video, or multimedia sources with that gained from reading a text on the same topic.
■ ■■ RST.6–8.10: By the end of grade 8, read and comprehend science/technical texts in the grades 6–8 text complexity band independently and proficiently.
Speaking and Listening Standards■ ■■ SL.7.1: Engage effectively in a range of collaborative discussions (one-on-one, in groups, and teacher-led) with diverse
partners on grade 7 topics, texts, and issues, building on others’ ideas and expressing their own clearly.
a) Come to discussions prepared, having read or researched material under study; explicitly draw on that preparation by referring to evidence on the topic, text, or issue to probe and reflect on ideas under discussion.
■ ■■ SL.7.2: Analyze the main ideas and supporting details presented in diverse media and formats (e.g., visually, quantitatively, orally) and explain how the ideas clarify a topic, text, or issue under study.
Writing Standards for Literacy in History/Social Studies, Science, and Technical Subjects■ ■■ WHST.6–8.1: Write arguments focused on discipline-specific content.
c) Use words, phrases, and clauses to create cohesion and clarify the relationships among claim(s), counterclaims, reasons, and evidence.
e) Provide a concluding statement or section that follows from and supports the argument presented.
Common Core Reference Pages