Embed Size (px)
Citation preview
TDWI BENCHMARK GUIDE
TDWI REsEARCH 2014–2015
tdwi.org
TDWI Analytics Maturity Model GuideBy Fern Halper and David stodder
Research Sponsors
Research Sponsors
Cloudera, Inc.
MicroStrategy
Tableau Software
tdwi.org 1
By Fern Halper and David stodder
Table of ContentsForeword from the Authors . . . . . . . . . . . . . . . . . . . . . . 3
Reason for the Model . . . . . . . . . . . . . . . . . . . . . . . . 3
Value of the Model . . . . . . . . . . . . . . . . . . . . . . . . . . 3
Introduction . . . . . . . . . . . . . . . . . . . . . . . . . . . . . . 4
Model Dimensions . . . . . . . . . . . . . . . . . . . . . . . . . . 4
Setting the Stage: Definitions . . . . . . . . . . . . . . . . . . . . 5
Trends in Analytics . . . . . . . . . . . . . . . . . . . . . . . . . . 6
TDWI Analytics Maturity Model: The Context for Benchmark Scores . . . . . . . . . . . . . . . . . . 9
Stages of Maturity . . . . . . . . . . . . . . . . . . . . . . . . . . 10
Stage 1: Nascent . . . . . . . . . . . . . . . . . . . . . . . . . . 10
Stage 2: Pre-Adoption . . . . . . . . . . . . . . . . . . . . . . . 11
Stage 3: Early Adoption . . . . . . . . . . . . . . . . . . . . . . 12
The Chasm. . . . . . . . . . . . . . . . . . . . . . . . . . . . . 13
Stage 4: Corporate Adoption . . . . . . . . . . . . . . . . . . . . 15
Stage 5: Mature/Visionary . . . . . . . . . . . . . . . . . . . . . 16
Evaluating Benchmark Scores . . . . . . . . . . . . . . . . . . . 17
Scoring. . . . . . . . . . . . . . . . . . . . . . . . . . . . . . . 17
Interpretation. . . . . . . . . . . . . . . . . . . . . . . . . . . . 18
Summary . . . . . . . . . . . . . . . . . . . . . . . . . . . . . . . 18
Research Sponsors . . . . . . . . . . . . . . . . . . . . . . . . . 19
Cloudera, Inc. . . . . . . . . . . . . . . . . . . . . . . . . . . . 19
MicroStrategy . . . . . . . . . . . . . . . . . . . . . . . . . . . 19
Tableau Software . . . . . . . . . . . . . . . . . . . . . . . . . 19
TDWI Analytics Maturity Model GuideInterpreting Your Assessment Score
2014–2015TDWI BENCHMARK GUIDE
TDWI REsEARCH
© 2014 by TDWI (The Data Warehousing InstituteTM), a division of 1105 Media, Inc. All rights reserved. Reproductions in whole or in part are prohibited except by written permission. E-mail requests or feedback to [email protected]. Product and company names mentioned herein may be trademarks and/or registered trademarks of their respective companies.
2 TDWI REsEARCH
TDWI Analytics Maturity Model Guide
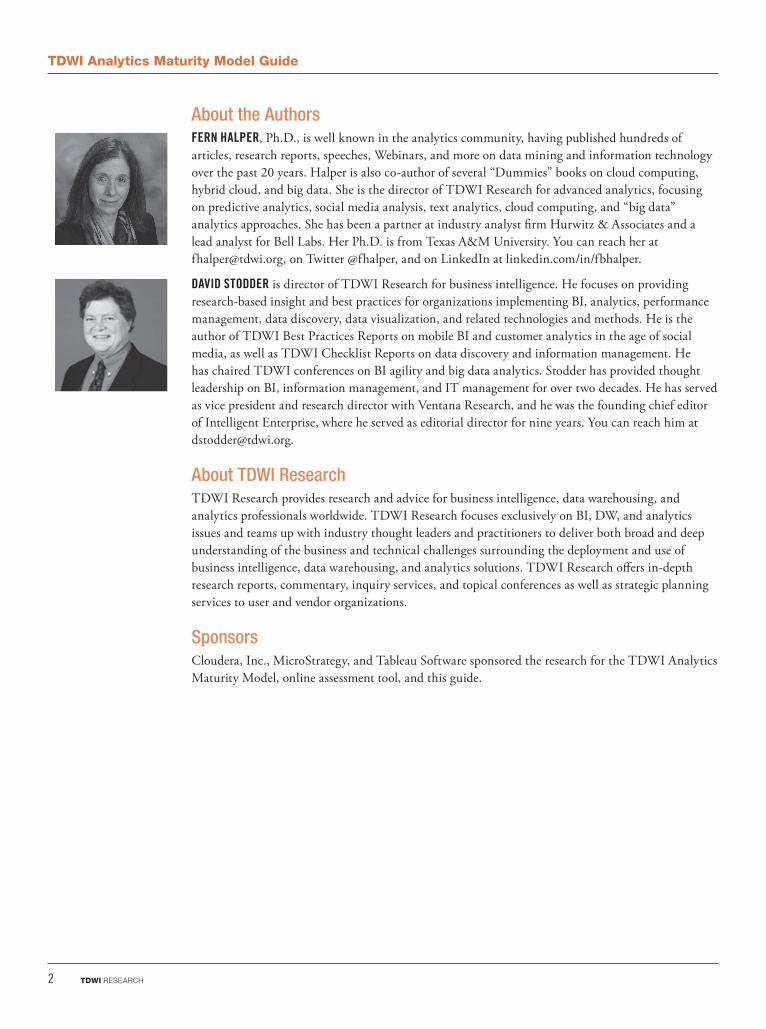
About the AuthorsFERn HAlpER, Ph.D., is well known in the analytics community, having published hundreds of articles, research reports, speeches, Webinars, and more on data mining and information technology over the past 20 years. Halper is also co-author of several “Dummies” books on cloud computing, hybrid cloud, and big data. She is the director of TDWI Research for advanced analytics, focusing on predictive analytics, social media analysis, text analytics, cloud computing, and “big data” analytics approaches. She has been a partner at industry analyst firm Hurwitz & Associates and a lead analyst for Bell Labs. Her Ph.D. is from Texas A&M University. You can reach her at [email protected], on Twitter @fhalper, and on LinkedIn at linkedin.com/in/fbhalper.
DAvID SToDDER is director of TDWI Research for business intelligence. He focuses on providing research-based insight and best practices for organizations implementing BI, analytics, performance management, data discovery, data visualization, and related technologies and methods. He is the author of TDWI Best Practices Reports on mobile BI and customer analytics in the age of social media, as well as TDWI Checklist Reports on data discovery and information management. He has chaired TDWI conferences on BI agility and big data analytics. Stodder has provided thought leadership on BI, information management, and IT management for over two decades. He has served as vice president and research director with Ventana Research, and he was the founding chief editor of Intelligent Enterprise, where he served as editorial director for nine years. You can reach him at [email protected].
About TDWI ResearchTDWI Research provides research and advice for business intelligence, data warehousing, and analytics professionals worldwide. TDWI Research focuses exclusively on BI, DW, and analytics issues and teams up with industry thought leaders and practitioners to deliver both broad and deep understanding of the business and technical challenges surrounding the deployment and use of business intelligence, data warehousing, and analytics solutions. TDWI Research offers in-depth research reports, commentary, inquiry services, and topical conferences as well as strategic planning services to user and vendor organizations.
SponsorsCloudera, Inc., MicroStrategy, and Tableau Software sponsored the research for the TDWI Analytics Maturity Model, online assessment tool, and this guide.
tdwi.org 3
Foreword
Foreword from the Authors
Reason for the ModelToday, many organizations realize that analytics and advanced analytics can provide an important competitive advantage. These organizations want to evolve their analytics strategies beyond spreadsheets or simple dashboards; many seek to build a broad “analytics culture” in which data analysis plays an essential role in all decisions and is fundamental to business collaboration. Analytics is rapidly becoming more self-service and democratized. More frequently, agile development methods are being used in analytics deployments so users can realize business value from projects sooner.
Over the past few years, TDWI has seen predictive analytics serve as a foothold for more advanced analytics. Other advanced analytics technologies will also begin to gain momentum, including geospatial analytics, text analytics, clickstream analysis, operational intelligence, and real-time analytics. Big data, including machine data and the Internet of things (IoT), is driving activity in advanced analytics, too. TDWI expects interest will continue to build for analytics technologies and methods, particularly as organizations include less traditional users in their growing analytics cultures.
We created the TDWI Analytics Maturity Model and assessment tool in response to organizations’ need to understand how their analytics deployments compare to those of their peers and to provide best-in-class insight and support. The assessment measures the maturity of an analytics program objectively across many dimensions that are key to deriving value from analytics.
Value of the ModelThe Analytics Maturity Model can help guide IT and business professionals on their analytics journey. It provides a framework for companies to understand where they are, where they’ve been, and where they still need to go in their analytics deployments. The model can also provide guidance for companies at the beginning of their analytics process by helping them understand best practices used by companies that are more mature in their deployments.
A great feature of the Analytics Maturity Model is the interactive benchmark assessment. At the end of the benchmark survey, you will be able to objectively quantify the maturity of your deployment, understand your progress, and identify what it will take to get to the next level of maturity. This benchmark guide is designed to help you understand the phases of maturity in analytics as well as help you interpret your benchmarking scores. We trust you will find it useful.
Fern Halper, Director for Advanced Analytics, TDWI Research
David Stodder, Director for Business Intelligence, TDWI Research
4 TDWI REsEARCH
TDWI Analytics Maturity Model Guide
IntroductionA perfect storm of factors has come together to make analytics a mainstream technology. Research indicates companies that utilize analytics are 5 percent more productive and 6 percent more profitable than other companies.1 Organizations are realizing that analytics can provide valuable insight to help them compete. Vendors are making analytics easier to use and consume. The computing power exists for iterative analyses. The result is that analytics adoption is accelerating, and not just among statisticians, data scientists, and others with degrees in math or statistics. Business analysts and casual users are also making use of the technology.
Many companies are interested in expanding their analytics footprint but don’t know where to start. Others are early in their analytics journey and want to understand what they should be doing next. Still others may have been unsuccessful in their analytics efforts and need additional insights. Many have had success and want to know what they should be doing to get to the next level. Insights and best practices for moving forward would be valuable for these companies.
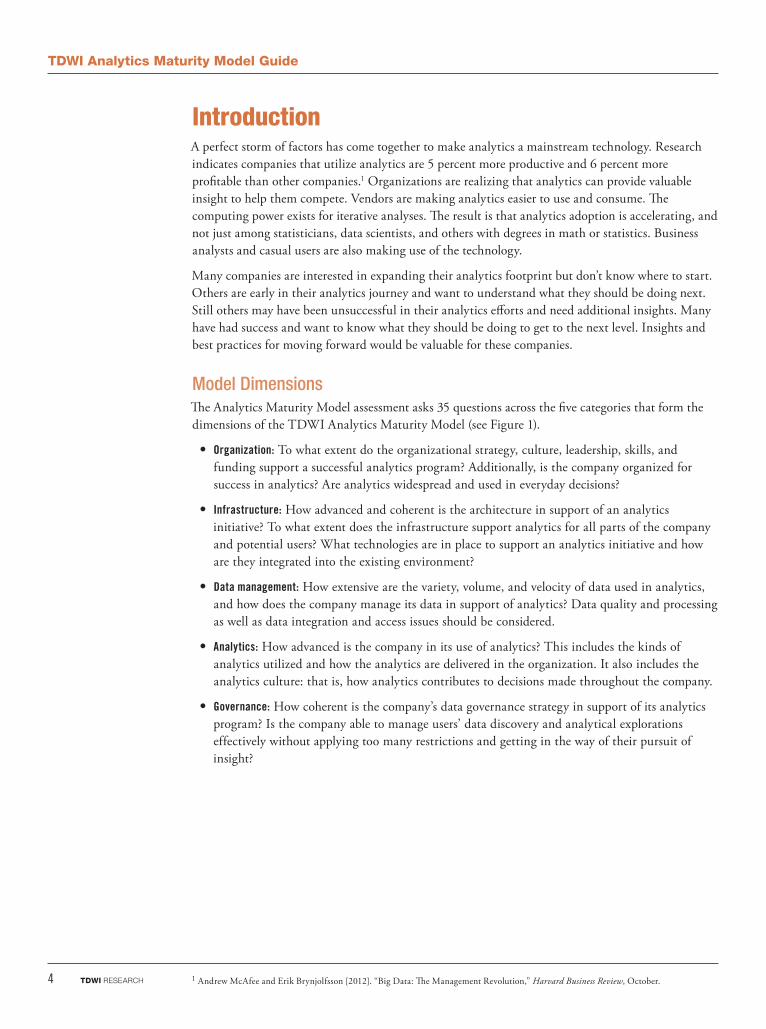
Model DimensionsThe Analytics Maturity Model assessment asks 35 questions across the five categories that form the dimensions of the TDWI Analytics Maturity Model (see Figure 1).
• organization: To what extent do the organizational strategy, culture, leadership, skills, and funding support a successful analytics program? Additionally, is the company organized for success in analytics? Are analytics widespread and used in everyday decisions?
• Infrastructure: How advanced and coherent is the architecture in support of an analytics initiative? To what extent does the infrastructure support analytics for all parts of the company and potential users? What technologies are in place to support an analytics initiative and how are they integrated into the existing environment?
• Data management: How extensive are the variety, volume, and velocity of data used in analytics, and how does the company manage its data in support of analytics? Data quality and processing as well as data integration and access issues should be considered.
• Analytics: How advanced is the company in its use of analytics? This includes the kinds of analytics utilized and how the analytics are delivered in the organization. It also includes the analytics culture: that is, how analytics contributes to decisions made throughout the company.
• Governance: How coherent is the company’s data governance strategy in support of its analytics program? Is the company able to manage users’ data discovery and analytical explorations effectively without applying too many restrictions and getting in the way of their pursuit of insight?
1 Andrew McAfee and Erik Brynjolfsson [2012]. “Big Data: The Management Revolution,” Harvard Business Review, October.
tdwi.org 5
Introduction
Dimensions
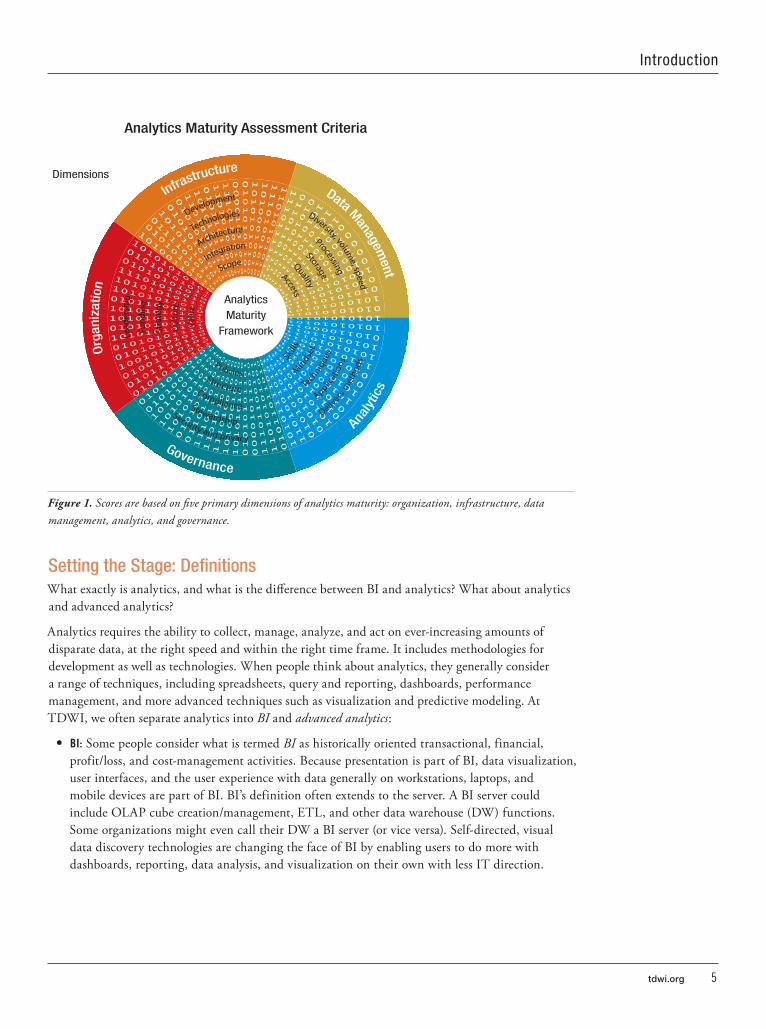
Analytics Maturity Assessment Criteria
Org
aniz
atio
n
Governance
Analy
tics
Data Managem
ent
Infrastructure
ScopeIntegrationArchitectureTechnologiesDevelopmentVa
lue
Cultu
re
Stra
tegy
Fund
ing
Lead
ersh
ip
PoliciesStructureComplianceStewardshipSecurity and privacy
Skills
Mindse
t
Technique
s
Applicat
ions
Delivery
met
hods
AccessQuality
Storage
Processing
Diversity, volume, speed
AnalyticsMaturity
Framework
Figure 1. Scores are based on five primary dimensions of analytics maturity: organization, infrastructure, data management, analytics, and governance.
Setting the Stage: DefinitionsWhat exactly is analytics, and what is the difference between BI and analytics? What about analytics and advanced analytics?
Analytics requires the ability to collect, manage, analyze, and act on ever-increasing amounts of disparate data, at the right speed and within the right time frame. It includes methodologies for development as well as technologies. When people think about analytics, they generally consider a range of techniques, including spreadsheets, query and reporting, dashboards, performance management, and more advanced techniques such as visualization and predictive modeling. At TDWI, we often separate analytics into BI and advanced analytics:
• BI: Some people consider what is termed BI as historically oriented transactional, financial, profit/loss, and cost-management activities. Because presentation is part of BI, data visualization, user interfaces, and the user experience with data generally on workstations, laptops, and mobile devices are part of BI. BI’s definition often extends to the server. A BI server could include OLAP cube creation/management, ETL, and other data warehouse (DW) functions. Some organizations might even call their DW a BI server (or vice versa). Self-directed, visual data discovery technologies are changing the face of BI by enabling users to do more with dashboards, reporting, data analysis, and visualization on their own with less IT direction.
6 TDWI REsEARCH
TDWI Analytics Maturity Model Guide
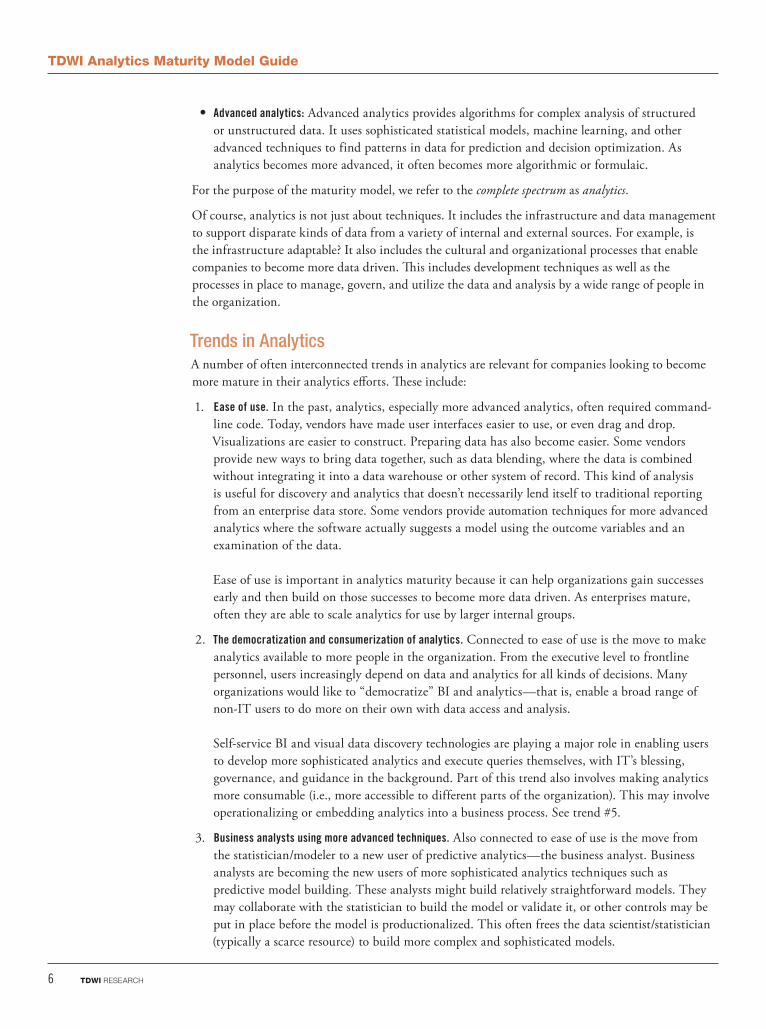
• Advanced analytics: Advanced analytics provides algorithms for complex analysis of structured or unstructured data. It uses sophisticated statistical models, machine learning, and other advanced techniques to find patterns in data for prediction and decision optimization. As analytics becomes more advanced, it often becomes more algorithmic or formulaic.
For the purpose of the maturity model, we refer to the complete spectrum as analytics.
Of course, analytics is not just about techniques. It includes the infrastructure and data management to support disparate kinds of data from a variety of internal and external sources. For example, is the infrastructure adaptable? It also includes the cultural and organizational processes that enable companies to become more data driven. This includes development techniques as well as the processes in place to manage, govern, and utilize the data and analysis by a wide range of people in the organization.
Trends in AnalyticsA number of often interconnected trends in analytics are relevant for companies looking to become more mature in their analytics efforts. These include:
1. Ease of use . In the past, analytics, especially more advanced analytics, often required command-line code. Today, vendors have made user interfaces easier to use, or even drag and drop. Visualizations are easier to construct. Preparing data has also become easier. Some vendors provide new ways to bring data together, such as data blending, where the data is combined without integrating it into a data warehouse or other system of record. This kind of analysis is useful for discovery and analytics that doesn’t necessarily lend itself to traditional reporting from an enterprise data store. Some vendors provide automation techniques for more advanced analytics where the software actually suggests a model using the outcome variables and an examination of the data. Ease of use is important in analytics maturity because it can help organizations gain successes early and then build on those successes to become more data driven. As enterprises mature, often they are able to scale analytics for use by larger internal groups.
2. The democratization and consumerization of analytics . Connected to ease of use is the move to make analytics available to more people in the organization. From the executive level to frontline personnel, users increasingly depend on data and analytics for all kinds of decisions. Many organizations would like to “democratize” BI and analytics—that is, enable a broad range of non-IT users to do more on their own with data access and analysis. Self-service BI and visual data discovery technologies are playing a major role in enabling users to develop more sophisticated analytics and execute queries themselves, with IT’s blessing, governance, and guidance in the background. Part of this trend also involves making analytics more consumable (i.e., more accessible to different parts of the organization). This may involve operationalizing or embedding analytics into a business process. See trend #5.
3. Business analysts using more advanced techniques . Also connected to ease of use is the move from the statistician/modeler to a new user of predictive analytics—the business analyst. Business analysts are becoming the new users of more sophisticated analytics techniques such as predictive model building. These analysts might build relatively straightforward models. They may collaborate with the statistician to build the model or validate it, or other controls may be put in place before the model is productionalized. This often frees the data scientist/statistician (typically a scarce resource) to build more complex and sophisticated models.
tdwi.org 7
Introduction
4. newer kinds of analytics . In addition to predictive models, other kinds of analytics are emerging to help drive business value. These include text analytics, social media analytics, geospatial analytics, and clickstream analysis. Text analytics is the process of analyzing unstructured text, extracting relevant information, and transforming it into structured information that can be leveraged in various ways. It is useful in understanding the “why” behind what has happened. It can be used on both internal and external data to extract important concepts, themes, or sentiments from the data. Text analytics can also be leveraged for social media analytics. Geospatial analytics involves the manipulation and analysis of geospatial data—often called location or spatial data. This includes geocoded, remote sensing, and GPS data, and statistical techniques as well as techniques designed for spatial and spatial/temporal data. Clickstream analysis helps organizations understand the behavior of customers on their websites. All of these techniques are starting to become more mainstream and can provide important insight, either by themselves or in combination with other techniques. Typically, the more mature an organization is in its analytics efforts, the more it makes use of newer forms of analysis.
5. operationalizing analytics . When you operationalize something, you make it part of a business process. Operationalizing analytics is important because it helps make analytics more actionable and hence drive more value. For example, a statistician might build a predictive model that predicts churn. The model is then embedded in a system. As customers call a company, they are scored by the model. Based on this score, information is then passed to a call center agent as part of a business process—say, to up- or cross-sell the customer or take other measures to retain them. The agent doesn’t need to know how the model works behind the scenes but can make important use of the output for business advantage. Operationalizing analytics also helps make it more consumable, and this is an important trend.
6. Big data . Big data—ever increasing amounts of disparate data at varying velocities—is the buzzword du jour. However, it is much more than that. An important point about big data is that it is helping to drive the use of already existing techniques as well as the development of new techniques for data analysis. Big data is also driving the use of newer infrastructure such as Hadoop and multi-platform data warehouse environments that manage, process, and analyze new forms of big data, non-structured data, and real-time data. This might include NoSQL databases, DW appliances, and columnar databases. Other technologies such as in-memory analytics are also gaining steam. Leveraging big data processing tools allows analysts to perform queries on larger data sets—providing more robust models and deeper reports—and removes sampling errors that might occur with smaller data sets.
7. new development methods . Unlike with BI reporting, analytics often demands that users explore the data and try different visualizations and analytical techniques before they can arrive at the reports or other conclusions they are seeking. Analytics thus often demands a different methodology than has been used for most traditional IT projects to develop applications. Instead of “waterfall” methods and cycles that do not deliver until the end of (usually) one long cycle, many organizations are employing agile methods. These faster, incremental cycles have
8 TDWI REsEARCH
TDWI Analytics Maturity Model Guide
helped guide organizations toward greater business-IT collaboration, faster and more iterative development cycles, and ultimately higher quality and satisfaction.
8. open source . Open source is rapidly becoming more popular for infrastructure as well as analytics. Hadoop is a prime example of how open source technologies are becoming important in analytics. In fact, a whole ecosystem of tools and techniques has sprung up to make the Hadoop Distributed File System (HDFS) more user friendly. Commercial distributions of Hadoop are becoming more powerful. On the analytics front, the emergence of the R language is also evidence of the growing popularity of open source. Many analytics vendors are already incorporating support for R into their packages. The open source Python programming language is also increasingly popular for analytics. Open source is important because it enables a community to innovate, and that is what is happening around the analytics ecosystem.
9. The cloud. Although it has taken longer than some expected for the cloud to be used in BI, it is now starting to become mainstream. One reason organizations are trying to move toward cloud is to offset costs with zero capital expenditure on infrastructure, maintenance, and even personnel—often making BI more cost-effective. Additionally, time to deploy is shortened. Organizations are making use of various types of cloud deployment and delivery options for cloud BI and analytics. For example, if data is generated in the public cloud, it is often analyzed there as well. This analysis might be basic or complex. More often, companies are capturing big data in the cloud and then experimenting with it there. Based on the analysis, certain data is brought on premises to the data warehouse.
10. Mobile BI and analytics . The increasing adoption of mobile devices has opened up new platforms from which users can access data and both initiate and consume analytics. Executives on the go can apply analytics to gain deeper insight into business performance metrics, while frontline sales and service personnel can improve customer engagements by consuming data visualizations that integrate relevant data about warranty claims, customer preferences, and more. To address security, performance, and availability concerns, some organizations will deploy cloud services to provide BI and analytics platform support for mobile users.
11. Analytics platforms . TDWI Research indicates that more companies are adopting analytics platforms, which provide an integrated solution for analytics. This includes data management, data preparation, and data analysis capabilities. The platforms can help drive efficiencies into the analytics life cycle because they can help bring together the data as well as analyze it. The platform can be delivered in different ways: in the cloud, on premises, as an appliance, or in an integrated solution.
tdwi.org 9
TDWI Analytics Maturity Model: The Context for Benchmark Scores
TDWI Analytics Maturity Model: The Context for Benchmark ScoresAnalytics maturity can be described as the evolution of an organization to integrate, manage, and leverage all relevant internal and external data sources into key decision points. It means creating an ecosystem that enables insight and action. In other words, analytics maturity is not simply about having some technology in place; it involves technologies, data management, analytics, governance, and organizational components. It can take years to create and instill an analytics culture in an organization.
A maturity model for analytics is useful for any enterprise considering or in the process of implementing an analytics project. First, it helps create structure around an analytics program and determine where to start. It also helps identify and define the organization’s program goals and creates a process to communicate that vision across the entire organization. A maturity model will provide a methodology to measure and monitor the state of the program and the effort needed to complete the current stage, as well as steps to move to the next stage of maturity. It serves as a kind of odometer to measure and manage your progress and adoption within the company for an analytics program.
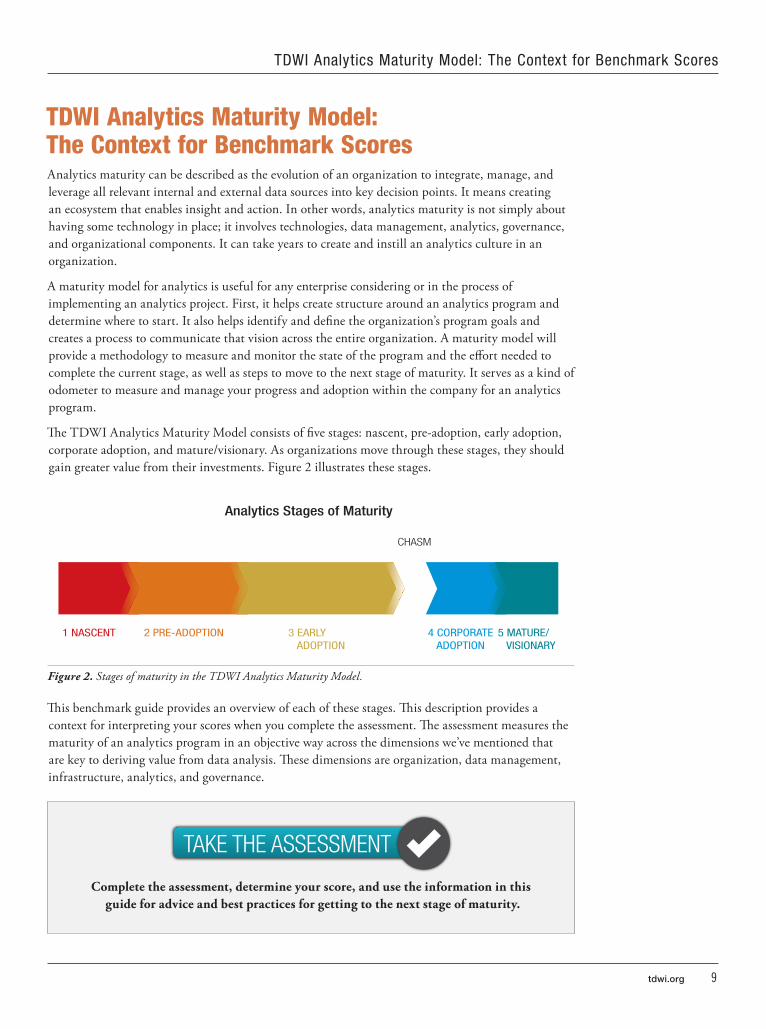
The TDWI Analytics Maturity Model consists of five stages: nascent, pre-adoption, early adoption, corporate adoption, and mature/visionary. As organizations move through these stages, they should gain greater value from their investments. Figure 2 illustrates these stages.
1 NASCENT 2 PRE-ADOPTION 3 EARLY ADOPTION
Analytics Stages of Maturity
4 CORPORATE ADOPTION
5 MATURE/ VISIONARY
CHASM
Figure 2. Stages of maturity in the TDWI Analytics Maturity Model.
This benchmark guide provides an overview of each of these stages. This description provides a context for interpreting your scores when you complete the assessment. The assessment measures the maturity of an analytics program in an objective way across the dimensions we’ve mentioned that are key to deriving value from data analysis. These dimensions are organization, data management, infrastructure, analytics, and governance.
TAKE THE ASSESSMENT
Complete the assessment, determine your score, and use the information in this guide for advice and best practices for getting to the next stage of maturity.
10 TDWI REsEARCH
TDWI Analytics Maturity Model Guide
Stages of Maturity
1 NASCENT 2 PRE-ADOPTION 3 EARLY ADOPTION
4 CORPORATE ADOPTION
5 MATURE/ VISIONARY
CHASM
Stage 1: NascentThe nascent stage represents a pre-analytics environment. In this stage, most companies are not utilizing analytics, except perhaps for a spreadsheet program. There is no real support for the effort, although there are pockets of people throughout the enterprise who may be interested in the potential value of analytics and who may be testing analytics software. Generally, in the nascent stage, the culture is not analytic. In other words, the culture is not data driven and decisions are made based on gut instinct rather than on fact.
organization . In the nascent organization, most executives are unaware of the power of analytics to help drive action. IT and the business typically do not work together to make analytics happen, although either group may want to. Often, IT is not particularly interested in helping the business get access to data unless it is under IT’s control because they believe they know best. Business may have developed its own systems for activities that might be useful for analysis, but the analyst is typically a spreadsheet super user. In this culture of non-collaboration, there may be pockets of people trying to get educated about newer kinds of analytics because they know the old ways won’t help them remain competitive.
Data management . Typically, the nascent organization has no sound data management strategy in place. IT may believe that it has some sort of data management strategy—perhaps with some databases or data sets that it uses for reporting—but hasn’t really thought about naming standards or metadata. Data quality and consistency may be poor. Data volumes are typically low or in disconnected silos, and data is generally structured only. On the business side, organizations are asking IT for data or reports. If they have their own data sources for a business activity, these are typically siloed for analysis, which is done by bringing spreadsheets together. It is a long undertaking to assemble a data set for analysis.
Analytics . In the nascent organization, the spreadsheet typically rules. Most of the analysis is slicing and dicing. Dashboards may be developed in a spreadsheet and e-mailed to those who “need to know.” If the company has an analytics group, it is generally within a department or line of business and targeted at a specific function such as marketing. In other words, analytics is occurring in pockets and silos in the organization and one group does not know what the other is doing. Best practices are not shared and there is no effort at creating a broader analytics culture involving non-traditional users of analytics. However, in many nascent organizations, employees are getting tired of not having access to data to make decisions. They want analytic tools so they can answer important business questions. They do not want to rely on IT because it takes too long to get at the data.
tdwi.org 11
Stages of Maturity
1 NASCENT 2 PRE-ADOPTION 3 EARLY ADOPTION
4 CORPORATE ADOPTION
5 MATURE/ VISIONARY
CHASM
Stage 2: Pre-AdoptionAs the company moves out of the nascent stage and into the pre-adoption stage, it is starting to do its homework about analytics. Staff may be reading about the topic and perhaps attending Webinars or conferences. One or more organizations may have invested in some analytics technology such as single instances of a low-cost front-end BI or data discovery tool or a back-end database, data mart, or data warehouse for managed reporting. People are starting to understand the power of analysis for improving decisions and ultimately business outcomes. Some key characteristics of the pre-adoption organization include:
organization: In the pre-adoption stage, often an executive sponsor has stepped up to drive the analytics discussion in the enterprise. The sponsor may be frustrated because decisions are being made in the absence of data, or the executive comes from an organization that is more data driven. Perhaps one group is starting to use commercially available tools to do some analysis, even if it is freeware. Other organizations will see what can be done and might get a project started. An analytics discussion is beginning.
Data management: Often, in the pre-adoption stage, business and/or IT leaders envision the potential value of combining multiple sources of data for analysis. The company has realized it needs a data infrastructure to support its efforts, even if those efforts don’t yet involve working with the business to develop the infrastructure. It may be that too many errors have been made with the existing data set, or someone is pointing out the errors in the data. Whatever the reason, the investment is starting for a data mart or data warehouse. Company leadership is beginning to think holistically about data (which is still typically structured only) from the disparate sources around the company. IT needs to step up to the plate and understand data quality issues, because the company is now thinking about putting together a shared data resource and taking steps to ensure that users have relevant, consistent, and timely data for analysis.
Analytics . Analytics is still rudimentary, but pockets of advancement are starting to develop. Business analysts are realizing the power of visualization, for example, and may have invested in a low-cost visualization tool to try to gain an understanding of their data. Marketing or other departments are starting to ask questions that need answers. They need to realize that IT and the business need to come together to support analytics and avoid a “Wild West” scenario by beginning to govern what kind of data users can and should see.
12 TDWI REsEARCH
TDWI Analytics Maturity Model Guide
1 NASCENT 2 PRE-ADOPTION 3 EARLY ADOPTION
4 CORPORATE ADOPTION
5 MATURE/ VISIONARY
CHASM
Stage 3: Early AdoptionDuring the early adoption phase, the company is putting analytics tools and methodologies in place. It is thinking about data management and reporting or dashboards. Users often spend a long time moving through the early adoption stage.
organization . In this stage, the company gets started with analytics. IT and the business may be working together as a team on selected projects. Often, this is because an executive or someone with clout has realized that IT is not helping the business and vice versa. There may be a business crisis or changes detected in customer preferences and behavior that are driving this. The team is working to determine the right business problems to solve and how to drive analytics into the decision-making process.
However, not everyone has bought into analytics. The company might utilize analytics as part of its decision-making process in various departments, but the company itself isn’t necessarily analytics driven. Analytics projects led by individuals or single departments in the company could be bearing fruit, and there is interest in building prototypes to see how analytics could be advanced and extended further across the enterprise. As the organization gets excited about the prospects for how analytics could improve decisions and outcomes more broadly, more people start to come on board. This often means that a team is established to plan and strategize for a wider analytics scope.
Infrastructure . In this stage there may be analytics technology in place, but typically not any sort of dedicated analytics platform or appliance for analytics unless it is in a proof-of-concept (POC) stage. The company may also be thinking about a unified architecture that can enable users to access multiple data sources and different types of data, including unstructured content. The company may be considering or even evaluating POCs for deploying analytics systems in the cloud or developing Hadoop systems to increase flexibility and reduce costs for some of its analytics initiatives.
Data management . In this stage, the organization typically has a data warehouse or data mart(s) in place—typically for structured data only. In some cases, it may be that the company is working primarily off its spreadsheet flat files, and that is fine as long as there’s a way to assure data integrity. From a data strategy perspective, there is often metadata attributed at the departmental level. However, defined data life cycle management and data auditability and lineage are lacking/absent/nonexistent. Governance, to ensure that sensitive data is protected and that users have relevant and appropriate data for analysis, is only starting to be put in place; a solid, company-wide analytics management strategy is typically not in place.
tdwi.org 13
Stages of Maturity
Analytics . In this stage, there may be pockets of BI, data discovery, or analytics tools throughout the organization. Typically, these are self-service tools that enable slicing and dicing of data and data visualization. There may be some groups or individuals, especially at established enterprises with some history of performing data analysis for such tasks as loan approvals or risk analysis, who are adept at more advanced analytics such as predictive modeling, but they may be aligned at the department or line-of-business level. There may also be some outside consulting organizations involved that are helping set the analytics strategy or have personnel on site who are performing some kind of advanced analytics. Having personnel with the appropriate skill sets can be an issue here.
Governance . At this stage of maturity, some organizations might have a steering committee overseeing the program from a governance perspective, with representatives from departments providing reports on progress and compliance. However, most do not. Instead, for data governance, a similar effort may be in place but only providing departmental-focused data strategy and management. A corporate data management steering committee, with IT often leading the effort, could oversee data integration.
1 NASCENT 2 PRE-ADOPTION 3 EARLY ADOPTION
4 CORPORATE ADOPTION
5 MATURE/ VISIONARY
CHASM
The ChasmAs organizations try to move from early adoption to corporate adoption and extend the value of analytics to more users and departments, enterprises must overcome a series of hurdles. This is often why they spend a large amount of time in this phase. There is the obvious challenge of obtaining the right skill set. There may also be political issues. For example, one organization may have been driving the company’s analytics effort and brought other departments on board. However, when it comes time to extend the platform or establish more stringent standards and governance, departments begin to fight over who owns the data, or whose particular vision is implemented. Often, analytics isn’t available in a way that encourages adoption.
To successfully cross the chasm, you’ll need to address the following four challenges.
Funding . Many early analytics projects are driven by a visionary executive champion. Of course, it is critical to establish wins with these early projects to secure funding. This funding needs to be both IT and business driven. Business involvement is needed because analytics projects must have business value with tangible business outcomes. In fact, organizations report that prototypes in the early phases of analytics that show real results can help achieve buy-in and show what is possible. Typically, business and IT can then work as a team; until they do, corporate adoption will not occur.
Data management and data governance . To move forward to corporate adoption and data sharing, a solid data management and governance plan must be in place. Data management must adjust to different and often dynamic requirements, data availability rhythms, and performance needed to support
“democratized” analytics. These are often quite different from standard and heavily scheduled BI
14 TDWI REsEARCH
TDWI Analytics Maturity Model Guide
reporting. To get to corporate adoption, data will need to be shared across the organization. This means that without being too heavy handed and stifling users’ analytics, IT or the governance committee must put in place the right processes and checkpoints for users to have the rights to access and work with certain data.
It also means that data quality controls and practices must be implemented, and this often goes hand in hand with data governance. Typically, companies will need to build toward a more unified information architecture or company-wide analytics platform, or at least a less siloed and more coherent way to get at data and ensure its integrity for analytics. This means data management and governance are critical.
Skill sets . A big barrier for analytics projects moving past the chasm is developing the skill set for new technologies such as self-service BI, Hadoop, or NoSQL databases as well as more advanced analytics. The skill issue comes up most often as a barrier to moving forward with analytics. If the enterprise can afford it, it will hire staff. Many companies are using a combination of approaches, such as hiring from outside and training from within. Some organizations are utilizing internal user groups to help build skill sets.
Cultural and political issues . Often the cultural and political issues can stop analytics from becoming more pervasive. For example, a company might hit a roadblock when trying to operationalize analytics as part of a business process, which is a sign of maturity. However, operationalizing analytics—especially embedding it so others can consume it downstream—takes time because building trust takes time. It can even take time for self-service BI to permeate an organization if there are cultural issues. If a company does not have a culture of thinking with data and making decisions with data, it takes time to get used to a new way of doing things.
Some organizations have noted that as users employ mobile devices for more of their interaction with data, there is an increase in interest and adoption of BI and analytics applications that will run on these devices. A well-planned mobile strategy that includes thinking about how analytics are presented and consumed can help broaden analytics adoption. Other organizations have found that success comes faster to enterprises that reach out to less-traditional users of analytics who often know the data best—such as salespeople or line-of-business executives who are interested in interacting with data and analytics on their mobile devices. This can help increase adoption.
Governance . Moving to corporate adoption requires an analytics governance team. To get across the chasm, organizations should have program governance in place, with guidance for the program and a steering committee that oversees how the program will be implemented in each division. The program should be executed as a budgeted and planned initiative from the division perspective and be treated on par with other data integration programs.
To cross the chasm, companies need to ensure that the right governance, data architecture, data life cycle management security strategies, and organizational structures are in place but in a way that is balanced and unobtrusive so users are not thwarted or delayed unnecessarily in their pursuit of analytics. To date, we have observed many organizations spend extra time as they near the chasm and require additional staffing to cross it.
tdwi.org 15
Stages of Maturity
1 NASCENT 2 PRE-ADOPTION 3 EARLY ADOPTION
4 CORPORATE ADOPTION
5 MATURE/ VISIONARY
CHASM
Stage 4: Corporate AdoptionCorporate adoption is the major crossover phase in any organization’s analytics journey. During corporate adoption, end users typically get involved and the analytics transforms how they do business. For instance, users may change how decisions are made by operationalizing analytics in the organization. They will be using disparate kinds of data, even big data that is semi-structured or unstructured, for their analytics efforts.
Organizations that reach this stage of maturity might have repeatedly addressed certain gaps in organization, infrastructure, data management, analytics, and governance.
organization . At this stage, the company realizes that analytics is a competitive differentiator and has successful projects or at least mature prototypes that prove it. Innovation in data and analysis is a core value, and an analytics culture prevails. The business strategy is generally a blend of top-down and bottom-up, with a data infrastructure that can support this. Business and IT view themselves as a team and have experience working together successfully on analytics projects. A growing analytics culture and mindset pervades the organization. These organizations often think out of the box about expanding the reach of analytics, even holding competitions or other events.
Infrastructure . In this stage of maturity, a range of technologies might be used, including enterprise NoSQL databases, Hadoop, and appliances or a data warehouse, mostly on premises but with some in the cloud. The information architecture is unified in a way that underpins analytics. The company is thinking in terms of an analytics ecosystem that encourages innovation and enables users to explore new types of data on a variety of platforms. The infrastructure and architecture of the analytics ecosystem comply with backup and recovery or disaster recovery procedures, which are in place. A unified architecture that takes an ecosystem approach is also installed. This may include standardized analytics tools across departments, but not a hodgepodge of multiple tools and platforms.
Data management . The more mature a company is, the better it can manage and make use of its data specifically for advanced analytics, not just BI reporting. In this stage of maturity, organizations can make use of many forms of data and absorb new sources of data as they emerge. Data sharing is a collaborative activity that is well managed through strong data governance policies. Locking up data in individual user or departmental silos is considered a negative in this phase; the company is actively seeking to consolidate silos or employ data federation and virtualization to unify views of data from across all components of the data infrastructure.
The company is always looking for new data, both internally and externally, to enhance its analytics. From a data strategy perspective, there is metadata attributed at the division or company level and a defined, end-state data architecture, whether in a semantic layer, in the platform architecture, or
16 TDWI REsEARCH
TDWI Analytics Maturity Model Guide
in a database layer. There is defined data life cycle management and a data auditability and lineage process or framework.
Analytics . Any company might collect a large amount of data but not make use of it. It’s a sign of maturity when new data coming into the organization can be analyzed quickly and made part of the logical infrastructure. In this stage, analytics supports the organization. Typically, a company at this juncture also has a center of excellence (COE) that serves different parts of the organization. The COE includes the data science team, which might even train other groups in using analytics in different forms. At this point, analytics might be operationalized as part of a business process. In other words, analytics might be automated or integrated with the business process, such as using machine-generated data together with other data about customers to determine a next-best offer. Different kinds of data are analyzed—including unstructured data and geospatial data. These companies are typically using new capabilities and not just existing BI infrastructure.
Governance . A company at this stage of maturity understands that analytics, for all its benefits, can be a liability, especially if data from external sources is part of the equation. A company at this stage should be concerned with answering questions such as: Whose data was it? Whose data is it? Where is it going? How long will it last?
At this stage of maturity, organizations will have program governance in place, with PMO guidance for the program and a steering committee that oversees the program from a company-wide perspective. For data governance, a similar effort will be in place with a well-defined data strategy and management and steering committee overseeing the progress of data. The overall executive sponsor is involved in monthly updates. The program is executed as a budgeted and planned enterprise initiative and treated on par with other data integration programs. The governance oversight will not be too heavy handed; it will balance policy and data privacy needs with the requirements of users to have the appropriate data they need for analytics that is relevant, timely, and consistent.
1 NASCENT 2 PRE-ADOPTION 3 EARLY ADOPTION
4 CORPORATE ADOPTION
5 MATURE/ VISIONARY
CHASM
Stage 5: Mature/VisionaryOnly a few companies can currently be considered visionary in terms of analytics. At this stage, organizations are executing analytics programs smoothly using a highly tuned infrastructure with well-established program and data governance strategies. Well-governed but flexible data access is available for users so they can explore data and develop visualizations in a self-service fashion and are not completely dependent on IT. Many programs are executed as budgeted and planned initiatives
tdwi.org 17
Evaluating Benchmark Scores
from the company perspective. In the visionary stage, there is excitement and energy in analytics and a healthy and agile analytics culture benefits non-traditional users at middle management and even frontline positions.
organization . The visionary company has several characteristics. First, executives have bought into analytics and view it as critical. Analytics is seen as a competitive weapon and the mindset is creative. Second, analytics is not simply used to drive strategy or insight; instead, the business is always looking for opportunities to use analytics in new ways. These companies realize that analytics is becoming more pervasive and they need to be thinking out of the box. The mature and visionary companies are typically able to access analytics from multiple devices. Analytics are a way of daily life with these organizations, whether it is consuming the analytics or developing it.
Infrastructure and data management . How you manage complexity is key to analytics maturity. The visionary company has deployed a coherent analytics infrastructure that is fully operational and can be used in the mission-critical aspects of the business. Part of the infrastructure includes the ability to integrate new sources of data for analytics, whether they are internal or external to the company. The infrastructure uses what has worked in the past, including a data warehouse, and may leverage newer technology such as commercial Hadoop and enterprise NoSQL databases. The cloud is also typically used by more mature organizations for many reasons and usually in a hybrid fashion. Hybrid cloud deployments often utilize public and private clouds as well as other data center deployments. Governance is well established and self-service options are deployed with oversight from a well-managed data access strategy.
Analytics . The visionary company continually develops analytics. Typically, such as company makes use of all kinds of data, including unstructured data and real-time data, for decision making and incorporation into business processes. The visionary company can connect the dots between new data and existing assets. The company has established COEs and teams are working to deliver new and exciting forms of analytics. Some visionary organizations build a joint business and IT team that innovates on the technologies, brings them back to the business, and takes them into production.
Evaluating Benchmark ScoresThe benchmark survey has 35 questions across the five categories that form the dimensions of the TDWI Analytics Maturity Model (see Figure 1, page 5).
These dimensions should now seem familiar from the many references throughout this guide. These factors, and others, are used to explore relationships in the data to help determine best practices for analytics.
Of course, organizations can be at different stages of maturity in each of these five categories, and most are.
ScoringThe questions are either provided singly or grouped together in a matrix. Questions may be weighted differently depending on their relative importance. Each dimension has a potential high score of 20 points. Because organizations can be at different levels of maturity in the five dimensions, we score each section separately as well as provide an overall score. There are also questions that aren’t scored but rather used for best-practices guidance.
18 TDWI REsEARCH
TDWI Analytics Maturity Model Guide
The output of the assessment is a score in each dimension and the total score, as well as a gap recommendation that provides advice and best practices for getting to the next stage of maturity.
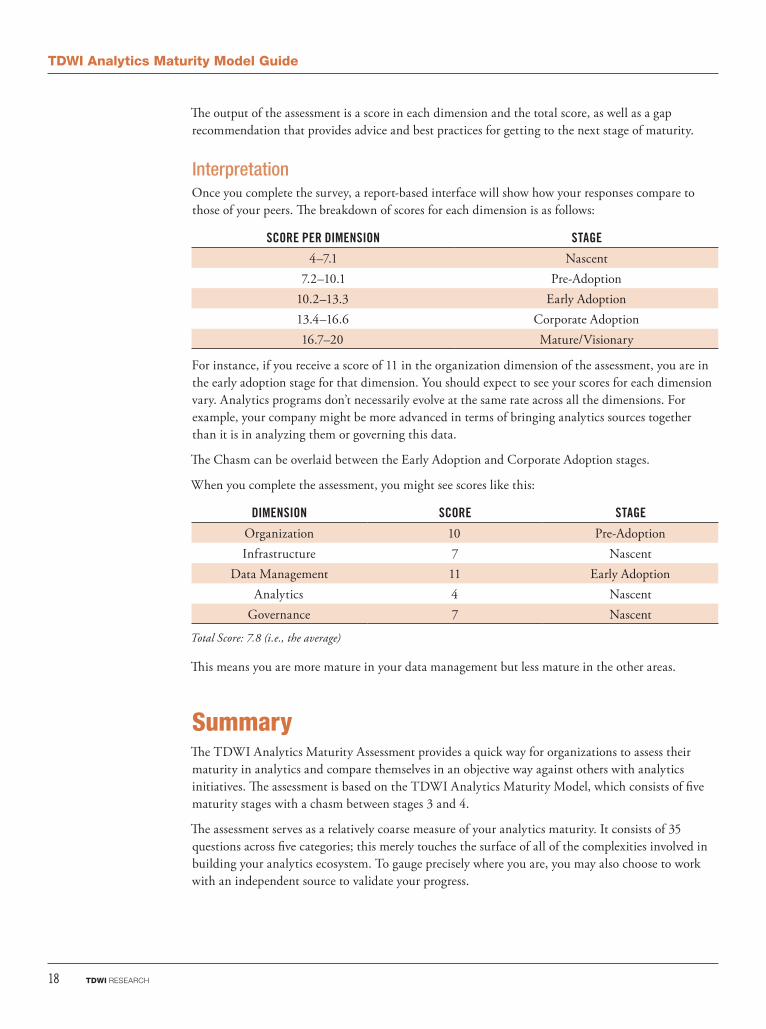
InterpretationOnce you complete the survey, a report-based interface will show how your responses compare to those of your peers. The breakdown of scores for each dimension is as follows:
SCoRE pER DIMEnSIon STAGE
4–7.1 Nascent7.2–10.1 Pre-Adoption
10.2–13.3 Early Adoption13.4–16.6 Corporate Adoption16.7–20 Mature/Visionary
For instance, if you receive a score of 11 in the organization dimension of the assessment, you are in the early adoption stage for that dimension. You should expect to see your scores for each dimension vary. Analytics programs don’t necessarily evolve at the same rate across all the dimensions. For example, your company might be more advanced in terms of bringing analytics sources together than it is in analyzing them or governing this data.
The Chasm can be overlaid between the Early Adoption and Corporate Adoption stages.
When you complete the assessment, you might see scores like this:
DIMEnSIon SCoRE STAGE
Organization 10 Pre-AdoptionInfrastructure 7 Nascent
Data Management 11 Early AdoptionAnalytics 4 Nascent
Governance 7 Nascent
Total Score: 7.8 (i.e., the average)
This means you are more mature in your data management but less mature in the other areas.
SummaryThe TDWI Analytics Maturity Assessment provides a quick way for organizations to assess their maturity in analytics and compare themselves in an objective way against others with analytics initiatives. The assessment is based on the TDWI Analytics Maturity Model, which consists of five maturity stages with a chasm between stages 3 and 4.
The assessment serves as a relatively coarse measure of your analytics maturity. It consists of 35 questions across five categories; this merely touches the surface of all of the complexities involved in building your analytics ecosystem. To gauge precisely where you are, you may also choose to work with an independent source to validate your progress.
Research Sponsors
Cloudera, Inc .www.cloudera.com
Cloudera is revolutionizing enterprise data management by offering the first unified Platform for Big Data, an enterprise data hub built on Apache Hadoop™. Cloudera offers enterprises one place to store, process, and analyze all their data, empowering them to extend the value of existing investments while enabling fundamental new ways to derive value from their data. Only Cloudera offers everything needed on a journey to an enterprise data hub, including software for business-critical data challenges such as storage, access, management, analysis, security, and search. As the leading educator of Hadoop professionals, Cloudera has trained over 22,000 individuals worldwide. Over 1,000 partners and a seasoned professional services team help deliver greater time to value. Finally, only Cloudera provides proactive and predictive support to run an enterprise data hub with confidence. Leading organizations in every industry plus top public sector organizations globally run Cloudera in production.
MicroStrategywww.microstrategy.com
Founded in 1989, MicroStrategy (Nasdaq: MSTR) is a leading worldwide provider of enterprise software platforms. The Company’s mission is to provide the most flexible, powerful, scalable, and user-friendly platforms for analytics, mobile, and identity, offered either on premises or in the cloud. The MicroStrategy Analytics Platform™ enables leading organizations to analyze vast amounts of data and distribute actionable business insight throughout the enterprise. The MicroStrategy Mobile App Platform™ lets organizations rapidly build information-rich applications that combine multimedia, transactions, analytics, and custom workflows. To learn more, visit www.microstrategy.com and follow us on Facebook and Twitter.
Tableau Softwarewww.tableausoftware.com
Tableau Software helps people see and understand data. Anyone can analyze, visualize, and share information quickly. More than 21,000 customer accounts get rapid results with Tableau in the office and on the go. And tens of thousands of people use Tableau Public to share data in their blogs and websites. See how Tableau can help you by downloading the free trial at www.tableausoftware.com/trial.
TDWI REsEARCH
TDWI Research provides research and advice for business intelligence, data warehousing, and analytics professionals worldwide. TDWI Research focuses exclusively on BI, DW, and analytics issues and teams up with industry thought leaders and practitioners to deliver both broad and deep understanding of the business and technical challenges surrounding the deployment and use of business intelligence, data warehousing, and analytics solutions. TDWI Research offers in-depth research reports, commentary, inquiry services, and topical conferences as well as strategic planning services to user and vendor organizations.
555 S Renton Village Place, Ste. 700
Renton, WA 98057-3295
T 425.277.9126
F 425.687.2842
E [email protected] tdwi.org