Embed Size (px)
Citation preview
INVESTOR PRESENTATIONSeptember 2021

SAFE HARBOR STATEMENT
Statements in this presentation regarding SYNNEX Corporation which are not historical facts may be forward-looking
statements within the meaning of Section 27A of the Securities Act of 1933 and Section 21E of the Securities Exchange Act of
1934. These forward-looking statements may be identified by terms such as believe, expect, may, will, provide, could and
should and the negative of these terms or other similar expressions. These forward-looking statements include, but are not
limited to, statements regarding our business strategy, the sizes and growth of technology distribution markets, market
opportunities, value creation opportunities, accretion, cost savings, capital allocation, free cash flow, Q4 FY21 revenue, Q4
FY21 net income, Q4 FY21 non-GAAP net income, Q4 FY21 diluted EPS, Q4 FY21 non-GAAP diluted EPS, Q4 FY21
outstanding diluted weighted average shares, Q4 FY21 net total interest expense and finance charges, Q4 FY21 tax rate, Q4
FY21 after-tax transaction-related and integration expenses, Q4 FY21 after-tax amortization of intangibles, Q4 FY21 after-tax
purchase accounting adjustments, Q4 FY21 share-based compensation costs, and features and capabilities of products and
services. These are subject to risks and uncertainties that could cause actual results to differ materially from those discussed
in the forward-looking statements. Please refer to the documents filed with the Securities and Exchange Commission,
specifically our most recent Form 10-K and subsequent SEC filings, for information on risk factors that could cause actual
results to differ materially from those discussed in these forward-looking statements. Statements included in this presentation
are based upon information known to SYNNEX Corporation as of the date of presentation and SYNNEX Corporation assumes
no obligation to update information contained in this presentation.

OUR HISTORY
Coming
together as
TD SYNNEX
through a
history of
balanced
M&A and
organic
growth.

OUR LOCATIONS
Argentina
Brazil
Canada
Chile
Colombia
Costa Rica
Ecuador
Mexico
Peru
Venezuela
United States
Australia
China
Hong Kong
India
Indonesia
Japan
Macau
Malaysia
New Zealand
Singapore
Taiwan
Thailand
Vietnam
Austria
Belgium
Croatia
Czech Republic
Denmark
Finland
France
Germany
Hungary
Ireland
Italy
Luxembourg
Netherlands
Norway
Poland
Portugal
Romania
Serbia
Slovenia
Spain
Sweden
Switzerland
Turkey
United Kingdom
Europe~8K co-workers
We're proud to serve customers and vendors in more than 100 countries with our co-workers in the following locations.
Americas~12K co-workers
APJ~3K co-workers
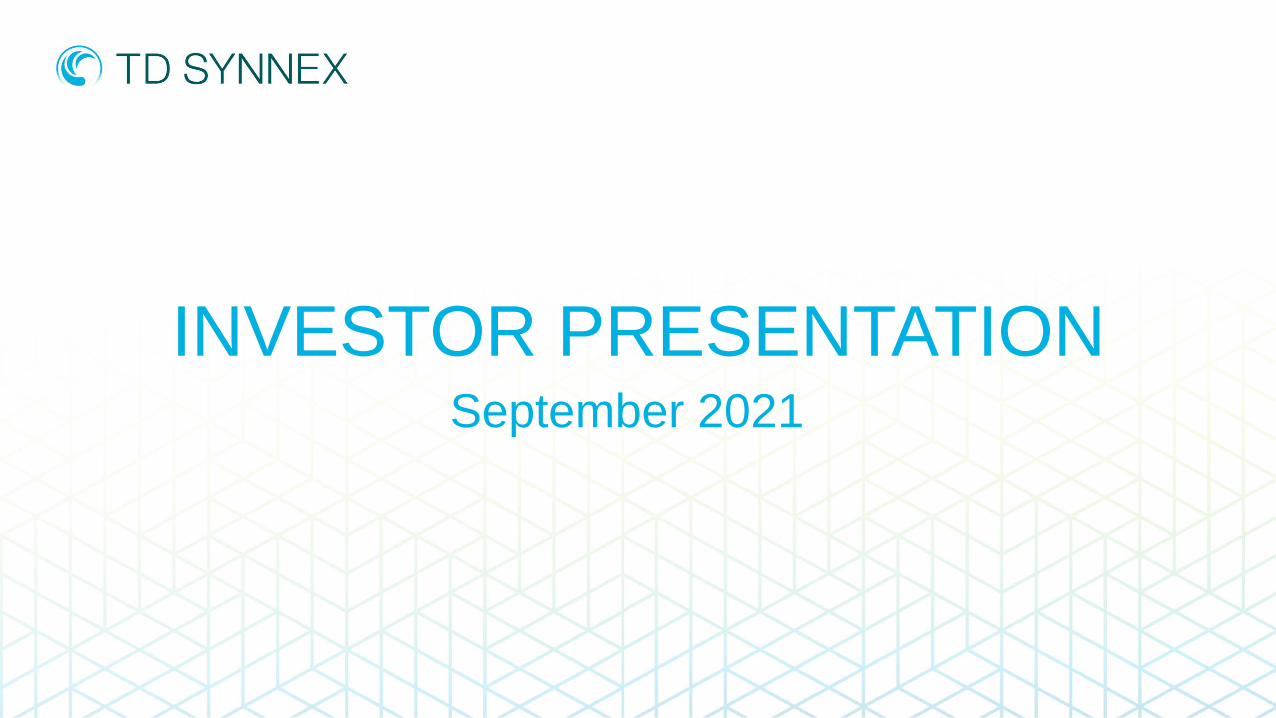
Americas President
MICHAEL URBAN
Chief Executive Officer
RICH HUME
EU & APAC President
PATRICK ZAMMIT
Chief Financial Officer
MARSHALL WITTChief Legal Officer
DAVID VETTERChief Information
Officer
BONNIE SMITH
Chief Business Officer
SIMON LEUNG
Chief Strategy Officer
SERGIO FARACHEChief Human
Resources Officer
BETH SIMONETTIHead of Global Businesses &
Integration Lead
DENNIS POLK
EXECUTIVE LEADERSHIP TEAMExperienced leaders from both legacy companies

We deliver compelling technology solutions to a dynamic
global marketplace. Intent on the success of our partners,
shareholders and each other, we hold ourselves to the
highest standards and deliver excellence every day.
OUR MISSION

CORPORATE SOCIAL RESPONSIBILITY
SOCIAL
We believe anyone can do great things
with technology – and “anyone” is the
operative word. Our commitment to
social responsibility starts with our co-
workers, and we are proud to be
recognized as a great place to work, a
leader in the promotion and practice of
diversity, equity and inclusion, and an
active member of the local
communities where we live and work.
GOVERNANCE
True to our values of Inclusion,
Collaboration, Integrity and
Excellence, we have a proud
history of strong corporate
governance based on best
practices, local requirements,
and the needs of our
co-workers, customers,
vendors and investors.
ENVIRONMENTAL
At TD SYNNEX, our vision for
a vibrant, interconnected world
remains focused on protecting
our environment. We are
committed to lowering our
global carbon footprint, setting
targets for emission reductions,
increasing our sustainability
initiatives and supporting our
customers and vendors.

AWARDS & RECOGNITION
We’re proud of the industry
awards we’ve received that
recognize everything from our
expansive global distribution
capabilities to our best in-class
product offerings in next-
generation, high-growth areas.
Even more, we’re proud of the
accolades our co-workers around
the world have earned, as well as
important recognition of our
culture, workplace and
commitment to inclusion.
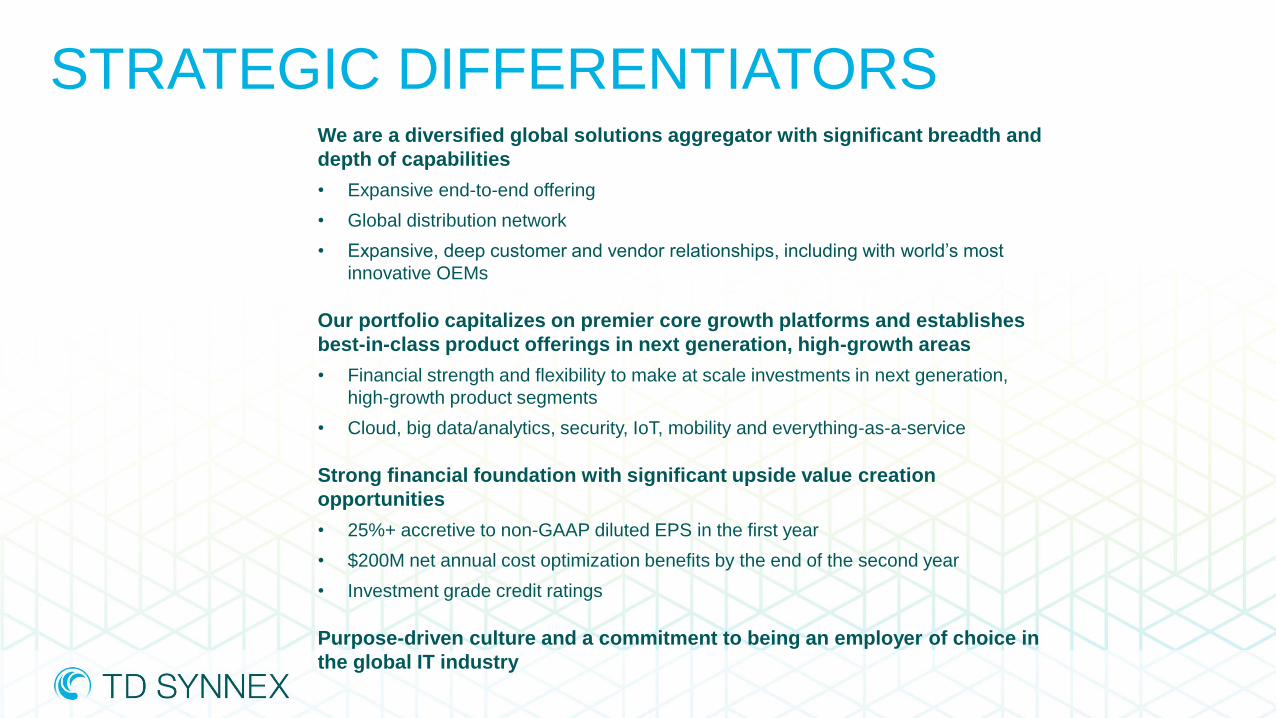
STRATEGIC DIFFERENTIATORSWe are a diversified global solutions aggregator with significant breadth and
depth of capabilities
• Expansive end-to-end offering
• Global distribution network
• Expansive, deep customer and vendor relationships, including with world’s most
innovative OEMs
Our portfolio capitalizes on premier core growth platforms and establishes
best-in-class product offerings in next generation, high-growth areas
• Financial strength and flexibility to make at scale investments in next generation,
high-growth product segments
• Cloud, big data/analytics, security, IoT, mobility and everything-as-a-service
Strong financial foundation with significant upside value creation
opportunities
• 25%+ accretive to non-GAAP diluted EPS in the first year
• $200M net annual cost optimization benefits by the end of the second year
• Investment grade credit ratings
Purpose-driven culture and a commitment to being an employer of choice in
the global IT industry
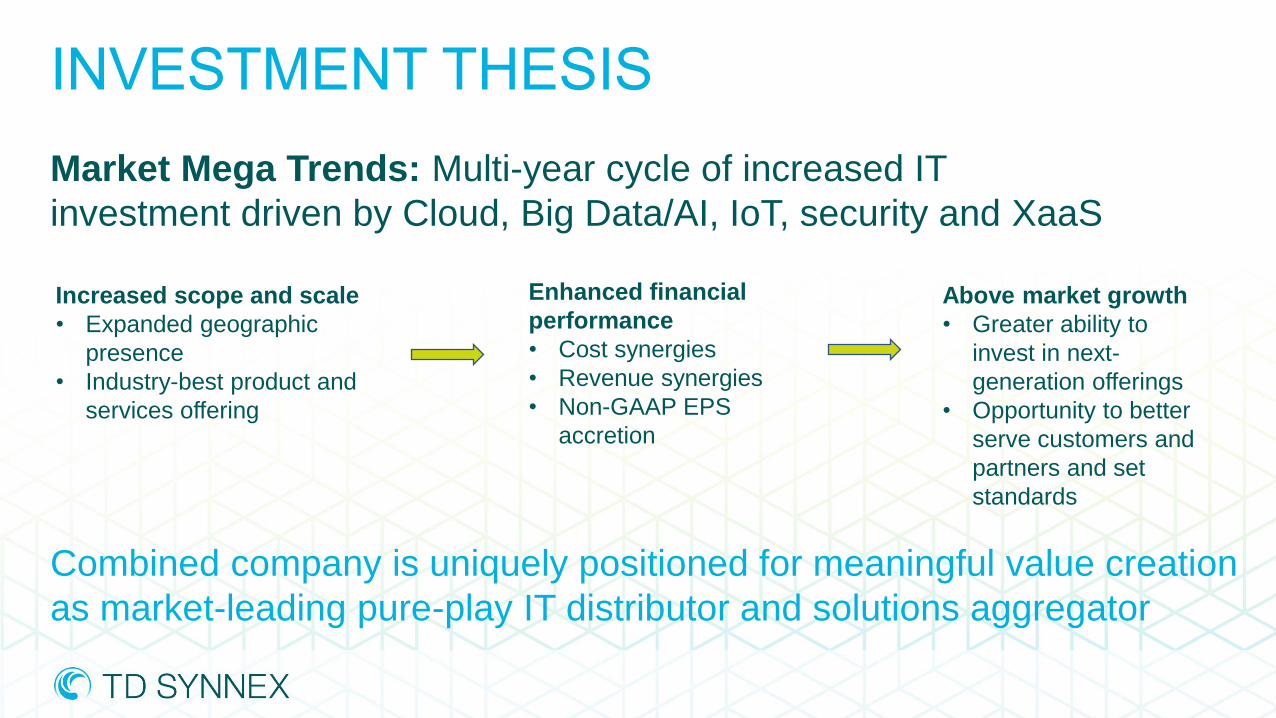
INVESTMENT THESIS
Increased scope and scale
• Expanded geographic
presence
• Industry-best product and
services offering
Market Mega Trends: Multi-year cycle of increased IT
investment driven by Cloud, Big Data/AI, IoT, security and XaaS
Enhanced financial
performance
• Cost synergies
• Revenue synergies
• Non-GAAP EPS
accretion
Above market growth
• Greater ability to
invest in next-
generation offerings
• Opportunity to better
serve customers and
partners and set
standards
Combined company is uniquely positioned for meaningful value creation
as market-leading pure-play IT distributor and solutions aggregator

Q3 FY21 EarningsReported on September 28, 2021

12
$10.4 $10.1 $10.7 $12.8 $11.9 $12.5
$14.8 $17.3
$19.1 $20.0 $22.1
2.5% 2.6%2.4% 2.5%
2.7% 2.6%2.9% 2.8%
3.1%2.9%
3.2%
$0.5
$5.5
$10.5
$15.5
$20.5
$25.5
$30.5
$35.5
$40.5
FY11 FY12 FY13 FY14 FY15 FY16 FY17 FY18 FY19 FY20 TTM
Revenue ($B)
Adj. OP%(1)
CONSISTENT TOPLINE GROWTH AND IMPROVING MARGINS
(1) Non-GAAP measure. See the Appendix to this presentation for definitions of non-GAAP measures and reconciliation of such measures to GAAP.
Reflects legacy SYNNEX Technology Solutions

13
Q3 FY2021 FINANCIAL RESULTS
2.90%Non-GAAP
Operating
Margin(1)
Robust adjusted ROIC of 18.4%(1)
» YTD cash flow generation of $249 million
Strength in Commercial Software, Security, Networking and Notebooks offset by supply chain headwinds» Revenue decreased 2% Y/Y
$5.2 billion
Revenue
3.2%Non-GAAP
Operating Margin(1)
(1) Non-GAAP measure. See the Appendix to this presentation for definitions of non-GAAP measures and reconciliation of such measures to GAAP.
Reflects legacy SYNNEX Technology Solutions
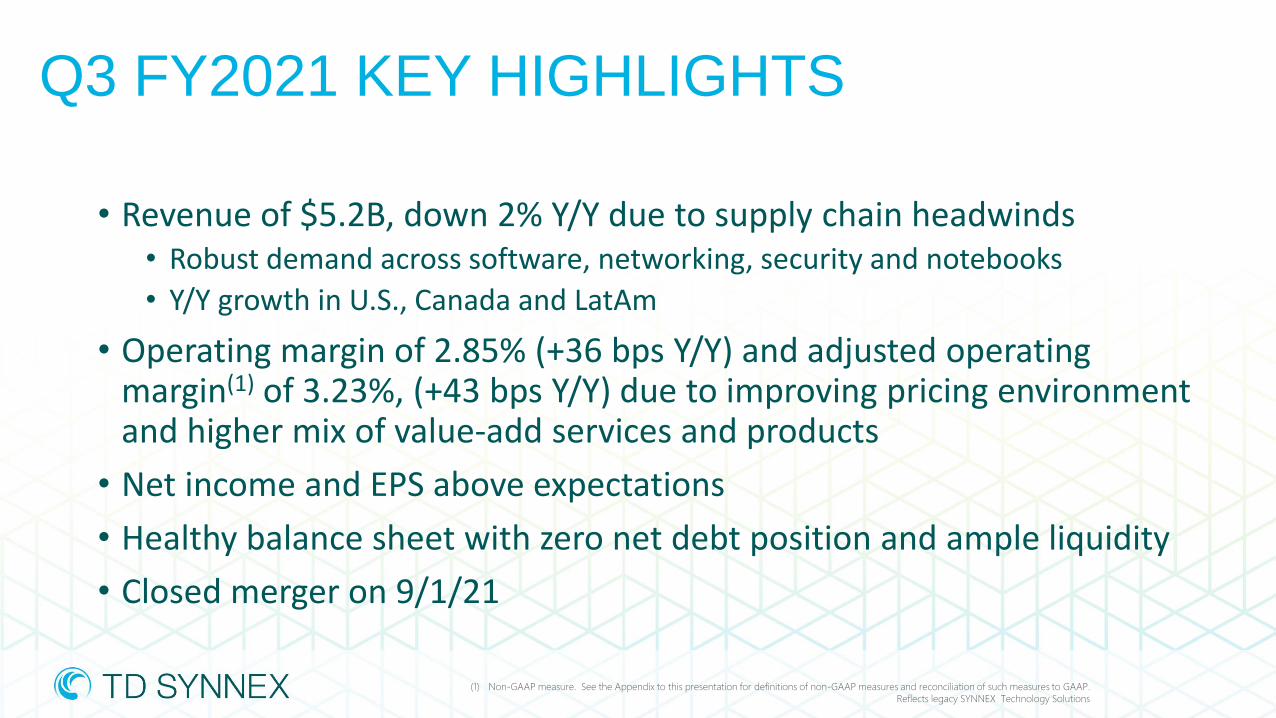
• Revenue of $5.2B, down 2% Y/Y due to supply chain headwinds• Robust demand across software, networking, security and notebooks
• Y/Y growth in U.S., Canada and LatAm
• Operating margin of 2.85% (+36 bps Y/Y) and adjusted operating margin(1) of 3.23%, (+43 bps Y/Y) due to improving pricing environment and higher mix of value-add services and products
• Net income and EPS above expectations
• Healthy balance sheet with zero net debt position and ample liquidity
• Closed merger on 9/1/21
Q3 FY2021 KEY HIGHLIGHTS
(1) Non-GAAP measure. See the Appendix to this presentation for definitions of non-GAAP measures and reconciliation of such measures to GAAP.
Reflects legacy SYNNEX Technology Solutions

15
Guidance Q4 FY21E
Revenue ($B) 15 – 16
Net Income ($M) 38 – 106
Non-GAAP Net Income ($M)(1) 242– 272
Diluted EPS $0.39 – $1.09
Non-GAAP Diluted EPS(1) $2.50 – $2.80
Outstanding Diluted Weighted Avg. Shares (Mil) 96.2
Non-GAAP Net Total Interest Expense ($M)(1) ~40
Tax Rate 25%
(1) Non-GAAP measure. See the Appendix to this presentation for definitions of non-GAAP measures and reconciliation of such measures to GAAP.
Q4 FY2021 OUTLOOK

~$4.5B in liquidity consisting of:
• ~$1B of cash and cash equivalents
• $3.5B of available Revolving Credit Facility capacity
• $1.5B 5-yr Term Loan A
• $2.5B of senior unsecured notes
• Strong track record of disciplined deleveraging
Liquidity
Leverage
ATTRACTIVE CAPITAL STRUCTURE PROVIDING AMPLE LIQUIDITY TO RUN THE BUSINESS
Expected strong free cash flow
provides ample financial flexibility
Maturity profile with no
significant near-term obligations
Significant liquidity and
conservative leverage profile

17
Investments in Core Business
Shareholder Returns
(1) Non-GAAP measure. See the Appendix to this presentation for definitions of non-GAAP measures and reconciliation of such measures to GAAP.
SIGNIFICANT FINANCIAL STRENGTH &
VALUE CREATING CAPITAL ALLOCATION
Investments in Core Business
Strategic M&A Capital ReturnsDe-Leveraging
Financial Strength• $3.5B of available
Revolving Credit Facility capacity
• Net debt-to-LTM adj. EBITDA of ~0 (1)
Investments in Core and Next Generation Technology• Cloud, big
data/analytics, security, mobility, IoT, Everything-as-a-Service
Capital Returns• $0.20 dividend
payable on Oct. 29th• Targeting modestly
growing dividend over time
• 3-year share repurchase authorization in place
APPENDIX

NON-GAAP FINANCIAL MEASURESUse of Non-GAAP Financial Measures
In addition to the financial results presented in accordance with GAAP, TD SYNNEX also uses adjusted selling, general and administrative expenses, non-GAAP operating income, non-GAAP operating margin, non-GAAP income from continuing operations, non-GAAP net income, and non-GAAP diluted earnings per share, which are non-GAAP financial measures that exclude transaction-related and integration expenses, the amortization of intangible assets, share-based compensation expense and the related tax effects thereon. The Company also uses adjusted earnings before interest, taxes, depreciation and amortization (“Adjusted EBITDA”) which excludes other income (expense), net, transaction-related and integration expenses and income from discontinued operations. In prior periods, SYNNEX has excluded other items relevant to those periods for purposes of its non-GAAP financial measures. Transaction-related expenses typically consist of acquisition, integration, and divestiture related costs and are expensed as incurred. These expenses primarily represent costs for legal, banking, consulting and advisory services, and debt extinguishment fees. From time to time, this category may also include transaction-related gains/losses on divestitures/spin-off of businesses. TD SYNNEX’ acquisition activities have resulted in the recognition of intangible assets which consist primarily of customer relationships and vendor lists. Definite-lived intangible assets are amortized over their estimated useful lives and are tested for impairment when events indicate that the carrying value may not be recoverable. The amortization of intangible assets is reflected in the Company’s statements of operations. Although intangible assets contribute to the Company’s revenue generation, the amortization of intangible assets does not directly relate to the sale of the Company’s products and the services performed for the Company’s clients. Additionally, intangible asset amortization expense typically fluctuates based on the size and timing of the Company’s acquisition activity. Accordingly, the Company believes excluding the amortization of intangible assets, along with the other non-GAAP adjustments which neither relate to the ordinary course of the Company’s business nor reflect the Company’s underlying business performance, enhances the Company’s and investors’ ability to compare the Company’s past financial performance with its current performance and to analyze underlying business performance and trends. Intangible asset amortization excluded from the related non-GAAP financial measure represents the entire amount recorded within the Company’s GAAP financial statements, and the revenue generated by the associated intangible assets has not been excluded from the related non-GAAP financial measure. Intangible asset amortization is excluded from the related non-GAAP financial measure because the amortization, unlike the related revenue, is not affected by operations of any particular period unless an intangible asset becomes impaired or the estimated useful life of an intangible asset is revised. Share-based compensation expense is a non-cash expense arising from the grant of equity awards to employees based on the estimated fair value of those awards. Although share-based compensation is an important aspect of the compensation of our employees, the fair value of the share-based awards may bear little resemblance to the actual value realized upon the vesting or future exercise of the related share-based awards and the expense can vary significantly between periods as a result of the timing of grants of new stock-based awards, including grants in connection with acquisitions. Given the variety and timing of awards and the subjective assumptions that are necessary when calculating share-based compensation expense, TD SYNNEX believes this additional information allows investors to make additional comparisons between our operating results from period to period. Additionally, TD SYNNEX refers to revenue at constant currency or adjusting for the translation effect of foreign currencies so that certain financial results can be viewed without the impact of fluctuations in foreign currency exchange rates, thereby facilitating period-to-period comparisons of TD SYNNEX’ business performance. Financial results adjusted for currency are calculated by translating current period activity in the transaction currency using the comparable prior year periods’ currency conversion rate. Generally, when the dollar either strengthens or weakens against other currencies, revenue at constant currency rates or adjusting for currency will be higher or lower than revenue reported at actual exchange rates. Trailing fiscal four quarters ROIC is defined as the last four quarters’ tax effected operating income divided by the average of the last five quarterly balances of borrowings (excluding book overdraft) and equity, net of surplus cash. Adjusted ROIC is calculated by excluding the tax effected impact of non-GAAP adjustments from operating income and by excluding the cumulative tax effected impact of current and prior period non-GAAP adjustments on equity. TD SYNNEX also uses free cash flow, which is cash flow from operating activities, reduced by purchases of property and equipment. TD SYNNEX uses free cash flow to conduct and evaluate its business because, although it is similar to cash flow from operations, TD SYNNEX believes it is an additional useful measure of cash flows since purchases of fixed assets are a necessary component of ongoing operations. Free cash flow reflects an additional way of viewing TD SYNNEX’ liquidity that, when viewed with its GAAP results, provides a more complete understanding of factors and trends affecting its cash flows. Free cash flow has limitations due to the fact that it does not represent the residual cash flow available for discretionary expenditures. For example, free cash flow does not incorporate payments for business acquisitions. Therefore, TD SYNNEX believes it is important to view free cash flow as a complement to its entire consolidated statements of cash flows. TD SYNNEX management uses non-GAAP financial measures internally to understand, manage and evaluate the business, to establish operational goals, and in some cases for measuring performance for compensation purposes. These non-GAAP measures are intended to provide investors with an understanding of TD SYNNEX’ operational results and trends that more readily enable investors to analyze TD SYNNEX’ base financial and operating performance and to facilitate period-to-period comparisons and analysis of operational trends, as well as for planning and forecasting in future periods. Management believes these non-GAAP financial measures are useful to investors in allowing for greater transparency with respect to supplemental information used by management in its financial and operational decision-making. As these non-GAAP financial measures are not calculated in accordance with GAAP, they may not necessarily be comparable to similarly titled measures employed by other companies. These non-GAAP financial measures should not be considered in isolation or as a substitute for the comparable GAAP measures, and should be read only in conjunction with TD SYNNEX’ consolidated financial statements prepared in accordance with GAAP. A reconciliation of TD SYNNEX’ GAAP to non-GAAP financial information is set forth in the supplemental tables at the end of this presentation.

20
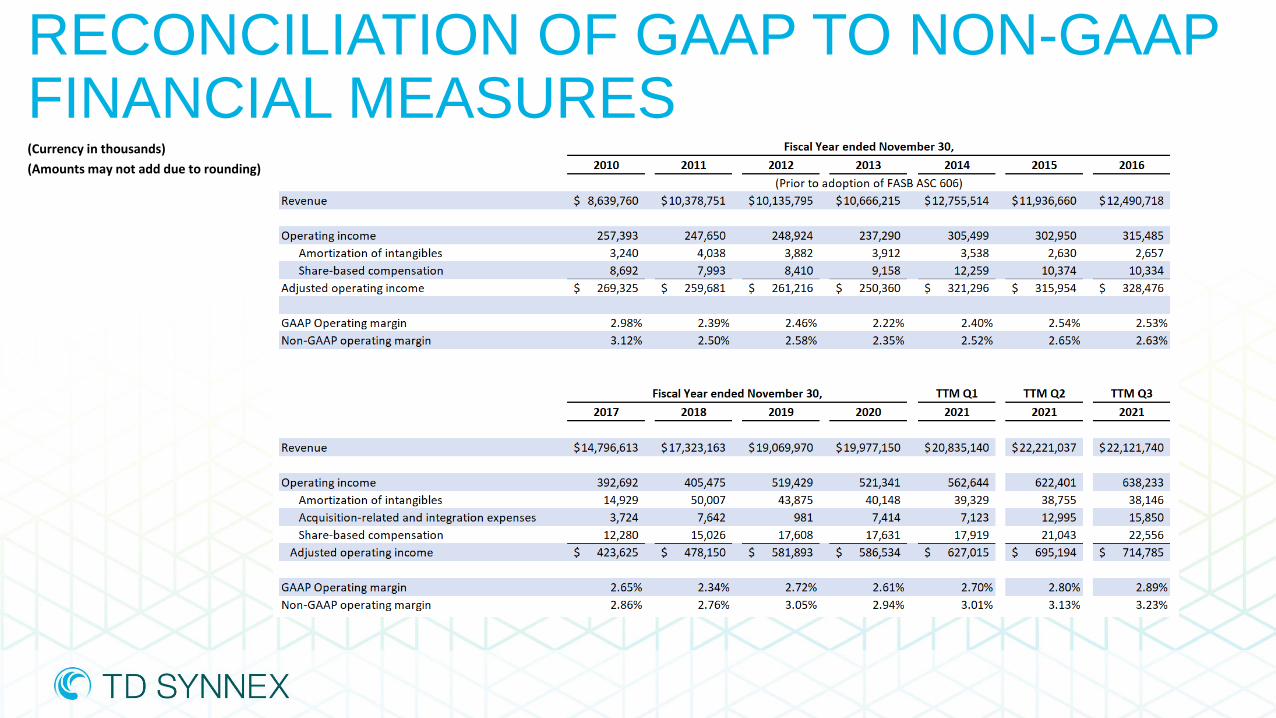
RECONCILIATION OF GAAP TO NON-GAAP FINANCIAL MEASURES
(Currency in thousands)
(Amounts may not add due to rounding)
21
(Currency in thousands)
(Amounts may not add due to rounding)
RECONCILIATION OF GAAP TO NON-GAAP FINANCIAL MEASURES
22
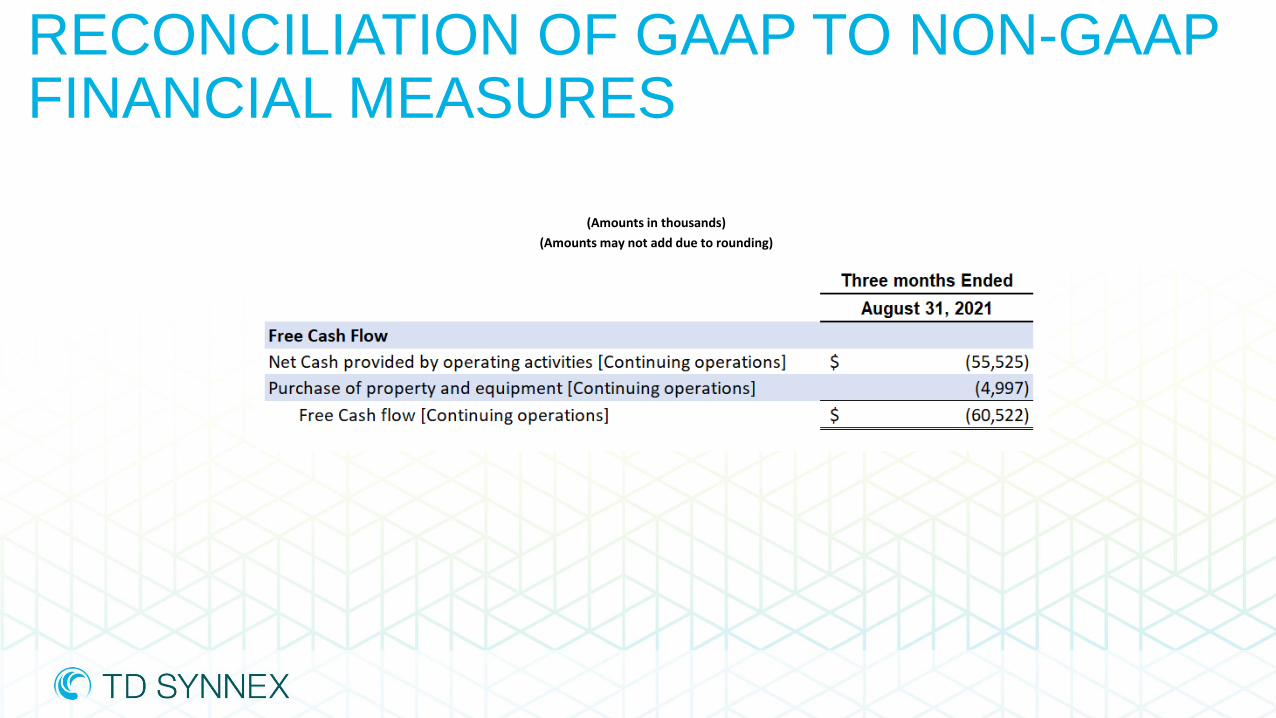
(Amounts in thousands)
(Amounts may not add due to rounding)
RECONCILIATION OF GAAP TO NON-GAAP FINANCIAL MEASURES

23
RECONCILIATION OF GAAP TO NON-GAAP FINANCIAL MEASURES

24
CALCULATION OF FINANCIAL METRICS(Amounts in thousands)
(Amounts may not add due to rounding)
(1)Income taxes on GAAP operating income was calculated using the effective year-to-date tax rate. Income taxes on non-GAAP operating income was calculated by excluding the tax effect of taxable and deductible non-GAAP adjustments using the effective year-to-date tax rate.
(2)Invested capital for the fiscal quarters preceding the quarter ended August 31, 2021 are based on pro forma presentation to reflect the separation of the Company’s erstwhile Concentrix reportable segment into an independent public company on December 1, 2020.

25
(Amounts in thousands)
(Amounts may not add due to rounding)
CALCULATION OF FINANCIAL METRICS

26
LEGACY TECH DATA RESULTSTIGER PARENT (AP) CORPORATION AND SUBSIDIARIES
HISTORICAL FINANCIAL INFORMATION(In millions)(Unaudited)
(1) Costs primarily associated with acquisitions, Tiger Parent (AP) Corporation’s GBO Program, GBO 2 Program and tdONE Program.(2) Costs associated with the amortization of intangible assets.(3) Purchase accounting adjustments related to acquisitions, primarily related to certain consideration received from vendors.(4) Costs associated with stock-based compensation plans.

THANK YOULiz Morali
Investor Relations
TD SYNNEX Corporation
510-668-8436
IR website: ir.synnex.com