Embed Size (px)
Citation preview

T&D Support
Community Insights Conference
August 20-22, 2014
Vail, CO
1
2014 Electric T&D Benchmarking

Agenda: T&D Support
◼Material Inventory Inventory Levels Turns and Fill Rates Stores Facilities Job Site Deliveries & Truck
Loading Mitigating Copper Theft
◼Fleet Operations Vehicle Numbers and Costs Vehicles per Field Employee Own vs. Lease Alternative Fuels Fleet Operations Outsourcing
◼Shops Shop Work Outsourcing Shop Operations Improvement
Initiatives Repair vs. Replace Criteria
2
Our T&D study benchmarks these important support functions at a high level• The topics reviewed for each function
include some demographic measures, key performance measures and current improvement initiatives

3
Material Inventory

T&D Material Inventory Levels
4
Percentage of Assets Percentage of Capital Additions
Support Pages 3 and 7Source: SU10, DF5, DF 70,TF65
There are a couple of ways to measure inventory levels
Companies that have a lot of consignment stocking (where a vendor owns the material before it leaves the storeroom) will appear on top of these charts. These companies may be paying more for those inventory items since the vendors price includes compensation for financing and maintaining the inventory

Inventory Turns and Order Fill Rates (Higher is Better)
5
Fill RateTurns per Year
Support Pages 11 and 15Source SU25, SU30
We often speak of tradeoffs, but some companies are high or low on both of these common inventory performance benchmarking measures

How Good Performance is Achieved on Inventory Turns
6Support Page 35
Source SU63
ID Improving Inventory Turns22 … we make extensive use of the integrator model for fast moving material
31 Good coordination and relationships with suppliers
23 Monthly project material requirement / management meetings
37 Dedicated inventory specialist
38 Coordination with Planners, Construction, Suppliers and Supply Chain
40 We focus on cycle counts, working closely with distribution of what jobs are needed when, and we have stocking requirements on many contracts.
24 Material planning
21 Focused analysis and metrics that create visibility and enable decision making
30 Optimizing inventory27 Planning34 Hard Work, Mentoring and Continuous Improvement
359 Concentrated focus on centralized warehousing, inventory values and material usage.32 Adjusting Min/Max Levels in Maximo Inventory Program
Close planning and coordination with suppliers and material users was mentioned by 6 of the 13 responding companies
Other specific responses focused on metrics (2 companies), dedicated staffing (1 company), use of an integrator supplier for fast moving material (1 company), and adjusting min/max levels in the company’s inventory management system (1 company)
Top 3 Performers on Inventory Turns

T&D Storeroom Facilities
7
# Storeroom Facilities # Facilities per 1,000 Square Miles
Support Pages 28 and 30Source SU45, SU30
The best way to evaluate this is on a per square mile basis.
Roughly 1.5 to 4 storeroom facilities per 1,000 square miles is the norm
This data suggests that companies 22 and 40 might gain some economies by consolidating storeroom locations

Job Site Deliveries and Truck Loading
8
Materials Delivered Directly to Job Site Materials Loaded on Crew Trucks
Support Pages 32, 33 and 34Source: SU60, SU61, SU62
There are wide variations on whether stores staff are engaged in delivering material to jobs sites and/or loading material onto crew trucks
Other:
38 – Loaded and delivered throughout the day to job sites
30 – Contractor pick up, counter pick up and job site delivery
27 – Deliveries to crews
359 – Loaded by logistics in the morning

9
Mitigating Copper Theft
Copper theft has been occurring in the storeroom yards as well as in the field. Companies are addressing this costly problem through a variety of security measures.
Company Experiences/Locations Responses22 After hour thefts that have impacted many of the locations in our service
territory.Copper is secured inside where possible, we also invested in an alarm system for the warehouse
23 We do not have a significant problem with this. Storage in a secure location37 Frequently, usually at satelite warehouses, contractors yard, or trucks Secure storage, Corporate Security following up on all events
40 It is rare from the warehouse If possible, we keep copper items inside the warehouse. If it is outside, we put a large heavy steel box over the copper bus bar. All copper items are kept in a yard close to the warehouse building with a fence having barb wire on top24 Cable thefts occur primarily at Sub -Stations and Division Headquarters Security fencing,Security Guards, additional cameras
21 Primarily occurs on job sites. Typically, a Conex box is broken into and copper is taken
We are using more robust locking systems on Conex boxes that increase security. At our warehouses, we keep copper away from fences, in the most secure areas possible, under camera view where possible
30 Mainly substations, transformers in the field, and some laydown areas Heightened security, moving copper materials such as cable from perimeter of yard to center
27 The main areas of copper theft have been in underground pull boxes, storage areas, exterior grounds in substations, and vacant businesses (transformers)
Higher levels of security, locking lids for pull boxes, and we are looking to purchase some proof positive ground wire that can be identified at the scrap dealers
34 Theft occurs occasionally Yards are secured and monitored, and inventory counts are reconciled.
359 Mostly wire. Theft has occurred in warehouses and substations. Installed cameras and marking bare wire with paint
32 Cut Hole in Storage Yard Fence and Stole Bare Copper along with pole grounds and sub grounds.
Cameras installed and increase security patrols at storage locations and changed standards to copper clad or tinned copper ground wires.
Support Pages 39 and 40Source: SU65 and SU66

10
Fleet Operations

Se-ries1
0
0.5
1
1.5
2
2.5
3
Vehicles per Circ
Mile
Pa
sse
ng
er
Ve
hic
les
Ae
ria
l lift
tru
ck: s
ing
le b
...
Ae
ria
l lift
tru
ck: d
ou
ble
b...
Lin
e T
ruck
s D
err
ick
Dig
...
Ba
ckh
oe
He
avy
co
nst
ruc.
..
Me
diu
m T
ruck
GV
W1
0k
l...
He
avy
Tru
ck G
VW
26
k lb
s
$0
$10,000
$20,000
$30,000
$40,000
$50,000
$60,000
Cost per Vehicle
(Note the wide ranges of costs for
some classes)
Vehicle Numbers and Operating Costs
Bars show panel average number of vehicles normalized by circuit mile. Lines show max, min and average annual operating costs.
Avg. Annual Operating Costs
2013YE 2012YE 2011YE
Passenger Vehicles $5,956 $6,139 $6,674
Aerial lift truck: single bucket
$22,262 $21,972 $26,170
Aerial lift truck: double bucket
$26,252 $26,076 $28,773
Line Trucks Derrick Diggers Cranes
$24,587 $26,044 $27,306
Backhoe Heavy construction vehicles
$8,204 $7,147 $8,578
Medium Truck GVW>10k lbs <= 26k lbs
$11,575 $10,959 $11,371
Heavy Truck GVW>26k lbs
$15,410 $18,285 $21,622
11
The average annual operating costs for most vehicles classes have been decreasing in our community (includes leases, depreciation, maintenance and licensing).
(Probably not all for T&D employees)
Annual
12
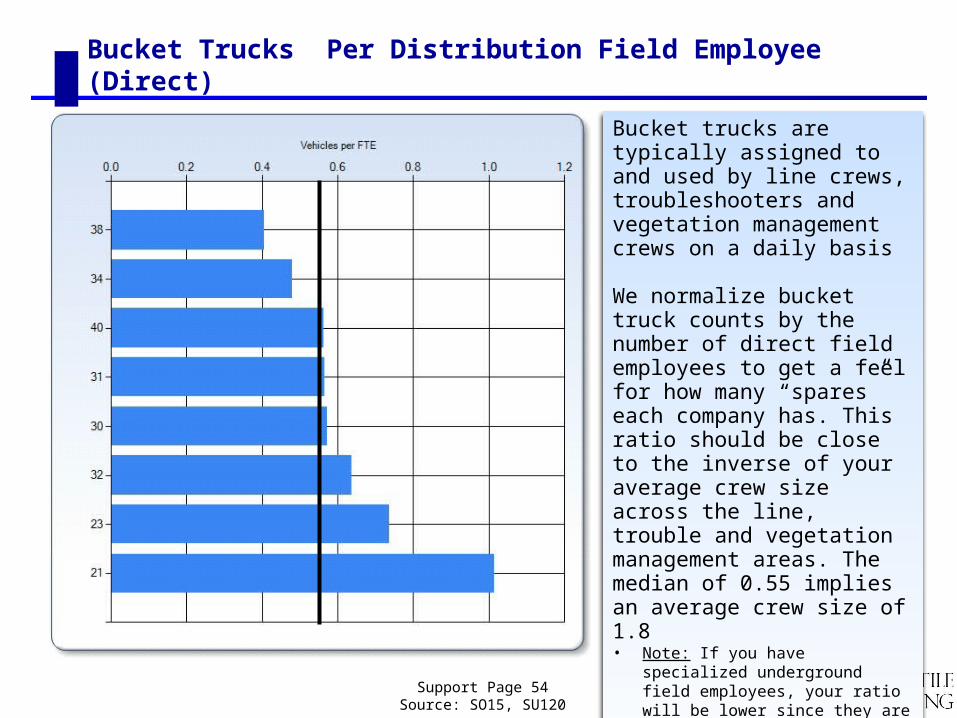
Bucket trucks are typically assigned to and used by line crews, troubleshooters and vegetation management crews on a daily basis
We normalize bucket truck counts by the number of direct field employees to get a feel for how many “spares” each company has. This ratio should be close to the inverse of your average crew size across the line, trouble and vegetation management areas. The median of 0.55 implies an average crew size of 1.8
• Note: If you have specialized underground field employees, your ratio will be lower since they are in the denominator but don’t use bucket trucks
Support Page 54Source: SO15, SU120
Bucket Trucks Per Distribution Field Employee (Direct)

13
Heavy Equipment Per Circuit Mile
Support Page 55Source: ST35, SU120
Typically much of this equipment is not assigned to nor used by all crews on an a daily basis (shared or pooled equipment)
Normalizing by circuit mile provides a rough indication of how much shared equipment is readily available to crews in each geographic area of each utility’s service territory.
The wide variations shown on this chart may be attributable to differences in practices regarding work contracting (companies that contract most of their underground construction and major overhead construction work would likely have less of this equipment).

14
% of Vehicles that are Owned (not leased)
Support Pages 57, 61,62.63Source: SU125, SU135
Owned vs. Leased Vehicles and Percent Alternative Fuel Use
10 of 13 reporting companies own most of their vehicles. Only 3 show large percentages of alternative fuel use for the larger trucks that T&D uses
% of Vehicles that Use Alternative Fuels (any type)Measure 21 22 23 27 28 30 31 32 34 37 359 38 40
Passenger vehicles 10 7 25 10 41 0 100 1 0 19 50
Aerial lift truck: single bucket 3 100 1 0 70 0 90 0 0
Aerial lift truck: double bucket 100 0 0 70 0 90 0 0
Line trucks, derricks, diggers, cranes 100 0 0 70 0 90 0 0
Backhoe, heavy construction vehicles 0 0 0 0 90 0 0
Medium Truck GVW10k lbs <= 26k lbs 97 0 0 47 0 1 90 0 0
Heavy Truck GVW26k lbs 100 0 0 79 0 90 0 0
Measure 21 22 23 27 28 30 31 32 34 37 359 38 40
Passenger vehicles 10 95 100 100 100 100 100 100 ? 100 100 100Aerial lift truck: single bucket 10 96 100 0 100 100 100 86 ? 100 100 50Aerial lift truck: double bucket 5 50 100 94 100 100 100 ? 100 100 64Line trucks, derricks, diggers, cranes 3 10 100 97 100 100 100 100 ? 100 100 82Backhoe, heavy construction vehicles 100 97 100 0 100 100 100 100 ? 100 100 0Medium Truck GVW10k lbs <= 26k lbs 100 5 100 100 100 100 100 100 ? 100 100 100Heavy Truck GVW26k lbs 100 100 5 100 100 100 100 100 100 ? 100 100 93

15
Fleet Operations Outsourcing
Outsourced Functions % *Routine maintenance 40%
Road Service 40%
Tire repair & replacement 73%
Engine repairs & overhauls 60%
Transmission repairs & overhauls 80%
Collision and Damage repair 87%
Storage 20%
Towing 87%
Alignment 60%
Glass & Windshield Replacement 87%
Aerial Equipment Inspection 53%
Other 33%
Support Pages 65Source: SU140
Most companies outsource portions of their fleet operations. The functions that are most commonly outsourced are highlighted in red
* % of responding companies (15) that outsource each function (partially or completely)

16
Shops

17
Distribution Shops Work Outsourcing
Only five companies responded to this question. All of those companies outsource portions of their Distribution Shops work. The functions that are most commonly outsourced are highlighted in red. None of those companies outsource AMR/AMI meter testing and repairs.
Source: Report page 41, SU67
Outsourced Functions % *
Distribution transformer testing and repairs/refurbishment 20%
Regulator testing and repairs/refurbishment 40%
Switch repairs/refurbishment 60%
Recloser repairs/refurbishment 60%
Traditional meter testing and repairs 20%
AMR/AMI meter testing and repairs/firmware updates 0%
Tool repairsrefurbishment 60%
Rubber goods cleaning and testing 80%
Other 20%
* % of responding companies (5) that outsource each function (partially or completely)

18
Meter Shop Operations Improvement Initiatives
It is interesting how much is going on in this area; a very diverse list of initiatives and process improvements
ID Response
31 Ability to perform multiple AMS firmware and configuration updates at a workstation
23 Adopting new technology and employee training
37 1) Procured rebuilds for Read One Pro Batteries to extend the life of an obsolete device. 2) programmed meter test systems to flag a meter and notify a technician for special meter disposition. 3) Develop new automated electric meter retirement process (point and click). 4) Eliminated nonvalue added processes that cost more to perform than the benefits they gained. 5) Pursued an aggressive resale of surplus meters.
38 Metering Operations has begun rotating meterman employees into the shop for cross training to improve metering operations and meter shop efficiency.
21 Standardizing Procedures, Engage with tech, Comm w/stakeholders
30 Consolidation of standard test equipment, meters and material
27 Hot checks of new transformer rated installations with redundant verification by journeymen
34 The meter shop is conducting a large study to understand the impact of AMI meters. This is a cross - department study (Operations, Engineering, Finance, etc.) and has helped identify many issues relating to the current processes.
32 Purchasing solid state meters that don't need testing like electro - mechanical.
Source: Report page 42, SU70

19
Distribution Transformer Shop Operations Improvement Initiatives
It is also interesting how much is going on in this area
ID Response
22 Working on similar style/types of transformers @ one time to gain efficiencies
31 Transformer repair currently outsourced
23 Adopting new technology and employee training. Value based prioritization of repairable units verses cost.
37 Procedures in place to repair equipment <20 years of age for 1* and 3* OH & pad mounted equipment. Cost to refurbish 1* OH transformers not to exceed $100, 1* PD not to exceed $200 and 3* PD not to exceed $1500. Check integrity of repaired equipment
38 The Standardization of Test equipment saves time on Training and improves safety and reliability for customers. Using formal classroom training along with OJT makes for a more valued employee. Tailboard meetings before job duties to be performed. Journeymen having company cell phones for quick communications. The implementation of the new spill notification process.
24 Only minor transformer repairs are done in house, no formal practices. Transformers are either outsourced for repair or scrapped.
30 Refurbishment of used transformer mineral oil. Direct relationship with OEM parts manufacturer. Structured 18 - 24 month training program. Immediate welding/fabricating support within department. Electronic procedure implemented that indicates status of individual apparatus, improving communication between repair, testing, inventory, and final customer
27 The only real change is changing the criteria on what we repair.
34 The transformer shop is also conducting a large study to understand the overall transformer process. The purpose is to address potential audit concerns and find opportunities for improvement. Swarms are being held to begin this process in mid - June.
32 New transformer test equipment computer software reduces labor filing paperwork.
Source: Report page 43, SU75

20
Substation Shop Work Outsourcing
Ten companies responded to this question. All of those companies outsource portions of their Substation Shop work. The functions that are most commonly outsourced are highlighted in red.
Source: Report page 47, SU90
* % of responding companies (10) that outsource each function (partially or completely)
Outsourced Functions % *
Substation transformer testing and repairs/refurbishment 90%
Substation switchgear testing and repairs/refurbishment 40%
Oil Circuit Breaker (OCB) repairs/refurbishment 40%
Air Circuit Breaker (ACB) repairs/refurbishment 50%
Relay testing and repairs/refurbishment 50%
Other 40%

21
Substation Shop Operations Improvement Initiatives
A variety of improvement initiatives were identified for Substation Shops
ID Response
31 Load management, transformer assessment study, Diagnostic testing
23 LTC rebuild spare inventory, LTC kits, carrying critical parts that are commonly known problems, monitoring DGA's thru lab analysis
37 Minor repairs are done in field, others require shipment to vendor
38 Having a one company mindset working with other departments, especially with Substation. We take
care of their transformer oil needs by ordering, testing, storage, reclaiming and disposal. Open
communications help to make the two departments work together well.
27 We don't repair substation transformers in the shop.
34 'One practice that is in place is having in - house technicians shadow vendors that perform services. This
helps us build the in - house capabilities to perform the same services. Another practice that is in place is
giving the manufacturers the specifications to meet our needs on the initial order/service. This eliminates
rework in the field.'
359 Increased use of the Work Management System has assisted in processing work orders more efficiently. Work identification has improved.
32 New transformer test equipment computer software reduces labor filing paperwork.
Source: Report page 48, SU95

22
Repair vs. Replace Criteria - Substation Transformers
ID Response22 For transformers ….. the [repair]cost cannot exceed 50% of the cost of a new unit.
31 Diagnostic testing, prioritized PM, condition based PM
23 Cost, Manufacturer, Type, Age, Re -wind Cost, Lead Time, Damage Occurred,
37 Technical evaluation of magnitude and type of problem/damage. Consideration given to age, size, and type transformer compared to future system needs. Are parts available now and in the future? Repairs (including rewinding core) are evaluated based on costs and overall benefit obtained
38 For replacement and major repairs of Power Transformers we are using a risk-based algorithm within our Cascade Database. The algorithm considers current off - line test results, yearly dissolved gas analysis (Main Tank and LTC), transformer criticality, Manufacturer, LTC Type, and Age. Asset Management will then couple this score with Maintenance History and Maintenance Dollars spent to derive a final ranking and asset replacement/repair strategy.
24 Condition Assessment Maintenance Plan through our Central Maintenance Manager System - DGA Yearly Sampling, Ten Year Insulation Electrical Testing - History of Electrical Test data
21 Financial analysis based off of many factors
30 Design, manufacturer, vintage
27 If cost is less then 75% of purchase of a new transformer will repair, or is transformer unique that it requires less modification
359 It depends on a lot of factors - age, availability of parts, lead time for parts, lead time for new equipment, cost of repair vs. cost of replacement, history of similar assets, etc. In general, if the repair can be performed quick and low cost, it is repaired. If the repair will take a long time, is very expensive, and the asset is old, it will be replaced. We also perform various tests on the transformer to determine its health and use that to help make the decision.
32 Replace sub transformers as they age to near end of life.
Repair vs. replace criteria for transformers vary widely across our community
Source: Report page 45, SU85.1

23
Repair vs. Replace Criteria - Breakers
Repair vs. replace criteria for breakers also vary widely across our community
ID Response
22 For … breakers, the [repair] cost cannot exceed 50% of the cost of a new unit
31 Condition based monitoring, equipment history, prioritization
23 Cost, Manufacturer, Type, Age, Parts Availability, Worse Performers
37 Technical evaluation of magnitude and type of problem/damage. Consideration given to age and type of breaker. Are parts available now and in the future? Repairs are evaluated based on costs and overall benefit obtained
38 We currently rely on diagnostic testing, equipment age, and system capacity upgrade needs as a basis for our circuit breaker replacements. At this time we are in the process of moving to a risk based methodology of breaker ranking, similar to our transformer ranking system that will allow us to target poor performing breakers with high maintenance costs for replacement.
24 Condition Assessment Maintenance Plan through our Central Maintenance Manager System - 8 Year Insulation Electrical Testing - History of ElectricalTest data, Yearly Moisture Sampling on SF6 GCB's
21 Reliability money is used to phase out oil breakers each year.
30 Design, manufacturer, vintage
27 Instead of overhauling OCB breakers we have moved to replacing them with GCB
359 It depends on a lot of factors - age, availability of parts, lead time for parts, lead time for new equipment, cost of repair vs. cost of replacement, history of similar assets, etc. In general, if the repair can be performed quick and low cost, it is repaired. If the repair will take a long time, is very expensive, and the asset is old, it will be replaced. We also perform various tests on the breaker to determine its health and use that to help make the decision.
32 It is almost always cheaper to repair then replace.
Source: Report page 45, SU85.2

24
Repair vs. Replace Criteria - Relays
Repair vs. replace analysis criteria for relays are influenced by the desire to upgrade to new technology
ID Response
22 We don't repair relays
31 New technology -micro - processor enhancement
37 Primary driver is fastest repair time to restore full functionality. Additionally, consideration given to age and type of relay, are parts available now and in the future? Repairs are evaluated based on costs and overall benefit obtained
38 Determination is based on availability of spare parts and/or spare Relays. Manpower is also taken in to consideration.
24 Preventive Maintenance Plan through our SAP System - Maintenance and testing of protection equipment is 4 years - Auxiliary relays are maintain in various intervals between 1 to 2 years which are set up to ensure that the protection system is in good working condition.
21 Relays are upgraded as the opportunity arises
27 Electromechanical are generally scrapped and SEL relays are sent back to the manufacturer
359 It depends on a lot of factors - age, availability of parts, lead time for parts, lead time for new equipment, cost of repair vs. cost of replacement, history of similar assets, etc. For relays, typically multiple relays are used for a protection scheme, so the system needs to be evaluated and a system decison is made.
32 Replace electromechanical on a program basis.
Source: Report page 46, SU85.3

Thank you for your Input and Participation!
25
Corporate Offices
California
400 Continental Blvd. Suite 600El Segundo, CA 90245(310) 426-2790
Maryland
3 Bethesda Metro Center Suite 700Bethesda, MD 20814(301) 961-1505
Ken Buckstaff [email protected]
David [email protected]
Dave [email protected]
New York | Texas | Washington | Wisconsin
Debi McLain [email protected]
Your Presenters
First Quartile Consulting is a utility-focused consultancy providing a full range of consulting services including continuous process improvement, change management, benchmarking and more. You can count on a proven process that assesses and optimizes your resources, processes, leadership management and technology to align your business needs with your customer’s needs.
Visit us at www.1stquartileconsulting.com | Follow our updates on LinkedIn
About 1QC
Satellite Offices