Embed Size (px)
Citation preview
TD Bank Group Reports Third Quarter 2021 Results Report to Shareholders • Three and nine months ended July 31, 2021
The financial information in this document is reported in Canadian dollars and is based on the Bank’s unaudited Interim Consolidated Financial Statements and related Notes prepared in accordance with International Financial Reporting Standards (IFRS) as issued by the International Accounting Standards Board (IASB), unless otherwise noted.
Reported results conform to generally accepted accounting principles (GAAP), in accordance with IFRS. Adjusted measures are non-GAAP measures. Refer to the “How the Bank Reports” section of the Management’s Discussion and Analysis (MD&A) for an explanation of reported and adjusted results.
THIRD QUARTER FINANCIAL HIGHLIGHTS, compared with the third quarter last year: Reported diluted earnings per share were $1.92, compared with $1.21. Adjusted diluted earnings per share were $1.96, compared with $1.25. Reported net income was $3,545 million, compared with $2,248 million. Adjusted net income was $3,628 million, compared with $2,327 million. YEAR-TO-DATE FINANCIAL HIGHLIGHTS, nine months ended July 31, 2021, compared with the corresponding period last year: Reported diluted earnings per share were $5.68, compared with $3.62. Adjusted diluted earnings per share were $5.83, compared with $3.76. Reported net income was $10,517 million, compared with $6,752 million. Adjusted net income was $10,783 million, compared with $6,998 million. THIRD QUARTER ADJUSTMENTS (ITEMS OF NOTE) The third quarter reported earnings figures included the following items of note: Amortization of acquired intangibles of $68 million ($61 million after-tax or 3 cents per share), compared with $63 million ($54 million after-tax or
3 cents per share) in the third quarter last year. Acquisition and integration charges related to the Schwab transaction of $24 million ($22 million after-tax or 1 cent per share). TORONTO, August 26, 2021 – TD Bank Group (“TD” or the “Bank”) today announced its financial results for the third quarter ended July 31, 2021. Reported earnings were $3.5 billion, up 58% compared with the third quarter last year, and adjusted earnings were $3.6 billion, up 56%. “TD’s strong performance in the third quarter was supported by solid revenue growth in our Canadian and U.S. Retail businesses as economic activity and employment levels continued to improve on both sides of the border,” said Bharat Masrani, Group President and CEO, TD Bank Group. “TD’s strategy – anchored in our proven business model – enabled us once again to deliver for our shareholders, meet the needs of our customers and clients and contribute to the economic recovery, while continuing to invest in our people, technology, and capabilities.” “While businesses and consumers are resuming some of their normal activities and more people are getting vaccinated, recent developments and new variants remind us that the global pandemic is not yet over,” added Masrani. “TD will continue to adapt in this fluid environment, adjust in real-time, and prioritize the well-being of our people and all those we serve.” Canadian Retail Canadian Retail reported net income was $2,125 million, an increase of 68% compared with the third quarter last year. Revenue increased 9%, supported by continued momentum in mortgage originations and deposits, strong commercial loan growth and mutual fund sales, as well as record card sales. Reported expenses increased 8%, reflecting business growth spend including volume-driven and employee-related expenses and investments in technology and marketing. Provisions for credit losses (PCL) decreased by $851 million from the prior year, reflecting lower impaired PCL and a recovery in performing PCL. Canadian Retail continued to innovate to serve customers where and when they want. This includes a new strategic alliance with Canada Post that will see the Personal Bank provide Canadians – particularly those in rural, remote and Indigenous communities – with expanded access to financial services, and the launch of new TD Insurance tools such as mobile severe weather and safety alerts and a new digital virtual assistant. In the Commercial Bank, the acquisition of Wells Fargo’s Canadian Direct Equipment Finance business closed, delivering scaled expertise in equipment leasing and finance. U.S. Retail U.S. Retail net income was $1,295 million (US$1,052 million), an increase of 92% (115% in U.S. dollars) compared with the third quarter last year. The Bank’s investment in The Charles Schwab Corporation (Schwab) contributed $197 million (US$161 million) in earnings, compared with the contribution of $317 million (US$230 million) from TD Ameritrade a year ago. The U.S. Retail Bank, which excludes the Bank’s investment in Schwab, reported record net income of $1,098 million (US$891 million), an increase of 208% (243% in U.S. dollars) from the third quarter last year. In U.S. dollars, revenue increased 5% reflecting higher non-interest income, partially offset by lower deposit margins. PCL decreased by US$729 million ($993 million) reflecting lower impaired and performing PCL. Expenses increased 2% in U.S. dollars, reflecting higher investment in the business and employee-related expenses, partially offset by productivity savings. In Canadian dollars, revenue and expenses declined 6% and 8%, respectively, primarily as a result of appreciation in the Canadian dollar since the third quarter last year. The U.S. Retail Bank continued to support customers by expanding the tools and advice it provides, generating strong results from increased customer activity and higher personal and business deposit volumes. This quarter, TD Bank, America’s Most Convenient Bank® (TD AMCB) introduced TD Essential Banking, a low-cost, no-overdraft-fee deposit account, and announced overdraft policy changes as part of its ongoing efforts to meet evolving customer needs and provide underserved communities with affordable access to mainstream financial services and products. TD AMCB also announced the establishment of a US$100 million equity fund in support of minority-owned small businesses, further demonstrating its commitment to provide opportunity in underserved communities and help
TD BANK GROUP • THIRD QUARTER 2021 • REPORT TO SHAREHOLDERS Page 1

combat racial inequities. The U.S. Retail Bank continued to invest in enhancing the customer experience, including the ability to book in-store appointments online for retail, small business and wealth services and simplifying how debit or credit cards are added to digital wallets. Wholesale Wholesale Banking reported net income of $330 million this quarter, a decrease of 25% compared to the third quarter last year, reflecting lower revenue, partially offset by lower PCL and lower non-interest expenses. Revenue for the quarter was $1,083 million, a decrease of 22% from a year ago, primarily reflecting lower trading-related revenue, partially offset by higher advisory fees. PCL decreased by $121 million from the prior year, reflecting lower impaired and performing PCL. This quarter, TD Securities was named “Canada’s Best Investment Bank” by the 2021 Euromoney Awards and recognized as the 2021 Canadian FX Service Quality Leader as measured by the Greenwich Quality Index for the second year in a row. TD Securities was selected as one of two Structuring Advisors to the Government of Canada’s inaugural issuance of green bonds, reflecting leadership in the Environmental, Social and Governance (ESG) space. The Wholesale Bank continued to invest in its client-centric strategy and further extended its global reach and capabilities with the completion of TD’s acquisition of Headlands Tech Global Markets, LLC. Capital TD’s Common Equity Tier 1 Capital ratio was 14.5%. Conclusion “As we look to the future, we are committed to delivering on our purpose to enrich the lives of our customers, colleagues and communities and to contributing to an inclusive recovery for all. Each day our 90,000 colleagues around the world help make our customers’ financial aspirations a reality and I want to thank them for their dedication,” concluded Masrani. The foregoing contains forward-looking statements. Please refer to the “Caution Regarding Forward-Looking Statements” on page 4.
TD BANK GROUP • THIRD QUARTER 2021 • REPORT TO SHAREHOLDERS Page 2
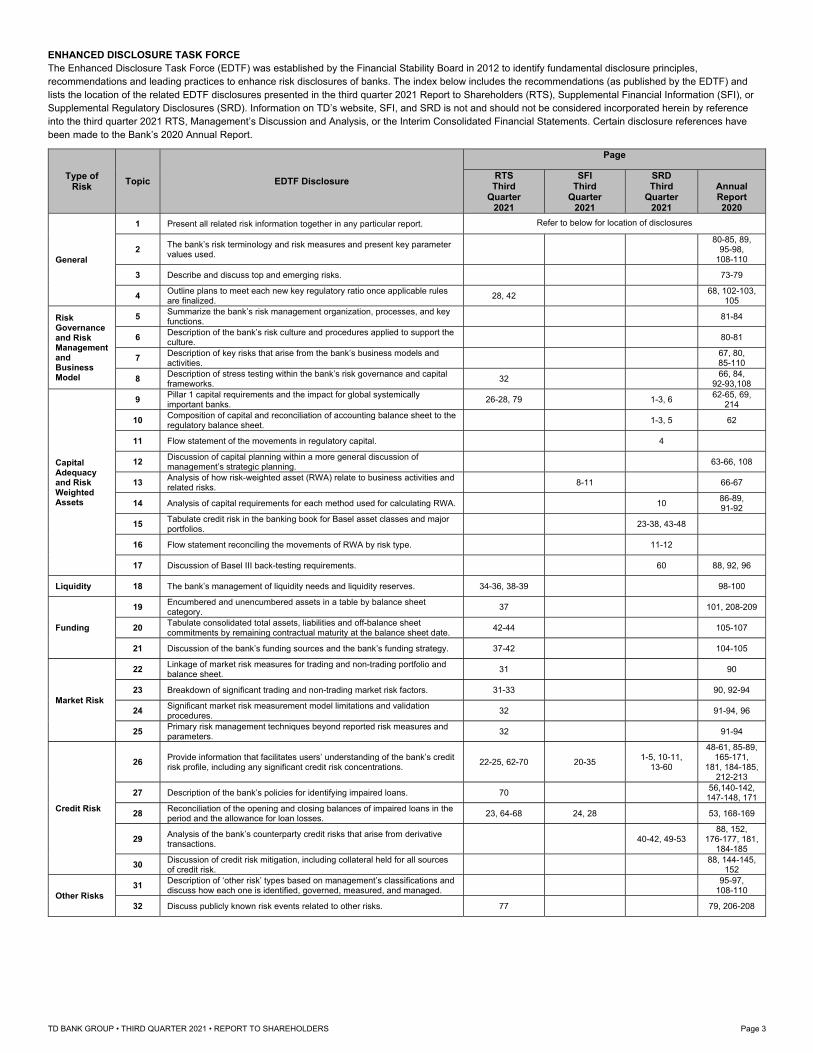
ENHANCED DISCLOSURE TASK FORCE The Enhanced Disclosure Task Force (EDTF) was established by the Financial Stability Board in 2012 to identify fundamental disclosure principles, recommendations and leading practices to enhance risk disclosures of banks. The index below includes the recommendations (as published by the EDTF) and lists the location of the related EDTF disclosures presented in the third quarter 2021 Report to Shareholders (RTS), Supplemental Financial Information (SFI), or Supplemental Regulatory Disclosures (SRD). Information on TD’s website, SFI, and SRD is not and should not be considered incorporated herein by reference into the third quarter 2021 RTS, Management’s Discussion and Analysis, or the Interim Consolidated Financial Statements. Certain disclosure references have been made to the Bank’s 2020 Annual Report.
Type of Risk
Topic EDTF Disclosure
Page
RTS Third
Quarter 2021
SFI Third
Quarter 2021
SRD Third
Quarter 2021
Annual Report 2020
General
1 Present all related risk information together in any particular report. Refer to below for location of disclosures
2 The bank’s risk terminology and risk measures and present key parameter values used.
80-85, 89,
95-98, 108-110
3 Describe and discuss top and emerging risks. 73-79
4 Outline plans to meet each new key regulatory ratio once applicable rules are finalized.
28, 42 68, 102-103,
105
Risk Governance and Risk Management and Business Model
5 Summarize the bank’s risk management organization, processes, and key functions.
81-84
6 Description of the bank’s risk culture and procedures applied to support the culture.
80-81
7 Description of key risks that arise from the bank’s business models and activities.
67, 80, 85-110
8 Description of stress testing within the bank’s risk governance and capital frameworks.
32 66, 84,
92-93,108
Capital Adequacy and Risk Weighted Assets
9 Pillar 1 capital requirements and the impact for global systemically important banks.
26-28, 79 1-3, 6 62-65, 69,
214
10 Composition of capital and reconciliation of accounting balance sheet to the regulatory balance sheet.
1-3, 5 62
11 Flow statement of the movements in regulatory capital. 4
12 Discussion of capital planning within a more general discussion of management’s strategic planning.
63-66, 108
13 Analysis of how risk-weighted asset (RWA) relate to business activities and related risks.
8-11 66-67
14 Analysis of capital requirements for each method used for calculating RWA. 10 86-89, 91-92
15 Tabulate credit risk in the banking book for Basel asset classes and major portfolios.
23-38, 43-48
16 Flow statement reconciling the movements of RWA by risk type. 11-12
17 Discussion of Basel III back-testing requirements. 60 88, 92, 96
Liquidity 18 The bank’s management of liquidity needs and liquidity reserves. 34-36, 38-39 98-100
Funding
19 Encumbered and unencumbered assets in a table by balance sheet category.
37 101, 208-209
20 Tabulate consolidated total assets, liabilities and off-balance sheet commitments by remaining contractual maturity at the balance sheet date.
42-44 105-107
21 Discussion of the bank’s funding sources and the bank’s funding strategy. 37-42 104-105
Market Risk
22 Linkage of market risk measures for trading and non-trading portfolio and balance sheet.
31 90
23 Breakdown of significant trading and non-trading market risk factors. 31-33 90, 92-94
24 Significant market risk measurement model limitations and validation procedures.
32 91-94, 96
25 Primary risk management techniques beyond reported risk measures and parameters.
32 91-94
Credit Risk
26 Provide information that facilitates users’ understanding of the bank’s credit risk profile, including any significant credit risk concentrations.
22-25, 62-70 20-35 1-5, 10-11,
13-60
48-61, 85-89, 165-171,
181, 184-185, 212-213
27 Description of the bank’s policies for identifying impaired loans. 70 56,140-142,
147-148, 171
28 Reconciliation of the opening and closing balances of impaired loans in the period and the allowance for loan losses.
23, 64-68 24, 28 53, 168-169
29 Analysis of the bank’s counterparty credit risks that arise from derivative transactions.
40-42, 49-53 88, 152,
176-177, 181, 184-185
30 Discussion of credit risk mitigation, including collateral held for all sources of credit risk.
88, 144-145,
152
Other Risks 31
Description of ‘other risk’ types based on management’s classifications and discuss how each one is identified, governed, measured, and managed.
95-97,
108-110
32 Discuss publicly known risk events related to other risks. 77 79, 206-208
TD BANK GROUP • THIRD QUARTER 2021 • REPORT TO SHAREHOLDERS Page 3
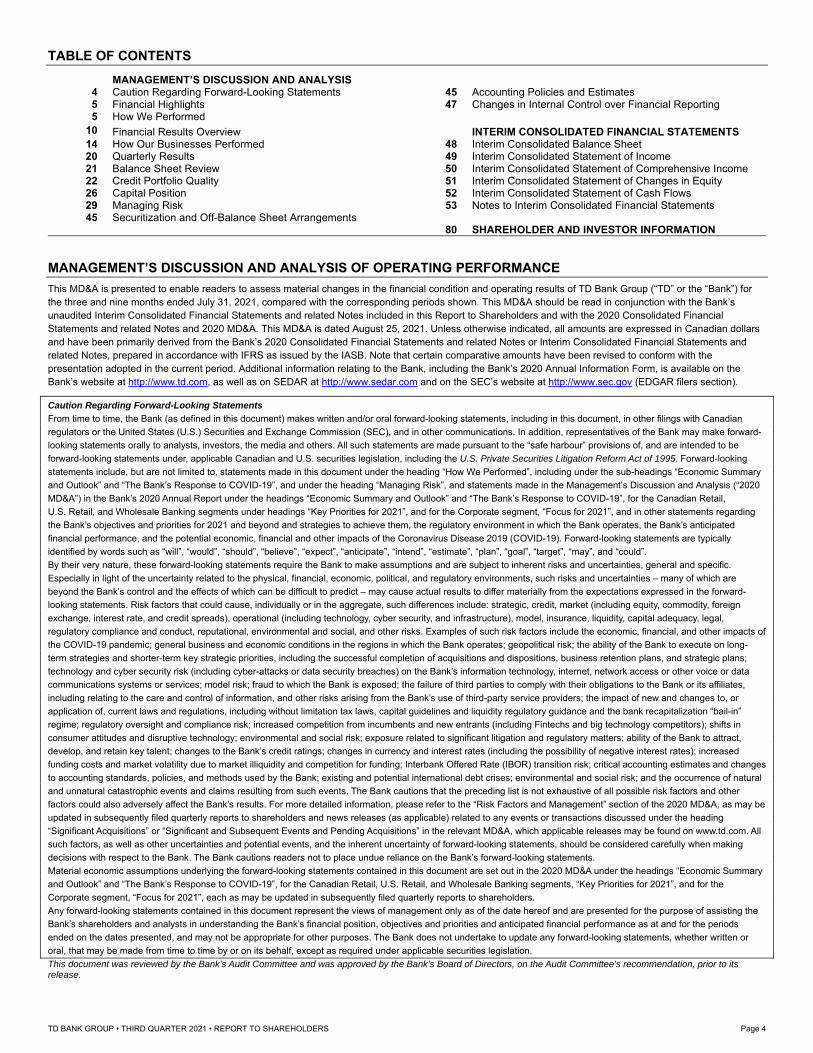
TABLE OF CONTENTS
MANAGEMENT’S DISCUSSION AND ANALYSIS 4 Caution Regarding Forward-Looking Statements 45 Accounting Policies and Estimates 5 Financial Highlights 47 Changes in Internal Control over Financial Reporting 5 How We Performed
10 Financial Results Overview INTERIM CONSOLIDATED FINANCIAL STATEMENTS 14 How Our Businesses Performed 48 Interim Consolidated Balance Sheet 20 Quarterly Results 49 Interim Consolidated Statement of Income 21 Balance Sheet Review 50 Interim Consolidated Statement of Comprehensive Income 22 Credit Portfolio Quality 51 Interim Consolidated Statement of Changes in Equity 26 Capital Position 52 Interim Consolidated Statement of Cash Flows 29 Managing Risk 53 Notes to Interim Consolidated Financial Statements 45 Securitization and Off-Balance Sheet Arrangements
80 SHAREHOLDER AND INVESTOR INFORMATION
MANAGEMENT’S DISCUSSION AND ANALYSIS OF OPERATING PERFORMANCE
This MD&A is presented to enable readers to assess material changes in the financial condition and operating results of TD Bank Group (“TD” or the “Bank”) for the three and nine months ended July 31, 2021, compared with the corresponding periods shown. This MD&A should be read in conjunction with the Bank’s unaudited Interim Consolidated Financial Statements and related Notes included in this Report to Shareholders and with the 2020 Consolidated Financial Statements and related Notes and 2020 MD&A. This MD&A is dated August 25, 2021. Unless otherwise indicated, all amounts are expressed in Canadian dollars and have been primarily derived from the Bank’s 2020 Consolidated Financial Statements and related Notes or Interim Consolidated Financial Statements and related Notes, prepared in accordance with IFRS as issued by the IASB. Note that certain comparative amounts have been revised to conform with the presentation adopted in the current period. Additional information relating to the Bank, including the Bank’s 2020 Annual Information Form, is available on the Bank’s website at http://www.td.com, as well as on SEDAR at http://www.sedar.com and on the SEC’s website at http://www.sec.gov (EDGAR filers section).
Caution Regarding Forward-Looking Statements
From time to time, the Bank (as defined in this document) makes written and/or oral forward-looking statements, including in this document, in other filings with Canadian
regulators or the United States (U.S.) Securities and Exchange Commission (SEC), and in other communications. In addition, representatives of the Bank may make forward-
looking statements orally to analysts, investors, the media and others. All such statements are made pursuant to the “safe harbour” provisions of, and are intended to be
forward-looking statements under, applicable Canadian and U.S. securities legislation, including the U.S. Private Securities Litigation Reform Act of 1995. Forward-looking
statements include, but are not limited to, statements made in this document under the heading “How We Performed”, including under the sub-headings “Economic Summary
and Outlook” and “The Bank’s Response to COVID-19”, and under the heading “Managing Risk”, and statements made in the Management’s Discussion and Analysis (“2020
MD&A”) in the Bank’s 2020 Annual Report under the headings “Economic Summary and Outlook” and “The Bank’s Response to COVID-19”, for the Canadian Retail,
U.S. Retail, and Wholesale Banking segments under headings “Key Priorities for 2021”, and for the Corporate segment, “Focus for 2021”, and in other statements regarding
the Bank’s objectives and priorities for 2021 and beyond and strategies to achieve them, the regulatory environment in which the Bank operates, the Bank’s anticipated
financial performance, and the potential economic, financial and other impacts of the Coronavirus Disease 2019 (COVID-19). Forward-looking statements are typically
identified by words such as “will”, “would”, “should”, “believe”, “expect”, “anticipate”, “intend”, “estimate”, “plan”, “goal”, “target”, “may”, and “could”.
By their very nature, these forward-looking statements require the Bank to make assumptions and are subject to inherent risks and uncertainties, general and specific.
Especially in light of the uncertainty related to the physical, financial, economic, political, and regulatory environments, such risks and uncertainties – many of which are
beyond the Bank’s control and the effects of which can be difficult to predict – may cause actual results to differ materially from the expectations expressed in the forward-
looking statements. Risk factors that could cause, individually or in the aggregate, such differences include: strategic, credit, market (including equity, commodity, foreign
exchange, interest rate, and credit spreads), operational (including technology, cyber security, and infrastructure), model, insurance, liquidity, capital adequacy, legal,
regulatory compliance and conduct, reputational, environmental and social, and other risks. Examples of such risk factors include the economic, financial, and other impacts of
the COVID-19 pandemic; general business and economic conditions in the regions in which the Bank operates; geopolitical risk; the ability of the Bank to execute on long-
term strategies and shorter-term key strategic priorities, including the successful completion of acquisitions and dispositions, business retention plans, and strategic plans;
technology and cyber security risk (including cyber-attacks or data security breaches) on the Bank’s information technology, internet, network access or other voice or data
communications systems or services; model risk; fraud to which the Bank is exposed; the failure of third parties to comply with their obligations to the Bank or its affiliates,
including relating to the care and control of information, and other risks arising from the Bank’s use of third-party service providers; the impact of new and changes to, or
application of, current laws and regulations, including without limitation tax laws, capital guidelines and liquidity regulatory guidance and the bank recapitalization “bail-in”
regime; regulatory oversight and compliance risk; increased competition from incumbents and new entrants (including Fintechs and big technology competitors); shifts in
consumer attitudes and disruptive technology; environmental and social risk; exposure related to significant litigation and regulatory matters; ability of the Bank to attract,
develop, and retain key talent; changes to the Bank’s credit ratings; changes in currency and interest rates (including the possibility of negative interest rates); increased
funding costs and market volatility due to market illiquidity and competition for funding; Interbank Offered Rate (IBOR) transition risk; critical accounting estimates and changes
to accounting standards, policies, and methods used by the Bank; existing and potential international debt crises; environmental and social risk; and the occurrence of natural
and unnatural catastrophic events and claims resulting from such events. The Bank cautions that the preceding list is not exhaustive of all possible risk factors and other
factors could also adversely affect the Bank’s results. For more detailed information, please refer to the “Risk Factors and Management” section of the 2020 MD&A, as may be
updated in subsequently filed quarterly reports to shareholders and news releases (as applicable) related to any events or transactions discussed under the heading
“Significant Acquisitions” or “Significant and Subsequent Events and Pending Acquisitions” in the relevant MD&A, which applicable releases may be found on www.td.com. All
such factors, as well as other uncertainties and potential events, and the inherent uncertainty of forward-looking statements, should be considered carefully when making
decisions with respect to the Bank. The Bank cautions readers not to place undue reliance on the Bank’s forward-looking statements.
Material economic assumptions underlying the forward-looking statements contained in this document are set out in the 2020 MD&A under the headings “Economic Summary
and Outlook” and “The Bank’s Response to COVID-19”, for the Canadian Retail, U.S. Retail, and Wholesale Banking segments, “Key Priorities for 2021”, and for the
Corporate segment, “Focus for 2021”, each as may be updated in subsequently filed quarterly reports to shareholders.
Any forward-looking statements contained in this document represent the views of management only as of the date hereof and are presented for the purpose of assisting the
Bank’s shareholders and analysts in understanding the Bank’s financial position, objectives and priorities and anticipated financial performance as at and for the periods
ended on the dates presented, and may not be appropriate for other purposes. The Bank does not undertake to update any forward-looking statements, whether written or
oral, that may be made from time to time by or on its behalf, except as required under applicable securities legislation. This document was reviewed by the Bank’s Audit Committee and was approved by the Bank’s Board of Directors, on the Audit Committee’s recommendation, prior to its release.
TD BANK GROUP • THIRD QUARTER 2021 • REPORT TO SHAREHOLDERS Page 4
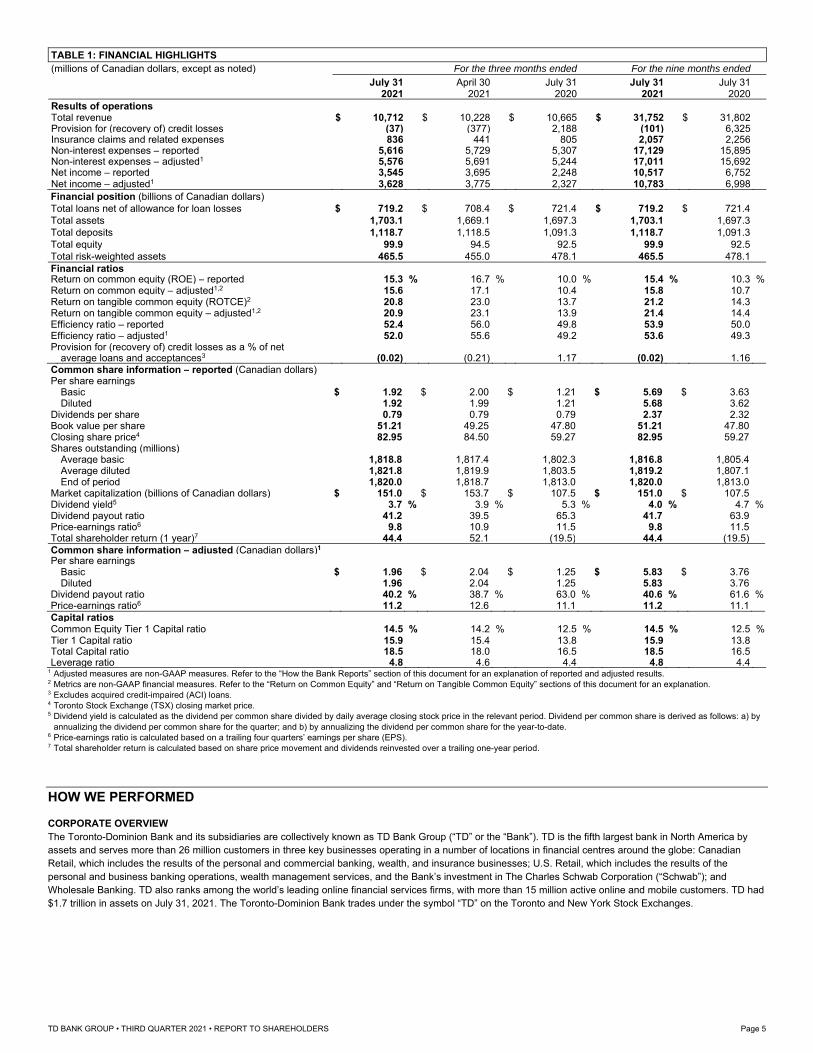
TABLE 1: FINANCIAL HIGHLIGHTS
(millions of Canadian dollars, except as noted) For the three months ended For the nine months ended
July 31 April 30 July 31 July 31 July 31 2021 2021 2020 2021 2020 Results of operations Total revenue $ 10,712 $ 10,228 $ 10,665 $ 31,752 $ 31,802 Provision for (recovery of) credit losses (37) (377) 2,188 (101) 6,325 Insurance claims and related expenses 836 441 805 2,057 2,256 Non-interest expenses – reported 5,616 5,729 5,307 17,129 15,895 Non-interest expenses – adjusted1 5,576 5,691 5,244 17,011 15,692 Net income – reported 3,545 3,695 2,248 10,517 6,752 Net income – adjusted1 3,628 3,775 2,327 10,783 6,998 Financial position (billions of Canadian dollars) Total loans net of allowance for loan losses $ 719.2 $ 708.4 $ 721.4 $ 719.2 $ 721.4 Total assets 1,703.1 1,669.1 1,697.3 1,703.1 1,697.3 Total deposits 1,118.7 1,118.5 1,091.3 1,118.7 1,091.3 Total equity 99.9 94.5 92.5 99.9 92.5 Total risk-weighted assets 465.5 455.0 478.1 465.5 478.1 Financial ratios Return on common equity (ROE) – reported 15.3 % 16.7 % 10.0 % 15.4 % 10.3 % Return on common equity – adjusted1,2 15.6 17.1 10.4 15.8 10.7 Return on tangible common equity (ROTCE)2 20.8 23.0 13.7 21.2 14.3 Return on tangible common equity – adjusted1,2 20.9 23.1 13.9 21.4 14.4 Efficiency ratio – reported 52.4 56.0 49.8 53.9 50.0 Efficiency ratio – adjusted1 52.0 55.6 49.2 53.6 49.3 Provision for (recovery of) credit losses as a % of net
average loans and acceptances3 (0.02) (0.21) 1.17 (0.02) 1.16 Common share information – reported (Canadian dollars) Per share earnings
Basic $ 1.92 $ 2.00 $ 1.21 $ 5.69 $ 3.63 Diluted 1.92 1.99 1.21 5.68 3.62 Dividends per share 0.79 0.79 0.79 2.37 2.32 Book value per share 51.21 49.25 47.80 51.21 47.80 Closing share price4 82.95 84.50 59.27 82.95 59.27 Shares outstanding (millions)
Average basic 1,818.8 1,817.4 1,802.3 1,816.8 1,805.4 Average diluted 1,821.8 1,819.9 1,803.5 1,819.2 1,807.1 End of period 1,820.0 1,818.7 1,813.0 1,820.0 1,813.0 Market capitalization (billions of Canadian dollars) $ 151.0 $ 153.7 $ 107.5 $ 151.0 $ 107.5 Dividend yield5 3.7 % 3.9 % 5.3 % 4.0 % 4.7 % Dividend payout ratio 41.2 39.5 65.3 41.7 63.9 Price-earnings ratio6 9.8 10.9 11.5 9.8 11.5 Total shareholder return (1 year)7 44.4 52.1 (19.5) 44.4 (19.5) Common share information – adjusted (Canadian dollars)1 Per share earnings
Basic $ 1.96 $ 2.04 $ 1.25 $ 5.83 $ 3.76 Diluted 1.96 2.04 1.25 5.83 3.76 Dividend payout ratio 40.2 % 38.7 % 63.0 % 40.6 % 61.6 % Price-earnings ratio6 11.2 12.6 11.1 11.2 11.1 Capital ratios Common Equity Tier 1 Capital ratio 14.5 % 14.2 % 12.5 % 14.5 % 12.5 % Tier 1 Capital ratio 15.9 15.4 13.8 15.9 13.8 Total Capital ratio 18.5 18.0 16.5 18.5 16.5 Leverage ratio 4.8 4.6 4.4 4.8 4.4
1 Adjusted measures are non-GAAP measures. Refer to the “How the Bank Reports” section of this document for an explanation of reported and adjusted results. 2 Metrics are non-GAAP financial measures. Refer to the “Return on Common Equity” and “Return on Tangible Common Equity” sections of this document for an explanation. 3 Excludes acquired credit-impaired (ACI) loans. 4 Toronto Stock Exchange (TSX) closing market price. 5 Dividend yield is calculated as the dividend per common share divided by daily average closing stock price in the relevant period. Dividend per common share is derived as follows: a) by
annualizing the dividend per common share for the quarter; and b) by annualizing the dividend per common share for the year-to-date. 6 Price-earnings ratio is calculated based on a trailing four quarters’ earnings per share (EPS). 7 Total shareholder return is calculated based on share price movement and dividends reinvested over a trailing one-year period.
HOW WE PERFORMED CORPORATE OVERVIEW The Toronto-Dominion Bank and its subsidiaries are collectively known as TD Bank Group (“TD” or the “Bank”). TD is the fifth largest bank in North America by assets and serves more than 26 million customers in three key businesses operating in a number of locations in financial centres around the globe: Canadian Retail, which includes the results of the personal and commercial banking, wealth, and insurance businesses; U.S. Retail, which includes the results of the personal and business banking operations, wealth management services, and the Bank’s investment in The Charles Schwab Corporation (“Schwab”); and Wholesale Banking. TD also ranks among the world’s leading online financial services firms, with more than 15 million active online and mobile customers. TD had $1.7 trillion in assets on July 31, 2021. The Toronto-Dominion Bank trades under the symbol “TD” on the Toronto and New York Stock Exchanges.
TD BANK GROUP • THIRD QUARTER 2021 • REPORT TO SHAREHOLDERS Page 5
ECONOMIC SUMMARY AND OUTLOOK The global economy picked up speed in the second calendar quarter of this year as restrictions on activity were lifted in several countries. Virus developments are still the main factor driving the outlook, and disparity in vaccine distribution will continue to lead to differences in economic outcomes between countries. The more contagious Delta variant is a particular challenge for emerging markets (EMs), where vaccine distribution has lagged. As a result, economic momentum within advanced economies is likely to pull further ahead of EMs in the second half of this year. However, as long as the virus is circulating globally, the persistence or threat of constrained supply chains and pressure on prices is likely to limit global economic growth. U.S. economic activity continues to improve. The economy grew by 6.5% (annualized) in the second calendar quarter and is now 0.8% larger than it was prior to the pandemic. Consumer spending led the way, up 11.8% annualized, growing at a double-digit pace for the second straight quarter. In addition to income supports provided in the American Rescue Plan, easing restrictions in high-contact service sectors such as transportation, recreation, and accommodation and food services contributed to the gain. Business investment was also robust, led by 13% growth in equipment investment and 10.7% growth in intellectual property products (including software). The only major component of private spending to pull back in the quarter was investment in structures – both residential and non-residential. However, overall economic growth did not mirror the pace of business investment and household spending, as it was offset by a significant drawdown in already-lean inventories in the face of supply constraints and a rise in imports. Supply side disruptions continue to restrain the American economic recovery. Shortages of key inputs have been particularly evident in the manufacturing sector. The combination of strong demand and production delays has led to historically low inventories relative to sales, especially in the auto industry. As supply constraints are alleviated, production growth is likely to pick up, in part to satisfy demand, but also to rebuild inventories. The labor market continues to respond to demand and support economic improvement. In July, an estimated 943,000 jobs were added to payrolls, and the unemployment rate fell to 5.4%. This marks a significant shift relative to the peak unemployment rate of 14.8% fourteen months ago. However, there is plenty of room for further improvement, with the level of employment still 5.7 million (3.7%) below its pre-crisis level. The Federal Reserve has maintained its policy interest rate at 0.00% to 0.25% and is continuing its commitment to purchase at least US$80 billion in Treasuries and US$40 billion in agency mortgage-back securities per month. However, it continues to express confidence that the economic recovery will remain above-trend through 2022. As such, TD Economics expects the Federal Reserve to signal a gradual tapering of its asset purchases later this year and to raise the federal funds rate in the fourth calendar quarter of 2022. This expectation is contingent on virus developments. The resurgence in new COVID-19 cases is unlikely to lead to broad lockdowns or stringent restrictions on business activity given the progress on vaccination. However, it will continue to create uncertainty about the outlook, which may be manifested in a variety of ways, including more cautious consumer behavior, prolonged labor shortages, and pressure on wage growth. Coupled with pre-existing supply constraints in production domestically and globally, this is likely to result in inflation remaining elevated over the remainder of this year. Canada’s economy significantly underperformed the U.S. in the second calendar quarter due to renewed restrictions across the country to curb the spread of COVID-19. Fortunately, high-frequency economic indicators point to the recovery picking up in June, as the economy re-opened and made further headway into July. While new strains of the virus are a concern, Canada’s successful vaccination campaign should help reduce the risk of a repeat in major disruptions to economic activity. Likewise, the job market is rebounding from its April and May pullback, adding an estimated total of 324,000 positions through June and July. This lowered the unemployment rate to 7.5% in July. Canadian jobs are much closer to their pre-recession level than in the U.S. – just 1.3% below as of July. The Canadian housing market continues to slow following a strong performance through the first calendar quarter of this year. Since March, Canadian home sales have dropped by 25%. Even so, the level of activity remains elevated relative to its pre-crisis level. Average home prices also dipped slightly in the second quarter. However, this is capturing a rebalancing of the market, as buyers shift away from larger single-family homes back towards lower-priced units. The housing market remains tight with a sales-to-new listings ratio still titled heavily in the favour of sellers. Moving forward, price growth is expected to be positive but more muted, allowing for some catch-up in income growth. Inflation in Canada has not been as elevated as in the United States. This partly reflects a delayed reopening of business operations. Price growth is likely to move higher in the months ahead, as Canadians participate in the economic reopening and supply chain disruptions linger. As in the U.S., much of the near-term price pressure is expected to be transitory, with inflation moving back toward 2% over the course of 2022 as supply adjusts. However, Canada is susceptible to the same risks as other advanced economies of prolonged global supply disruptions and a slower return to economic normalization. The Bank of Canada kept its overnight interest rate at 0.25% in June but further reduced the pace of its asset purchases from $3 billion to $2 billion per week. TD Economics expects the Bank of Canada to begin raising the overnight rate in the fourth calendar quarter of 2022, while the Canadian dollar is expected to remain in a range of 79-81 U.S. cents over the next two years. THE BANK’S RESPONSE TO COVID-19 While economic conditions in Canada and the U.S. are steadily improving, the COVID-19 pandemic continues to have an impact on economies around the world. Significant progress has been made on vaccination in the Bank’s North American footprint, but rates of vaccination vary considerably across regions, and as economies proceed with reopening plans, it remains uncertain how effective vaccines will be against new variants of COVID-19, some of which may be more contagious or harmful. TD remains actively engaged with governments, supervisory agencies and public health authorities in the response to COVID-19, guided by the principles of supporting the well-being of its customers and colleagues and maintaining the Bank’s operational and financial resilience.
In fiscal 2020, the Bank offered several forms of direct financial assistance to customers experiencing financial hardship due to COVID-19, including deferral of loan payments. The bulk of this assistance has now largely run its course, except for deferrals of real estate secured loans in the U.S., where the original program allowed deferrals to be extended for up to 12 months. There have been few other customer requests for extensions. As of July 31, 2021, gross loan balances that remained subject to COVID-related deferral programs were approximately $0.04 billion in Canada ($0.04 billion as at April 30, 2021), primarily reflecting Small Business Banking and Commercial Lending portfolios, and US$1.0 billion in the United States (US$1.1 billion as at April 30, 2021), primarily in the Real Estate Secured Lending portfolio. Delinquency rates for customers that have exited deferral are higher than for the broader population but remain low in absolute terms, reflecting the continuation of government support and TD’s proactive outreach to clients. The Bank continues to provide advice and assistance to customers through its usual channels, TD Helps in Canada and TD Cares in the U.S. Any financial relief offered through these channels is not included in the balances disclosed above. In addition to direct financial assistance, the Bank continues to support programs for individuals and businesses introduced by the Canadian and U.S. governments described below. Canada Emergency Business Account Program Under the Canada Emergency Business Account (CEBA) Program, with funding provided by Her Majesty in Right of Canada (the “Government of Canada”) and Export Development Canada (EDC) as the Government of Canada’s agent, the Bank provided eligible business banking customers with an interest-free, partially forgivable loan of up to $60,000 until December 31, 2022. If the loan is not repaid by December 31, 2022, it will be extended for an additional 3-year term bearing an interest rate of 5% per annum. The application window for new CEBA loans and expansion requests closed June 30, 2021. As of July 31, 2021, the Bank had
TD BANK GROUP • THIRD QUARTER 2021 • REPORT TO SHAREHOLDERS Page 6
provided approximately 211,000 customers (April 30, 2021 – 206,000) with CEBA loans and had funded approximately $11.5 billion (April 30, 2021 – $11.0 billion) in loans under the program. U.S. Coronavirus Aid, Relief, and Economic Security Act, Paycheck Protection Program Under the Paycheck Protection Program (PPP) implemented by the Small Business Administration (SBA), the Bank provides loans to small businesses to assist them in retaining workers, maintaining payroll, and covering other expenses. PPP loans have a 2-year or 5-year term, bear an interest rate of 1% per annum, and are 100% guaranteed by the SBA. The full principal amount of the loan and any accrued interest are eligible for forgiveness if the loan is used for qualifying expenses. The Bank will be paid by the SBA for any portion of the loan that is forgiven. As of July 31, 2021, the Bank had approximately 72,500 PPP loans outstanding (April 30, 2021 – 98,000) with a gross carrying amount of approximately US$6.3 billion (April 30, 2021 – US$9.8 billion). During the three months ended July 31, 2021, approximately 2,000 new PPP loans (US$0.2 billion) were originated (three months ended April 30, 2021 – 45,000 new PPP loans, US$3.4 billion) and approximately 27,500 PPP loans (US$3.7 billion) were forgiven (three months ended April 30, 2021 – 26,000 PPP loans, US$1.1 billion). PPP ended on May 31, 2021. Other Programs The Bank continues to work with federal Crown Corporations, including EDC and the Business Development Bank of Canada (BDC) to deliver various other guarantee and co-lending programs for the Bank’s clients. This includes the Highly Affected Sectors Credit Availability Program (HASCAP) Guarantee to provide support to Canadian businesses that have been highly affected by and are facing economic hardship as a result of the COVID-19 pandemic which launched in the second fiscal quarter. In addition, TD is working with Canada’s federal government to facilitate access to the Canada Recovery Benefit and Canada Emergency Wage Subsidy through Canada Revenue Agency direct deposit. HOW THE BANK REPORTS The Bank prepares its Interim Consolidated Financial Statements in accordance with IFRS and refers to results prepared in accordance with IFRS as “reported” results. The Bank also utilizes non-GAAP financial measures referred to as “adjusted” results to assess each of its businesses and to measure the Bank’s overall performance. The Bank believes that adjusted results provide the reader with a better understanding of how management views the Bank’s performance. To arrive at adjusted results, the Bank removes “items of note”, from reported results. The items of note relate to items which management does not believe are indicative of underlying business performance. The items of note are disclosed in Table 3. As explained, adjusted results differ from reported results determined in accordance with IFRS. Adjusted results, items of note, and related terms used in this document are not defined terms under IFRS and, therefore, may not be comparable to similar terms used by other issuers. The Bank’s U.S. strategic cards portfolio comprises agreements with certain U.S. retailers pursuant to which TD is the U.S. issuer of private label and co-branded consumer credit cards to the retailers’ U.S. customers. Under the terms of the individual agreements, the Bank and the retailers share in the profits generated by the relevant portfolios after the provision for credit losses (PCL). Under IFRS, TD is required to present the gross amount of revenue and PCL related to these portfolios in the Bank’s Interim Consolidated Statement of Income. The Corporate segment reflects the retailer program partners’ share of revenues and PCL, with an offsetting amount reflecting the partners’ net share recorded in Non-interest expenses. This results in no impact to the Corporate segment reported net income (loss). The U.S. Retail segment reflects only the portion of revenue and PCL attributable to TD under the agreements in its reported net income. On October 6, 2020, the Bank acquired an approximately 13.5% stake in Schwab following the completion of Schwab’s acquisition of TD Ameritrade (“Schwab transaction”). The Bank accounts for its investment in Schwab using the equity method and reports its after-tax share of Schwab’s earnings with a one-month lag. The U.S. Retail segment reflects the Bank’s share of net income from its investment in Schwab. The Corporate segment net income (loss) includes amounts for amortization of acquired intangibles and the acquisition and integration charges related to the Schwab transaction. SIGNIFICANT ACQUISITIONS
The Bank completed two acquisitions during the third quarter of fiscal 2021:
Acquisition of Wells Fargo & Company’s Canadian Direct Equipment Finance Business On May 1, 2021, the Bank acquired the Canadian Direct Equipment Finance business of Wells Fargo & Company. The results of the acquired business have been consolidated from the acquisition date and included in the Canadian Retail segment.
Acquisition of Headlands Tech Global Markets, LLC On July 1, 2021, the Bank acquired Headlands Tech Global Markets, LLC, a Chicago based quantitative fixed income trading company. The results of the acquired business have been consolidated from the acquisition date and included in the Wholesale segment.
These acquisitions were accounted for as business combinations under the purchase method. The excess of accounting consideration over the fair value of tangible net assets acquired is allocated to other intangibles and goodwill. The purchase price allocation is subject to refinement during the measurement period and may be adjusted to reflect new information about facts and circumstances that existed at the acquisition date.
TD BANK GROUP • THIRD QUARTER 2021 • REPORT TO SHAREHOLDERS Page 7
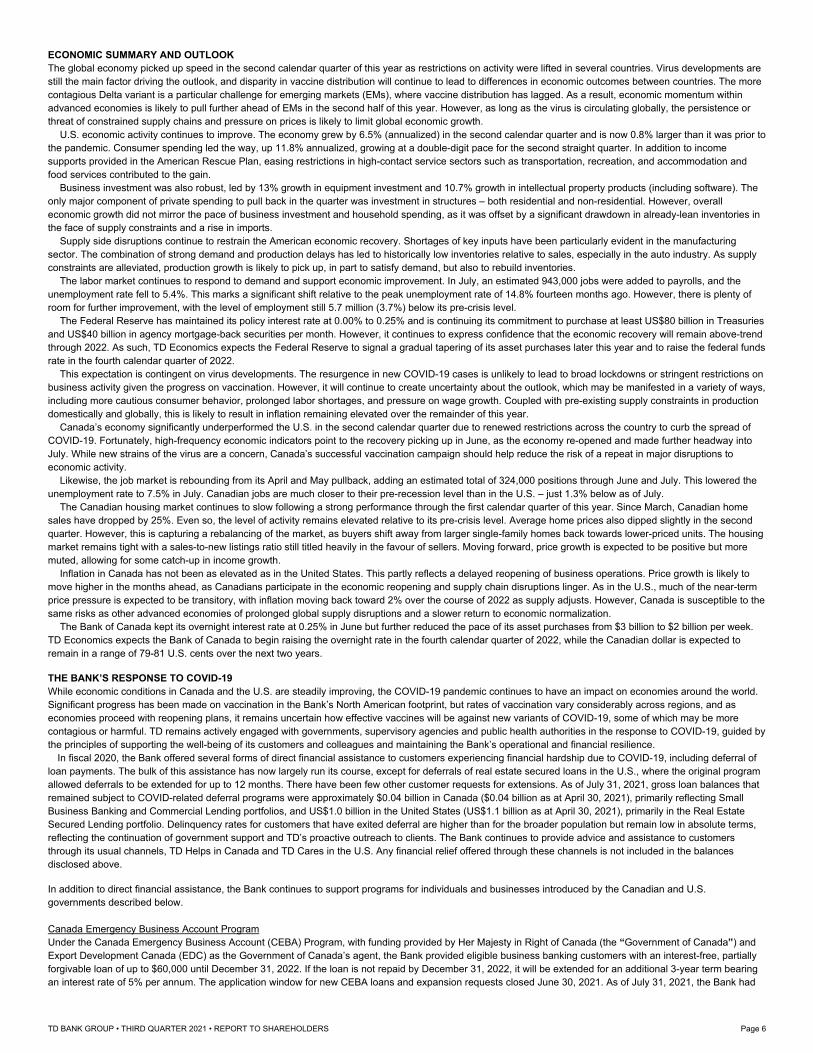
The following table provides the operating results on a reported basis for the Bank.
TABLE 2: OPERATING RESULTS – Reported1 (millions of Canadian dollars) For the three months ended For the nine months ended
July 31 April 30 July 31 July 31 July 31 2021 2021 2020 2021 2020 Net interest income $ 6,004 $ 5,835 $ 6,101 $ 17,869 $ 18,470 Non-interest income 4,708 4,393 4,564 13,883 13,332 Total revenue 10,712 10,228 10,665 31,752 31,802 Provision for (recovery of) credit losses (37) (377) 2,188 (101) 6,325 Insurance claims and related expenses 836 441 805 2,057 2,256 Non-interest expenses 5,616 5,729 5,307 17,129 15,895 Income before income taxes and share of net income from
investment in Schwab and TD Ameritrade 4,297 4,435 2,365 12,667 7,326 Provision for (recovery of) income taxes 922 962 445 2,711 1,354 Share of net income from investment in Schwab and TD Ameritrade 170 222 328 561 780 Net income – reported 3,545 3,695 2,248 10,517 6,752 Preferred dividends and distributions on other equity instruments 56 65 68 186 203 Net income available to common shareholders $ 3,489 $ 3,630 $ 2,180 $ 10,331 $ 6,549
1 Certain comparative amounts have been reclassified to conform with the presentation adopted in the current period.
The following table provides a reconciliation between the Bank’s adjusted and reported results.
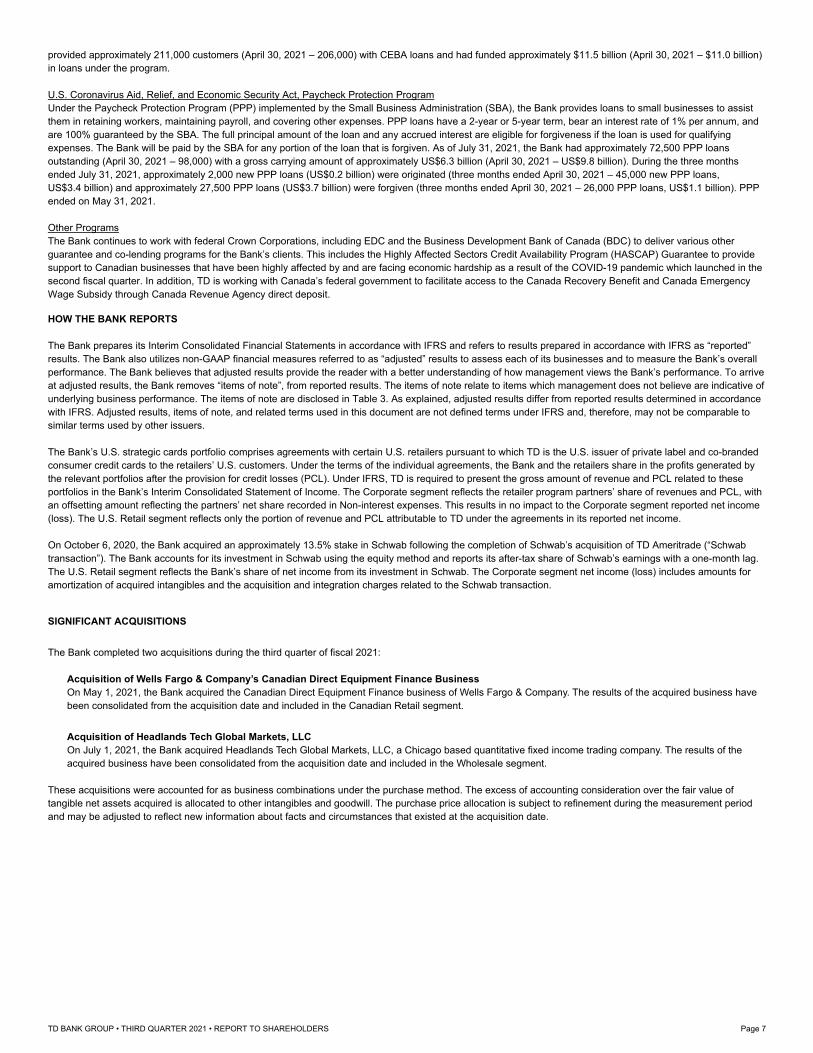
TABLE 3: NON-GAAP FINANCIAL MEASURES – Reconciliation of Adjusted to Reported Net Income1 (millions of Canadian dollars) For the three months ended For the nine months ended
July 31 April 30 July 31 July 31 July 31 2021 2021 2020 2021 2020 Operating results – adjusted Net interest income $ 6,004 $ 5,835 $ 6,101 $ 17,869 $ 18,470 Non-interest income 4,708 4,393 4,564 13,883 13,332 Total revenue 10,712 10,228 10,665 31,752 31,802 Provision for (recovery of) credit losses (37) (377) 2,188 (101) 6,325 Insurance claims and related expenses 836 441 805 2,057 2,256 Non-interest expenses2 5,576 5,691 5,244 17,011 15,692 Income before income taxes and share of net income from
investment in Schwab and TD Ameritrade 4,337 4,473 2,428 12,785 7,529 Provision for income taxes 931 970 454 2,737 1,384 Share of net income from investment in Schwab and TD Ameritrade3 222 272 353 735 853 Net income – adjusted 3,628 3,775 2,327 10,783 6,998 Preferred dividends and distributions on other equity instruments 56 65 68 186 203 Net income available to common shareholders – adjusted 3,572 3,710 2,259 10,597 6,795 Pre-tax adjustments for items of note Amortization of acquired intangibles4 (68) (69) (63) (211) (201) Acquisition and integration charges related to the Schwab transaction5 (24) (19) – (81) – Charges associated with the acquisition of Greystone2 – – (25) – (75) Less: Impact of income taxes Amortization of acquired intangibles (7) (7) (9) (23) (29) Acquisition and integration charges related to the Schwab transaction5 (2) (1) – (3) – Charges associated with the acquisition of Greystone – – – – (1) Total adjustments for items of note (83) (80) (79) (266) (246) Net income available to common shareholders – reported $ 3,489 $ 3,630 $ 2,180 $ 10,331 $ 6,549
1 Certain comparative amounts have been reclassified to conform with the presentation adopted in the current period.
2 Adjusted non-interest expenses exclude the following items of note related to the Bank’s own asset acquisitions and business combinations: i.Amortization of acquired intangibles – Q3 2021: $34 million, Q2 2021: $35 million, Q1 2021: $39 million, Q3 2020: $38 million, Q2 2020: $44 million, Q1 2020: $46 million. These charges are reported in the Corporate segment.
ii.The Bank’s own integration costs related to the Schwab transaction – Q3 2021: $6 million, Q2 2021: $3 million, Q1 2021: $1 million. These costs are reported in the Corporate segment.
iii.Charges associated with the acquisition of Greystone – Q3 2020: $25 million, Q2 2020: $26 million, Q1 2020: $24 million. These charges were reported in the Canadian Retail segment.
3 Adjusted share of net income from investment in Schwab and TD Ameritrade excludes the following items of note on an after-tax basis. The earnings impact of both items is reported in
the Corporate segment: i.Amortization of Schwab and TD Ameritrade-related acquired intangibles – Q3 2021: $34 million, Q2 2021: $34 million, Q1 2021: $35 million, Q3 2020: $25 million, Q2 2020: $24 million, Q1 2020: $24 million; and
ii.The Bank’s share of acquisition and integration charges associated with Schwab’s acquisition of TD Ameritrade – Q3 2021: $18 million, Q2 2021: $16 million, Q1 2021: $37 million. 4 Amortization of acquired intangibles relates to intangibles acquired as a result of asset acquisitions and business combinations, including the after-tax amounts for amortization of
acquired intangibles relating to the Share of net income from investment in Schwab and TD Ameritrade, both reported in the Corporate segment. Refer to footnotes 2 and 3 for amounts.
5 Acquisition and integration charges related to the Schwab transaction include the Bank’s own integration costs, as well as the Bank’s share of acquisition and integration charges associated with Schwab’s acquisition of TD Ameritrade on an after-tax basis, both reported in the Corporate segment. Refer to footnotes 2 and 3 for amounts.
TD BANK GROUP • THIRD QUARTER 2021 • REPORT TO SHAREHOLDERS Page 8
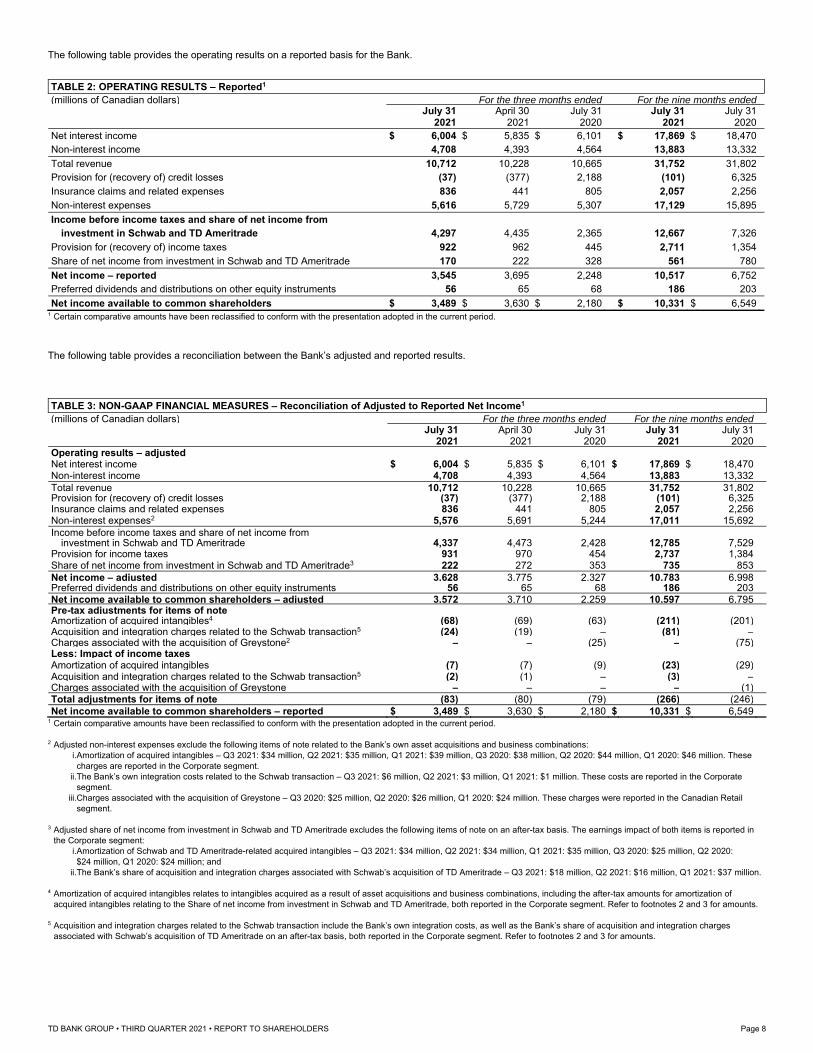
TABLE 4: RECONCILIATION OF REPORTED TO ADJUSTED EARNINGS PER SHARE1 (Canadian dollars) For the three months ended For the nine months ended
July 31 April 30 July 31 July 31 July 31 2021 2021 2020 2021 2020 Basic earnings per share – reported $ 1.92 $ 2.00 $ 1.21 $ 5.69 $ 3.63 Adjustments for items of note2 0.04 0.04 0.04 0.14 0.13 Basic earnings per share – adjusted $ 1.96 $ 2.04 $ 1.25 $ 5.83 $ 3.76
Diluted earnings per share – reported $ 1.92 $ 1.99 $ 1.21 $ 5.68 $ 3.62 Adjustments for items of note2 0.04 0.04 0.04 0.14 0.14 Diluted earnings per share – adjusted $ 1.96 $ 2.04 $ 1.25 $ 5.83 $ 3.76
1 EPS is computed by dividing net income available to common shareholders by the weighted-average number of shares outstanding during the period. Numbers may not add due to rounding.
2 For explanations of items of note, refer to the “Non-GAAP Financial Measures – Reconciliation of Adjusted to Reported Net Income” table in the “How We Performed” section of this document.
TABLE 5: AMORTIZATION OF INTANGIBLES, NET OF INCOME TAXES1 (millions of Canadian dollars) For the three months ended For the nine months ended
July 31 April 30 July 31 July 31 July 31 2021 2021 2020 2021 2020 TD Bank, National Association (TD Bank, N.A.) $ 5 $ 8 $ 10 $ 22 $ 41 Schwab and TD Ameritrade2 34 34 25 103 73 MBNA Canada 7 6 6 20 20 Aeroplan 6 7 4 19 13 Other 9 7 9 24 25
61 62 54 188 172 Software and asset servicing rights 109 107 133 326 382 Amortization of intangibles, net of income taxes $ 170 $ 169 $ 187 $ 514 $ 554
1 Amortization of intangibles, with the exception of software and asset servicing rights, is included as items of note. For explanations of items of note, refer to the “Non-GAAP Financial Measures – Reconciliation of Adjusted to Reported Net Income” table in the “How We Performed” section of this document.
2 Included in Share of net income from investment in Schwab and TD Ameritrade. Return on Common Equity The consolidated Bank ROE is calculated as reported net income available to common shareholders as a percentage of average common equity. The consolidated Bank adjusted ROE is calculated as adjusted net income available to common shareholders as a percentage of average common equity. Adjusted ROE is a non-GAAP financial measure as it is not a defined term under IFRS. Readers are cautioned that earnings and other measures adjusted to a basis other than IFRS do not have standardized meanings under IFRS and, therefore, may not be comparable to similar terms used by other issuers.
The Bank’s methodology for allocating capital to its business segments is largely aligned with the common equity capital requirements under Basel III. Capital allocated to the business segments is based on 9% Common Equity Tier 1 (CET1) Capital in fiscal 2021. Capital allocated to the business segments was decreased to 9% CET1 Capital effective the second quarter of 2020 compared with 10.5% in the first quarter of 2020.
TABLE 6: RETURN ON COMMON EQUITY (millions of Canadian dollars, except as noted) For the three months ended For the nine months ended
July 31 April 30 July 31 July 31 July 31 2021 2021 2020 2021 2020 Average common equity $ 90,626 $ 89,069 $ 86,794 $ 89,627 $ 84,677 Net income available to common shareholders – reported 3,489 3,630 2,180 10,331 6,549 Items of note, net of income taxes1 83 80 79 266 246 Net income available to common shareholders – adjusted $ 3,572 $ 3,710 $ 2,259 $ 10,597 $ 6,795 Return on common equity – reported 15.3 % 16.7 % 10.0 % 15.4 % 10.3 % Return on common equity – adjusted 15.6 17.1 10.4 15.8 10.7
1 For explanations of items of note, refer to the “Non-GAAP Financial Measures – Reconciliation of Adjusted to Reported Net Income” table in the “How We Performed” section of this document.
Return on Tangible Common Equity Tangible common equity (TCE) is calculated as common shareholders’ equity less goodwill, imputed goodwill and intangibles on the investments in Schwab and TD Ameritrade and other acquired intangible assets, net of related deferred tax liabilities. ROTCE is calculated as reported net income available to common shareholders after adjusting for the after-tax amortization of acquired intangibles, which are treated as an item of note, as a percentage of average TCE. Adjusted ROTCE is calculated using reported net income available to common shareholders, adjusted for all items of note, as a percentage of average TCE. Adjusted ROTCE provides a useful measure of the performance of the Bank’s income producing assets, independent of whether they were acquired or developed internally. TCE, ROTCE, and adjusted ROTCE are each non-GAAP financial measures and are not defined terms under IFRS. Readers are cautioned that earnings and other measures adjusted to a basis other than IFRS do not have standardized meanings under IFRS and, therefore, may not be comparable to similar terms used by other issuers.
TD BANK GROUP • THIRD QUARTER 2021 • REPORT TO SHAREHOLDERS Page 9
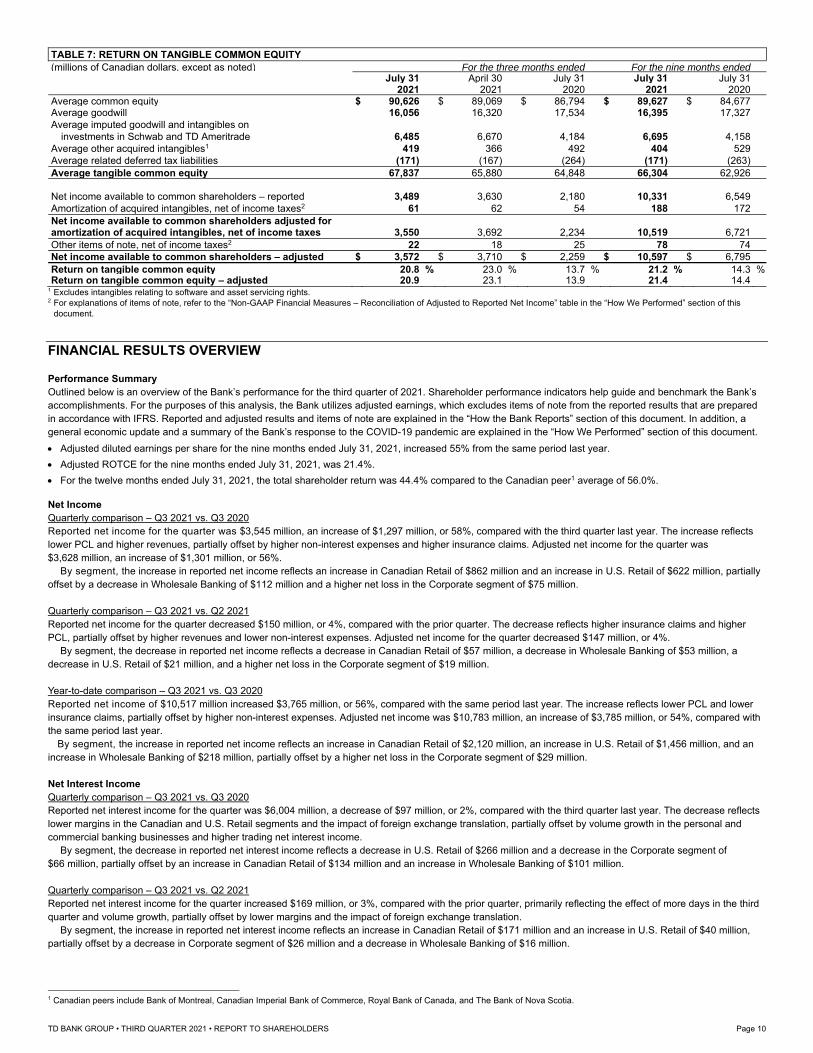
TABLE 7: RETURN ON TANGIBLE COMMON EQUITY (millions of Canadian dollars, except as noted) For the three months ended For the nine months ended
July 31 April 30 July 31 July 31 July 31 2021 2021 2020 2021 2020 Average common equity $ 90,626 $ 89,069 $ 86,794 $ 89,627 $ 84,677 Average goodwill 16,056 16,320 17,534 16,395 17,327 Average imputed goodwill and intangibles on
investments in Schwab and TD Ameritrade 6,485 6,670 4,184 6,695 4,158 Average other acquired intangibles1 419 366 492 404 529 Average related deferred tax liabilities (171) (167) (264) (171) (263) Average tangible common equity 67,837 65,880 64,848 66,304 62,926
Net income available to common shareholders – reported 3,489 3,630 2,180 10,331 6,549 Amortization of acquired intangibles, net of income taxes2 61 62 54 188 172 Net income available to common shareholders adjusted for amortization of acquired intangibles, net of income taxes 3,550 3,692 2,234 10,519 6,721 Other items of note, net of income taxes2 22 18 25 78 74 Net income available to common shareholders – adjusted $ 3,572 $ 3,710 $ 2,259 $ 10,597 $ 6,795 Return on tangible common equity 20.8 % 23.0 % 13.7 % 21.2 % 14.3 % Return on tangible common equity – adjusted 20.9 23.1 13.9 21.4 14.4
1 Excludes intangibles relating to software and asset servicing rights. 2 For explanations of items of note, refer to the “Non-GAAP Financial Measures – Reconciliation of Adjusted to Reported Net Income” table in the “How We Performed” section of this
document.
FINANCIAL RESULTS OVERVIEW Performance Summary Outlined below is an overview of the Bank’s performance for the third quarter of 2021. Shareholder performance indicators help guide and benchmark the Bank’s accomplishments. For the purposes of this analysis, the Bank utilizes adjusted earnings, which excludes items of note from the reported results that are prepared in accordance with IFRS. Reported and adjusted results and items of note are explained in the “How the Bank Reports” section of this document. In addition, a general economic update and a summary of the Bank’s response to the COVID-19 pandemic are explained in the “How We Performed” section of this document.
Adjusted diluted earnings per share for the nine months ended July 31, 2021, increased 55% from the same period last year.
Adjusted ROTCE for the nine months ended July 31, 2021, was 21.4%.
For the twelve months ended July 31, 2021, the total shareholder return was 44.4% compared to the Canadian peer1 average of 56.0%. Net Income Quarterly comparison – Q3 2021 vs. Q3 2020 Reported net income for the quarter was $3,545 million, an increase of $1,297 million, or 58%, compared with the third quarter last year. The increase reflects lower PCL and higher revenues, partially offset by higher non-interest expenses and higher insurance claims. Adjusted net income for the quarter was $3,628 million, an increase of $1,301 million, or 56%.
By segment, the increase in reported net income reflects an increase in Canadian Retail of $862 million and an increase in U.S. Retail of $622 million, partially offset by a decrease in Wholesale Banking of $112 million and a higher net loss in the Corporate segment of $75 million. Quarterly comparison – Q3 2021 vs. Q2 2021 Reported net income for the quarter decreased $150 million, or 4%, compared with the prior quarter. The decrease reflects higher insurance claims and higher PCL, partially offset by higher revenues and lower non-interest expenses. Adjusted net income for the quarter decreased $147 million, or 4%.
By segment, the decrease in reported net income reflects a decrease in Canadian Retail of $57 million, a decrease in Wholesale Banking of $53 million, a decrease in U.S. Retail of $21 million, and a higher net loss in the Corporate segment of $19 million. Year-to-date comparison – Q3 2021 vs. Q3 2020 Reported net income of $10,517 million increased $3,765 million, or 56%, compared with the same period last year. The increase reflects lower PCL and lower insurance claims, partially offset by higher non-interest expenses. Adjusted net income was $10,783 million, an increase of $3,785 million, or 54%, compared with the same period last year.
By segment, the increase in reported net income reflects an increase in Canadian Retail of $2,120 million, an increase in U.S. Retail of $1,456 million, and an increase in Wholesale Banking of $218 million, partially offset by a higher net loss in the Corporate segment of $29 million. Net Interest Income Quarterly comparison – Q3 2021 vs. Q3 2020 Reported net interest income for the quarter was $6,004 million, a decrease of $97 million, or 2%, compared with the third quarter last year. The decrease reflects lower margins in the Canadian and U.S. Retail segments and the impact of foreign exchange translation, partially offset by volume growth in the personal and commercial banking businesses and higher trading net interest income.
By segment, the decrease in reported net interest income reflects a decrease in U.S. Retail of $266 million and a decrease in the Corporate segment of $66 million, partially offset by an increase in Canadian Retail of $134 million and an increase in Wholesale Banking of $101 million.
Quarterly comparison – Q3 2021 vs. Q2 2021 Reported net interest income for the quarter increased $169 million, or 3%, compared with the prior quarter, primarily reflecting the effect of more days in the third quarter and volume growth, partially offset by lower margins and the impact of foreign exchange translation.
By segment, the increase in reported net interest income reflects an increase in Canadian Retail of $171 million and an increase in U.S. Retail of $40 million, partially offset by a decrease in Corporate segment of $26 million and a decrease in Wholesale Banking of $16 million.
1 Canadian peers include Bank of Montreal, Canadian Imperial Bank of Commerce, Royal Bank of Canada, and The Bank of Nova Scotia.
TD BANK GROUP • THIRD QUARTER 2021 • REPORT TO SHAREHOLDERS Page 10
Year-to-date comparison – Q3 2021 vs. Q3 2020 Reported net interest income was $17,869 million, a decrease of $601 million, or 3%, compared with the same period last year. The decrease reflects lower margins in the Canadian and U.S. Retail segments and the impact of foreign exchange translation, partially offset by volume growth in the personal and commercial banking businesses and higher trading net interest income.
By segment, the decrease in reported net interest income reflects a decrease in U.S. Retail of $792 million, a decrease in Canadian Retail of $184 million, and a decrease in the Corporate segment of $185 million, partially offset by an increase in Wholesale Banking of $560 million. Non-Interest Income Quarterly comparison – Q3 2021 vs. Q3 2020 Reported non-interest income for the quarter was $4,708 million, an increase of $144 million, or 3%, compared with the third quarter last year. The increase reflects higher fee-based revenue in the banking and wealth businesses, higher insurance volumes, and higher other revenue and advisory fees in Wholesale Banking, partially offset by lower wholesale trading revenue.
By segment, the increase in reported non-interest income reflects an increase in Canadian Retail of $419 million, an increase in U.S. Retail of $96 million, and an increase in the Corporate segment of $44 million, partially offset by a decrease in Wholesale Banking of $415 million.
Quarterly comparison – Q3 2021 vs. Q2 2021 Reported non-interest income for the quarter increased $315 million, or 7%, compared with the prior quarter. The increase primarily reflects prior quarter premium rebates for customers in the insurance business, and higher fee-based revenue in the banking and wealth businesses, partially offset by lower wholesale trading revenue.
By segment, the increase in reported non-interest income reflects an increase in Canadian Retail of $346 million and an increase in U.S Retail of $28 million, partially offset by a decrease in Wholesale Banking of $58 million, and a decrease in the Corporate segment of $1 million.
Year-to-date comparison – Q3 2021 vs. Q3 2020 Reported non-interest income was $13,883 million, an increase of $551 million, or 4%, compared with the same period last year. The increase reflects higher transaction-based revenue in the wealth business, higher fee-based revenue in the wealth and banking businesses, higher underwriting and advisory fees, higher valuation of certain investments in the U.S. Retail segment, and higher revenue from treasury and balance sheet management activities. These were partially offset by lower wholesale trading revenue, premium rebates for customers in the insurance business, and a decrease in the fair value of investments supporting claims liabilities which resulted in a similar decrease in insurance claims.
By segment, the increase in reported non-interest income reflects an increase in Canadian Retail of $866 million, an increase in U.S. Retail of $215 million, and an increase in the Corporate segment of $184 million, partially offset by a decrease in Wholesale Banking of $714 million. Provision for Credit Losses Quarterly comparison – Q3 2021 vs. Q3 2020 PCL for the quarter was a recovery of $37 million, lower by $2,225 million compared with the third quarter last year. PCL – impaired was $242 million, a decrease of $589 million, primarily reflecting the continued impact of government economic support programs in the consumer lending portfolios and prior year credit migration in the commercial and Wholesale lending portfolios. PCL – performing was a recovery of $279 million, lower by $1,636 million, reflecting a performing allowance increase in the prior year and allowance release this quarter, largely related to improved credit conditions. Total PCL for the quarter as an annualized percentage of credit volume was -0.02%.
By segment, PCL was lower by $993 million in U.S. Retail, by $851 million in Canadian Retail, by $260 million in the Corporate segment, and by $121 million in Wholesale Banking. Quarterly comparison – Q3 2021 vs. Q2 2021 PCL was a recovery of $37 million, compared with a recovery of $377 million in the prior quarter. PCL – impaired decreased by $139 million, primarily reflected in the consumer and commercial lending portfolios. PCL – performing was a recovery of $279 million, compared with a recovery of $758 million in the prior quarter, reflecting a continued improvement in credit conditions. Total PCL for the quarter as an annualized percentage of credit volume was -0.02%.
By segment, PCL was higher by $137 million in Canadian Retail, by $117 million in U.S. Retail, by $65 million in Wholesale Banking, and by $21 million in the Corporate segment.
Year-to-date comparison – Q3 2021 vs. Q3 2020 PCL was a recovery of $101 million, lower by $6,426 million compared with the same period last year. PCL – impaired was $1,089 million, a decrease of $1,515 million, primarily reflecting the continued impact of government economic support programs in the consumer lending portfolios and prior year credit migration in the Wholesale lending portfolio. PCL – performing was a recovery of $1,190 million, lower by $4,911 million, reflecting a performing allowance increase in the prior year, and allowance release this year, largely related to an improvement in the economic outlook. Total PCL as an annualized percentage of credit volume was -0.02%.
By segment, PCL was lower by $2,527 million in U.S. Retail, by $2,290 million in Canadian Retail, by $1,054 million in the Corporate segment, and by $555 million in Wholesale Banking.
TD BANK GROUP • THIRD QUARTER 2021 • REPORT TO SHAREHOLDERS Page 11
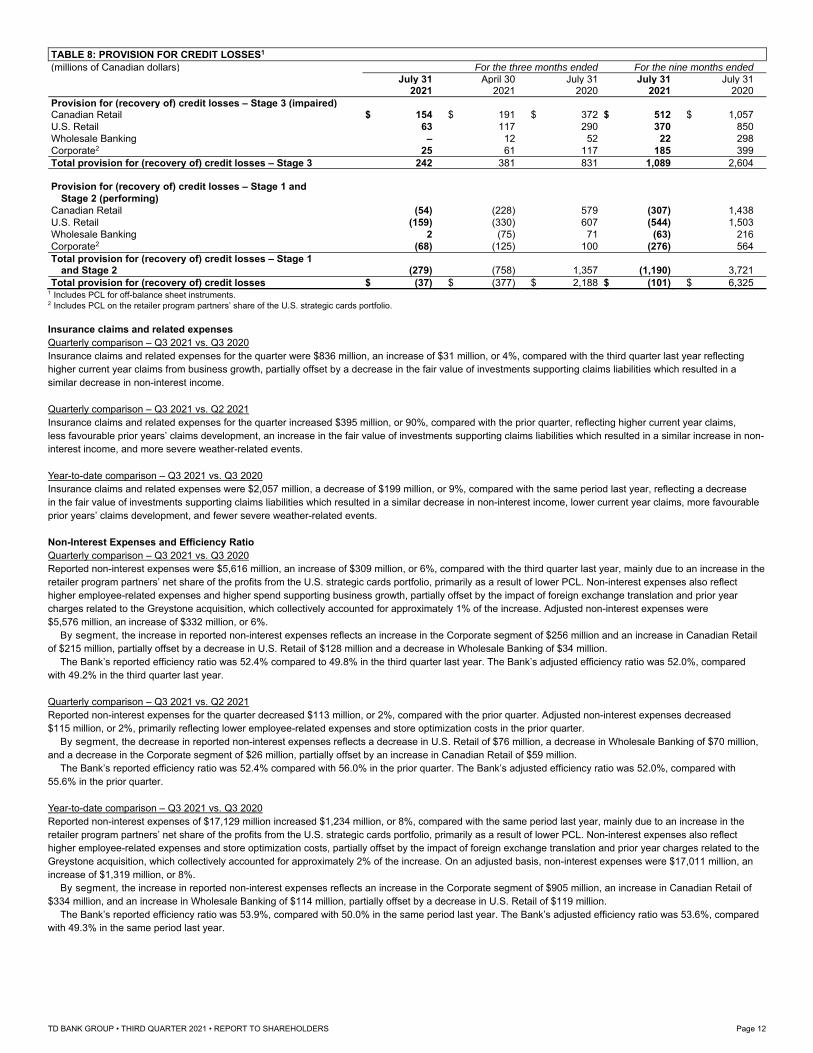
TABLE 8: PROVISION FOR CREDIT LOSSES1 (millions of Canadian dollars) For the three months ended For the nine months ended
July 31 April 30 July 31 July 31 July 31 2021 2021 2020 2021 2020 Provision for (recovery of) credit losses – Stage 3 (impaired) Canadian Retail $ 154 $ 191 $ 372 $ 512 $ 1,057 U.S. Retail 63 117 290 370 850 Wholesale Banking – 12 52 22 298 Corporate2 25 61 117 185 399 Total provision for (recovery of) credit losses – Stage 3 242 381 831 1,089 2,604
Provision for (recovery of) credit losses – Stage 1 and
Stage 2 (performing) Canadian Retail (54) (228) 579 (307) 1,438 U.S. Retail (159) (330) 607 (544) 1,503 Wholesale Banking 2 (75) 71 (63) 216 Corporate2 (68) (125) 100 (276) 564 Total provision for (recovery of) credit losses – Stage 1
and Stage 2 (279) (758) 1,357 (1,190) 3,721 Total provision for (recovery of) credit losses $ (37) $ (377) $ 2,188 $ (101) $ 6,325
1 Includes PCL for off-balance sheet instruments. 2 Includes PCL on the retailer program partners’ share of the U.S. strategic cards portfolio. Insurance claims and related expenses Quarterly comparison – Q3 2021 vs. Q3 2020 Insurance claims and related expenses for the quarter were $836 million, an increase of $31 million, or 4%, compared with the third quarter last year reflecting higher current year claims from business growth, partially offset by a decrease in the fair value of investments supporting claims liabilities which resulted in a similar decrease in non-interest income. Quarterly comparison – Q3 2021 vs. Q2 2021 Insurance claims and related expenses for the quarter increased $395 million, or 90%, compared with the prior quarter, reflecting higher current year claims, less favourable prior years’ claims development, an increase in the fair value of investments supporting claims liabilities which resulted in a similar increase in non-interest income, and more severe weather-related events.
Year-to-date comparison – Q3 2021 vs. Q3 2020 Insurance claims and related expenses were $2,057 million, a decrease of $199 million, or 9%, compared with the same period last year, reflecting a decrease in the fair value of investments supporting claims liabilities which resulted in a similar decrease in non-interest income, lower current year claims, more favourable prior years’ claims development, and fewer severe weather-related events.
Non-Interest Expenses and Efficiency Ratio Quarterly comparison – Q3 2021 vs. Q3 2020 Reported non-interest expenses were $5,616 million, an increase of $309 million, or 6%, compared with the third quarter last year, mainly due to an increase in the retailer program partners’ net share of the profits from the U.S. strategic cards portfolio, primarily as a result of lower PCL. Non-interest expenses also reflect higher employee-related expenses and higher spend supporting business growth, partially offset by the impact of foreign exchange translation and prior year charges related to the Greystone acquisition, which collectively accounted for approximately 1% of the increase. Adjusted non-interest expenses were $5,576 million, an increase of $332 million, or 6%.
By segment, the increase in reported non-interest expenses reflects an increase in the Corporate segment of $256 million and an increase in Canadian Retail of $215 million, partially offset by a decrease in U.S. Retail of $128 million and a decrease in Wholesale Banking of $34 million.
The Bank’s reported efficiency ratio was 52.4% compared to 49.8% in the third quarter last year. The Bank’s adjusted efficiency ratio was 52.0%, compared with 49.2% in the third quarter last year. Quarterly comparison – Q3 2021 vs. Q2 2021 Reported non-interest expenses for the quarter decreased $113 million, or 2%, compared with the prior quarter. Adjusted non-interest expenses decreased $115 million, or 2%, primarily reflecting lower employee-related expenses and store optimization costs in the prior quarter.
By segment, the decrease in reported non-interest expenses reflects a decrease in U.S. Retail of $76 million, a decrease in Wholesale Banking of $70 million, and a decrease in the Corporate segment of $26 million, partially offset by an increase in Canadian Retail of $59 million.
The Bank’s reported efficiency ratio was 52.4% compared with 56.0% in the prior quarter. The Bank’s adjusted efficiency ratio was 52.0%, compared with 55.6% in the prior quarter.
Year-to-date comparison – Q3 2021 vs. Q3 2020 Reported non-interest expenses of $17,129 million increased $1,234 million, or 8%, compared with the same period last year, mainly due to an increase in the retailer program partners’ net share of the profits from the U.S. strategic cards portfolio, primarily as a result of lower PCL. Non-interest expenses also reflect higher employee-related expenses and store optimization costs, partially offset by the impact of foreign exchange translation and prior year charges related to the Greystone acquisition, which collectively accounted for approximately 2% of the increase. On an adjusted basis, non-interest expenses were $17,011 million, an increase of $1,319 million, or 8%.
By segment, the increase in reported non-interest expenses reflects an increase in the Corporate segment of $905 million, an increase in Canadian Retail of $334 million, and an increase in Wholesale Banking of $114 million, partially offset by a decrease in U.S. Retail of $119 million.
The Bank’s reported efficiency ratio was 53.9%, compared with 50.0% in the same period last year. The Bank’s adjusted efficiency ratio was 53.6%, compared with 49.3% in the same period last year.
TD BANK GROUP • THIRD QUARTER 2021 • REPORT TO SHAREHOLDERS Page 12
Income Taxes As discussed in the “How the Bank Reports” section of this document, the Bank adjusts its reported results to assess each of its businesses and to measure overall Bank performance. As such, the provision for income taxes is stated on a reported and an adjusted basis.
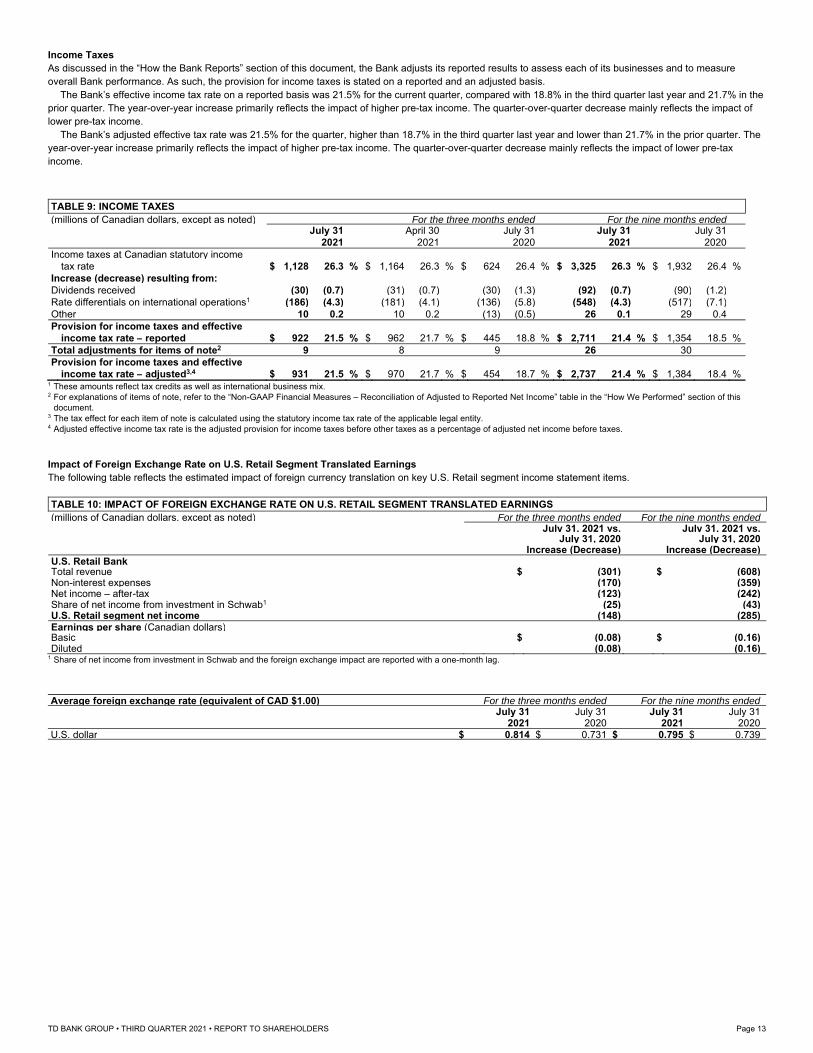
The Bank’s effective income tax rate on a reported basis was 21.5% for the current quarter, compared with 18.8% in the third quarter last year and 21.7% in the prior quarter. The year-over-year increase primarily reflects the impact of higher pre-tax income. The quarter-over-quarter decrease mainly reflects the impact of lower pre-tax income.
The Bank’s adjusted effective tax rate was 21.5% for the quarter, higher than 18.7% in the third quarter last year and lower than 21.7% in the prior quarter. The year-over-year increase primarily reflects the impact of higher pre-tax income. The quarter-over-quarter decrease mainly reflects the impact of lower pre-tax income.
TABLE 9: INCOME TAXES (millions of Canadian dollars, except as noted) For the three months ended For the nine months ended
July 31 April 30 July 31 July 31 July 31 2021 2021 2020 2021 2020 Income taxes at Canadian statutory income
tax rate $ 1,128 26.3 % $ 1,164 26.3 % $ 624 26.4 % $ 3,325 26.3 % $ 1,932 26.4 % Increase (decrease) resulting from: Dividends received (30) (0.7) (31) (0.7) (30) (1.3) (92) (0.7) (90) (1.2) Rate differentials on international operations1 (186) (4.3) (181) (4.1) (136) (5.8) (548) (4.3) (517) (7.1) Other 10 0.2 10 0.2 (13) (0.5) 26 0.1 29 0.4 Provision for income taxes and effective
income tax rate – reported $ 922 21.5 % $ 962 21.7 % $ 445 18.8 % $ 2,711 21.4 % $ 1,354 18.5 % Total adjustments for items of note2 9 8 9 26 30 Provision for income taxes and effective
income tax rate – adjusted3,4 $ 931 21.5 % $ 970 21.7 % $ 454 18.7 % $ 2,737 21.4 % $ 1,384 18.4 % 1 These amounts reflect tax credits as well as international business mix. 2 For explanations of items of note, refer to the “Non-GAAP Financial Measures – Reconciliation of Adjusted to Reported Net Income” table in the “How We Performed” section of this
document. 3 The tax effect for each item of note is calculated using the statutory income tax rate of the applicable legal entity. 4 Adjusted effective income tax rate is the adjusted provision for income taxes before other taxes as a percentage of adjusted net income before taxes. Impact of Foreign Exchange Rate on U.S. Retail Segment Translated Earnings The following table reflects the estimated impact of foreign currency translation on key U.S. Retail segment income statement items. TABLE 10: IMPACT OF FOREIGN EXCHANGE RATE ON U.S. RETAIL SEGMENT TRANSLATED EARNINGS (millions of Canadian dollars, except as noted) For the three months ended For the nine months ended
July 31, 2021 vs. July 31, 2021 vs. July 31, 2020 July 31, 2020 Increase (Decrease) Increase (Decrease) U.S. Retail Bank Total revenue $ (301) $ (608) Non-interest expenses (170) (359) Net income – after-tax (123) (242) Share of net income from investment in Schwab1 (25) (43) U.S. Retail segment net income (148) (285) Earnings per share (Canadian dollars) Basic $ (0.08) $ (0.16) Diluted (0.08) (0.16)
1 Share of net income from investment in Schwab and the foreign exchange impact are reported with a one-month lag.
Average foreign exchange rate (equivalent of CAD $1.00) For the three months ended For the nine months ended
July 31 July 31 July 31 July 31 2021 2020 2021 2020 U.S. dollar $ 0.814 $ 0.731 $ 0.795 $ 0.739
TD BANK GROUP • THIRD QUARTER 2021 • REPORT TO SHAREHOLDERS Page 13
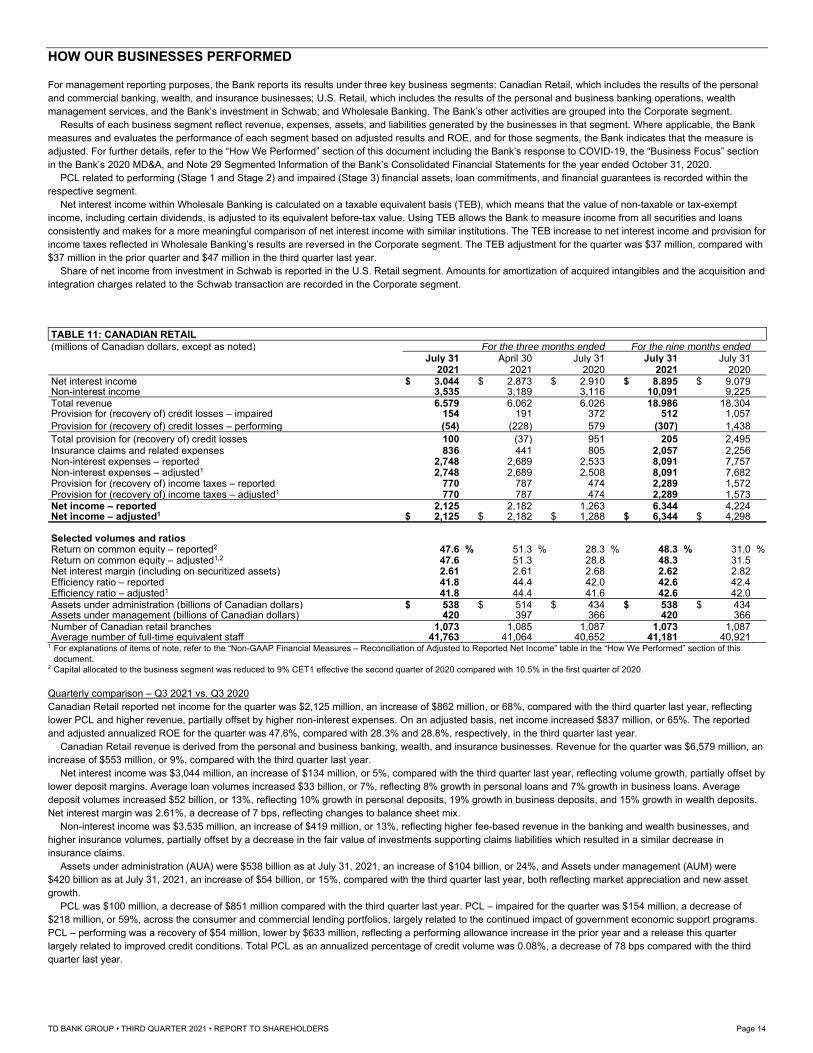
HOW OUR BUSINESSES PERFORMED For management reporting purposes, the Bank reports its results under three key business segments: Canadian Retail, which includes the results of the personal and commercial banking, wealth, and insurance businesses; U.S. Retail, which includes the results of the personal and business banking operations, wealth management services, and the Bank’s investment in Schwab; and Wholesale Banking. The Bank’s other activities are grouped into the Corporate segment.
Results of each business segment reflect revenue, expenses, assets, and liabilities generated by the businesses in that segment. Where applicable, the Bank measures and evaluates the performance of each segment based on adjusted results and ROE, and for those segments, the Bank indicates that the measure is adjusted. For further details, refer to the “How We Performed” section of this document including the Bank’s response to COVID-19, the “Business Focus” section in the Bank’s 2020 MD&A, and Note 29 Segmented Information of the Bank’s Consolidated Financial Statements for the year ended October 31, 2020.
PCL related to performing (Stage 1 and Stage 2) and impaired (Stage 3) financial assets, loan commitments, and financial guarantees is recorded within the respective segment.
Net interest income within Wholesale Banking is calculated on a taxable equivalent basis (TEB), which means that the value of non-taxable or tax-exempt income, including certain dividends, is adjusted to its equivalent before-tax value. Using TEB allows the Bank to measure income from all securities and loans consistently and makes for a more meaningful comparison of net interest income with similar institutions. The TEB increase to net interest income and provision for income taxes reflected in Wholesale Banking’s results are reversed in the Corporate segment. The TEB adjustment for the quarter was $37 million, compared with $37 million in the prior quarter and $47 million in the third quarter last year.
Share of net income from investment in Schwab is reported in the U.S. Retail segment. Amounts for amortization of acquired intangibles and the acquisition and integration charges related to the Schwab transaction are recorded in the Corporate segment.
TABLE 11: CANADIAN RETAIL (millions of Canadian dollars, except as noted) For the three months ended For the nine months ended
July 31 April 30 July 31 July 31 July 31 2021 2021 2020 2021 2020 Net interest income $ 3,044 $ 2,873 $ 2,910 $ 8,895 $ 9,079 Non-interest income 3,535 3,189 3,116 10,091 9,225 Total revenue 6,579 6,062 6,026 18,986 18,304 Provision for (recovery of) credit losses – impaired 154 191 372 512 1,057 Provision for (recovery of) credit losses – performing (54) (228) 579 (307) 1,438 Total provision for (recovery of) credit losses 100 (37) 951 205 2,495 Insurance claims and related expenses 836 441 805 2,057 2,256 Non-interest expenses – reported 2,748 2,689 2,533 8,091 7,757 Non-interest expenses – adjusted1 2,748 2,689 2,508 8,091 7,682 Provision for (recovery of) income taxes – reported 770 787 474 2,289 1,572 Provision for (recovery of) income taxes – adjusted1 770 787 474 2,289 1,573 Net income – reported 2,125 2,182 1,263 6,344 4,224 Net income – adjusted1 $ 2,125 $ 2,182 $ 1,288 $ 6,344 $ 4,298
Selected volumes and ratios Return on common equity – reported2 47.6 % 51.3 % 28.3 % 48.3 % 31.0 % Return on common equity – adjusted1,2 47.6 51.3 28.8 48.3 31.5 Net interest margin (including on securitized assets) 2.61 2.61 2.68 2.62 2.82 Efficiency ratio – reported 41.8 44.4 42.0 42.6 42.4 Efficiency ratio – adjusted1 41.8 44.4 41.6 42.6 42.0 Assets under administration (billions of Canadian dollars) $ 538 $ 514 $ 434 $ 538 $ 434 Assets under management (billions of Canadian dollars) 420 397 366 420 366 Number of Canadian retail branches 1,073 1,085 1,087 1,073 1,087 Average number of full-time equivalent staff 41,763 41,064 40,652 41,181 40,921
1 For explanations of items of note, refer to the “Non-GAAP Financial Measures – Reconciliation of Adjusted to Reported Net Income” table in the “How We Performed” section of this document.
2 Capital allocated to the business segment was reduced to 9% CET1 effective the second quarter of 2020 compared with 10.5% in the first quarter of 2020. Quarterly comparison – Q3 2021 vs. Q3 2020 Canadian Retail reported net income for the quarter was $2,125 million, an increase of $862 million, or 68%, compared with the third quarter last year, reflecting lower PCL and higher revenue, partially offset by higher non-interest expenses. On an adjusted basis, net income increased $837 million, or 65%. The reported and adjusted annualized ROE for the quarter was 47.6%, compared with 28.3% and 28.8%, respectively, in the third quarter last year.
Canadian Retail revenue is derived from the personal and business banking, wealth, and insurance businesses. Revenue for the quarter was $6,579 million, an increase of $553 million, or 9%, compared with the third quarter last year.
Net interest income was $3,044 million, an increase of $134 million, or 5%, compared with the third quarter last year, reflecting volume growth, partially offset by lower deposit margins. Average loan volumes increased $33 billion, or 7%, reflecting 8% growth in personal loans and 7% growth in business loans. Average deposit volumes increased $52 billion, or 13%, reflecting 10% growth in personal deposits, 19% growth in business deposits, and 15% growth in wealth deposits. Net interest margin was 2.61%, a decrease of 7 bps, reflecting changes to balance sheet mix.
Non-interest income was $3,535 million, an increase of $419 million, or 13%, reflecting higher fee-based revenue in the banking and wealth businesses, and higher insurance volumes, partially offset by a decrease in the fair value of investments supporting claims liabilities which resulted in a similar decrease in insurance claims.
Assets under administration (AUA) were $538 billion as at July 31, 2021, an increase of $104 billion, or 24%, and Assets under management (AUM) were $420 billion as at July 31, 2021, an increase of $54 billion, or 15%, compared with the third quarter last year, both reflecting market appreciation and new asset growth.
PCL was $100 million, a decrease of $851 million compared with the third quarter last year. PCL – impaired for the quarter was $154 million, a decrease of $218 million, or 59%, across the consumer and commercial lending portfolios, largely related to the continued impact of government economic support programs. PCL – performing was a recovery of $54 million, lower by $633 million, reflecting a performing allowance increase in the prior year and a release this quarter largely related to improved credit conditions. Total PCL as an annualized percentage of credit volume was 0.08%, a decrease of 78 bps compared with the third quarter last year.
TD BANK GROUP • THIRD QUARTER 2021 • REPORT TO SHAREHOLDERS Page 14
Insurance claims and related expenses for the quarter were $836 million, an increase of $31 million, or 4%, compared with the third quarter last year reflecting higher current year claims from business growth, partially offset by a decrease in the fair value of investments supporting claims liabilities which resulted in a similar decrease in non-interest income.
Reported non-interest expenses for the quarter were $2,748 million, an increase of $215 million, or 8%, compared with the third quarter last year, reflecting higher spend supporting business growth, including volume-driven and employee-related expenses, and technology and marketing costs, partially offset by prior year charges related to the Greystone acquisition. On an adjusted basis, non-interest expenses increased $240 million, or 10%, compared with the third quarter last year.
The reported and adjusted efficiency ratio for the quarter was 41.8%, compared with 42.0% and 41.6%, respectively, in the third quarter last year. Quarterly comparison – Q3 2021 vs. Q2 2021 Canadian Retail net income of $2,125 million decreased $57 million, or 3%, compared with the prior quarter, reflecting higher insurance claims, PCL and non-interest expenses, partially offset by revenue growth. The annualized ROE for the quarter was 47.6%, compared with 51.3%, in the prior quarter.
Revenue increased $517 million, or 9%, compared with the prior quarter. Net interest income increased $171 million, or 6%, largely reflecting volume growth and the effect of more days in the third quarter. Average loan volumes increased $13 billion, or 3%, reflecting 2% growth in personal loans and 5% growth in business loans. Average deposit volumes increased $11 billion, or 3%, reflecting 2% growth in personal deposits, 4% growth in business deposits, and a 2% decrease in wealth deposits. Net interest margin was 2.61%, flat to the prior quarter.
Non-interest income increased $346 million, or 11%, reflecting higher fee-based revenue in the wealth and banking businesses, prior quarter premium rebates for customers in the insurance business, and an increase in the fair value of investments supporting claims liabilities which resulted in a similar increase in insurance claims, partially offset by lower transaction revenue in the wealth business.
AUA increased $24 billion, or 5%, and AUM increased $23 billion, or 6%, compared with the prior quarter, reflecting market appreciation and new asset growth. PCL was $100 million, compared with a recovery of $37 million in the prior quarter. PCL – impaired decreased $37 million, or 19%, primarily reflected in the
commercial lending portfolio. PCL – performing was a recovery of $54 million compared with a recovery of $228 million in the prior quarter, reflecting continued improvement in credit conditions. Total PCL as an annualized percentage of credit volume was 0.08%, an increase of 11 bps.
Insurance claims and related expenses for the quarter increased $395 million, or 90%, compared with the prior quarter, reflecting higher current year claims, less favourable prior years’ claims development, an increase in the fair value of investments supporting claims liabilities which resulted in a similar increase in non-interest income, and more severe weather-related events.
Non-interest expenses increased $59 million, or 2%, compared with the prior quarter reflecting higher volume-driven and employee-related expenses. The efficiency ratio was 41.8%, compared with 44.4%, in the prior quarter.
Year-to-date comparison – Q3 2021 vs. Q3 2020 Canadian Retail reported net income for the nine months ended July 31, 2021 was $6,344 million, an increase of $2,120 million, or 50%, compared with same period last year, reflecting lower PCL and higher revenue, partially offset by higher non-interest expenses. On an adjusted basis, net income increased $2,046 million, or 48%. The reported and adjusted annualized ROE for the period was 48.3%, compared with 31.0% and 31.5%, respectively, in the same period last year.
Revenue for the period was $18,986 million, an increase of $682 million, or 4%, compared with same period last year. Net interest income decreased $184 million, or 2%, reflecting lower deposit margins, partially offset by volume growth. Average loan volumes increased $23 billion, or 5%, reflecting 6% growth in personal loans and 4% growth in business loans. Average deposit volumes increased $66 billion, or 18%, reflecting 13% growth in personal deposits, 24% growth in business deposits, and 28% growth in wealth deposits. Net interest margin was 2.62%, a decrease of 20 bps, reflecting lower rates and changes to balance sheet mix.
Non-interest income increased $866 million, or 9%, reflecting higher transaction and fee-based revenue in the wealth and banking businesses and higher insurance volumes, partially offset by a decrease in the fair value of investments supporting claims liabilities which resulted in a similar decrease in insurance claims and the impact of premium rebates for customers in the insurance business.
PCL was $205 million, a decrease of $2,290 million compared with the same period last year. PCL – impaired was $512 million, a decrease of $545 million, or 52%, primarily in the consumer and commercial lending portfolios, largely related to the continued impact of government economic support programs. PCL – performing was a recovery of $307 million, lower by $1,745 million, reflecting a performing allowance increase in the prior year and an allowance release this year largely related to an improvement in the economic outlook. Total PCL as an annualized percentage of credit volume was 0.06%, a decrease of 70 bps.
Insurance claims and related expenses were $2,057 million, a decrease of $199 million, or 9%, compared with the same period last year, reflecting a decrease in the fair value of investments supporting claims liabilities which resulted in a similar decrease in non-interest income, lower current year claims, more favourable prior years’ claims development, and fewer severe weather-related events.
Reported non-interest expenses were $8,091 million, an increase of $334 million, or 4%, compared with the same period last year. The increase primarily reflects higher spend supporting business growth, including volume-driven and employee-related expenses and technology costs, partially offset by prior year charges related to the Greystone acquisition. On an adjusted basis, non-interest expenses increased $409 million or 5%.
The reported and adjusted efficiency ratios for the period were 42.6%, compared with 42.4% and 42.0%, respectively, for the same period last year.
TD BANK GROUP • THIRD QUARTER 2021 • REPORT TO SHAREHOLDERS Page 15
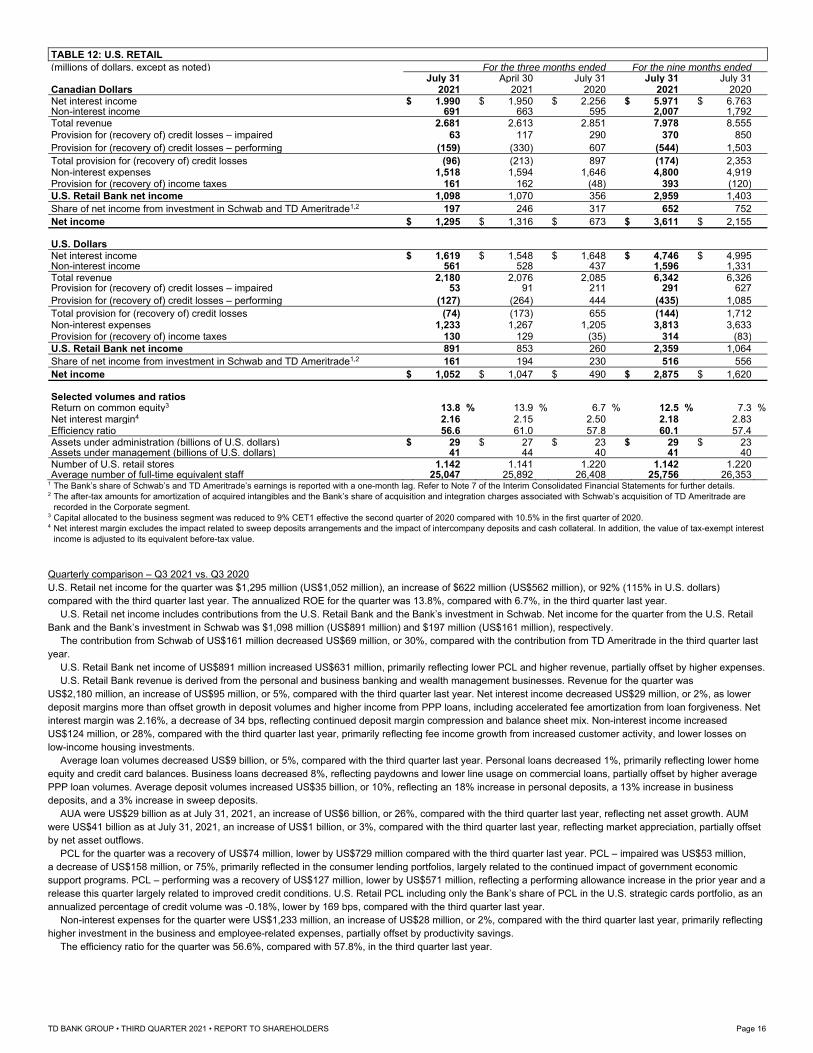
TABLE 12: U.S. RETAIL (millions of dollars, except as noted) For the three months ended For the nine months ended
July 31 April 30 July 31 July 31 July 31 Canadian Dollars 2021 2021 2020 2021 2020 Net interest income $ 1,990 $ 1,950 $ 2,256 $ 5,971 $ 6,763 Non-interest income 691 663 595 2,007 1,792 Total revenue 2,681 2,613 2,851 7,978 8,555 Provision for (recovery of) credit losses – impaired 63 117 290 370 850 Provision for (recovery of) credit losses – performing (159) (330) 607 (544) 1,503 Total provision for (recovery of) credit losses (96) (213) 897 (174) 2,353 Non-interest expenses 1,518 1,594 1,646 4,800 4,919 Provision for (recovery of) income taxes 161 162 (48) 393 (120) U.S. Retail Bank net income 1,098 1,070 356 2,959 1,403 Share of net income from investment in Schwab and TD Ameritrade1,2 197 246 317 652 752 Net income $ 1,295 $ 1,316 $ 673 $ 3,611 $ 2,155
U.S. Dollars Net interest income $ 1,619 $ 1,548 $ 1,648 $ 4,746 $ 4,995 Non-interest income 561 528 437 1,596 1,331 Total revenue 2,180 2,076 2,085 6,342 6,326 Provision for (recovery of) credit losses – impaired 53 91 211 291 627 Provision for (recovery of) credit losses – performing (127) (264) 444 (435) 1,085 Total provision for (recovery of) credit losses (74) (173) 655 (144) 1,712 Non-interest expenses 1,233 1,267 1,205 3,813 3,633 Provision for (recovery of) income taxes 130 129 (35) 314 (83) U.S. Retail Bank net income 891 853 260 2,359 1,064 Share of net income from investment in Schwab and TD Ameritrade1,2 161 194 230 516 556 Net income $ 1,052 $ 1,047 $ 490 $ 2,875 $ 1,620
Selected volumes and ratios Return on common equity3 13.8 % 13.9 % 6.7 % 12.5 % 7.3 % Net interest margin4 2.16 2.15 2.50 2.18 2.83 Efficiency ratio 56.6 61.0 57.8 60.1 57.4 Assets under administration (billions of U.S. dollars) $ 29 $ 27 $ 23 $ 29 $ 23 Assets under management (billions of U.S. dollars) 41 44 40 41 40 Number of U.S. retail stores 1,142 1,141 1,220 1,142 1,220 Average number of full-time equivalent staff 25,047 25,892 26,408 25,756 26,353
1 The Bank’s share of Schwab’s and TD Ameritrade’s earnings is reported with a one-month lag. Refer to Note 7 of the Interim Consolidated Financial Statements for further details. 2 The after-tax amounts for amortization of acquired intangibles and the Bank’s share of acquisition and integration charges associated with Schwab’s acquisition of TD Ameritrade are
recorded in the Corporate segment. 3 Capital allocated to the business segment was reduced to 9% CET1 effective the second quarter of 2020 compared with 10.5% in the first quarter of 2020. 4 Net interest margin excludes the impact related to sweep deposits arrangements and the impact of intercompany deposits and cash collateral. In addition, the value of tax-exempt interest
income is adjusted to its equivalent before-tax value. Quarterly comparison – Q3 2021 vs. Q3 2020 U.S. Retail net income for the quarter was $1,295 million (US$1,052 million), an increase of $622 million (US$562 million), or 92% (115% in U.S. dollars) compared with the third quarter last year. The annualized ROE for the quarter was 13.8%, compared with 6.7%, in the third quarter last year.
U.S. Retail net income includes contributions from the U.S. Retail Bank and the Bank’s investment in Schwab. Net income for the quarter from the U.S. Retail Bank and the Bank’s investment in Schwab was $1,098 million (US$891 million) and $197 million (US$161 million), respectively.
The contribution from Schwab of US$161 million decreased US$69 million, or 30%, compared with the contribution from TD Ameritrade in the third quarter last year.
U.S. Retail Bank net income of US$891 million increased US$631 million, primarily reflecting lower PCL and higher revenue, partially offset by higher expenses. U.S. Retail Bank revenue is derived from the personal and business banking and wealth management businesses. Revenue for the quarter was
US$2,180 million, an increase of US$95 million, or 5%, compared with the third quarter last year. Net interest income decreased US$29 million, or 2%, as lower deposit margins more than offset growth in deposit volumes and higher income from PPP loans, including accelerated fee amortization from loan forgiveness. Net interest margin was 2.16%, a decrease of 34 bps, reflecting continued deposit margin compression and balance sheet mix. Non-interest income increased US$124 million, or 28%, compared with the third quarter last year, primarily reflecting fee income growth from increased customer activity, and lower losses on low-income housing investments.
Average loan volumes decreased US$9 billion, or 5%, compared with the third quarter last year. Personal loans decreased 1%, primarily reflecting lower home equity and credit card balances. Business loans decreased 8%, reflecting paydowns and lower line usage on commercial loans, partially offset by higher average PPP loan volumes. Average deposit volumes increased US$35 billion, or 10%, reflecting an 18% increase in personal deposits, a 13% increase in business deposits, and a 3% increase in sweep deposits.
AUA were US$29 billion as at July 31, 2021, an increase of US$6 billion, or 26%, compared with the third quarter last year, reflecting net asset growth. AUM were US$41 billion as at July 31, 2021, an increase of US$1 billion, or 3%, compared with the third quarter last year, reflecting market appreciation, partially offset by net asset outflows.
PCL for the quarter was a recovery of US$74 million, lower by US$729 million compared with the third quarter last year. PCL – impaired was US$53 million, a decrease of US$158 million, or 75%, primarily reflected in the consumer lending portfolios, largely related to the continued impact of government economic support programs. PCL – performing was a recovery of US$127 million, lower by US$571 million, reflecting a performing allowance increase in the prior year and a release this quarter largely related to improved credit conditions. U.S. Retail PCL including only the Bank’s share of PCL in the U.S. strategic cards portfolio, as an annualized percentage of credit volume was -0.18%, lower by 169 bps, compared with the third quarter last year.
Non-interest expenses for the quarter were US$1,233 million, an increase of US$28 million, or 2%, compared with the third quarter last year, primarily reflecting higher investment in the business and employee-related expenses, partially offset by productivity savings.
The efficiency ratio for the quarter was 56.6%, compared with 57.8%, in the third quarter last year.
TD BANK GROUP • THIRD QUARTER 2021 • REPORT TO SHAREHOLDERS Page 16
Quarterly comparison – Q3 2021 vs. Q2 2021 U.S. Retail net income of $1,295 million (US$1,052 million) decreased CAD$21 million (increased US$5 million). The annualized ROE for the quarter was 13.8%, compared with 13.9% in the prior quarter.
The contribution from Schwab of US$161 million decreased US$33 million, or 17%, reflecting lower earnings. U.S. Retail Bank net income of US$891 million increased US$38 million, or 4%, compared with the prior quarter, primarily reflecting higher revenue and lower
expenses, partially offset by a smaller recovery of credit losses. Revenue for the quarter increased US$104 million, or 5%, compared with the prior quarter. Net interest income increased US$71 million, or 5%, reflecting the
effect of more days in the third quarter, higher average deposit volume excluding sweep deposits, and accelerated fee amortization from PPP loan forgiveness, partially offset by continued deposit margin compression. Net interest margin was 2.16%, an increase of 1 bps. Non-interest income increased US$33 million, or 6%, primarily reflecting higher fee income growth from increased customer activity, and lower losses on low-income housing investments.
Average loan volumes decreased US$3 billion, or 1%, compared with the prior quarter. Personal loans decreased 1%, primarily reflecting lower home equity and residential mortgage balances. Business loans decreased 2%, primarily reflecting paydowns, lower line usage on commercial loans, and a decline in PPP loan volumes from forgiveness. Average deposit volumes were flat compared with the prior quarter reflecting a 3% increase in personal and business deposits, offset by a 5% decrease in sweep deposits.
AUA were US$29 billion as at July 31, 2021, an increase of US$2 billion, or 7%, compared with the prior quarter, reflecting net asset growth. AUM were US$41 billion as at July 31, 2021, a decrease of US$3 billion, or 7%, reflecting net asset outflows, partially offset by market appreciation.
PCL was a recovery of US$74 million compared with a recovery of US$173 million in the prior quarter. PCL – impaired decreased US$38 million, or 42%, largely related to the continued impact of government economic support programs. PCL – performing was a recovery of US$127 million, compared with a recovery of US$264 million in the prior quarter, reflecting continued improvement in credit conditions. U.S. Retail PCL including only the Bank’s share of PCL in the U.S. strategic cards portfolio, as an annualized percentage of credit volume was -0.18%, higher by 23 bps.
Non-interest expenses for the quarter were US$1,233 million, a decrease of US$34 million, or 3%, primarily reflecting store optimization costs in the prior quarter, partially offset by more days in the quarter.
The efficiency ratio for the quarter was 56.6%, compared with 61.0% in the prior quarter. Year-to-date comparison – Q3 2021 vs. Q3 2020 U.S. Retail net income for the nine months ended July 31, 2021, was $3,611 million (US$2,875 million), an increase of $1,456 million (US$1,255 million), or 68% (77% in U.S. dollars), compared with the same period last year. The annualized ROE for the period was 12.5%, compared with 7.3%, in the same period last year. Net income from the U.S. Retail Bank and the Bank’s investment in Schwab was $2,959 million (US$2,359 million) and $652 million (US$516 million), respectively.
The contribution from Schwab was US$516 million, a decrease of US$40 million, or 7%, compared with the contribution from TD Ameritrade for the same period last year.
U.S. Retail Bank net income for the period was US$2,359 million, an increase of US$1,295 million, or 122%, compared with the same period last year, reflecting lower PCL and higher non-interest income, partially offset by lower net interest income and higher expenses.
Revenue for the period was US$6,342 million, an increase of US$16 million compared with same period last year. Net interest income decreased US$249 million, or 5%, as lower deposit margins more than offset growth in deposit volume and higher income from PPP loans, including accelerated fee amortization from loan forgiveness. Net interest margin was 2.18%, a decrease of 65 bps, primarily reflecting deposit margin compression and balance sheet mix. Non-interest income increased US$265 million, or 20%, reflecting fee income growth from increased customer activity, lower losses on low-income housing investments, higher valuation of certain investments, and higher gains on the sale of mortgage loans.
Average loan volumes increased US$1 billion compared with the same period last year. Personal loans decreased 1%, as growth in residential mortgages and auto loans was offset by historically high payment rates on credit cards and decline in home equity. Business loans increased 1%, as higher PPP originations were partially offset by paydowns and lower line usage on commercial loans, and PPP loan forgiveness. Average deposit volumes increased US$65 billion, or 21%, reflecting a 26% increase in business deposit volumes, a 20% increase in personal deposit volumes, and an 18% increase in sweep deposit volumes.
PCL was a recovery of US$144 million, lower by US$1,856 million compared with the same period last year. PCL – impaired was US$291 million, a decrease of US$336 million, or 54%, primarily reflected in the consumer lending portfolios, largely related to the continued impact of government economic support programs. PCL – performing was a recovery of US$435 million, lower by US$1,520 million, reflecting a performing allowance increase in the prior year and a release this period largely related to an improvement in the economic outlook. U.S. Retail PCL including only the Bank’s share of PCL in the U.S. strategic cards portfolio, as an annualized percentage of credit volume was -0.10%, a decrease of 150 bps.
Non-interest expenses for the period were US$3,813 million, an increase of US$180 million, or 5%, compared with the same period last year, reflecting US$125 million in store optimization costs and higher employee-related expenses, partially offset by lower legal provisions and productivity savings.
The efficiency ratio for the period was 60.1%, compared with 57.4%, for the same period last year. THE CHARLES SCHWAB CORPORATION Refer to Note 7, Investment in Associates and Joint Ventures of the Bank’s Interim Consolidated Financial Statements for further information on Schwab.
TD BANK GROUP • THIRD QUARTER 2021 • REPORT TO SHAREHOLDERS Page 17
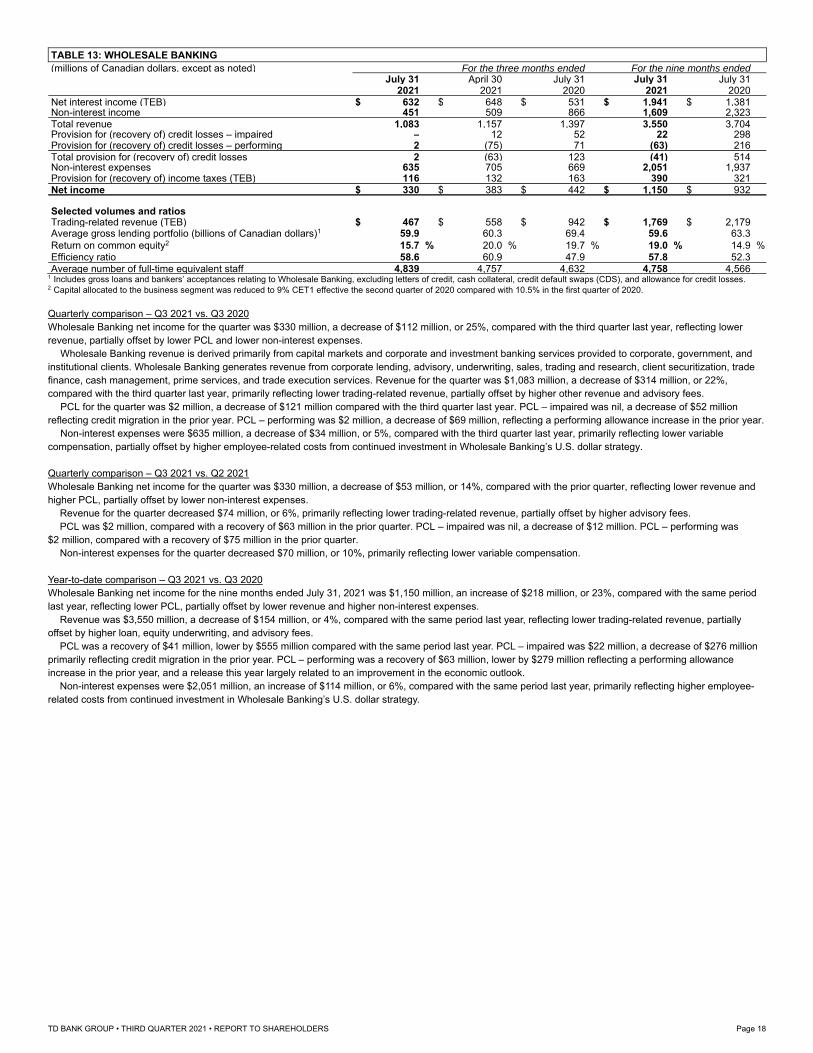
TABLE 13: WHOLESALE BANKING (millions of Canadian dollars, except as noted) For the three months ended For the nine months ended
July 31 April 30 July 31 July 31 July 31 2021 2021 2020 2021 2020 Net interest income (TEB) $ 632 $ 648 $ 531 $ 1,941 $ 1,381 Non-interest income 451 509 866 1,609 2,323 Total revenue 1,083 1,157 1,397 3,550 3,704 Provision for (recovery of) credit losses – impaired – 12 52 22 298 Provision for (recovery of) credit losses – performing 2 (75) 71 (63) 216 Total provision for (recovery of) credit losses 2 (63) 123 (41) 514 Non-interest expenses 635 705 669 2,051 1,937 Provision for (recovery of) income taxes (TEB) 116 132 163 390 321 Net income $ 330 $ 383 $ 442 $ 1,150 $ 932
Selected volumes and ratios Trading-related revenue (TEB) $ 467 $ 558 $ 942 $ 1,769 $ 2,179 Average gross lending portfolio (billions of Canadian dollars)1 59.9 60.3 69.4 59.6 63.3 Return on common equity2 15.7 % 20.0 % 19.7 % 19.0 % 14.9 % Efficiency ratio 58.6 60.9 47.9 57.8 52.3 Average number of full-time equivalent staff 4,839 4,757 4,632 4,758 4,566
1 Includes gross loans and bankers’ acceptances relating to Wholesale Banking, excluding letters of credit, cash collateral, credit default swaps (CDS), and allowance for credit losses. 2 Capital allocated to the business segment was reduced to 9% CET1 effective the second quarter of 2020 compared with 10.5% in the first quarter of 2020. Quarterly comparison – Q3 2021 vs. Q3 2020 Wholesale Banking net income for the quarter was $330 million, a decrease of $112 million, or 25%, compared with the third quarter last year, reflecting lower revenue, partially offset by lower PCL and lower non-interest expenses.
Wholesale Banking revenue is derived primarily from capital markets and corporate and investment banking services provided to corporate, government, and institutional clients. Wholesale Banking generates revenue from corporate lending, advisory, underwriting, sales, trading and research, client securitization, trade finance, cash management, prime services, and trade execution services. Revenue for the quarter was $1,083 million, a decrease of $314 million, or 22%, compared with the third quarter last year, primarily reflecting lower trading-related revenue, partially offset by higher other revenue and advisory fees.
PCL for the quarter was $2 million, a decrease of $121 million compared with the third quarter last year. PCL – impaired was nil, a decrease of $52 million reflecting credit migration in the prior year. PCL – performing was $2 million, a decrease of $69 million, reflecting a performing allowance increase in the prior year.
Non-interest expenses were $635 million, a decrease of $34 million, or 5%, compared with the third quarter last year, primarily reflecting lower variable compensation, partially offset by higher employee-related costs from continued investment in Wholesale Banking’s U.S. dollar strategy. Quarterly comparison – Q3 2021 vs. Q2 2021 Wholesale Banking net income for the quarter was $330 million, a decrease of $53 million, or 14%, compared with the prior quarter, reflecting lower revenue and higher PCL, partially offset by lower non-interest expenses.
Revenue for the quarter decreased $74 million, or 6%, primarily reflecting lower trading-related revenue, partially offset by higher advisory fees. PCL was $2 million, compared with a recovery of $63 million in the prior quarter. PCL – impaired was nil, a decrease of $12 million. PCL – performing was
$2 million, compared with a recovery of $75 million in the prior quarter. Non-interest expenses for the quarter decreased $70 million, or 10%, primarily reflecting lower variable compensation.
Year-to-date comparison – Q3 2021 vs. Q3 2020 Wholesale Banking net income for the nine months ended July 31, 2021 was $1,150 million, an increase of $218 million, or 23%, compared with the same period last year, reflecting lower PCL, partially offset by lower revenue and higher non-interest expenses.
Revenue was $3,550 million, a decrease of $154 million, or 4%, compared with the same period last year, reflecting lower trading-related revenue, partially offset by higher loan, equity underwriting, and advisory fees.
PCL was a recovery of $41 million, lower by $555 million compared with the same period last year. PCL – impaired was $22 million, a decrease of $276 million primarily reflecting credit migration in the prior year. PCL – performing was a recovery of $63 million, lower by $279 million reflecting a performing allowance increase in the prior year, and a release this year largely related to an improvement in the economic outlook.
Non-interest expenses were $2,051 million, an increase of $114 million, or 6%, compared with the same period last year, primarily reflecting higher employee-related costs from continued investment in Wholesale Banking’s U.S. dollar strategy.
TD BANK GROUP • THIRD QUARTER 2021 • REPORT TO SHAREHOLDERS Page 18
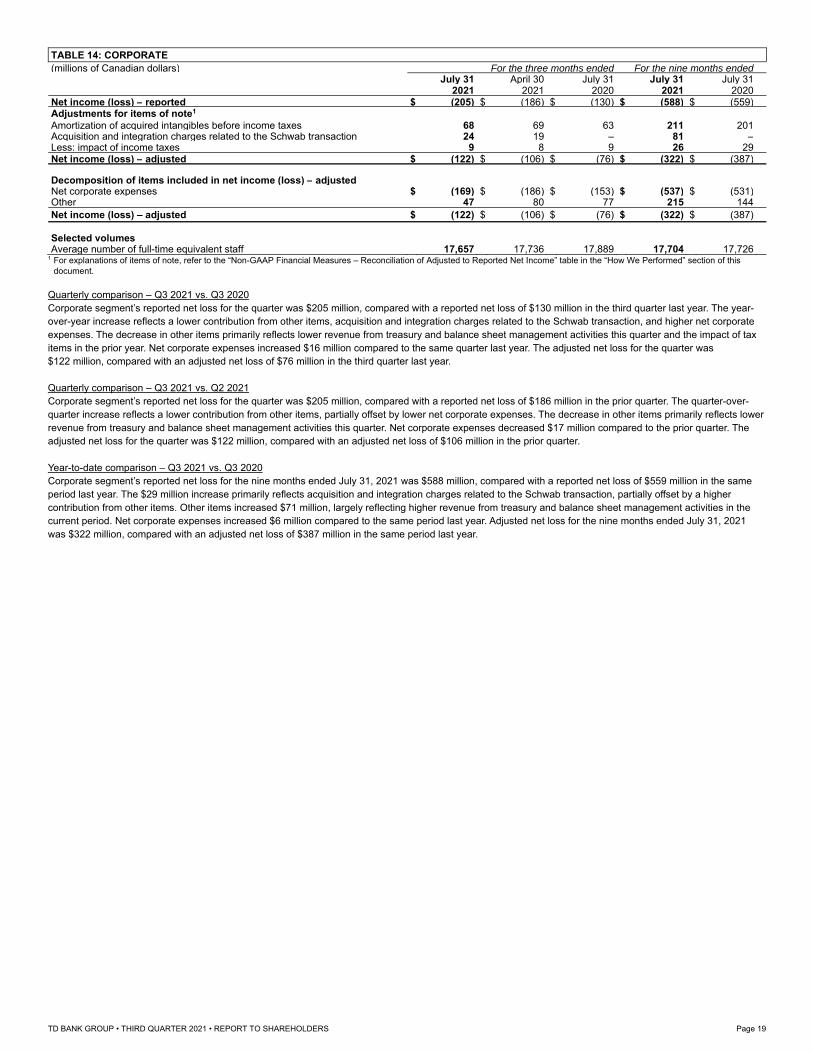
TABLE 14: CORPORATE (millions of Canadian dollars) For the three months ended For the nine months ended
July 31 April 30 July 31 July 31 July 31 2021 2021 2020 2021 2020 Net income (loss) – reported $ (205) $ (186) $ (130) $ (588) $ (559) Adjustments for items of note1 Amortization of acquired intangibles before income taxes 68 69 63 211 201 Acquisition and integration charges related to the Schwab transaction 24 19 – 81 – Less: impact of income taxes 9 8 9 26 29 Net income (loss) – adjusted $ (122) $ (106) $ (76) $ (322) $ (387)
Decomposition of items included in net income (loss) – adjusted Net corporate expenses $ (169) $ (186) $ (153) $ (537) $ (531) Other 47 80 77 215 144 Net income (loss) – adjusted $ (122) $ (106) $ (76) $ (322) $ (387)
Selected volumes Average number of full-time equivalent staff 17,657 17,736 17,889 17,704 17,726
1 For explanations of items of note, refer to the “Non-GAAP Financial Measures – Reconciliation of Adjusted to Reported Net Income” table in the “How We Performed” section of this document.
Quarterly comparison – Q3 2021 vs. Q3 2020 Corporate segment’s reported net loss for the quarter was $205 million, compared with a reported net loss of $130 million in the third quarter last year. The year-over-year increase reflects a lower contribution from other items, acquisition and integration charges related to the Schwab transaction, and higher net corporate expenses. The decrease in other items primarily reflects lower revenue from treasury and balance sheet management activities this quarter and the impact of tax items in the prior year. Net corporate expenses increased $16 million compared to the same quarter last year. The adjusted net loss for the quarter was $122 million, compared with an adjusted net loss of $76 million in the third quarter last year. Quarterly comparison – Q3 2021 vs. Q2 2021 Corporate segment’s reported net loss for the quarter was $205 million, compared with a reported net loss of $186 million in the prior quarter. The quarter-over-quarter increase reflects a lower contribution from other items, partially offset by lower net corporate expenses. The decrease in other items primarily reflects lower revenue from treasury and balance sheet management activities this quarter. Net corporate expenses decreased $17 million compared to the prior quarter. The adjusted net loss for the quarter was $122 million, compared with an adjusted net loss of $106 million in the prior quarter. Year-to-date comparison – Q3 2021 vs. Q3 2020 Corporate segment’s reported net loss for the nine months ended July 31, 2021 was $588 million, compared with a reported net loss of $559 million in the same period last year. The $29 million increase primarily reflects acquisition and integration charges related to the Schwab transaction, partially offset by a higher contribution from other items. Other items increased $71 million, largely reflecting higher revenue from treasury and balance sheet management activities in the current period. Net corporate expenses increased $6 million compared to the same period last year. Adjusted net loss for the nine months ended July 31, 2021 was $322 million, compared with an adjusted net loss of $387 million in the same period last year.
TD BANK GROUP • THIRD QUARTER 2021 • REPORT TO SHAREHOLDERS Page 19
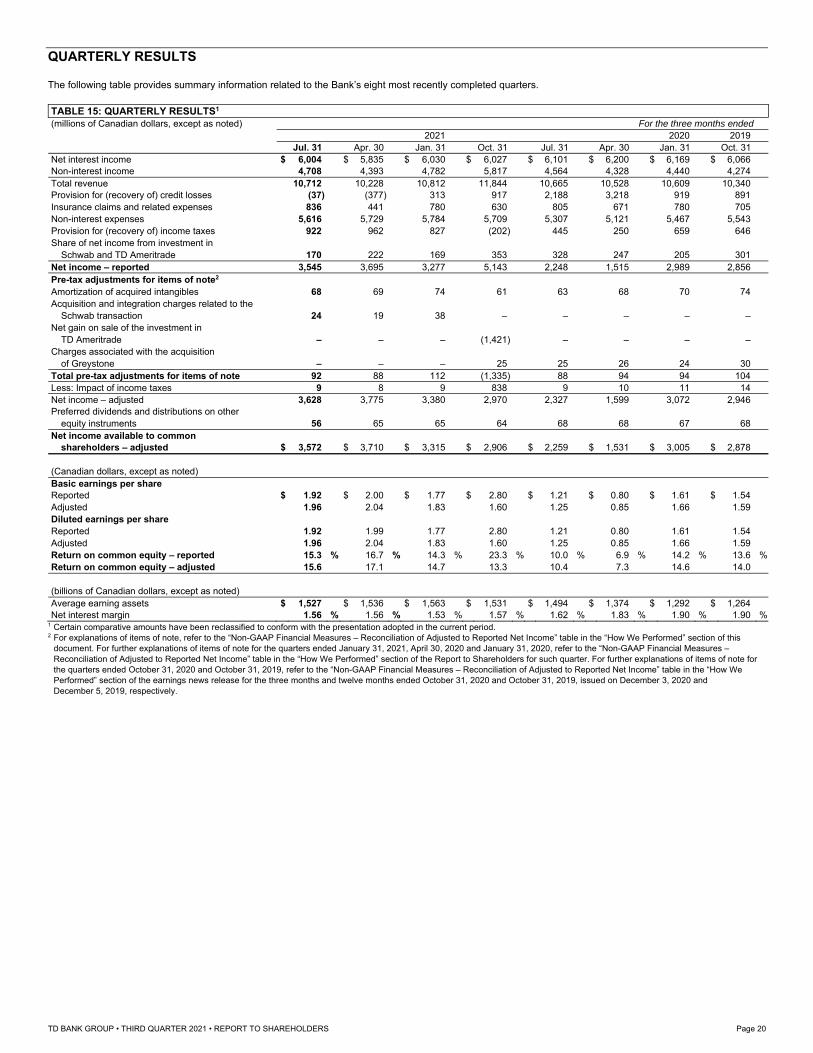
QUARTERLY RESULTS The following table provides summary information related to the Bank’s eight most recently completed quarters. TABLE 15: QUARTERLY RESULTS1 (millions of Canadian dollars, except as noted) For the three months ended
2021 2020 2019 Jul. 31 Apr. 30 Jan. 31 Oct. 31 Jul. 31 Apr. 30 Jan. 31 Oct. 31 Net interest income $ 6,004 $ 5,835 $ 6,030 $ 6,027 $ 6,101 $ 6,200 $ 6,169 $ 6,066 Non-interest income 4,708 4,393 4,782 5,817 4,564 4,328 4,440 4,274 Total revenue 10,712 10,228 10,812 11,844 10,665 10,528 10,609 10,340 Provision for (recovery of) credit losses (37) (377) 313 917 2,188 3,218 919 891 Insurance claims and related expenses 836 441 780 630 805 671 780 705 Non-interest expenses 5,616 5,729 5,784 5,709 5,307 5,121 5,467 5,543 Provision for (recovery of) income taxes 922 962 827 (202) 445 250 659 646 Share of net income from investment in
Schwab and TD Ameritrade 170 222 169 353 328 247 205 301 Net income – reported 3,545 3,695 3,277 5,143 2,248 1,515 2,989 2,856 Pre-tax adjustments for items of note2 Amortization of acquired intangibles 68 69 74 61 63 68 70 74 Acquisition and integration charges related to the
Schwab transaction 24 19 38 – – – – – Net gain on sale of the investment in
TD Ameritrade – – – (1,421) – – – – Charges associated with the acquisition
of Greystone – – – 25 25 26 24 30 Total pre-tax adjustments for items of note 92 88 112 (1,335) 88 94 94 104 Less: Impact of income taxes 9 8 9 838 9 10 11 14 Net income – adjusted 3,628 3,775 3,380 2,970 2,327 1,599 3,072 2,946 Preferred dividends and distributions on other
equity instruments 56 65 65 64 68 68 67 68 Net income available to common
shareholders – adjusted $ 3,572 $ 3,710 $ 3,315 $ 2,906 $ 2,259 $ 1,531 $ 3,005 $ 2,878 (Canadian dollars, except as noted) Basic earnings per share Reported $ 1.92 $ 2.00 $ 1.77 $ 2.80 $ 1.21 $ 0.80 $ 1.61 $ 1.54 Adjusted 1.96 2.04 1.83 1.60 1.25 0.85 1.66 1.59 Diluted earnings per share Reported 1.92 1.99 1.77 2.80 1.21 0.80 1.61 1.54 Adjusted 1.96 2.04 1.83 1.60 1.25 0.85 1.66 1.59 Return on common equity – reported 15.3 % 16.7 % 14.3 % 23.3 % 10.0 % 6.9 % 14.2 % 13.6 % Return on common equity – adjusted 15.6 17.1 14.7 13.3 10.4 7.3 14.6 14.0
(billions of Canadian dollars, except as noted) Average earning assets $ 1,527 $ 1,536 $ 1,563 $ 1,531 $ 1,494 $ 1,374 $ 1,292 $ 1,264 Net interest margin 1.56 % 1.56 % 1.53 % 1.57 % 1.62 % 1.83 % 1.90 % 1.90 %
1 Certain comparative amounts have been reclassified to conform with the presentation adopted in the current period. 2 For explanations of items of note, refer to the “Non-GAAP Financial Measures – Reconciliation of Adjusted to Reported Net Income” table in the “How We Performed” section of this
document. For further explanations of items of note for the quarters ended January 31, 2021, April 30, 2020 and January 31, 2020, refer to the “Non-GAAP Financial Measures – Reconciliation of Adjusted to Reported Net Income” table in the “How We Performed” section of the Report to Shareholders for such quarter. For further explanations of items of note for the quarters ended October 31, 2020 and October 31, 2019, refer to the “Non-GAAP Financial Measures – Reconciliation of Adjusted to Reported Net Income” table in the “How We Performed” section of the earnings news release for the three months and twelve months ended October 31, 2020 and October 31, 2019, issued on December 3, 2020 and December 5, 2019, respectively.
TD BANK GROUP • THIRD QUARTER 2021 • REPORT TO SHAREHOLDERS Page 20
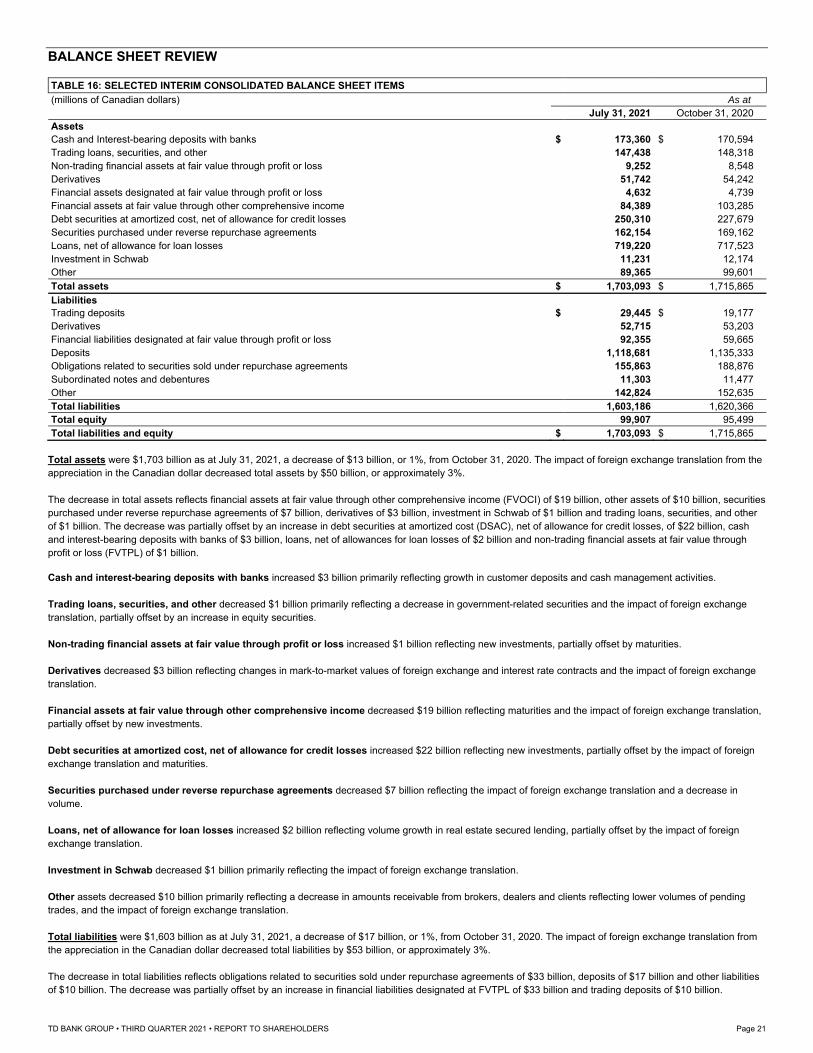
BALANCE SHEET REVIEW
TABLE 16: SELECTED INTERIM CONSOLIDATED BALANCE SHEET ITEMS
(millions of Canadian dollars) As at July 31, 2021 October 31, 2020
Assets
Cash and Interest-bearing deposits with banks $ 173,360 $ 170,594
Trading loans, securities, and other 147,438 148,318
Non-trading financial assets at fair value through profit or loss 9,252 8,548
Derivatives 51,742 54,242
Financial assets designated at fair value through profit or loss 4,632 4,739
Financial assets at fair value through other comprehensive income 84,389 103,285
Debt securities at amortized cost, net of allowance for credit losses 250,310 227,679
Securities purchased under reverse repurchase agreements 162,154 169,162
Loans, net of allowance for loan losses 719,220 717,523
Investment in Schwab 11,231 12,174
Other 89,365 99,601
Total assets $ 1,703,093 $ 1,715,865
Liabilities Trading deposits $ 29,445 $ 19,177
Derivatives 52,715 53,203
Financial liabilities designated at fair value through profit or loss 92,355 59,665
Deposits 1,118,681 1,135,333
Obligations related to securities sold under repurchase agreements 155,863 188,876
Subordinated notes and debentures 11,303 11,477
Other 142,824 152,635
Total liabilities 1,603,186 1,620,366
Total equity 99,907 95,499
Total liabilities and equity $ 1,703,093 $ 1,715,865
Total assets were $1,703 billion as at July 31, 2021, a decrease of $13 billion, or 1%, from October 31, 2020. The impact of foreign exchange translation from the appreciation in the Canadian dollar decreased total assets by $50 billion, or approximately 3%. The decrease in total assets reflects financial assets at fair value through other comprehensive income (FVOCI) of $19 billion, other assets of $10 billion, securities purchased under reverse repurchase agreements of $7 billion, derivatives of $3 billion, investment in Schwab of $1 billion and trading loans, securities, and other of $1 billion. The decrease was partially offset by an increase in debt securities at amortized cost (DSAC), net of allowance for credit losses, of $22 billion, cash and interest-bearing deposits with banks of $3 billion, loans, net of allowances for loan losses of $2 billion and non-trading financial assets at fair value through profit or loss (FVTPL) of $1 billion. Cash and interest-bearing deposits with banks increased $3 billion primarily reflecting growth in customer deposits and cash management activities. Trading loans, securities, and other decreased $1 billion primarily reflecting a decrease in government-related securities and the impact of foreign exchange translation, partially offset by an increase in equity securities. Non-trading financial assets at fair value through profit or loss increased $1 billion reflecting new investments, partially offset by maturities. Derivatives decreased $3 billion reflecting changes in mark-to-market values of foreign exchange and interest rate contracts and the impact of foreign exchange translation. Financial assets at fair value through other comprehensive income decreased $19 billion reflecting maturities and the impact of foreign exchange translation, partially offset by new investments. Debt securities at amortized cost, net of allowance for credit losses increased $22 billion reflecting new investments, partially offset by the impact of foreign exchange translation and maturities. Securities purchased under reverse repurchase agreements decreased $7 billion reflecting the impact of foreign exchange translation and a decrease in volume. Loans, net of allowance for loan losses increased $2 billion reflecting volume growth in real estate secured lending, partially offset by the impact of foreign exchange translation. Investment in Schwab decreased $1 billion primarily reflecting the impact of foreign exchange translation. Other assets decreased $10 billion primarily reflecting a decrease in amounts receivable from brokers, dealers and clients reflecting lower volumes of pending trades, and the impact of foreign exchange translation. Total liabilities were $1,603 billion as at July 31, 2021, a decrease of $17 billion, or 1%, from October 31, 2020. The impact of foreign exchange translation from the appreciation in the Canadian dollar decreased total liabilities by $53 billion, or approximately 3%. The decrease in total liabilities reflects obligations related to securities sold under repurchase agreements of $33 billion, deposits of $17 billion and other liabilities of $10 billion. The decrease was partially offset by an increase in financial liabilities designated at FVTPL of $33 billion and trading deposits of $10 billion.
TD BANK GROUP • THIRD QUARTER 2021 • REPORT TO SHAREHOLDERS Page 21
Trading deposits increased $10 billion reflecting new issuances, partially offset by maturities. Financial liabilities designated at fair value through profit or loss increased $33 billion reflecting new issuances, partially offset by maturities. Deposits decreased $17 billion as the increase in total deposits was more than offset by the impact of foreign exchange translation. Obligations related to securities sold under repurchase agreements decreased $33 billion reflecting a decrease in volume. Other liabilities decreased $10 billion primarily reflecting a decrease in amounts payable to brokers, dealers and clients reflecting lower volumes of pending trades, and the impact of foreign exchange translation. Equity was $100 billion as at July 31, 2021, an increase of $4 billion, or 5%, from October 31, 2020. The increase primarily reflects an increase in retained earnings and the issuance of limited recourse capital notes, partially offset by the impact of foreign exchange translation.
CREDIT PORTFOLIO QUALITY Quarterly comparison – Q3 2021 vs. Q3 2020 Gross impaired loans excluding ACI loans, were $2,651 million as at July 31, 2021, a decrease of $1,170 million, or 31%, compared with the third quarter last year. Canadian Retail gross impaired loans decreased $330 million, or 24%, compared with the third quarter last year, primarily in the consumer lending portfolios reflecting the ongoing impact of government economic support programs. U.S. Retail gross impaired loans decreased $565 million, or 27%, compared with the third quarter last year, largely reflecting the impact of foreign exchange, the ongoing impact of government economic support programs, and resolutions of impaired loans in the commercial lending portfolio. Wholesale gross impaired loans decreased $275 million or 80%, compared with the third quarter last year, reflecting resolutions outpacing formations. Net impaired loans were $1,938 million as at July 31, 2021, a decrease of $671 million, or 26%, compared with the third quarter last year.
The allowance for credit losses of $7,716 million as at July 31, 2021 was comprised of Stage 3 allowance for impaired loans of $728 million, Stage 2 allowance of $4,297 million and Stage 1 allowance of $2,685 million, and the allowance for debt securities of $6 million. The Stage 1 and 2 allowances are for performing loans and off-balance sheet instruments.
The Stage 3 allowance for loan losses decreased $530 million, or 42%, reflecting resolutions of impaired loans in the Wholesale portfolio, the ongoing impact of government economic support programs, and the impact of foreign exchange. The Stage 1 and Stage 2 allowance for loan losses decreased $980 million, or 12%, largely related to releases this year reflecting improvement in credit conditions, and the impact of foreign exchange. The allowance change included a decrease of $373 million attributable to the retailer program partners’ share of the U.S. strategic cards portfolio.
The allowance for debt securities decreased by $1 million compared with the third quarter last year. Forward-looking information, including macroeconomic variables deemed to be predictive of expected credit losses (ECLs) based on the Bank’s experience, is
used to determine ECL scenarios and associated probability weights to determine the probability-weighted ECLs. Each quarter, all base forecast macroeconomic variables are refreshed, resulting in new upside and downside macroeconomic scenarios. Starting in the first quarter of 2021, the upside scenario was based on plausible scenario analyses of a more rapid recovery from the COVID-19 shock. For the downside forecast, since the second quarter of 2020, macroeconomic variables were based on plausible scenario analyses of COVID-19 impacts, given the lack of comparable historical data for a shock of this nature. The probability weightings assigned to each ECL scenario are also reviewed each quarter and updated as required, as part of the Bank’s ECL governance process. As a result of periodic reviews and quarterly updates, the allowance for credit losses may be revised to reflect updates in statistically derived loss estimates based on the Bank’s recent loss experience and its forward-looking views, including the impact of COVID-19. The Bank periodically reviews the methodology and has performed certain additional qualitative portfolio and loan level assessments of significant increase in credit risk. Refer to Note 3 of the Bank’s third quarter 2021 Interim Consolidated Financial Statements for further details on forward-looking information.
The probability-weighted allowance for credit losses reflects the Bank’s forward-looking views, including its estimate of the potential impact of COVID-19. The Bank continues to monitor the effects of COVID-19. To the extent that certain anticipated effects of COVID-19 cannot be fully incorporated into quantitative models, management continues to exercise expert credit judgment in determining the amount of ECLs by considering reasonable and supportable information. There remains considerable uncertainty regarding the impact of the COVID-19 pandemic, and as the situation unfolds, the allowance for credit losses will be updated in future quarters. Refer to Note 3 of the Bank’s third quarter 2021 Interim Consolidated Financial Statements for additional details.
The Bank calculates allowances for ECLs on debt securities measured at amortized cost and FVOCI. The Bank has $329 billion in such debt securities, all of which are performing (Stage 1 and 2) and none are impaired (Stage 3). The allowance for credit losses on DSAC and debt securities at FVOCI was $2 million and $4 million, respectively. Quarterly comparison – Q3 2021 vs. Q2 2021 Gross impaired loans, excluding ACI loans, decreased $152 million, or 5%, compared with the prior quarter, primarily in the Canadian and U.S. consumer lending portfolios reflecting the ongoing impact of government economic support programs. Impaired loans net of allowance decreased $131 million, or 6%, compared with the prior quarter.
The allowance for credit losses of $7,716 million as at July 31, 2021 was comprised of Stage 3 allowance for impaired loans of $728 million, Stage 2 allowance of $4,297 million and Stage 1 allowance of $2,685 million, and the allowance for debt securities of $6 million. The Stage 1 and 2 allowances are for performing loans and off-balance sheet instruments. The Stage 3 allowance for loan losses decreased $38 million, or 5%, compared with prior quarter, primarily in the consumer lending portfolios, largely related to the continued impact of government economic support programs. The Stage 1 and Stage 2 allowance for loan losses decreased $221 million, or 3%, compared with the prior quarter.
The allowance for debt securities was $6 million, consistent with the prior quarter.
For further details on loans, impaired loans, allowance for credit losses, and on the Bank’s use of forward-looking information and macroeconomic variables in determining its allowance for credit losses, refer to Note 6 of the Bank’s third quarter 2021 Interim Consolidated Financial Statements.
TD BANK GROUP • THIRD QUARTER 2021 • REPORT TO SHAREHOLDERS Page 22
TABLE 17: CHANGES IN GROSS IMPAIRED LOANS AND ACCEPTANCES
(millions of Canadian dollars) For the three months ended For the nine months ended July 31 April 30 July 31 July 31 July 31 2021 2021 2020 2021 2020 Personal, Business, and Government Loans1 Impaired loans as at beginning of period $ 2,803 $ 3,057 $ 3,606 $ 3,157 $ 3,032 Classified as impaired during the period 830 1,010 1,708 3,043 5,180 Transferred to performing during the period (229) (257) (297) (732) (842) Net repayments (309) (353) (278) (963) (987) Disposals of loans (15) – – (18) (15) Amounts written off (454) (585) (828) (1,714) (2,575) Exchange and other movements 25 (69) (90) (122) 28 Impaired loans as at end of period $ 2,651 $ 2,803 $ 3,821 $ 2,651 $ 3,821
1 Excludes ACI loans.
TABLE 18: ALLOWANCE FOR CREDIT LOSSES (millions of Canadian dollars, except as noted) As at
July 31 April 30 July 31 2021 2021 2020 Allowance for loan losses for on-balance sheet loans Stage 1 allowance for loan losses $ 2,311 $ 2,368 $ 2,841 Stage 2 allowance for loan losses 3,782 3,891 4,070 Stage 3 allowance for loan losses 718 740 1,222 Total allowance for loan losses for on-balance sheet loans1 6,811 6,999 8,133
Allowance for off-balance sheet instruments Stage 1 allowance for loan losses 374 381 459 Stage 2 allowance for loan losses 515 563 592 Stage 3 allowance for loan losses 10 26 36 Total allowance for off-balance sheet instruments 899 970 1,087 Allowance for loan losses 7,710 7,969 9,220 Allowance for debt securities 6 6 7 Allowance for credit losses $ 7,716 $ 7,975 $ 9,227 Impaired loans, net of allowance2,3 $ 1,938 $ 2,069 $ 2,609 Net impaired loans as a percentage of net loans2,3 0.26 % 0.28 % 0.35 % Total allowance for loan losses as a percentage of gross loans and acceptances2 1.03 1.08 1.24 Provision for (recovery of) credit losses as a percentage of net average loans and acceptances (0.02) (0.21) 1.17
1 Includes allowance for loan losses related to loans that are measured at FVOCI of nil as at July 31, 2021 (April 30, 2021 – $1 million; July 31, 2020 – nil). 2 Excludes ACI loans. 3 Credit cards are considered impaired when they are 90 days past due and written off at 180 days past due. Real Estate Secured Lending Retail real estate secured lending includes mortgages and lines of credit to North American consumers to satisfy financing needs including home purchases and refinancing. While the Bank retains first lien on the majority of properties held as security, there is a small portion of loans with second liens, but most of these are behind a TD mortgage that is in first position. In Canada, credit policies are designed so that the combined exposure of all uninsured facilities on one property does not exceed 80% of the collateral value at origination. Lending at a higher loan-to-value ratio is permitted by legislation but requires default insurance. This insurance is contractual coverage for the life of eligible facilities and protects the Bank’s real estate secured lending portfolio against potential losses caused by borrowers’ default. The Bank may also purchase default insurance on lower loan-to-value ratio loans. The insurance is provided by either government-backed entities or approved private mortgage insurers. In the U.S., for residential mortgage originations, mortgage insurance is usually obtained from either government-backed entities or approved private mortgage insurers when the loan-to-value exceeds 80% of the collateral value at origination.
The Bank regularly performs stress tests on its real estate lending portfolio as part of its overall stress testing program. This is done with a view to determine the extent to which the portfolio would be vulnerable to a severe downturn in economic conditions. The effect of severe changes in house prices, interest rates, and unemployment levels are among the factors considered when assessing the impact on credit losses and the Bank’s overall profitability. A variety of portfolio segments, including dwelling type and geographical regions, are examined during the exercise to determine whether specific vulnerabilities exist. Canadian minimum qualifying rate for uninsured and insured mortgages On May 20, 2021, Office of the Superintendent of Financial Institutions Canada (OSFI) announced changes to the minimum qualifying rate for uninsured mortgages. In addition, the Department of Finance announced changes to the qualifying rate for insured mortgages. Effective June 1, 2021, the new benchmark rate will be the greater of the mortgage contractual rate plus 2% or 5.25% for both uninsured and insured mortgages. The previous uninsured benchmark rate was the greater of the mortgage contractual rate plus 2% or the Bank of Canada five-year benchmark rate. The previous insured benchmark rate was the greater of the mortgage contractual rate or the Bank of Canada five-year benchmark rate.
TABLE 19: CANADIAN REAL ESTATE SECURED LENDING1 (millions of Canadian dollars) As at
Amortizing Non-amortizing Total Residential Home equity Total amortizing real Home equity Mortgages lines of credit estate secured lending lines of credit July 31, 2021 Total $ 227,606 $ 68,928 $ 296,534 $ 31,105 $ 327,639
October 31, 2020 Total $ 213,239 $ 61,790 $ 275,029 $ 33,048 $ 308,077
1 Excludes loans classified as trading as the Bank intends to sell the loans immediately or in the near term, and loans designated at FVTPL for which no allowance is recorded.
TD BANK GROUP • THIRD QUARTER 2021 • REPORT TO SHAREHOLDERS Page 23
TABLE 20: REAL ESTATE SECURED LENDING1,2 (millions of Canadian dollars, except as noted) As at
Residential mortgages Home equity lines of credit Total Insured3 Uninsured Insured3 Uninsured Insured3 Uninsured July 31, 2021 Canada Atlantic provinces $ 3,052 1.3 % $ 3,424 1.5 % $ 278 0.3 % $ 1,427 1.4 % $ 3,330 1.0 % $ 4,851 1.5 % British Columbia4 9,646 4.2 35,722 15.7 1,505 1.5 17,372 17.4 11,151 3.4 53,094 16.2 Ontario4 26,312 11.6 91,689 40.4 5,319 5.3 51,457 51.4 31,631 9.7 143,146 43.6 Prairies4 20,939 9.2 17,122 7.5 2,501 2.5 11,314 11.3 23,440 7.2 28,436 8.7 Québec 8,239 3.6 11,461 5.0 870 0.9 7,990 8.0 9,109 2.8 19,451 5.9 Total Canada 68,188 29.9 % 159,418 70.1 % 10,473 10.5 % 89,560 89.5 % 78,661 24.1 % 248,978 75.9 % United States 880 34,970 – 9,075 880 44,045 Total $ 69,068 $ 194,388 $ 10,473 $ 98,635 $ 79,541 $ 293,023
October 31, 2020 Canada Atlantic provinces $ 3,218 1.5 % $ 3,108 1.5 % $ 316 0.3 % $ 1,337 1.4 % $ 3,534 1.1 % $ 4,445 1.4 % British Columbia4 10,142 4.8 30,416 14.3 1,670 1.8 16,192 17.1 11,812 3.8 46,608 15.1 Ontario4 28,818 13.5 80,096 37.4 5,925 6.2 47,361 50.0 34,743 11.3 127,457 41.5 Prairies4 21,741 10.2 16,750 7.9 2,726 2.9 11,260 11.9 24,467 7.9 28,010 9.1 Québec 8,520 4.0 10,430 4.9 993 1.0 7,058 7.4 9,513 3.1 17,488 5.7 Total Canada 72,439 34.0 % 140,800 66.0 % 11,630 12.2 % 83,208 87.8 % 84,069 27.2 % 224,008 72.8 % United States 1,008 37,972 – 10,953 1,008 48,925 Total $ 73,447 $ 178,772 $ 11,630 $ 94,161 $ 85,077 $ 272,933
1 Geographic location is based on the address of the property mortgaged. 2 Excludes loans classified as trading as the Bank intends to sell the loans immediately or in the near term, and loans designated at FVTPL for which no allowance is recorded. 3 Default insurance is contractual coverage for the life of eligible facilities whereby the Bank’s exposure to real estate secured lending, all or in part, is protected against potential losses
caused by borrower default. It is provided by either government-backed entities or other approved private mortgage insurers.
4 The territories are included as follows: Yukon is included in British Columbia; Nunavut is included in Ontario; and the Northwest Territories is included in the Prairies region. The following table provides a summary of the Bank’s residential mortgages by remaining amortization period. All figures are calculated based on current customer payment behaviour in order to properly reflect the propensity to prepay by borrowers. The current customer payment basis accounts for any accelerated payments made to date and projects remaining amortization based on existing balance outstanding and current payment terms.
TABLE 21: RESIDENTIAL MORTGAGES BY REMAINING AMORTIZATION1,2 As at <5 5– <10 10– <15 15– <20 20– <25 25– <30 30– <35 >=35 years years years years years years years years Total July 31, 2021 Canada 0.9 % 3.2 % 6.6 % 19.3 % 42.6 % 27.0 % 0.4 % – % 100.0 % United States 7.8 3.6 4.5 5.7 18.5 58.0 1.7 0.2 100.0 Total 1.8 % 3.3 % 6.4 % 17.4 % 39.3 % 31.2 % 0.6 % – % 100.0 %
October 31, 2020 Canada 0.9 % 3.4 % 6.9 % 20.0 % 44.7 % 23.3 % 0.8 % – % 100.0 % United States 5.3 4.5 4.6 6.0 20.8 56.3 2.3 0.2 100.0 Total 1.6 % 3.5 % 6.5 % 17.8 % 41.2 % 28.4 % 1.0 % – % 100.0 %
1 Excludes loans classified as trading as the Bank intends to sell the loans immediately or in the near term, and loans designated at FVTPL for which no allowance is recorded. 2 Percentage based on outstanding balance.
TABLE 22: UNINSURED AVERAGE LOAN-TO-VALUE – Newly Originated and Newly Acquired1,2,3
For the three months ended Residential Home equity Residential Home equity mortgages lines of credit4,5 Total mortgages lines of credit4,5 Total July 31, 2021 October 31, 2020 Canada Atlantic provinces 73 % 71 % 72 % 74 % 72 % 74 % British Columbia6 68 65 67 68 65 67 Ontario6 68 66 67 69 66 68 Prairies6 74 71 73 74 71 73 Québec 73 72 72 73 73 73 Total Canada 69 67 68 70 67 69 United States 73 63 72 73 63 72 Total 69 % 66 % 68 % 70 % 67 % 69 %
1 Geographic location is based on the address of the property mortgaged. 2 Excludes loans classified as trading as the Bank intends to sell the loans immediately or in the near term, and loans designated at FVTPL for which no allowance is recorded.
3 Based on house price at origination. 4 Home equity lines of credit (HELOCs) loan-to-value includes first position collateral mortgage if applicable. 5 HELOC fixed rate advantage option is included in loan-to-value calculation. 6 The territories are included as follows: Yukon is included in British Columbia; Nunavut is included in Ontario; and the Northwest Territories is included in the Prairies region.
TD BANK GROUP • THIRD QUARTER 2021 • REPORT TO SHAREHOLDERS Page 24
Sovereign Risk The following table provides a summary of the Bank’s credit exposure to certain European countries, including Greece, Italy, Ireland, Portugal, and Spain (GIIPS). TABLE 23: EXPOSURE TO EUROPE – Total Net Exposure by Country and Counterparty1 (millions of Canadian dollars) As at
Loans and commitments2 Derivatives, repos, and securities lending3 Trading and investment portfolio4,5 Total
Corporate Sovereign Financial Total Corporate Sovereign Financial Total Corporate Sovereign Financial Total Exposure6
Country July 31, 2021
GIIPS
Greece $ – $ – $ – $ – $ – $ – $ – $ – $ – $ – $ – $ – $ –
Italy – – 9 9 – – 13 13 24 2 66 92 114
Ireland – – 544 544 4 4 358 366 – – 3 3 913
Portugal – – – – – 121 37 158 1 – – 1 159
Spain – – 95 95 – – 146 146 19 53 33 105 346
Total GIIPS – – 648 648 4 125 554 683 44 55 102 201 1,532
Rest of Europe
Austria – – 17 17 10 87 26 123 – 1,462 3 1,465 1,605
Belgium 437 – 172 609 707 37 179 923 – 307 – 307 1,839
Finland – 211 9 220 – 66 120 186 – 950 59 1,009 1,415
France 557 923 979 2,459 20 372 1,198 1,590 158 5,973 353 6,484 10,533
Germany 2,305 530 377 3,212 936 703 1,390 3,029 261 8,810 44 9,115 15,356
Netherlands 612 243 378 1,233 244 235 675 1,154 162 2,462 71 2,695 5,082
Norway – 320 28 348 – 186 29 215 5 1,024 474 1,503 2,066
Sweden – – 56 56 – 105 144 249 14 1,881 690 2,585 2,890
Switzerland 1,022 81 313 1,416 507 85 1,108 1,700 16 – 62 78 3,194
United Kingdom 6,549 24,034 664 31,247 1,748 1,167 8,861 11,776 676 1,203 394 2,273 45,296
Other7 – 249 173 422 – 180 610 790 1 385 2 388 1,600
Total Rest of Europe 11,482 26,591 3,166 41,239 4,172 3,223 14,340 21,735 1,293 24,457 2,152 27,902 90,876
Total Europe $ 11,482 $ 26,591 $ 3,814 $ 41,887 $ 4,176 $ 3,348 $ 14,894 $ 22,418 $ 1,337 $ 24,512 $ 2,254 $ 28,103 $ 92,408
Country October 31, 2020
GIIPS
Greece $ – $ – $ – $ – $ – $ – $ – $ – $ – $ – $ – $ – $ –
Italy – – 10 10 – – 3 3 17 – 17 34 47
Ireland – – 320 320 11 – 331 342 – – 21 21 683
Portugal – – – – – 86 24 110 13 – – 13 123
Spain – – 89 89 – – 86 86 4 715 38 757 932
Total GIIPS – – 419 419 11 86 444 541 34 715 76 825 1,785
Rest of Europe
Austria – – 18 18 3 122 33 158 5 1,266 9 1,280 1,456
Belgium 266 – 189 455 824 30 175 1,029 40 320 – 360 1,844
Finland – 252 9 261 – 52 63 115 – 1,054 16 1,070 1,446
France 591 1,024 962 2,577 55 1,075 1,253 2,383 109 4,789 466 5,364 10,324
Germany 1,481 494 374 2,349 895 697 725 2,317 249 9,691 30 9,970 14,636
Netherlands 609 275 536 1,420 383 179 1,086 1,648 29 2,635 220 2,884 5,952
Norway – 365 29 394 – 439 42 481 5 708 439 1,152 2,027
Sweden – – 67 67 – 109 174 283 4 1,784 781 2,569 2,919
Switzerland 1,163 151 331 1,645 327 19 856 1,202 16 – 162 178 3,025
United Kingdom 5,333 9,797 760 15,890 1,592 847 8,424 10,863 93 479 526 1,098 27,851
Other7 – 273 109 382 9 203 699 911 – 430 40 470 1,763
Total Rest of Europe 9,443 12,631 3,384 25,458 4,088 3,772 13,530 21,390 550 23,156 2,689 26,395 73,243
Total Europe $ 9,443 $ 12,631 $ 3,803 $ 25,877 $ 4,099 $ 3,858 $ 13,974 $ 21,931 $ 584 $ 23,871 $ 2,765 $ 27,220 $ 75,028 1 Certain comparative amounts have been reclassified to conform with the presentation adopted in the current period. 2 Exposures include interest-bearing deposits with banks and are presented net of impairment charges where applicable. There were no impairment charges for European exposures as at
July 31, 2021, or October 31, 2020. 3 Exposures are calculated on a fair value basis and are net of collateral. Total market value of pledged collateral is $2.0 billion (October 31, 2020 – $1.5 billion) for GIIPS and $77.7 billion
for the rest of Europe (October 31, 2020 – $82.3 billion). Derivatives are presented as net exposures where there is an International Swaps and Derivatives Association (ISDA) master netting agreement.
4 Trading and investment portfolio includes deposits and trading exposures are net of eligible short positions. 5 The fair values of the GIIPS exposures in Level 3 in the trading and investment portfolio were nil as at July 31, 2021 and October 31, 2020.
6 The Bank had nil related notional protection purchased through CDS (October 31, 2020 – nil). 7 Other European exposure is distributed across 11 countries (October 31, 2020 – 12 countries), each of which has a net exposure including loans and commitments, derivatives, repos
and securities lending, and trading and investment portfolio below $1 billion as at October 31, 2020. Of the Bank’s European exposure, approximately 98% (October 31, 2020 – 97%) is to counterparties in countries rated either Aa3 or better by Moody’s Investor Services (Moody’s) or AA or better by Standard & Poor’s (S&P), with the majority of this exposure to the sovereigns themselves or to well rated, systemically important banks in these countries. Derivatives and securities repurchase transactions are completed on a collateralized basis. The vast majority of derivatives exposure is offset by cash collateral while the repurchase transactions are backed largely by government securities rated AA or better, and cash. The Bank also takes a limited amount of exposure to well rated corporate issuers in Europe where the Bank also does business with their related entities in North America.
In addition to the European exposure identified above, the Bank also has $14.1 billion (October 31, 2020 – $14.8 billion) of exposure to supranational entities with European sponsorship and $4.2 billion (October 31, 2020 – $6.2 billion) of indirect exposure to European collateral from non-European counterparties related to repurchase and securities lending transactions that are margined daily.
TD BANK GROUP • THIRD QUARTER 2021 • REPORT TO SHAREHOLDERS Page 25
CAPITAL POSITION REGULATORY CAPITAL Capital requirements of the Basel Committee on Banking Supervision (BCBS) are commonly referred to as Basel III. Under Basel III, Total Capital consists of three components, namely CET1, Additional Tier 1, and Tier 2 Capital. Risk sensitive regulatory capital ratios are calculated by dividing CET1, Tier 1, and Total Capital by RWA, inclusive of any minimum requirements outlined under the regulatory floor. In 2015, Basel III introduced a non-risk sensitive leverage ratio to act as a supplementary measure to the risk-sensitive capital requirements. The objective of the leverage ratio is to constrain the build-up of excess leverage in the banking sector. The leverage ratio is calculated by dividing Tier 1 Capital by leverage exposure which is primarily comprised of on-balance sheet assets with adjustments made to derivative and securities financing transaction exposures, and credit equivalent amounts of off-balance sheet exposures. TD continues to manage its regulatory capital in accordance with the Basel III Capital Framework as discussed in the “Capital Position” section of the Bank’s 2020 Annual Report. OSFI’s Capital Requirements under Basel III OSFI’s Capital Adequacy Requirements (CAR) guideline details how the Basel III capital rules apply to Canadian banks. Other requirements, in addition to those described in “OSFI’s Capital Requirements under Basel III” section of Bank’s 2020 Annual Report, are noted below.
On March 13, 2020, as part of its COVID-19 response, OSFI announced that the Domestic Stability Buffer (DSB), previously set to increase to 2.25% effective April 30, 2020, was being lowered to 1.00% effective immediately and would not be increased for at least 18 months from March 13, 2020. On June 17, 2021, OSFI announced that the DSB would increase to 2.50% of total risk-weighted assets, effective October 31, 2021.
The Bank maintained its Global Systemically Important Bank (G-SIB) status when the Financial Stability Board published the 2020 list of G-SIBs on November 11, 2020. As a result, the Bank continues to be subject to an additional loss absorbency requirement (CET1 as a percentage of RWA) of 1%, which is consistent with the surcharge applied to all Canadian Domestic Systemically Important Banks (D-SIBs). The table below summarizes OSFI’s current regulatory minimum capital ratios for the Bank.
REGULATORY CAPITAL TARGET RATIOS
Minimum Capital D-SIB / G-SIB1 Pillar 12 DSB3 Pillar 1 & 2 Conservation Surcharge Regulatory regulatory Buffer target target CET1 4.5 % 2.5 % 1.0 % 8.0 % 1.0 % 9.0 % Tier 1 6.0 2.5 1.0 9.5 1.0 10.5 Total Capital 8.0 2.5 1.0 11.5 1.0 12.5
1 The higher of the D-SIB and G-SIB surcharge applies. The D-SIB surcharge is currently equivalent to the Bank’s 1% G-SIB additional common equity requirement. The G SIB surcharge may increase above 1% if the Bank’s G-SIB score increases above certain thresholds to a maximum of 4.5%.
2 The Bank’s countercyclical buffer requirement is 0% as of July 31, 2021.
3 The DSB is established by OSFI within a range of 0% to 2.5% and is required to be held by D-SIBs in recognition of Pillar 2 risks associated with systemic vulnerabilities. OSFI has announced that the DSB will increase to 2.5% of total RWA effective October 31, 2021.
The Bank’s Leverage Ratio is calculated as per OSFI’s Leverage Requirements guideline and has a regulatory minimum requirement of 3%. Effective January 1, 2013, all newly issued non-common Tier 1 and Tier 2 Capital instruments must include non-viability contingent capital (NVCC) provisions to qualify as regulatory capital. NVCC provisions require the conversion of non-common capital instruments into a variable number of common shares of the Bank upon the occurrence of a trigger event as defined in the guidance. Non-common Tier 1 and Tier 2 capital instruments issued prior to January 1, 2013 which do not include NVCC provisions are non-qualifying capital instruments and are subject to a phase-out period which began in 2013 and ends in Q1 2022.
On September 23, 2018, the Canadian Bail-in regime came into effect, including OSFI’s Total Loss Absorbing Capacity (TLAC) guideline. Under this guideline, the Bank is required to meet supervisory risk-based TLAC and TLAC leverage ratio targets by November 1, 2021. As of September 2018, the targets were 23.0% of RWA for the risk-based TLAC ratio, inclusive of the 1.50% DSB effective at that time, and 6.75% for the TLAC leverage ratio. As a result of the June 17, 2021 OSFI announcement related to the increase in the DSB, the Bank will be required to meet a risk-based TLAC target ratio of 24.0% of RWA, inclusive of the 2.50% DSB, by November 1, 2021. Further changes to the DSB will result in corresponding changes to the risk-based TLAC target ratio.
In the second quarter of 2020, OSFI introduced a number of measures to support D-SIBs’ ability to supply credit to the economy during an expected period of disruption related to COVID-19 and market conditions which are described in the “OSFI’s Capital Requirements under Basel III” section of Bank’s 2020 Annual Report, with further announcements and measures noted below.
On January 27, 2021, OSFI published guidance on the treatment of new loans to businesses through the Government of Canada’s HASCAP, announced on January 26, 2021. Under the program, the Government mandated the BDC to set up the HASCAP loan guarantee program. HASCAP loans are treated as sovereign exposures based on the BDC guarantee and the relevant risk weight applied under OSFI’s CAR guideline. The entire amount of the loan is included in the lender’s leverage ratio calculation. The Bank began originating loans under the HASCAP program in the second quarter of 2021.
On March 16, 2021, OSFI announced the expiration, effective May 1, 2021, of the temporary reduction in the stressed Value-at-Risk (VaR) multiplier, that was announced on March 27, 2020.
Beginning April 9, 2020, OSFI allowed Deposit-Taking Institutions to temporarily exclude sovereign-issued securities that qualify as High-Quality Liquid Assets (HQLA) and central bank reserves under the Liquidity Adequacy Requirements (LAR) Guideline from the leverage ratio measure. On August 12, 2021, OSFI confirmed that the exclusion of sovereign-issued securities will not extend past December 31, 2021. Central bank reserves will continue to be excluded from the leverage ratio exposure measure until further notice.
TD BANK GROUP • THIRD QUARTER 2021 • REPORT TO SHAREHOLDERS Page 26
The following table provides details of TD’s regulatory capital position.
TABLE 24: CAPITAL STRUCTURE AND RATIOS – Basel III (millions of Canadian dollars, except as noted) As at
July 31 October 31 July 31 2021 2020 2020 Common Equity Tier 1 Capital Common shares plus related contributed surplus $ 22,879 $ 22,570 $ 22,429
Retained earnings 61,167 53,845 49,934 Accumulated other comprehensive income 9,164 13,437 14,307 Common Equity Tier 1 Capital before regulatory adjustments 93,210 89,852 86,670
Common Equity Tier 1 Capital regulatory adjustments Goodwill (net of related tax liability)1 (16,211) (17,019) (20,001) Intangibles (net of related tax liability) (2,022) (2,030) (2,138) Deferred tax assets excluding those arising from temporary differences (122) (177) (207) Cash flow hedge reserve (3,052) (3,720) (4,276) Shortfall of provisions to expected losses – – – Gains and losses due to changes in own credit risk on fair valued liabilities (90) (57) (62) Defined benefit pension fund net assets (net of related tax liability) (246) (9) (13) Investment in own shares (2) (36) (87) Non-significant investments in the capital of banking, financial, and insurance entities, net of eligible
short positions (amount above 10% threshold)2 (5,163) (6,321) – Significant investments in the common stock of banking, financial, and insurance entities
that are outside the scope of regulatory consolidation, net of eligible short positions (amount above 10% threshold)2 – – (2,197) Other deductions or regulatory adjustments to CET1 as determined by OSFI3 960 2,133 1,857 Total regulatory adjustments to Common Equity Tier 1 Capital (25,948) (27,236) (27,124) Common Equity Tier 1 Capital 67,262 62,616 59,546
Additional Tier 1 Capital instruments Directly issued qualifying Additional Tier 1 instruments plus stock surplus 6,697 5,647 5,796 Directly issued capital instruments subject to phase out from Additional Tier 1 440 1,190 1,193 Additional Tier 1 instruments issued by subsidiaries and held by third parties – – – Additional Tier 1 Capital instruments before regulatory adjustments 7,137 6,837 6,989
Additional Tier 1 Capital instruments regulatory adjustments
Non-significant investments in the capital of banking, financial, and insurance entities, net of eligible short positions (amount above 10% threshold) (10) (12) – Significant investments in the capital of banking, financial, and insurance entities that are outside
the scope of regulatory consolidation, net of eligible short positions (350) (350) (350) Total regulatory adjustments to Additional Tier 1 Capital (360) (362) (350) Additional Tier 1 Capital 6,777 6,475 6,639 Tier 1 Capital 74,039 69,091 66,185
Tier 2 Capital instruments and provisions Directly issued qualifying Tier 2 instruments plus related stock surplus 11,103 11,277 12,276 Directly issued capital instruments subject to phase out from Tier 2 120 160 160 Collective allowances 1,569 509 646 Tier 2 Capital before regulatory adjustments 12,792 11,946 13,082
Tier 2 regulatory adjustments Investments in own Tier 2 instruments – – – Non-significant investments in the capital of banking, financial, and insurance entities, net of eligible
short positions (amount above 10% threshold)4 (369) (856) – Non-significant investments in the other TLAC-eligible instruments issued by G-SIBs and Canadian
D-SIBs, where the institution does not own more than 10% of the issued common share capital of the entity: amount previously designated for the 5% threshold but that no longer meets the conditions (101) – – Significant investments in the capital of banking, financial, and insurance entities that are outside
the scope of regulatory consolidation, net of eligible short positions (160) (160) (160) Total regulatory adjustments to Tier 2 Capital (630) (1,016) (160) Tier 2 Capital 12,162 10,930 12,922 Total Capital $ 86,201 $ 80,021 $ 79,107
Risk-weighted assets $ 465,453 $ 478,909 $ 478,117
Capital Ratios and Multiples5
Common Equity Tier 1 Capital (as percentage of risk-weighted assets) 14.5 % 13.1 % 12.5 % Tier 1 Capital (as percentage of risk-weighted assets) 15.9 14.4 13.8 Total Capital (as percentage of risk-weighted assets) 18.5 16.7 16.5 Leverage ratio6 4.8 4.5 4.4
1 As of the fourth quarter of 2020, goodwill deduction decreased due to the sale of the investment in TD Ameritrade.
2 As of the fourth quarter of 2020, significant investment deduction was eliminated due to the sale of the investment in TD Ameritrade and the non-significant investment deduction increased due to the investment in Schwab.
3 Represents ECL transitional arrangements provided by OSFI. Refer to the “OSFI’s Capital Requirements under Basel III” within the “Capital Position” section of the Bank’s 2020 Annual Report.
4 Includes other TLAC-eligible instruments issued by G-SIBs and Canadian D-SIBs that are outside the scope of regulatory consolidation, where the institution does not own more than 10% of the issued common share capital of the entity.
5 The CET1, Tier 1, Total Capital and Leverage ratios excluding the ECL transitional arrangements are 14.2%, 15.7%, 18.5%, and 4.7%, respectively. 6 The Leverage ratio is calculated as Tier 1 Capital divided by leverage exposure, as defined in the “Regulatory Capital” section of this document.
TD BANK GROUP • THIRD QUARTER 2021 • REPORT TO SHAREHOLDERS Page 27
As at July 31, 2021, the Bank’s CET1, Tier 1, and Total Capital ratios were 14.5%, 15.9%, and 18.5%, respectively. The increase in the Bank’s CET1 Capital ratio from 13.1% as at October 31, 2020 was primarily from organic growth and actuarial gains on employee benefit plans (net), partially offset by the reduction in the scaling factor related to OSFI’s transition arrangements for ECL provisioning, from 70% in fiscal 2020 to 50% in fiscal 2021, and acquisitions during the quarter. As at July 31, 2021, the Bank’s Leverage ratio was 4.8%, compared with 4.5%, as at October 31, 2020. The Leverage ratio increased primarily reflecting organic growth and the impact of foreign exchange, partially offset by exposure growth primarily in the Canadian Retail segment. Future Regulatory Capital Developments Future regulatory capital developments, in addition to those described in the “Future Regulatory Capital Developments” section of the Bank’s 2020 Annual Report, are noted below.
On November 26, 2020, the BCBS published a technical amendment for capital requirements for non-performing loan securitizations. The amendment includes removal of the option to use the foundation internal risk-based parameters as inputs for the internal ratings-based approach (SEC-IRBA), a 100% risk weight floor for exposures to securitizations that are risk weighted under SEC-IRBA or the standardized approach, and guidance on risk weights for certain senior tranches of securitizations. The amendment is scheduled to be implemented no later than January 1, 2023.
On March 11, 2021, OSFI released a public consultation on proposed regulatory changes for the final round of Basel III reforms to its capital, leverage, and related disclosure guidelines for banks. OSFI’s proposals are largely in line with the international standards set by the BCBS adapted to reflect domestic market considerations. The revised guidelines will be implemented in the first quarter of 2023, with the exception of the revised CAR guideline chapters relating to credit valuation adjustment risk and market risk that will be effective in the first quarter of 2024. On June 18, 2021, OSFI published a public consultation on the proposed management of operational risk capital data for institutions required to use the Basel III Standardized Approach for Operational Risk capital. Also, on June 18, 2021, OSFI launched a consultation on proposed changes to the treatment of credit valuation adjustments and market risk hedges of other valuation adjustments of over-the-counter (OTC) derivatives. These two proposed regulatory changes are a continuation of OSFI’s public consultation on the Basel III reforms.
On August 13, 2021, OSFI published final revisions to its Advisory on G-SIBs – Public Disclosure Requirements. The revised advisory addresses changes to the disclosure requirements included in the updated G-SIBs assessment methodology that was published by the BCBS in July 2018 and takes effect for the 2022 G-SIB assessment exercise.
TABLE 25: EQUITY AND OTHER SECURITIES
(millions of shares/units, except as noted) As at July 31, 2021 October 31, 2020 Number of Number of shares/units shares/units Common shares outstanding 1,822.5 1,816.1 Treasury shares – common (2.5) (0.5) Total common shares 1,820.0 1,815.6 Stock options Vested 4.7 5.4 Non-vested 7.8 7.7 Preferred shares – Class A Series 1 20.0 20.0 Series 3 20.0 20.0 Series 5 20.0 20.0 Series 7 14.0 14.0 Series 9 8.0 8.0 Series 121 – 28.0 Series 14 40.0 40.0 Series 16 14.0 14.0 Series 18 14.0 14.0 Series 20 16.0 16.0 Series 22 14.0 14.0 Series 24 18.0 18.0 Total preferred shares – equity 198.0 226.0 Treasury shares – preferred (0.2) (0.1) Total preferred shares 197.8 225.9 Limited Recourse Capital Notes Series 12 1.8 – Debt issued by TD Capital Trust IV: (thousands of units)
TD Capital Trust IV Notes – Series 23 450.0 450.0 TD Capital Trust IV Notes – Series 34 – 750.0 1 On April 30, 2021, the Bank redeemed all of its 28 million outstanding Non-Cumulative 5-Year Rate Reset Class A First Preferred Shares NVCC, Series 12 (“Series 12 Shares”), at a
redemption price of $25.00 per Series 12 Share, for a total redemption cost of $700 million. 2 For Limited Recourse Capital Notes, the number of shares/units represents the number of notes issued. 3 On February 27, 2020, the Bank announced that, subject to regulatory approval, it expects to exercise a regulatory event redemption right in its fiscal 2022 year in respect of the
TD Capital Trust IV Notes – Series 2 outstanding at that time, meaning that this redemption right could occur as early as November 1, 2021. The Bank’s expectations regarding this redemption are based on a number of factors and assumptions, including the Bank’s current and expected future capital position and market conditions, which are subject to change and may result in a change in the Bank’s expectations regarding the redemption.
4 On June 30, 2021, TD Capital Trust IV redeemed all of the outstanding TD Capital Trust IV Notes – Series 3.
Limited Recourse Capital Notes On July 29, 2021, the Bank issued $1,750 million of Limited Recourse Capital Notes NVCC, Series 1 (the “LRCNs”) with recourse limited to assets held in a trust consolidated by the Bank (the “Limited Recourse Trust”). The Limited Recourse Trust’s assets consist of $1,750 million of the Bank’s Non-Cumulative 5-Year Fixed Rate Reset Preferred Shares NVCC, Series 26 (“Preferred Shares Series 26”) at a price of $1,000 per share, issued concurrently with the LRCNs. The Preferred Shares Series 26 are eliminated on the Bank’s consolidated financial statements.
The LRCNs bear interest at a fixed rate of 3.6% per annum, payable semi-annually, until October 31, 2026 and thereafter at a rate per annum, reset every five years, equal to the prevailing 5-year Government of Canada Yield plus 2.747% until maturity on October 31, 2081. The Bank may redeem the LRCNs, in whole or in part, during the period from October 1 to and including October 31, commencing in 2026 and every five years thereafter, with the prior written approval of OSFI.
TD BANK GROUP • THIRD QUARTER 2021 • REPORT TO SHAREHOLDERS Page 28
In the event of (i) non-payment of interest following any interest payment date, (ii) non-payment of the redemption price in case of a redemption of the LRCNs, (iii) non-payment of principal plus accrued and unpaid interest at the maturity of the LRCNs, (iv) an event of default on the LRCNs, or (v) a Trigger Event, the recourse of each LRCN holder will be limited to that holder’s pro rata share of the Limited Recourse Trust’s assets. A Trigger Event is defined as an event where OSFI deems the Bank non-viable or a federal or provincial government of Canada publicly announces that the Bank has accepted or agreed to accept a capital injection or equivalent support from it.
The LRCNs, by virtue of the recourse to the Preferred Shares Series 26, include standard NVCC provisions necessary for them to qualify as Additional Tier 1 Capital under OSFI’s Capital Adequacy Requirements guideline. NVCC provisions require the conversion of the instrument into a variable number of common shares upon the occurrence of a Trigger Event. In such an event, each Preferred Share Series 26 held in the Limited Recourse Trust will automatically and immediately be converted into a variable number of common shares which will be delivered to LRCN holders in satisfaction of the principal amount of, and accrued and unpaid interest on, the LRCNs. The number of common shares issued will be determined based on the conversion formula set out in the terms of the Preferred Shares Series 26.
The LRCNs are compound instruments with both equity and liability features as payments of interest and principal in cash are made at the Bank’s discretion. Non-payment of interest and principal in cash does not constitute an event of default and will trigger the delivery of Preferred Shares Series 26. The liability component has a nominal value and, therefore, the proceeds received upon issuance have been presented as equity, and any interest payments are accounted for as distributions on other equity instruments. NVCC Provision All series of preferred shares – Class A include NVCC provisions. If a NVCC trigger event were to occur and excluding the preferred shares issued with respect to LRCNs, the maximum number of common shares that could be issued, assuming there are no declared and unpaid dividends on the respective series of preferred shares at the time of conversion, would be 1.0 billion in aggregate.
The LRCNs, by virtue of the recourse to the respective preferred shares, include NVCC provisions. For LRCNs, if a NVCC trigger were to occur, the maximum number of common shares that could be issued, assuming there are no declared and unpaid dividends on the respective series of preferred shares at the time of conversion, would be 350 million in aggregate.
For NVCC subordinated notes and debentures, if a NVCC trigger event were to occur, the maximum number of common shares that could be issued, assuming there is no accrued and unpaid interest on the respective subordinated notes and debentures, would be 3.2 billion in aggregate. The following subordinated debentures contain NVCC provisions: 3.589% subordinated debentures due September 14, 2028, 3.224% subordinated debentures due July 25, 2029, 3.105% subordinated debentures due April 22, 2030, 4.859% subordinated debentures due March 4, 2031, 3.625% subordinated debentures due September 15, 2031, and the 3.06% subordinated debentures due January 26, 2032. Refer to Note 19 of the Bank’s 2020 Annual Consolidated Financial Statements for additional details.
MANAGING RISK EXECUTIVE SUMMARY Growing profitability in financial results based on balanced revenue, expense and capital growth services involves selectively taking and managing risks within the Bank’s risk appetite. The Bank’s goal is to earn a stable and sustainable rate of return for every dollar of risk it takes, while putting significant emphasis on investing in its businesses to meet its future strategic objectives.
The Bank’s businesses and operations are exposed to a broad number of risks that have been identified and defined in the Enterprise Risk Framework. The Bank’s tolerance to those risks is defined in the Enterprise Risk Appetite which has been developed within a comprehensive framework that takes into consideration current conditions in which the Bank operates and the impact that emerging risks will have on TD’s strategy and risk profile. The Bank’s risk appetite states that it takes risks required to build its business, but only if those risks: (1) fit the business strategy, and can be understood and managed; (2) do not expose the enterprise to any significant single loss events; TD does not ‘bet the bank’ on any single acquisition, business, or product; and (3) do not risk harming the TD brand. Each business is responsible for setting and aligning its individual risk appetites with that of the enterprise based on a thorough examination of the specific risks to which it is exposed.
The Bank considers it critical to regularly assess its operating environment and highlight top and emerging risks. These are risks with a potential to have a material effect on the Bank and where the attention of senior leaders is focused due to the potential magnitude or immediacy of their impact.
Risks are identified, discussed, and actioned by senior leaders and reported quarterly to the Risk Committee of the Board and the Board. Specific plans to mitigate top and emerging risks are prepared, monitored, and adjusted as required.
The Bank’s risk governance structure and risk management approach have not substantially changed from that described in the Bank’s 2020 Annual Report. Additional information on risk factors can be found in the 2020 MD&A under the heading “Risk Factors and Management”. For a complete discussion of the risk governance structure and the risk management approach, refer to the “Managing Risk” section in the Bank’s 2020 Annual Report.
The shaded sections of this MD&A represent a discussion relating to market and liquidity risks and form an integral part of the Interim Consolidated Financial Statements for the period ended July 31, 2021. CREDIT RISK Gross credit risk exposure, also referred to as exposure at default (EAD), is the total amount the Bank is exposed to at the time of default of a loan and is measured before counterparty-specific provisions or write-offs. Gross credit risk exposure does not reflect the effects of credit risk mitigation and includes both on-balance sheet and off-balance sheet exposures. On-balance sheet exposures consist primarily of outstanding loans, acceptances, non-trading securities, derivatives, and certain other repo-style transactions. Off-balance sheet exposures consist primarily of undrawn commitments, guarantees, and certain other repo-style transactions.
Gross credit risk exposures for the two approaches the Bank uses to measure credit risk are included in the following table.
TD BANK GROUP • THIRD QUARTER 2021 • REPORT TO SHAREHOLDERS Page 29
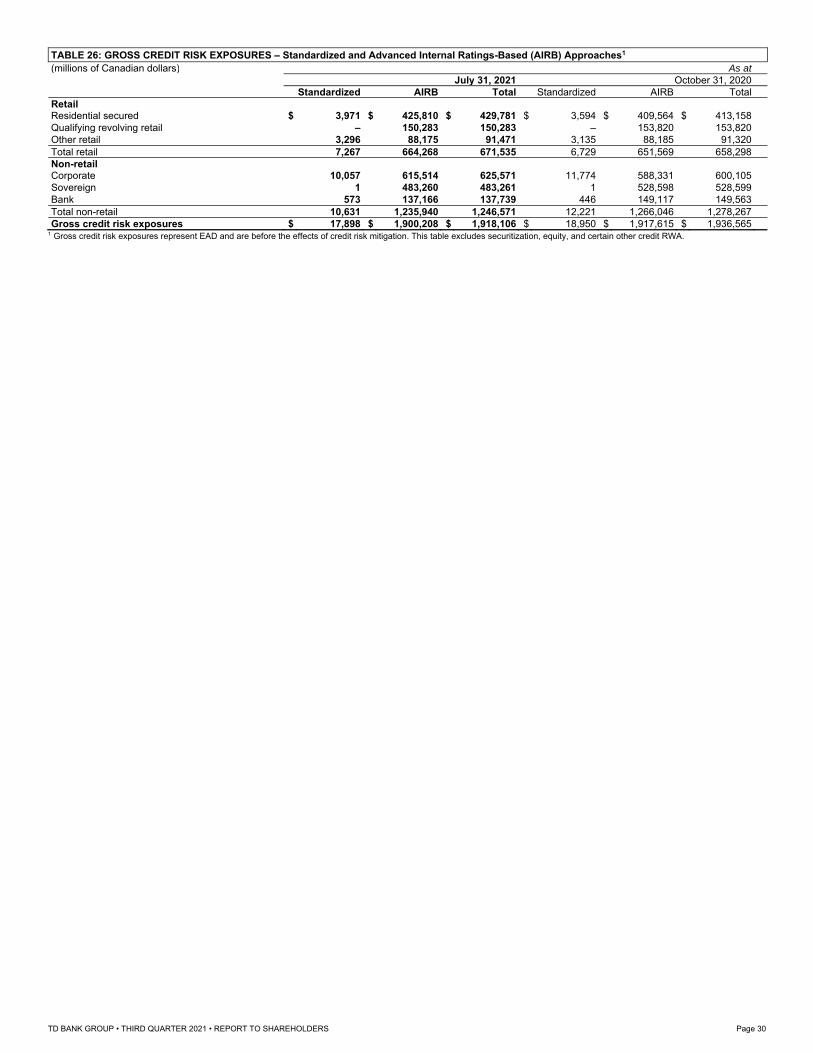
TABLE 26: GROSS CREDIT RISK EXPOSURES – Standardized and Advanced Internal Ratings-Based (AIRB) Approaches1
(millions of Canadian dollars) As at July 31, 2021 October 31, 2020 Standardized AIRB Total Standardized AIRB Total Retail Residential secured $ 3,971 $ 425,810 $ 429,781 $ 3,594 $ 409,564 $ 413,158 Qualifying revolving retail – 150,283 150,283 – 153,820 153,820 Other retail 3,296 88,175 91,471 3,135 88,185 91,320 Total retail 7,267 664,268 671,535 6,729 651,569 658,298 Non-retail Corporate 10,057 615,514 625,571 11,774 588,331 600,105 Sovereign 1 483,260 483,261 1 528,598 528,599 Bank 573 137,166 137,739 446 149,117 149,563 Total non-retail 10,631 1,235,940 1,246,571 12,221 1,266,046 1,278,267 Gross credit risk exposures $ 17,898 $ 1,900,208 $ 1,918,106 $ 18,950 $ 1,917,615 $ 1,936,565
1 Gross credit risk exposures represent EAD and are before the effects of credit risk mitigation. This table excludes securitization, equity, and certain other credit RWA.
TD BANK GROUP • THIRD QUARTER 2021 • REPORT TO SHAREHOLDERS Page 30
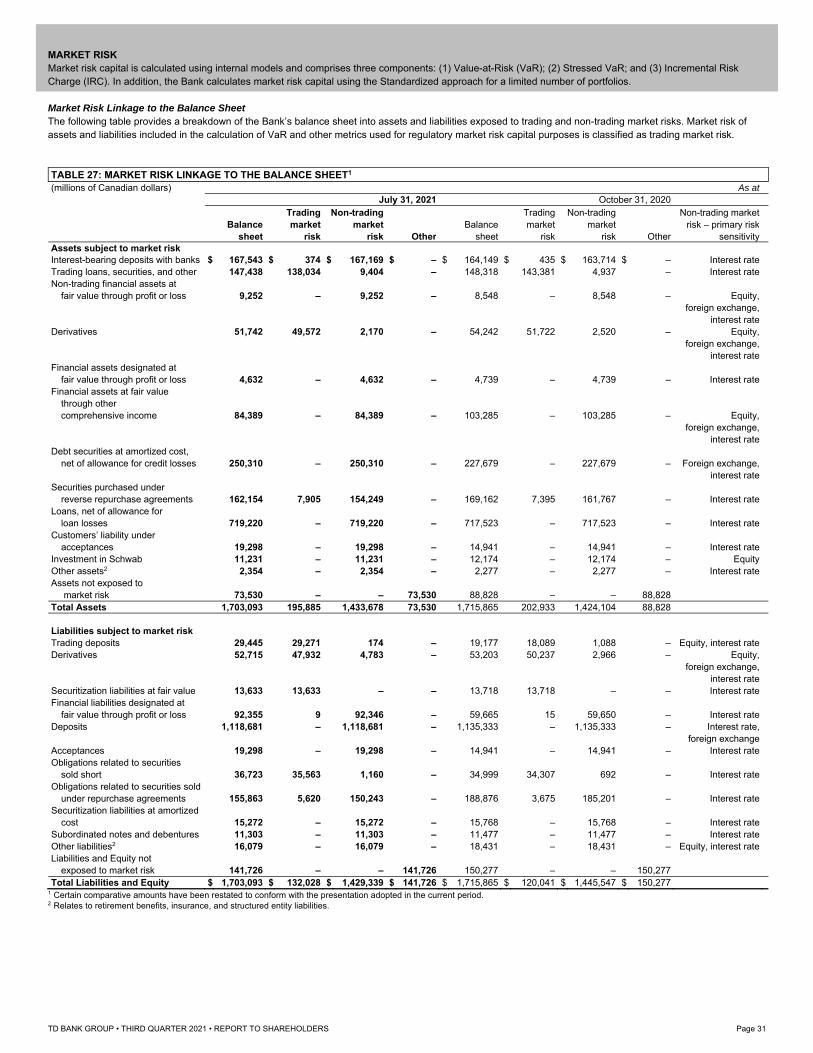
MARKET RISK Market risk capital is calculated using internal models and comprises three components: (1) Value-at-Risk (VaR); (2) Stressed VaR; and (3) Incremental Risk Charge (IRC). In addition, the Bank calculates market risk capital using the Standardized approach for a limited number of portfolios. Market Risk Linkage to the Balance Sheet The following table provides a breakdown of the Bank’s balance sheet into assets and liabilities exposed to trading and non-trading market risks. Market risk of assets and liabilities included in the calculation of VaR and other metrics used for regulatory market risk capital purposes is classified as trading market risk. TABLE 27: MARKET RISK LINKAGE TO THE BALANCE SHEET1 (millions of Canadian dollars) As at
July 31, 2021 October 31, 2020 Trading Non-trading Trading Non-trading Non-trading market Balance market market Balance market market risk – primary risk sheet risk risk Other sheet risk risk Other sensitivity Assets subject to market risk Interest-bearing deposits with banks $ 167,543 $ 374 $ 167,169 $ – $ 164,149 $ 435 $ 163,714 $ – Interest rate Trading loans, securities, and other 147,438 138,034 9,404 – 148,318 143,381 4,937 – Interest rate Non-trading financial assets at
fair value through profit or loss 9,252 – 9,252 – 8,548 – 8,548 – Equity, foreign exchange, interest rate Derivatives 51,742 49,572 2,170 – 54,242 51,722 2,520 – Equity,
foreign exchange, interest rate Financial assets designated at
fair value through profit or loss 4,632 – 4,632 – 4,739 – 4,739 – Interest rate Financial assets at fair value
through other comprehensive income 84,389 – 84,389 – 103,285 – 103,285 – Equity, foreign exchange, interest rate Debt securities at amortized cost,
net of allowance for credit losses 250,310 – 250,310 – 227,679 – 227,679 – Foreign exchange, interest rate Securities purchased under
reverse repurchase agreements 162,154 7,905 154,249 – 169,162 7,395 161,767 – Interest rate Loans, net of allowance for
loan losses 719,220 – 719,220 – 717,523 – 717,523 – Interest rate Customers’ liability under
acceptances 19,298 – 19,298 – 14,941 – 14,941 – Interest rate Investment in Schwab 11,231 – 11,231 – 12,174 – 12,174 – Equity Other assets2 2,354 – 2,354 – 2,277 – 2,277 – Interest rate Assets not exposed to
market risk 73,530 – – 73,530 88,828 – – 88,828 Total Assets 1,703,093 195,885 1,433,678 73,530 1,715,865 202,933 1,424,104 88,828
Liabilities subject to market risk Trading deposits 29,445 29,271 174 – 19,177 18,089 1,088 – Equity, interest rate Derivatives 52,715 47,932 4,783 – 53,203 50,237 2,966 – Equity,
foreign exchange, interest rate Securitization liabilities at fair value 13,633 13,633 – – 13,718 13,718 – – Interest rate Financial liabilities designated at
fair value through profit or loss 92,355 9 92,346 – 59,665 15 59,650 – Interest rate Deposits 1,118,681 – 1,118,681 – 1,135,333 – 1,135,333 – Interest rate,
foreign exchange Acceptances 19,298 – 19,298 – 14,941 – 14,941 – Interest rate Obligations related to securities
sold short 36,723 35,563 1,160 – 34,999 34,307 692 – Interest rate Obligations related to securities sold
under repurchase agreements 155,863 5,620 150,243 – 188,876 3,675 185,201 – Interest rate Securitization liabilities at amortized
cost 15,272 – 15,272 – 15,768 – 15,768 – Interest rate Subordinated notes and debentures 11,303 – 11,303 – 11,477 – 11,477 – Interest rate Other liabilities2 16,079 – 16,079 – 18,431 – 18,431 – Equity, interest rate Liabilities and Equity not
exposed to market risk 141,726 – – 141,726 150,277 – – 150,277 Total Liabilities and Equity $ 1,703,093 $ 132,028 $ 1,429,339 $ 141,726 $ 1,715,865 $ 120,041 $ 1,445,547 $ 150,277
1 Certain comparative amounts have been restated to conform with the presentation adopted in the current period. 2 Relates to retirement benefits, insurance, and structured entity liabilities.
TD BANK GROUP • THIRD QUARTER 2021 • REPORT TO SHAREHOLDERS Page 31
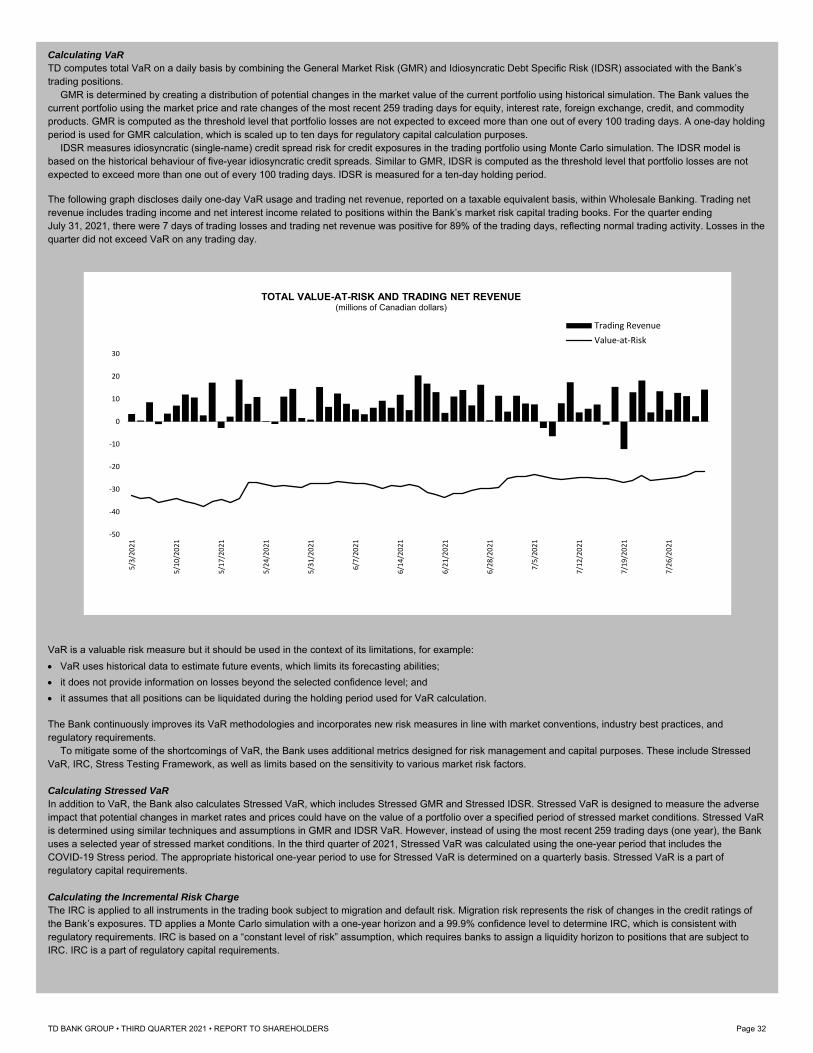
Calculating VaR TD computes total VaR on a daily basis by combining the General Market Risk (GMR) and Idiosyncratic Debt Specific Risk (IDSR) associated with the Bank’s trading positions.
GMR is determined by creating a distribution of potential changes in the market value of the current portfolio using historical simulation. The Bank values the current portfolio using the market price and rate changes of the most recent 259 trading days for equity, interest rate, foreign exchange, credit, and commodity products. GMR is computed as the threshold level that portfolio losses are not expected to exceed more than one out of every 100 trading days. A one-day holding period is used for GMR calculation, which is scaled up to ten days for regulatory capital calculation purposes.
IDSR measures idiosyncratic (single-name) credit spread risk for credit exposures in the trading portfolio using Monte Carlo simulation. The IDSR model is based on the historical behaviour of five-year idiosyncratic credit spreads. Similar to GMR, IDSR is computed as the threshold level that portfolio losses are not expected to exceed more than one out of every 100 trading days. IDSR is measured for a ten-day holding period. The following graph discloses daily one-day VaR usage and trading net revenue, reported on a taxable equivalent basis, within Wholesale Banking. Trading net revenue includes trading income and net interest income related to positions within the Bank’s market risk capital trading books. For the quarter ending July 31, 2021, there were 7 days of trading losses and trading net revenue was positive for 89% of the trading days, reflecting normal trading activity. Losses in the quarter did not exceed VaR on any trading day.
VaR is a valuable risk measure but it should be used in the context of its limitations, for example:
VaR uses historical data to estimate future events, which limits its forecasting abilities;
it does not provide information on losses beyond the selected confidence level; and
it assumes that all positions can be liquidated during the holding period used for VaR calculation. The Bank continuously improves its VaR methodologies and incorporates new risk measures in line with market conventions, industry best practices, and regulatory requirements.
To mitigate some of the shortcomings of VaR, the Bank uses additional metrics designed for risk management and capital purposes. These include Stressed VaR, IRC, Stress Testing Framework, as well as limits based on the sensitivity to various market risk factors. Calculating Stressed VaR In addition to VaR, the Bank also calculates Stressed VaR, which includes Stressed GMR and Stressed IDSR. Stressed VaR is designed to measure the adverse impact that potential changes in market rates and prices could have on the value of a portfolio over a specified period of stressed market conditions. Stressed VaR is determined using similar techniques and assumptions in GMR and IDSR VaR. However, instead of using the most recent 259 trading days (one year), the Bank uses a selected year of stressed market conditions. In the third quarter of 2021, Stressed VaR was calculated using the one-year period that includes the COVID-19 Stress period. The appropriate historical one-year period to use for Stressed VaR is determined on a quarterly basis. Stressed VaR is a part of regulatory capital requirements. Calculating the Incremental Risk Charge The IRC is applied to all instruments in the trading book subject to migration and default risk. Migration risk represents the risk of changes in the credit ratings of the Bank’s exposures. TD applies a Monte Carlo simulation with a one-year horizon and a 99.9% confidence level to determine IRC, which is consistent with regulatory requirements. IRC is based on a “constant level of risk” assumption, which requires banks to assign a liquidity horizon to positions that are subject to IRC. IRC is a part of regulatory capital requirements.
‐50
‐40
‐30
‐20
‐10
0
10
20
30
5/3/2021
5/10/2021
5/17/2021
5/24/2021
5/31/2021
6/7/2021
6/14/2021
6/21/2021
6/28/2021
7/5/2021
7/12/2021
7/19/2021
7/26/2021
TOTAL VALUE-AT-RISK AND TRADING NET REVENUE(millions of Canadian dollars)
Trading Revenue
Value‐at‐Risk
TD BANK GROUP • THIRD QUARTER 2021 • REPORT TO SHAREHOLDERS Page 32
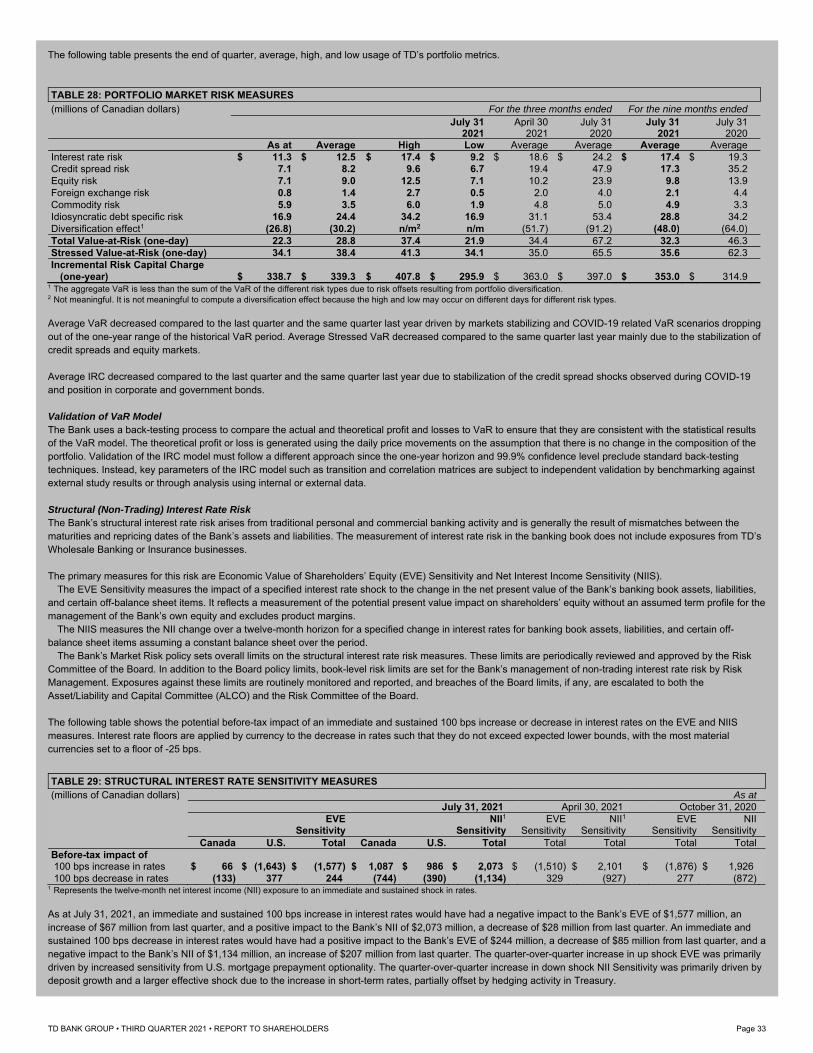
The following table presents the end of quarter, average, high, and low usage of TD’s portfolio metrics. TABLE 28: PORTFOLIO MARKET RISK MEASURES
(millions of Canadian dollars) For the three months ended For the nine months ended July 31 April 30 July 31 July 31 July 31 2021 2021 2020 2021 2020 As at Average High Low Average Average Average Average Interest rate risk $ 11.3 $ 12.5 $ 17.4 $ 9.2 $ 18.6 $ 24.2 $ 17.4 $ 19.3 Credit spread risk 7.1 8.2 9.6 6.7 19.4 47.9 17.3 35.2 Equity risk 7.1 9.0 12.5 7.1 10.2 23.9 9.8 13.9 Foreign exchange risk 0.8 1.4 2.7 0.5 2.0 4.0 2.1 4.4 Commodity risk 5.9 3.5 6.0 1.9 4.8 5.0 4.9 3.3 Idiosyncratic debt specific risk 16.9 24.4 34.2 16.9 31.1 53.4 28.8 34.2 Diversification effect1 (26.8) (30.2) n/m2 n/m (51.7) (91.2) (48.0) (64.0) Total Value-at-Risk (one-day) 22.3 28.8 37.4 21.9 34.4 67.2 32.3 46.3 Stressed Value-at-Risk (one-day) 34.1 38.4 41.3 34.1 35.0 65.5 35.6 62.3 Incremental Risk Capital Charge
(one-year) $ 338.7 $ 339.3 $ 407.8 $ 295.9 $ 363.0 $ 397.0 $ 353.0 $ 314.9 1 The aggregate VaR is less than the sum of the VaR of the different risk types due to risk offsets resulting from portfolio diversification. 2 Not meaningful. It is not meaningful to compute a diversification effect because the high and low may occur on different days for different risk types. Average VaR decreased compared to the last quarter and the same quarter last year driven by markets stabilizing and COVID-19 related VaR scenarios dropping out of the one-year range of the historical VaR period. Average Stressed VaR decreased compared to the same quarter last year mainly due to the stabilization of credit spreads and equity markets. Average IRC decreased compared to the last quarter and the same quarter last year due to stabilization of the credit spread shocks observed during COVID-19 and position in corporate and government bonds. Validation of VaR Model The Bank uses a back-testing process to compare the actual and theoretical profit and losses to VaR to ensure that they are consistent with the statistical results of the VaR model. The theoretical profit or loss is generated using the daily price movements on the assumption that there is no change in the composition of the portfolio. Validation of the IRC model must follow a different approach since the one-year horizon and 99.9% confidence level preclude standard back-testing techniques. Instead, key parameters of the IRC model such as transition and correlation matrices are subject to independent validation by benchmarking against external study results or through analysis using internal or external data. Structural (Non-Trading) Interest Rate Risk The Bank’s structural interest rate risk arises from traditional personal and commercial banking activity and is generally the result of mismatches between the maturities and repricing dates of the Bank’s assets and liabilities. The measurement of interest rate risk in the banking book does not include exposures from TD’s Wholesale Banking or Insurance businesses. The primary measures for this risk are Economic Value of Shareholders’ Equity (EVE) Sensitivity and Net Interest Income Sensitivity (NIIS).
The EVE Sensitivity measures the impact of a specified interest rate shock to the change in the net present value of the Bank’s banking book assets, liabilities, and certain off-balance sheet items. It reflects a measurement of the potential present value impact on shareholders’ equity without an assumed term profile for the management of the Bank’s own equity and excludes product margins.
The NIIS measures the NII change over a twelve-month horizon for a specified change in interest rates for banking book assets, liabilities, and certain off-balance sheet items assuming a constant balance sheet over the period.
The Bank’s Market Risk policy sets overall limits on the structural interest rate risk measures. These limits are periodically reviewed and approved by the Risk Committee of the Board. In addition to the Board policy limits, book-level risk limits are set for the Bank’s management of non-trading interest rate risk by Risk Management. Exposures against these limits are routinely monitored and reported, and breaches of the Board limits, if any, are escalated to both the Asset/Liability and Capital Committee (ALCO) and the Risk Committee of the Board. The following table shows the potential before-tax impact of an immediate and sustained 100 bps increase or decrease in interest rates on the EVE and NIIS measures. Interest rate floors are applied by currency to the decrease in rates such that they do not exceed expected lower bounds, with the most material currencies set to a floor of -25 bps.
TABLE 29: STRUCTURAL INTEREST RATE SENSITIVITY MEASURES
(millions of Canadian dollars) As at July 31, 2021 April 30, 2021 October 31, 2020 EVE NII1 EVE NII1 EVE NII Sensitivity Sensitivity Sensitivity Sensitivity Sensitivity Sensitivity Canada U.S. Total Canada U.S. Total Total Total Total Total Before-tax impact of 100 bps increase in rates $ 66 $ (1,643) $ (1,577) $ 1,087 $ 986 $ 2,073 $ (1,510) $ 2,101 $ (1,876) $ 1,926 100 bps decrease in rates (133) 377 244 (744) (390) (1,134) 329 (927) 277 (872)
1 Represents the twelve-month net interest income (NII) exposure to an immediate and sustained shock in rates. As at July 31, 2021, an immediate and sustained 100 bps increase in interest rates would have had a negative impact to the Bank’s EVE of $1,577 million, an increase of $67 million from last quarter, and a positive impact to the Bank’s NII of $2,073 million, a decrease of $28 million from last quarter. An immediate and sustained 100 bps decrease in interest rates would have had a positive impact to the Bank’s EVE of $244 million, a decrease of $85 million from last quarter, and a negative impact to the Bank’s NII of $1,134 million, an increase of $207 million from last quarter. The quarter-over-quarter increase in up shock EVE was primarily driven by increased sensitivity from U.S. mortgage prepayment optionality. The quarter-over-quarter increase in down shock NII Sensitivity was primarily driven by deposit growth and a larger effective shock due to the increase in short-term rates, partially offset by hedging activity in Treasury.
TD BANK GROUP • THIRD QUARTER 2021 • REPORT TO SHAREHOLDERS Page 33
Liquidity Risk Liquidity risk is the risk of having insufficient cash or collateral to meet financial obligations and an inability to, in a timely manner, raise funding or monetize assets at a non-distressed price. Financial obligations can arise from deposit withdrawals, debt maturities, commitments to provide credit or liquidity support, or the need to pledge additional collateral. TD’S LIQUIDITY RISK APPETITE The Bank maintains a prudent and disciplined approach to managing its potential exposure to liquidity risk. The Bank targets a 90-day survival horizon under a combined bank-specific and market-wide stress scenario, and a minimum buffer over regulatory requirements prescribed by the OSFI LAR guidelines. Under the LAR guidelines, Canadian banks are required to maintain a Liquidity Coverage Ratio (LCR) at the minimum of 100% other than during periods of financial stress and to maintain a Net Stable Funding Ratio (NSFR) at the minimum of 100%. The Bank’s funding program emphasizes maximizing deposits as a core source of funding, and having ready access to wholesale funding markets across diversified terms, funding types, and currencies that is designed to ensure low exposure to a sudden contraction of wholesale funding capacity and to minimize structural liquidity gaps. The Bank also maintains a comprehensive contingency funding plan to enhance preparedness for recovery from potential liquidity stress events. The Bank’s strategies and actions comprise an integrated liquidity risk management program that is designed to ensure low exposure to liquidity risk and compliance with regulatory requirements. LIQUIDITY RISK MANAGEMENT RESPONSIBILITY The Bank’s ALCO oversees the Bank’s liquidity risk management program. It ensures there are effective management structures and practices in place to properly measure and manage liquidity risk. The Global Liquidity & Funding Committee, a subcommittee of the ALCO comprised of senior management from Treasury and Balance Sheet Management (TBSM), Risk Management and Wholesale Banking, identifies and monitors the Bank’s liquidity risks. The management of liquidity risk is the responsibility of the Head of TBSM, while oversight and challenge is provided by the ALCO and independently by Risk Management. The Risk Committee of the Board regularly reviews the Bank’s liquidity position and approves the Bank’s Liquidity Risk Management Framework bi-annually and the related policies annually.
The Bank has established TDGUS as TD’s U.S. Intermediate Holding Company (IHC), as well as a Combined U.S. Operations (CUSO) reporting unit that consists of the IHC and TD’s U.S. branch and agency network. Both TDGUS and CUSO are managed to the U.S. Enhanced Prudential Standards liquidity requirements in addition to the Bank’s liquidity management framework.
The Bank’s liquidity risk appetite and liquidity risk management approach have not substantially changed from that described in the Bank’s 2020 Annual Report. For a complete discussion of liquidity risk, refer to the “Liquidity Risk” section in the Bank’s 2020 Annual Report. Liquid assets The unencumbered liquid assets the Bank holds to meet its liquidity requirements must be high-quality securities that the Bank believes can be monetized quickly in stress conditions with minimum loss in market value. The liquidity value of unencumbered liquid assets considers estimated market or trading depths, settlement timing, and/or other identified impediments to potential sale or pledging. Overall, the Bank expects any reduction in market value of its liquid asset portfolio to be modest given the underlying high credit quality and demonstrated liquidity.
Assets held by the Bank to meet liquidity requirements are summarized in the following tables. The tables do not include assets held within the Bank’s insurance businesses as these are used to support insurance-specific liabilities and capital requirements.
TD BANK GROUP • THIRD QUARTER 2021 • REPORT TO SHAREHOLDERS Page 34
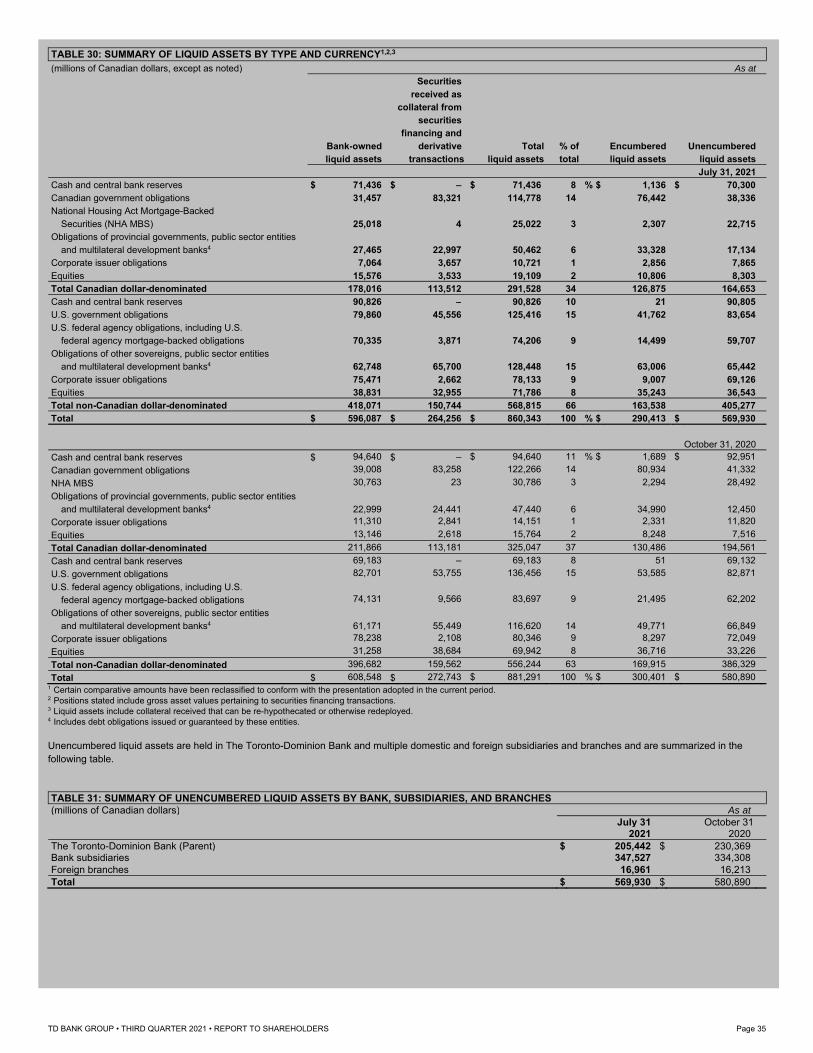
TABLE 30: SUMMARY OF LIQUID ASSETS BY TYPE AND CURRENCY1,2,3 (millions of Canadian dollars, except as noted) As at
Securities received as collateral from securities financing and Bank-owned derivative Total % of Encumbered Unencumbered liquid assets transactions liquid assets total liquid assets liquid assets July 31, 2021 Cash and central bank reserves $ 71,436 $ – $ 71,436 8 % $ 1,136 $ 70,300 Canadian government obligations 31,457 83,321 114,778 14 76,442 38,336 National Housing Act Mortgage-Backed
Securities (NHA MBS) 25,018 4 25,022 3 2,307 22,715 Obligations of provincial governments, public sector entities
and multilateral development banks4 27,465 22,997 50,462 6 33,328 17,134 Corporate issuer obligations 7,064 3,657 10,721 1 2,856 7,865 Equities 15,576 3,533 19,109 2 10,806 8,303 Total Canadian dollar-denominated 178,016 113,512 291,528 34 126,875 164,653 Cash and central bank reserves 90,826 – 90,826 10 21 90,805 U.S. government obligations 79,860 45,556 125,416 15 41,762 83,654 U.S. federal agency obligations, including U.S.
federal agency mortgage-backed obligations 70,335 3,871 74,206 9 14,499 59,707 Obligations of other sovereigns, public sector entities
and multilateral development banks4 62,748 65,700 128,448 15 63,006 65,442 Corporate issuer obligations 75,471 2,662 78,133 9 9,007 69,126 Equities 38,831 32,955 71,786 8 35,243 36,543 Total non-Canadian dollar-denominated 418,071 150,744 568,815 66 163,538 405,277 Total $ 596,087 $ 264,256 $ 860,343 100 % $ 290,413 $ 569,930
October 31, 2020 Cash and central bank reserves $ 94,640 $ – $ 94,640 11 % $ 1,689 $ 92,951
Canadian government obligations 39,008 83,258 122,266 14 80,934 41,332
NHA MBS 30,763 23 30,786 3 2,294 28,492
Obligations of provincial governments, public sector entities and multilateral development banks4 22,999 24,441 47,440 6 34,990 12,450 Corporate issuer obligations 11,310 2,841 14,151 1 2,331 11,820
Equities 13,146 2,618 15,764 2 8,248 7,516
Total Canadian dollar-denominated 211,866 113,181 325,047 37 130,486 194,561
Cash and central bank reserves 69,183 – 69,183 8 51 69,132
U.S. government obligations 82,701 53,755 136,456 15 53,585 82,871
U.S. federal agency obligations, including U.S. federal agency mortgage-backed obligations 74,131 9,566 83,697 9 21,495 62,202
Obligations of other sovereigns, public sector entities and multilateral development banks4 61,171 55,449 116,620 14 49,771 66,849 Corporate issuer obligations 78,238 2,108 80,346 9 8,297 72,049
Equities 31,258 38,684 69,942 8 36,716 33,226
Total non-Canadian dollar-denominated 396,682 159,562 556,244 63 169,915 386,329
Total $ 608,548 $ 272,743 $ 881,291 100 % $ 300,401 $ 580,890 1 Certain comparative amounts have been reclassified to conform with the presentation adopted in the current period. 2 Positions stated include gross asset values pertaining to securities financing transactions. 3 Liquid assets include collateral received that can be re-hypothecated or otherwise redeployed. 4 Includes debt obligations issued or guaranteed by these entities. Unencumbered liquid assets are held in The Toronto-Dominion Bank and multiple domestic and foreign subsidiaries and branches and are summarized in the following table. TABLE 31: SUMMARY OF UNENCUMBERED LIQUID ASSETS BY BANK, SUBSIDIARIES, AND BRANCHES (millions of Canadian dollars) As at
July 31 October 31 2021 2020 The Toronto-Dominion Bank (Parent) $ 205,442 $ 230,369 Bank subsidiaries 347,527 334,308 Foreign branches 16,961 16,213 Total $ 569,930 $ 580,890
TD BANK GROUP • THIRD QUARTER 2021 • REPORT TO SHAREHOLDERS Page 35
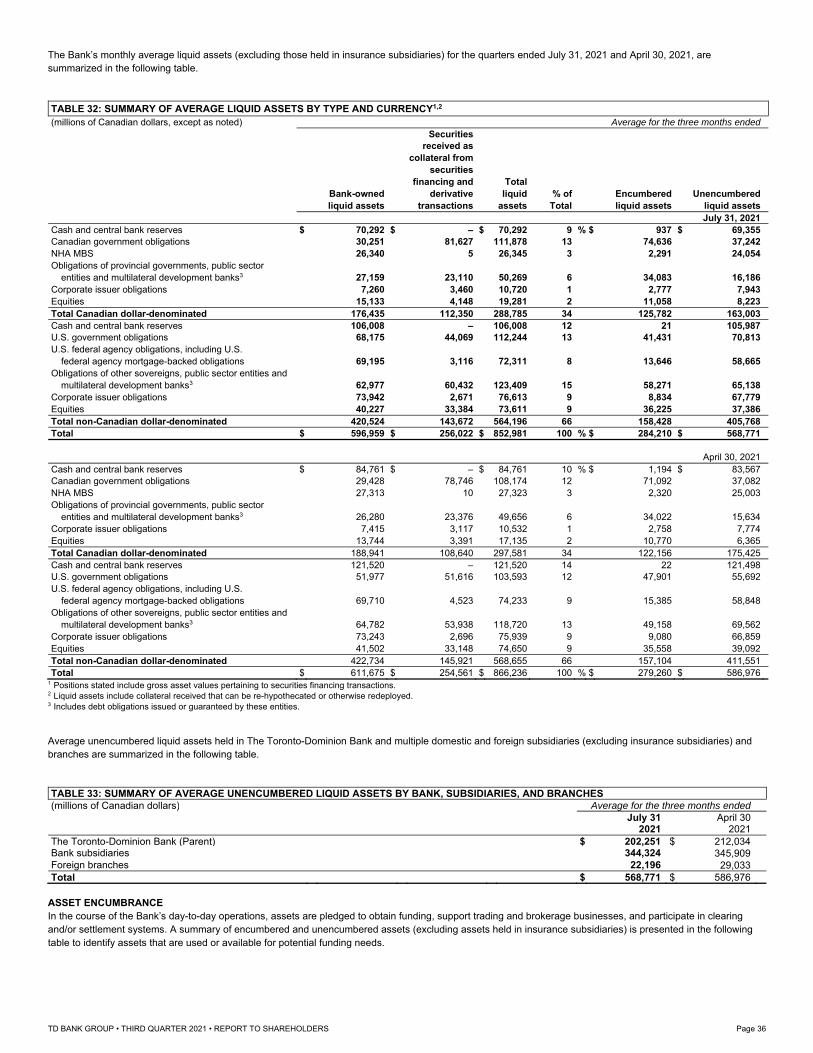
The Bank’s monthly average liquid assets (excluding those held in insurance subsidiaries) for the quarters ended July 31, 2021 and April 30, 2021, are summarized in the following table.
TABLE 32: SUMMARY OF AVERAGE LIQUID ASSETS BY TYPE AND CURRENCY1,2
(millions of Canadian dollars, except as noted) Average for the three months ended Securities received as collateral from securities financing and Total Bank-owned derivative liquid % of Encumbered Unencumbered liquid assets transactions assets Total liquid assets liquid assets July 31, 2021 Cash and central bank reserves $ 70,292 $ – $ 70,292 9 % $ 937 $ 69,355 Canadian government obligations 30,251 81,627 111,878 13 74,636 37,242 NHA MBS 26,340 5 26,345 3 2,291 24,054 Obligations of provincial governments, public sector entities and multilateral development banks3 27,159 23,110 50,269 6 34,083 16,186 Corporate issuer obligations 7,260 3,460 10,720 1 2,777 7,943 Equities 15,133 4,148 19,281 2 11,058 8,223 Total Canadian dollar-denominated 176,435 112,350 288,785 34 125,782 163,003 Cash and central bank reserves 106,008 – 106,008 12 21 105,987 U.S. government obligations 68,175 44,069 112,244 13 41,431 70,813 U.S. federal agency obligations, including U.S. federal agency mortgage-backed obligations 69,195 3,116 72,311 8 13,646 58,665 Obligations of other sovereigns, public sector entities and multilateral development banks3 62,977 60,432 123,409 15 58,271 65,138 Corporate issuer obligations 73,942 2,671 76,613 9 8,834 67,779 Equities 40,227 33,384 73,611 9 36,225 37,386 Total non-Canadian dollar-denominated 420,524 143,672 564,196 66 158,428 405,768 Total $ 596,959 $ 256,022 $ 852,981 100 % $ 284,210 $ 568,771
April 30, 2021 Cash and central bank reserves $ 84,761 $ – $ 84,761 10 % $ 1,194 $ 83,567 Canadian government obligations 29,428 78,746 108,174 12 71,092 37,082 NHA MBS 27,313 10 27,323 3 2,320 25,003 Obligations of provincial governments, public sector entities and multilateral development banks3 26,280 23,376 49,656 6 34,022 15,634 Corporate issuer obligations 7,415 3,117 10,532 1 2,758 7,774 Equities 13,744 3,391 17,135 2 10,770 6,365 Total Canadian dollar-denominated 188,941 108,640 297,581 34 122,156 175,425 Cash and central bank reserves 121,520 – 121,520 14 22 121,498 U.S. government obligations 51,977 51,616 103,593 12 47,901 55,692 U.S. federal agency obligations, including U.S. federal agency mortgage-backed obligations 69,710 4,523 74,233 9 15,385 58,848 Obligations of other sovereigns, public sector entities and multilateral development banks3 64,782 53,938 118,720 13 49,158 69,562 Corporate issuer obligations 73,243 2,696 75,939 9 9,080 66,859 Equities 41,502 33,148 74,650 9 35,558 39,092 Total non-Canadian dollar-denominated 422,734 145,921 568,655 66 157,104 411,551 Total $ 611,675 $ 254,561 $ 866,236 100 % $ 279,260 $ 586,976
1 Positions stated include gross asset values pertaining to securities financing transactions. 2 Liquid assets include collateral received that can be re-hypothecated or otherwise redeployed. 3 Includes debt obligations issued or guaranteed by these entities.
Average unencumbered liquid assets held in The Toronto-Dominion Bank and multiple domestic and foreign subsidiaries (excluding insurance subsidiaries) and branches are summarized in the following table. TABLE 33: SUMMARY OF AVERAGE UNENCUMBERED LIQUID ASSETS BY BANK, SUBSIDIARIES, AND BRANCHES (millions of Canadian dollars) Average for the three months ended
July 31 April 30 2021 2021 The Toronto-Dominion Bank (Parent) $ 202,251 $ 212,034 Bank subsidiaries 344,324 345,909 Foreign branches 22,196 29,033 Total $ 568,771 $ 586,976
ASSET ENCUMBRANCE In the course of the Bank’s day-to-day operations, assets are pledged to obtain funding, support trading and brokerage businesses, and participate in clearing and/or settlement systems. A summary of encumbered and unencumbered assets (excluding assets held in insurance subsidiaries) is presented in the following table to identify assets that are used or available for potential funding needs.
TD BANK GROUP • THIRD QUARTER 2021 • REPORT TO SHAREHOLDERS Page 36
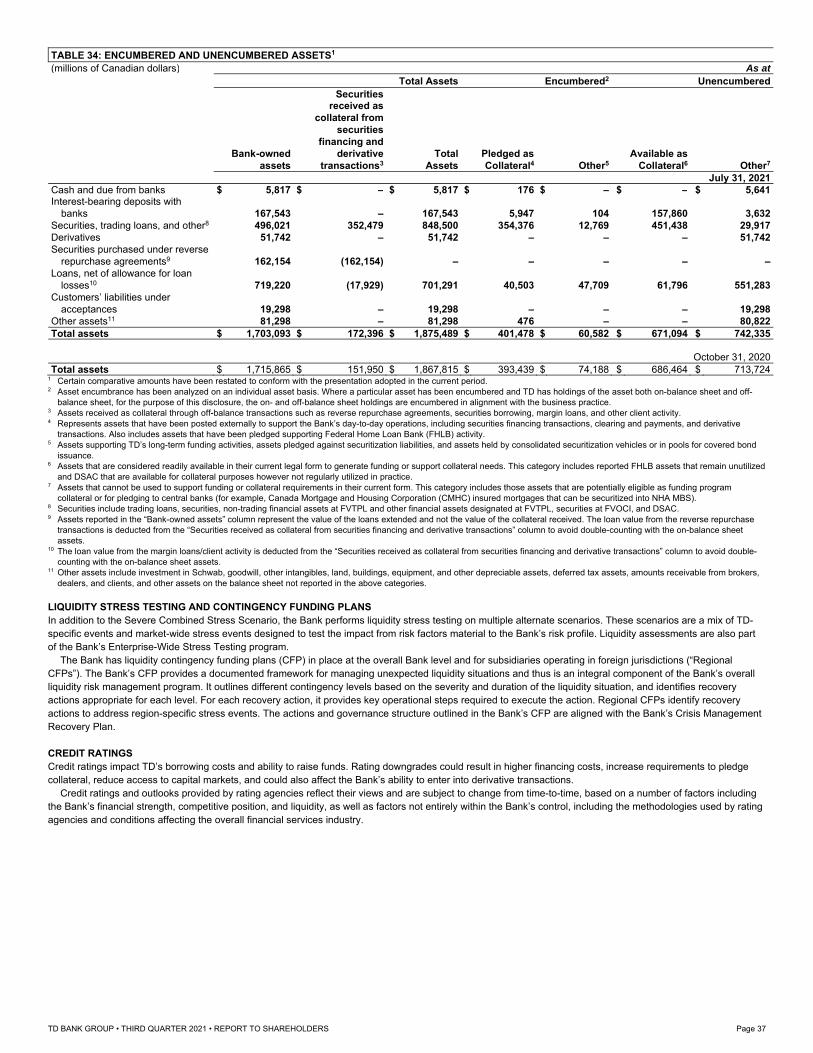
TABLE 34: ENCUMBERED AND UNENCUMBERED ASSETS1 (millions of Canadian dollars) As at
Total Assets Encumbered2 Unencumbered Securities received as collateral from securities financing and Bank-owned derivative Total Pledged as Available as assets transactions3 Assets Collateral4 Other5 Collateral6 Other7 July 31, 2021 Cash and due from banks $ 5,817 $ – $ 5,817 $ 176 $ – $ – $ 5,641 Interest-bearing deposits with
banks 167,543 – 167,543 5,947 104 157,860 3,632 Securities, trading loans, and other8 496,021 352,479 848,500 354,376 12,769 451,438 29,917 Derivatives 51,742 – 51,742 – – – 51,742 Securities purchased under reverse
repurchase agreements9 162,154 (162,154) – – – – – Loans, net of allowance for loan
losses10 719,220 (17,929) 701,291 40,503 47,709 61,796 551,283 Customers’ liabilities under
acceptances 19,298 – 19,298 – – – 19,298 Other assets11 81,298 – 81,298 476 – – 80,822 Total assets $ 1,703,093 $ 172,396 $ 1,875,489 $ 401,478 $ 60,582 $ 671,094 $ 742,335
October 31, 2020 Total assets $ 1,715,865 $ 151,950 $ 1,867,815 $ 393,439 $ 74,188 $ 686,464 $ 713,724
1 Certain comparative amounts have been restated to conform with the presentation adopted in the current period. 2 Asset encumbrance has been analyzed on an individual asset basis. Where a particular asset has been encumbered and TD has holdings of the asset both on-balance sheet and off-
balance sheet, for the purpose of this disclosure, the on- and off-balance sheet holdings are encumbered in alignment with the business practice. 3 Assets received as collateral through off-balance transactions such as reverse repurchase agreements, securities borrowing, margin loans, and other client activity. 4 Represents assets that have been posted externally to support the Bank’s day-to-day operations, including securities financing transactions, clearing and payments, and derivative
transactions. Also includes assets that have been pledged supporting Federal Home Loan Bank (FHLB) activity. 5 Assets supporting TD’s long-term funding activities, assets pledged against securitization liabilities, and assets held by consolidated securitization vehicles or in pools for covered bond
issuance. 6 Assets that are considered readily available in their current legal form to generate funding or support collateral needs. This category includes reported FHLB assets that remain unutilized
and DSAC that are available for collateral purposes however not regularly utilized in practice. 7 Assets that cannot be used to support funding or collateral requirements in their current form. This category includes those assets that are potentially eligible as funding program
collateral or for pledging to central banks (for example, Canada Mortgage and Housing Corporation (CMHC) insured mortgages that can be securitized into NHA MBS). 8 Securities include trading loans, securities, non-trading financial assets at FVTPL and other financial assets designated at FVTPL, securities at FVOCI, and DSAC. 9 Assets reported in the “Bank-owned assets” column represent the value of the loans extended and not the value of the collateral received. The loan value from the reverse repurchase
transactions is deducted from the “Securities received as collateral from securities financing and derivative transactions” column to avoid double-counting with the on-balance sheet assets.
10 The loan value from the margin loans/client activity is deducted from the “Securities received as collateral from securities financing and derivative transactions” column to avoid double-counting with the on-balance sheet assets.
11 Other assets include investment in Schwab, goodwill, other intangibles, land, buildings, equipment, and other depreciable assets, deferred tax assets, amounts receivable from brokers, dealers, and clients, and other assets on the balance sheet not reported in the above categories.
LIQUIDITY STRESS TESTING AND CONTINGENCY FUNDING PLANS In addition to the Severe Combined Stress Scenario, the Bank performs liquidity stress testing on multiple alternate scenarios. These scenarios are a mix of TD-specific events and market-wide stress events designed to test the impact from risk factors material to the Bank’s risk profile. Liquidity assessments are also part of the Bank’s Enterprise-Wide Stress Testing program.
The Bank has liquidity contingency funding plans (CFP) in place at the overall Bank level and for subsidiaries operating in foreign jurisdictions (“Regional CFPs”). The Bank’s CFP provides a documented framework for managing unexpected liquidity situations and thus is an integral component of the Bank’s overall liquidity risk management program. It outlines different contingency levels based on the severity and duration of the liquidity situation, and identifies recovery actions appropriate for each level. For each recovery action, it provides key operational steps required to execute the action. Regional CFPs identify recovery actions to address region-specific stress events. The actions and governance structure outlined in the Bank’s CFP are aligned with the Bank’s Crisis Management Recovery Plan. CREDIT RATINGS Credit ratings impact TD’s borrowing costs and ability to raise funds. Rating downgrades could result in higher financing costs, increase requirements to pledge collateral, reduce access to capital markets, and could also affect the Bank’s ability to enter into derivative transactions.
Credit ratings and outlooks provided by rating agencies reflect their views and are subject to change from time-to-time, based on a number of factors including the Bank’s financial strength, competitive position, and liquidity, as well as factors not entirely within the Bank’s control, including the methodologies used by rating agencies and conditions affecting the overall financial services industry.
TD BANK GROUP • THIRD QUARTER 2021 • REPORT TO SHAREHOLDERS Page 37
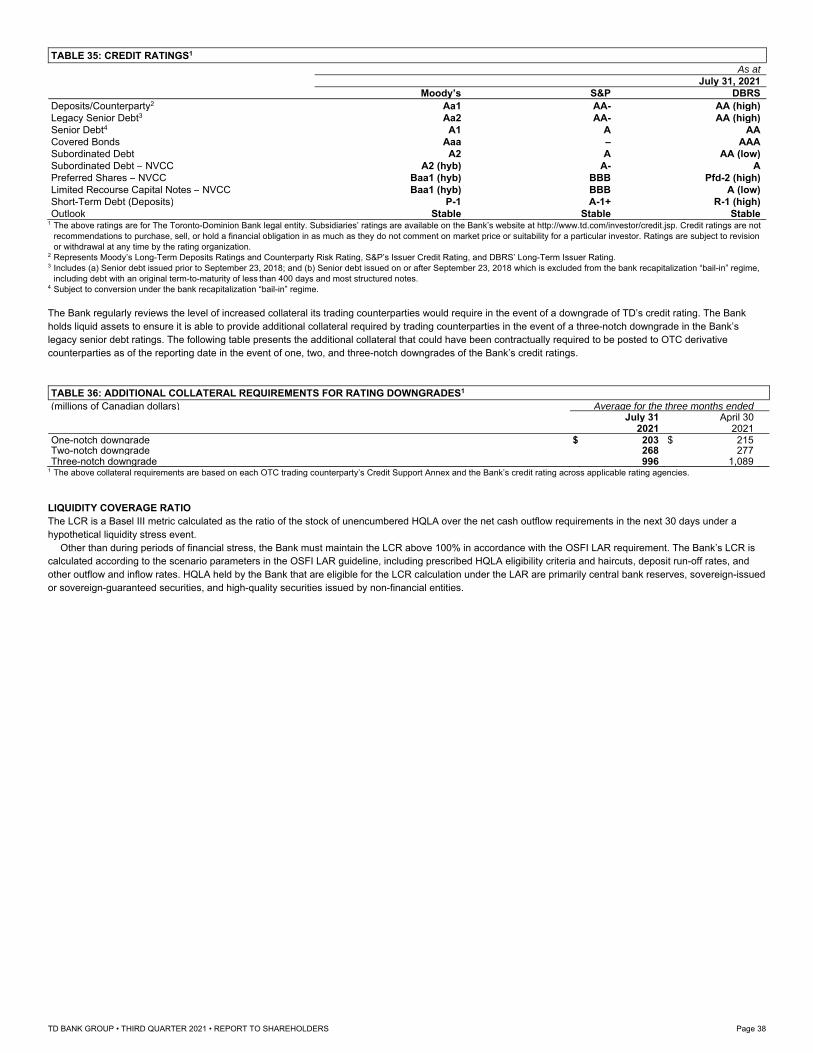
TABLE 35: CREDIT RATINGS1
As at July 31, 2021
Moody’s S&P DBRS Deposits/Counterparty2 Aa1 AA- AA (high) Legacy Senior Debt3 Aa2 AA- AA (high) Senior Debt4 A1 A AA Covered Bonds Aaa – AAA Subordinated Debt A2 A AA (low) Subordinated Debt – NVCC A2 (hyb) A- A Preferred Shares – NVCC Baa1 (hyb) BBB Pfd-2 (high) Limited Recourse Capital Notes – NVCC Baa1 (hyb) BBB A (low) Short-Term Debt (Deposits) P-1 A-1+ R-1 (high) Outlook Stable Stable Stable
1 The above ratings are for The Toronto-Dominion Bank legal entity. Subsidiaries’ ratings are available on the Bank’s website at http://www.td.com/investor/credit.jsp. Credit ratings are not recommendations to purchase, sell, or hold a financial obligation in as much as they do not comment on market price or suitability for a particular investor. Ratings are subject to revision or withdrawal at any time by the rating organization.
2 Represents Moody’s Long-Term Deposits Ratings and Counterparty Risk Rating, S&P’s Issuer Credit Rating, and DBRS’ Long-Term Issuer Rating. 3 Includes (a) Senior debt issued prior to September 23, 2018; and (b) Senior debt issued on or after September 23, 2018 which is excluded from the bank recapitalization “bail-in” regime,
including debt with an original term-to-maturity of less than 400 days and most structured notes.
4 Subject to conversion under the bank recapitalization “bail-in” regime. The Bank regularly reviews the level of increased collateral its trading counterparties would require in the event of a downgrade of TD’s credit rating. The Bank holds liquid assets to ensure it is able to provide additional collateral required by trading counterparties in the event of a three-notch downgrade in the Bank’s legacy senior debt ratings. The following table presents the additional collateral that could have been contractually required to be posted to OTC derivative counterparties as of the reporting date in the event of one, two, and three-notch downgrades of the Bank’s credit ratings. TABLE 36: ADDITIONAL COLLATERAL REQUIREMENTS FOR RATING DOWNGRADES1
(millions of Canadian dollars) Average for the three months ended July 31 April 30 2021 2021 One-notch downgrade $ 203 $ 215 Two-notch downgrade 268 277 Three-notch downgrade 996 1,089
1 The above collateral requirements are based on each OTC trading counterparty’s Credit Support Annex and the Bank’s credit rating across applicable rating agencies. LIQUIDITY COVERAGE RATIO The LCR is a Basel III metric calculated as the ratio of the stock of unencumbered HQLA over the net cash outflow requirements in the next 30 days under a hypothetical liquidity stress event.
Other than during periods of financial stress, the Bank must maintain the LCR above 100% in accordance with the OSFI LAR requirement. The Bank’s LCR is calculated according to the scenario parameters in the OSFI LAR guideline, including prescribed HQLA eligibility criteria and haircuts, deposit run-off rates, and other outflow and inflow rates. HQLA held by the Bank that are eligible for the LCR calculation under the LAR are primarily central bank reserves, sovereign-issued or sovereign-guaranteed securities, and high-quality securities issued by non-financial entities.
TD BANK GROUP • THIRD QUARTER 2021 • REPORT TO SHAREHOLDERS Page 38
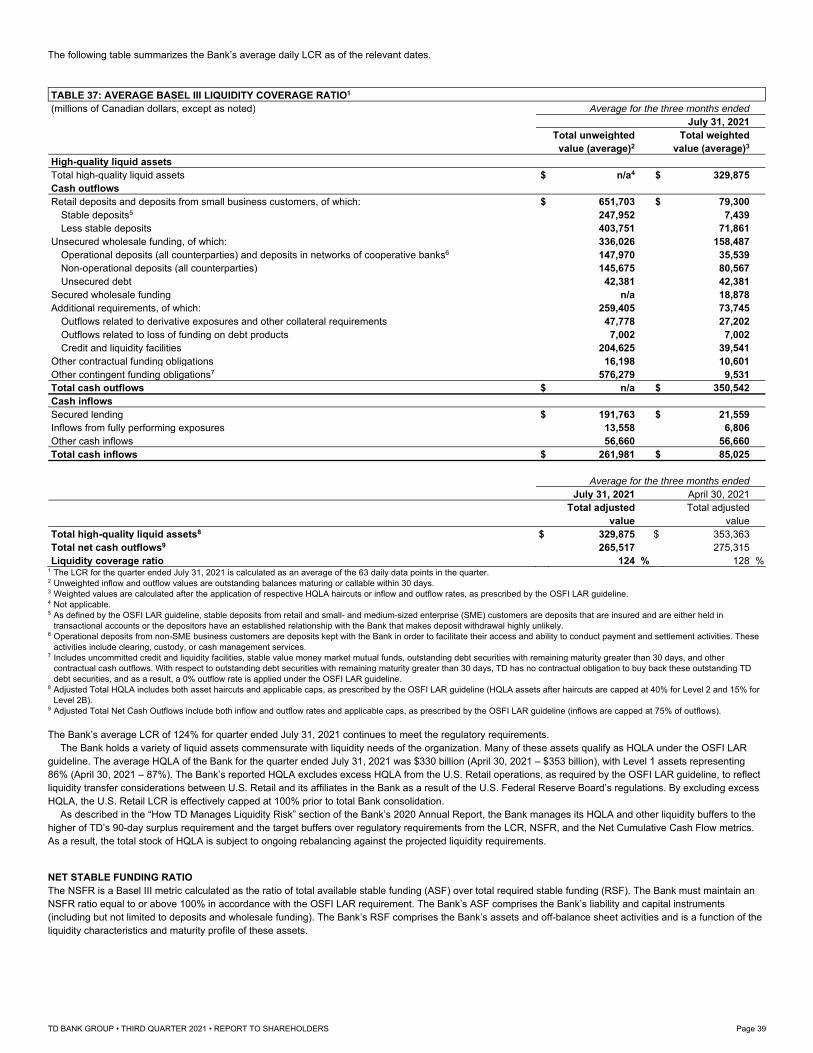
The following table summarizes the Bank’s average daily LCR as of the relevant dates. TABLE 37: AVERAGE BASEL III LIQUIDITY COVERAGE RATIO1
(millions of Canadian dollars, except as noted) Average for the three months ended
July 31, 2021
Total unweighted Total weighted
value (average)2 value (average)3
High-quality liquid assets
Total high-quality liquid assets $ n/a4 $ 329,875
Cash outflows
Retail deposits and deposits from small business customers, of which: $ 651,703 $ 79,300
Stable deposits5 247,952 7,439
Less stable deposits 403,751 71,861
Unsecured wholesale funding, of which: 336,026 158,487
Operational deposits (all counterparties) and deposits in networks of cooperative banks6 147,970 35,539
Non-operational deposits (all counterparties) 145,675 80,567
Unsecured debt 42,381 42,381
Secured wholesale funding n/a 18,878
Additional requirements, of which: 259,405 73,745
Outflows related to derivative exposures and other collateral requirements 47,778 27,202
Outflows related to loss of funding on debt products 7,002 7,002
Credit and liquidity facilities 204,625 39,541
Other contractual funding obligations 16,198 10,601
Other contingent funding obligations7 576,279 9,531
Total cash outflows $ n/a $ 350,542
Cash inflows
Secured lending $ 191,763 $ 21,559
Inflows from fully performing exposures 13,558 6,806
Other cash inflows 56,660 56,660
Total cash inflows $ 261,981 $ 85,025
Average for the three months ended
July 31, 2021 April 30, 2021
Total adjusted Total adjusted
value value
Total high-quality liquid assets8 $ 329,875 $ 353,363
Total net cash outflows9 265,517 275,315
Liquidity coverage ratio 124 % 128 % 1 The LCR for the quarter ended July 31, 2021 is calculated as an average of the 63 daily data points in the quarter. 2 Unweighted inflow and outflow values are outstanding balances maturing or callable within 30 days. 3 Weighted values are calculated after the application of respective HQLA haircuts or inflow and outflow rates, as prescribed by the OSFI LAR guideline. 4 Not applicable. 5 As defined by the OSFI LAR guideline, stable deposits from retail and small- and medium-sized enterprise (SME) customers are deposits that are insured and are either held in
transactional accounts or the depositors have an established relationship with the Bank that makes deposit withdrawal highly unlikely. 6 Operational deposits from non-SME business customers are deposits kept with the Bank in order to facilitate their access and ability to conduct payment and settlement activities. These
activities include clearing, custody, or cash management services. 7 Includes uncommitted credit and liquidity facilities, stable value money market mutual funds, outstanding debt securities with remaining maturity greater than 30 days, and other
contractual cash outflows. With respect to outstanding debt securities with remaining maturity greater than 30 days, TD has no contractual obligation to buy back these outstanding TD debt securities, and as a result, a 0% outflow rate is applied under the OSFI LAR guideline.
8 Adjusted Total HQLA includes both asset haircuts and applicable caps, as prescribed by the OSFI LAR guideline (HQLA assets after haircuts are capped at 40% for Level 2 and 15% for Level 2B).
9 Adjusted Total Net Cash Outflows include both inflow and outflow rates and applicable caps, as prescribed by the OSFI LAR guideline (inflows are capped at 75% of outflows). The Bank’s average LCR of 124% for quarter ended July 31, 2021 continues to meet the regulatory requirements.
The Bank holds a variety of liquid assets commensurate with liquidity needs of the organization. Many of these assets qualify as HQLA under the OSFI LAR guideline. The average HQLA of the Bank for the quarter ended July 31, 2021 was $330 billion (April 30, 2021 – $353 billion), with Level 1 assets representing 86% (April 30, 2021 – 87%). The Bank’s reported HQLA excludes excess HQLA from the U.S. Retail operations, as required by the OSFI LAR guideline, to reflect liquidity transfer considerations between U.S. Retail and its affiliates in the Bank as a result of the U.S. Federal Reserve Board’s regulations. By excluding excess HQLA, the U.S. Retail LCR is effectively capped at 100% prior to total Bank consolidation.
As described in the “How TD Manages Liquidity Risk” section of the Bank’s 2020 Annual Report, the Bank manages its HQLA and other liquidity buffers to the higher of TD’s 90-day surplus requirement and the target buffers over regulatory requirements from the LCR, NSFR, and the Net Cumulative Cash Flow metrics. As a result, the total stock of HQLA is subject to ongoing rebalancing against the projected liquidity requirements. NET STABLE FUNDING RATIO The NSFR is a Basel III metric calculated as the ratio of total available stable funding (ASF) over total required stable funding (RSF). The Bank must maintain an NSFR ratio equal to or above 100% in accordance with the OSFI LAR requirement. The Bank’s ASF comprises the Bank’s liability and capital instruments (including but not limited to deposits and wholesale funding). The Bank’s RSF comprises the Bank’s assets and off-balance sheet activities and is a function of the liquidity characteristics and maturity profile of these assets.
TD BANK GROUP • THIRD QUARTER 2021 • REPORT TO SHAREHOLDERS Page 39
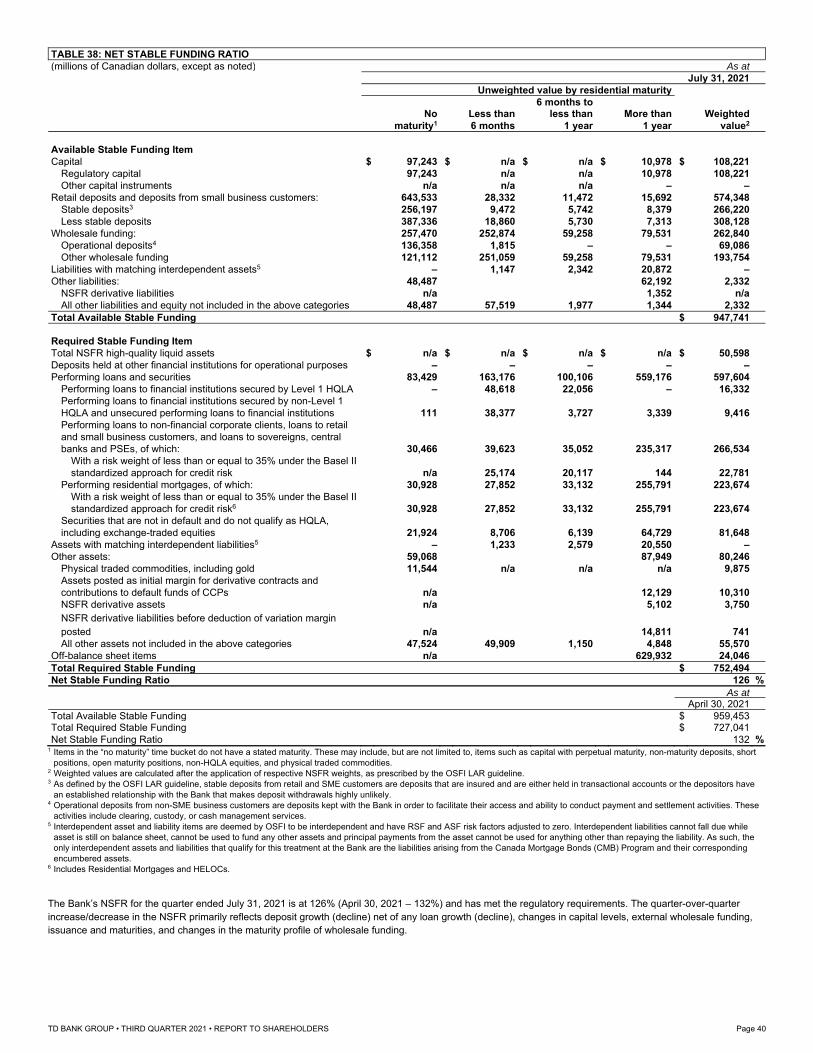
TABLE 38: NET STABLE FUNDING RATIO (millions of Canadian dollars, except as noted) As at
July 31, 2021 Unweighted value by residential maturity 6 months to No Less than less than More than Weighted maturity1 6 months 1 year 1 year value2 Available Stable Funding Item Capital $ 97,243 $ n/a $ n/a $ 10,978 $ 108,221
Regulatory capital 97,243 n/a n/a 10,978 108,221 Other capital instruments n/a n/a n/a – – Retail deposits and deposits from small business customers: 643,533 28,332 11,472 15,692 574,348
Stable deposits3 256,197 9,472 5,742 8,379 266,220 Less stable deposits 387,336 18,860 5,730 7,313 308,128 Wholesale funding: 257,470 252,874 59,258 79,531 262,840
Operational deposits4 136,358 1,815 – – 69,086 Other wholesale funding 121,112 251,059 59,258 79,531 193,754 Liabilities with matching interdependent assets5 – 1,147 2,342 20,872 – Other liabilities: 48,487 62,192 2,332
NSFR derivative liabilities n/a 1,352 n/a All other liabilities and equity not included in the above categories 48,487 57,519 1,977 1,344 2,332 Total Available Stable Funding $ 947,741
Required Stable Funding Item Total NSFR high-quality liquid assets $ n/a $ n/a $ n/a $ n/a $ 50,598 Deposits held at other financial institutions for operational purposes – – – – – Performing loans and securities 83,429 163,176 100,106 559,176 597,604
Performing loans to financial institutions secured by Level 1 HQLA – 48,618 22,056 – 16,332 Performing loans to financial institutions secured by non-Level 1 HQLA and unsecured performing loans to financial institutions 111 38,377 3,727 3,339 9,416 Performing loans to non-financial corporate clients, loans to retail and small business customers, and loans to sovereigns, central banks and PSEs, of which: 30,466 39,623 35,052 235,317 266,534 With a risk weight of less than or equal to 35% under the Basel II standardized approach for credit risk n/a 25,174 20,117 144 22,781 Performing residential mortgages, of which: 30,928 27,852 33,132 255,791 223,674 With a risk weight of less than or equal to 35% under the Basel II standardized approach for credit risk6 30,928 27,852 33,132 255,791 223,674 Securities that are not in default and do not qualify as HQLA, including exchange-traded equities 21,924 8,706 6,139 64,729 81,648 Assets with matching interdependent liabilities5 – 1,233 2,579 20,550 – Other assets: 59,068 87,949 80,246
Physical traded commodities, including gold 11,544 n/a n/a n/a 9,875 Assets posted as initial margin for derivative contracts and contributions to default funds of CCPs n/a 12,129 10,310 NSFR derivative assets n/a 5,102 3,750
NSFR derivative liabilities before deduction of variation margin posted n/a 14,811 741 All other assets not included in the above categories 47,524 49,909 1,150 4,848 55,570 Off-balance sheet items n/a 629,932 24,046 Total Required Stable Funding $ 752,494 Net Stable Funding Ratio 126 %
As at April 30, 2021 Total Available Stable Funding $ 959,453 Total Required Stable Funding $ 727,041 Net Stable Funding Ratio 132 %
1 Items in the “no maturity” time bucket do not have a stated maturity. These may include, but are not limited to, items such as capital with perpetual maturity, non-maturity deposits, short positions, open maturity positions, non-HQLA equities, and physical traded commodities.
2 Weighted values are calculated after the application of respective NSFR weights, as prescribed by the OSFI LAR guideline. 3 As defined by the OSFI LAR guideline, stable deposits from retail and SME customers are deposits that are insured and are either held in transactional accounts or the depositors have
an established relationship with the Bank that makes deposit withdrawals highly unlikely. 4 Operational deposits from non-SME business customers are deposits kept with the Bank in order to facilitate their access and ability to conduct payment and settlement activities. These
activities include clearing, custody, or cash management services. 5 Interdependent asset and liability items are deemed by OSFI to be interdependent and have RSF and ASF risk factors adjusted to zero. Interdependent liabilities cannot fall due while
asset is still on balance sheet, cannot be used to fund any other assets and principal payments from the asset cannot be used for anything other than repaying the liability. As such, the only interdependent assets and liabilities that qualify for this treatment at the Bank are the liabilities arising from the Canada Mortgage Bonds (CMB) Program and their corresponding encumbered assets.
6 Includes Residential Mortgages and HELOCs.
The Bank’s NSFR for the quarter ended July 31, 2021 is at 126% (April 30, 2021 – 132%) and has met the regulatory requirements. The quarter-over-quarter increase/decrease in the NSFR primarily reflects deposit growth (decline) net of any loan growth (decline), changes in capital levels, external wholesale funding, issuance and maturities, and changes in the maturity profile of wholesale funding.
TD BANK GROUP • THIRD QUARTER 2021 • REPORT TO SHAREHOLDERS Page 40
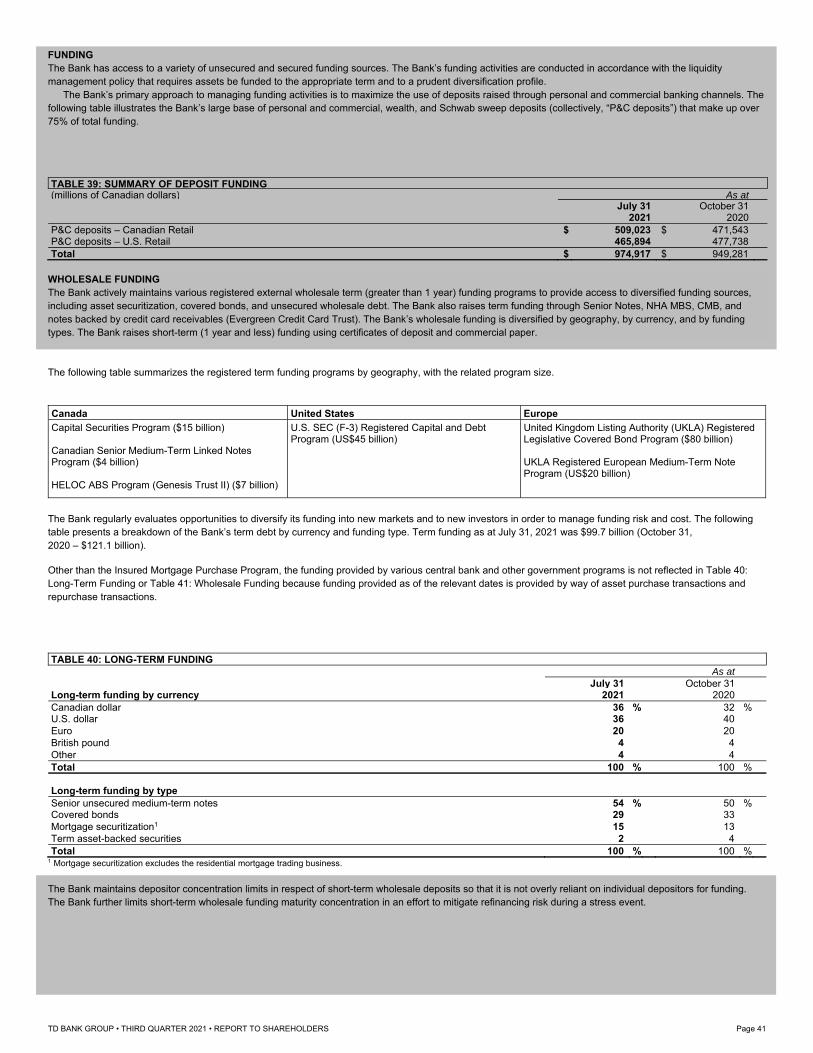
FUNDING The Bank has access to a variety of unsecured and secured funding sources. The Bank’s funding activities are conducted in accordance with the liquidity management policy that requires assets be funded to the appropriate term and to a prudent diversification profile.
The Bank’s primary approach to managing funding activities is to maximize the use of deposits raised through personal and commercial banking channels. The following table illustrates the Bank’s large base of personal and commercial, wealth, and Schwab sweep deposits (collectively, “P&C deposits”) that make up over 75% of total funding.
TABLE 39: SUMMARY OF DEPOSIT FUNDING (millions of Canadian dollars) As at
July 31 October 31 2021 2020 P&C deposits – Canadian Retail $ 509,023 $ 471,543 P&C deposits – U.S. Retail 465,894 477,738 Total $ 974,917 $ 949,281
WHOLESALE FUNDING The Bank actively maintains various registered external wholesale term (greater than 1 year) funding programs to provide access to diversified funding sources, including asset securitization, covered bonds, and unsecured wholesale debt. The Bank also raises term funding through Senior Notes, NHA MBS, CMB, and notes backed by credit card receivables (Evergreen Credit Card Trust). The Bank’s wholesale funding is diversified by geography, by currency, and by funding types. The Bank raises short-term (1 year and less) funding using certificates of deposit and commercial paper. The following table summarizes the registered term funding programs by geography, with the related program size.
Canada United States Europe
Capital Securities Program ($15 billion) Canadian Senior Medium-Term Linked Notes Program ($4 billion) HELOC ABS Program (Genesis Trust II) ($7 billion)
U.S. SEC (F-3) Registered Capital and Debt Program (US$45 billion)
United Kingdom Listing Authority (UKLA) Registered Legislative Covered Bond Program ($80 billion) UKLA Registered European Medium-Term Note Program (US$20 billion)
The Bank regularly evaluates opportunities to diversify its funding into new markets and to new investors in order to manage funding risk and cost. The following table presents a breakdown of the Bank’s term debt by currency and funding type. Term funding as at July 31, 2021 was $99.7 billion (October 31, 2020 – $121.1 billion). Other than the Insured Mortgage Purchase Program, the funding provided by various central bank and other government programs is not reflected in Table 40: Long-Term Funding or Table 41: Wholesale Funding because funding provided as of the relevant dates is provided by way of asset purchase transactions and repurchase transactions.
TABLE 40: LONG-TERM FUNDING
As at July 31 October 31 Long-term funding by currency 2021 2020 Canadian dollar 36 % 32 % U.S. dollar 36 40 Euro 20 20 British pound 4 4 Other 4 4 Total 100 % 100 %
Long-term funding by type Senior unsecured medium-term notes 54 % 50 % Covered bonds 29 33 Mortgage securitization1 15 13 Term asset-backed securities 2 4 Total 100 % 100 %
1 Mortgage securitization excludes the residential mortgage trading business.
The Bank maintains depositor concentration limits in respect of short-term wholesale deposits so that it is not overly reliant on individual depositors for funding. The Bank further limits short-term wholesale funding maturity concentration in an effort to mitigate refinancing risk during a stress event.
TD BANK GROUP • THIRD QUARTER 2021 • REPORT TO SHAREHOLDERS Page 41
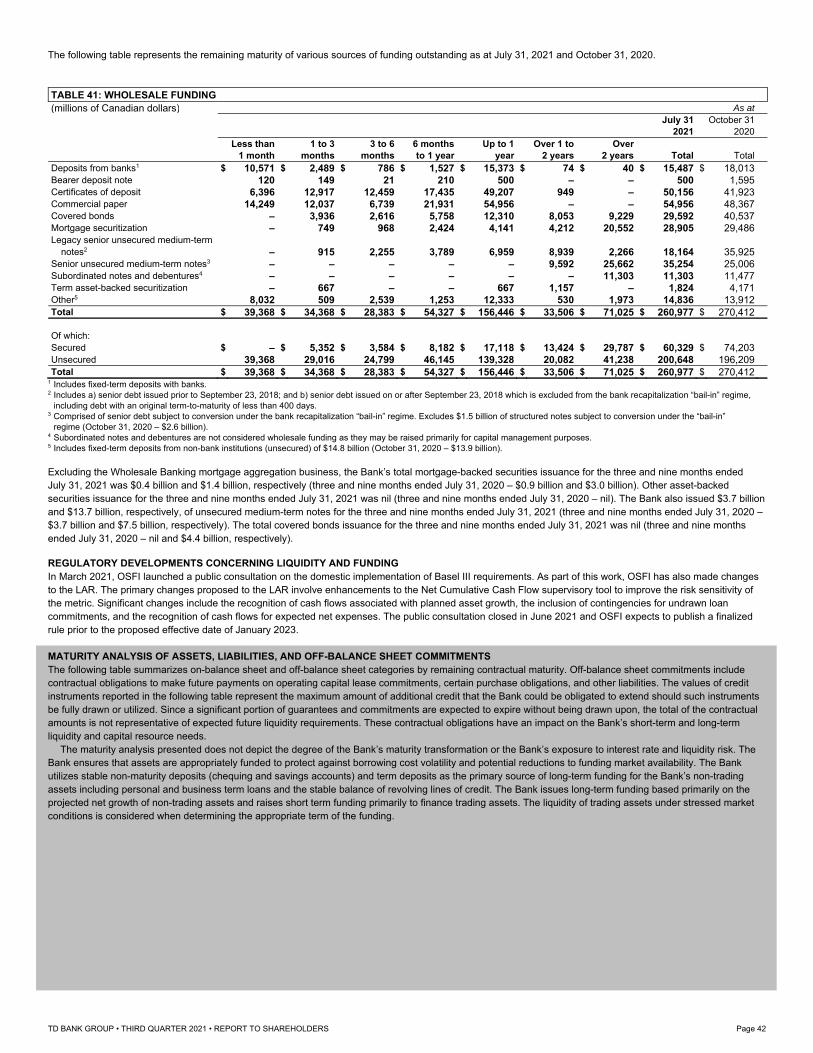
The following table represents the remaining maturity of various sources of funding outstanding as at July 31, 2021 and October 31, 2020. TABLE 41: WHOLESALE FUNDING (millions of Canadian dollars) As at
July 31 October 31 2021 2020 Less than 1 to 3 3 to 6 6 months Up to 1 Over 1 to Over 1 month months months to 1 year year 2 years 2 years Total Total Deposits from banks1 $ 10,571 $ 2,489 $ 786 $ 1,527 $ 15,373 $ 74 $ 40 $ 15,487 $ 18,013 Bearer deposit note 120 149 21 210 500 – – 500 1,595 Certificates of deposit 6,396 12,917 12,459 17,435 49,207 949 – 50,156 41,923 Commercial paper 14,249 12,037 6,739 21,931 54,956 – – 54,956 48,367 Covered bonds – 3,936 2,616 5,758 12,310 8,053 9,229 29,592 40,537 Mortgage securitization – 749 968 2,424 4,141 4,212 20,552 28,905 29,486 Legacy senior unsecured medium-term
notes2 – 915 2,255 3,789 6,959 8,939 2,266 18,164 35,925 Senior unsecured medium-term notes3 – – – – – 9,592 25,662 35,254 25,006 Subordinated notes and debentures4 – – – – – – 11,303 11,303 11,477 Term asset-backed securitization – 667 – – 667 1,157 – 1,824 4,171 Other5 8,032 509 2,539 1,253 12,333 530 1,973 14,836 13,912 Total $ 39,368 $ 34,368 $ 28,383 $ 54,327 $ 156,446 $ 33,506 $ 71,025 $ 260,977 $ 270,412
Of which: Secured $ – $ 5,352 $ 3,584 $ 8,182 $ 17,118 $ 13,424 $ 29,787 $ 60,329 $ 74,203 Unsecured 39,368 29,016 24,799 46,145 139,328 20,082 41,238 200,648 196,209 Total $ 39,368 $ 34,368 $ 28,383 $ 54,327 $ 156,446 $ 33,506 $ 71,025 $ 260,977 $ 270,412
1 Includes fixed-term deposits with banks. 2 Includes a) senior debt issued prior to September 23, 2018; and b) senior debt issued on or after September 23, 2018 which is excluded from the bank recapitalization “bail-in” regime,
including debt with an original term-to-maturity of less than 400 days. 3 Comprised of senior debt subject to conversion under the bank recapitalization “bail-in” regime. Excludes $1.5 billion of structured notes subject to conversion under the “bail-in”
regime (October 31, 2020 – $2.6 billion). 4 Subordinated notes and debentures are not considered wholesale funding as they may be raised primarily for capital management purposes. 5 Includes fixed-term deposits from non-bank institutions (unsecured) of $14.8 billion (October 31, 2020 – $13.9 billion). Excluding the Wholesale Banking mortgage aggregation business, the Bank’s total mortgage-backed securities issuance for the three and nine months ended July 31, 2021 was $0.4 billion and $1.4 billion, respectively (three and nine months ended July 31, 2020 – $0.9 billion and $3.0 billion). Other asset-backed securities issuance for the three and nine months ended July 31, 2021 was nil (three and nine months ended July 31, 2020 – nil). The Bank also issued $3.7 billion and $13.7 billion, respectively, of unsecured medium-term notes for the three and nine months ended July 31, 2021 (three and nine months ended July 31, 2020 – $3.7 billion and $7.5 billion, respectively). The total covered bonds issuance for the three and nine months ended July 31, 2021 was nil (three and nine months ended July 31, 2020 – nil and $4.4 billion, respectively). REGULATORY DEVELOPMENTS CONCERNING LIQUIDITY AND FUNDING In March 2021, OSFI launched a public consultation on the domestic implementation of Basel III requirements. As part of this work, OSFI has also made changes to the LAR. The primary changes proposed to the LAR involve enhancements to the Net Cumulative Cash Flow supervisory tool to improve the risk sensitivity of the metric. Significant changes include the recognition of cash flows associated with planned asset growth, the inclusion of contingencies for undrawn loan commitments, and the recognition of cash flows for expected net expenses. The public consultation closed in June 2021 and OSFI expects to publish a finalized rule prior to the proposed effective date of January 2023. MATURITY ANALYSIS OF ASSETS, LIABILITIES, AND OFF-BALANCE SHEET COMMITMENTS The following table summarizes on-balance sheet and off-balance sheet categories by remaining contractual maturity. Off-balance sheet commitments include contractual obligations to make future payments on operating capital lease commitments, certain purchase obligations, and other liabilities. The values of credit instruments reported in the following table represent the maximum amount of additional credit that the Bank could be obligated to extend should such instruments be fully drawn or utilized. Since a significant portion of guarantees and commitments are expected to expire without being drawn upon, the total of the contractual amounts is not representative of expected future liquidity requirements. These contractual obligations have an impact on the Bank’s short-term and long-term liquidity and capital resource needs.
The maturity analysis presented does not depict the degree of the Bank’s maturity transformation or the Bank’s exposure to interest rate and liquidity risk. The Bank ensures that assets are appropriately funded to protect against borrowing cost volatility and potential reductions to funding market availability. The Bank utilizes stable non-maturity deposits (chequing and savings accounts) and term deposits as the primary source of long-term funding for the Bank’s non-trading assets including personal and business term loans and the stable balance of revolving lines of credit. The Bank issues long-term funding based primarily on the projected net growth of non-trading assets and raises short term funding primarily to finance trading assets. The liquidity of trading assets under stressed market conditions is considered when determining the appropriate term of the funding.
TD BANK GROUP • THIRD QUARTER 2021 • REPORT TO SHAREHOLDERS Page 42
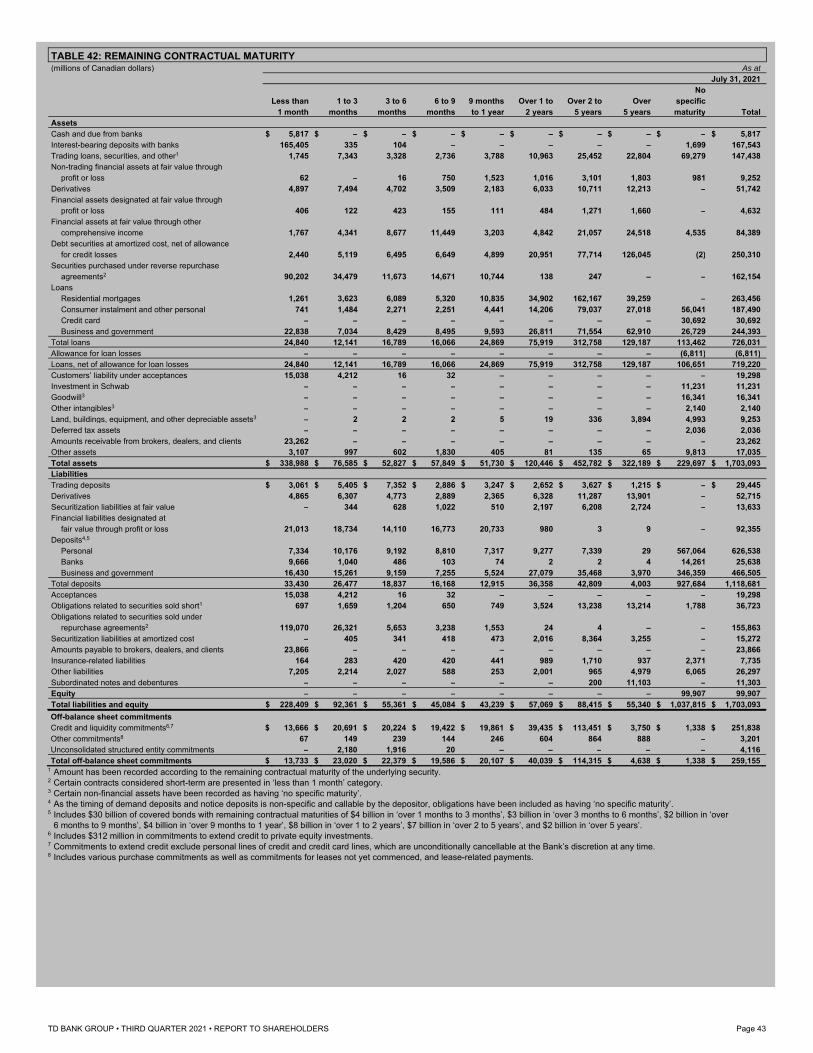
TABLE 42: REMAINING CONTRACTUAL MATURITY (millions of Canadian dollars) As at
July 31, 2021 No Less than 1 to 3 3 to 6 6 to 9 9 months Over 1 to Over 2 to Over specific
1 month months months months to 1 year 2 years 5 years 5 years maturity Total Assets Cash and due from banks $ 5,817 $ – $ – $ – $ – $ – $ – $ – $ – $ 5,817 Interest-bearing deposits with banks 165,405 335 104 – – – – – 1,699 167,543 Trading loans, securities, and other1 1,745 7,343 3,328 2,736 3,788 10,963 25,452 22,804 69,279 147,438 Non-trading financial assets at fair value through
profit or loss 62 – 16 750 1,523 1,016 3,101 1,803 981 9,252 Derivatives 4,897 7,494 4,702 3,509 2,183 6,033 10,711 12,213 – 51,742 Financial assets designated at fair value through
profit or loss 406 122 423 155 111 484 1,271 1,660 – 4,632 Financial assets at fair value through other
comprehensive income 1,767 4,341 8,677 11,449 3,203 4,842 21,057 24,518 4,535 84,389 Debt securities at amortized cost, net of allowance
for credit losses 2,440 5,119 6,495 6,649 4,899 20,951 77,714 126,045 (2) 250,310 Securities purchased under reverse repurchase
agreements2 90,202 34,479 11,673 14,671 10,744 138 247 – – 162,154 Loans
Residential mortgages 1,261 3,623 6,089 5,320 10,835 34,902 162,167 39,259 – 263,456 Consumer instalment and other personal 741 1,484 2,271 2,251 4,441 14,206 79,037 27,018 56,041 187,490 Credit card – – – – – – – – 30,692 30,692 Business and government 22,838 7,034 8,429 8,495 9,593 26,811 71,554 62,910 26,729 244,393 Total loans 24,840 12,141 16,789 16,066 24,869 75,919 312,758 129,187 113,462 726,031 Allowance for loan losses – – – – – – – – (6,811) (6,811) Loans, net of allowance for loan losses 24,840 12,141 16,789 16,066 24,869 75,919 312,758 129,187 106,651 719,220 Customers’ liability under acceptances 15,038 4,212 16 32 – – – – – 19,298 Investment in Schwab – – – – – – – – 11,231 11,231 Goodwill3 – – – – – – – – 16,341 16,341 Other intangibles3 – – – – – – – – 2,140 2,140 Land, buildings, equipment, and other depreciable assets3 – 2 2 2 5 19 336 3,894 4,993 9,253 Deferred tax assets – – – – – – – – 2,036 2,036 Amounts receivable from brokers, dealers, and clients 23,262 – – – – – – – – 23,262 Other assets 3,107 997 602 1,830 405 81 135 65 9,813 17,035 Total assets $ 338,988 $ 76,585 $ 52,827 $ 57,849 $ 51,730 $ 120,446 $ 452,782 $ 322,189 $ 229,697 $ 1,703,093 Liabilities Trading deposits $ 3,061 $ 5,405 $ 7,352 $ 2,886 $ 3,247 $ 2,652 $ 3,627 $ 1,215 $ – $ 29,445 Derivatives 4,865 6,307 4,773 2,889 2,365 6,328 11,287 13,901 – 52,715 Securitization liabilities at fair value – 344 628 1,022 510 2,197 6,208 2,724 – 13,633 Financial liabilities designated at
fair value through profit or loss 21,013 18,734 14,110 16,773 20,733 980 3 9 – 92,355 Deposits4,5
Personal 7,334 10,176 9,192 8,810 7,317 9,277 7,339 29 567,064 626,538 Banks 9,666 1,040 486 103 74 2 2 4 14,261 25,638 Business and government 16,430 15,261 9,159 7,255 5,524 27,079 35,468 3,970 346,359 466,505 Total deposits 33,430 26,477 18,837 16,168 12,915 36,358 42,809 4,003 927,684 1,118,681 Acceptances 15,038 4,212 16 32 – – – – – 19,298 Obligations related to securities sold short1 697 1,659 1,204 650 749 3,524 13,238 13,214 1,788 36,723 Obligations related to securities sold under
repurchase agreements2 119,070 26,321 5,653 3,238 1,553 24 4 – – 155,863 Securitization liabilities at amortized cost – 405 341 418 473 2,016 8,364 3,255 – 15,272 Amounts payable to brokers, dealers, and clients 23,866 – – – – – – – – 23,866 Insurance-related liabilities 164 283 420 420 441 989 1,710 937 2,371 7,735 Other liabilities 7,205 2,214 2,027 588 253 2,001 965 4,979 6,065 26,297 Subordinated notes and debentures – – – – – – 200 11,103 – 11,303 Equity – – – – – – – – 99,907 99,907 Total liabilities and equity $ 228,409 $ 92,361 $ 55,361 $ 45,084 $ 43,239 $ 57,069 $ 88,415 $ 55,340 $ 1,037,815 $ 1,703,093
Off-balance sheet commitments Credit and liquidity commitments6,7 $ 13,666 $ 20,691 $ 20,224 $ 19,422 $ 19,861 $ 39,435 $ 113,451 $ 3,750 $ 1,338 $ 251,838 Other commitments8 67 149 239 144 246 604 864 888 – 3,201 Unconsolidated structured entity commitments – 2,180 1,916 20 – – – – – 4,116 Total off-balance sheet commitments $ 13,733 $ 23,020 $ 22,379 $ 19,586 $ 20,107 $ 40,039 $ 114,315 $ 4,638 $ 1,338 $ 259,155
1 Amount has been recorded according to the remaining contractual maturity of the underlying security. 2 Certain contracts considered short-term are presented in ‘less than 1 month’ category. 3 Certain non-financial assets have been recorded as having ‘no specific maturity’. 4 As the timing of demand deposits and notice deposits is non-specific and callable by the depositor, obligations have been included as having ‘no specific maturity’. 5 Includes $30 billion of covered bonds with remaining contractual maturities of $4 billion in ‘over 1 months to 3 months’, $3 billion in ‘over 3 months to 6 months’, $2 billion in ‘over
6 months to 9 months’, $4 billion in ‘over 9 months to 1 year’, $8 billion in ‘over 1 to 2 years’, $7 billion in ‘over 2 to 5 years’, and $2 billion in ‘over 5 years’. 6 Includes $312 million in commitments to extend credit to private equity investments. 7 Commitments to extend credit exclude personal lines of credit and credit card lines, which are unconditionally cancellable at the Bank’s discretion at any time. 8 Includes various purchase commitments as well as commitments for leases not yet commenced, and lease-related payments.
TD BANK GROUP • THIRD QUARTER 2021 • REPORT TO SHAREHOLDERS Page 43
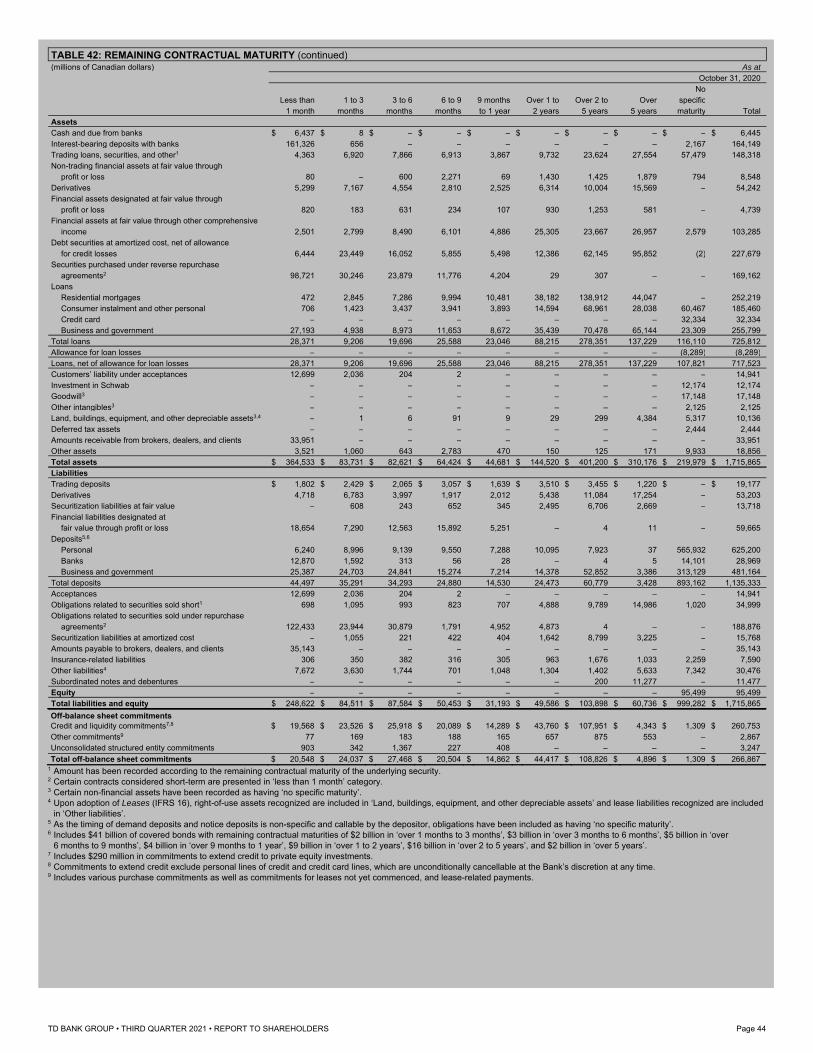
TABLE 42: REMAINING CONTRACTUAL MATURITY (continued) (millions of Canadian dollars) As at
October 31, 2020 No Less than 1 to 3 3 to 6 6 to 9 9 months Over 1 to Over 2 to Over specific
1 month months months months to 1 year 2 years 5 years 5 years maturity Total Assets Cash and due from banks $ 6,437 $ 8 $ – $ – $ – $ – $ – $ – $ – $ 6,445 Interest-bearing deposits with banks 161,326 656 – – – – – – 2,167 164,149 Trading loans, securities, and other1 4,363 6,920 7,866 6,913 3,867 9,732 23,624 27,554 57,479 148,318 Non-trading financial assets at fair value through
profit or loss 80 – 600 2,271 69 1,430 1,425 1,879 794 8,548 Derivatives 5,299 7,167 4,554 2,810 2,525 6,314 10,004 15,569 – 54,242 Financial assets designated at fair value through
profit or loss 820 183 631 234 107 930 1,253 581 – 4,739 Financial assets at fair value through other comprehensive
income 2,501 2,799 8,490 6,101 4,886 25,305 23,667 26,957 2,579 103,285 Debt securities at amortized cost, net of allowance
for credit losses 6,444 23,449 16,052 5,855 5,498 12,386 62,145 95,852 (2) 227,679 Securities purchased under reverse repurchase
agreements2 98,721 30,246 23,879 11,776 4,204 29 307 – – 169,162 Loans
Residential mortgages 472 2,845 7,286 9,994 10,481 38,182 138,912 44,047 – 252,219 Consumer instalment and other personal 706 1,423 3,437 3,941 3,893 14,594 68,961 28,038 60,467 185,460 Credit card – – – – – – – – 32,334 32,334 Business and government 27,193 4,938 8,973 11,653 8,672 35,439 70,478 65,144 23,309 255,799 Total loans 28,371 9,206 19,696 25,588 23,046 88,215 278,351 137,229 116,110 725,812 Allowance for loan losses – – – – – – – – (8,289) (8,289) Loans, net of allowance for loan losses 28,371 9,206 19,696 25,588 23,046 88,215 278,351 137,229 107,821 717,523 Customers’ liability under acceptances 12,699 2,036 204 2 – – – – – 14,941 Investment in Schwab – – – – – – – – 12,174 12,174 Goodwill3 – – – – – – – – 17,148 17,148 Other intangibles3 – – – – – – – – 2,125 2,125 Land, buildings, equipment, and other depreciable assets3,4 – 1 6 91 9 29 299 4,384 5,317 10,136 Deferred tax assets – – – – – – – – 2,444 2,444 Amounts receivable from brokers, dealers, and clients 33,951 – – – – – – – – 33,951 Other assets 3,521 1,060 643 2,783 470 150 125 171 9,933 18,856 Total assets $ 364,533 $ 83,731 $ 82,621 $ 64,424 $ 44,681 $ 144,520 $ 401,200 $ 310,176 $ 219,979 $ 1,715,865 Liabilities Trading deposits $ 1,802 $ 2,429 $ 2,065 $ 3,057 $ 1,639 $ 3,510 $ 3,455 $ 1,220 $ – $ 19,177 Derivatives 4,718 6,783 3,997 1,917 2,012 5,438 11,084 17,254 – 53,203 Securitization liabilities at fair value – 608 243 652 345 2,495 6,706 2,669 – 13,718 Financial liabilities designated at
fair value through profit or loss 18,654 7,290 12,563 15,892 5,251 – 4 11 – 59,665 Deposits5,6
Personal 6,240 8,996 9,139 9,550 7,288 10,095 7,923 37 565,932 625,200 Banks 12,870 1,592 313 56 28 – 4 5 14,101 28,969 Business and government 25,387 24,703 24,841 15,274 7,214 14,378 52,852 3,386 313,129 481,164 Total deposits 44,497 35,291 34,293 24,880 14,530 24,473 60,779 3,428 893,162 1,135,333 Acceptances 12,699 2,036 204 2 – – – – – 14,941 Obligations related to securities sold short1 698 1,095 993 823 707 4,888 9,789 14,986 1,020 34,999 Obligations related to securities sold under repurchase
agreements2 122,433 23,944 30,879 1,791 4,952 4,873 4 – – 188,876 Securitization liabilities at amortized cost – 1,055 221 422 404 1,642 8,799 3,225 – 15,768 Amounts payable to brokers, dealers, and clients 35,143 – – – – – – – – 35,143 Insurance-related liabilities 306 350 382 316 305 963 1,676 1,033 2,259 7,590 Other liabilities4 7,672 3,630 1,744 701 1,048 1,304 1,402 5,633 7,342 30,476 Subordinated notes and debentures – – – – – – 200 11,277 – 11,477 Equity – – – – – – – – 95,499 95,499 Total liabilities and equity $ 248,622 $ 84,511 $ 87,584 $ 50,453 $ 31,193 $ 49,586 $ 103,898 $ 60,736 $ 999,282 $ 1,715,865
Off-balance sheet commitments Credit and liquidity commitments7,8 $ 19,568 $ 23,526 $ 25,918 $ 20,089 $ 14,289 $ 43,760 $ 107,951 $ 4,343 $ 1,309 $ 260,753 Other commitments9 77 169 183 188 165 657 875 553 – 2,867 Unconsolidated structured entity commitments 903 342 1,367 227 408 – – – – 3,247 Total off-balance sheet commitments $ 20,548 $ 24,037 $ 27,468 $ 20,504 $ 14,862 $ 44,417 $ 108,826 $ 4,896 $ 1,309 $ 266,867
1 Amount has been recorded according to the remaining contractual maturity of the underlying security. 2 Certain contracts considered short-term are presented in ‘less than 1 month’ category. 3 Certain non-financial assets have been recorded as having ‘no specific maturity’. 4 Upon adoption of Leases (IFRS 16), right-of-use assets recognized are included in ‘Land, buildings, equipment, and other depreciable assets’ and lease liabilities recognized are included
in ‘Other liabilities’. 5 As the timing of demand deposits and notice deposits is non-specific and callable by the depositor, obligations have been included as having ‘no specific maturity’. 6 Includes $41 billion of covered bonds with remaining contractual maturities of $2 billion in ‘over 1 months to 3 months’, $3 billion in ‘over 3 months to 6 months’, $5 billion in ‘over
6 months to 9 months’, $4 billion in ‘over 9 months to 1 year’, $9 billion in ‘over 1 to 2 years’, $16 billion in ‘over 2 to 5 years’, and $2 billion in ‘over 5 years’. 7 Includes $290 million in commitments to extend credit to private equity investments. 8 Commitments to extend credit exclude personal lines of credit and credit card lines, which are unconditionally cancellable at the Bank’s discretion at any time. 9 Includes various purchase commitments as well as commitments for leases not yet commenced, and lease-related payments.
TD BANK GROUP • THIRD QUARTER 2021 • REPORT TO SHAREHOLDERS Page 44
SECURITIZATION AND OFF-BALANCE SHEET ARRANGEMENTS The Bank enters into securitization and off-balance sheet arrangements in the normal course of operations. The Bank is involved with structured entities (SEs) that it sponsors, as well as entities sponsored by third parties. Refer to “Securitization and Off-Balance Sheet Arrangements” section, Note 9: Transfers of Financial Assets and Note 10: Structured Entities of the Bank’s 2020 Annual Report and “Transfers of Financial Assets Qualifying for Derecognition” section of Note 6 of the Bank’s third quarter 2021 Interim Consolidated Financial Statements for further details. There have been no significant changes to the Bank’s securitization and off-balance sheet arrangements during the quarter ended July 31, 2021. Securitization of Bank-Originated Assets The Bank securitizes residential mortgages, personal loans, credit cards and business and government loans to enhance its liquidity position, to diversify sources of funding, and to optimize the management of the balance sheet. Residential Mortgage Loans The Bank securitizes residential mortgage loans through significant unconsolidated SEs and Canadian non-SE third parties. Residential mortgage loans securitized by the Bank may give rise to full derecognition of the financial assets depending on the individual arrangement of each transaction. In instances where the Bank fully derecognizes residential mortgage loans, the Bank may be exposed to the risks of transferred loans through retained interests. Consumer Instalment and Other Personal Loans The Bank securitizes consumer instalment and other personal loans through a consolidated SE. The Bank consolidates the SE as it serves as a financing vehicle for the Bank’s assets, the Bank has power over the key economic decisions of the SE, and the Bank is exposed to the majority of the residual risks of the SE. Credit Card Loans The Bank securitizes credit card loans through an SE. The Bank consolidates the SE as it serves as a financing vehicle for the Bank’s assets, the Bank has power over the key economic decisions of the SE, and the Bank is exposed to the majority of the residual risks of the SE. Business and Government Loans The Bank securitizes business and government loans through significant unconsolidated SEs and Canadian non-SE third parties. Business and government loans securitized by the Bank may be derecognized from the Bank’s balance sheet depending on the individual arrangement of each transaction. In instances where the Bank fully derecognizes business and government loans, the Bank may be exposed to the risks of transferred loans through retained interests. There are no ECLs on the retained interests of the securitized business and government loans as the mortgages are all government insured. Securitization of Third Party-Originated Assets Significant Unconsolidated Special Purpose Entities The Bank securitizes third party-originated assets through Bank-sponsored SEs, including its Canadian multi-seller conduits which are not consolidated. These Canadian multi-seller conduits securitize Canadian originated third-party assets. The Bank administers these multi-seller conduits and provides liquidity facilities as well as securities distribution services; it may also provide credit enhancements. TD’s maximum potential exposure to loss due to its ownership interest in commercial paper and through the provision of liquidity facilities for multi-seller conduits was $9.3 billion as at July 31, 2021 (October 31, 2020 – $10.9 billion). In addition, as at July 31, 2021, the Bank had committed to provide $4.1 billion in liquidity facilities that can be used to support future asset-backed commercial paper in the purchase of deal-specific assets (October 31, 2020 – $3.2 billion). Off-Balance Sheet Exposure to Third Party-Sponsored Conduits The Bank has off-balance sheet exposure to third party-sponsored conduits arising from providing liquidity facilities and funding commitments of $3.5 billion as at July 31, 2021 (October 31, 2020 – $4.0 billion). The assets within these conduits are comprised of individual notes backed by automotive loan receivables, credit card receivables, equipment receivables and trade receivables. On-balance sheet exposure to third party-sponsored conduits have been included in the financial statements.
ACCOUNTING POLICIES AND ESTIMATES The Bank’s unaudited Interim Consolidated Financial Statements have been prepared in accordance with IFRS. For details of the Bank’s accounting policies under IFRS, refer to Note 2 of the Bank’s third quarter 2021 Interim Consolidated Financial Statements and 2020 Annual Consolidated Financial Statements. For details of the Bank’s significant accounting judgments, estimates, and assumptions under IFRS, refer to Note 3 of the Bank’s third quarter 2021 Interim Consolidated Financial Statements and Bank’s 2020 Annual Consolidated Financial Statements. ACCOUNTING JUDGMENTS, ESTIMATES AND ASSUMPTIONS The estimates used in the Bank’s accounting policies are essential for understanding the results of its operations and financial condition. Some of the Bank’s policies require subjective, complex judgments and estimates as they relate to matters that are inherently uncertain. Changes in these judgments or estimates and changes to accounting standards and policies could have a materially adverse impact on the Bank’s Interim Consolidated Financial Statements. The Bank has established procedures to ensure that accounting policies are applied consistently and that the processes for changing methodologies, determining estimates, and adopting new accounting standards are well-controlled and occur in an appropriate and systematic manner. Impairment – Expected Credit Loss Model The ECL model requires the application of estimates and judgment in the assessment of the current and forward-looking economic environment. As a result of COVID-19, there is a higher degree of uncertainty in determining reasonable and supportable forward-looking information used in assessing significant increase in credit risk and measuring ECLs. The Bank introduced relief programs in the second quarter of 2020 that allowed borrowers to temporarily defer payments of principal and/or interest on their loans and is supporting various government assistance programs which reduce the Bank’s exposure to expected losses. Under these retail and non-retail programs and notwithstanding any other changes in credit risk, opting into a payment deferral program does not in and of itself trigger a significant increase in credit risk since initial recognition (which would result in stage migration) and does not result in additional days past due. Since the second quarter of 2020, macroeconomic variables for the downside scenario were based on plausible scenario analyses of COVID-19 impacts, given the lack of comparable historical data for a shock of this nature. Starting in the first quarter of 2021, the upside scenario was based on plausible scenario analyses of a more rapid recovery from the COVID-19 shock. Refer to Note 6 of the Bank’s third quarter 2021 Interim Consolidated Financial Statements for additional details on the macroeconomic variables used in the forward-looking macroeconomic forecasts.
TD BANK GROUP • THIRD QUARTER 2021 • REPORT TO SHAREHOLDERS Page 45
Management exercises expert credit judgment in assessing if an exposure has experienced significant increase in credit risk since initial recognition and in determining the amount of ECLs at each reporting date, by considering reasonable and supportable information that is not already included in the quantitative models. The current environment is subject to rapid change and to the extent that certain effects of COVID-19 are not fully incorporated into the model calculations, increased temporary quantitative and qualitative adjustments have been applied. This includes borrower credit scores, industry and geography specific COVID-19 impacts, payment support initiatives introduced by the Bank and governments, and the persistence of the economic shutdown, the effects of which are not yet fully reflected in the quantitative models. The Bank has performed certain additional qualitative portfolio and loan level assessments of significant increase in credit risk.
CURRENT CHANGES IN ACCOUNTING POLICY The following new standards and changes in accounting policies have been adopted by the Bank on November 1, 2020. IBOR Reform and its Effects on Financial Reporting Various interest rates and other indices that are deemed to be “benchmarks”, including interbank offered rate (IBOR) benchmarks, have been, and continue to be, the subject of international regulatory guidance and proposals for reform. Following the announcements by the U.K. Financial Conduct Authority in July 2017 that it would no longer compel banks to submit London Interbank Offered Rates (LIBORs) after December 2021 and by ICE Benchmark Administration (IBA) in March 2021 that it will cease publication of: (i) GBP LIBOR (all tenors), EUR LIBOR (all tenors), CHF LIBOR (all tenors), JPY LIBOR (all tenors), and US LIBOR (1-week and 2-months) following December 31, 2021; and (ii) US LIBOR (overnight, 1-month, 3-months, 6-months, and 12-months) following June 30, 2023, efforts to transition away from IBORs to alternative reference rates (ARRs) have been continuing in various jurisdictions. The global transition from IBORs to ARRs introduces challenges and risks that may have adverse consequences on the Bank, its clients, and the financial services industry. The replacement of IBORs or other benchmark rates could result in market dislocation and different financial performance for legacy transactions, require different hedging strategies, affect the Bank’s capital and liquidity planning and management, or have other adverse consequences to market participants. Additionally, any adverse impacts on the value of and return on existing instruments and contracts for the Bank’s clients may present an increased risk of litigation, regulatory intervention, and possible reputational damage.
To manage the transition to ARRs, the Bank has established an enterprise-wide, cross functional initiative with Board oversight and dedicated work streams to evaluate and address the key areas of impact on the Bank’s products, services, systems, documents, processes, models, funding and liquidity planning, risk management frameworks, and financial reporting with the intention of managing the impact through appropriate mitigating actions. The Bank is also actively participating in industry associations and incorporating best practice guidance from these working groups as well as regulatory bodies into the transition plan, such as incorporating appropriate fallback language in contracts, making available new products referencing ARRs, ceasing the issuance of IBOR based financial instruments, and preparing for overall operational readiness.
The Bank is progressing on its transition plan and incorporating market developments as they arise. Details related to certain market developments are noted below:
To help support the transition of legacy derivative contracts, the Bank’s registered swap dealer and four additional Bank affiliates have adhered to the International Swaps and Derivatives Association IBOR Fallbacks Protocol (ISDA Protocol). The ISDA Protocol, which took effect on January 25, 2021, provides an efficient transition mechanism for mutually adhering counterparties to incorporate prescribed fallback rates into legacy derivative contracts.
Further to IBA’s confirmation of its timeline for LIBOR cessation, London Clearing House and the Chicago Mercantile Exchange (CME) Group have established a process with market participants to convert outstanding LIBOR swaps into corresponding market standard ARR-based contracts.
In July 2021, the Alternative Reference Rates Committee formally recommended CME Group’s forward-looking Secured Overnight Financing Rate (SOFR) term rates, following completion of a key change in interdealer trading conventions on July 26, 2021 under the SOFR First initiative.
As a result of the decision taken by international regulators to transition from IBORs to ARRs, the IASB undertook standard setting activities related to the accounting issues of IBOR reform in two phases. On September 26, 2019, the IASB issued Interest Rate Benchmark Reform, Amendments to IFRS 9, IAS 39 and IFRS 7 (Interest Rate Benchmark Reform Phase 1), for which the Bank adopted the applicable amendments in the fourth quarter of 2019. On August 27, 2020, the IASB issued Interest Rate Benchmark Reform – Phase 2, Amendments to IFRS 9, IAS 39, IFRS 7, IFRS 4 and IFRS 16 (Interest Rate Benchmark Reform Phase 2). The amendments are effective for annual periods beginning on or after January 1, 2021, with early adoption permitted. The Bank early adopted these amendments on November 1, 2020 and no transition adjustment was required.
Interest Rate Benchmark Reform Phase 2 addresses issues affecting financial reporting when changes are made to contractual cash flows of financial instruments or hedging relationships as a result of IBOR reform. The amendments permit modification to financial assets, financial liabilities and lessee lease liabilities required as a direct consequence of IBOR reform and made on an economically equivalent basis to be accounted for by updating the effective interest rate (EIR) prospectively. If the modification does not meet the practical expedient requirements, existing IFRS requirements are applied. Reliefs are also provided for an entity’s hedge accounting relationships in circumstances where changes to hedged items and hedging instruments arise as a result of IBOR reform. The amendments enable entities to amend the formal designation and documentation of a hedging relationship to reflect these changes without discontinuing the hedging relationship or designating a new hedging relationship. Permitted changes include redefining the hedged risk to reference an ARR (contractually or non-contractually specified), amending the description of the hedged item and hedging instrument to reflect the ARR, and amending the description of how the entity will assess hedge effectiveness. Hedging relationships within the scope of Interest Rate Benchmark Reform Phase 2 are the same as those within the scope of Interest Rate Benchmark Reform Phase 1. Interest Rate Benchmark Reform Phase 2 also amended IFRS 7, introducing expanded qualitative and quantitative disclosures about the risks arising from IBOR reform, how an entity is managing those risks, its progress in completing the transition to ARRs, and how it is managing the transition. Hedging Relationships Fair Value Hedges The Bank’s fair value hedges principally consist of interest rate swaps that are used to protect against changes in the fair value of fixed-rate financial instruments due to movements in market interest rates.
Changes in the fair value of derivatives that are designated and qualify as fair value hedging instruments are recognized in Net interest income on the Interim Consolidated Statement of Income, along with changes in the fair value of the assets, liabilities, or group thereof that are attributable to the hedged risk. Any change in fair value relating to the ineffective portion of the hedging relationship is recognized immediately in non-interest income.
The cumulative adjustment to the carrying amount of the hedged item (the basis adjustment) is amortized to the Interim Consolidated Statement of Income in Net interest income based on a recalculated EIR over the remaining expected life of the hedged item, with amortization beginning no later than when the hedged item ceases to be adjusted for changes in its fair value attributable to the hedged risk. Where the hedged item has been derecognized, the basis adjustment is immediately released to Net interest income or Non-interest income, as applicable, on the Interim Consolidated Statement of Income.
On November 1, 2020, the Bank changed its accounting policy on a retrospective basis for the presentation of fair value changes on hedging instruments designated in certain fair value hedge accounting relationships, reclassifying the portion excluded from the hedge accounting designation to net interest income
TD BANK GROUP • THIRD QUARTER 2021 • REPORT TO SHAREHOLDERS Page 46
from non-interest income. With the reclassification, changes in the fair value of the hedged item and related hedging instrument (excluding hedge ineffectiveness) are presented in the same lines on the Interim Consolidated Statement of Income. For the comparative three and nine months ended July 31, 2020, the Bank reclassified losses of $382 million and $774 million, respectively, from Non-interest income to Net interest income on the Interim Consolidated Statement of Income to conform with the presentation adopted in the current period. Business Combinations In October 2018, the IASB issued narrow-scope amendments to IFRS 3, Business Combinations. The amendments provide additional guidance on the definition of a business which determines whether an acquisition is of a business or a group of assets. An acquirer recognizes goodwill only when acquiring a business, not when acquiring a group of assets. The Bank adopted these amendments on November 1, 2020 prospectively and they did not have a significant impact on the Bank. Revised Conceptual Framework for Financial Reporting In March 2018, the IASB issued the revised Conceptual Framework for Financial Reporting (Revised Conceptual Framework), which provides a set of concepts to assist the IASB in developing standards and to help preparers consistently apply accounting policies where specific accounting standards do not exist. The framework is not an accounting standard and does not override the requirements that exist in other IFRS standards. The Revised Conceptual Framework describes that financial information must be relevant and faithfully represented to be useful, provides revised definitions and recognition criteria for assets and liabilities, and confirms that different measurement bases are useful and permitted. The Bank adopted the Revised Conceptual Framework prospectively on November 1, 2020 and it did not have a significant impact on the Bank. FUTURE CHANGES IN ACCOUNTING POLICIES The following standard has been issued, but is not yet effective on the date of issuance of the Bank’s Interim Consolidated Financial Statements. The Bank is currently assessing the impact of applying the standard on the Interim Consolidated Financial Statements and will adopt the standard when it becomes effective. Insurance Contracts The IASB issued IFRS 17, Insurance Contracts (IFRS 17) which replaces the guidance in IFRS 4, Insurance Contracts and establishes principles for recognition, measurement, presentation, and disclosure of insurance contracts. Insurance contracts are aggregated into groups which are measured at the risk adjusted present value of cash flows in fulfilling the contracts. Revenue is recognized as insurance contract services are provided over the coverage period. Losses are recognized immediately if the contract group is expected to be onerous.
The standard is effective for annual reporting periods beginning on or after January 1, 2023, which will be November 1, 2023 for the Bank. OSFI’s related Advisory precludes early adoption. The standard will be applied retrospectively with restatement of comparatives unless impracticable.
The adoption of IFRS 17 is a significant initiative for the Bank and is supported by a robust governance structure. The Executive Steering Committee includes representation from the Insurance business, Finance, Actuaries, Risk, Technology, and project management teams. Updates are also provided to the TD Insurance Board, Risk Committee, and Audit Committee.
CHANGES IN INTERNAL CONTROL OVER FINANCIAL REPORTING During the most recent interim period, there have been no changes in the Bank’s policies and procedures and other processes that comprise its internal control over financial reporting, that have materially affected, or are reasonably likely to materially affect, the Bank’s internal control over financial reporting.
TD BANK GROUP • THIRD QUARTER 2021 • REPORT TO SHAREHOLDERS Page 47
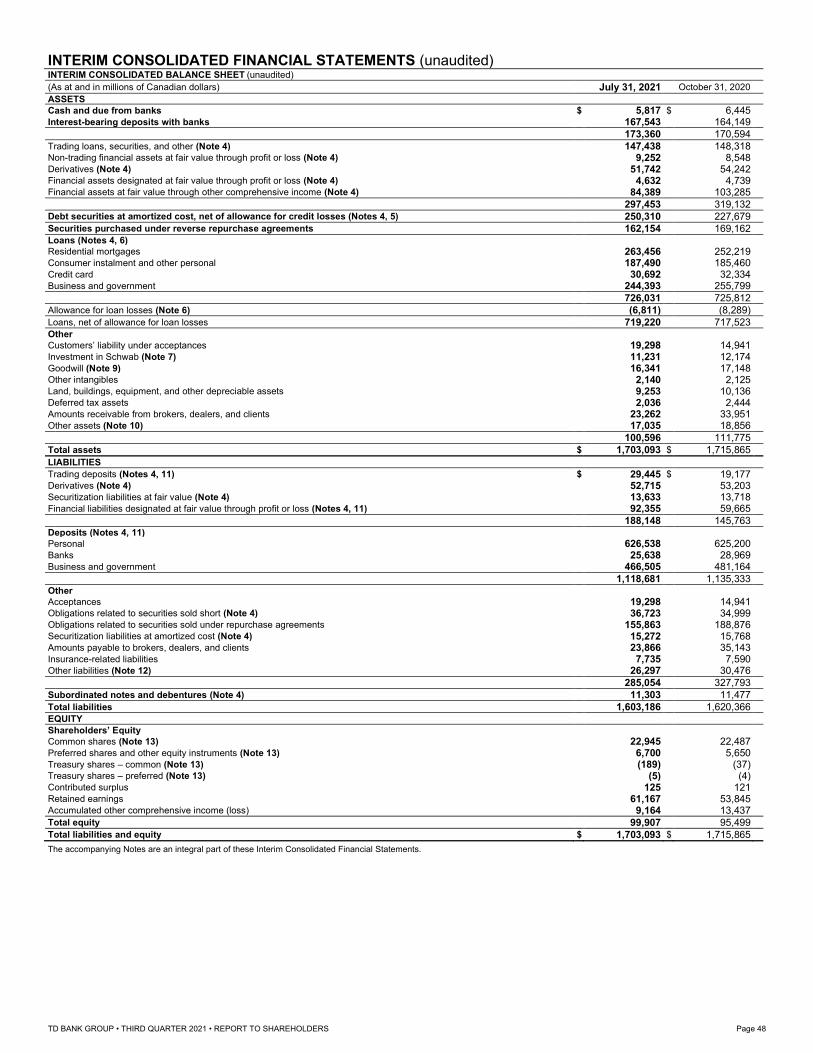
INTERIM CONSOLIDATED FINANCIAL STATEMENTS (unaudited) INTERIM CONSOLIDATED BALANCE SHEET (unaudited)
(As at and in millions of Canadian dollars) July 31, 2021 October 31, 2020
ASSETS
Cash and due from banks $ 5,817 $ 6,445
Interest-bearing deposits with banks 167,543 164,149
173,360 170,594
Trading loans, securities, and other (Note 4) 147,438 148,318
Non-trading financial assets at fair value through profit or loss (Note 4) 9,252 8,548
Derivatives (Note 4) 51,742 54,242
Financial assets designated at fair value through profit or loss (Note 4) 4,632 4,739
Financial assets at fair value through other comprehensive income (Note 4) 84,389 103,285
297,453 319,132
Debt securities at amortized cost, net of allowance for credit losses (Notes 4, 5) 250,310 227,679
Securities purchased under reverse repurchase agreements 162,154 169,162
Loans (Notes 4, 6)
Residential mortgages 263,456 252,219
Consumer instalment and other personal 187,490 185,460
Credit card 30,692 32,334
Business and government 244,393 255,799
726,031 725,812
Allowance for loan losses (Note 6) (6,811) (8,289)
Loans, net of allowance for loan losses 719,220 717,523
Other
Customers’ liability under acceptances 19,298 14,941
Investment in Schwab (Note 7) 11,231 12,174
Goodwill (Note 9) 16,341 17,148
Other intangibles 2,140 2,125
Land, buildings, equipment, and other depreciable assets 9,253 10,136
Deferred tax assets 2,036 2,444
Amounts receivable from brokers, dealers, and clients 23,262 33,951
Other assets (Note 10) 17,035 18,856
100,596 111,775
Total assets $ 1,703,093 $ 1,715,865
LIABILITIES
Trading deposits (Notes 4, 11) $ 29,445 $ 19,177
Derivatives (Note 4) 52,715 53,203
Securitization liabilities at fair value (Note 4) 13,633 13,718
Financial liabilities designated at fair value through profit or loss (Notes 4, 11) 92,355 59,665
188,148 145,763
Deposits (Notes 4, 11)
Personal 626,538 625,200
Banks 25,638 28,969
Business and government 466,505 481,164
1,118,681 1,135,333
Other
Acceptances 19,298 14,941
Obligations related to securities sold short (Note 4) 36,723 34,999
Obligations related to securities sold under repurchase agreements 155,863 188,876
Securitization liabilities at amortized cost (Note 4) 15,272 15,768
Amounts payable to brokers, dealers, and clients 23,866 35,143
Insurance-related liabilities 7,735 7,590
Other liabilities (Note 12) 26,297 30,476
285,054 327,793
Subordinated notes and debentures (Note 4) 11,303 11,477
Total liabilities 1,603,186 1,620,366
EQUITY
Shareholders’ Equity
Common shares (Note 13) 22,945 22,487
Preferred shares and other equity instruments (Note 13) 6,700 5,650
Treasury shares – common (Note 13) (189) (37) Treasury shares – preferred (Note 13) (5) (4) Contributed surplus 125 121
Retained earnings 61,167 53,845
Accumulated other comprehensive income (loss) 9,164 13,437
Total equity 99,907 95,499
Total liabilities and equity $ 1,703,093 $ 1,715,865
The accompanying Notes are an integral part of these Interim Consolidated Financial Statements.
TD BANK GROUP • THIRD QUARTER 2021 • REPORT TO SHAREHOLDERS Page 48
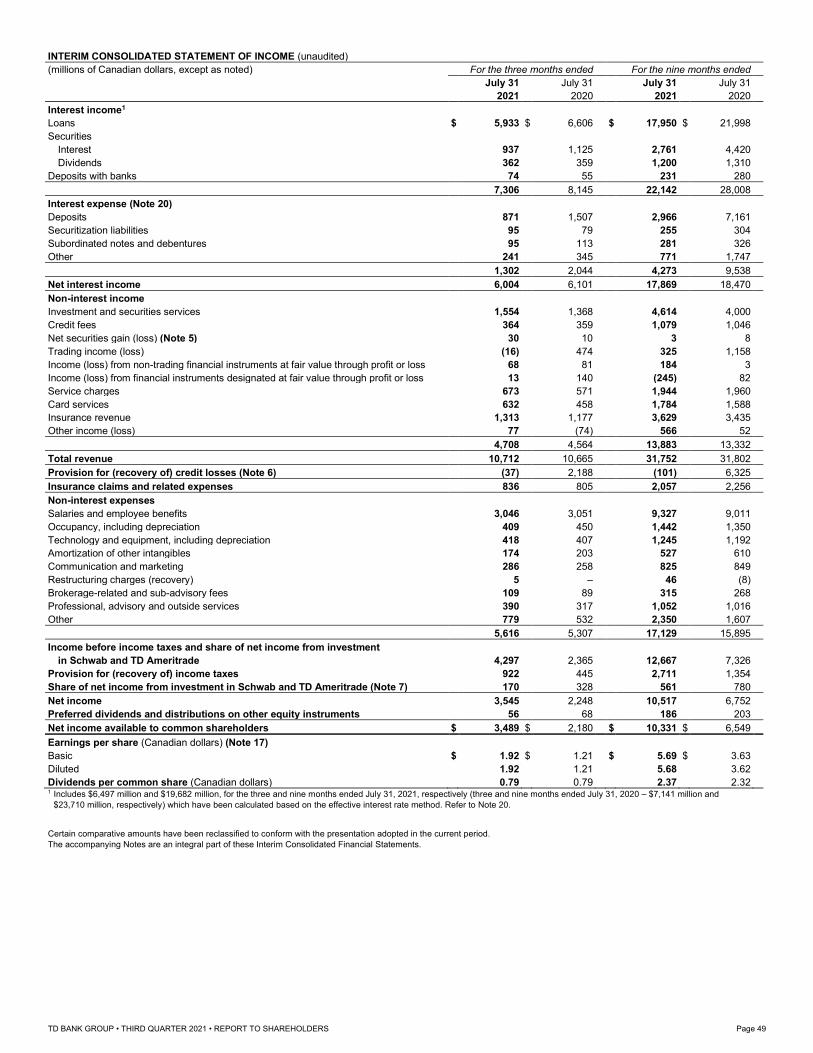
INTERIM CONSOLIDATED STATEMENT OF INCOME (unaudited)
(millions of Canadian dollars, except as noted) For the three months ended For the nine months ended
July 31 July 31 July 31 July 31
2021 2020 2021 2020
Interest income1
Loans $ 5,933 $ 6,606 $ 17,950 $ 21,998
Securities
Interest 937 1,125 2,761 4,420
Dividends 362 359 1,200 1,310
Deposits with banks 74 55 231 280
7,306 8,145 22,142 28,008
Interest expense (Note 20)
Deposits 871 1,507 2,966 7,161
Securitization liabilities 95 79 255 304
Subordinated notes and debentures 95 113 281 326
Other 241 345 771 1,747
1,302 2,044 4,273 9,538
Net interest income 6,004 6,101 17,869 18,470
Non-interest income
Investment and securities services 1,554 1,368 4,614 4,000
Credit fees 364 359 1,079 1,046
Net securities gain (loss) (Note 5) 30 10 3 8
Trading income (loss) (16) 474 325 1,158
Income (loss) from non-trading financial instruments at fair value through profit or loss 68 81 184 3
Income (loss) from financial instruments designated at fair value through profit or loss 13 140 (245) 82
Service charges 673 571 1,944 1,960
Card services 632 458 1,784 1,588
Insurance revenue 1,313 1,177 3,629 3,435
Other income (loss) 77 (74) 566 52
4,708 4,564 13,883 13,332
Total revenue 10,712 10,665 31,752 31,802
Provision for (recovery of) credit losses (Note 6) (37) 2,188 (101) 6,325
Insurance claims and related expenses 836 805 2,057 2,256
Non-interest expenses
Salaries and employee benefits 3,046 3,051 9,327 9,011
Occupancy, including depreciation 409 450 1,442 1,350
Technology and equipment, including depreciation 418 407 1,245 1,192
Amortization of other intangibles 174 203 527 610
Communication and marketing 286 258 825 849
Restructuring charges (recovery) 5 – 46 (8)
Brokerage-related and sub-advisory fees 109 89 315 268
Professional, advisory and outside services 390 317 1,052 1,016
Other 779 532 2,350 1,607
5,616 5,307 17,129 15,895
Income before income taxes and share of net income from investment
in Schwab and TD Ameritrade 4,297 2,365 12,667 7,326
Provision for (recovery of) income taxes 922 445 2,711 1,354
Share of net income from investment in Schwab and TD Ameritrade (Note 7) 170 328 561 780
Net income 3,545 2,248 10,517 6,752
Preferred dividends and distributions on other equity instruments 56 68 186 203
Net income available to common shareholders $ 3,489 $ 2,180 $ 10,331 $ 6,549
Earnings per share (Canadian dollars) (Note 17)
Basic $ 1.92 $ 1.21 $ 5.69 $ 3.63
Diluted 1.92 1.21 5.68 3.62
Dividends per common share (Canadian dollars) 0.79 0.79 2.37 2.32 1 Includes $6,497 million and $19,682 million, for the three and nine months ended July 31, 2021, respectively (three and nine months ended July 31, 2020 – $7,141 million and
$23,710 million, respectively) which have been calculated based on the effective interest rate method. Refer to Note 20.
Certain comparative amounts have been reclassified to conform with the presentation adopted in the current period.
The accompanying Notes are an integral part of these Interim Consolidated Financial Statements.
TD BANK GROUP • THIRD QUARTER 2021 • REPORT TO SHAREHOLDERS Page 49
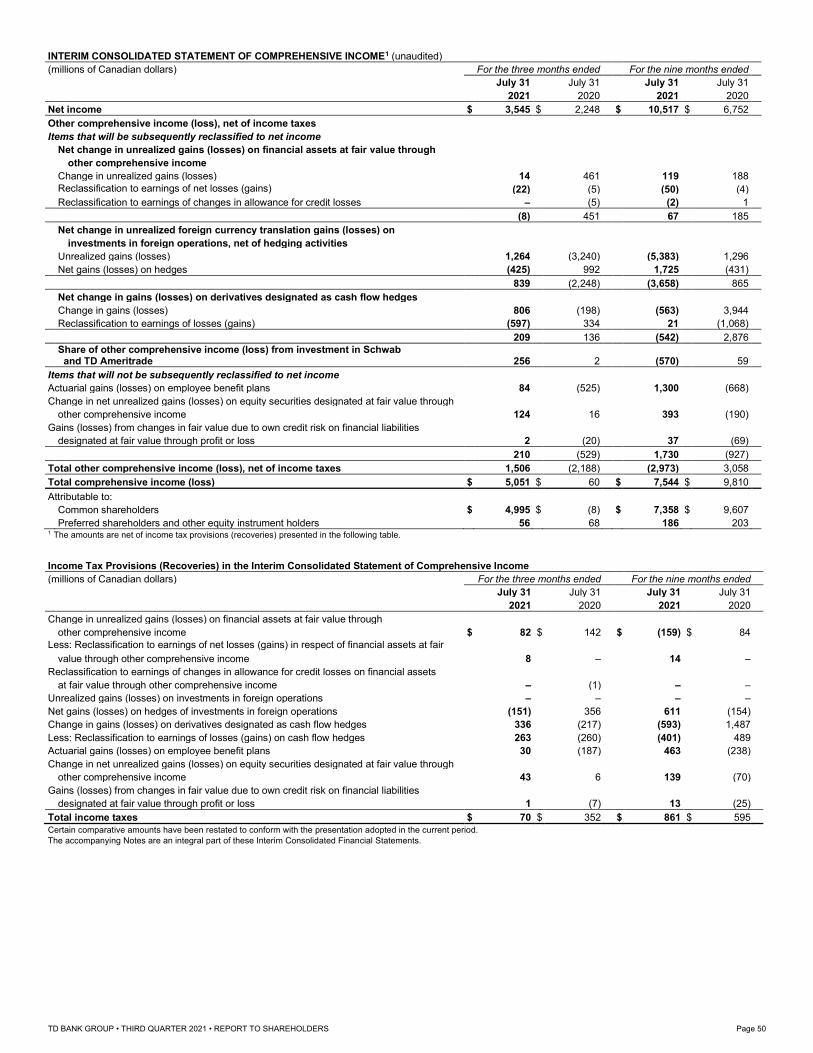
INTERIM CONSOLIDATED STATEMENT OF COMPREHENSIVE INCOME1 (unaudited)
(millions of Canadian dollars) For the three months ended For the nine months ended
July 31 July 31 July 31 July 31
2021 2020 2021 2020
Net income $ 3,545 $ 2,248 $ 10,517 $ 6,752
Other comprehensive income (loss), net of income taxes
Items that will be subsequently reclassified to net income
Net change in unrealized gains (losses) on financial assets at fair value through
other comprehensive income
Change in unrealized gains (losses) 14 461 119 188
Reclassification to earnings of net losses (gains) (22) (5) (50) (4)
Reclassification to earnings of changes in allowance for credit losses – (5) (2) 1
(8) 451 67 185
Net change in unrealized foreign currency translation gains (losses) on
investments in foreign operations, net of hedging activities
Unrealized gains (losses) 1,264 (3,240) (5,383) 1,296
Net gains (losses) on hedges (425) 992 1,725 (431)
839 (2,248) (3,658) 865
Net change in gains (losses) on derivatives designated as cash flow hedges
Change in gains (losses) 806 (198) (563) 3,944
Reclassification to earnings of losses (gains) (597) 334 21 (1,068)
209 136 (542) 2,876
Share of other comprehensive income (loss) from investment in Schwab and TD Ameritrade 256 2 (570) 59
Items that will not be subsequently reclassified to net income
Actuarial gains (losses) on employee benefit plans 84 (525) 1,300 (668)
Change in net unrealized gains (losses) on equity securities designated at fair value through
other comprehensive income 124 16 393 (190)
Gains (losses) from changes in fair value due to own credit risk on financial liabilities
designated at fair value through profit or loss 2 (20) 37 (69)
210 (529) 1,730 (927)
Total other comprehensive income (loss), net of income taxes 1,506 (2,188) (2,973) 3,058
Total comprehensive income (loss) $ 5,051 $ 60 $ 7,544 $ 9,810
Attributable to:
Common shareholders $ 4,995 $ (8) $ 7,358 $ 9,607
Preferred shareholders and other equity instrument holders 56 68 186 203 1 The amounts are net of income tax provisions (recoveries) presented in the following table.
Income Tax Provisions (Recoveries) in the Interim Consolidated Statement of Comprehensive Income
(millions of Canadian dollars) For the three months ended For the nine months ended
July 31 July 31 July 31 July 31
2021 2020 2021 2020
Change in unrealized gains (losses) on financial assets at fair value through
other comprehensive income $ 82 $ 142 $ (159) $ 84
Less: Reclassification to earnings of net losses (gains) in respect of financial assets at fair
value through other comprehensive income 8 – 14 –
Reclassification to earnings of changes in allowance for credit losses on financial assets
at fair value through other comprehensive income – (1) – –
Unrealized gains (losses) on investments in foreign operations – – – –
Net gains (losses) on hedges of investments in foreign operations (151) 356 611 (154)
Change in gains (losses) on derivatives designated as cash flow hedges 336 (217) (593) 1,487
Less: Reclassification to earnings of losses (gains) on cash flow hedges 263 (260) (401) 489
Actuarial gains (losses) on employee benefit plans 30 (187) 463 (238)
Change in net unrealized gains (losses) on equity securities designated at fair value through
other comprehensive income 43 6 139 (70)
Gains (losses) from changes in fair value due to own credit risk on financial liabilities
designated at fair value through profit or loss 1 (7) 13 (25)
Total income taxes $ 70 $ 352 $ 861 $ 595
Certain comparative amounts have been restated to conform with the presentation adopted in the current period.
The accompanying Notes are an integral part of these Interim Consolidated Financial Statements.
TD BANK GROUP • THIRD QUARTER 2021 • REPORT TO SHAREHOLDERS Page 50
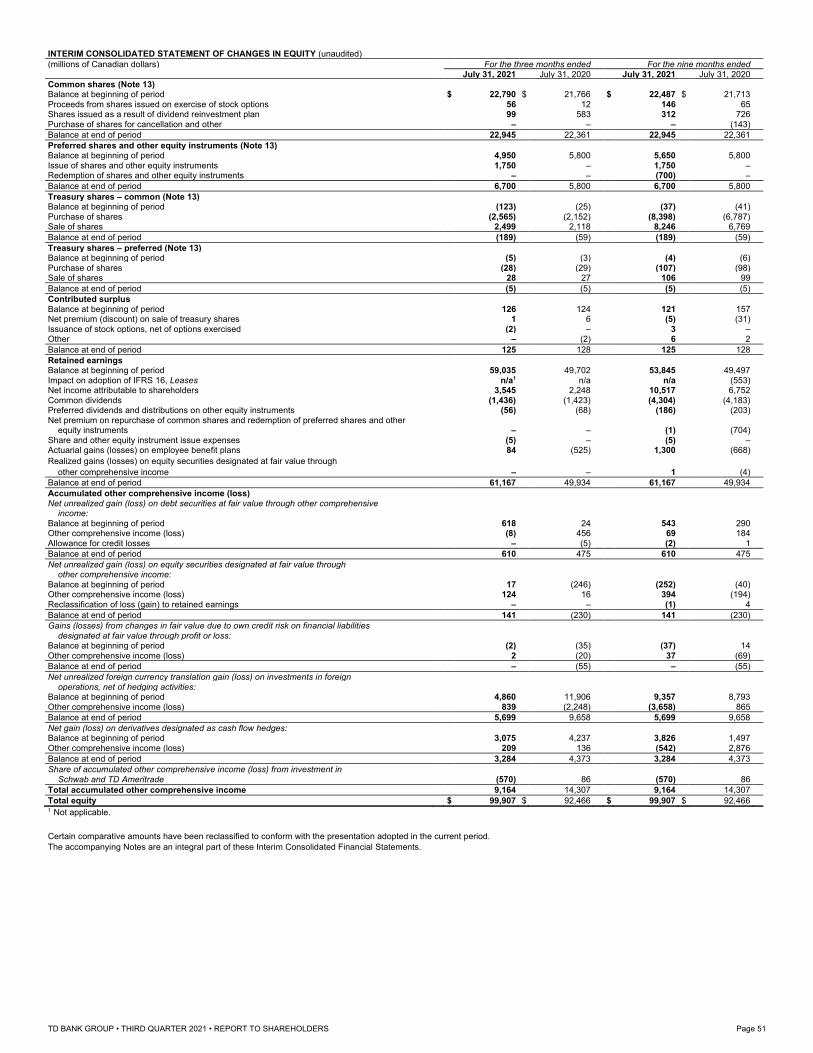
INTERIM CONSOLIDATED STATEMENT OF CHANGES IN EQUITY (unaudited)
(millions of Canadian dollars) For the three months ended For the nine months ended
July 31, 2021 July 31, 2020 July 31, 2021 July 31, 2020
Common shares (Note 13)
Balance at beginning of period $ 22,790 $ 21,766 $ 22,487 $ 21,713
Proceeds from shares issued on exercise of stock options 56 12 146 65
Shares issued as a result of dividend reinvestment plan 99 583 312 726
Purchase of shares for cancellation and other – – – (143)
Balance at end of period 22,945 22,361 22,945 22,361
Preferred shares and other equity instruments (Note 13)
Balance at beginning of period 4,950 5,800 5,650 5,800
Issue of shares and other equity instruments 1,750 – 1,750 –
Redemption of shares and other equity instruments – – (700) –
Balance at end of period 6,700 5,800 6,700 5,800
Treasury shares – common (Note 13)
Balance at beginning of period (123) (25) (37) (41)
Purchase of shares (2,565) (2,152) (8,398) (6,787)
Sale of shares 2,499 2,118 8,246 6,769
Balance at end of period (189) (59) (189) (59)
Treasury shares – preferred (Note 13)
Balance at beginning of period (5) (3) (4) (6)
Purchase of shares (28) (29) (107) (98)
Sale of shares 28 27 106 99
Balance at end of period (5) (5) (5) (5)
Contributed surplus
Balance at beginning of period 126 124 121 157
Net premium (discount) on sale of treasury shares 1 6 (5) (31)
Issuance of stock options, net of options exercised (2) – 3 –
Other – (2) 6 2
Balance at end of period 125 128 125 128
Retained earnings
Balance at beginning of period 59,035 49,702 53,845 49,497
Impact on adoption of IFRS 16, Leases n/a1 n/a n/a (553)
Net income attributable to shareholders 3,545 2,248 10,517 6,752
Common dividends (1,436) (1,423) (4,304) (4,183)
Preferred dividends and distributions on other equity instruments (56) (68) (186) (203)
Net premium on repurchase of common shares and redemption of preferred shares and other
equity instruments – – (1) (704)
Share and other equity instrument issue expenses (5) – (5) –
Actuarial gains (losses) on employee benefit plans 84 (525) 1,300 (668)
Realized gains (losses) on equity securities designated at fair value through
other comprehensive income – – 1 (4)
Balance at end of period 61,167 49,934 61,167 49,934
Accumulated other comprehensive income (loss)
Net unrealized gain (loss) on debt securities at fair value through other comprehensive
income:
Balance at beginning of period 618 24 543 290
Other comprehensive income (loss) (8) 456 69 184
Allowance for credit losses – (5) (2) 1
Balance at end of period 610 475 610 475
Net unrealized gain (loss) on equity securities designated at fair value through
other comprehensive income:
Balance at beginning of period 17 (246) (252) (40)
Other comprehensive income (loss) 124 16 394 (194)
Reclassification of loss (gain) to retained earnings – – (1) 4
Balance at end of period 141 (230) 141 (230)
Gains (losses) from changes in fair value due to own credit risk on financial liabilities
designated at fair value through profit or loss:
Balance at beginning of period (2) (35) (37) 14
Other comprehensive income (loss) 2 (20) 37 (69)
Balance at end of period – (55) – (55)
Net unrealized foreign currency translation gain (loss) on investments in foreign
operations, net of hedging activities:
Balance at beginning of period 4,860 11,906 9,357 8,793
Other comprehensive income (loss) 839 (2,248) (3,658) 865
Balance at end of period 5,699 9,658 5,699 9,658
Net gain (loss) on derivatives designated as cash flow hedges:
Balance at beginning of period 3,075 4,237 3,826 1,497
Other comprehensive income (loss) 209 136 (542) 2,876
Balance at end of period 3,284 4,373 3,284 4,373
Share of accumulated other comprehensive income (loss) from investment in
Schwab and TD Ameritrade (570) 86 (570) 86
Total accumulated other comprehensive income 9,164 14,307 9,164 14,307
Total equity $ 99,907 $ 92,466 $ 99,907 $ 92,466 1 Not applicable.
Certain comparative amounts have been reclassified to conform with the presentation adopted in the current period.
The accompanying Notes are an integral part of these Interim Consolidated Financial Statements.
TD BANK GROUP • THIRD QUARTER 2021 • REPORT TO SHAREHOLDERS Page 51
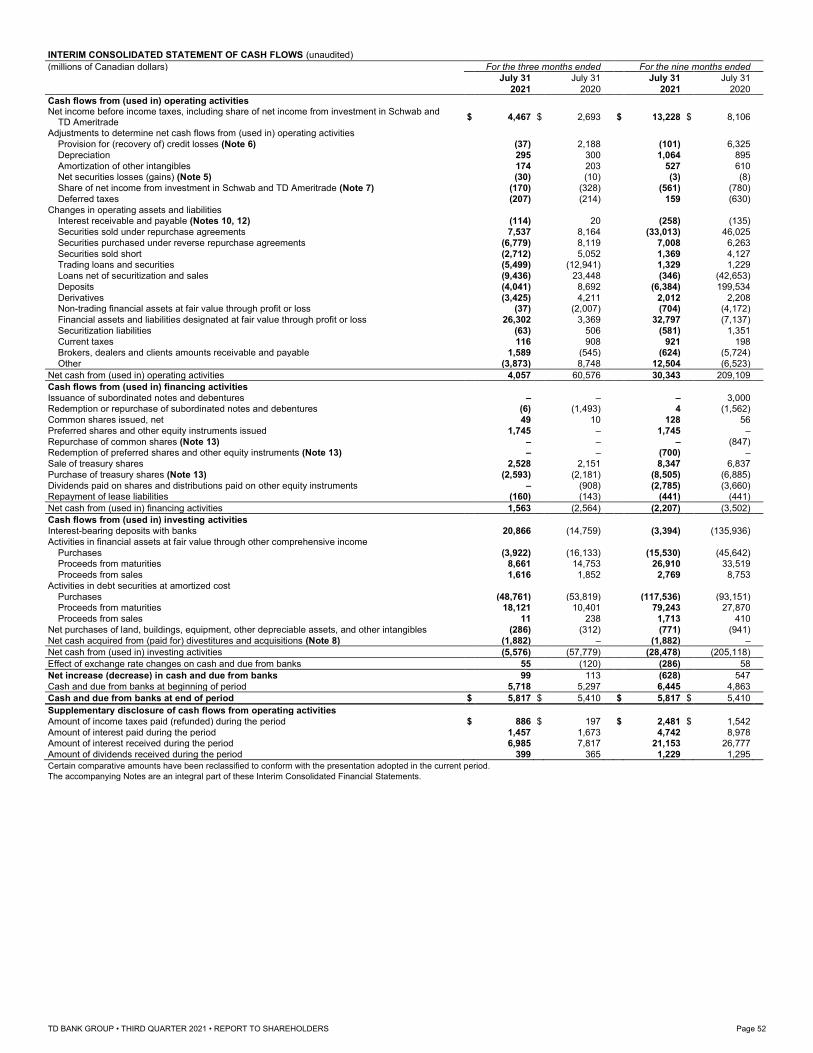
INTERIM CONSOLIDATED STATEMENT OF CASH FLOWS (unaudited)
(millions of Canadian dollars) For the three months ended For the nine months ended
July 31 July 31 July 31 July 31
2021 2020 2021 2020
Cash flows from (used in) operating activities Net income before income taxes, including share of net income from investment in Schwab and TD Ameritrade
$ 4,467 $ 2,693 $ 13,228 $ 8,106
Adjustments to determine net cash flows from (used in) operating activities
Provision for (recovery of) credit losses (Note 6) (37) 2,188 (101) 6,325
Depreciation 295 300 1,064 895
Amortization of other intangibles 174 203 527 610 Net securities losses (gains) (Note 5) (30) (10) (3) (8)
Share of net income from investment in Schwab and TD Ameritrade (Note 7) (170) (328) (561) (780)
Deferred taxes (207) (214) 159 (630)
Changes in operating assets and liabilities Interest receivable and payable (Notes 10, 12) (114) 20 (258) (135)
Securities sold under repurchase agreements 7,537 8,164 (33,013) 46,025
Securities purchased under reverse repurchase agreements (6,779) 8,119 7,008 6,263
Securities sold short (2,712) 5,052 1,369 4,127 Trading loans and securities (5,499) (12,941) 1,329 1,229
Loans net of securitization and sales (9,436) 23,448 (346) (42,653)
Deposits (4,041) 8,692 (6,384) 199,534
Derivatives (3,425) 4,211 2,012 2,208 Non-trading financial assets at fair value through profit or loss (37) (2,007) (704) (4,172)
Financial assets and liabilities designated at fair value through profit or loss 26,302 3,369 32,797 (7,137)
Securitization liabilities (63) 506 (581) 1,351
Current taxes 116 908 921 198
Brokers, dealers and clients amounts receivable and payable 1,589 (545) (624) (5,724)
Other (3,873) 8,748 12,504 (6,523)
Net cash from (used in) operating activities 4,057 60,576 30,343 209,109
Cash flows from (used in) financing activities
Issuance of subordinated notes and debentures – – – 3,000 Redemption or repurchase of subordinated notes and debentures (6) (1,493) 4 (1,562)
Common shares issued, net 49 10 128 56
Preferred shares and other equity instruments issued 1,745 – 1,745 –
Repurchase of common shares (Note 13) – – – (847) Redemption of preferred shares and other equity instruments (Note 13) – – (700) –
Sale of treasury shares 2,528 2,151 8,347 6,837
Purchase of treasury shares (Note 13) (2,593) (2,181) (8,505) (6,885)
Dividends paid on shares and distributions paid on other equity instruments – (908) (2,785) (3,660) Repayment of lease liabilities (160) (143) (441) (441)
Net cash from (used in) financing activities 1,563 (2,564) (2,207) (3,502)
Cash flows from (used in) investing activities
Interest-bearing deposits with banks 20,866 (14,759) (3,394) (135,936)
Activities in financial assets at fair value through other comprehensive income
Purchases (3,922) (16,133) (15,530) (45,642) Proceeds from maturities 8,661 14,753 26,910 33,519
Proceeds from sales 1,616 1,852 2,769 8,753
Activities in debt securities at amortized cost
Purchases (48,761) (53,819) (117,536) (93,151) Proceeds from maturities 18,121 10,401 79,243 27,870
Proceeds from sales 11 238 1,713 410
Net purchases of land, buildings, equipment, other depreciable assets, and other intangibles (286) (312) (771) (941)
Net cash acquired from (paid for) divestitures and acquisitions (Note 8) (1,882) – (1,882) –
Net cash from (used in) investing activities (5,576) (57,779) (28,478) (205,118)
Effect of exchange rate changes on cash and due from banks 55 (120) (286) 58
Net increase (decrease) in cash and due from banks 99 113 (628) 547
Cash and due from banks at beginning of period 5,718 5,297 6,445 4,863
Cash and due from banks at end of period $ 5,817 $ 5,410 $ 5,817 $ 5,410
Supplementary disclosure of cash flows from operating activities
Amount of income taxes paid (refunded) during the period $ 886 $ 197 $ 2,481 $ 1,542
Amount of interest paid during the period 1,457 1,673 4,742 8,978 Amount of interest received during the period 6,985 7,817 21,153 26,777
Amount of dividends received during the period 399 365 1,229 1,295
Certain comparative amounts have been reclassified to conform with the presentation adopted in the current period. The accompanying Notes are an integral part of these Interim Consolidated Financial Statements.
TD BANK GROUP • THIRD QUARTER 2021 • REPORT TO SHAREHOLDERS Page 52
NOTES TO INTERIM CONSOLIDATED FINANCIAL STATEMENTS (unaudited)
NOTE 1: NATURE OF OPERATIONS
CORPORATE INFORMATION The Toronto-Dominion Bank is a bank chartered under the Bank Act. The shareholders of a bank are not, as shareholders, liable for any liability, act, or default of
the bank except as otherwise provided under the Bank Act. The Toronto-Dominion Bank and its subsidiaries are collectively known as TD Bank Group (“TD” or the
“Bank”). The Bank was formed through the amalgamation on February 1, 1955, of The Bank of Toronto (chartered in 1855) and The Dominion Bank (chartered
in 1869). The Bank is incorporated and domiciled in Canada with its registered and principal business offices located at 66 Wellington Street West, Toronto,
Ontario. TD serves customers in three business segments operating in a number of locations in key financial centres around the globe: Canadian Retail,
U.S. Retail, and Wholesale Banking. BASIS OF PREPARATION The accompanying Interim Consolidated Financial Statements and accounting principles followed by the Bank have been prepared in accordance with
International Financial Reporting Standards (IFRS), as issued by the International Accounting Standards Board (IASB), including the accounting requirements of
the Office of the Superintendent of Financial Institutions Canada (OSFI). The Interim Consolidated Financial Statements are presented in Canadian dollars, unless
otherwise indicated. These Interim Consolidated Financial Statements were prepared on a condensed basis in accordance with International Accounting Standard 34, Interim
Financial Reporting using the accounting policies as described in Note 2 of the Bank’s 2020 Annual Consolidated Financial Statements, except for the changes in
accounting policies described in Note 2 of this report. Certain comparative amounts have been revised to conform with the presentation adopted in the current
period. The preparation of the Interim Consolidated Financial Statements requires that management make estimates, assumptions, and judgments regarding the
reported amount of assets, liabilities, revenue and expenses, and disclosure of contingent assets and liabilities, as further described in Note 3 of the Bank’s 2020
Annual Consolidated Financial Statements and in Note 3 of this report. Accordingly, actual results may differ from estimated amounts as future confirming events
occur. The Bank’s Interim Consolidated Financial Statements have been prepared using uniform accounting policies for like transactions and events in similar
circumstances. All intercompany transactions, balances, and unrealized gains and losses on transactions are eliminated on consolidation. The Interim Consolidated Financial Statements for the three and nine months ended July 31, 2021, were approved and authorized for issue by the Bank’s
Board of Directors, in accordance with a recommendation of the Audit Committee, on August 25, 2021. As the Interim Consolidated Financial Statements do not include all of the disclosures normally provided in the Annual Consolidated Financial Statements, they
should be read in conjunction with the Bank’s 2020 Annual Consolidated Financial Statements and the accompanying Notes, and the shaded sections of the 2020
Management’s Discussion and Analysis (MD&A). Certain disclosures are included in the shaded sections of the “Managing Risk” section of the MD&A in this
report, as permitted by IFRS, and form an integral part of the Interim Consolidated Financial Statements.
NOTE 2: CURRENT AND FUTURE CHANGES IN ACCOUNTING POLICIES
CURRENT CHANGES IN ACCOUNTING POLICY The following new standards and changes in accounting policies have been adopted by the Bank on November 1, 2020.
IBOR Reform and its Effects on Financial Reporting Various interest rates and other indices that are deemed to be “benchmarks”, including interbank offered rate (IBOR) benchmarks, have been, and continue to be,
the subject of international regulatory guidance and proposals for reform. Following the announcements by the U.K. Financial Conduct Authority in July 2017 that it
would no longer compel banks to submit London Interbank Offered Rates (LIBORs) after December 2021 and by ICE Benchmark Administration (IBA) in March
2021 that it will cease publication of: (i) GBP LIBOR (all tenors), EUR LIBOR (all tenors), CHF LIBOR (all tenors), JPY LIBOR (all tenors), and US LIBOR (1-week
and 2-months) following December 31, 2021; and (ii) US LIBOR (overnight, 1-month, 3-months, 6-months, and 12-months) following June 30, 2023, efforts to
transition away from IBORs to alternative reference rates (ARRs) have been continuing in various jurisdictions. The global transition from IBORs to ARRs
introduces challenges and risks that may have adverse consequences on the Bank, its clients, and the financial services industry. The replacement of IBORs or
other benchmark rates could result in market dislocation and different financial performance for legacy transactions, require different hedging strategies, affect the
Bank’s capital and liquidity planning and management, or have other adverse consequences to market participants. Additionally, any adverse impacts on the value
of and return on existing instruments and contracts for the Bank’s clients may present an increased risk of litigation, regulatory intervention, and possible
reputational damage. To manage the transition to ARRs, the Bank has established an enterprise-wide, cross functional initiative with Board oversight and dedicated work streams to
evaluate and address the key areas of impact on the Bank’s products, services, systems, documents, processes, models, funding and liquidity planning, risk
management frameworks, and financial reporting with the intention of managing the impact through appropriate mitigating actions. The Bank is also actively
participating in industry associations and incorporating best practice guidance from these working groups as well as regulatory bodies into the transition plan, such
as incorporating appropriate fallback language in contracts, making available new products referencing ARRs, ceasing the issuance of IBOR based financial
instruments, and preparing for overall operational readiness.
TD BANK GROUP • THIRD QUARTER 2021 • REPORT TO SHAREHOLDERS Page 53
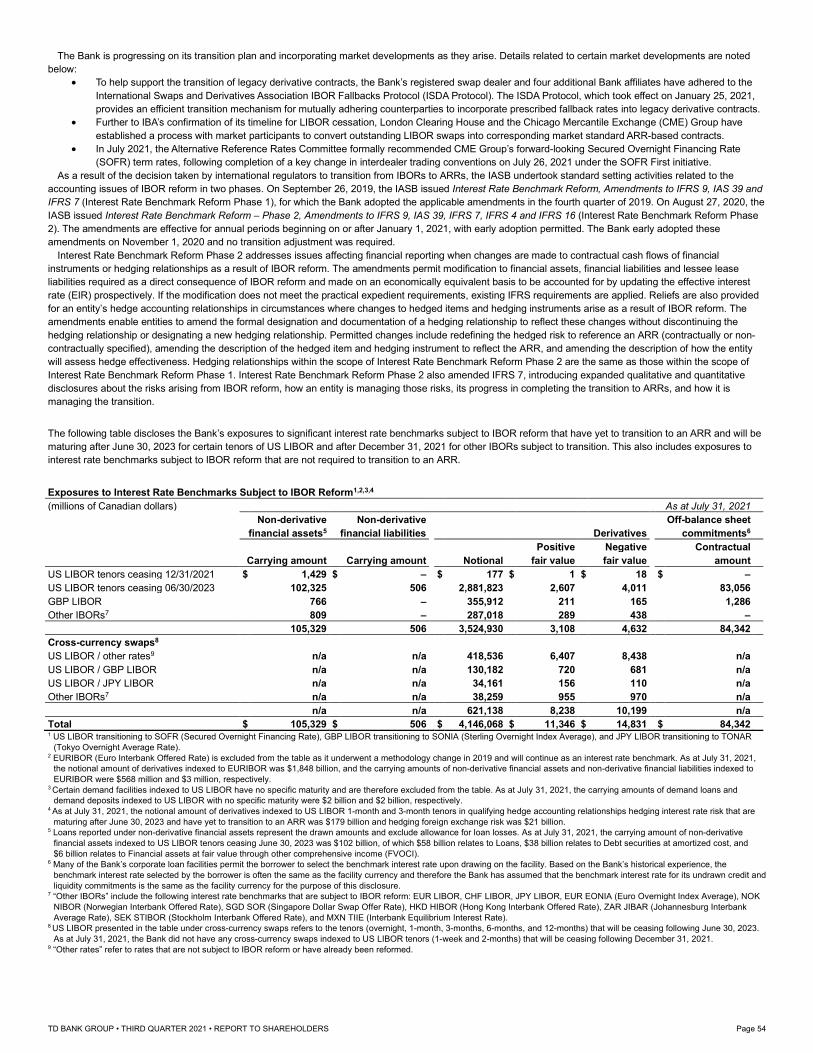
The Bank is progressing on its transition plan and incorporating market developments as they arise. Details related to certain market developments are noted
below: • To help support the transition of legacy derivative contracts, the Bank’s registered swap dealer and four additional Bank affiliates have adhered to the
International Swaps and Derivatives Association IBOR Fallbacks Protocol (ISDA Protocol). The ISDA Protocol, which took effect on January 25, 2021,
provides an efficient transition mechanism for mutually adhering counterparties to incorporate prescribed fallback rates into legacy derivative contracts.
• Further to IBA’s confirmation of its timeline for LIBOR cessation, London Clearing House and the Chicago Mercantile Exchange (CME) Group have
established a process with market participants to convert outstanding LIBOR swaps into corresponding market standard ARR-based contracts.
• In July 2021, the Alternative Reference Rates Committee formally recommended CME Group’s forward-looking Secured Overnight Financing Rate
(SOFR) term rates, following completion of a key change in interdealer trading conventions on July 26, 2021 under the SOFR First initiative.
As a result of the decision taken by international regulators to transition from IBORs to ARRs, the IASB undertook standard setting activities related to the
accounting issues of IBOR reform in two phases. On September 26, 2019, the IASB issued Interest Rate Benchmark Reform, Amendments to IFRS 9, IAS 39 and
IFRS 7 (Interest Rate Benchmark Reform Phase 1), for which the Bank adopted the applicable amendments in the fourth quarter of 2019. On August 27, 2020, the
IASB issued Interest Rate Benchmark Reform – Phase 2, Amendments to IFRS 9, IAS 39, IFRS 7, IFRS 4 and IFRS 16 (Interest Rate Benchmark Reform Phase
2). The amendments are effective for annual periods beginning on or after January 1, 2021, with early adoption permitted. The Bank early adopted these
amendments on November 1, 2020 and no transition adjustment was required. Interest Rate Benchmark Reform Phase 2 addresses issues affecting financial reporting when changes are made to contractual cash flows of financial
instruments or hedging relationships as a result of IBOR reform. The amendments permit modification to financial assets, financial liabilities and lessee lease
liabilities required as a direct consequence of IBOR reform and made on an economically equivalent basis to be accounted for by updating the effective interest
rate (EIR) prospectively. If the modification does not meet the practical expedient requirements, existing IFRS requirements are applied. Reliefs are also provided
for an entity’s hedge accounting relationships in circumstances where changes to hedged items and hedging instruments arise as a result of IBOR reform. The
amendments enable entities to amend the formal designation and documentation of a hedging relationship to reflect these changes without discontinuing the
hedging relationship or designating a new hedging relationship. Permitted changes include redefining the hedged risk to reference an ARR (contractually or non-
contractually specified), amending the description of the hedged item and hedging instrument to reflect the ARR, and amending the description of how the entity
will assess hedge effectiveness. Hedging relationships within the scope of Interest Rate Benchmark Reform Phase 2 are the same as those within the scope of
Interest Rate Benchmark Reform Phase 1. Interest Rate Benchmark Reform Phase 2 also amended IFRS 7, introducing expanded qualitative and quantitative
disclosures about the risks arising from IBOR reform, how an entity is managing those risks, its progress in completing the transition to ARRs, and how it is
managing the transition. The following table discloses the Bank’s exposures to significant interest rate benchmarks subject to IBOR reform that have yet to transition to an ARR and will be
maturing after June 30, 2023 for certain tenors of US LIBOR and after December 31, 2021 for other IBORs subject to transition. This also includes exposures to
interest rate benchmarks subject to IBOR reform that are not required to transition to an ARR. Exposures to Interest Rate Benchmarks Subject to IBOR Reform1,2,3,4
(millions of Canadian dollars) As at July 31, 2021
Non-derivative Non-derivative Off-balance sheet
financial assets5 financial liabilities Derivatives commitments6
Positive Negative Contractual
Carrying amount Carrying amount Notional fair value fair value amount
US LIBOR tenors ceasing 12/31/2021 $ 1,429 $ – $ 177 $ 1 $ 18 $ –
US LIBOR tenors ceasing 06/30/2023 102,325 506 2,881,823 2,607 4,011 83,056
GBP LIBOR 766 – 355,912 211 165 1,286
Other IBORs7 809 – 287,018 289 438 –
105,329 506 3,524,930 3,108 4,632 84,342
Cross-currency swaps8
US LIBOR / other rates9 n/a n/a 418,536 6,407 8,438 n/a
US LIBOR / GBP LIBOR n/a n/a 130,182 720 681 n/a
US LIBOR / JPY LIBOR n/a n/a 34,161 156 110 n/a
Other IBORs7 n/a n/a 38,259 955 970 n/a
n/a n/a 621,138 8,238 10,199 n/a
Total $ 105,329 $ 506 $ 4,146,068 $ 11,346 $ 14,831 $ 84,342 1 US LIBOR transitioning to SOFR (Secured Overnight Financing Rate), GBP LIBOR transitioning to SONIA (Sterling Overnight Index Average), and JPY LIBOR transitioning to TONAR
(Tokyo Overnight Average Rate). 2 EURIBOR (Euro Interbank Offered Rate) is excluded from the table as it underwent a methodology change in 2019 and will continue as an interest rate benchmark. As at July 31, 2021,
the notional amount of derivatives indexed to EURIBOR was $1,848 billion, and the carrying amounts of non-derivative financial assets and non-derivative financial liabilities indexed to
EURIBOR were $568 million and $3 million, respectively. 3 Certain demand facilities indexed to US LIBOR have no specific maturity and are therefore excluded from the table. As at July 31, 2021, the carrying amounts of demand loans and
demand deposits indexed to US LIBOR with no specific maturity were $2 billion and $2 billion, respectively. 4 As at July 31, 2021, the notional amount of derivatives indexed to US LIBOR 1-month and 3-month tenors in qualifying hedge accounting relationships hedging interest rate risk that are
maturing after June 30, 2023 and have yet to transition to an ARR was $179 billion and hedging foreign exchange risk was $21 billion.
5 Loans reported under non-derivative financial assets represent the drawn amounts and exclude allowance for loan losses. As at July 31, 2021, the carrying amount of non-derivative
financial assets indexed to US LIBOR tenors ceasing June 30, 2023 was $102 billion, of which $58 billion relates to Loans, $38 billion relates to Debt securities at amortized cost, and
$6 billion relates to Financial assets at fair value through other comprehensive income (FVOCI). 6 Many of the Bank’s corporate loan facilities permit the borrower to select the benchmark interest rate upon drawing on the facility. Based on the Bank’s historical experience, the
benchmark interest rate selected by the borrower is often the same as the facility currency and therefore the Bank has assumed that the benchmark interest rate for its undrawn credit and
liquidity commitments is the same as the facility currency for the purpose of this disclosure. 7 “Other IBORs” include the following interest rate benchmarks that are subject to IBOR reform: EUR LIBOR, CHF LIBOR, JPY LIBOR, EUR EONIA (Euro Overnight Index Average), NOK
NIBOR (Norwegian Interbank Offered Rate), SGD SOR (Singapore Dollar Swap Offer Rate), HKD HIBOR (Hong Kong Interbank Offered Rate), ZAR JIBAR (Johannesburg Interbank
Average Rate), SEK STIBOR (Stockholm Interbank Offered Rate), and MXN TIIE (Interbank Equilibrium Interest Rate). 8 US LIBOR presented in the table under cross-currency swaps refers to the tenors (overnight, 1-month, 3-months, 6-months, and 12-months) that will be ceasing following June 30, 2023.
As at July 31, 2021, the Bank did not have any cross-currency swaps indexed to US LIBOR tenors (1-week and 2-months) that will be ceasing following December 31, 2021. 9 “Other rates” refer to rates that are not subject to IBOR reform or have already been reformed.
TD BANK GROUP • THIRD QUARTER 2021 • REPORT TO SHAREHOLDERS Page 54
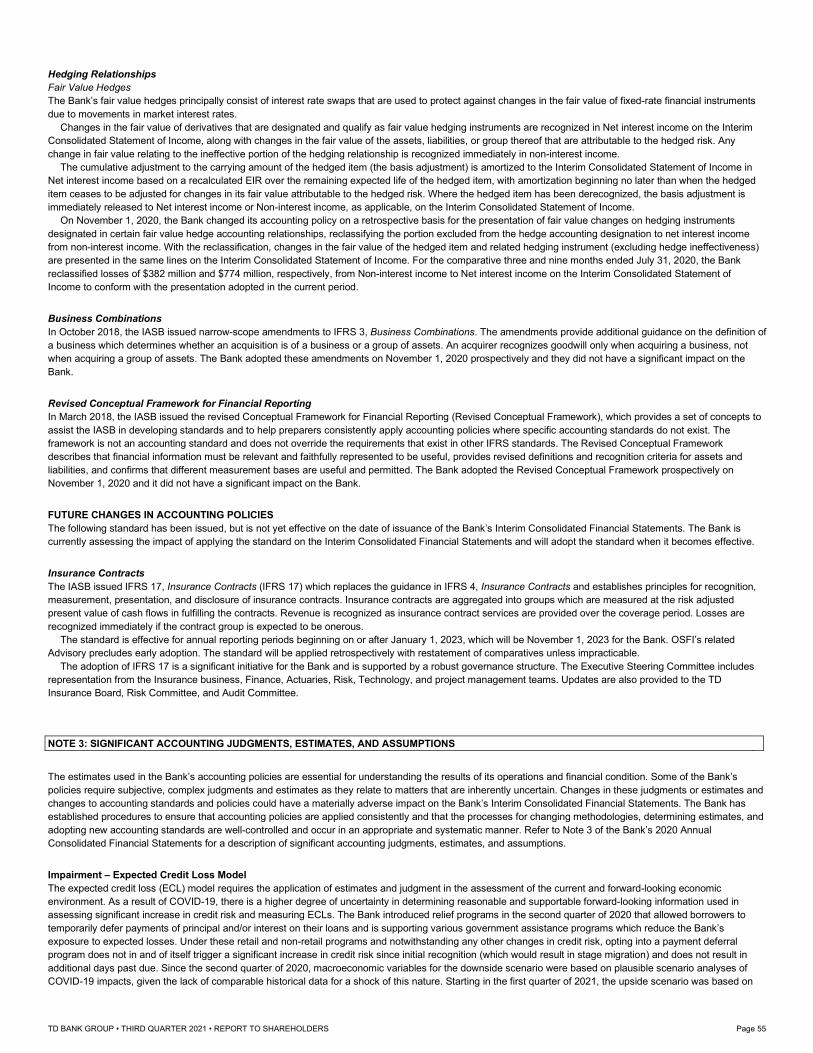
Hedging Relationships
Fair Value Hedges The Bank’s fair value hedges principally consist of interest rate swaps that are used to protect against changes in the fair value of fixed-rate financial instruments
due to movements in market interest rates. Changes in the fair value of derivatives that are designated and qualify as fair value hedging instruments are recognized in Net interest income on the Interim
Consolidated Statement of Income, along with changes in the fair value of the assets, liabilities, or group thereof that are attributable to the hedged risk. Any
change in fair value relating to the ineffective portion of the hedging relationship is recognized immediately in non-interest income. The cumulative adjustment to the carrying amount of the hedged item (the basis adjustment) is amortized to the Interim Consolidated Statement of Income in
Net interest income based on a recalculated EIR over the remaining expected life of the hedged item, with amortization beginning no later than when the hedged
item ceases to be adjusted for changes in its fair value attributable to the hedged risk. Where the hedged item has been derecognized, the basis adjustment is
immediately released to Net interest income or Non-interest income, as applicable, on the Interim Consolidated Statement of Income. On November 1, 2020, the Bank changed its accounting policy on a retrospective basis for the presentation of fair value changes on hedging instruments
designated in certain fair value hedge accounting relationships, reclassifying the portion excluded from the hedge accounting designation to net interest income
from non-interest income. With the reclassification, changes in the fair value of the hedged item and related hedging instrument (excluding hedge ineffectiveness)
are presented in the same lines on the Interim Consolidated Statement of Income. For the comparative three and nine months ended July 31, 2020, the Bank
reclassified losses of $382 million and $774 million, respectively, from Non-interest income to Net interest income on the Interim Consolidated Statement of
Income to conform with the presentation adopted in the current period. Business Combinations In October 2018, the IASB issued narrow-scope amendments to IFRS 3, Business Combinations. The amendments provide additional guidance on the definition of
a business which determines whether an acquisition is of a business or a group of assets. An acquirer recognizes goodwill only when acquiring a business, not
when acquiring a group of assets. The Bank adopted these amendments on November 1, 2020 prospectively and they did not have a significant impact on the
Bank. Revised Conceptual Framework for Financial Reporting
In March 2018, the IASB issued the revised Conceptual Framework for Financial Reporting (Revised Conceptual Framework), which provides a set of concepts to
assist the IASB in developing standards and to help preparers consistently apply accounting policies where specific accounting standards do not exist. The
framework is not an accounting standard and does not override the requirements that exist in other IFRS standards. The Revised Conceptual Framework
describes that financial information must be relevant and faithfully represented to be useful, provides revised definitions and recognition criteria for assets and
liabilities, and confirms that different measurement bases are useful and permitted. The Bank adopted the Revised Conceptual Framework prospectively on
November 1, 2020 and it did not have a significant impact on the Bank. FUTURE CHANGES IN ACCOUNTING POLICIES The following standard has been issued, but is not yet effective on the date of issuance of the Bank’s Interim Consolidated Financial Statements. The Bank is
currently assessing the impact of applying the standard on the Interim Consolidated Financial Statements and will adopt the standard when it becomes effective. Insurance Contracts The IASB issued IFRS 17, Insurance Contracts (IFRS 17) which replaces the guidance in IFRS 4, Insurance Contracts and establishes principles for recognition,
measurement, presentation, and disclosure of insurance contracts. Insurance contracts are aggregated into groups which are measured at the risk adjusted
present value of cash flows in fulfilling the contracts. Revenue is recognized as insurance contract services are provided over the coverage period. Losses are
recognized immediately if the contract group is expected to be onerous. The standard is effective for annual reporting periods beginning on or after January 1, 2023, which will be November 1, 2023 for the Bank. OSFI’s related
Advisory precludes early adoption. The standard will be applied retrospectively with restatement of comparatives unless impracticable. The adoption of IFRS 17 is a significant initiative for the Bank and is supported by a robust governance structure. The Executive Steering Committee includes
representation from the Insurance business, Finance, Actuaries, Risk, Technology, and project management teams. Updates are also provided to the TD
Insurance Board, Risk Committee, and Audit Committee.
NOTE 3: SIGNIFICANT ACCOUNTING JUDGMENTS, ESTIMATES, AND ASSUMPTIONS
The estimates used in the Bank’s accounting policies are essential for understanding the results of its operations and financial condition. Some of the Bank’s
policies require subjective, complex judgments and estimates as they relate to matters that are inherently uncertain. Changes in these judgments or estimates and
changes to accounting standards and policies could have a materially adverse impact on the Bank’s Interim Consolidated Financial Statements. The Bank has
established procedures to ensure that accounting policies are applied consistently and that the processes for changing methodologies, determining estimates, and
adopting new accounting standards are well-controlled and occur in an appropriate and systematic manner. Refer to Note 3 of the Bank’s 2020 Annual
Consolidated Financial Statements for a description of significant accounting judgments, estimates, and assumptions. Impairment – Expected Credit Loss Model The expected credit loss (ECL) model requires the application of estimates and judgment in the assessment of the current and forward-looking economic environment. As a result of COVID-19, there is a higher degree of uncertainty in determining reasonable and supportable forward-looking information used in
assessing significant increase in credit risk and measuring ECLs. The Bank introduced relief programs in the second quarter of 2020 that allowed borrowers to
temporarily defer payments of principal and/or interest on their loans and is supporting various government assistance programs which reduce the Bank’s
exposure to expected losses. Under these retail and non-retail programs and notwithstanding any other changes in credit risk, opting into a payment deferral
program does not in and of itself trigger a significant increase in credit risk since initial recognition (which would result in stage migration) and does not result in
additional days past due. Since the second quarter of 2020, macroeconomic variables for the downside scenario were based on plausible scenario analyses of
COVID-19 impacts, given the lack of comparable historical data for a shock of this nature. Starting in the first quarter of 2021, the upside scenario was based on
TD BANK GROUP • THIRD QUARTER 2021 • REPORT TO SHAREHOLDERS Page 55
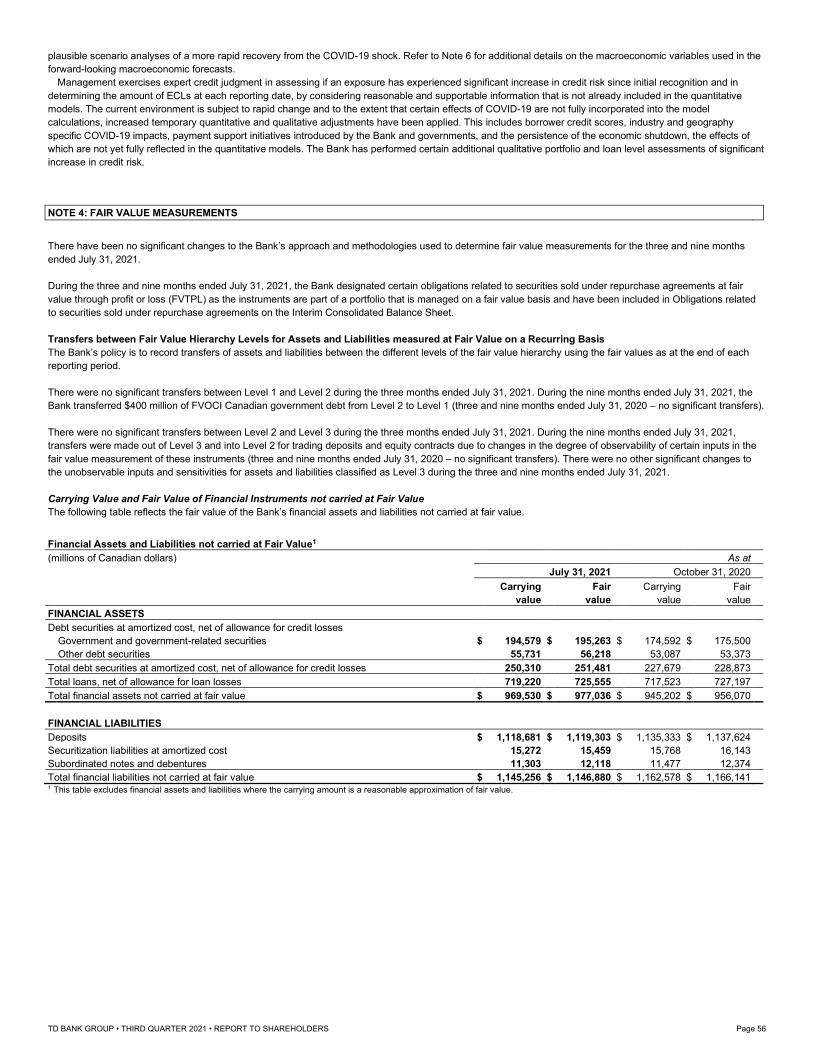
plausible scenario analyses of a more rapid recovery from the COVID-19 shock. Refer to Note 6 for additional details on the macroeconomic variables used in the
forward-looking macroeconomic forecasts. Management exercises expert credit judgment in assessing if an exposure has experienced significant increase in credit risk since initial recognition and in
determining the amount of ECLs at each reporting date, by considering reasonable and supportable information that is not already included in the quantitative models. The current environment is subject to rapid change and to the extent that certain effects of COVID-19 are not fully incorporated into the model
calculations, increased temporary quantitative and qualitative adjustments have been applied. This includes borrower credit scores, industry and geography
specific COVID-19 impacts, payment support initiatives introduced by the Bank and governments, and the persistence of the economic shutdown, the effects of
which are not yet fully reflected in the quantitative models. The Bank has performed certain additional qualitative portfolio and loan level assessments of significant
increase in credit risk.
NOTE 4: FAIR VALUE MEASUREMENTS
There have been no significant changes to the Bank’s approach and methodologies used to determine fair value measurements for the three and nine months
ended July 31, 2021. During the three and nine months ended July 31, 2021, the Bank designated certain obligations related to securities sold under repurchase agreements at fair
value through profit or loss (FVTPL) as the instruments are part of a portfolio that is managed on a fair value basis and have been included in Obligations related
to securities sold under repurchase agreements on the Interim Consolidated Balance Sheet. Transfers between Fair Value Hierarchy Levels for Assets and Liabilities measured at Fair Value on a Recurring Basis The Bank’s policy is to record transfers of assets and liabilities between the different levels of the fair value hierarchy using the fair values as at the end of each
reporting period. There were no significant transfers between Level 1 and Level 2 during the three months ended July 31, 2021. During the nine months ended July 31, 2021, the
Bank transferred $400 million of FVOCI Canadian government debt from Level 2 to Level 1 (three and nine months ended July 31, 2020 – no significant transfers). There were no significant transfers between Level 2 and Level 3 during the three months ended July 31, 2021. During the nine months ended July 31, 2021,
transfers were made out of Level 3 and into Level 2 for trading deposits and equity contracts due to changes in the degree of observability of certain inputs in the
fair value measurement of these instruments (three and nine months ended July 31, 2020 – no significant transfers). There were no other significant changes to
the unobservable inputs and sensitivities for assets and liabilities classified as Level 3 during the three and nine months ended July 31, 2021. Carrying Value and Fair Value of Financial Instruments not carried at Fair Value The following table reflects the fair value of the Bank’s financial assets and liabilities not carried at fair value. Financial Assets and Liabilities not carried at Fair Value1
(millions of Canadian dollars) As at
July 31, 2021 October 31, 2020
Carrying Fair Carrying Fair
value value value value
FINANCIAL ASSETS
Debt securities at amortized cost, net of allowance for credit losses
Government and government-related securities $ 194,579 $ 195,263 $ 174,592 $ 175,500
Other debt securities 55,731 56,218 53,087 53,373
Total debt securities at amortized cost, net of allowance for credit losses 250,310 251,481 227,679 228,873
Total loans, net of allowance for loan losses 719,220 725,555 717,523 727,197
Total financial assets not carried at fair value $ 969,530 $ 977,036 $ 945,202 $ 956,070
FINANCIAL LIABILITIES
Deposits $ 1,118,681 $ 1,119,303 $ 1,135,333 $ 1,137,624
Securitization liabilities at amortized cost 15,272 15,459 15,768 16,143
Subordinated notes and debentures 11,303 12,118 11,477 12,374
Total financial liabilities not carried at fair value $ 1,145,256 $ 1,146,880 $ 1,162,578 $ 1,166,141 1 This table excludes financial assets and liabilities where the carrying amount is a reasonable approximation of fair value.
TD BANK GROUP • THIRD QUARTER 2021 • REPORT TO SHAREHOLDERS Page 56
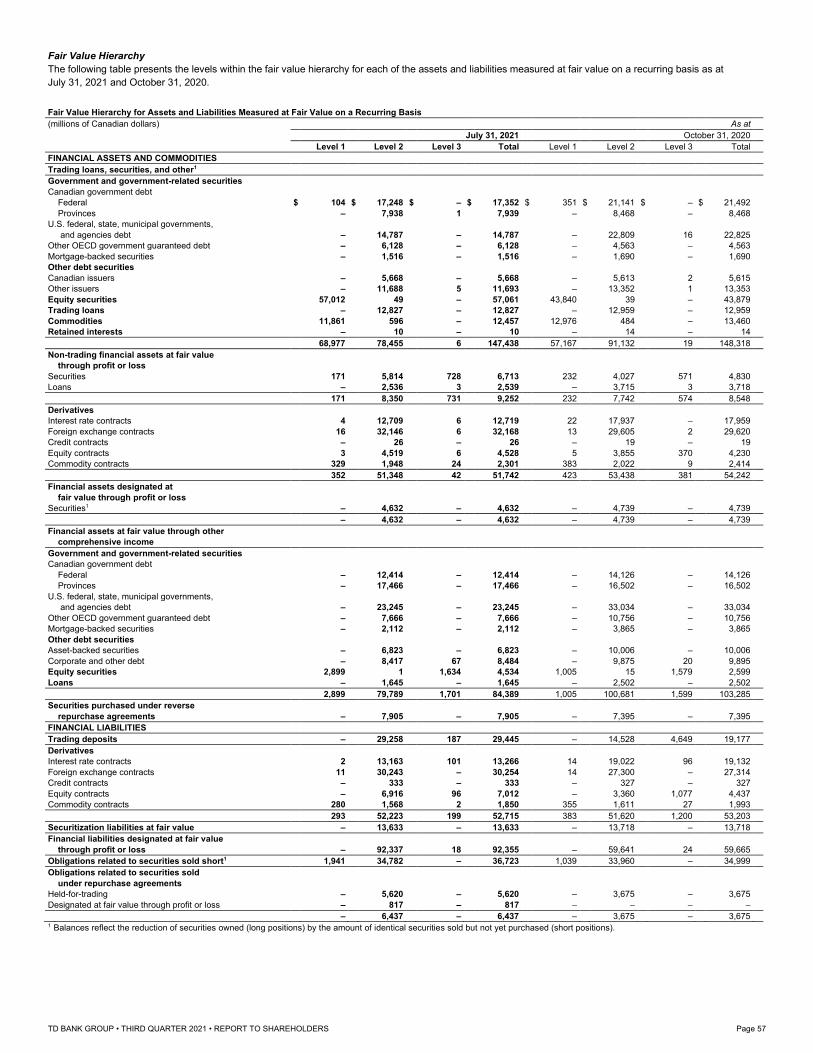
Fair Value Hierarchy The following table presents the levels within the fair value hierarchy for each of the assets and liabilities measured at fair value on a recurring basis as at
July 31, 2021 and October 31, 2020. Fair Value Hierarchy for Assets and Liabilities Measured at Fair Value on a Recurring Basis
(millions of Canadian dollars) As at
July 31, 2021 October 31, 2020
Level 1 Level 2 Level 3 Total Level 1 Level 2 Level 3 Total
FINANCIAL ASSETS AND COMMODITIES
Trading loans, securities, and other1
Government and government-related securities
Canadian government debt
Federal $ 104 $ 17,248 $ – $ 17,352 $ 351 $ 21,141 $ – $ 21,492
Provinces – 7,938 1 7,939 – 8,468 – 8,468
U.S. federal, state, municipal governments,
and agencies debt – 14,787 – 14,787 – 22,809 16 22,825
Other OECD government guaranteed debt – 6,128 – 6,128 – 4,563 – 4,563
Mortgage-backed securities – 1,516 – 1,516 – 1,690 – 1,690
Other debt securities
Canadian issuers – 5,668 – 5,668 – 5,613 2 5,615
Other issuers – 11,688 5 11,693 – 13,352 1 13,353
Equity securities 57,012 49 – 57,061 43,840 39 – 43,879
Trading loans – 12,827 – 12,827 – 12,959 – 12,959
Commodities 11,861 596 – 12,457 12,976 484 – 13,460
Retained interests – 10 – 10 – 14 – 14
68,977 78,455 6 147,438 57,167 91,132 19 148,318
Non-trading financial assets at fair value
through profit or loss
Securities 171 5,814 728 6,713 232 4,027 571 4,830
Loans – 2,536 3 2,539 – 3,715 3 3,718
171 8,350 731 9,252 232 7,742 574 8,548
Derivatives
Interest rate contracts 4 12,709 6 12,719 22 17,937 – 17,959
Foreign exchange contracts 16 32,146 6 32,168 13 29,605 2 29,620
Credit contracts – 26 – 26 – 19 – 19
Equity contracts 3 4,519 6 4,528 5 3,855 370 4,230
Commodity contracts 329 1,948 24 2,301 383 2,022 9 2,414
352 51,348 42 51,742 423 53,438 381 54,242
Financial assets designated at
fair value through profit or loss
Securities1 – 4,632 – 4,632 – 4,739 – 4,739
– 4,632 – 4,632 – 4,739 – 4,739
Financial assets at fair value through other
comprehensive income
Government and government-related securities
Canadian government debt
Federal – 12,414 – 12,414 – 14,126 – 14,126
Provinces – 17,466 – 17,466 – 16,502 – 16,502
U.S. federal, state, municipal governments,
and agencies debt – 23,245 – 23,245 – 33,034 – 33,034
Other OECD government guaranteed debt – 7,666 – 7,666 – 10,756 – 10,756
Mortgage-backed securities – 2,112 – 2,112 – 3,865 – 3,865
Other debt securities
Asset-backed securities – 6,823 – 6,823 – 10,006 – 10,006
Corporate and other debt – 8,417 67 8,484 – 9,875 20 9,895
Equity securities 2,899 1 1,634 4,534 1,005 15 1,579 2,599
Loans – 1,645 – 1,645 – 2,502 – 2,502
2,899 79,789 1,701 84,389 1,005 100,681 1,599 103,285
Securities purchased under reverse
repurchase agreements – 7,905 – 7,905 – 7,395 – 7,395
FINANCIAL LIABILITIES
Trading deposits – 29,258 187 29,445 – 14,528 4,649 19,177
Derivatives
Interest rate contracts 2 13,163 101 13,266 14 19,022 96 19,132
Foreign exchange contracts 11 30,243 – 30,254 14 27,300 – 27,314
Credit contracts – 333 – 333 – 327 – 327
Equity contracts – 6,916 96 7,012 – 3,360 1,077 4,437
Commodity contracts 280 1,568 2 1,850 355 1,611 27 1,993
293 52,223 199 52,715 383 51,620 1,200 53,203
Securitization liabilities at fair value – 13,633 – 13,633 – 13,718 – 13,718
Financial liabilities designated at fair value
through profit or loss – 92,337 18 92,355 – 59,641 24 59,665
Obligations related to securities sold short1 1,941 34,782 – 36,723 1,039 33,960 – 34,999
Obligations related to securities sold
under repurchase agreements
Held-for-trading – 5,620 – 5,620 – 3,675 – 3,675
Designated at fair value through profit or loss – 817 – 817 – – – –
– 6,437 – 6,437 – 3,675 – 3,675 1 Balances reflect the reduction of securities owned (long positions) by the amount of identical securities sold but not yet purchased (short positions).
TD BANK GROUP • THIRD QUARTER 2021 • REPORT TO SHAREHOLDERS Page 57
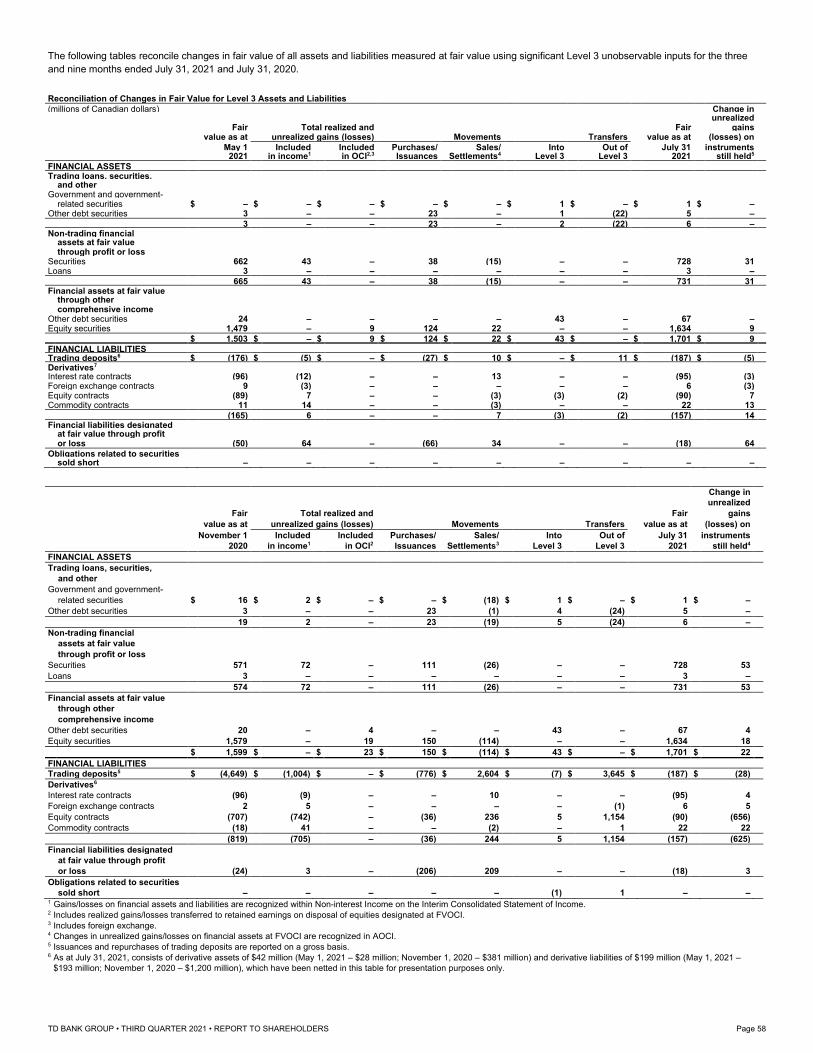
The following tables reconcile changes in fair value of all assets and liabilities measured at fair value using significant Level 3 unobservable inputs for the three
and nine months ended July 31, 2021 and July 31, 2020. Reconciliation of Changes in Fair Value for Level 3 Assets and Liabilities
(millions of Canadian dollars) Change in unrealized
Fair Total realized and Fair gains
value as at unrealized gains (losses) Movements Transfers value as at (losses) on
May 1 Included Included Purchases/ Sales/ Into Out of July 31 instruments 2021 in income1 in OCI2,3 Issuances Settlements4 Level 3 Level 3 2021 still held5
FINANCIAL ASSETS
Trading loans, securities, and other
Government and government-
related securities $ – $ – $ – $ – $ – $ 1 $ – $ 1 $ –
Other debt securities 3 – – 23 – 1 (22) 5 –
3 – – 23 – 2 (22) 6 –
Non-trading financial assets at fair value
through profit or loss
Securities 662 43 – 38 (15) – – 728 31
Loans 3 – – – – – – 3 –
665 43 – 38 (15) – – 731 31
Financial assets at fair value through other
comprehensive income
Other debt securities 24 – – – – 43 – 67 –
Equity securities 1,479 – 9 124 22 – – 1,634 9
$ 1,503 $ – $ 9 $ 124 $ 22 $ 43 $ – $ 1,701 $ 9
FINANCIAL LIABILITIES
Trading deposits6 $ (176) $ (5) $ – $ (27) $ 10 $ – $ 11 $ (187) $ (5)
Derivatives7
Interest rate contracts (96) (12) – – 13 – – (95) (3)
Foreign exchange contracts 9 (3) – – – – – 6 (3)
Equity contracts (89) 7 – – (3) (3) (2) (90) 7
Commodity contracts 11 14 – – (3) – – 22 13
(165) 6 – – 7 (3) (2) (157) 14
Financial liabilities designated at fair value through profit
or loss (50) 64 – (66) 34 – – (18) 64
Obligations related to securities sold short – – – – – – – – –
Change in
unrealized
Fair Total realized and Fair gains
value as at unrealized gains (losses) Movements Transfers value as at (losses) on
November 1 Included Included Purchases/ Sales/ Into Out of July 31 instruments
2020 in income1 in OCI2 Issuances Settlements3 Level 3 Level 3 2021 still held4
FINANCIAL ASSETS
Trading loans, securities,
and other
Government and government-
related securities $ 16 $ 2 $ – $ – $ (18) $ 1 $ – $ 1 $ –
Other debt securities 3 – – 23 (1) 4 (24) 5 –
19 2 – 23 (19) 5 (24) 6 –
Non-trading financial
assets at fair value
through profit or loss
Securities 571 72 – 111 (26) – – 728 53
Loans 3 – – – – – – 3 –
574 72 – 111 (26) – – 731 53
Financial assets at fair value
through other
comprehensive income
Other debt securities 20 – 4 – – 43 – 67 4
Equity securities 1,579 – 19 150 (114) – – 1,634 18
$ 1,599 $ – $ 23 $ 150 $ (114) $ 43 $ – $ 1,701 $ 22
FINANCIAL LIABILITIES
Trading deposits5 $ (4,649) $ (1,004) $ – $ (776) $ 2,604 $ (7) $ 3,645 $ (187) $ (28)
Derivatives6
Interest rate contracts (96) (9) – – 10 – – (95) 4
Foreign exchange contracts 2 5 – – – – (1) 6 5
Equity contracts (707) (742) – (36) 236 5 1,154 (90) (656)
Commodity contracts (18) 41 – – (2) – 1 22 22
(819) (705) – (36) 244 5 1,154 (157) (625)
Financial liabilities designated
at fair value through profit
or loss (24) 3 – (206) 209 – – (18) 3
Obligations related to securities
sold short – – – – – (1) 1 – – 1 Gains/losses on financial assets and liabilities are recognized within Non-interest Income on the Interim Consolidated Statement of Income.
2 Includes realized gains/losses transferred to retained earnings on disposal of equities designated at FVOCI. 3 Includes foreign exchange. 4 Changes in unrealized gains/losses on financial assets at FVOCI are recognized in AOCI. 5 Issuances and repurchases of trading deposits are reported on a gross basis. 6 As at July 31, 2021, consists of derivative assets of $42 million (May 1, 2021 – $28 million; November 1, 2020 – $381 million) and derivative liabilities of $199 million (May 1, 2021 –
$193 million; November 1, 2020 – $1,200 million), which have been netted in this table for presentation purposes only.
TD BANK GROUP • THIRD QUARTER 2021 • REPORT TO SHAREHOLDERS Page 58
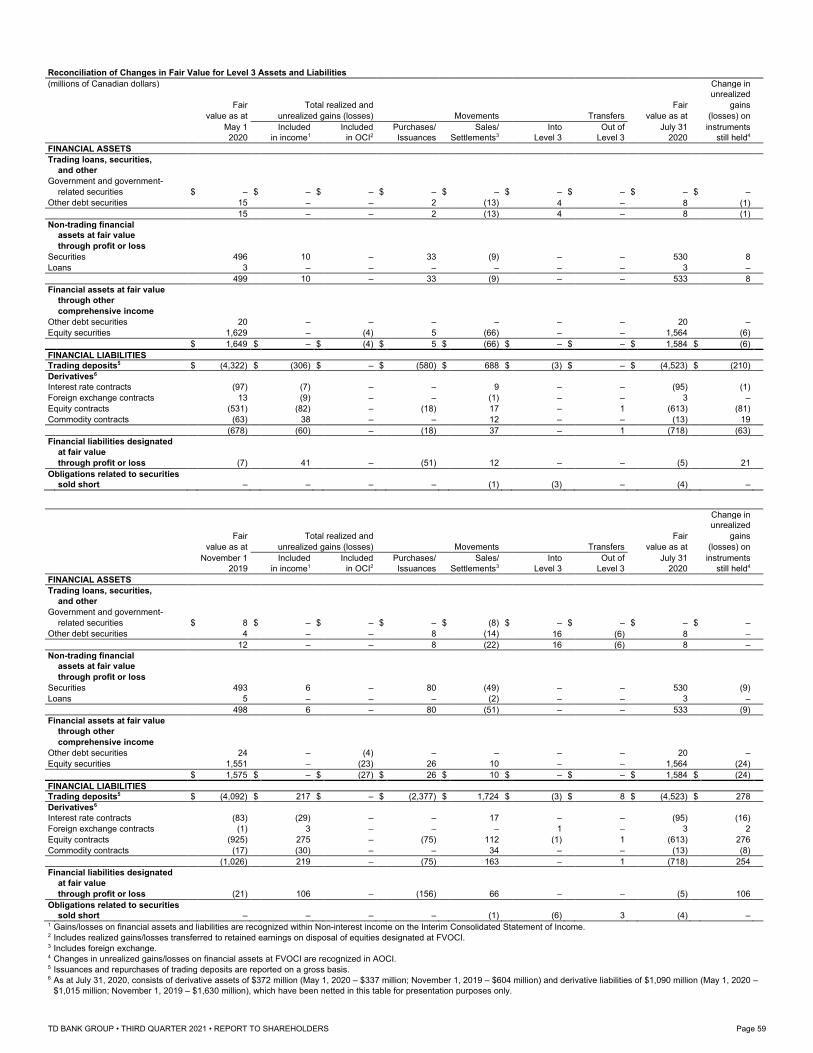
Reconciliation of Changes in Fair Value for Level 3 Assets and Liabilities
(millions of Canadian dollars) Change in
unrealized
Fair Total realized and Fair gains
value as at unrealized gains (losses) Movements Transfers value as at (losses) on
May 1 Included Included Purchases/ Sales/ Into Out of July 31 instruments
2020 in income1 in OCI2 Issuances Settlements3 Level 3 Level 3 2020 still held4
FINANCIAL ASSETS
Trading loans, securities,
and other
Government and government-
related securities $ – $ – $ – $ – $ – $ – $ – $ – $ –
Other debt securities 15 – – 2 (13) 4 – 8 (1)
15 – – 2 (13) 4 – 8 (1)
Non-trading financial
assets at fair value
through profit or loss
Securities 496 10 – 33 (9) – – 530 8
Loans 3 – – – – – – 3 –
499 10 – 33 (9) – – 533 8
Financial assets at fair value
through other
comprehensive income
Other debt securities 20 – – – – – – 20 –
Equity securities 1,629 – (4) 5 (66) – – 1,564 (6)
$ 1,649 $ – $ (4) $ 5 $ (66) $ – $ – $ 1,584 $ (6)
FINANCIAL LIABILITIES
Trading deposits5 $ (4,322) $ (306) $ – $ (580) $ 688 $ (3) $ – $ (4,523) $ (210)
Derivatives6
Interest rate contracts (97) (7) – – 9 – – (95) (1)
Foreign exchange contracts 13 (9) – – (1) – – 3 –
Equity contracts (531) (82) – (18) 17 – 1 (613) (81)
Commodity contracts (63) 38 – – 12 – – (13) 19
(678) (60) – (18) 37 – 1 (718) (63)
Financial liabilities designated
at fair value
through profit or loss (7) 41 – (51) 12 – – (5) 21
Obligations related to securities
sold short – – – – (1) (3) – (4) –
Change in
unrealized
Fair Total realized and Fair gains
value as at unrealized gains (losses) Movements Transfers value as at (losses) on
November 1 Included Included Purchases/ Sales/ Into Out of July 31 instruments
2019 in income1 in OCI2 Issuances Settlements3 Level 3 Level 3 2020 still held4
FINANCIAL ASSETS
Trading loans, securities,
and other
Government and government-
related securities $ 8 $ – $ – $ – $ (8) $ – $ – $ – $ –
Other debt securities 4 – – 8 (14) 16 (6) 8 –
12 – – 8 (22) 16 (6) 8 –
Non-trading financial
assets at fair value
through profit or loss
Securities 493 6 – 80 (49) – – 530 (9)
Loans 5 – – – (2) – – 3 –
498 6 – 80 (51) – – 533 (9)
Financial assets at fair value
through other
comprehensive income
Other debt securities 24 – (4) – – – – 20 –
Equity securities 1,551 – (23) 26 10 – – 1,564 (24)
$ 1,575 $ – $ (27) $ 26 $ 10 $ – $ – $ 1,584 $ (24)
FINANCIAL LIABILITIES
Trading deposits5 $ (4,092) $ 217 $ – $ (2,377) $ 1,724 $ (3) $ 8 $ (4,523) $ 278
Derivatives6
Interest rate contracts (83) (29) – – 17 – – (95) (16)
Foreign exchange contracts (1) 3 – – – 1 – 3 2
Equity contracts (925) 275 – (75) 112 (1) 1 (613) 276
Commodity contracts (17) (30) – – 34 – – (13) (8)
(1,026) 219 – (75) 163 – 1 (718) 254
Financial liabilities designated
at fair value
through profit or loss (21) 106 – (156) 66 – – (5) 106
Obligations related to securities
sold short – – – – (1) (6) 3 (4) – 1 Gains/losses on financial assets and liabilities are recognized within Non-interest income on the Interim Consolidated Statement of Income. 2 Includes realized gains/losses transferred to retained earnings on disposal of equities designated at FVOCI. 3 Includes foreign exchange. 4 Changes in unrealized gains/losses on financial assets at FVOCI are recognized in AOCI. 5 Issuances and repurchases of trading deposits are reported on a gross basis. 6 As at July 31, 2020, consists of derivative assets of $372 million (May 1, 2020 – $337 million; November 1, 2019 – $604 million) and derivative liabilities of $1,090 million (May 1, 2020 –
$1,015 million; November 1, 2019 – $1,630 million), which have been netted in this table for presentation purposes only.
TD BANK GROUP • THIRD QUARTER 2021 • REPORT TO SHAREHOLDERS Page 59
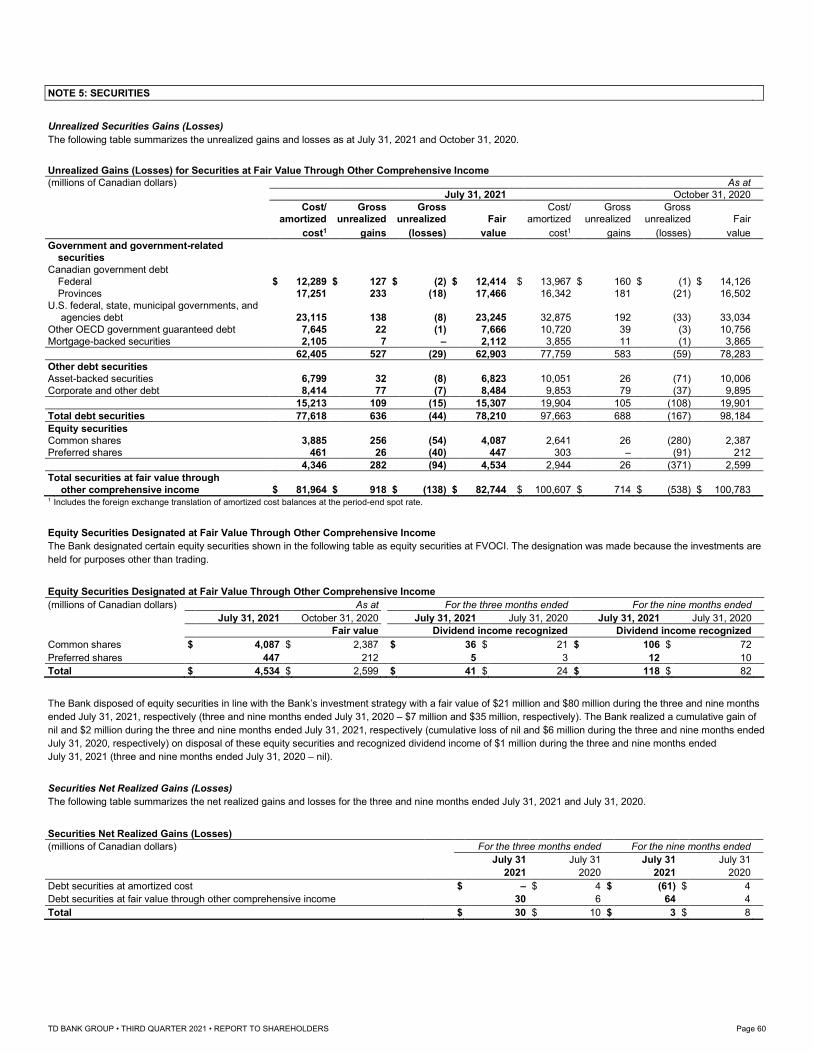
NOTE 5: SECURITIES
Unrealized Securities Gains (Losses) The following table summarizes the unrealized gains and losses as at July 31, 2021 and October 31, 2020. Unrealized Gains (Losses) for Securities at Fair Value Through Other Comprehensive Income
(millions of Canadian dollars) As at
July 31, 2021 October 31, 2020
Cost/ Gross Gross Cost/ Gross Gross
amortized unrealized unrealized Fair amortized unrealized unrealized Fair
cost1 gains (losses) value cost1 gains (losses) value
Government and government-related
securities
Canadian government debt
Federal $ 12,289 $ 127 $ (2) $ 12,414 $ 13,967 $ 160 $ (1) $ 14,126
Provinces 17,251 233 (18) 17,466 16,342 181 (21) 16,502
U.S. federal, state, municipal governments, and
agencies debt 23,115 138 (8) 23,245 32,875 192 (33) 33,034
Other OECD government guaranteed debt 7,645 22 (1) 7,666 10,720 39 (3) 10,756
Mortgage-backed securities 2,105 7 – 2,112 3,855 11 (1) 3,865
62,405 527 (29) 62,903 77,759 583 (59) 78,283
Other debt securities
Asset-backed securities 6,799 32 (8) 6,823 10,051 26 (71) 10,006
Corporate and other debt 8,414 77 (7) 8,484 9,853 79 (37) 9,895
15,213 109 (15) 15,307 19,904 105 (108) 19,901
Total debt securities 77,618 636 (44) 78,210 97,663 688 (167) 98,184
Equity securities
Common shares 3,885 256 (54) 4,087 2,641 26 (280) 2,387
Preferred shares 461 26 (40) 447 303 – (91) 212
4,346 282 (94) 4,534 2,944 26 (371) 2,599
Total securities at fair value through
other comprehensive income $ 81,964 $ 918 $ (138) $ 82,744 $ 100,607 $ 714 $ (538) $ 100,783 1 Includes the foreign exchange translation of amortized cost balances at the period-end spot rate.
Equity Securities Designated at Fair Value Through Other Comprehensive Income The Bank designated certain equity securities shown in the following table as equity securities at FVOCI. The designation was made because the investments are
held for purposes other than trading. Equity Securities Designated at Fair Value Through Other Comprehensive Income
(millions of Canadian dollars) As at For the three months ended For the nine months ended
July 31, 2021 October 31, 2020 July 31, 2021 July 31, 2020 July 31, 2021 July 31, 2020
Fair value Dividend income recognized Dividend income recognized
Common shares $ 4,087 $ 2,387 $ 36 $ 21 $ 106 $ 72
Preferred shares 447 212 5 3 12 10
Total $ 4,534 $ 2,599 $ 41 $ 24 $ 118 $ 82
The Bank disposed of equity securities in line with the Bank’s investment strategy with a fair value of $21 million and $80 million during the three and nine months
ended July 31, 2021, respectively (three and nine months ended July 31, 2020 – $7 million and $35 million, respectively). The Bank realized a cumulative gain of
nil and $2 million during the three and nine months ended July 31, 2021, respectively (cumulative loss of nil and $6 million during the three and nine months ended
July 31, 2020, respectively) on disposal of these equity securities and recognized dividend income of $1 million during the three and nine months ended
July 31, 2021 (three and nine months ended July 31, 2020 – nil). Securities Net Realized Gains (Losses) The following table summarizes the net realized gains and losses for the three and nine months ended July 31, 2021 and July 31, 2020. Securities Net Realized Gains (Losses)
(millions of Canadian dollars) For the three months ended For the nine months ended
July 31 July 31 July 31 July 31
2021 2020 2021 2020
Debt securities at amortized cost $ – $ 4 $ (61) $ 4
Debt securities at fair value through other comprehensive income 30 6 64 4
Total $ 30 $ 10 $ 3 $ 8
TD BANK GROUP • THIRD QUARTER 2021 • REPORT TO SHAREHOLDERS Page 60
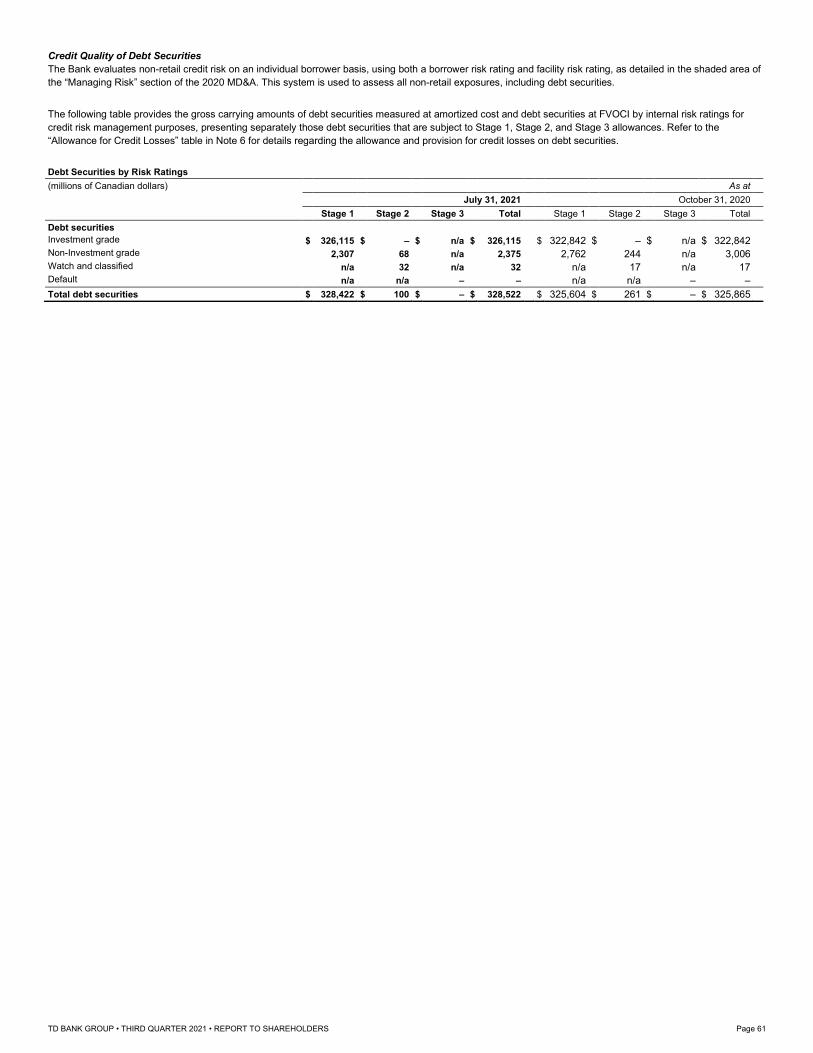
Credit Quality of Debt Securities The Bank evaluates non-retail credit risk on an individual borrower basis, using both a borrower risk rating and facility risk rating, as detailed in the shaded area of
the “Managing Risk” section of the 2020 MD&A. This system is used to assess all non-retail exposures, including debt securities. The following table provides the gross carrying amounts of debt securities measured at amortized cost and debt securities at FVOCI by internal risk ratings for
credit risk management purposes, presenting separately those debt securities that are subject to Stage 1, Stage 2, and Stage 3 allowances. Refer to the
“Allowance for Credit Losses” table in Note 6 for details regarding the allowance and provision for credit losses on debt securities. Debt Securities by Risk Ratings
(millions of Canadian dollars) As at
July 31, 2021 October 31, 2020
Stage 1 Stage 2 Stage 3 Total Stage 1 Stage 2 Stage 3 Total
Debt securities
Investment grade $ 326,115 $ – $ n/a $ 326,115 $ 322,842 $ – $ n/a $ 322,842
Non-Investment grade 2,307 68 n/a 2,375 2,762 244 n/a 3,006
Watch and classified n/a 32 n/a 32 n/a 17 n/a 17
Default n/a n/a – – n/a n/a – –
Total debt securities $ 328,422 $ 100 $ – $ 328,522 $ 325,604 $ 261 $ – $ 325,865
TD BANK GROUP • THIRD QUARTER 2021 • REPORT TO SHAREHOLDERS Page 61
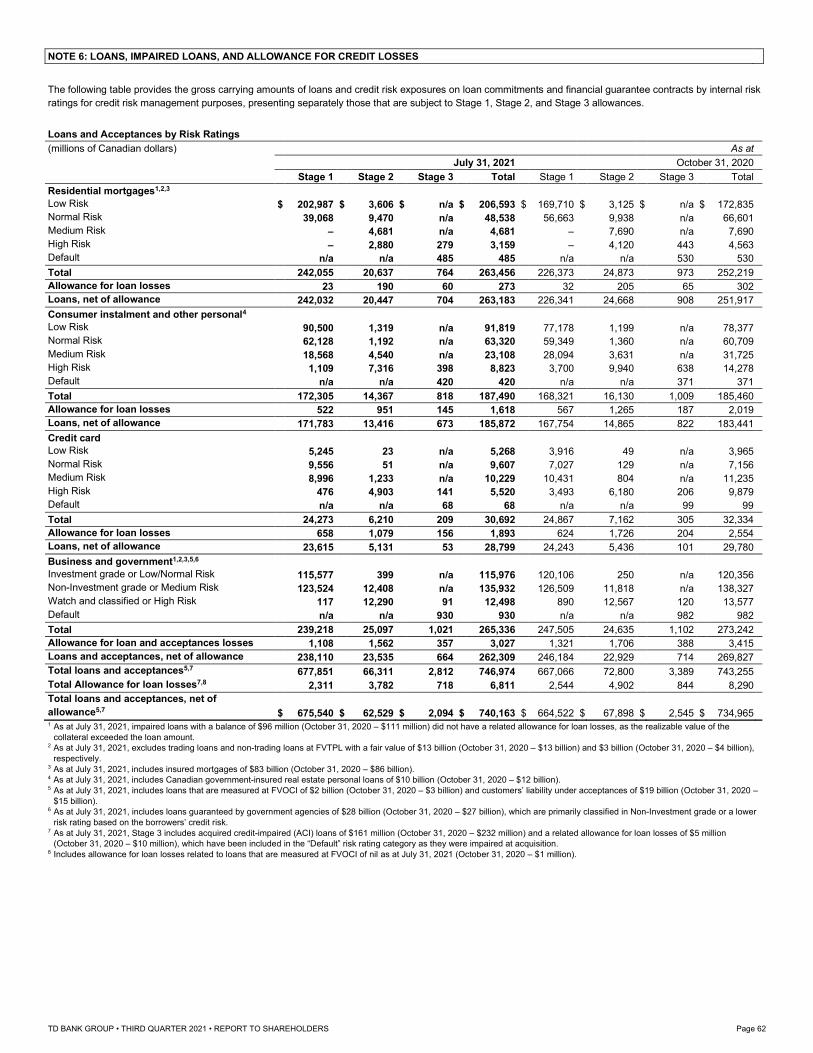
NOTE 6: LOANS, IMPAIRED LOANS, AND ALLOWANCE FOR CREDIT LOSSES
The following table provides the gross carrying amounts of loans and credit risk exposures on loan commitments and financial guarantee contracts by internal risk
ratings for credit risk management purposes, presenting separately those that are subject to Stage 1, Stage 2, and Stage 3 allowances. Loans and Acceptances by Risk Ratings
(millions of Canadian dollars) As at
July 31, 2021 October 31, 2020
Stage 1 Stage 2 Stage 3 Total Stage 1 Stage 2 Stage 3 Total
Residential mortgages1,2,3
Low Risk $ 202,987 $ 3,606 $ n/a $ 206,593 $ 169,710 $ 3,125 $ n/a $ 172,835
Normal Risk 39,068 9,470 n/a 48,538 56,663 9,938 n/a 66,601
Medium Risk – 4,681 n/a 4,681 – 7,690 n/a 7,690
High Risk – 2,880 279 3,159 – 4,120 443 4,563
Default n/a n/a 485 485 n/a n/a 530 530
Total 242,055 20,637 764 263,456 226,373 24,873 973 252,219
Allowance for loan losses 23 190 60 273 32 205 65 302
Loans, net of allowance 242,032 20,447 704 263,183 226,341 24,668 908 251,917
Consumer instalment and other personal4
Low Risk 90,500 1,319 n/a 91,819 77,178 1,199 n/a 78,377
Normal Risk 62,128 1,192 n/a 63,320 59,349 1,360 n/a 60,709
Medium Risk 18,568 4,540 n/a 23,108 28,094 3,631 n/a 31,725
High Risk 1,109 7,316 398 8,823 3,700 9,940 638 14,278
Default n/a n/a 420 420 n/a n/a 371 371
Total 172,305 14,367 818 187,490 168,321 16,130 1,009 185,460
Allowance for loan losses 522 951 145 1,618 567 1,265 187 2,019
Loans, net of allowance 171,783 13,416 673 185,872 167,754 14,865 822 183,441
Credit card
Low Risk 5,245 23 n/a 5,268 3,916 49 n/a 3,965
Normal Risk 9,556 51 n/a 9,607 7,027 129 n/a 7,156
Medium Risk 8,996 1,233 n/a 10,229 10,431 804 n/a 11,235
High Risk 476 4,903 141 5,520 3,493 6,180 206 9,879
Default n/a n/a 68 68 n/a n/a 99 99
Total 24,273 6,210 209 30,692 24,867 7,162 305 32,334
Allowance for loan losses 658 1,079 156 1,893 624 1,726 204 2,554
Loans, net of allowance 23,615 5,131 53 28,799 24,243 5,436 101 29,780
Business and government1,2,3,5,6
Investment grade or Low/Normal Risk 115,577 399 n/a 115,976 120,106 250 n/a 120,356
Non-Investment grade or Medium Risk 123,524 12,408 n/a 135,932 126,509 11,818 n/a 138,327
Watch and classified or High Risk 117 12,290 91 12,498 890 12,567 120 13,577
Default n/a n/a 930 930 n/a n/a 982 982
Total 239,218 25,097 1,021 265,336 247,505 24,635 1,102 273,242
Allowance for loan and acceptances losses 1,108 1,562 357 3,027 1,321 1,706 388 3,415
Loans and acceptances, net of allowance 238,110 23,535 664 262,309 246,184 22,929 714 269,827
Total loans and acceptances5,7 677,851 66,311 2,812 746,974 667,066 72,800 3,389 743,255
Total Allowance for loan losses7,8 2,311 3,782 718 6,811 2,544 4,902 844 8,290
Total loans and acceptances, net of
allowance5,7 $ 675,540 $ 62,529 $ 2,094 $ 740,163 $ 664,522 $ 67,898 $ 2,545 $ 734,965 1 As at July 31, 2021, impaired loans with a balance of $96 million (October 31, 2020 – $111 million) did not have a related allowance for loan losses, as the realizable value of the
collateral exceeded the loan amount. 2 As at July 31, 2021, excludes trading loans and non-trading loans at FVTPL with a fair value of $13 billion (October 31, 2020 – $13 billion) and $3 billion (October 31, 2020 – $4 billion),
respectively. 3 As at July 31, 2021, includes insured mortgages of $83 billion (October 31, 2020 – $86 billion). 4 As at July 31, 2021, includes Canadian government-insured real estate personal loans of $10 billion (October 31, 2020 – $12 billion). 5 As at July 31, 2021, includes loans that are measured at FVOCI of $2 billion (October 31, 2020 – $3 billion) and customers’ liability under acceptances of $19 billion (October 31, 2020 –
$15 billion). 6 As at July 31, 2021, includes loans guaranteed by government agencies of $28 billion (October 31, 2020 – $27 billion), which are primarily classified in Non-Investment grade or a lower
risk rating based on the borrowers’ credit risk. 7 As at July 31, 2021, Stage 3 includes acquired credit-impaired (ACI) loans of $161 million (October 31, 2020 – $232 million) and a related allowance for loan losses of $5 million
(October 31, 2020 – $10 million), which have been included in the “Default” risk rating category as they were impaired at acquisition. 8 Includes allowance for loan losses related to loans that are measured at FVOCI of nil as at July 31, 2021 (October 31, 2020 – $1 million).
TD BANK GROUP • THIRD QUARTER 2021 • REPORT TO SHAREHOLDERS Page 62
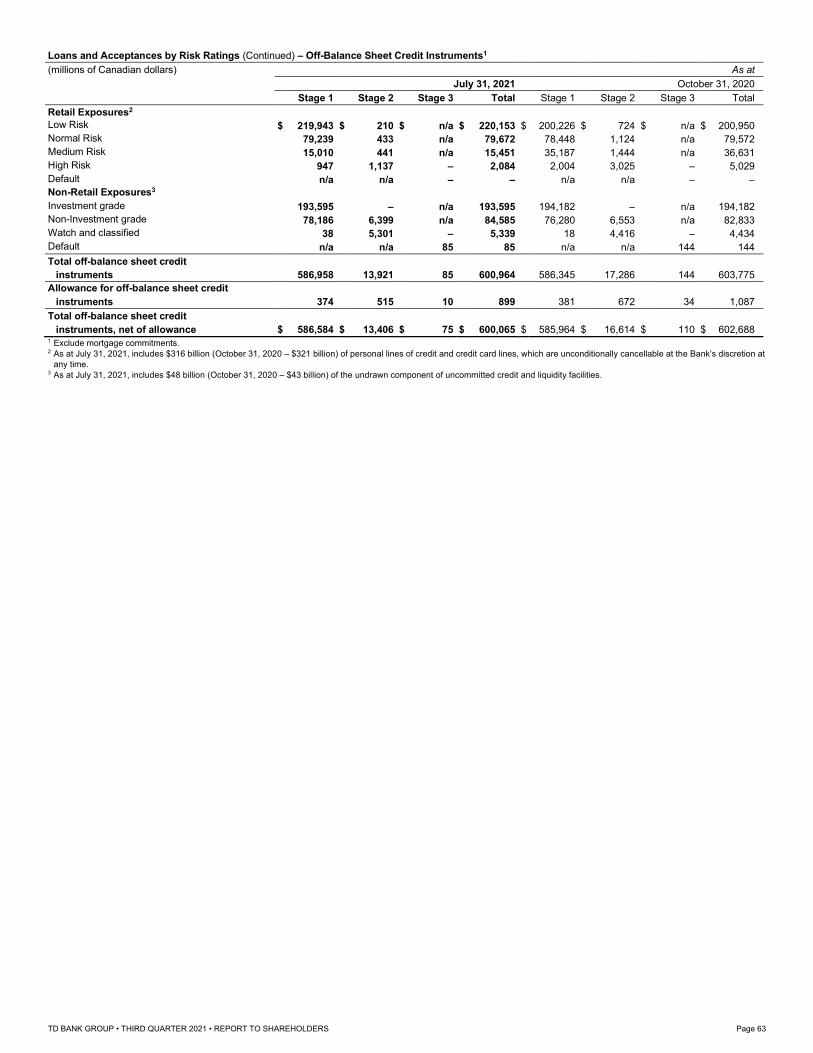
Loans and Acceptances by Risk Ratings (Continued) – Off-Balance Sheet Credit Instruments1
(millions of Canadian dollars) As at
July 31, 2021 October 31, 2020
Stage 1 Stage 2 Stage 3 Total Stage 1 Stage 2 Stage 3 Total
Retail Exposures2
Low Risk $ 219,943 $ 210 $ n/a $ 220,153 $ 200,226 $ 724 $ n/a $ 200,950
Normal Risk 79,239 433 n/a 79,672 78,448 1,124 n/a 79,572
Medium Risk 15,010 441 n/a 15,451 35,187 1,444 n/a 36,631
High Risk 947 1,137 – 2,084 2,004 3,025 – 5,029
Default n/a n/a – – n/a n/a – –
Non-Retail Exposures3
Investment grade 193,595 – n/a 193,595 194,182 – n/a 194,182
Non-Investment grade 78,186 6,399 n/a 84,585 76,280 6,553 n/a 82,833
Watch and classified 38 5,301 – 5,339 18 4,416 – 4,434
Default n/a n/a 85 85 n/a n/a 144 144
Total off-balance sheet credit
instruments 586,958 13,921 85 600,964 586,345 17,286 144 603,775
Allowance for off-balance sheet credit
instruments 374 515 10 899 381 672 34 1,087
Total off-balance sheet credit
instruments, net of allowance $ 586,584 $ 13,406 $ 75 $ 600,065 $ 585,964 $ 16,614 $ 110 $ 602,688 1 Exclude mortgage commitments. 2 As at July 31, 2021, includes $316 billion (October 31, 2020 – $321 billion) of personal lines of credit and credit card lines, which are unconditionally cancellable at the Bank’s discretion at
any time. 3 As at July 31, 2021, includes $48 billion (October 31, 2020 – $43 billion) of the undrawn component of uncommitted credit and liquidity facilities.
TD BANK GROUP • THIRD QUARTER 2021 • REPORT TO SHAREHOLDERS Page 63
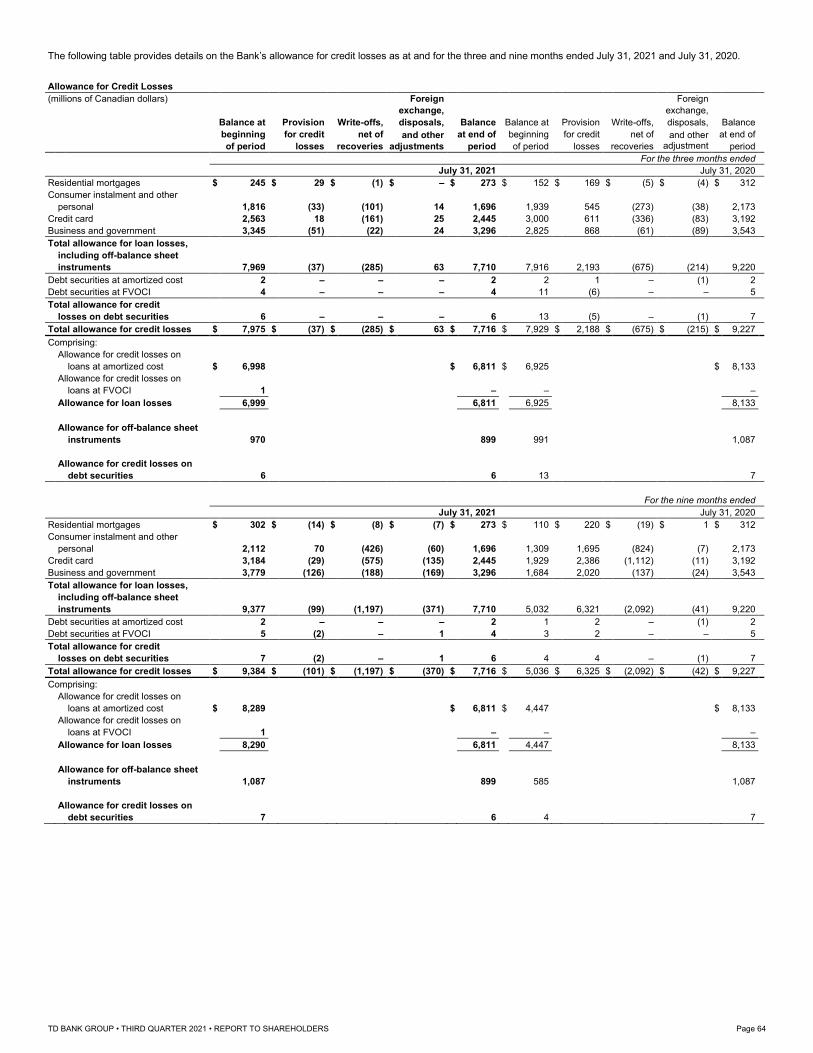
The following table provides details on the Bank’s allowance for credit losses as at and for the three and nine months ended July 31, 2021 and July 31, 2020. Allowance for Credit Losses
(millions of Canadian dollars) Foreign Foreign
exchange, exchange,
Balance at Provision Write-offs, disposals, Balance Balance at Provision Write-offs, disposals, Balance
beginning for credit net of and other at end of beginning for credit net of and other at end of
of period losses recoveries adjustments period of period losses recoveries adjustments
period
For the three months ended
July 31, 2021 July 31, 2020
Residential mortgages $ 245 $ 29 $ (1) $ – $ 273 $ 152 $ 169 $ (5) $ (4) $ 312
Consumer instalment and other
personal 1,816 (33) (101) 14 1,696 1,939 545 (273) (38) 2,173
Credit card 2,563 18 (161) 25 2,445 3,000 611 (336) (83) 3,192
Business and government 3,345 (51) (22) 24 3,296 2,825 868 (61) (89) 3,543
Total allowance for loan losses,
including off-balance sheet
instruments 7,969 (37) (285) 63 7,710 7,916 2,193 (675) (214) 9,220
Debt securities at amortized cost 2 – – – 2 2 1 – (1) 2
Debt securities at FVOCI 4 – – – 4 11 (6) – – 5
Total allowance for credit
losses on debt securities 6 – – – 6 13 (5) – (1) 7
Total allowance for credit losses $ 7,975 $ (37) $ (285) $ 63 $ 7,716 $ 7,929 $ 2,188 $ (675) $ (215) $ 9,227
Comprising:
Allowance for credit losses on
loans at amortized cost $ 6,998 $ 6,811 $ 6,925 $ 8,133
Allowance for credit losses on
loans at FVOCI 1 – – –
Allowance for loan losses 6,999 6,811 6,925 8,133
Allowance for off-balance sheet
instruments 970 899 991 1,087
Allowance for credit losses on
debt securities 6 6 13 7
For the nine months ended
July 31, 2021 July 31, 2020
Residential mortgages $ 302 $ (14) $ (8) $ (7) $ 273 $ 110 $ 220 $ (19) $ 1 $ 312
Consumer instalment and other
personal 2,112 70 (426) (60) 1,696 1,309 1,695 (824) (7) 2,173
Credit card 3,184 (29) (575) (135) 2,445 1,929 2,386 (1,112) (11) 3,192
Business and government 3,779 (126) (188) (169) 3,296 1,684 2,020 (137) (24) 3,543
Total allowance for loan losses,
including off-balance sheet
instruments 9,377 (99) (1,197) (371) 7,710 5,032 6,321 (2,092) (41) 9,220
Debt securities at amortized cost 2 – – – 2 1 2 – (1) 2
Debt securities at FVOCI 5 (2) – 1 4 3 2 – – 5
Total allowance for credit
losses on debt securities 7 (2) – 1 6 4 4 – (1) 7
Total allowance for credit losses $ 9,384 $ (101) $ (1,197) $ (370) $ 7,716 $ 5,036 $ 6,325 $ (2,092) $ (42) $ 9,227
Comprising:
Allowance for credit losses on
loans at amortized cost $ 8,289 $ 6,811 $ 4,447 $ 8,133
Allowance for credit losses on
loans at FVOCI 1 – – –
Allowance for loan losses 8,290 6,811 4,447 8,133
Allowance for off-balance sheet
instruments 1,087 899 585 1,087
Allowance for credit losses on
debt securities 7 6 4 7
TD BANK GROUP • THIRD QUARTER 2021 • REPORT TO SHAREHOLDERS Page 64
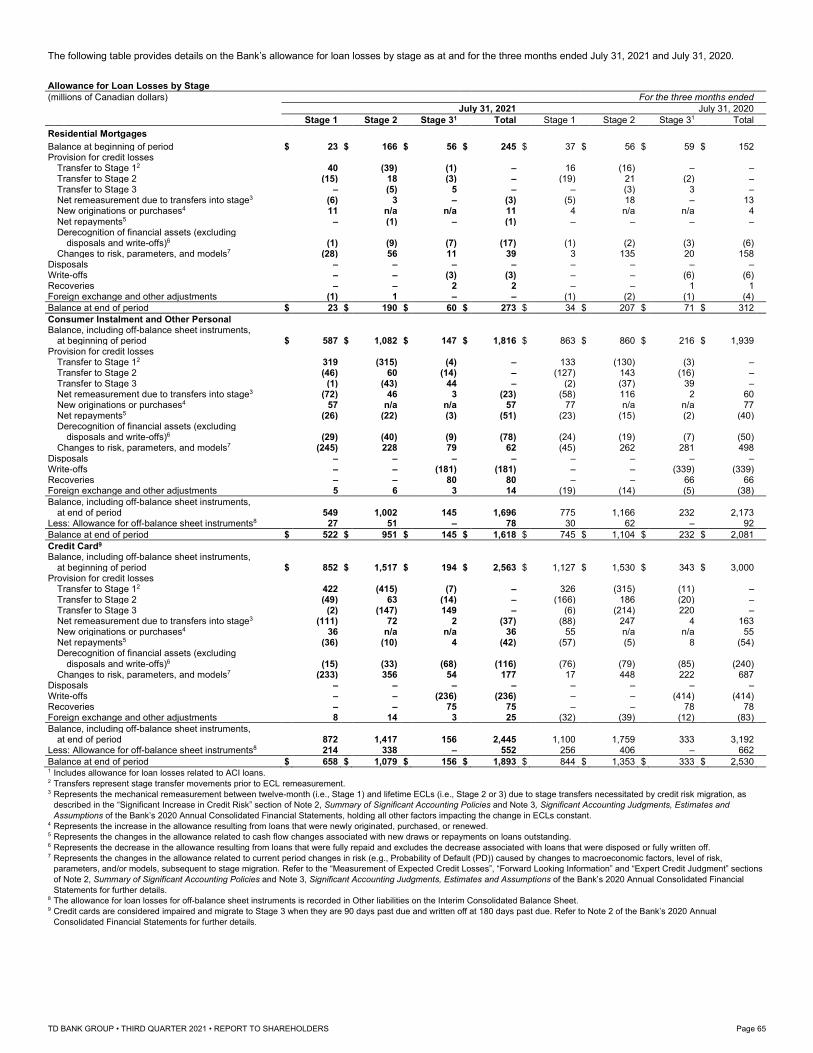
The following table provides details on the Bank’s allowance for loan losses by stage as at and for the three months ended July 31, 2021 and July 31, 2020. Allowance for Loan Losses by Stage
(millions of Canadian dollars) For the three months ended
July 31, 2021 July 31, 2020
Stage 1 Stage 2 Stage 31 Total Stage 1 Stage 2 Stage 31 Total
Residential Mortgages
Balance at beginning of period $ 23 $ 166 $ 56 $ 245 $ 37 $ 56 $ 59 $ 152 Provision for credit losses
Transfer to Stage 12 40 (39) (1) – 16 (16) – – Transfer to Stage 2 (15) 18 (3) – (19) 21 (2) – Transfer to Stage 3 – (5) 5 – – (3) 3 – Net remeasurement due to transfers into stage3 (6) 3 – (3) (5) 18 – 13 New originations or purchases4 11 n/a n/a 11 4 n/a n/a 4 Net repayments5 – (1) – (1) – – – – Derecognition of financial assets (excluding disposals and write-offs)6 (1) (9) (7) (17) (1) (2) (3) (6) Changes to risk, parameters, and models7 (28) 56 11 39 3 135 20 158 Disposals – – – – – – – – Write-offs – – (3) (3) – – (6) (6) Recoveries – – 2 2 – – 1 1 Foreign exchange and other adjustments (1) 1 – – (1) (2) (1) (4)
Balance at end of period $ 23 $ 190 $ 60 $ 273 $ 34 $ 207 $ 71 $ 312
Consumer Instalment and Other Personal Balance, including off-balance sheet instruments,
at beginning of period $ 587 $ 1,082 $ 147 $ 1,816 $ 863 $ 860 $ 216 $ 1,939 Provision for credit losses
Transfer to Stage 12 319 (315) (4) – 133 (130) (3) – Transfer to Stage 2 (46) 60 (14) – (127) 143 (16) – Transfer to Stage 3 (1) (43) 44 – (2) (37) 39 – Net remeasurement due to transfers into stage3 (72) 46 3 (23) (58) 116 2 60 New originations or purchases4 57 n/a n/a 57 77 n/a n/a 77 Net repayments5 (26) (22) (3) (51) (23) (15) (2) (40) Derecognition of financial assets (excluding disposals and write-offs)6 (29) (40) (9) (78) (24) (19) (7) (50) Changes to risk, parameters, and models7 (245) 228 79 62 (45) 262 281 498 Disposals – – – – – – – – Write-offs – – (181) (181) – – (339) (339) Recoveries – – 80 80 – – 66 66 Foreign exchange and other adjustments 5 6 3 14 (19) (14) (5) (38)
Balance, including off-balance sheet instruments, at end of period 549 1,002 145 1,696 775 1,166 232 2,173 Less: Allowance for off-balance sheet instruments8 27 51 – 78 30 62 – 92
Balance at end of period $ 522 $ 951 $ 145 $ 1,618 $ 745 $ 1,104 $ 232 $ 2,081
Credit Card9 Balance, including off-balance sheet instruments,
at beginning of period $ 852 $ 1,517 $ 194 $ 2,563 $ 1,127 $ 1,530 $ 343 $ 3,000 Provision for credit losses
Transfer to Stage 12 422 (415) (7) – 326 (315) (11) – Transfer to Stage 2 (49) 63 (14) – (166) 186 (20) – Transfer to Stage 3 (2) (147) 149 – (6) (214) 220 – Net remeasurement due to transfers into stage3 (111) 72 2 (37) (88) 247 4 163 New originations or purchases4 36 n/a n/a 36 55 n/a n/a 55 Net repayments5 (36) (10) 4 (42) (57) (5) 8 (54) Derecognition of financial assets (excluding disposals and write-offs)6 (15) (33) (68) (116) (76) (79) (85) (240) Changes to risk, parameters, and models7 (233) 356 54 177 17 448 222 687 Disposals – – – – – – – – Write-offs – – (236) (236) – – (414) (414) Recoveries – – 75 75 – – 78 78 Foreign exchange and other adjustments 8 14 3 25 (32) (39) (12) (83)
Balance, including off-balance sheet instruments, at end of period 872 1,417 156 2,445 1,100 1,759 333 3,192 Less: Allowance for off-balance sheet instruments8 214 338 – 552 256 406 – 662
Balance at end of period $ 658 $ 1,079 $ 156 $ 1,893 $ 844 $ 1,353 $ 333 $ 2,530 1 Includes allowance for loan losses related to ACI loans. 2 Transfers represent stage transfer movements prior to ECL remeasurement. 3 Represents the mechanical remeasurement between twelve-month (i.e., Stage 1) and lifetime ECLs (i.e., Stage 2 or 3) due to stage transfers necessitated by credit risk migration, as
described in the “Significant Increase in Credit Risk” section of Note 2, Summary of Significant Accounting Policies and Note 3, Significant Accounting Judgments, Estimates and
Assumptions of the Bank’s 2020 Annual Consolidated Financial Statements, holding all other factors impacting the change in ECLs constant. 4 Represents the increase in the allowance resulting from loans that were newly originated, purchased, or renewed. 5 Represents the changes in the allowance related to cash flow changes associated with new draws or repayments on loans outstanding. 6 Represents the decrease in the allowance resulting from loans that were fully repaid and excludes the decrease associated with loans that were disposed or fully written off. 7 Represents the changes in the allowance related to current period changes in risk (e.g., Probability of Default (PD)) caused by changes to macroeconomic factors, level of risk,
parameters, and/or models, subsequent to stage migration. Refer to the “Measurement of Expected Credit Losses”, “Forward Looking Information” and “Expert Credit Judgment” sections
of Note 2, Summary of Significant Accounting Policies and Note 3, Significant Accounting Judgments, Estimates and Assumptions of the Bank’s 2020 Annual Consolidated Financial
Statements for further details. 8 The allowance for loan losses for off-balance sheet instruments is recorded in Other liabilities on the Interim Consolidated Balance Sheet. 9 Credit cards are considered impaired and migrate to Stage 3 when they are 90 days past due and written off at 180 days past due. Refer to Note 2 of the Bank’s 2020 Annual
Consolidated Financial Statements for further details.
TD BANK GROUP • THIRD QUARTER 2021 • REPORT TO SHAREHOLDERS Page 65
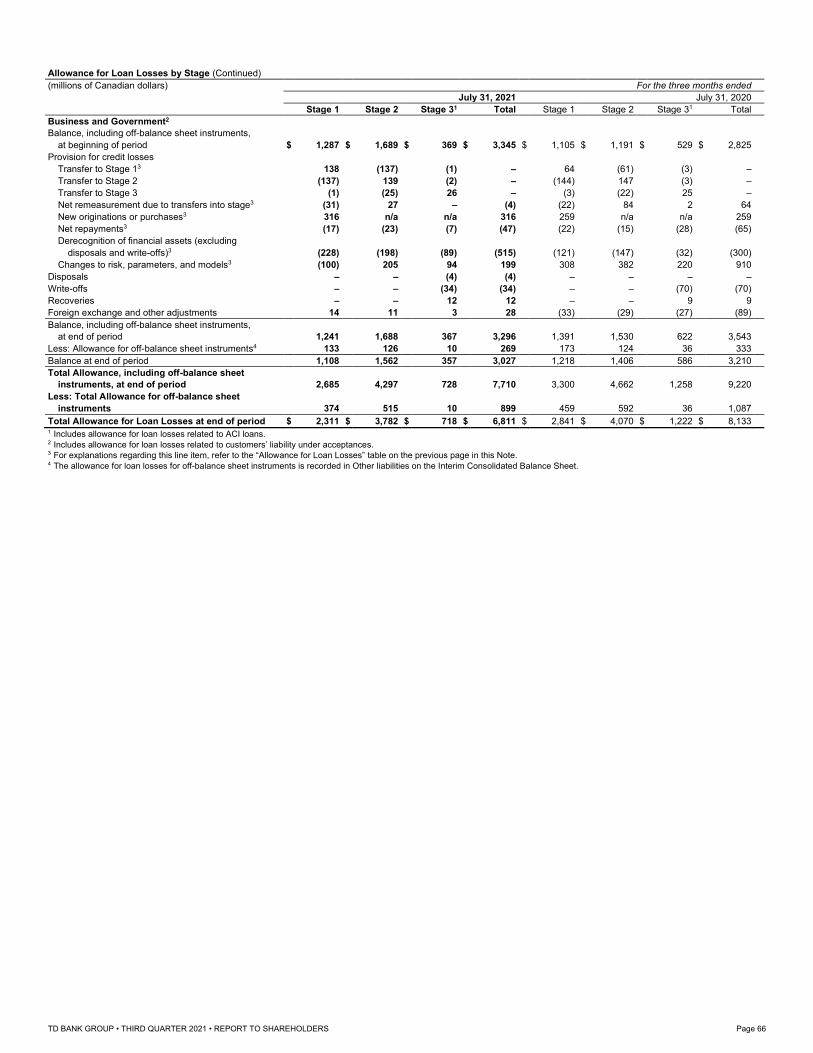
Allowance for Loan Losses by Stage (Continued)
(millions of Canadian dollars) For the three months ended
July 31, 2021 July 31, 2020
Stage 1 Stage 2 Stage 31 Total Stage 1 Stage 2 Stage 31 Total
Business and Government2
Balance, including off-balance sheet instruments,
at beginning of period $ 1,287 $ 1,689 $ 369 $ 3,345 $ 1,105 $ 1,191 $ 529 $ 2,825
Provision for credit losses
Transfer to Stage 13 138 (137) (1) – 64 (61) (3) –
Transfer to Stage 2 (137) 139 (2) – (144) 147 (3) –
Transfer to Stage 3 (1) (25) 26 – (3) (22) 25 –
Net remeasurement due to transfers into stage3 (31) 27 – (4) (22) 84 2 64
New originations or purchases3 316 n/a n/a 316 259 n/a n/a 259
Net repayments3 (17) (23) (7) (47) (22) (15) (28) (65)
Derecognition of financial assets (excluding
disposals and write-offs)3 (228) (198) (89) (515) (121) (147) (32) (300)
Changes to risk, parameters, and models3 (100) 205 94 199 308 382 220 910
Disposals – – (4) (4) – – – –
Write-offs – – (34) (34) – – (70) (70)
Recoveries – – 12 12 – – 9 9
Foreign exchange and other adjustments 14 11 3 28 (33) (29) (27) (89)
Balance, including off-balance sheet instruments,
at end of period 1,241 1,688 367 3,296 1,391 1,530 622 3,543
Less: Allowance for off-balance sheet instruments4 133 126 10 269 173 124 36 333
Balance at end of period 1,108 1,562 357 3,027 1,218 1,406 586 3,210
Total Allowance, including off-balance sheet
instruments, at end of period 2,685 4,297 728 7,710 3,300 4,662 1,258 9,220
Less: Total Allowance for off-balance sheet
instruments 374 515 10 899 459 592 36 1,087
Total Allowance for Loan Losses at end of period $ 2,311 $ 3,782 $ 718 $ 6,811 $ 2,841 $ 4,070 $ 1,222 $ 8,133 1 Includes allowance for loan losses related to ACI loans. 2 Includes allowance for loan losses related to customers’ liability under acceptances. 3 For explanations regarding this line item, refer to the “Allowance for Loan Losses” table on the previous page in this Note. 4 The allowance for loan losses for off-balance sheet instruments is recorded in Other liabilities on the Interim Consolidated Balance Sheet.
TD BANK GROUP • THIRD QUARTER 2021 • REPORT TO SHAREHOLDERS Page 66
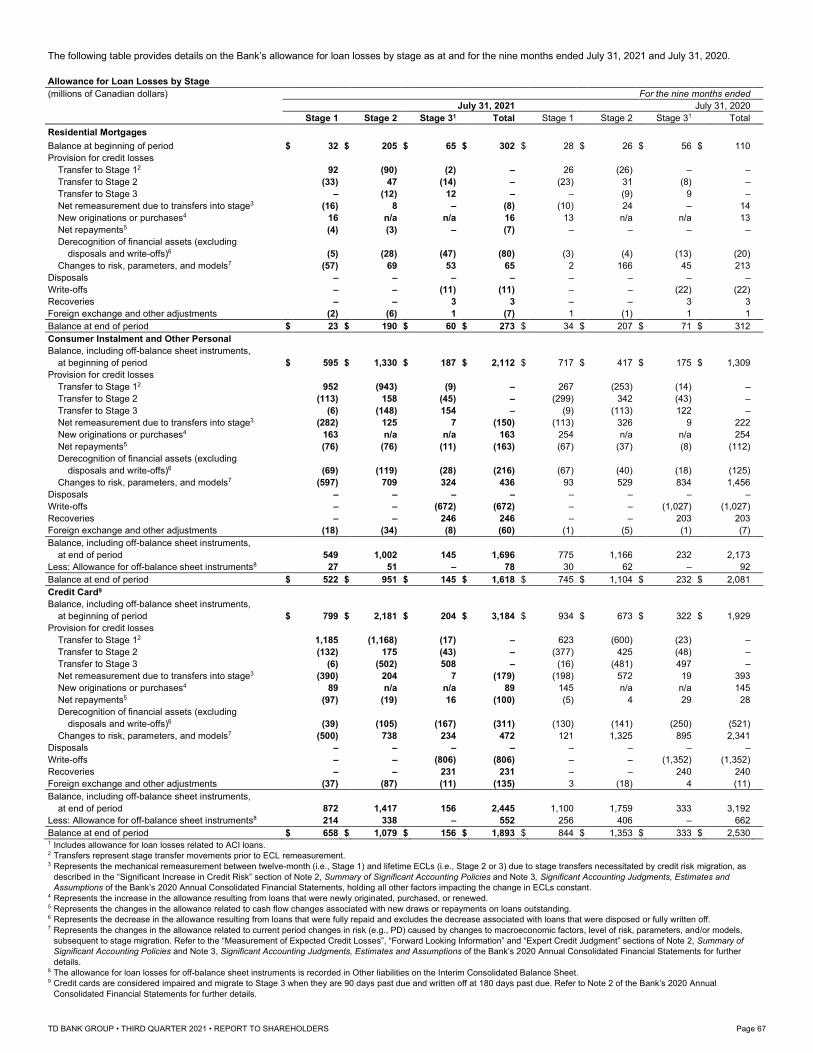
The following table provides details on the Bank’s allowance for loan losses by stage as at and for the nine months ended July 31, 2021 and July 31, 2020. Allowance for Loan Losses by Stage
(millions of Canadian dollars) For the nine months ended
July 31, 2021 July 31, 2020
Stage 1 Stage 2 Stage 31 Total Stage 1 Stage 2 Stage 31 Total
Residential Mortgages
Balance at beginning of period $ 32 $ 205 $ 65 $ 302 $ 28 $ 26 $ 56 $ 110
Provision for credit losses
Transfer to Stage 12 92 (90) (2) – 26 (26) – –
Transfer to Stage 2 (33) 47 (14) – (23) 31 (8) –
Transfer to Stage 3 – (12) 12 – – (9) 9 –
Net remeasurement due to transfers into stage3 (16) 8 – (8) (10) 24 – 14
New originations or purchases4 16 n/a n/a 16 13 n/a n/a 13
Net repayments5 (4) (3) – (7) – – – –
Derecognition of financial assets (excluding
disposals and write-offs)6 (5) (28) (47) (80) (3) (4) (13) (20)
Changes to risk, parameters, and models7 (57) 69 53 65 2 166 45 213
Disposals – – – – – – – –
Write-offs – – (11) (11) – – (22) (22)
Recoveries – – 3 3 – – 3 3
Foreign exchange and other adjustments (2) (6) 1 (7) 1 (1) 1 1
Balance at end of period $ 23 $ 190 $ 60 $ 273 $ 34 $ 207 $ 71 $ 312
Consumer Instalment and Other Personal
Balance, including off-balance sheet instruments,
at beginning of period $ 595 $ 1,330 $ 187 $ 2,112 $ 717 $ 417 $ 175 $ 1,309
Provision for credit losses
Transfer to Stage 12 952 (943) (9) – 267 (253) (14) –
Transfer to Stage 2 (113) 158 (45) – (299) 342 (43) –
Transfer to Stage 3 (6) (148) 154 – (9) (113) 122 –
Net remeasurement due to transfers into stage3 (282) 125 7 (150) (113) 326 9 222
New originations or purchases4 163 n/a n/a 163 254 n/a n/a 254
Net repayments5 (76) (76) (11) (163) (67) (37) (8) (112)
Derecognition of financial assets (excluding
disposals and write-offs)6 (69) (119) (28) (216) (67) (40) (18) (125)
Changes to risk, parameters, and models7 (597) 709 324 436 93 529 834 1,456
Disposals – – – – – – – –
Write-offs – – (672) (672) – – (1,027) (1,027)
Recoveries – – 246 246 – – 203 203
Foreign exchange and other adjustments (18) (34) (8) (60) (1) (5) (1) (7)
Balance, including off-balance sheet instruments,
at end of period 549 1,002 145 1,696 775 1,166 232 2,173
Less: Allowance for off-balance sheet instruments8 27 51 – 78 30 62 – 92
Balance at end of period $ 522 $ 951 $ 145 $ 1,618 $ 745 $ 1,104 $ 232 $ 2,081
Credit Card9
Balance, including off-balance sheet instruments,
at beginning of period $ 799 $ 2,181 $ 204 $ 3,184 $ 934 $ 673 $ 322 $ 1,929
Provision for credit losses
Transfer to Stage 12 1,185 (1,168) (17) – 623 (600) (23) –
Transfer to Stage 2 (132) 175 (43) – (377) 425 (48) –
Transfer to Stage 3 (6) (502) 508 – (16) (481) 497 –
Net remeasurement due to transfers into stage3 (390) 204 7 (179) (198) 572 19 393
New originations or purchases4 89 n/a n/a 89 145 n/a n/a 145
Net repayments5 (97) (19) 16 (100) (5) 4 29 28
Derecognition of financial assets (excluding
disposals and write-offs)6 (39) (105) (167) (311) (130) (141) (250) (521)
Changes to risk, parameters, and models7 (500) 738 234 472 121 1,325 895 2,341
Disposals – – – – – – – –
Write-offs – – (806) (806) – – (1,352) (1,352)
Recoveries – – 231 231 – – 240 240
Foreign exchange and other adjustments (37) (87) (11) (135) 3 (18) 4 (11)
Balance, including off-balance sheet instruments,
at end of period 872 1,417 156 2,445 1,100 1,759 333 3,192
Less: Allowance for off-balance sheet instruments8 214 338 – 552 256 406 – 662
Balance at end of period $ 658 $ 1,079 $ 156 $ 1,893 $ 844 $ 1,353 $ 333 $ 2,530 1 Includes allowance for loan losses related to ACI loans. 2 Transfers represent stage transfer movements prior to ECL remeasurement. 3 Represents the mechanical remeasurement between twelve-month (i.e., Stage 1) and lifetime ECLs (i.e., Stage 2 or 3) due to stage transfers necessitated by credit risk migration, as
described in the “Significant Increase in Credit Risk” section of Note 2, Summary of Significant Accounting Policies and Note 3, Significant Accounting Judgments, Estimates and
Assumptions of the Bank’s 2020 Annual Consolidated Financial Statements, holding all other factors impacting the change in ECLs constant. 4 Represents the increase in the allowance resulting from loans that were newly originated, purchased, or renewed. 5 Represents the changes in the allowance related to cash flow changes associated with new draws or repayments on loans outstanding. 6 Represents the decrease in the allowance resulting from loans that were fully repaid and excludes the decrease associated with loans that were disposed or fully written off. 7 Represents the changes in the allowance related to current period changes in risk (e.g., PD) caused by changes to macroeconomic factors, level of risk, parameters, and/or models,
subsequent to stage migration. Refer to the “Measurement of Expected Credit Losses”, “Forward Looking Information” and “Expert Credit Judgment” sections of Note 2, Summary of
Significant Accounting Policies and Note 3, Significant Accounting Judgments, Estimates and Assumptions of the Bank’s 2020 Annual Consolidated Financial Statements for further
details. 8 The allowance for loan losses for off-balance sheet instruments is recorded in Other liabilities on the Interim Consolidated Balance Sheet. 9 Credit cards are considered impaired and migrate to Stage 3 when they are 90 days past due and written off at 180 days past due. Refer to Note 2 of the Bank’s 2020 Annual
Consolidated Financial Statements for further details.
TD BANK GROUP • THIRD QUARTER 2021 • REPORT TO SHAREHOLDERS Page 67
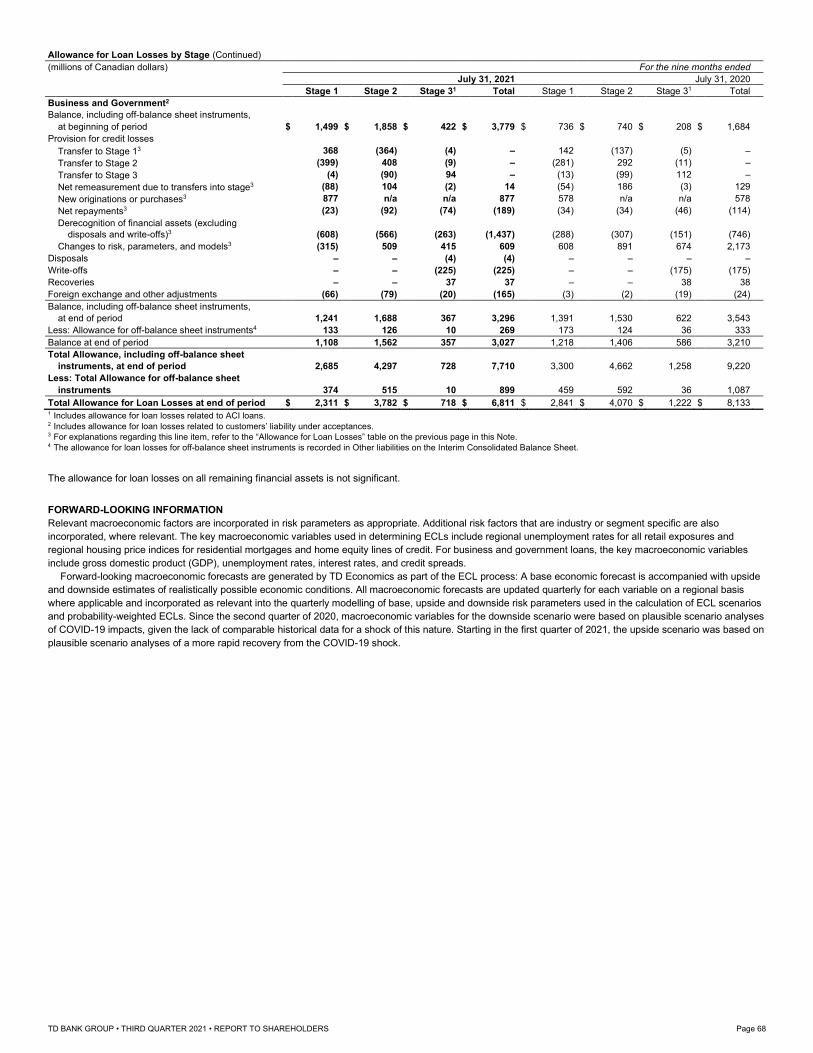
Allowance for Loan Losses by Stage (Continued)
(millions of Canadian dollars) For the nine months ended
July 31, 2021 July 31, 2020
Stage 1 Stage 2 Stage 31 Total Stage 1 Stage 2 Stage 31 Total
Business and Government2
Balance, including off-balance sheet instruments,
at beginning of period $ 1,499 $ 1,858 $ 422 $ 3,779 $ 736 $ 740 $ 208 $ 1,684
Provision for credit losses
Transfer to Stage 13 368 (364) (4) – 142 (137) (5) –
Transfer to Stage 2 (399) 408 (9) – (281) 292 (11) –
Transfer to Stage 3 (4) (90) 94 – (13) (99) 112 –
Net remeasurement due to transfers into stage3 (88) 104 (2) 14 (54) 186 (3) 129
New originations or purchases3 877 n/a n/a 877 578 n/a n/a 578
Net repayments3 (23) (92) (74) (189) (34) (34) (46) (114)
Derecognition of financial assets (excluding
disposals and write-offs)3 (608) (566) (263) (1,437) (288) (307) (151) (746)
Changes to risk, parameters, and models3 (315) 509 415 609 608 891 674 2,173
Disposals – – (4) (4) – – – –
Write-offs – – (225) (225) – – (175) (175)
Recoveries – – 37 37 – – 38 38
Foreign exchange and other adjustments (66) (79) (20) (165) (3) (2) (19) (24)
Balance, including off-balance sheet instruments,
at end of period 1,241 1,688 367 3,296 1,391 1,530 622 3,543
Less: Allowance for off-balance sheet instruments4 133 126 10 269 173 124 36 333
Balance at end of period 1,108 1,562 357 3,027 1,218 1,406 586 3,210
Total Allowance, including off-balance sheet
instruments, at end of period 2,685 4,297 728 7,710 3,300 4,662 1,258 9,220
Less: Total Allowance for off-balance sheet
instruments 374 515 10 899 459 592 36 1,087
Total Allowance for Loan Losses at end of period $ 2,311 $ 3,782 $ 718 $ 6,811 $ 2,841 $ 4,070 $ 1,222 $ 8,133 1 Includes allowance for loan losses related to ACI loans. 2 Includes allowance for loan losses related to customers’ liability under acceptances. 3 For explanations regarding this line item, refer to the “Allowance for Loan Losses” table on the previous page in this Note. 4 The allowance for loan losses for off-balance sheet instruments is recorded in Other liabilities on the Interim Consolidated Balance Sheet.
The allowance for loan losses on all remaining financial assets is not significant. FORWARD-LOOKING INFORMATION Relevant macroeconomic factors are incorporated in risk parameters as appropriate. Additional risk factors that are industry or segment specific are also
incorporated, where relevant. The key macroeconomic variables used in determining ECLs include regional unemployment rates for all retail exposures and
regional housing price indices for residential mortgages and home equity lines of credit. For business and government loans, the key macroeconomic variables
include gross domestic product (GDP), unemployment rates, interest rates, and credit spreads. Forward-looking macroeconomic forecasts are generated by TD Economics as part of the ECL process: A base economic forecast is accompanied with upside
and downside estimates of realistically possible economic conditions. All macroeconomic forecasts are updated quarterly for each variable on a regional basis
where applicable and incorporated as relevant into the quarterly modelling of base, upside and downside risk parameters used in the calculation of ECL scenarios
and probability-weighted ECLs. Since the second quarter of 2020, macroeconomic variables for the downside scenario were based on plausible scenario analyses
of COVID-19 impacts, given the lack of comparable historical data for a shock of this nature. Starting in the first quarter of 2021, the upside scenario was based on
plausible scenario analyses of a more rapid recovery from the COVID-19 shock.
TD BANK GROUP • THIRD QUARTER 2021 • REPORT TO SHAREHOLDERS Page 68
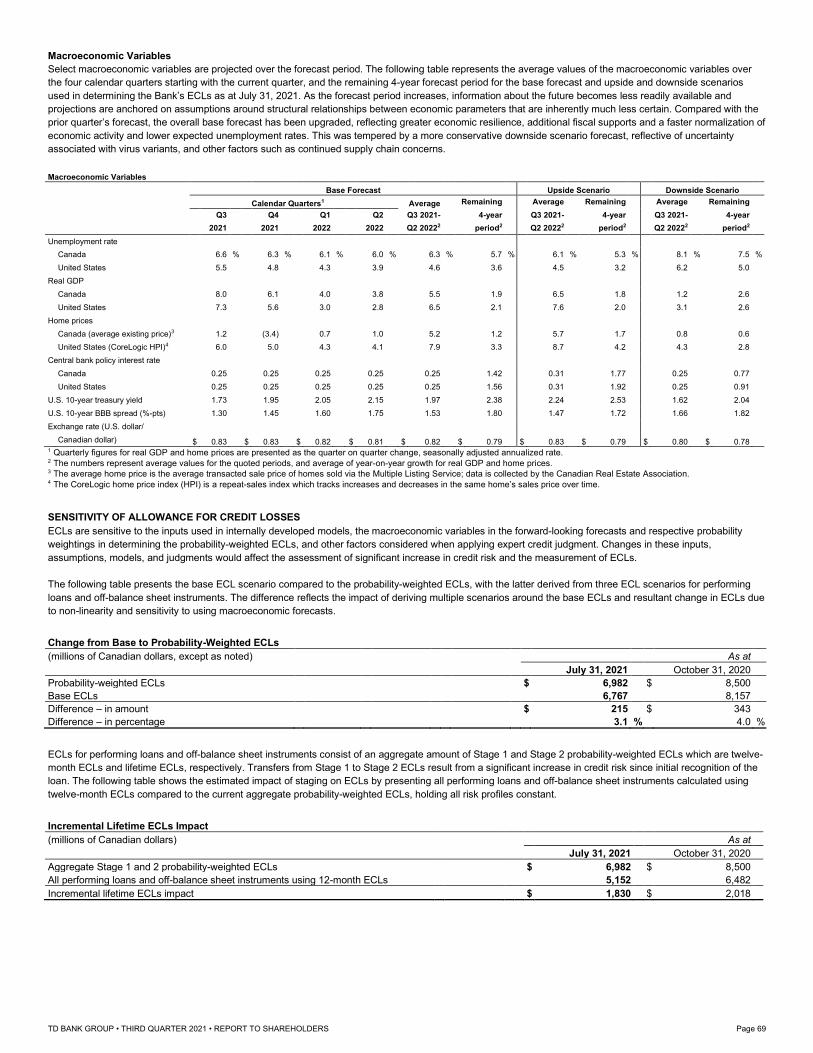
Macroeconomic Variables Select macroeconomic variables are projected over the forecast period. The following table represents the average values of the macroeconomic variables over
the four calendar quarters starting with the current quarter, and the remaining 4-year forecast period for the base forecast and upside and downside scenarios
used in determining the Bank’s ECLs as at July 31, 2021. As the forecast period increases, information about the future becomes less readily available and
projections are anchored on assumptions around structural relationships between economic parameters that are inherently much less certain. Compared with the
prior quarter’s forecast, the overall base forecast has been upgraded, reflecting greater economic resilience, additional fiscal supports and a faster normalization of
economic activity and lower expected unemployment rates. This was tempered by a more conservative downside scenario forecast, reflective of uncertainty
associated with virus variants, and other factors such as continued supply chain concerns.
Macroeconomic Variables
Base Forecast Upside Scenario Downside Scenario
Calendar Quarters1 Average Remaining Average Remaining Average Remaining
Q3 Q4 Q1 Q2 Q3 2021- 4-year Q3 2021- 4-year Q3 2021- 4-year
2021 2021 2022 2022 Q2 20222 period2 Q2 20222 period2 Q2 20222 period2
Unemployment rate
Canada 6.6 % 6.3 % 6.1 % 6.0 % 6.3 % 5.7 % 6.1 % 5.3 % 8.1 % 7.5 %
United States 5.5 4.8 4.3 3.9 4.6 3.6 4.5 3.2 6.2 5.0
Real GDP
Canada 8.0 6.1 4.0 3.8 5.5 1.9 6.5 1.8 1.2 2.6
United States 7.3 5.6 3.0 2.8 6.5 2.1 7.6 2.0 3.1 2.6
Home prices
Canada (average existing price)3 1.2 (3.4) 0.7 1.0 5.2 1.2 5.7 1.7 0.8 0.6
United States (CoreLogic HPI)4 6.0 5.0 4.3 4.1 7.9 3.3 8.7 4.2 4.3 2.8
Central bank policy interest rate
Canada 0.25 0.25 0.25 0.25 0.25 1.42 0.31 1.77 0.25 0.77
United States 0.25 0.25 0.25 0.25 0.25 1.56 0.31 1.92 0.25 0.91
U.S. 10-year treasury yield 1.73 1.95 2.05 2.15 1.97 2.38 2.24 2.53 1.62 2.04
U.S. 10-year BBB spread (%-pts) 1.30 1.45 1.60 1.75 1.53 1.80 1.47 1.72 1.66 1.82
Exchange rate (U.S. dollar/
Canadian dollar) $ 0.83 $ 0.83 $ 0.82 $ 0.81 $ 0.82 $ 0.79 $ 0.83 $ 0.79 $ 0.80 $ 0.78
1 Quarterly figures for real GDP and home prices are presented as the quarter on quarter change, seasonally adjusted annualized rate.
2 The numbers represent average values for the quoted periods, and average of year-on-year growth for real GDP and home prices.
3 The average home price is the average transacted sale price of homes sold via the Multiple Listing Service; data is collected by the Canadian Real Estate Association. 4 The CoreLogic home price index (HPI) is a repeat-sales index which tracks increases and decreases in the same home’s sales price over time.
SENSITIVITY OF ALLOWANCE FOR CREDIT LOSSES ECLs are sensitive to the inputs used in internally developed models, the macroeconomic variables in the forward-looking forecasts and respective probability
weightings in determining the probability-weighted ECLs, and other factors considered when applying expert credit judgment. Changes in these inputs,
assumptions, models, and judgments would affect the assessment of significant increase in credit risk and the measurement of ECLs. The following table presents the base ECL scenario compared to the probability-weighted ECLs, with the latter derived from three ECL scenarios for performing
loans and off-balance sheet instruments. The difference reflects the impact of deriving multiple scenarios around the base ECLs and resultant change in ECLs due
to non-linearity and sensitivity to using macroeconomic forecasts. Change from Base to Probability-Weighted ECLs
(millions of Canadian dollars, except as noted) As at
July 31, 2021 October 31, 2020
Probability-weighted ECLs $ 6,982 $ 8,500
Base ECLs 6,767 8,157
Difference – in amount $ 215 $ 343
Difference – in percentage 3.1 % 4.0 %
ECLs for performing loans and off-balance sheet instruments consist of an aggregate amount of Stage 1 and Stage 2 probability-weighted ECLs which are twelve-
month ECLs and lifetime ECLs, respectively. Transfers from Stage 1 to Stage 2 ECLs result from a significant increase in credit risk since initial recognition of the
loan. The following table shows the estimated impact of staging on ECLs by presenting all performing loans and off-balance sheet instruments calculated using
twelve-month ECLs compared to the current aggregate probability-weighted ECLs, holding all risk profiles constant. Incremental Lifetime ECLs Impact
(millions of Canadian dollars) As at
July 31, 2021 October 31, 2020
Aggregate Stage 1 and 2 probability-weighted ECLs $ 6,982 $ 8,500
All performing loans and off-balance sheet instruments using 12-month ECLs 5,152 6,482
Incremental lifetime ECLs impact $ 1,830 $ 2,018
TD BANK GROUP • THIRD QUARTER 2021 • REPORT TO SHAREHOLDERS Page 69
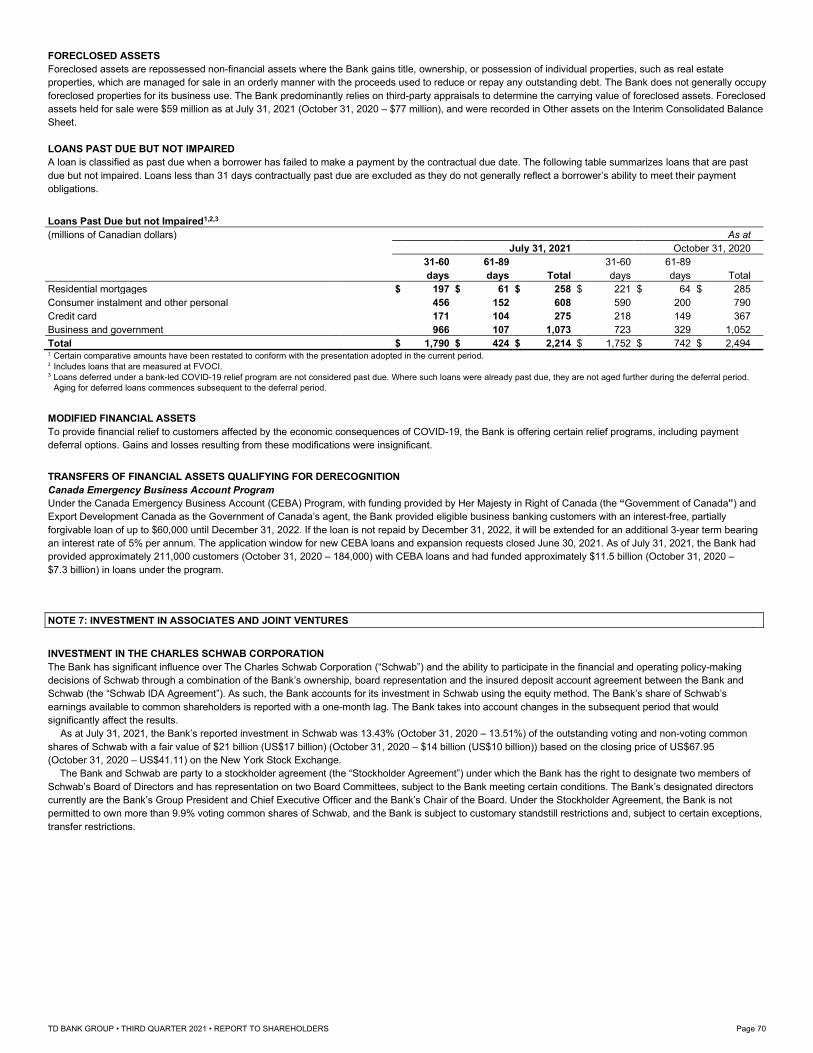
FORECLOSED ASSETS Foreclosed assets are repossessed non-financial assets where the Bank gains title, ownership, or possession of individual properties, such as real estate
properties, which are managed for sale in an orderly manner with the proceeds used to reduce or repay any outstanding debt. The Bank does not generally occupy
foreclosed properties for its business use. The Bank predominantly relies on third-party appraisals to determine the carrying value of foreclosed assets. Foreclosed
assets held for sale were $59 million as at July 31, 2021 (October 31, 2020 – $77 million), and were recorded in Other assets on the Interim Consolidated Balance
Sheet.
LOANS PAST DUE BUT NOT IMPAIRED A loan is classified as past due when a borrower has failed to make a payment by the contractual due date. The following table summarizes loans that are past
due but not impaired. Loans less than 31 days contractually past due are excluded as they do not generally reflect a borrower’s ability to meet their payment
obligations. Loans Past Due but not Impaired1,2,3
(millions of Canadian dollars) As at
July 31, 2021 October 31, 2020
31-60 61-89 31-60 61-89
days days Total days days Total
Residential mortgages $ 197 $ 61 $ 258 $ 221 $ 64 $ 285
Consumer instalment and other personal 456 152 608 590 200 790
Credit card 171 104 275 218 149 367
Business and government 966 107 1,073 723 329 1,052
Total $ 1,790 $ 424 $ 2,214 $ 1,752 $ 742 $ 2,494 1 Certain comparative amounts have been restated to conform with the presentation adopted in the current period. 2 Includes loans that are measured at FVOCI. 3 Loans deferred under a bank-led COVID-19 relief program are not considered past due. Where such loans were already past due, they are not aged further during the deferral period.
Aging for deferred loans commences subsequent to the deferral period.
MODIFIED FINANCIAL ASSETS To provide financial relief to customers affected by the economic consequences of COVID-19, the Bank is offering certain relief programs, including payment
deferral options. Gains and losses resulting from these modifications were insignificant. TRANSFERS OF FINANCIAL ASSETS QUALIFYING FOR DERECOGNITION Canada Emergency Business Account Program Under the Canada Emergency Business Account (CEBA) Program, with funding provided by Her Majesty in Right of Canada (the “Government of Canada”) and
Export Development Canada as the Government of Canada’s agent, the Bank provided eligible business banking customers with an interest-free, partially
forgivable loan of up to $60,000 until December 31, 2022. If the loan is not repaid by December 31, 2022, it will be extended for an additional 3-year term bearing
an interest rate of 5% per annum. The application window for new CEBA loans and expansion requests closed June 30, 2021. As of July 31, 2021, the Bank had
provided approximately 211,000 customers (October 31, 2020 – 184,000) with CEBA loans and had funded approximately $11.5 billion (October 31, 2020 –
$7.3 billion) in loans under the program.
NOTE 7: INVESTMENT IN ASSOCIATES AND JOINT VENTURES
INVESTMENT IN THE CHARLES SCHWAB CORPORATION The Bank has significant influence over The Charles Schwab Corporation (“Schwab”) and the ability to participate in the financial and operating policy-making
decisions of Schwab through a combination of the Bank’s ownership, board representation and the insured deposit account agreement between the Bank and
Schwab (the “Schwab IDA Agreement”). As such, the Bank accounts for its investment in Schwab using the equity method. The Bank’s share of Schwab’s
earnings available to common shareholders is reported with a one-month lag. The Bank takes into account changes in the subsequent period that would
significantly affect the results. As at July 31, 2021, the Bank’s reported investment in Schwab was 13.43% (October 31, 2020 – 13.51%) of the outstanding voting and non-voting common
shares of Schwab with a fair value of $21 billion (US$17 billion) (October 31, 2020 – $14 billion (US$10 billion)) based on the closing price of US$67.95
(October 31, 2020 – US$41.11) on the New York Stock Exchange. The Bank and Schwab are party to a stockholder agreement (the “Stockholder Agreement”) under which the Bank has the right to designate two members of
Schwab’s Board of Directors and has representation on two Board Committees, subject to the Bank meeting certain conditions. The Bank’s designated directors
currently are the Bank’s Group President and Chief Executive Officer and the Bank’s Chair of the Board. Under the Stockholder Agreement, the Bank is not
permitted to own more than 9.9% voting common shares of Schwab, and the Bank is subject to customary standstill restrictions and, subject to certain exceptions,
transfer restrictions.
TD BANK GROUP • THIRD QUARTER 2021 • REPORT TO SHAREHOLDERS Page 70
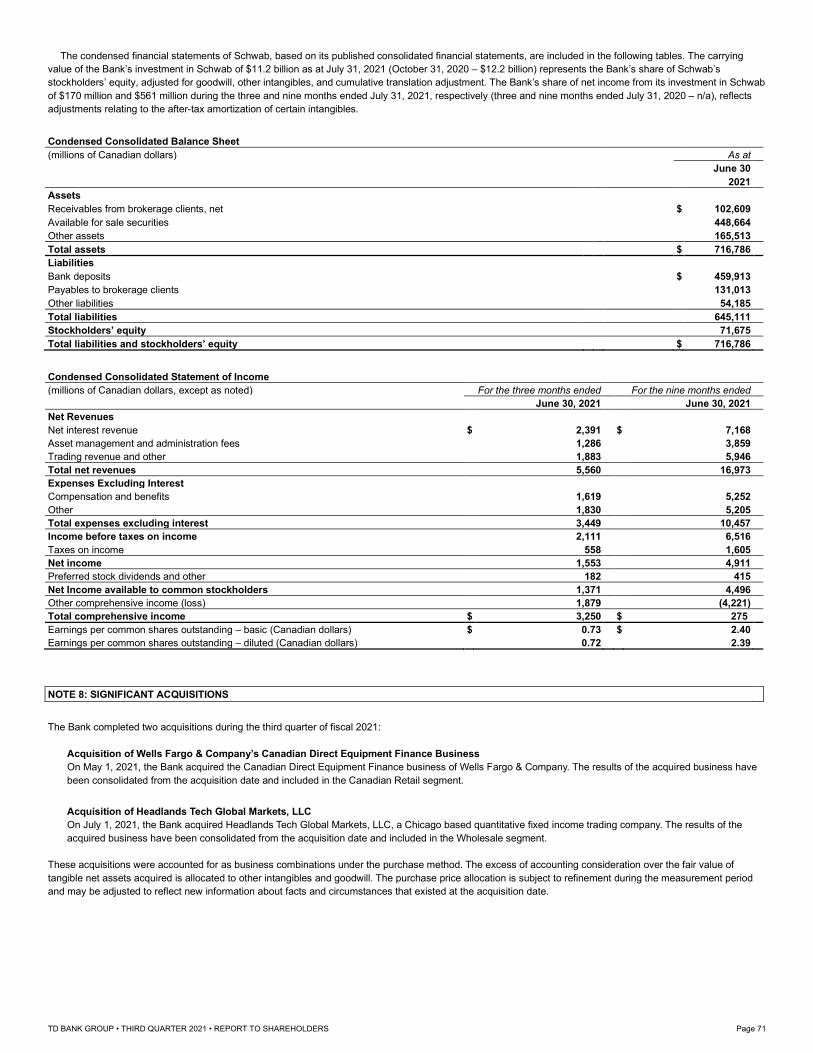
The condensed financial statements of Schwab, based on its published consolidated financial statements, are included in the following tables. The carrying
value of the Bank’s investment in Schwab of $11.2 billion as at July 31, 2021 (October 31, 2020 – $12.2 billion) represents the Bank’s share of Schwab’s
stockholders’ equity, adjusted for goodwill, other intangibles, and cumulative translation adjustment. The Bank’s share of net income from its investment in Schwab
of $170 million and $561 million during the three and nine months ended July 31, 2021, respectively (three and nine months ended July 31, 2020 – n/a), reflects
adjustments relating to the after-tax amortization of certain intangibles. Condensed Consolidated Balance Sheet
(millions of Canadian dollars) As at
June 30
2021
Assets
Receivables from brokerage clients, net $ 102,609
Available for sale securities 448,664
Other assets 165,513
Total assets $ 716,786
Liabilities
Bank deposits $ 459,913
Payables to brokerage clients 131,013
Other liabilities 54,185
Total liabilities 645,111
Stockholders’ equity 71,675
Total liabilities and stockholders’ equity $ 716,786
Condensed Consolidated Statement of Income
(millions of Canadian dollars, except as noted) For the three months ended For the nine months ended June 30, 2021 June 30, 2021
Net Revenues
Net interest revenue $ 2,391 $ 7,168
Asset management and administration fees 1,286 3,859
Trading revenue and other 1,883 5,946
Total net revenues 5,560 16,973
Expenses Excluding Interest
Compensation and benefits 1,619 5,252
Other 1,830 5,205
Total expenses excluding interest 3,449 10,457
Income before taxes on income 2,111 6,516
Taxes on income 558 1,605
Net income 1,553 4,911
Preferred stock dividends and other 182 415
Net Income available to common stockholders 1,371 4,496
Other comprehensive income (loss) 1,879 (4,221)
Total comprehensive income $ 3,250 $ 275
Earnings per common shares outstanding – basic (Canadian dollars) $ 0.73 $ 2.40
Earnings per common shares outstanding – diluted (Canadian dollars) 0.72 2.39
NOTE 8: SIGNIFICANT ACQUISITIONS
The Bank completed two acquisitions during the third quarter of fiscal 2021:
Acquisition of Wells Fargo & Company’s Canadian Direct Equipment Finance Business
On May 1, 2021, the Bank acquired the Canadian Direct Equipment Finance business of Wells Fargo & Company. The results of the acquired business have
been consolidated from the acquisition date and included in the Canadian Retail segment.
Acquisition of Headlands Tech Global Markets, LLC
On July 1, 2021, the Bank acquired Headlands Tech Global Markets, LLC, a Chicago based quantitative fixed income trading company. The results of the
acquired business have been consolidated from the acquisition date and included in the Wholesale segment.
These acquisitions were accounted for as business combinations under the purchase method. The excess of accounting consideration over the fair value of
tangible net assets acquired is allocated to other intangibles and goodwill. The purchase price allocation is subject to refinement during the measurement period
and may be adjusted to reflect new information about facts and circumstances that existed at the acquisition date.
TD BANK GROUP • THIRD QUARTER 2021 • REPORT TO SHAREHOLDERS Page 71
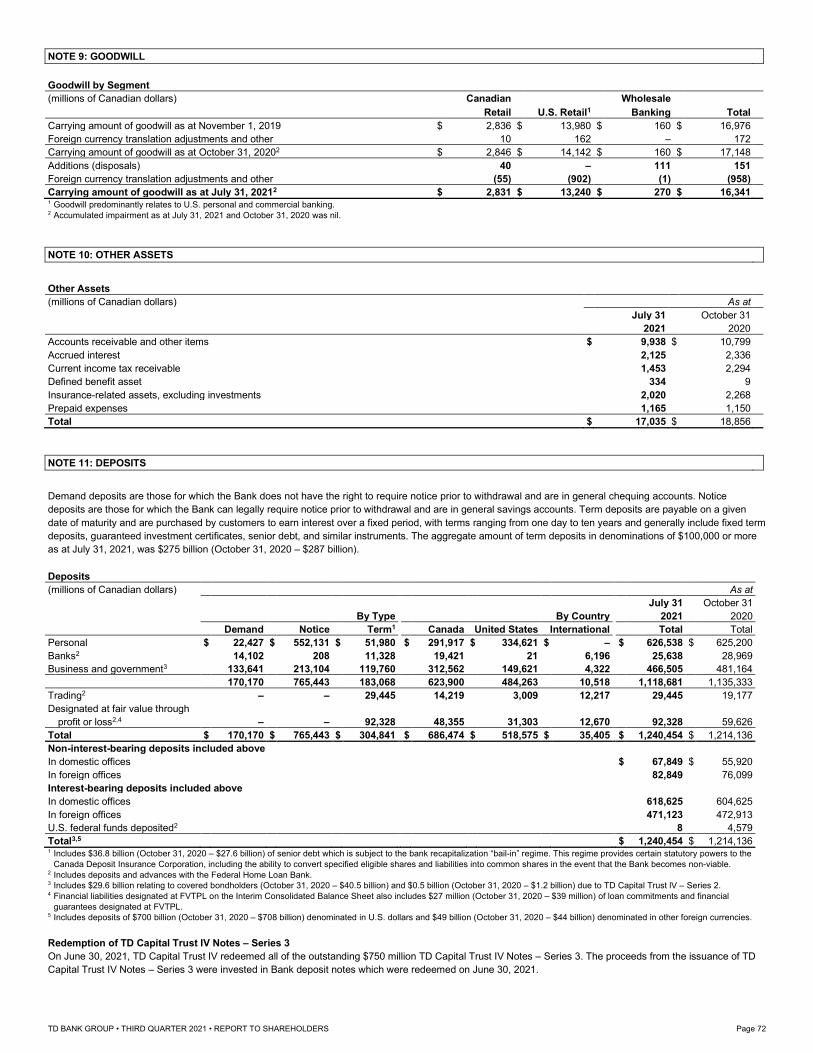
NOTE 9: GOODWILL
Goodwill by Segment
(millions of Canadian dollars) Canadian Wholesale
Retail U.S. Retail1 Banking Total
Carrying amount of goodwill as at November 1, 2019 $ 2,836 $ 13,980 $ 160 $ 16,976
Foreign currency translation adjustments and other 10 162 – 172
Carrying amount of goodwill as at October 31, 20202 $ 2,846 $ 14,142 $ 160 $ 17,148
Additions (disposals) 40 – 111 151
Foreign currency translation adjustments and other (55) (902) (1) (958)
Carrying amount of goodwill as at July 31, 20212 $ 2,831 $ 13,240 $ 270 $ 16,341 1 Goodwill predominantly relates to U.S. personal and commercial banking. 2 Accumulated impairment as at July 31, 2021 and October 31, 2020 was nil.
NOTE 10: OTHER ASSETS
Other Assets
(millions of Canadian dollars) As at
July 31 October 31
2021 2020
Accounts receivable and other items $ 9,938 $ 10,799
Accrued interest 2,125 2,336
Current income tax receivable 1,453 2,294
Defined benefit asset 334 9
Insurance-related assets, excluding investments 2,020 2,268
Prepaid expenses 1,165 1,150
Total $ 17,035 $ 18,856
NOTE 11: DEPOSITS
Demand deposits are those for which the Bank does not have the right to require notice prior to withdrawal and are in general chequing accounts. Notice
deposits are those for which the Bank can legally require notice prior to withdrawal and are in general savings accounts. Term deposits are payable on a given
date of maturity and are purchased by customers to earn interest over a fixed period, with terms ranging from one day to ten years and generally include fixed term
deposits, guaranteed investment certificates, senior debt, and similar instruments. The aggregate amount of term deposits in denominations of $100,000 or more
as at July 31, 2021, was $275 billion (October 31, 2020 – $287 billion). Deposits
(millions of Canadian dollars) As at
July 31 October 31
By Type By Country 2021 2020
Demand Notice Term1 Canada United States International Total Total
Personal $ 22,427 $ 552,131 $ 51,980 $ 291,917 $ 334,621 $ – $ 626,538 $ 625,200
Banks2 14,102 208 11,328 19,421 21 6,196 25,638 28,969
Business and government3 133,641 213,104 119,760 312,562 149,621 4,322 466,505 481,164
170,170 765,443 183,068 623,900 484,263 10,518 1,118,681 1,135,333
Trading2 – – 29,445 14,219 3,009 12,217 29,445 19,177
Designated at fair value through
profit or loss2,4 – – 92,328 48,355 31,303 12,670 92,328 59,626
Total $ 170,170 $ 765,443 $ 304,841 $ 686,474 $ 518,575 $ 35,405 $ 1,240,454 $ 1,214,136
Non-interest-bearing deposits included above
In domestic offices $ 67,849 $ 55,920
In foreign offices 82,849 76,099
Interest-bearing deposits included above
In domestic offices 618,625 604,625
In foreign offices 471,123 472,913
U.S. federal funds deposited2 8 4,579
Total3,5 $ 1,240,454 $ 1,214,136 1 Includes $36.8 billion (October 31, 2020 – $27.6 billion) of senior debt which is subject to the bank recapitalization “bail-in” regime. This regime provides certain statutory powers to the
Canada Deposit Insurance Corporation, including the ability to convert specified eligible shares and liabilities into common shares in the event that the Bank becomes non-viable. 2 Includes deposits and advances with the Federal Home Loan Bank. 3 Includes $29.6 billion relating to covered bondholders (October 31, 2020 – $40.5 billion) and $0.5 billion (October 31, 2020 – $1.2 billion) due to TD Capital Trust lV – Series 2. 4 Financial liabilities designated at FVTPL on the Interim Consolidated Balance Sheet also includes $27 million (October 31, 2020 – $39 million) of loan commitments and financial
guarantees designated at FVTPL. 5 Includes deposits of $700 billion (October 31, 2020 – $708 billion) denominated in U.S. dollars and $49 billion (October 31, 2020 – $44 billion) denominated in other foreign currencies.
Redemption of TD Capital Trust IV Notes – Series 3
On June 30, 2021, TD Capital Trust IV redeemed all of the outstanding $750 million TD Capital Trust IV Notes – Series 3. The proceeds from the issuance of TD
Capital Trust IV Notes – Series 3 were invested in Bank deposit notes which were redeemed on June 30, 2021.
TD BANK GROUP • THIRD QUARTER 2021 • REPORT TO SHAREHOLDERS Page 72
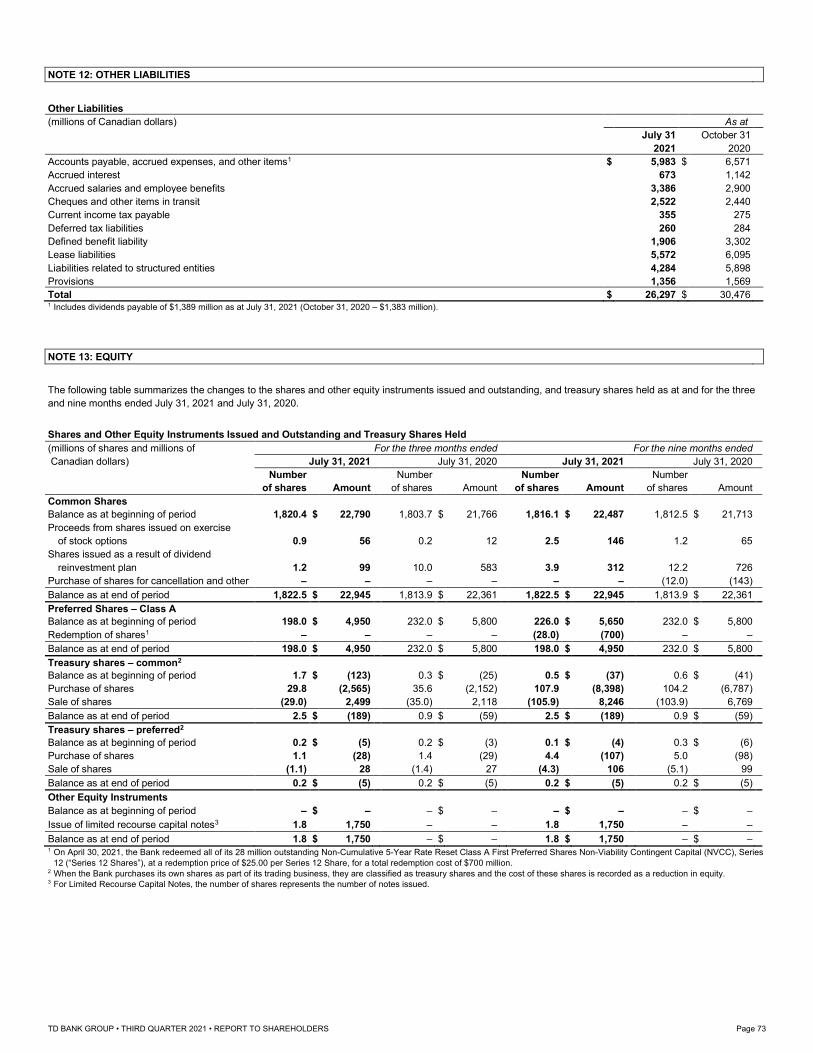
NOTE 12: OTHER LIABILITIES
Other Liabilities
(millions of Canadian dollars) As at
July 31 October 31
2021 2020
Accounts payable, accrued expenses, and other items1 $ 5,983 $ 6,571
Accrued interest 673 1,142
Accrued salaries and employee benefits 3,386 2,900
Cheques and other items in transit 2,522 2,440
Current income tax payable 355 275
Deferred tax liabilities 260 284
Defined benefit liability 1,906 3,302
Lease liabilities 5,572 6,095
Liabilities related to structured entities 4,284 5,898
Provisions 1,356 1,569
Total $ 26,297 $ 30,476 1 Includes dividends payable of $1,389 million as at July 31, 2021 (October 31, 2020 – $1,383 million).
NOTE 13: EQUITY
The following table summarizes the changes to the shares and other equity instruments issued and outstanding, and treasury shares held as at and for the three
and nine months ended July 31, 2021 and July 31, 2020. Shares and Other Equity Instruments Issued and Outstanding and Treasury Shares Held
(millions of shares and millions of For the three months ended For the nine months ended
Canadian dollars) July 31, 2021 July 31, 2020 July 31, 2021 July 31, 2020
Number Number Number Number
of shares Amount of shares Amount of shares Amount of shares Amount
Common Shares
Balance as at beginning of period 1,820.4 $ 22,790 1,803.7 $ 21,766 1,816.1 $ 22,487 1,812.5 $ 21,713
Proceeds from shares issued on exercise
of stock options 0.9 56 0.2 12 2.5 146 1.2 65
Shares issued as a result of dividend
reinvestment plan 1.2 99 10.0 583 3.9 312 12.2 726
Purchase of shares for cancellation and other – – – – – – (12.0) (143)
Balance as at end of period 1,822.5 $ 22,945 1,813.9 $ 22,361 1,822.5 $ 22,945 1,813.9 $ 22,361
Preferred Shares – Class A
Balance as at beginning of period 198.0 $ 4,950 232.0 $ 5,800 226.0 $ 5,650 232.0 $ 5,800
Redemption of shares1 – – – – (28.0) (700) – –
Balance as at end of period 198.0 $ 4,950 232.0 $ 5,800 198.0 $ 4,950 232.0 $ 5,800
Treasury shares – common2
Balance as at beginning of period 1.7 $ (123) 0.3 $ (25) 0.5 $ (37) 0.6 $ (41)
Purchase of shares 29.8 (2,565) 35.6 (2,152) 107.9 (8,398) 104.2 (6,787)
Sale of shares (29.0) 2,499 (35.0) 2,118 (105.9) 8,246 (103.9) 6,769
Balance as at end of period 2.5 $ (189) 0.9 $ (59) 2.5 $ (189) 0.9 $ (59)
Treasury shares – preferred2
Balance as at beginning of period 0.2 $ (5) 0.2 $ (3) 0.1 $ (4) 0.3 $ (6)
Purchase of shares 1.1 (28) 1.4 (29) 4.4 (107) 5.0 (98)
Sale of shares (1.1) 28 (1.4) 27 (4.3) 106 (5.1) 99
Balance as at end of period 0.2 $ (5) 0.2 $ (5) 0.2 $ (5) 0.2 $ (5)
Other Equity Instruments
Balance as at beginning of period – $ – – $ – – $ – – $ –
Issue of limited recourse capital notes3 1.8 1,750 – – 1.8 1,750 – –
Balance as at end of period 1.8 $ 1,750 – $ – 1.8 $ 1,750 – $ – 1 On April 30, 2021, the Bank redeemed all of its 28 million outstanding Non-Cumulative 5-Year Rate Reset Class A First Preferred Shares Non-Viability Contingent Capital (NVCC), Series
12 (“Series 12 Shares”), at a redemption price of $25.00 per Series 12 Share, for a total redemption cost of $700 million. 2 When the Bank purchases its own shares as part of its trading business, they are classified as treasury shares and the cost of these shares is recorded as a reduction in equity. 3 For Limited Recourse Capital Notes, the number of shares represents the number of notes issued.
TD BANK GROUP • THIRD QUARTER 2021 • REPORT TO SHAREHOLDERS Page 73
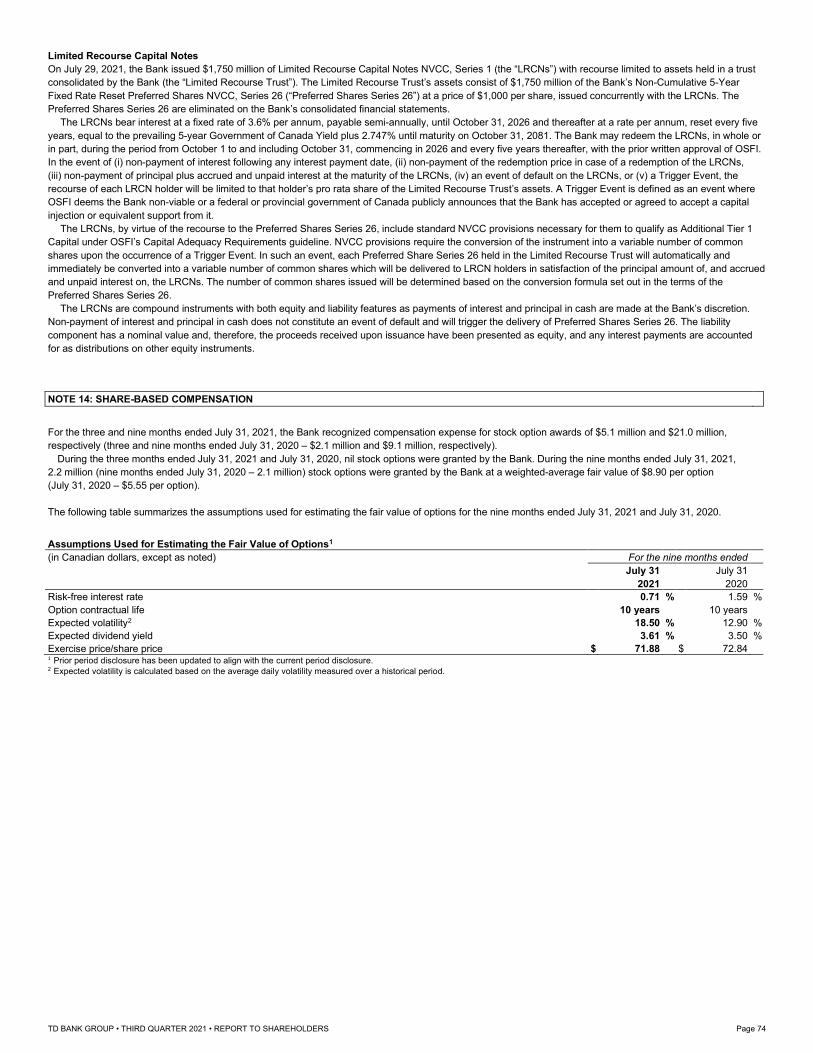
Limited Recourse Capital Notes On July 29, 2021, the Bank issued $1,750 million of Limited Recourse Capital Notes NVCC, Series 1 (the “LRCNs”) with recourse limited to assets held in a trust
consolidated by the Bank (the “Limited Recourse Trust”). The Limited Recourse Trust’s assets consist of $1,750 million of the Bank’s Non-Cumulative 5-Year
Fixed Rate Reset Preferred Shares NVCC, Series 26 (“Preferred Shares Series 26”) at a price of $1,000 per share, issued concurrently with the LRCNs. The
Preferred Shares Series 26 are eliminated on the Bank’s consolidated financial statements. The LRCNs bear interest at a fixed rate of 3.6% per annum, payable semi-annually, until October 31, 2026 and thereafter at a rate per annum, reset every five
years, equal to the prevailing 5-year Government of Canada Yield plus 2.747% until maturity on October 31, 2081. The Bank may redeem the LRCNs, in whole or
in part, during the period from October 1 to and including October 31, commencing in 2026 and every five years thereafter, with the prior written approval of OSFI.
In the event of (i) non-payment of interest following any interest payment date, (ii) non-payment of the redemption price in case of a redemption of the LRCNs,
(iii) non-payment of principal plus accrued and unpaid interest at the maturity of the LRCNs, (iv) an event of default on the LRCNs, or (v) a Trigger Event, the
recourse of each LRCN holder will be limited to that holder’s pro rata share of the Limited Recourse Trust’s assets. A Trigger Event is defined as an event where
OSFI deems the Bank non-viable or a federal or provincial government of Canada publicly announces that the Bank has accepted or agreed to accept a capital
injection or equivalent support from it. The LRCNs, by virtue of the recourse to the Preferred Shares Series 26, include standard NVCC provisions necessary for them to qualify as Additional Tier 1
Capital under OSFI’s Capital Adequacy Requirements guideline. NVCC provisions require the conversion of the instrument into a variable number of common
shares upon the occurrence of a Trigger Event. In such an event, each Preferred Share Series 26 held in the Limited Recourse Trust will automatically and
immediately be converted into a variable number of common shares which will be delivered to LRCN holders in satisfaction of the principal amount of, and accrued
and unpaid interest on, the LRCNs. The number of common shares issued will be determined based on the conversion formula set out in the terms of the
Preferred Shares Series 26. The LRCNs are compound instruments with both equity and liability features as payments of interest and principal in cash are made at the Bank’s discretion.
Non-payment of interest and principal in cash does not constitute an event of default and will trigger the delivery of Preferred Shares Series 26. The liability
component has a nominal value and, therefore, the proceeds received upon issuance have been presented as equity, and any interest payments are accounted
for as distributions on other equity instruments.
NOTE 14: SHARE-BASED COMPENSATION
For the three and nine months ended July 31, 2021, the Bank recognized compensation expense for stock option awards of $5.1 million and $21.0 million,
respectively (three and nine months ended July 31, 2020 – $2.1 million and $9.1 million, respectively). During the three months ended July 31, 2021 and July 31, 2020, nil stock options were granted by the Bank. During the nine months ended July 31, 2021,
2.2 million (nine months ended July 31, 2020 – 2.1 million) stock options were granted by the Bank at a weighted-average fair value of $8.90 per option
(July 31, 2020 – $5.55 per option). The following table summarizes the assumptions used for estimating the fair value of options for the nine months ended July 31, 2021 and July 31, 2020. Assumptions Used for Estimating the Fair Value of Options1
(in Canadian dollars, except as noted) For the nine months ended
July 31 July 31
2021 2020
Risk-free interest rate 0.71 % 1.59 %
Option contractual life 10 years 10 years
Expected volatility2 18.50 % 12.90 %
Expected dividend yield 3.61 % 3.50 %
Exercise price/share price $ 71.88 $ 72.84 1 Prior period disclosure has been updated to align with the current period disclosure. 2 Expected volatility is calculated based on the average daily volatility measured over a historical period.
TD BANK GROUP • THIRD QUARTER 2021 • REPORT TO SHAREHOLDERS Page 74
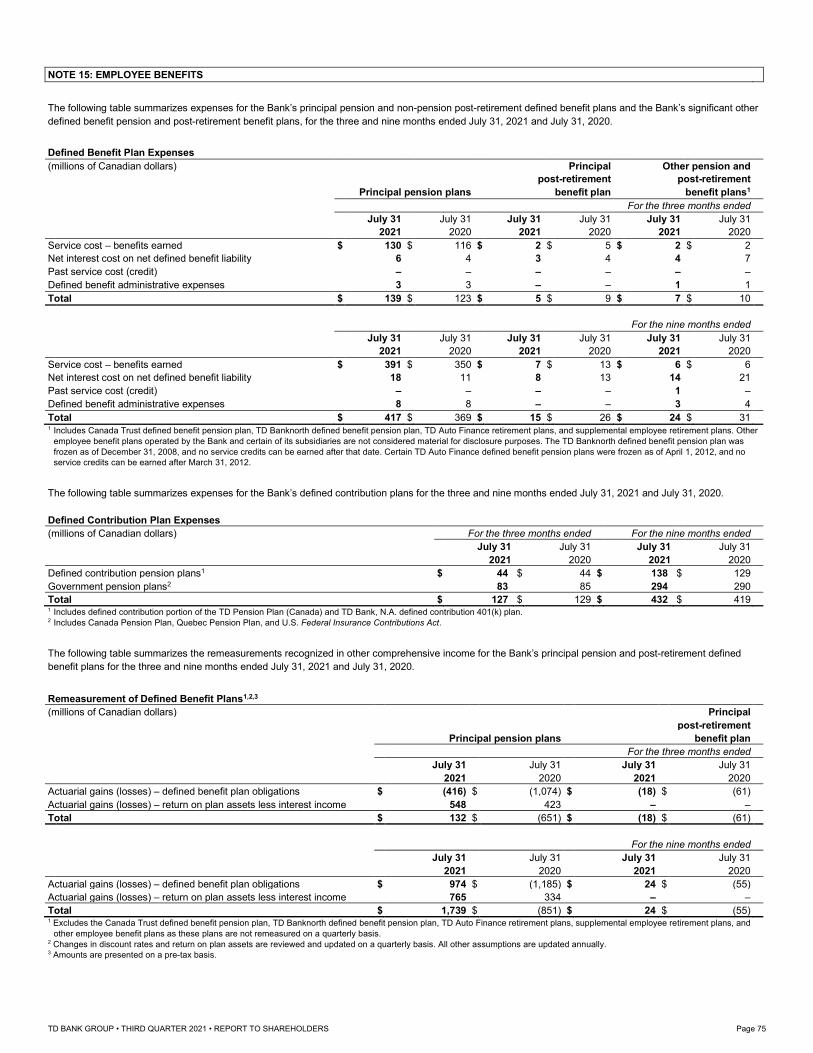
NOTE 15: EMPLOYEE BENEFITS
The following table summarizes expenses for the Bank’s principal pension and non-pension post-retirement defined benefit plans and the Bank’s significant other
defined benefit pension and post-retirement benefit plans, for the three and nine months ended July 31, 2021 and July 31, 2020. Defined Benefit Plan Expenses
(millions of Canadian dollars) Principal Other pension and
post-retirement post-retirement
Principal pension plans benefit plan benefit plans1
For the three months ended
July 31 July 31 July 31 July 31 July 31 July 31
2021 2020 2021 2020 2021 2020
Service cost – benefits earned $ 130 $ 116 $ 2 $ 5 $ 2 $ 2
Net interest cost on net defined benefit liability 6 4 3 4 4 7
Past service cost (credit) – – – – – –
Defined benefit administrative expenses 3 3 – – 1 1
Total $ 139 $ 123 $ 5 $ 9 $ 7 $ 10
For the nine months ended
July 31 July 31 July 31 July 31 July 31 July 31
2021 2020 2021 2020 2021 2020
Service cost – benefits earned $ 391 $ 350 $ 7 $ 13 $ 6 $ 6
Net interest cost on net defined benefit liability 18 11 8 13 14 21
Past service cost (credit) – – – – 1 –
Defined benefit administrative expenses 8 8 – – 3 4
Total $ 417 $ 369 $ 15 $ 26 $ 24 $ 31 1 Includes Canada Trust defined benefit pension plan, TD Banknorth defined benefit pension plan, TD Auto Finance retirement plans, and supplemental employee retirement plans. Other
employee benefit plans operated by the Bank and certain of its subsidiaries are not considered material for disclosure purposes. The TD Banknorth defined benefit pension plan was
frozen as of December 31, 2008, and no service credits can be earned after that date. Certain TD Auto Finance defined benefit pension plans were frozen as of April 1, 2012, and no
service credits can be earned after March 31, 2012.
The following table summarizes expenses for the Bank’s defined contribution plans for the three and nine months ended July 31, 2021 and July 31, 2020. Defined Contribution Plan Expenses
(millions of Canadian dollars) For the three months ended For the nine months ended
July 31 July 31 July 31 July 31
2021 2020 2021 2020
Defined contribution pension plans1 $ 44 $ 44 $ 138 $ 129
Government pension plans2 83 85 294 290
Total $ 127 $ 129 $ 432 $ 419 1 Includes defined contribution portion of the TD Pension Plan (Canada) and TD Bank, N.A. defined contribution 401(k) plan. 2 Includes Canada Pension Plan, Quebec Pension Plan, and U.S. Federal Insurance Contributions Act.
The following table summarizes the remeasurements recognized in other comprehensive income for the Bank’s principal pension and post-retirement defined
benefit plans for the three and nine months ended July 31, 2021 and July 31, 2020.
Remeasurement of Defined Benefit Plans1,2,3
(millions of Canadian dollars) Principal
post-retirement
Principal pension plans benefit plan
For the three months ended
July 31 July 31 July 31 July 31
2021 2020 2021 2020
Actuarial gains (losses) – defined benefit plan obligations $ (416) $ (1,074) $ (18) $ (61)
Actuarial gains (losses) – return on plan assets less interest income 548 423 – –
Total $ 132 $ (651) $ (18) $ (61)
For the nine months ended
July 31 July 31 July 31 July 31
2021 2020 2021 2020
Actuarial gains (losses) – defined benefit plan obligations $ 974 $ (1,185) $ 24 $ (55)
Actuarial gains (losses) – return on plan assets less interest income 765 334 – –
Total $ 1,739 $ (851) $ 24 $ (55) 1 Excludes the Canada Trust defined benefit pension plan, TD Banknorth defined benefit pension plan, TD Auto Finance retirement plans, supplemental employee retirement plans, and
other employee benefit plans as these plans are not remeasured on a quarterly basis. 2 Changes in discount rates and return on plan assets are reviewed and updated on a quarterly basis. All other assumptions are updated annually. 3 Amounts are presented on a pre-tax basis.
TD BANK GROUP • THIRD QUARTER 2021 • REPORT TO SHAREHOLDERS Page 75
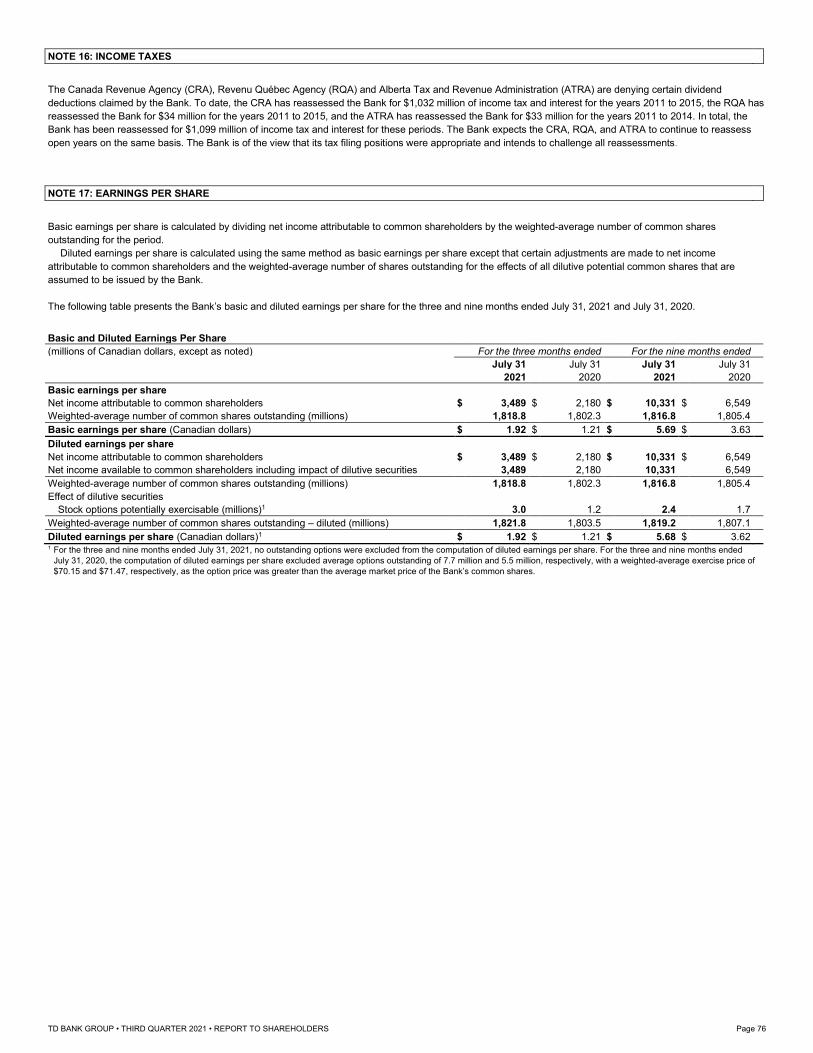
NOTE 16: INCOME TAXES
The Canada Revenue Agency (CRA), Revenu Québec Agency (RQA) and Alberta Tax and Revenue Administration (ATRA) are denying certain dividend
deductions claimed by the Bank. To date, the CRA has reassessed the Bank for $1,032 million of income tax and interest for the years 2011 to 2015, the RQA has
reassessed the Bank for $34 million for the years 2011 to 2015, and the ATRA has reassessed the Bank for $33 million for the years 2011 to 2014. In total, the
Bank has been reassessed for $1,099 million of income tax and interest for these periods. The Bank expects the CRA, RQA, and ATRA to continue to reassess
open years on the same basis. The Bank is of the view that its tax filing positions were appropriate and intends to challenge all reassessments.
NOTE 17: EARNINGS PER SHARE
Basic earnings per share is calculated by dividing net income attributable to common shareholders by the weighted-average number of common shares
outstanding for the period. Diluted earnings per share is calculated using the same method as basic earnings per share except that certain adjustments are made to net income
attributable to common shareholders and the weighted-average number of shares outstanding for the effects of all dilutive potential common shares that are
assumed to be issued by the Bank. The following table presents the Bank’s basic and diluted earnings per share for the three and nine months ended July 31, 2021 and July 31, 2020. Basic and Diluted Earnings Per Share
(millions of Canadian dollars, except as noted) For the three months ended For the nine months ended
July 31 July 31 July 31 July 31
2021 2020 2021 2020
Basic earnings per share
Net income attributable to common shareholders $ 3,489 $ 2,180 $ 10,331 $ 6,549
Weighted-average number of common shares outstanding (millions) 1,818.8 1,802.3 1,816.8 1,805.4
Basic earnings per share (Canadian dollars) $ 1.92 $ 1.21 $ 5.69 $ 3.63
Diluted earnings per share
Net income attributable to common shareholders $ 3,489 $ 2,180 $ 10,331 $ 6,549
Net income available to common shareholders including impact of dilutive securities 3,489 2,180 10,331 6,549
Weighted-average number of common shares outstanding (millions) 1,818.8 1,802.3 1,816.8 1,805.4
Effect of dilutive securities
Stock options potentially exercisable (millions)1 3.0 1.2 2.4 1.7
Weighted-average number of common shares outstanding – diluted (millions) 1,821.8 1,803.5 1,819.2 1,807.1
Diluted earnings per share (Canadian dollars)1 $ 1.92 $ 1.21 $ 5.68 $ 3.62 1 For the three and nine months ended July 31, 2021, no outstanding options were excluded from the computation of diluted earnings per share. For the three and nine months ended
July 31, 2020, the computation of diluted earnings per share excluded average options outstanding of 7.7 million and 5.5 million, respectively, with a weighted-average exercise price of
$70.15 and $71.47, respectively, as the option price was greater than the average market price of the Bank’s common shares.
TD BANK GROUP • THIRD QUARTER 2021 • REPORT TO SHAREHOLDERS Page 76
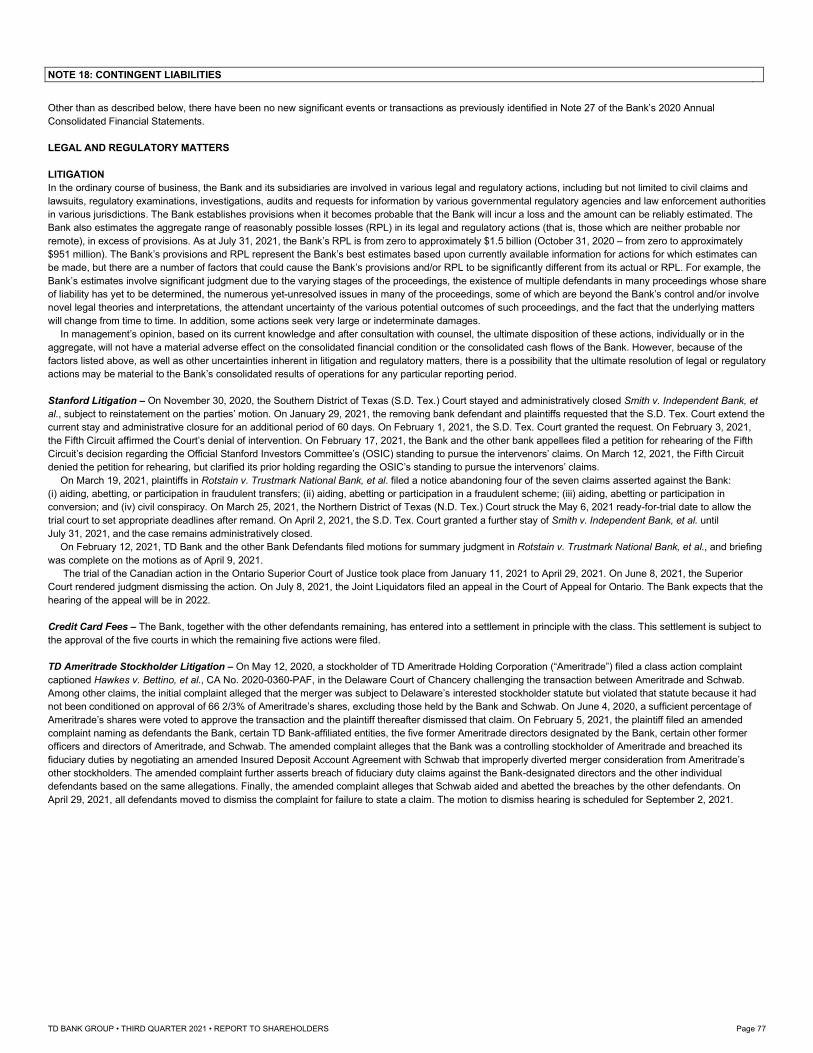
NOTE 18: CONTINGENT LIABILITIES
Other than as described below, there have been no new significant events or transactions as previously identified in Note 27 of the Bank’s 2020 Annual
Consolidated Financial Statements.
LEGAL AND REGULATORY MATTERS
LITIGATION In the ordinary course of business, the Bank and its subsidiaries are involved in various legal and regulatory actions, including but not limited to civil claims and
lawsuits, regulatory examinations, investigations, audits and requests for information by various governmental regulatory agencies and law enforcement authorities
in various jurisdictions. The Bank establishes provisions when it becomes probable that the Bank will incur a loss and the amount can be reliably estimated. The
Bank also estimates the aggregate range of reasonably possible losses (RPL) in its legal and regulatory actions (that is, those which are neither probable nor
remote), in excess of provisions. As at July 31, 2021, the Bank’s RPL is from zero to approximately $1.5 billion (October 31, 2020 – from zero to approximately
$951 million). The Bank’s provisions and RPL represent the Bank’s best estimates based upon currently available information for actions for which estimates can
be made, but there are a number of factors that could cause the Bank’s provisions and/or RPL to be significantly different from its actual or RPL. For example, the
Bank’s estimates involve significant judgment due to the varying stages of the proceedings, the existence of multiple defendants in many proceedings whose share
of liability has yet to be determined, the numerous yet-unresolved issues in many of the proceedings, some of which are beyond the Bank’s control and/or involve
novel legal theories and interpretations, the attendant uncertainty of the various potential outcomes of such proceedings, and the fact that the underlying matters
will change from time to time. In addition, some actions seek very large or indeterminate damages.
In management’s opinion, based on its current knowledge and after consultation with counsel, the ultimate disposition of these actions, individually or in the
aggregate, will not have a material adverse effect on the consolidated financial condition or the consolidated cash flows of the Bank. However, because of the
factors listed above, as well as other uncertainties inherent in litigation and regulatory matters, there is a possibility that the ultimate resolution of legal or regulatory
actions may be material to the Bank’s consolidated results of operations for any particular reporting period.
Stanford Litigation – On November 30, 2020, the Southern District of Texas (S.D. Tex.) Court stayed and administratively closed Smith v. Independent Bank, et
al., subject to reinstatement on the parties’ motion. On January 29, 2021, the removing bank defendant and plaintiffs requested that the S.D. Tex. Court extend the
current stay and administrative closure for an additional period of 60 days. On February 1, 2021, the S.D. Tex. Court granted the request. On February 3, 2021,
the Fifth Circuit affirmed the Court’s denial of intervention. On February 17, 2021, the Bank and the other bank appellees filed a petition for rehearing of the Fifth
Circuit’s decision regarding the Official Stanford Investors Committee’s (OSIC) standing to pursue the intervenors’ claims. On March 12, 2021, the Fifth Circuit
denied the petition for rehearing, but clarified its prior holding regarding the OSIC’s standing to pursue the intervenors’ claims.
On March 19, 2021, plaintiffs in Rotstain v. Trustmark National Bank, et al. filed a notice abandoning four of the seven claims asserted against the Bank:
(i) aiding, abetting, or participation in fraudulent transfers; (ii) aiding, abetting or participation in a fraudulent scheme; (iii) aiding, abetting or participation in
conversion; and (iv) civil conspiracy. On March 25, 2021, the Northern District of Texas (N.D. Tex.) Court struck the May 6, 2021 ready-for-trial date to allow the
trial court to set appropriate deadlines after remand. On April 2, 2021, the S.D. Tex. Court granted a further stay of Smith v. Independent Bank, et al. until
July 31, 2021, and the case remains administratively closed.
On February 12, 2021, TD Bank and the other Bank Defendants filed motions for summary judgment in Rotstain v. Trustmark National Bank, et al., and briefing
was complete on the motions as of April 9, 2021.
The trial of the Canadian action in the Ontario Superior Court of Justice took place from January 11, 2021 to April 29, 2021. On June 8, 2021, the Superior
Court rendered judgment dismissing the action. On July 8, 2021, the Joint Liquidators filed an appeal in the Court of Appeal for Ontario. The Bank expects that the
hearing of the appeal will be in 2022.
Credit Card Fees – The Bank, together with the other defendants remaining, has entered into a settlement in principle with the class. This settlement is subject to
the approval of the five courts in which the remaining five actions were filed.
TD Ameritrade Stockholder Litigation – On May 12, 2020, a stockholder of TD Ameritrade Holding Corporation (“Ameritrade”) filed a class action complaint
captioned Hawkes v. Bettino, et al., CA No. 2020-0360-PAF, in the Delaware Court of Chancery challenging the transaction between Ameritrade and Schwab.
Among other claims, the initial complaint alleged that the merger was subject to Delaware’s interested stockholder statute but violated that statute because it had
not been conditioned on approval of 66 2/3% of Ameritrade’s shares, excluding those held by the Bank and Schwab. On June 4, 2020, a sufficient percentage of
Ameritrade’s shares were voted to approve the transaction and the plaintiff thereafter dismissed that claim. On February 5, 2021, the plaintiff filed an amended
complaint naming as defendants the Bank, certain TD Bank-affiliated entities, the five former Ameritrade directors designated by the Bank, certain other former
officers and directors of Ameritrade, and Schwab. The amended complaint alleges that the Bank was a controlling stockholder of Ameritrade and breached its
fiduciary duties by negotiating an amended Insured Deposit Account Agreement with Schwab that improperly diverted merger consideration from Ameritrade’s
other stockholders. The amended complaint further asserts breach of fiduciary duty claims against the Bank-designated directors and the other individual
defendants based on the same allegations. Finally, the amended complaint alleges that Schwab aided and abetted the breaches by the other defendants. On
April 29, 2021, all defendants moved to dismiss the complaint for failure to state a claim. The motion to dismiss hearing is scheduled for September 2, 2021.
TD BANK GROUP • THIRD QUARTER 2021 • REPORT TO SHAREHOLDERS Page 77
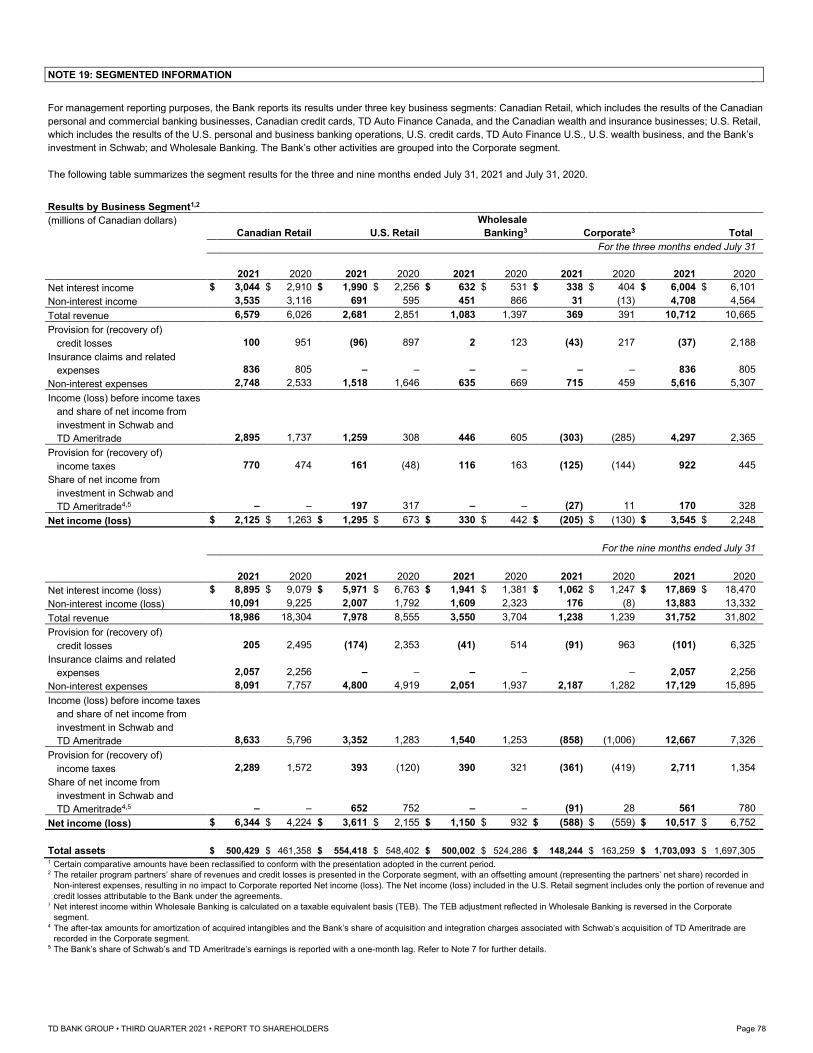
NOTE 19: SEGMENTED INFORMATION
For management reporting purposes, the Bank reports its results under three key business segments: Canadian Retail, which includes the results of the Canadian
personal and commercial banking businesses, Canadian credit cards, TD Auto Finance Canada, and the Canadian wealth and insurance businesses; U.S. Retail,
which includes the results of the U.S. personal and business banking operations, U.S. credit cards, TD Auto Finance U.S., U.S. wealth business, and the Bank’s
investment in Schwab; and Wholesale Banking. The Bank’s other activities are grouped into the Corporate segment. The following table summarizes the segment results for the three and nine months ended July 31, 2021 and July 31, 2020. Results by Business Segment1,2
(millions of Canadian dollars) Wholesale
Canadian Retail U.S. Retail Banking3 Corporate3 Total
For the three months ended July 31
2021 2020 2021 2020 2021 2020 2021 2020 2021 2020
Net interest income $ 3,044 $ 2,910 $ 1,990 $ 2,256 $ 632 $ 531 $ 338 $ 404 $ 6,004 $ 6,101
Non-interest income 3,535 3,116 691 595 451 866 31 (13) 4,708 4,564
Total revenue 6,579 6,026 2,681 2,851 1,083 1,397 369 391 10,712 10,665
Provision for (recovery of)
credit losses 100 951 (96) 897 2 123 (43) 217 (37) 2,188
Insurance claims and related
expenses 836 805 – – – – – – 836 805
Non-interest expenses 2,748 2,533 1,518 1,646 635 669 715 459 5,616 5,307
Income (loss) before income taxes
and share of net income from
investment in Schwab and
TD Ameritrade 2,895 1,737 1,259 308 446 605 (303) (285) 4,297 2,365
Provision for (recovery of)
income taxes 770 474 161 (48) 116 163 (125) (144) 922 445
Share of net income from
investment in Schwab and
TD Ameritrade4,5 – – 197 317 – – (27) 11 170 328
Net income (loss) $ 2,125 $ 1,263 $ 1,295 $ 673 $ 330 $ 442 $ (205) $ (130) $ 3,545 $ 2,248
For the nine months ended July 31
2021 2020 2021 2020 2021 2020 2021 2020 2021 2020
Net interest income (loss) $ 8,895 $ 9,079 $ 5,971 $ 6,763 $ 1,941 $ 1,381 $ 1,062 $ 1,247 $ 17,869 $ 18,470
Non-interest income (loss) 10,091 9,225 2,007 1,792 1,609 2,323 176 (8) 13,883 13,332
Total revenue 18,986 18,304 7,978 8,555 3,550 3,704 1,238 1,239 31,752 31,802
Provision for (recovery of)
credit losses 205 2,495 (174) 2,353 (41) 514 (91) 963 (101) 6,325
Insurance claims and related
expenses 2,057 2,256 – – – – – 2,057 2,256
Non-interest expenses 8,091 7,757 4,800 4,919 2,051 1,937 2,187 1,282 17,129 15,895
Income (loss) before income taxes
and share of net income from
investment in Schwab and
TD Ameritrade 8,633 5,796 3,352 1,283 1,540 1,253 (858) (1,006) 12,667 7,326
Provision for (recovery of)
income taxes 2,289 1,572 393 (120) 390 321 (361) (419) 2,711 1,354
Share of net income from
investment in Schwab and
TD Ameritrade4,5 – – 652 752 – – (91) 28 561 780
Net income (loss) $ 6,344 $ 4,224 $ 3,611 $ 2,155 $ 1,150 $ 932 $ (588) $ (559) $ 10,517 $ 6,752
Total assets $ 500,429 $ 461,358 $ 554,418 $ 548,402 $ 500,002 $ 524,286 $ 148,244 $ 163,259 $ 1,703,093 $ 1,697,305 1 Certain comparative amounts have been reclassified to conform with the presentation adopted in the current period. 2 The retailer program partners’ share of revenues and credit losses is presented in the Corporate segment, with an offsetting amount (representing the partners’ net share) recorded in
Non-interest expenses, resulting in no impact to Corporate reported Net income (loss). The Net income (loss) included in the U.S. Retail segment includes only the portion of revenue and
credit losses attributable to the Bank under the agreements. 3 Net interest income within Wholesale Banking is calculated on a taxable equivalent basis (TEB). The TEB adjustment reflected in Wholesale Banking is reversed in the Corporate
segment. 4 The after-tax amounts for amortization of acquired intangibles and the Bank’s share of acquisition and integration charges associated with Schwab’s acquisition of TD Ameritrade are
recorded in the Corporate segment. 5 The Bank’s share of Schwab’s and TD Ameritrade’s earnings is reported with a one-month lag. Refer to Note 7 for further details.
TD BANK GROUP • THIRD QUARTER 2021 • REPORT TO SHAREHOLDERS Page 78
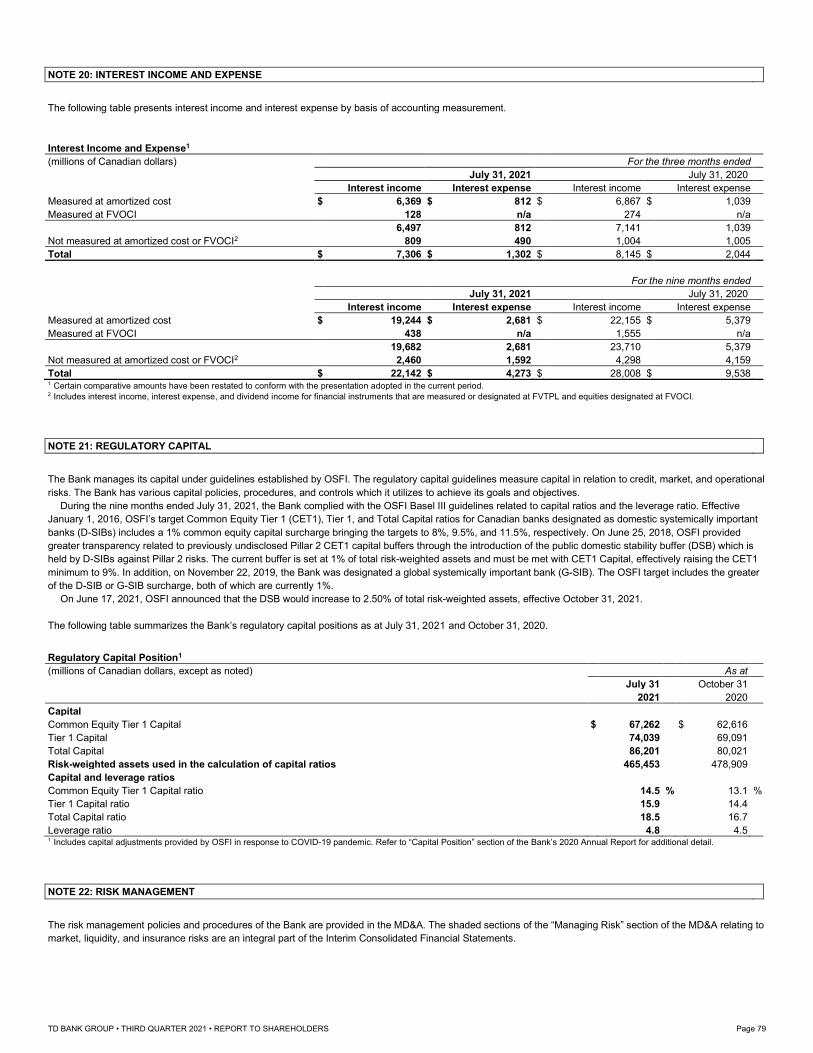
NOTE 20: INTEREST INCOME AND EXPENSE
The following table presents interest income and interest expense by basis of accounting measurement. Interest Income and Expense1
(millions of Canadian dollars) For the three months ended
July 31, 2021 July 31, 2020
Interest income Interest expense Interest income Interest expense
Measured at amortized cost $ 6,369 $ 812 $ 6,867 $ 1,039
Measured at FVOCI 128 n/a 274 n/a
6,497 812 7,141 1,039
Not measured at amortized cost or FVOCI2 809 490 1,004 1,005
Total $ 7,306 $ 1,302 $ 8,145 $ 2,044
For the nine months ended
July 31, 2021 July 31, 2020
Interest income Interest expense Interest income Interest expense
Measured at amortized cost $ 19,244 $ 2,681 $ 22,155 $ 5,379
Measured at FVOCI 438 n/a 1,555 n/a
19,682 2,681 23,710 5,379
Not measured at amortized cost or FVOCI2 2,460 1,592 4,298 4,159
Total $ 22,142 $ 4,273 $ 28,008 $ 9,538 1 Certain comparative amounts have been restated to conform with the presentation adopted in the current period. 2 Includes interest income, interest expense, and dividend income for financial instruments that are measured or designated at FVTPL and equities designated at FVOCI.
NOTE 21: REGULATORY CAPITAL
The Bank manages its capital under guidelines established by OSFI. The regulatory capital guidelines measure capital in relation to credit, market, and operational
risks. The Bank has various capital policies, procedures, and controls which it utilizes to achieve its goals and objectives. During the nine months ended July 31, 2021, the Bank complied with the OSFI Basel III guidelines related to capital ratios and the leverage ratio. Effective
January 1, 2016, OSFI’s target Common Equity Tier 1 (CET1), Tier 1, and Total Capital ratios for Canadian banks designated as domestic systemically important
banks (D-SIBs) includes a 1% common equity capital surcharge bringing the targets to 8%, 9.5%, and 11.5%, respectively. On June 25, 2018, OSFI provided
greater transparency related to previously undisclosed Pillar 2 CET1 capital buffers through the introduction of the public domestic stability buffer (DSB) which is
held by D-SIBs against Pillar 2 risks. The current buffer is set at 1% of total risk-weighted assets and must be met with CET1 Capital, effectively raising the CET1
minimum to 9%. In addition, on November 22, 2019, the Bank was designated a global systemically important bank (G-SIB). The OSFI target includes the greater
of the D-SIB or G-SIB surcharge, both of which are currently 1%. On June 17, 2021, OSFI announced that the DSB would increase to 2.50% of total risk-weighted assets, effective October 31, 2021.
The following table summarizes the Bank’s regulatory capital positions as at July 31, 2021 and October 31, 2020. Regulatory Capital Position1
(millions of Canadian dollars, except as noted) As at
July 31 October 31
2021 2020
Capital
Common Equity Tier 1 Capital $ 67,262 $ 62,616
Tier 1 Capital 74,039 69,091
Total Capital 86,201 80,021
Risk-weighted assets used in the calculation of capital ratios 465,453 478,909
Capital and leverage ratios
Common Equity Tier 1 Capital ratio 14.5 % 13.1 %
Tier 1 Capital ratio 15.9 14.4
Total Capital ratio 18.5 16.7
Leverage ratio 4.8 4.5 1 Includes capital adjustments provided by OSFI in response to COVID-19 pandemic. Refer to “Capital Position” section of the Bank’s 2020 Annual Report for additional detail.
NOTE 22: RISK MANAGEMENT
The risk management policies and procedures of the Bank are provided in the MD&A. The shaded sections of the “Managing Risk” section of the MD&A relating to
market, liquidity, and insurance risks are an integral part of the Interim Consolidated Financial Statements.
TD BANK GROUP • THIRD QUARTER 2021 • REPORT TO SHAREHOLDERS Page 79
SHAREHOLDER AND INVESTOR INFORMATION
Shareholder Services
If you: And your inquiry relates to: Please contact:
Are a registered shareholder (your name appears on your TD share certificate)
Missing dividends, lost share certificates, estate questions, address changes to the share register, dividend bank account changes, the dividend reinvestment plan, eliminating duplicate mailings of shareholder materials or stopping (or resuming) receiving annual and quarterly reports
Transfer Agent:AST Trust Company (Canada) P.O. Box 700, Station BMontréal, Québec H3B 3K31-800-387-0825 (Canada and U.S. only)or 416-682-3860Facsimile: [email protected] or www.astfinancial.com/ca-en
Hold your TD shares through the Direct Registration System in the United States
Missing dividends, lost share certificates, estate questions, address changes to the share register, eliminating duplicate mailings of shareholder materials or stopping (or resuming) receiving annual and quarterly reports
Co-Transfer Agent and Registrar:Computershare Trust Company, N.A.P.O. Box 505000Louisville, KY 40233, or
Computershare Trust Company, N.A.462 South 4th Street, Suite 1600Louisville, KY 402021-866-233-4836TDD for hearing impaired: 1-800-231-5469Shareholders outside of U.S.: 201-680-6578TDD shareholders outside of U.S.: 201-680-6610 www.computershare.com/investor
Beneficially own TD shares that are held in the name of an intermediary, such as a bank, a trust company, a securities broker or other nominee
Your TD shares, including questions regarding the dividend reinvestment plan and mailings of shareholder materials
Your intermediary
For all other shareholder inquiries, please contact TD Shareholder Relations at 416-944-6367 or 1-866-756-8936 or email [email protected]. Please note that by
leaving us an e-mail or voicemail message, you are providing your consent for us to forward your inquiry to the appropriate party for response.
General Information
Products and services: Contact TD Canada Trust, 24 hours a day, seven days a week: 1-866-567-8888
French: 1-866-233-2323
Cantonese/Mandarin: 1-800-328-3698
Telephone device for the hearing impaired (TTY): 1-800-361-1180
Website: www.td.com
Email: [email protected]
Quarterly Earnings Conference Call
TD Bank Group will host an earnings conference call in Toronto, Ontario on August 26, 2021. The call will be audio webcast live through TD’s website at
1:30 p.m. ET. The call will feature presentations by TD executives on the Bank’s financial results for the third quarter and discussions of related disclosures,
followed by a question-and-answer period with analysts. The presentation material referenced during the call will be available on the TD website at
www.td.com/investor on August 26, 2021 by approximately 1:30 p.m. ET. A listen-only telephone line is available at 416-641-6150 or 1-866-696-5894 (toll free) and
the passcode is 2727354#.
The audio webcast and presentations will be archived at www.td.com/investor. Replay of the teleconference will be available from 5:00 p.m. ET on
August 26, 2021, until 11:59 p.m. ET on September 10, 2021 by calling 905-694-9451 or 1-800-408-3053 (toll free). The passcode is 7300743#.
Annual MeetingThursday, April 14, 2022Toronto, Ontario
TD BANK GROUP • THIRD QUARTER 2021 • REPORT TO SHAREHOLDERS Page 80