Embed Size (px)
Citation preview
TAVR Update 2012TAVR Update 2012TAVR Update 2012: TAVR Update 2012: The Year in ReviewThe Year in ReviewThe Year in ReviewThe Year in Review
Martin B. Leon, MDMartin B. Leon, MDColumbia University Medical CenterColumbia University Medical Center
New York Presbyterian HospitalNew York Presbyterian HospitalNew York Presbyterian HospitalNew York Presbyterian HospitalNew York CityNew York City
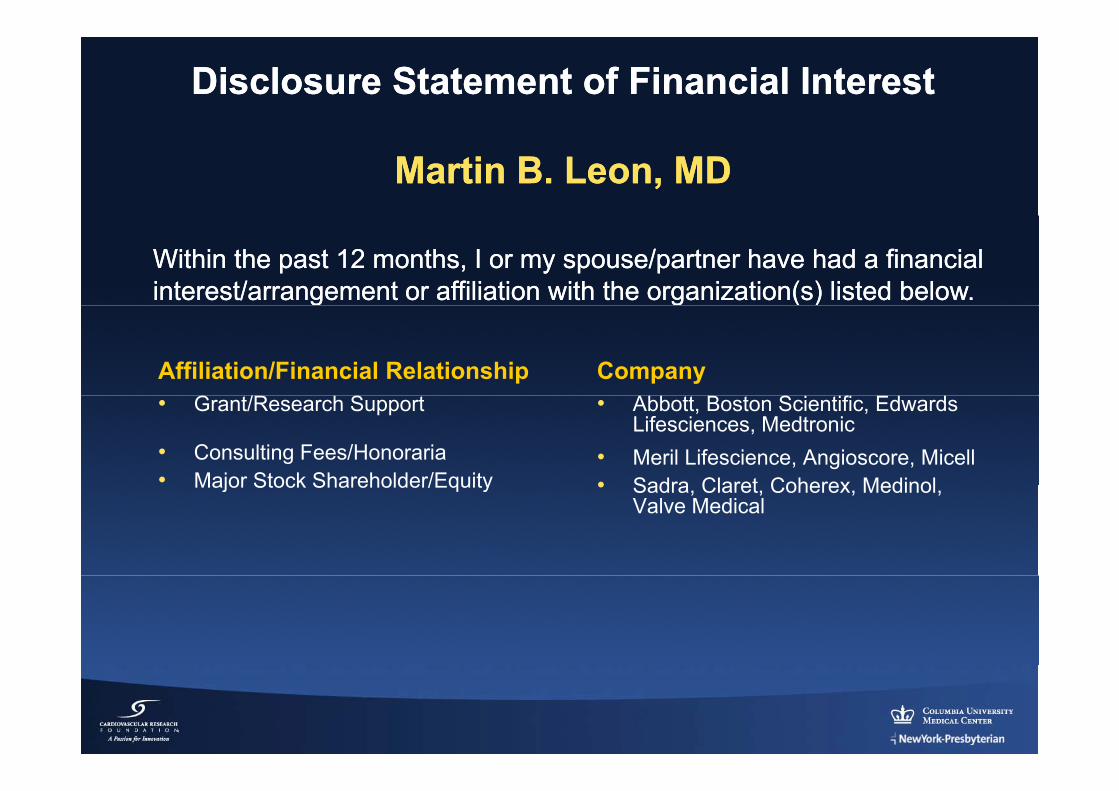
Disclosure Statement of Financial InterestDisclosure Statement of Financial Interest
Martin B. Leon, MDMartin B. Leon, MD
Within the past 12 months, I or my spouse/partner have had a financial Within the past 12 months, I or my spouse/partner have had a financial interest/arrangement or affiliation with the organization(s) listed below.interest/arrangement or affiliation with the organization(s) listed below.
G / S S fAffiliation/Financial Relationship Company• Grant/Research Support
• Consulting Fees/Honoraria• Major Stock Shareholder/Equity
• Abbott, Boston Scientific, Edwards Lifesciences, Medtronic
• Meril Lifescience, Angioscore, Micell• Sadra Claret Coherex MedinolMajor Stock Shareholder/Equity • Sadra, Claret, Coherex, Medinol,
Valve Medical
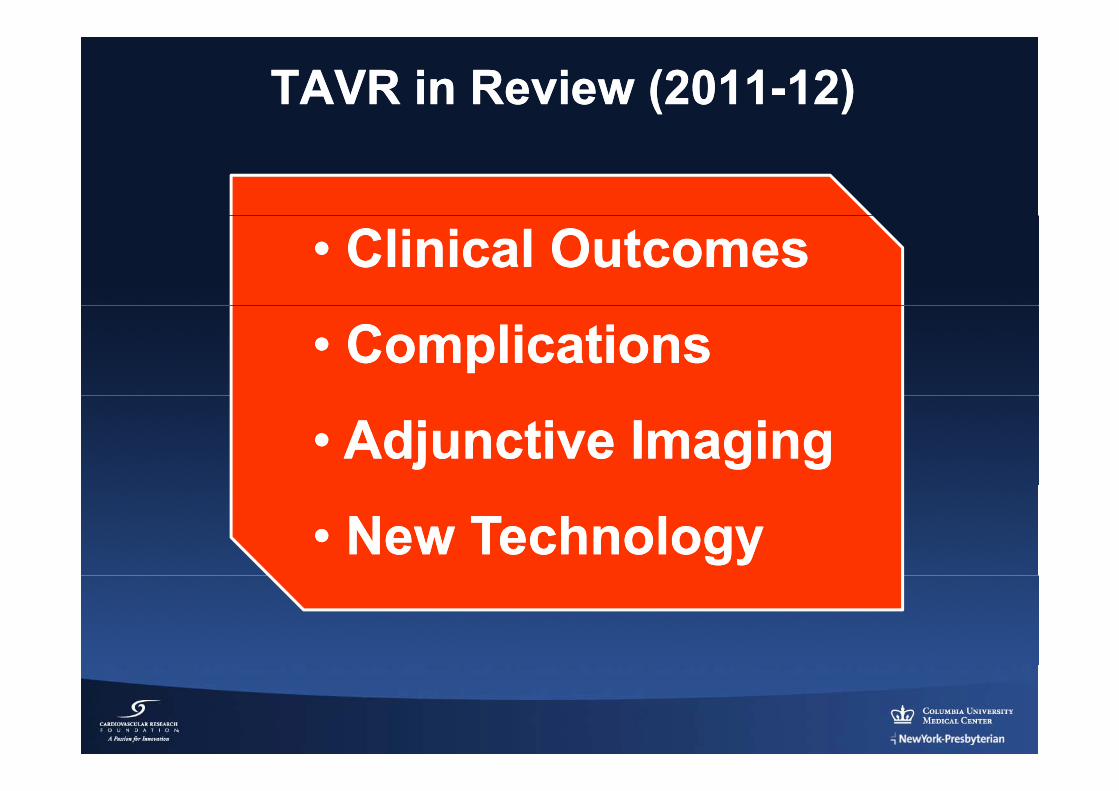
TAVR in Review (TAVR in Review (20112011--12)12)
•• Clinical OutcomesClinical Outcomes
ClinicalClinical•• ComplicationsComplications
OutcomesOutcomes•• Adjunctive ImagingAdjunctive Imaging
•• New TechnologyNew Technology
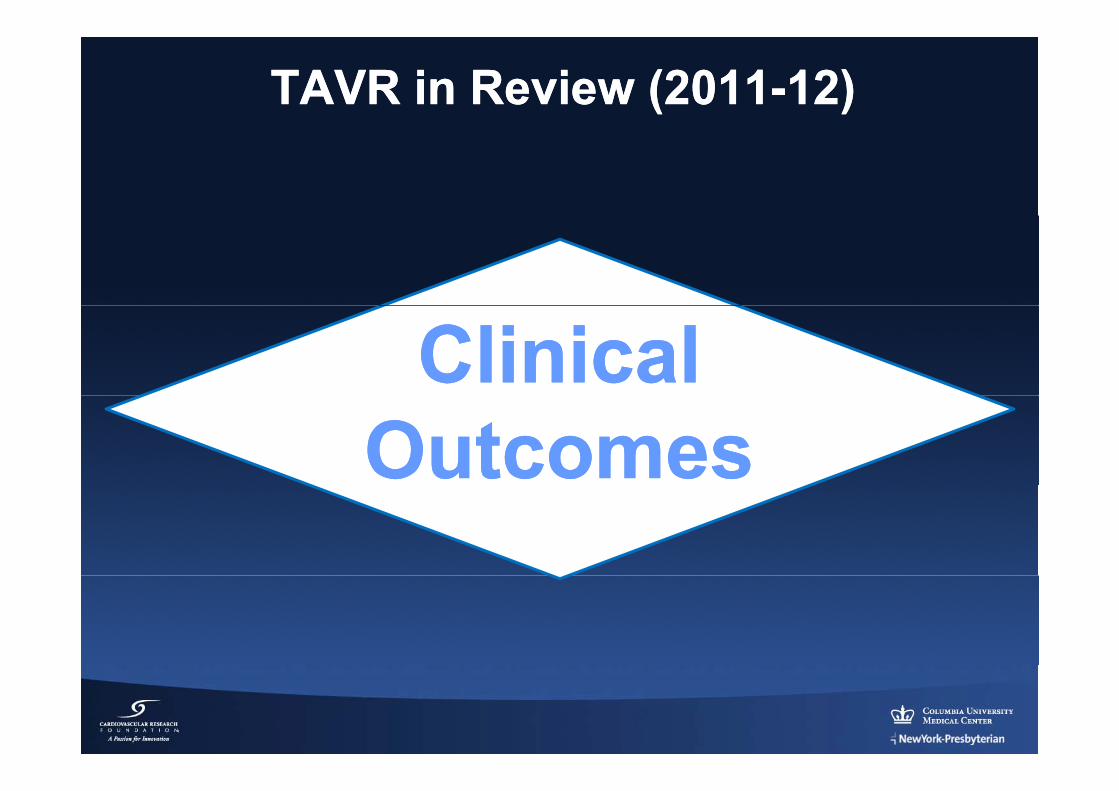
TAVR in Review (TAVR in Review (20112011--12)12)
ClinicalClinicalOutcomesOutcomes
VARC MANUSCRIPTVARC MANUSCRIPT
New PARTNER NEJM PublicationsNew PARTNER NEJM Publications
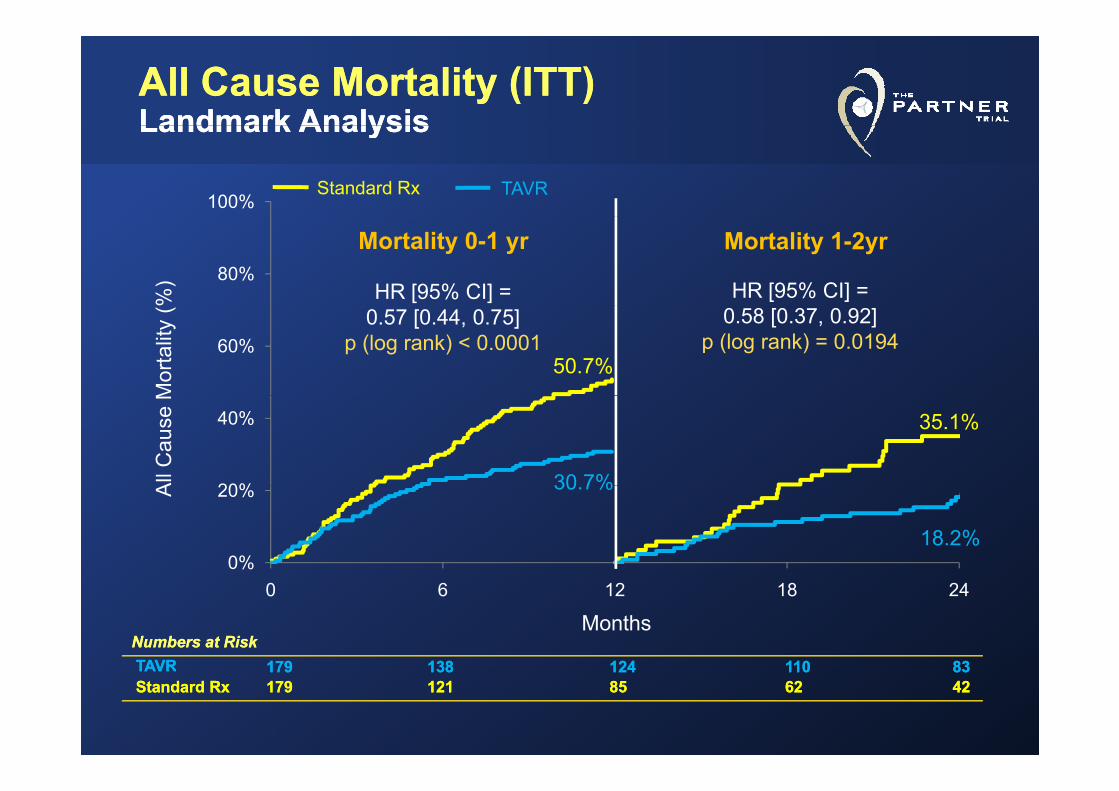
All Cause Mortality (ITT)All Cause Mortality (ITT)Landmark AnalysisLandmark AnalysisLandmark AnalysisLandmark Analysis
100%Standard Rx TAVR
%) 80%
Mortality 0-1 yr Mortality 1-2yr
HR [95% CI] = HR [95% CI] =
Mor
talit
y (
60%0.57 [0.44, 0.75]
p (log rank) < 0.00010.58 [0.37, 0.92]
p (log rank) = 0.019450.7%
All
Cau
se M
20%
40%
30 7%
35.1%
A
0%
20% 30.7%
18.2%
Months0 6 12 18 24
Numbers at RiskNumbers at RiskTAVRTAVR 179179 138138 124124 110110 8383TAVRTAVR 179179 138138 124124 110110 8383Standard RxStandard Rx 179179 121121 8585 6262 4242
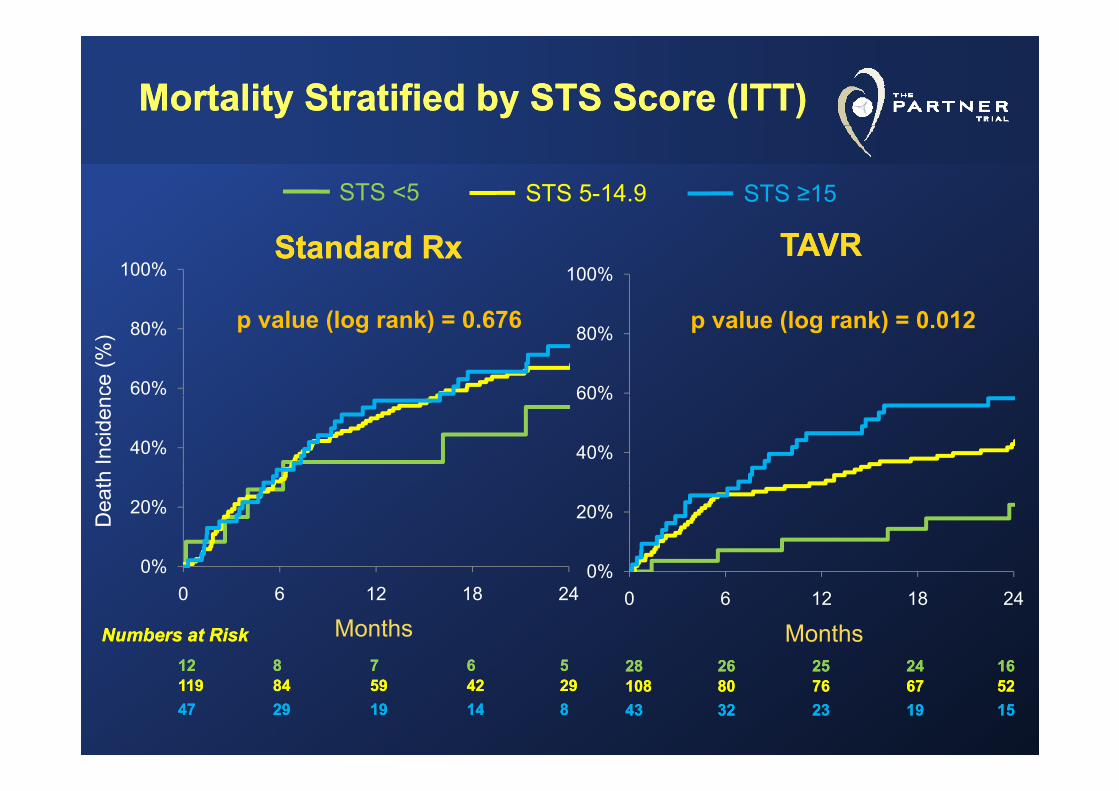
Mortality Stratified by STS Score (ITT)Mortality Stratified by STS Score (ITT)
STS <5 STS 5-14.9 STS ≥15
100% 100%TAVRTAVRStandard RxStandard Rx
ce (%
)
60%
80%
60%
80% p value (log rank) = 0.012p value (log rank) = 0.676
th In
cide
n
40% 40%
60%
Dea
t
0%
20%
0%
20%
2828 2626 2525 2424 1616
Months
0 6 12 18 24
Months
0%0 6 12 18 24
1212 88 77 66 55
Numbers at RiskNumbers at Risk2828 2626 2525 2424 1616108108 8080 7676 6767 52524343 3232 2323 1919 1515
1212 88 77 66 55119119 8484 5959 4242 29294747 2929 1919 1414 88
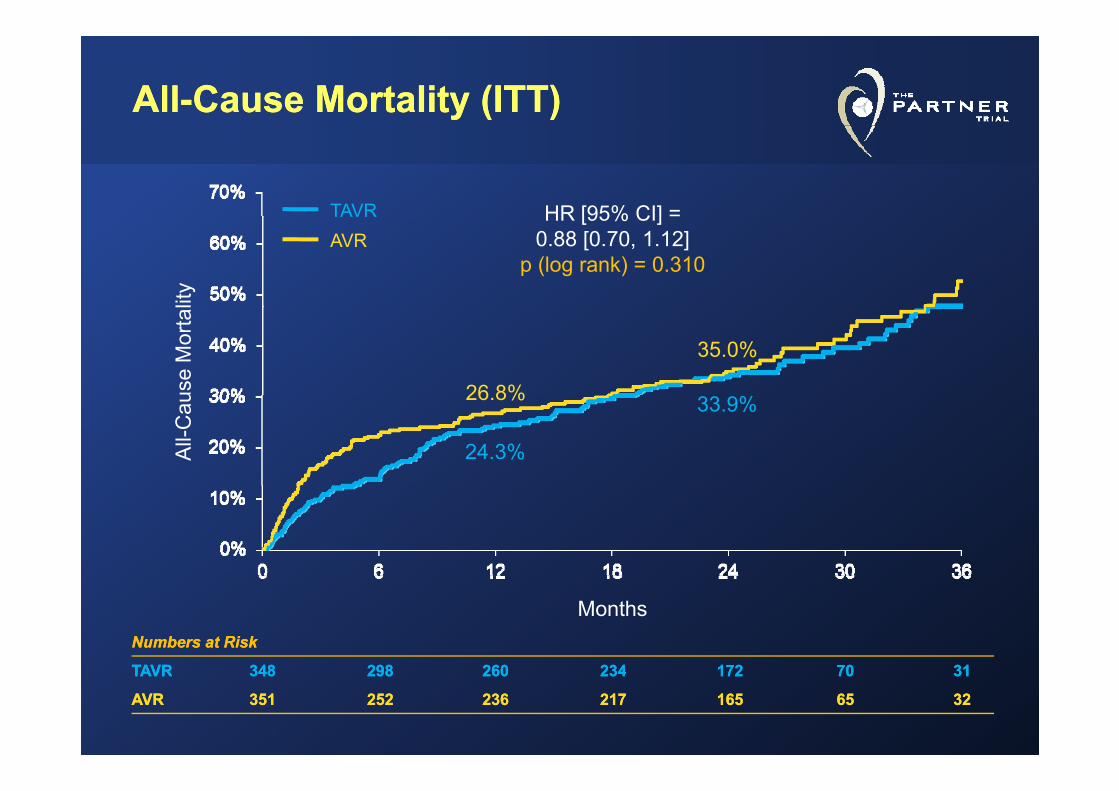
AllAll--Cause Mortality (ITT)Cause Mortality (ITT)
HR [95% CI] =TAVR HR [95% CI] =0.88 [0.70, 1.12]
p (log rank) = 0.310
TAVRAVR
lity
26 8%
35.0%
use
Mor
tal
26.8%
24.3%
33.9%
All-
Cau
Numbers at RiskNumbers at Risk
TAVRTAVR 348348 298298 260260 234234 172172 7070 3131
Months
TAVRTAVR 348348 298298 260260 234234 172172 7070 3131
AVRAVR 351351 252252 236236 217217 165165 6565 3232
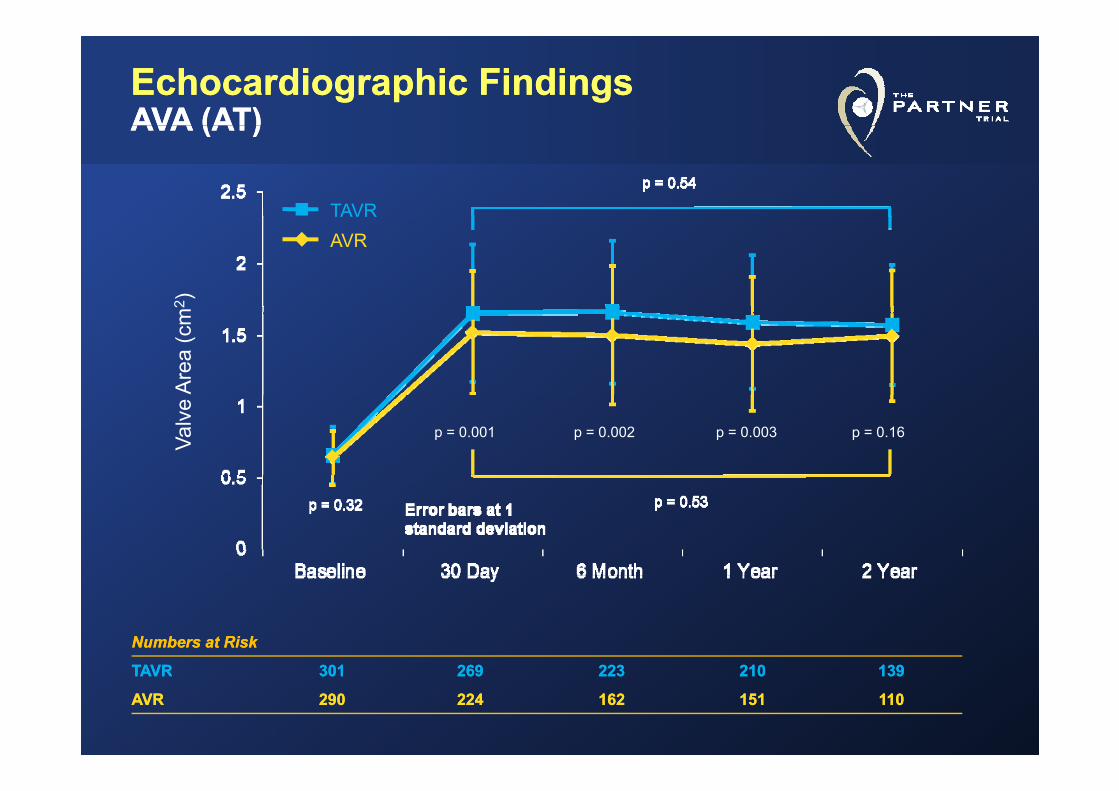
EchocardiographicEchocardiographic Findings Findings AVA (AT)AVA (AT)AVA (AT)AVA (AT)
TAVR
2 )TAVRAVR
Are
a (c
m2
Valv
e
p = 0.002 p = 0.003 p = 0.16p = 0.001
Numbers at RiskNumbers at Risk
TAVRTAVR 301301 269269 223223 210210 139139TAVRTAVR 301301 269269 223223 210210 139139
AVRAVR 290290 224224 162162 151151 110110
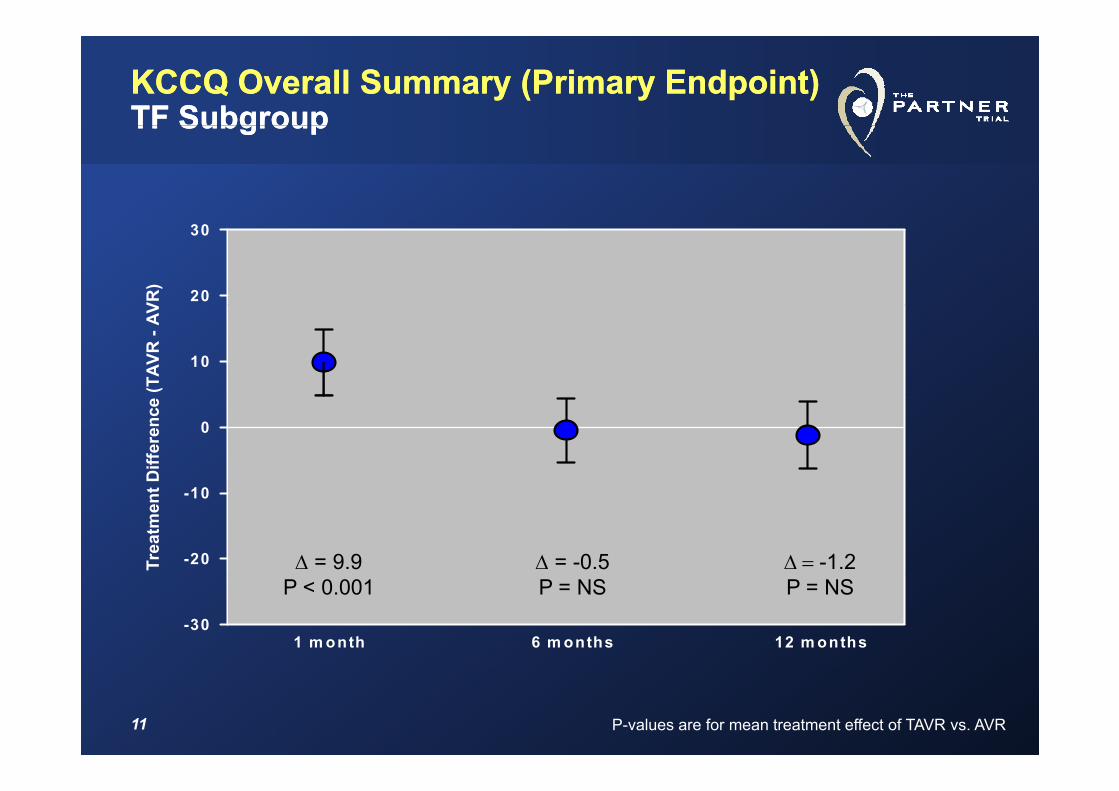
KCCQ Overall Summary (Primary Endpoint)KCCQ Overall Summary (Primary Endpoint)TF SubgroupTF SubgroupTF SubgroupTF Subgroup
VR)
20
30
(TAV
R -
AV
10
Diff
eren
ce
0
Trea
tmen
t
-20
-10
Δ = 9.9 Δ = -0.5 Δ = -1.2
-301 m onth 6 m onths 12 m onths
P < 0.001 P = NS P = NS
11 P-values are for mean treatment effect of TAVR vs. AVR
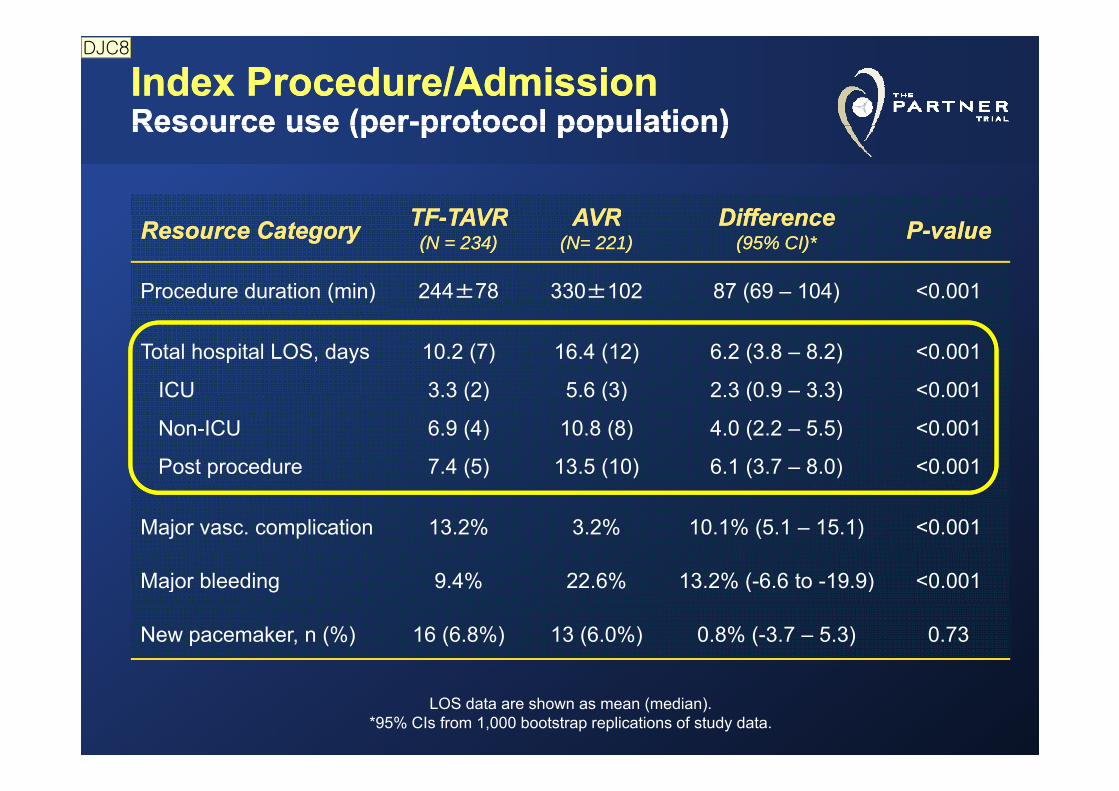
Index Procedure/Admission Index Procedure/Admission Resource use (perResource use (per--protocol population)protocol population)Resource use (perResource use (per protocol population)protocol population)
TFTF TAVRTAVR AVRAVR DifferenceDifferenceResource CategoryResource Category TFTF--TAVRTAVR((N = 234N = 234))
AVRAVR(N= 221)(N= 221)
DifferenceDifference(95% CI)*(95% CI)* PP--valuevalue
Procedure duration (min) 244±78 330±102 87 (69 – 104) <0.001
Total hospital LOS, days
ICU
10.2 (7)
3.3 (2)
16.4 (12)
5.6 (3)
6.2 (3.8 – 8.2)
2.3 (0.9 – 3.3)
<0.001
<0.001ICU
Non-ICU
Post procedure
3.3 (2)
6.9 (4)
7.4 (5)
5.6 (3)
10.8 (8)
13.5 (10)
2.3 (0.9 3.3)
4.0 (2.2 – 5.5)
6.1 (3.7 – 8.0)
0.001
<0.001
<0.001
Major vasc. complication 13.2% 3.2% 10.1% (5.1 – 15.1) <0.001
M j bl di 9 4% 22 6% 13 2% ( 6 6 t 19 9) 0 001Major bleeding 9.4% 22.6% 13.2% (-6.6 to -19.9) <0.001
New pacemaker, n (%) 16 (6.8%) 13 (6.0%) 0.8% (-3.7 – 5.3) 0.73
LOS data are shown as mean (median).*95% CIs from 1,000 bootstrap replications of study data.
DJC8
슬라이드 12
DJC8 Consider simplifying this table a bit-- new pacemaker doesn't differ and that was reported previously, so perhaps you can get rid of that
Note that some of your confidence intervals have a dash and others have "to"David Cohen, 2011-10-19
TAVR vs. AVR: TAVR vs. AVR: TransfemoralTransfemoralCost per QALY gainedCost per QALY gainedCost per QALY gainedCost per QALY gained
TAVR TAVR
)
Economically Dominant
Economically Dominant
VR
–AV
Rco
st (
TAV
$50,000 per QALY
$50,000 per QALY
Δ1-
yr
Complete PopulationComplete Population
13 Δ QALY (TAVR - AVR)
Current TAVR Eligibility According to Current TAVR Eligibility According to Operative RiskOperative RiskOperative RiskOperative Risk
FutilityFutilityUtilityUtility FutilityFutilityUtilityUtility
Low or Moderate High Inoperable
TAVR orTAVR orTAVR orTAVR orSAVRSAVRSAVRSAVR TAVRTAVR
ReasonableIrrational, irresponsibleOperative Risk > 15%
Operative Risk 10-15%
Adapted from S. Kodali
SOURCE Family of RegistriesSOURCE Family of Registries
1 Year Results from Combined Cohort I and1‐Year Results from Combined Cohort I and Cohort II of The SOURCE RegistryThe European Registry of Transcatheter Aortic Valve Replacement using the Edwards SAPIENTM Valve
M Thomas, G Schymik, T Walther, D Himbert, T Levefre, H T d E E b ht P R bi A C l b R LH Treede, E Eggebrecht, P Rubino, A Colombo, R Lange, O Wendler
on behalf of The SOURCE Registry Investigatorson behalf of The SOURCE Registry Investigators
15
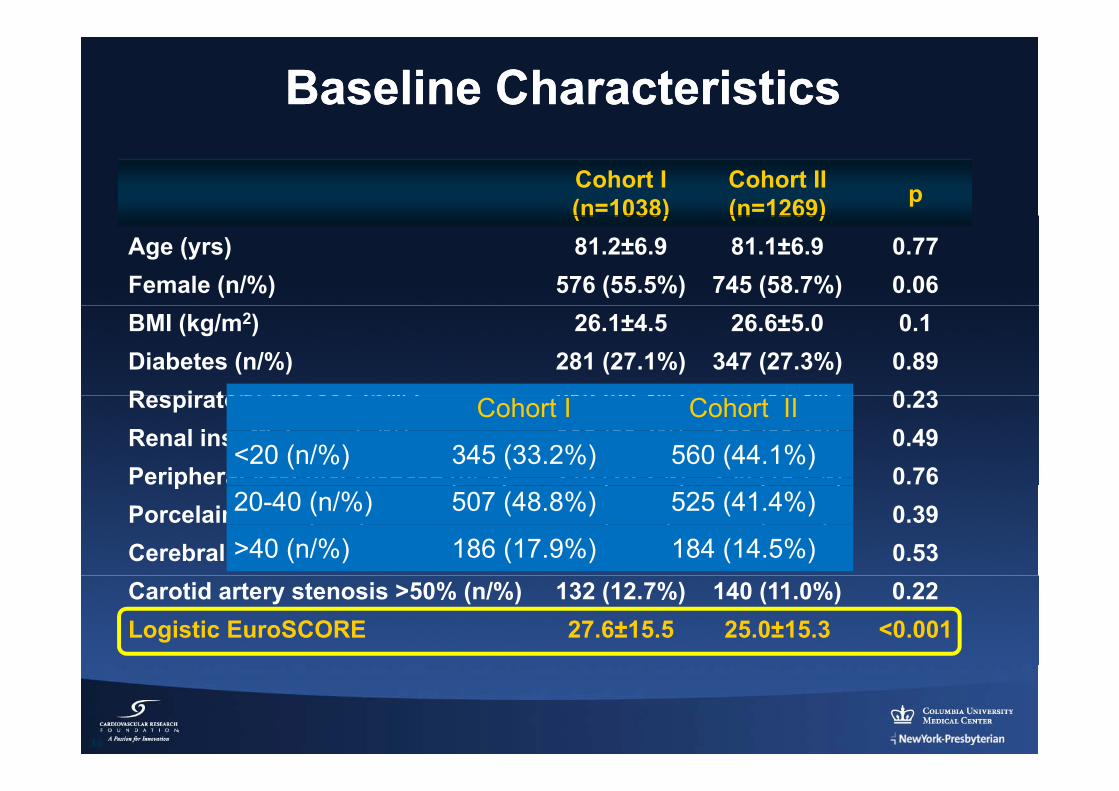
Baseline CharacteristicsBaseline Characteristics
Cohort I(n=1038)
Cohort II (n=1269) p(n 1038) (n 1269)
Age (yrs) 81.2±6.9 81.1±6.9 0.77Female (n/%) 576 (55.5%) 745 (58.7%) 0.06BMI (kg/m2) 26.1±4.5 26.6±5.0 0.1Diabetes (n/%) 281 (27.1%) 347 (27.3%) 0.89Respiratory disease (n/%) 212 (20 4%) 233 (18 4%) 0 23Respiratory disease (n/%) 212 (20.4%) 233 (18.4%) 0.23Renal insufficiency (n/%) 305 (29.4%) 356 (28.1%) 0.49Peripheral vascular disease (n/%) 210 (20.2%) 250 (19.7%) 0.76
Cohort I Cohort II
<20 (n/%) 345 (33.2%) 560 (44.1%)p ( ) ( ) ( )
Porcelain aorta (n/%) 86 (8.3%) 92 (7.2%) 0.39Cerebral vascular accident (n/%) 57 (5.5%) 78 (6.1%) 0.53
20-40 (n/%) 507 (48.8%) 525 (41.4%)
>40 (n/%) 186 (17.9%) 184 (14.5%)Carotid artery stenosis >50% (n/%) 132 (12.7%) 140 (11.0%) 0.22Logistic EuroSCORE 27.6±15.5 25.0±15.3 <0.001
16
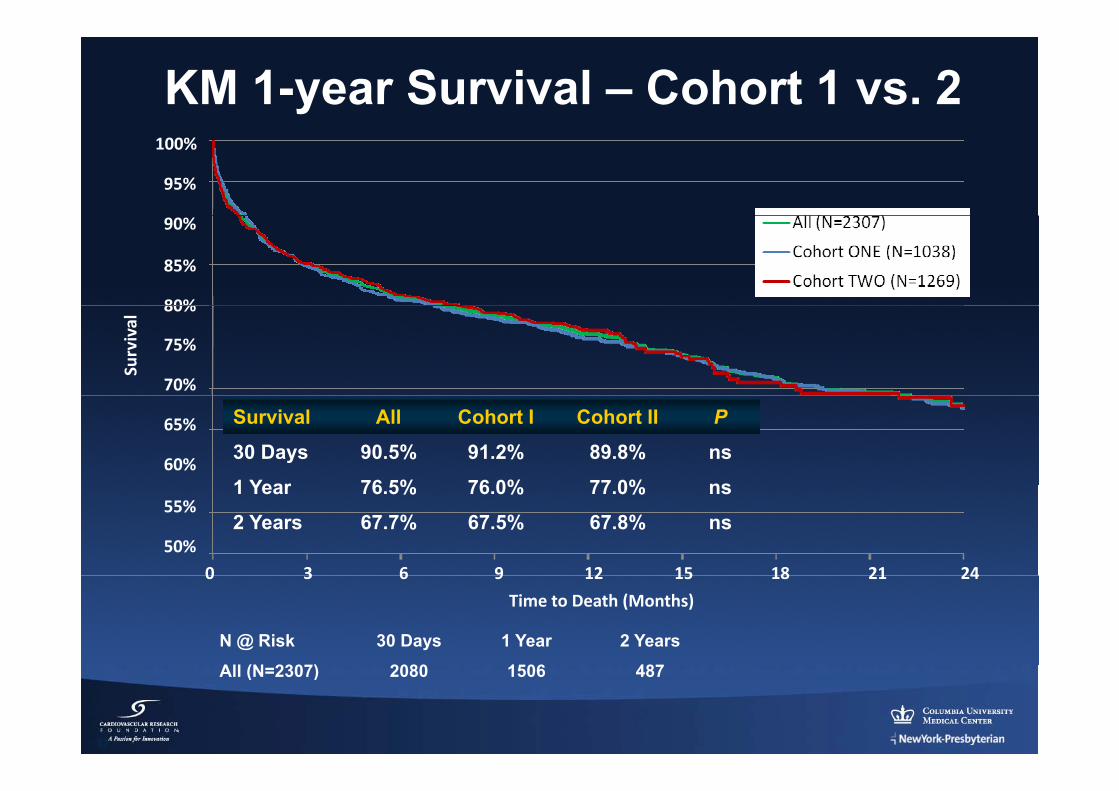
KM 1-year Survival – Cohort 1 vs. 2
95%
100%
80%
85%
90%
Survival
70%
75%
80%
Survival All Cohort I Cohort II P
30 Days 90.5% 91.2% 89.8% ns
1 Year 76 5% 76 0% 77 0% ns60%
65%
1 Year 76.5% 76.0% 77.0% ns
2 Years 67.7% 67.5% 67.8% ns50%
55%
0 3 6 9 12 15 18 21 24
Time to Death (Months)
0 3 6 9 12 15 18 21 24
N @ Risk 30 Days 1 Year 2 Years
All (N 2307) 2080 1506 487
17
All (N=2307) 2080 1506 487
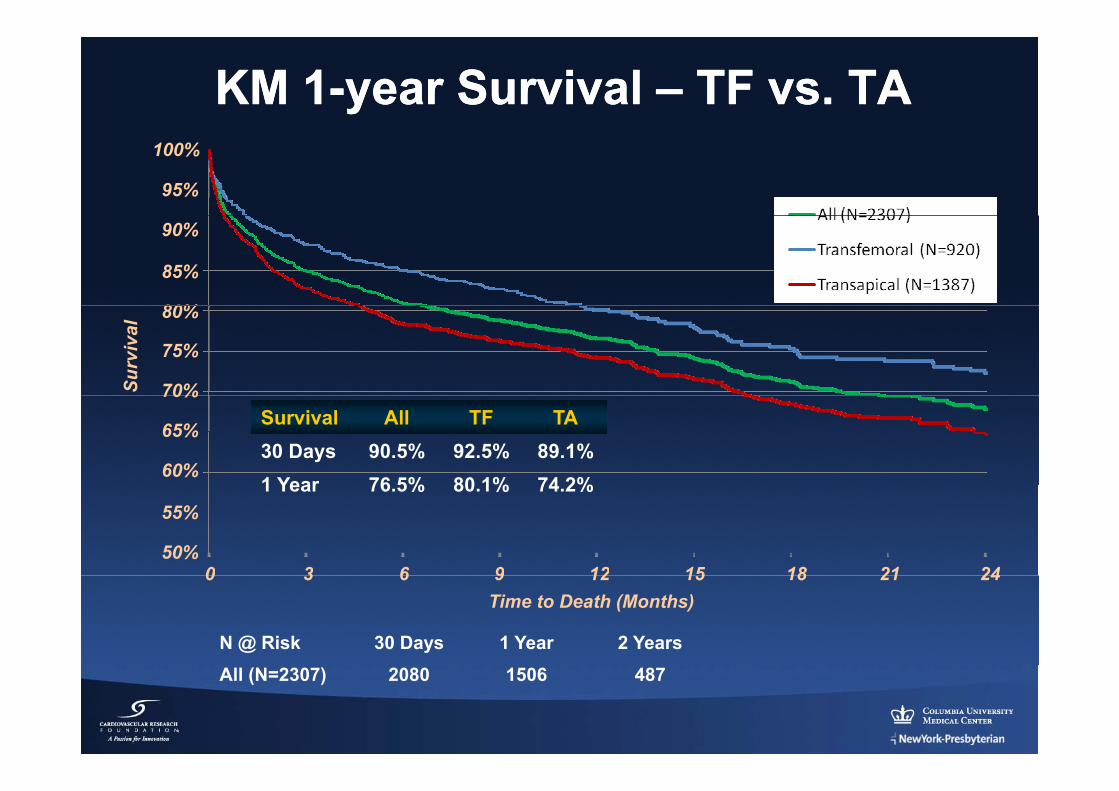
KM 1KM 1--year Survival year Survival –– TF vs. TATF vs. TA
95%
100%
80%
85%
90%
Surv
ival
70%
75%
80%
Survival All TF TA30 Days 90.5% 92.5% 89.1%1 Year 76 5% 80 1% 74 2%
60%
65%
70%
1 Year 76.5% 80.1% 74.2%
0 3 6 9 12 15 18 21 2450%
55%
N @ Risk 30 Days 1 Year 2 Years
Time to Death (Months)0 3 6 9 12 15 18 21 24
All (N=2307) 2080 1506 487
FRANCE 2:FRANCE 2:FRench AorticNationalCorevalve
and Edwards Registry
Martine Gilard, MDUniversity of Brest FranceUniversity of Brest, France
On behalf of the scientific committee and the investigatorsOn behalf of the scientific committee and the investigatorsM Laskar, P Donzeau‐Gouge, K Chevreul, H Eltchaninoff, J Fajadet, B Iung,
P Leprince, A Leguerrier, M Lievre, A Prat, E Teigerp , g , , , g
FRANCE 2FRANCE 2
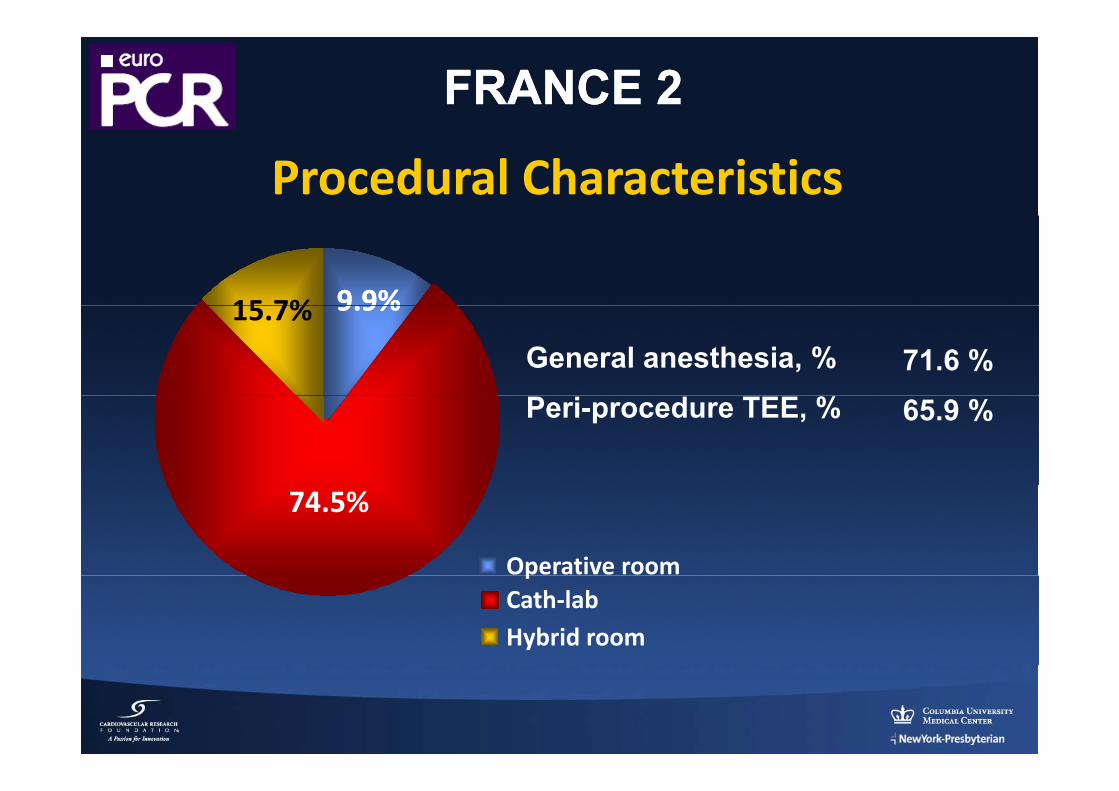
Procedural Characteristics
9.9%9.9%15 7% 9.9%9.9%15.7%
General anesthesia, % 71.6 %Peri-procedure TEE, % 65.9 %
74.5%
Operative roompCath‐labHybrid room
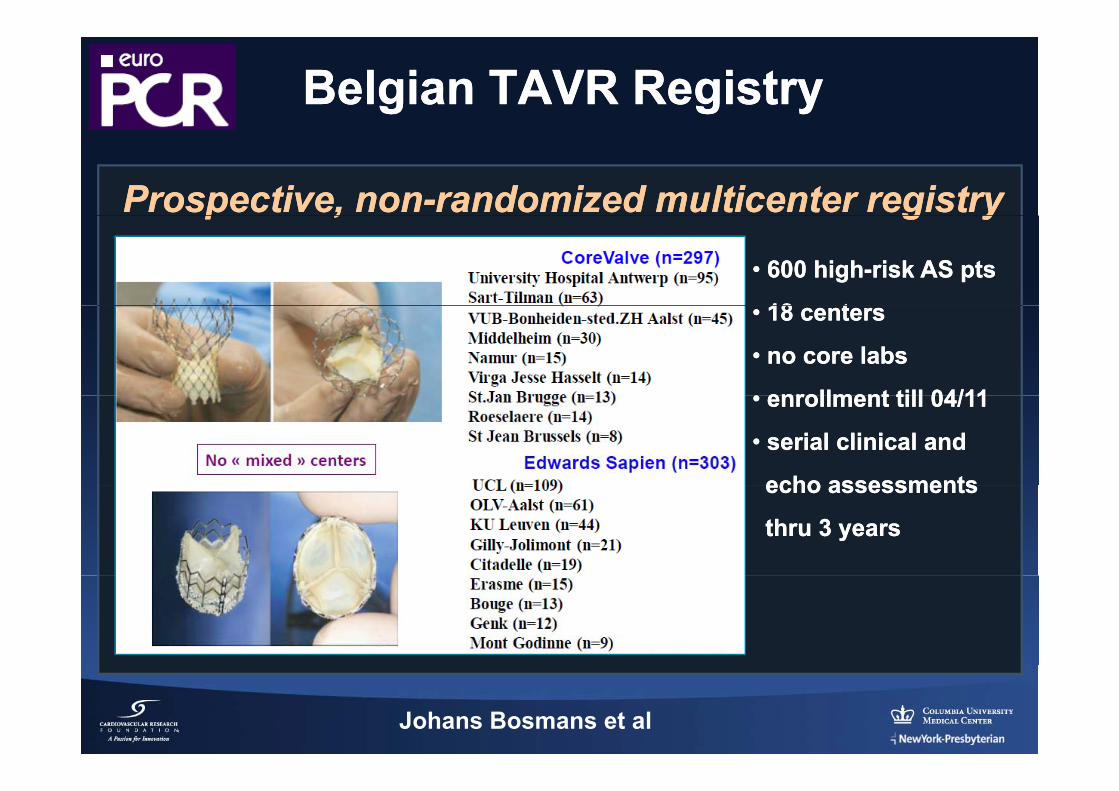
Belgian TAVR RegistryBelgian TAVR Registry
Prospective, nonProspective, non--randomized multicenter registryrandomized multicenter registryp ,p , g yg y
•• 600 high600 high--risk AS ptsrisk AS pts
18 t18 t•• 18 centers18 centers
•• no core labsno core labs
•• enrollment till 04/11enrollment till 04/11•• enrollment till 04/11enrollment till 04/11
•• serial clinical andserial clinical and
echo assessmentsecho assessmentsecho assessmentsecho assessments
thru 3 yearsthru 3 years
Johans Bosmans et al
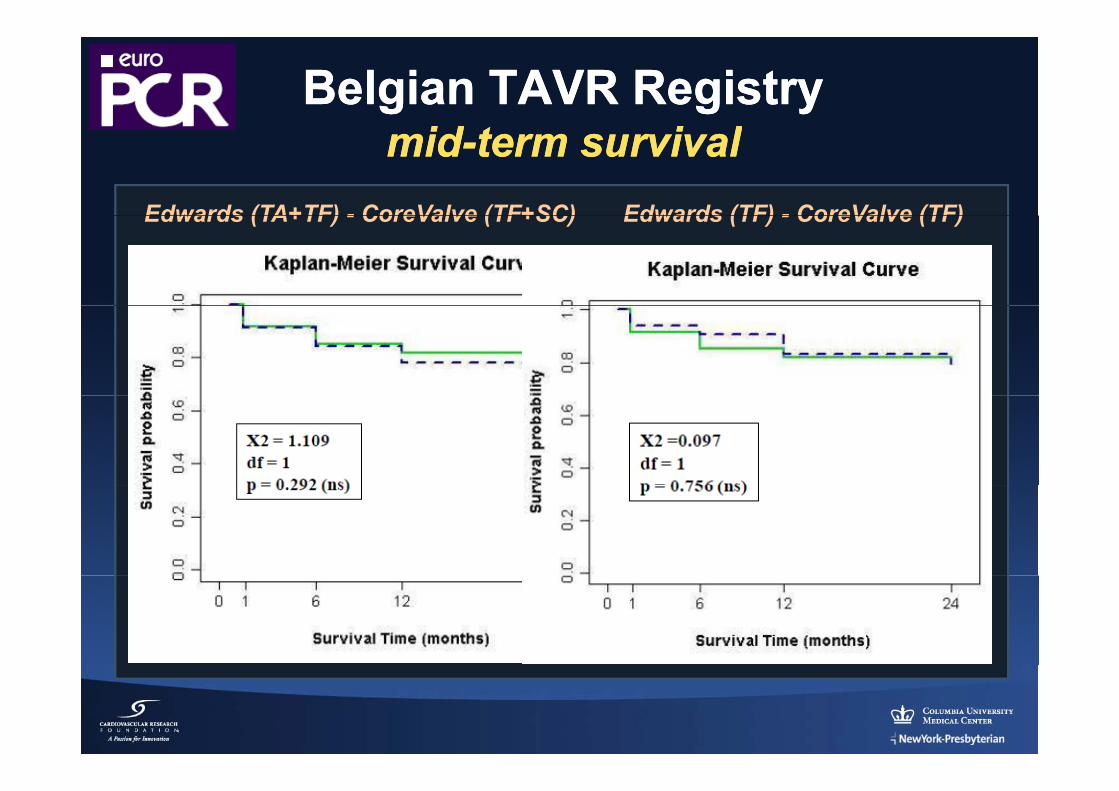
Belgian TAVR RegistryBelgian TAVR Registryidid i li lmidmid--term survivalterm survival
Edwards (TA+TF) - CoreValve (TF+SC) Edwards (TF) - CoreValve (TF)Edwards (TA+TF) - CoreValve (TF+SC) Edwards (TF) - CoreValve (TF)
Axel Linke University of Leipzig Heart Center, Leipzig, Germany
Ulrich Gerckens Gemeinschaftskrankenhaus Bonn, Bonn, Germany
Peter Wenaweser University Hospital Bern, Bern, Switzerland
Corrado Tamburino Ferrarotto Hospital, University of Catania, Catania, Italy
Johan Bosmans University Hospital Antwerp, Antwerp Belgium
Stephen Brecker St. George’s Hospital, London, United Kingdom
Robert Bauernschmitt ISAR Heart Center, Munich, Germany
(on behalf of the ADVANCE Investigators)(on behalf of the ADVANCE Investigators)
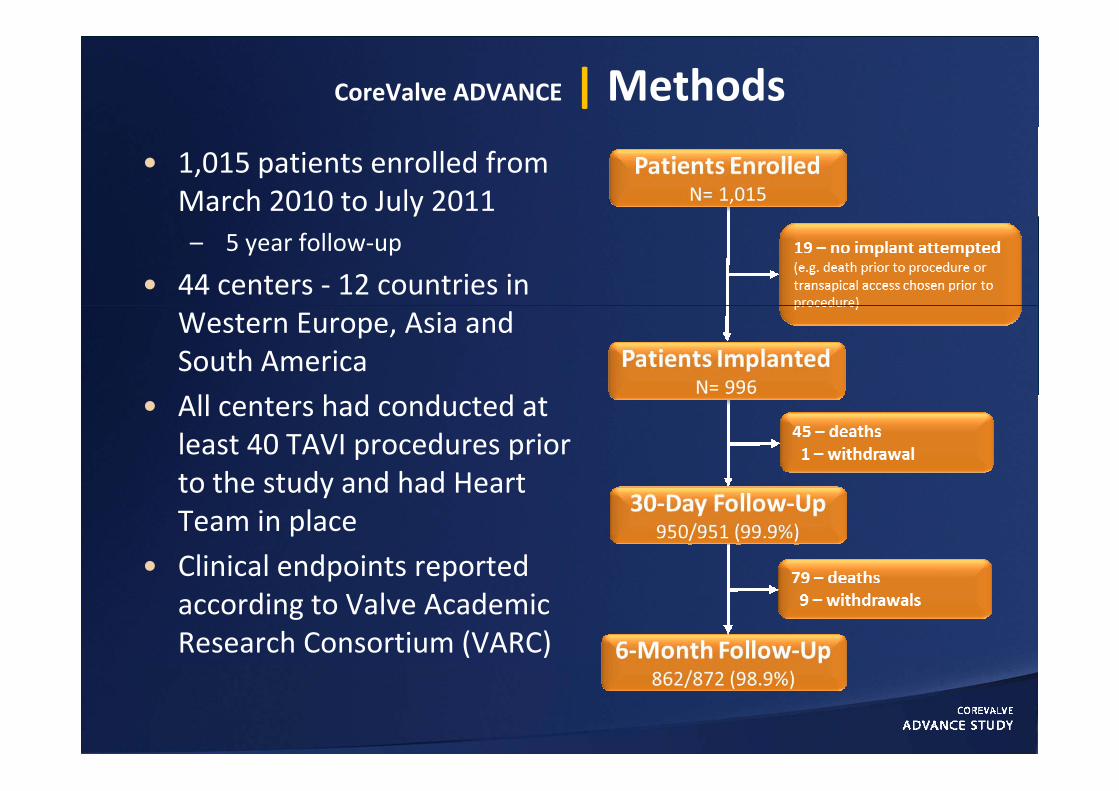
CoreValve ADVANCE | Methods
• 1,015 patients enrolled from March 2010 to July 2011y– 5 year follow‐up
• 44 centers ‐ 12 countries in Western Europe, Asia and South America ll h d d d• All centers had conducted at
least 40 TAVI procedures prior to the study and had Heartto the study and had Heart Team in place
• Clinical endpoints reportedClinical endpoints reported according to Valve Academic Research Consortium (VARC)
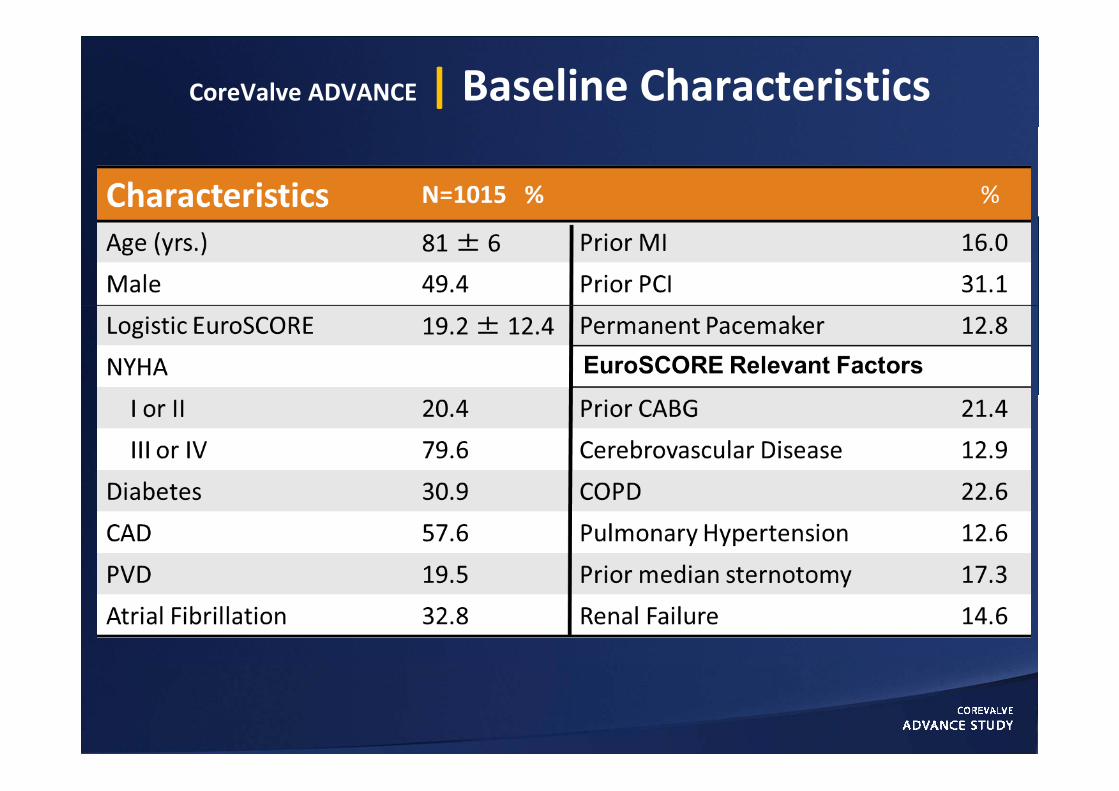
CoreValve ADVANCE | Baseline Characteristics
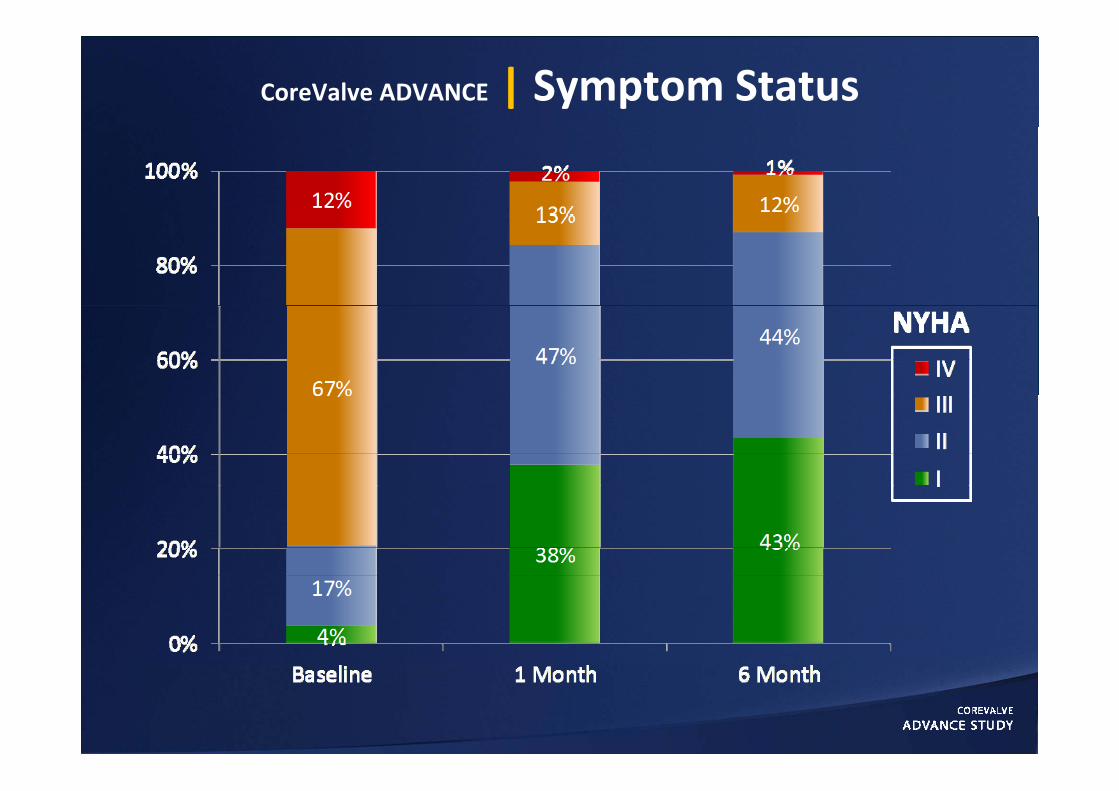
CoreValve ADVANCE | Symptom Status
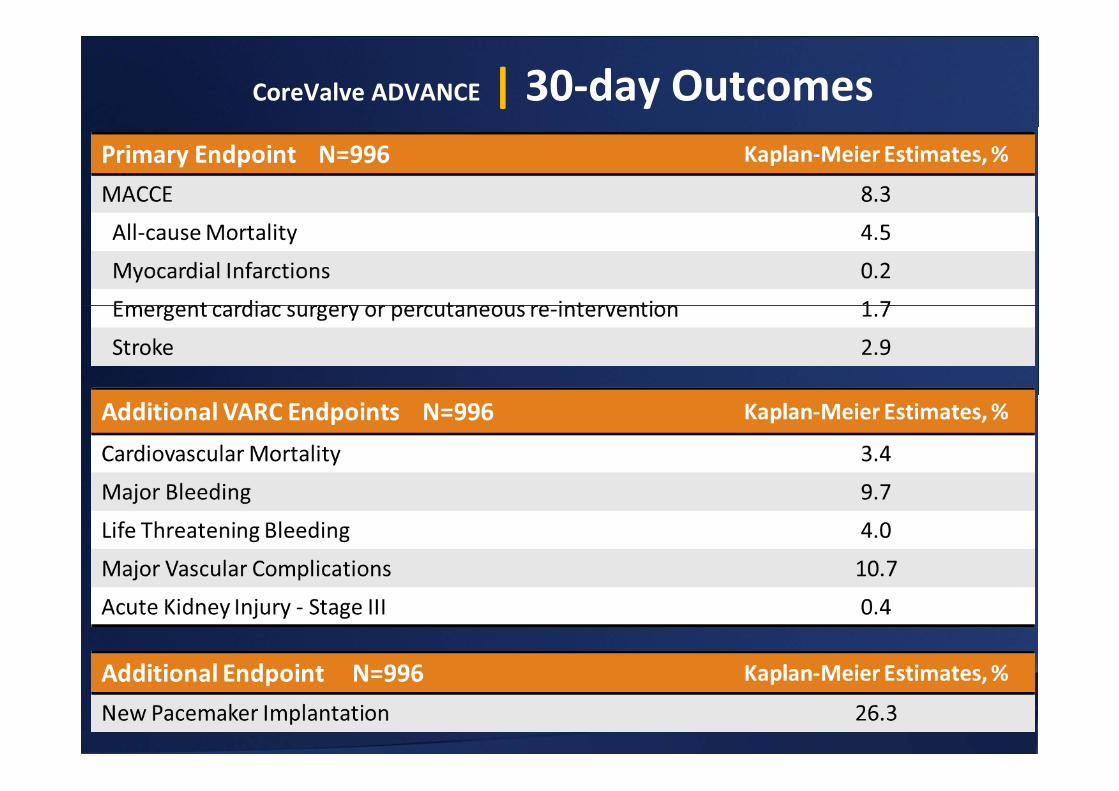
CoreValve ADVANCE | 30‐day Outcomes
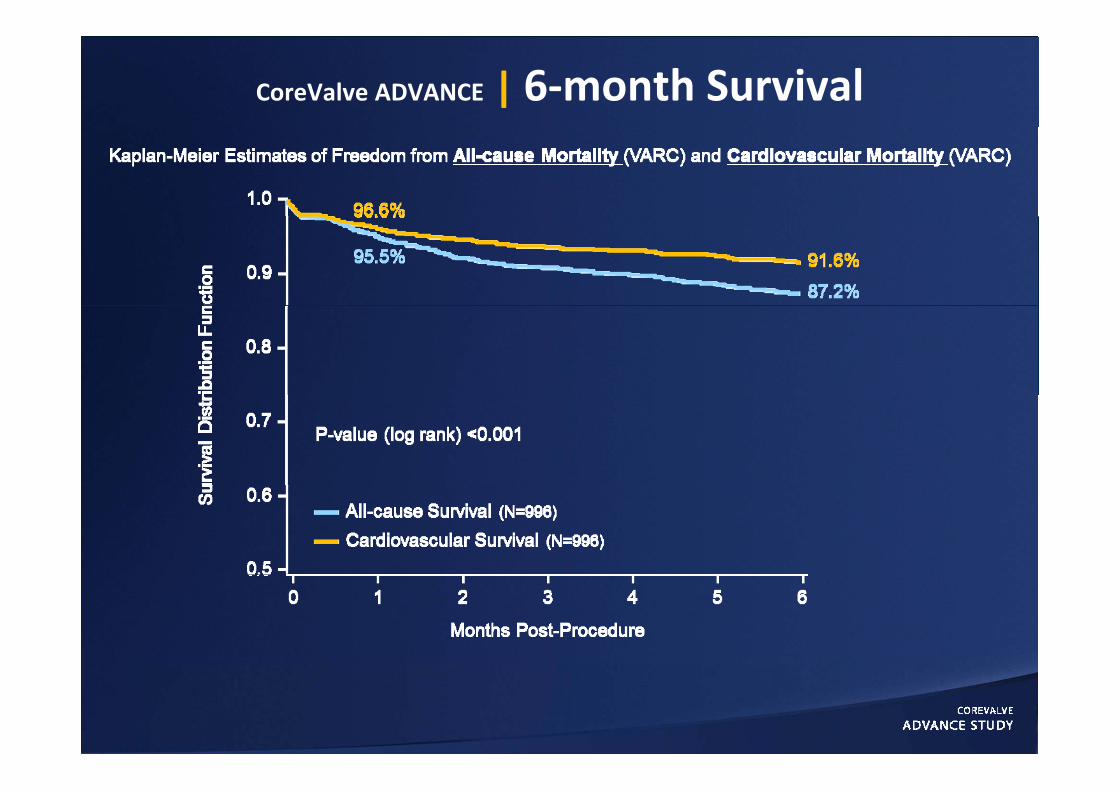
CoreValve ADVANCE | 6‐month Survival
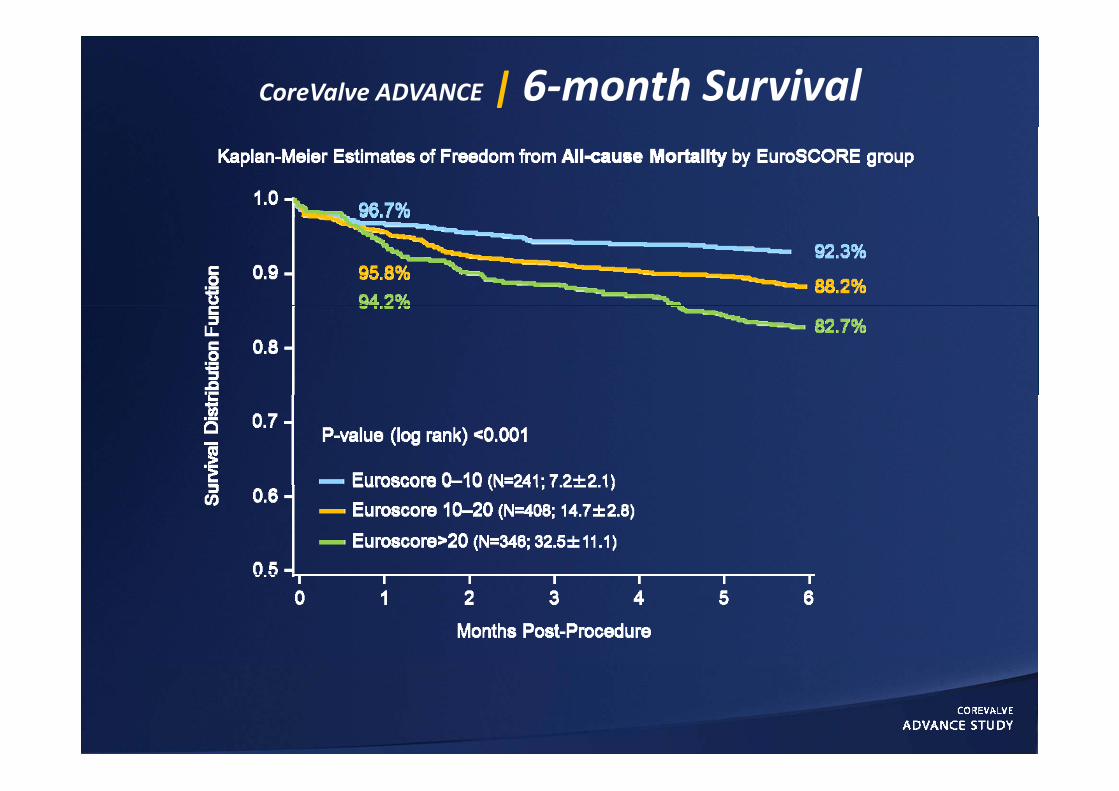
CoreValve ADVANCE | 6‐month Survival
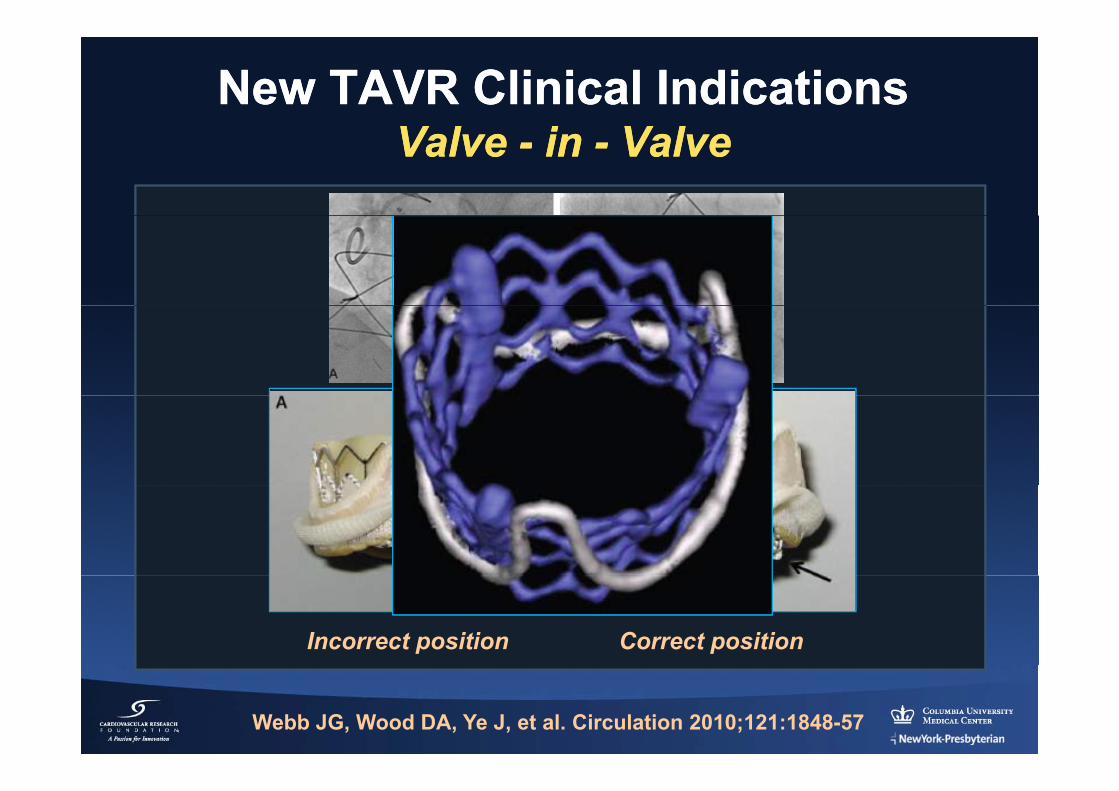
New TAVR Clinical IndicationsNew TAVR Clinical IndicationsV lV l ii V lV lValve Valve -- in in -- ValveValve
Incorrect position Correct position
Webb JG, Wood DA, Ye J, et al. Circulation 2010;121:1848-57
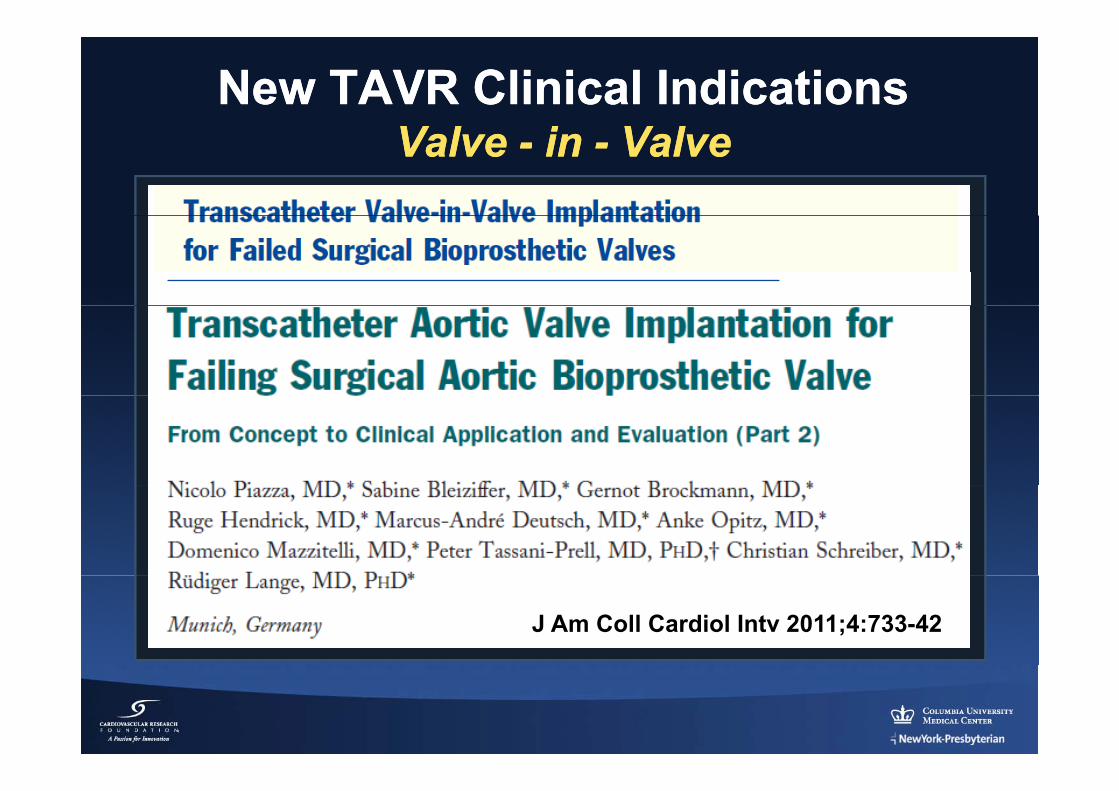
New TAVR Clinical IndicationsNew TAVR Clinical IndicationsV lV l ii V lV lValve Valve -- in in -- ValveValve
J Am J Am CollColl CardiolCardiol 20112011;;5858::21962196--209209
J Am Coll Cardiol Intv 2011;4:733-42
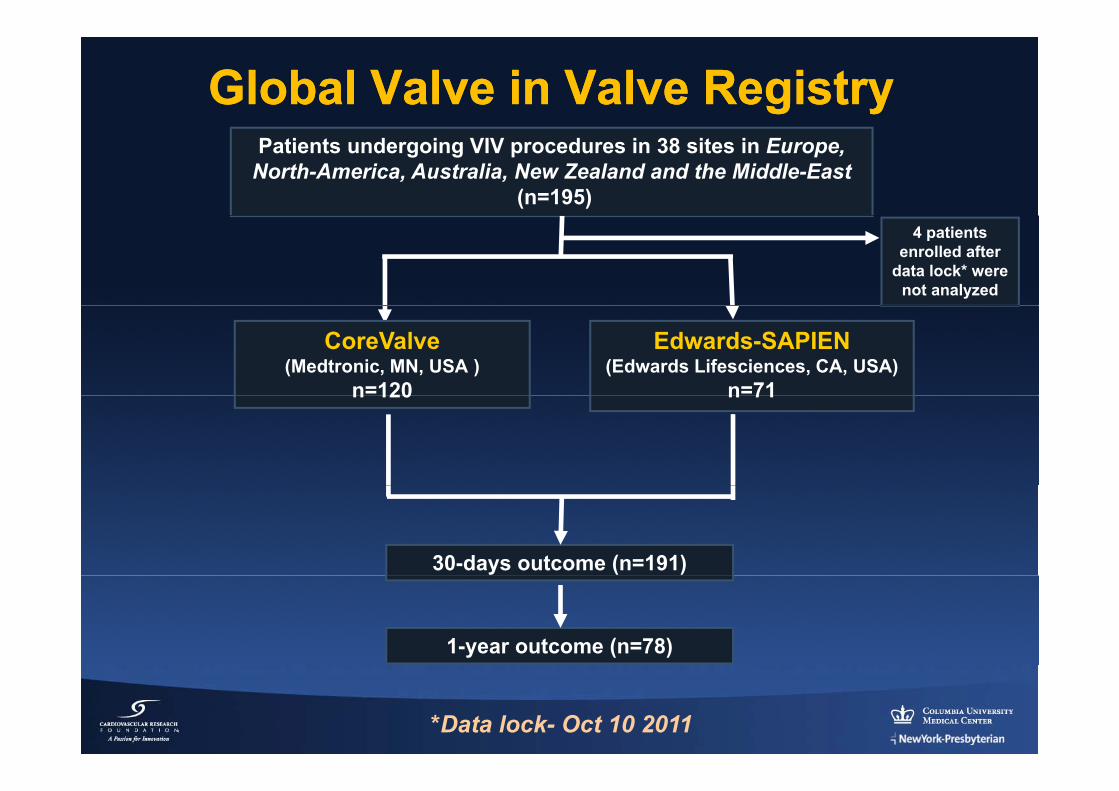
Global Valve in Valve RegistryGlobal Valve in Valve RegistryPatients undergoing VIV procedures in 38 sites in Europe,
North-America, Australia, New Zealand and the Middle-East(n=195)
4 patients enrolled after
data lock* were not analyzed
CoreValve(Medtronic, MN, USA )
n=120
Edwards-SAPIEN(Edwards Lifesciences, CA, USA)
n=71n 120 n 71
30-days outcome (n=191)
1-year outcome (n=78)
*Data lock- Oct 10 2011
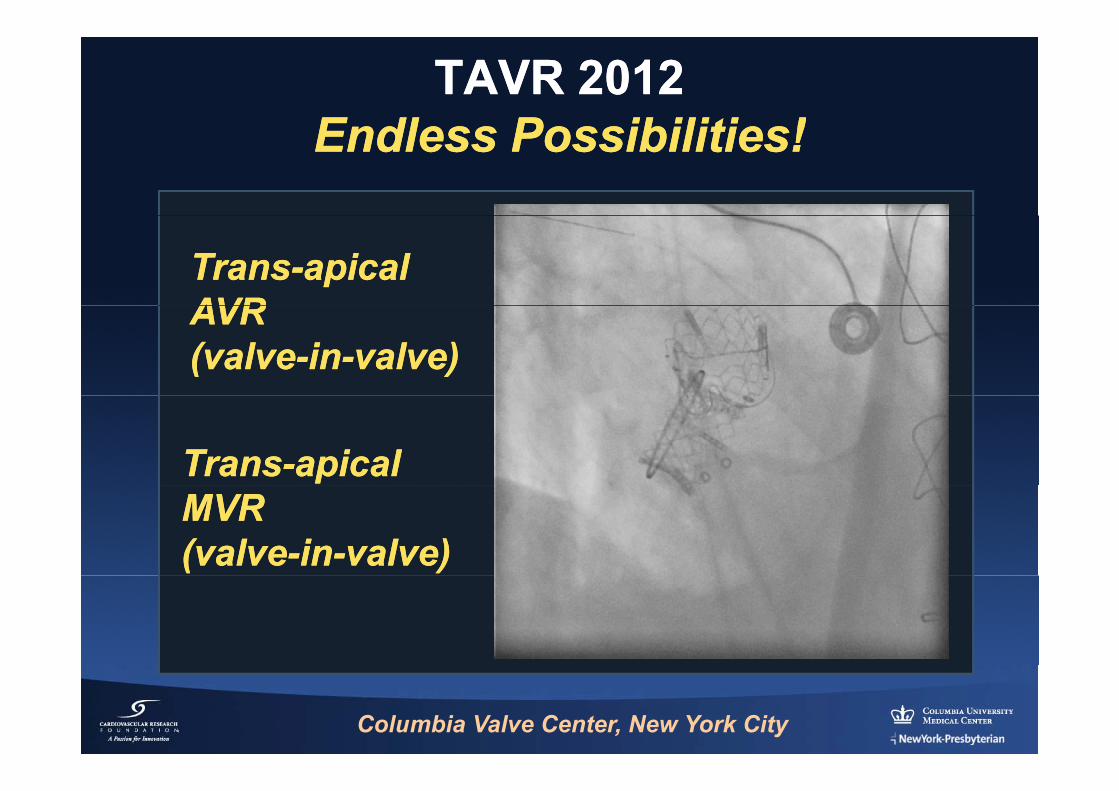
TAVR 2012TAVR 2012Endless Possibilities!Endless Possibilities!Endless Possibilities!Endless Possibilities!
TransTrans--apicalapicalAVRAVRAVRAVR(valve(valve--inin--valve)valve)
TransTrans--apicalapicalMVRMVR(valve(valve--inin--valve)valve)
EdwardsEdwards--SapienSapien
Columbia Valve Center, New York City
TAVR in Review (TAVR in Review (20112011--12)12)
ComplicationsComplicationsComplicationsComplications
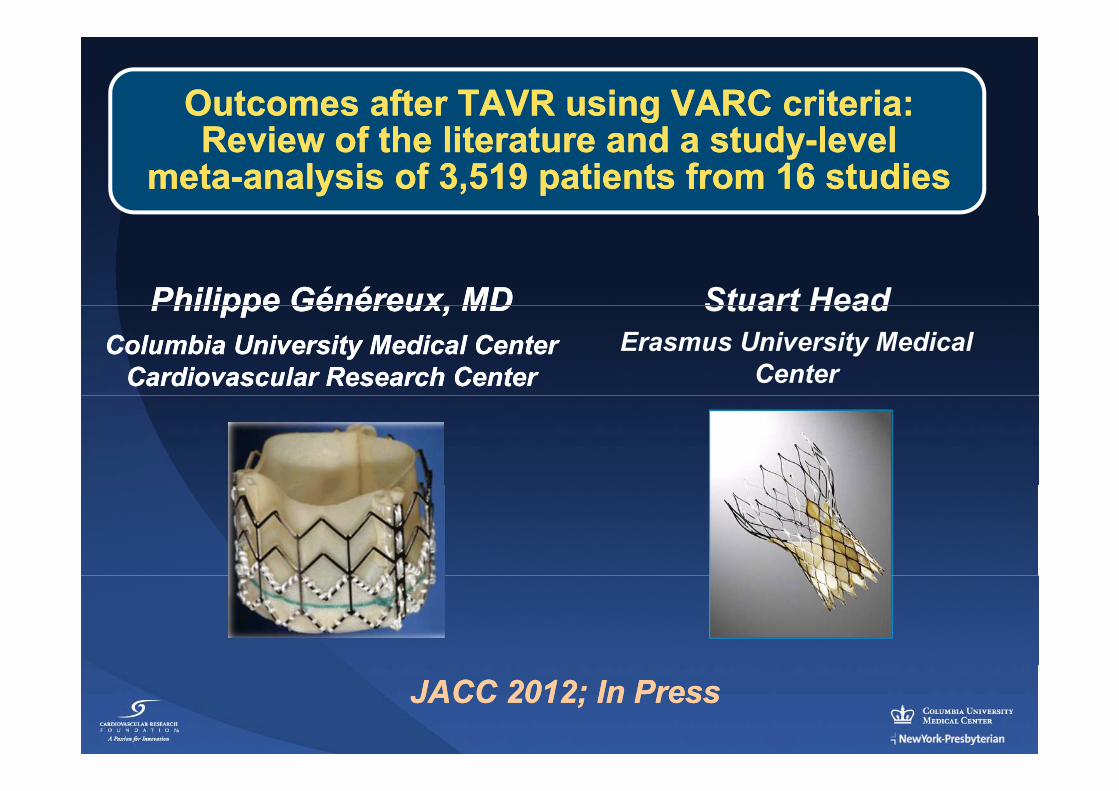
Outcomes after TAVR using VARC criteria:Outcomes after TAVR using VARC criteria:ffReview of the literature and a studyReview of the literature and a study--level level
metameta--analysis of 3,519 patients from 16 studiesanalysis of 3,519 patients from 16 studies
Philippe Généreux MDPhilippe Généreux MD Stuart HeadPhilippe Généreux, MD Philippe Généreux, MD Columbia University Medical Center Columbia University Medical Center
Cardiovascular Research CenterCardiovascular Research Center
Stuart HeadErasmus University Medical
Center
JACC JACC 20122012; In Press; In Press
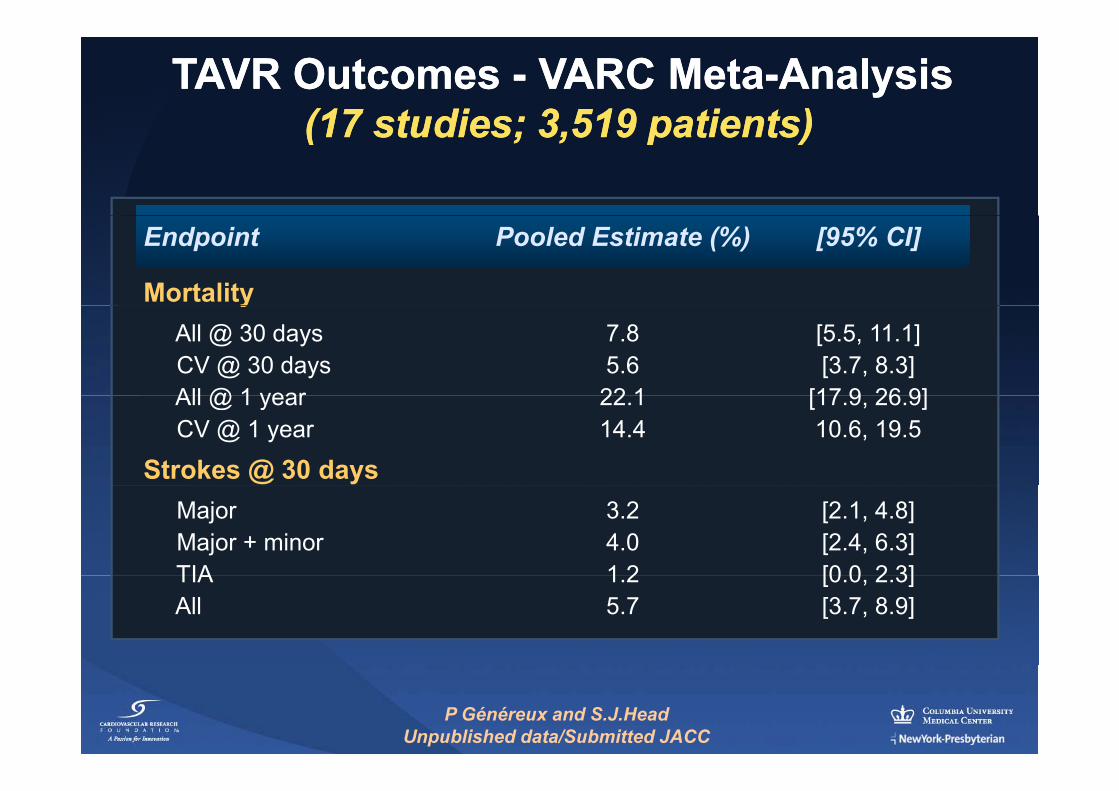
TAVR Outcomes TAVR Outcomes -- VARC MetaVARC Meta--AnalysisAnalysis(17 studies; 3 519 patients)(17 studies; 3 519 patients)(17 studies; 3,519 patients)(17 studies; 3,519 patients)
Endpoint Pooled Estimate (%) [95% CI]
MortalityyAll @ 30 days 7.8 [5.5, 11.1]CV @ 30 days 5.6 [3.7, 8.3]All @ 1 year 22 1 [17 9 26 9]All @ 1 year 22.1 [17.9, 26.9]CV @ 1 year 14.4 10.6, 19.5
Strokes @ 30 daysMajor 3.2 [2.1, 4.8]Major + minor 4.0 [2.4, 6.3]TIA 1 2 [0 0 2 3]TIA 1.2 [0.0, 2.3]All 5.7 [3.7, 8.9]
P Généreux and S.J.HeadUnpublished data/Submitted JACC
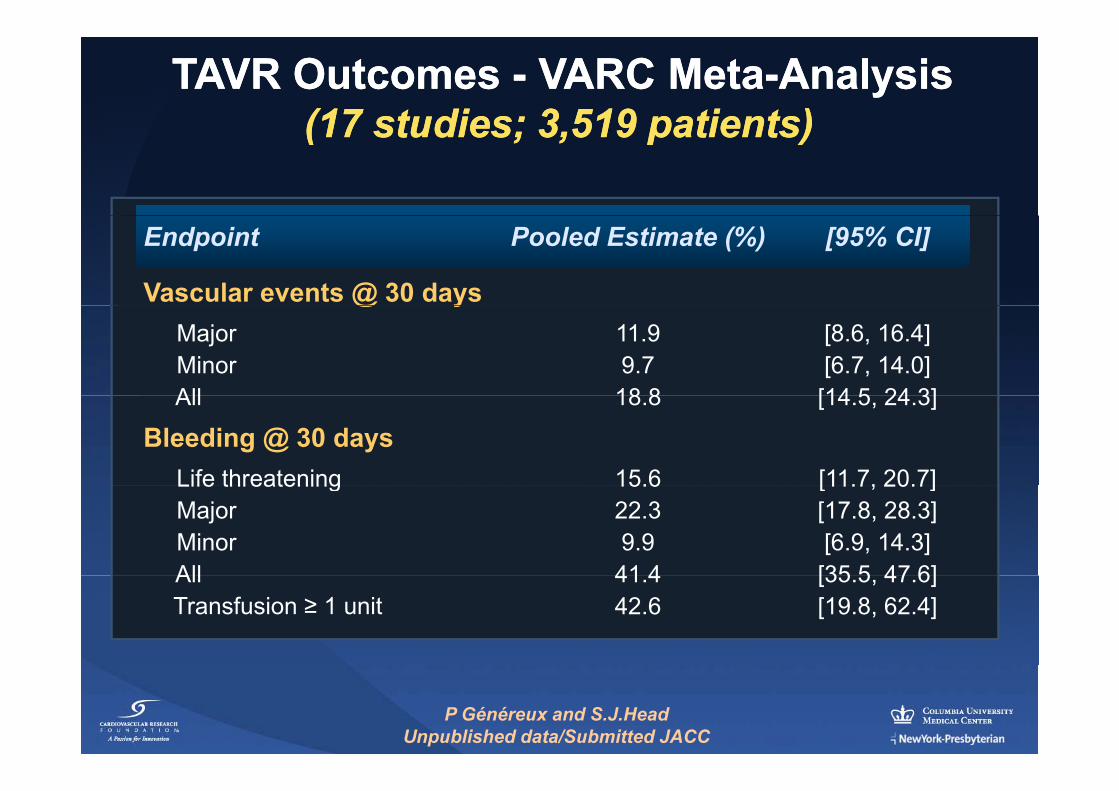
TAVR Outcomes TAVR Outcomes -- VARC MetaVARC Meta--AnalysisAnalysis((1717 studies;studies; 33 519519 patients)patients)((17 17 studies; studies; 33,,519 519 patients)patients)
Endpoint Pooled Estimate (%) [95% CI]
Vascular events @ 30 days@ yMajor 11.9 [8.6, 16.4]Minor 9.7 [6.7, 14.0]All 18 8 [14 5 24 3]All 18.8 [14.5, 24.3]
Bleeding @ 30 daysLife threatening 15.6 [11.7, 20.7]Life threatening 15.6 [11.7, 20.7]Major 22.3 [17.8, 28.3]Minor 9.9 [6.9, 14.3]All 41 4 [35 5 47 6]All 41.4 [35.5, 47.6]Transfusion ≥ 1 unit 42.6 [19.8, 62.4]
P Généreux and S.J.HeadUnpublished data/Submitted JACC
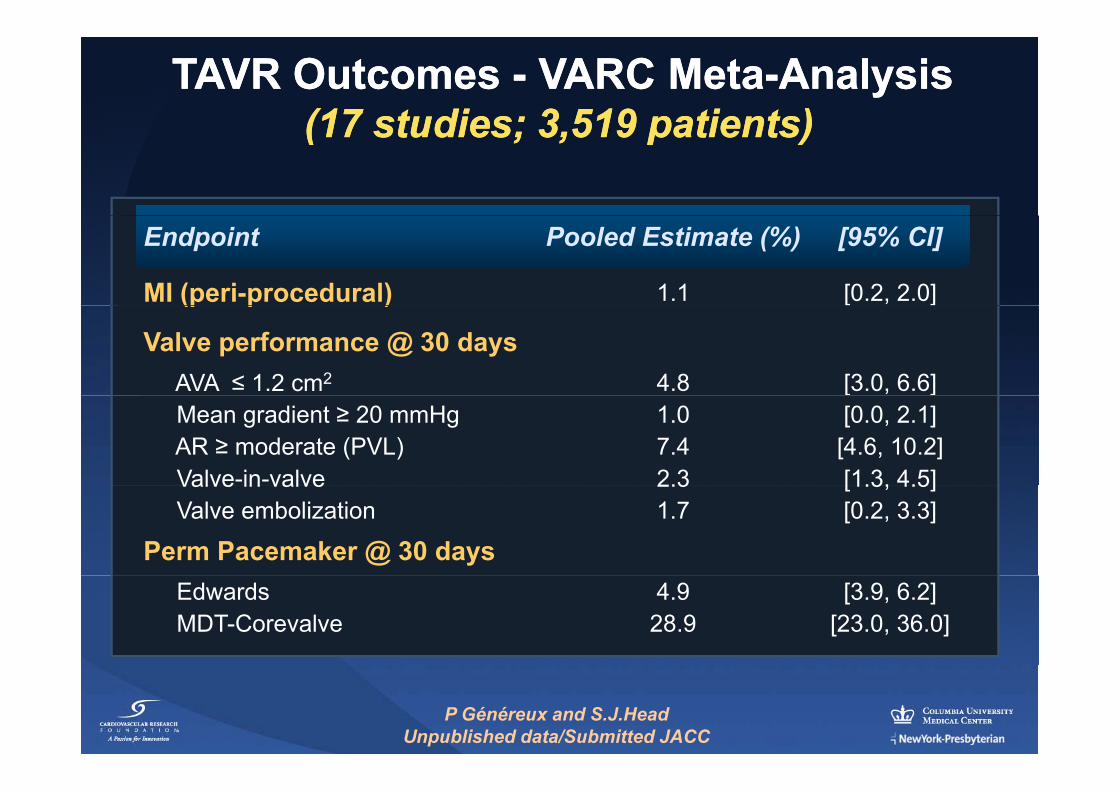
TAVR Outcomes TAVR Outcomes -- VARC MetaVARC Meta--AnalysisAnalysis(17 studies; 3 519 patients)(17 studies; 3 519 patients)(17 studies; 3,519 patients)(17 studies; 3,519 patients)
Endpoint Pooled Estimate (%) [95% CI]
MI (peri-procedural) 1.1 [0.2, 2.0](p p )
Valve performance @ 30 daysAVA ≤ 1.2 cm2 4.8 [3.0, 6.6]Mean gradient ≥ 20 mmHg 1.0 [0.0, 2.1]AR ≥ moderate (PVL) 7.4 [4.6, 10.2]Valve-in-valve 2.3 [1.3, 4.5]Valve in valve 2.3 [1.3, 4.5]Valve embolization 1.7 [0.2, 3.3]
Perm Pacemaker @ 30 daysEdwards 4.9 [3.9, 6.2]MDT-Corevalve 28.9 [23.0, 36.0]
P Généreux and S.J.HeadUnpublished data/Submitted JACC
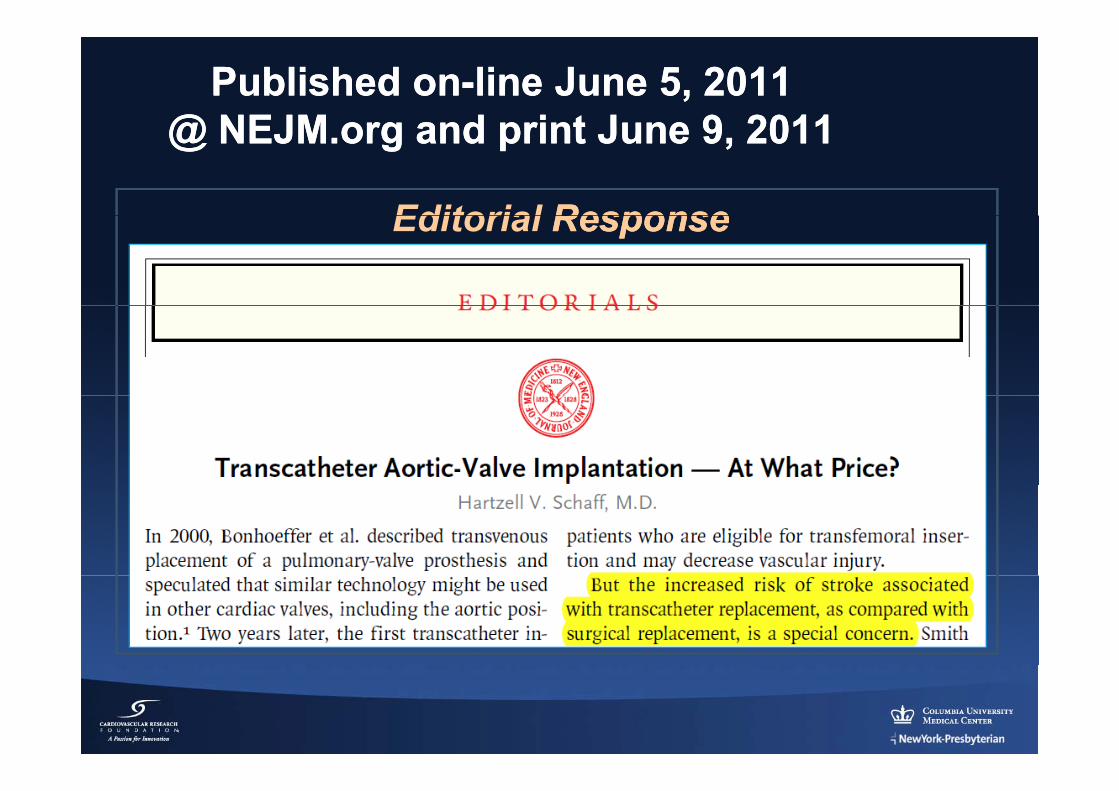
Published onPublished on--line June 5, 2011line June 5, 2011@ NEJM org and print June 9 2011@ NEJM org and print June 9 2011@ NEJM.org and print June 9, 2011@ NEJM.org and print June 9, 2011
Editorial ResponseResponseEditorial ResponseResponse
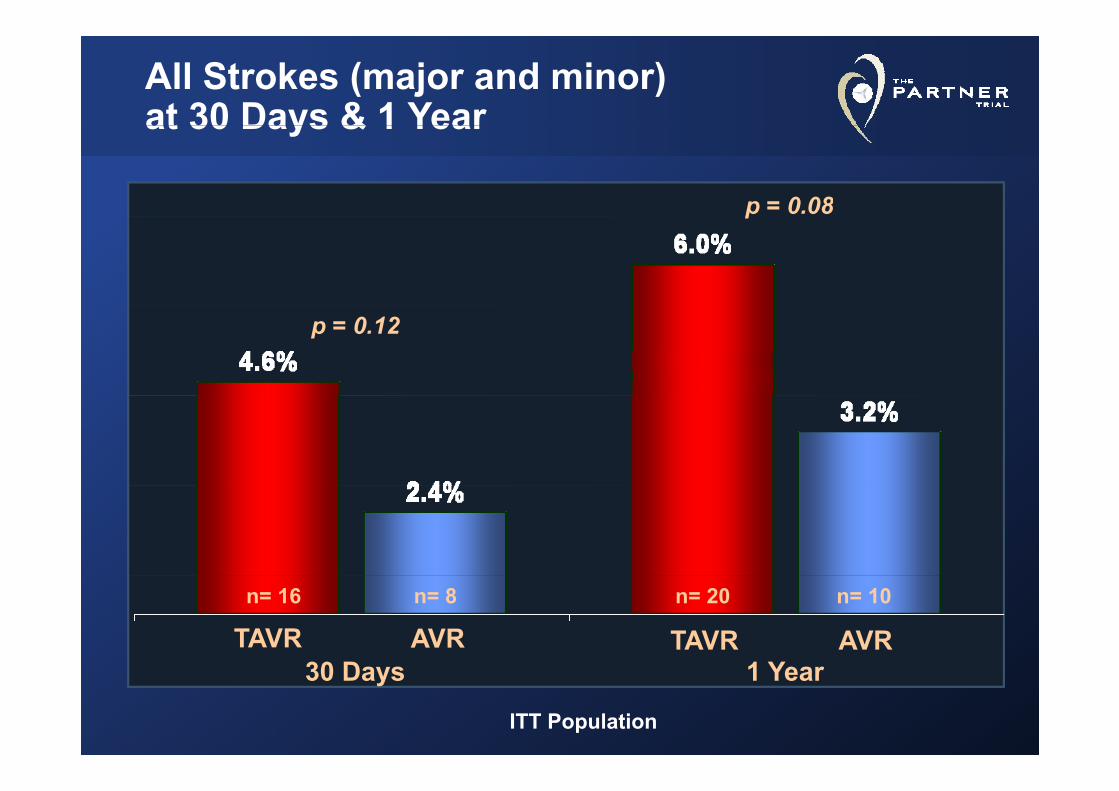
All Strokes (major and minor) at 30 Days & 1 Yearat 30 Days & 1 Year
p = 0.08p
p = 0.12
n= 20 n= 10n= 16 n= 8
30 D 1 YTAVR AVR TAVR AVR
30 Days 1 Year
ITT Population
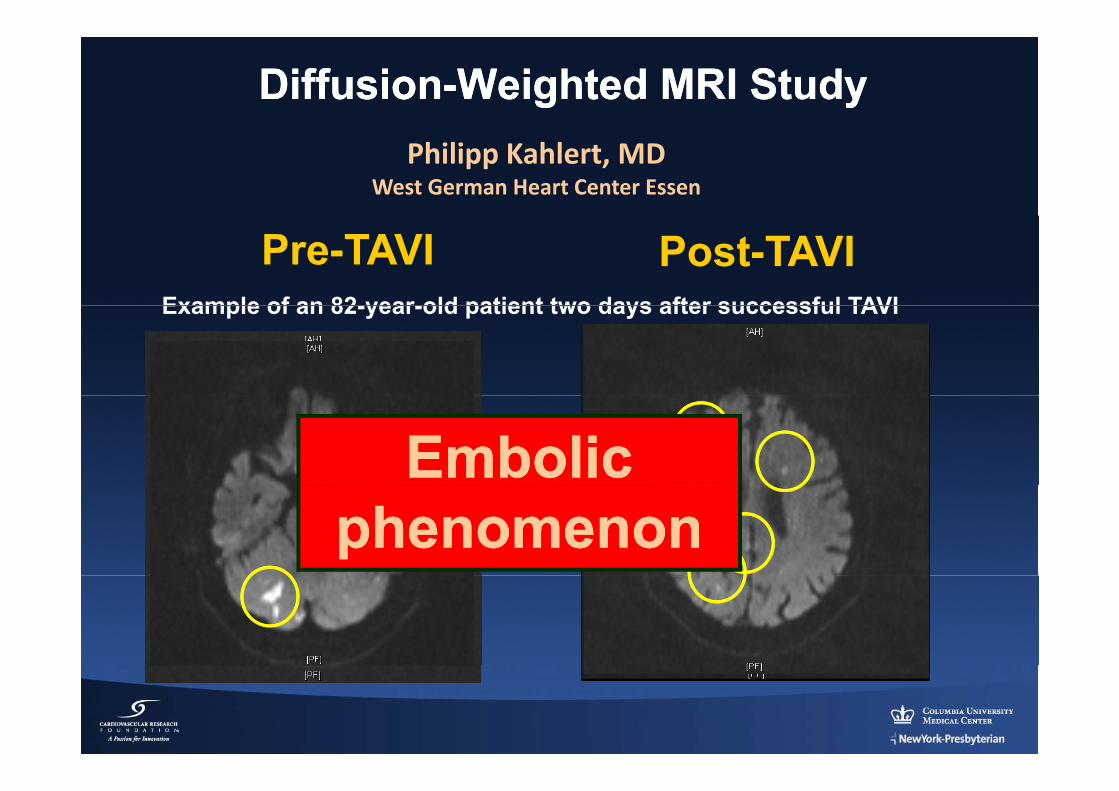
DiffusionDiffusion--Weighted MRI StudyWeighted MRI StudyPhilipp Kahlert, MD
West German Heart Center Essen
Example of an 82 year old patient two days after successful TAVI
Pre-TAVI Post-TAVIExample of an 82-year-old patient two days after successful TAVI
Embolic Embolic phenomenonphenomenon
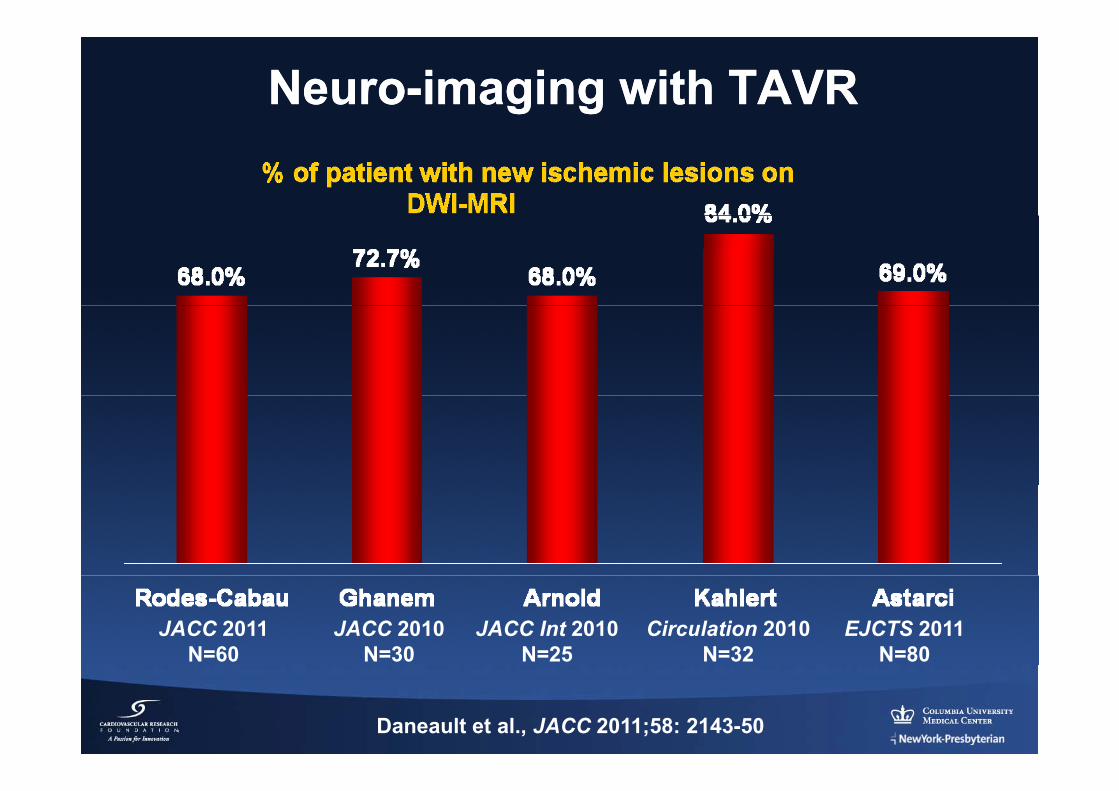
NeuroNeuro--imaging with TAVRimaging with TAVR
JACC 2011N=60
JACC 2010N=30
JACC Int 2010N=25
Circulation 2010N=32
EJCTS 2011N=80
Daneault et al., JACC 2011;58: 2143-50
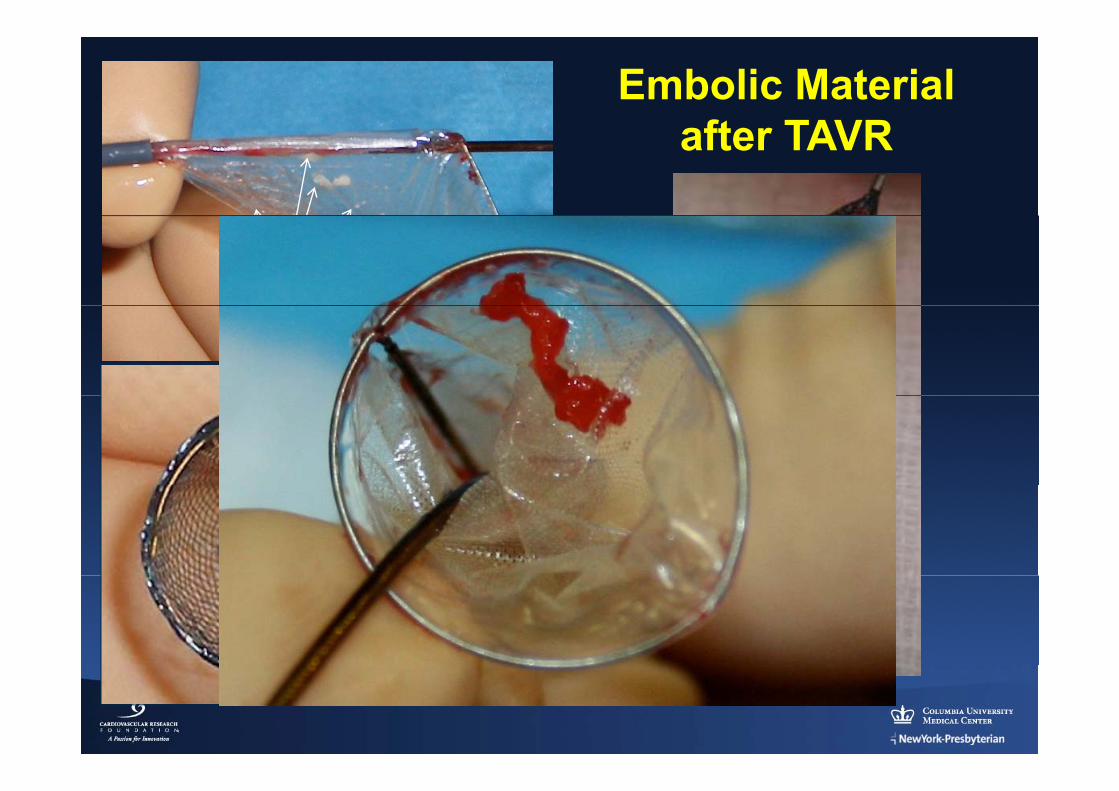
Embolic Materialft TAVRafter TAVR
Embolic Material
Embolic Material
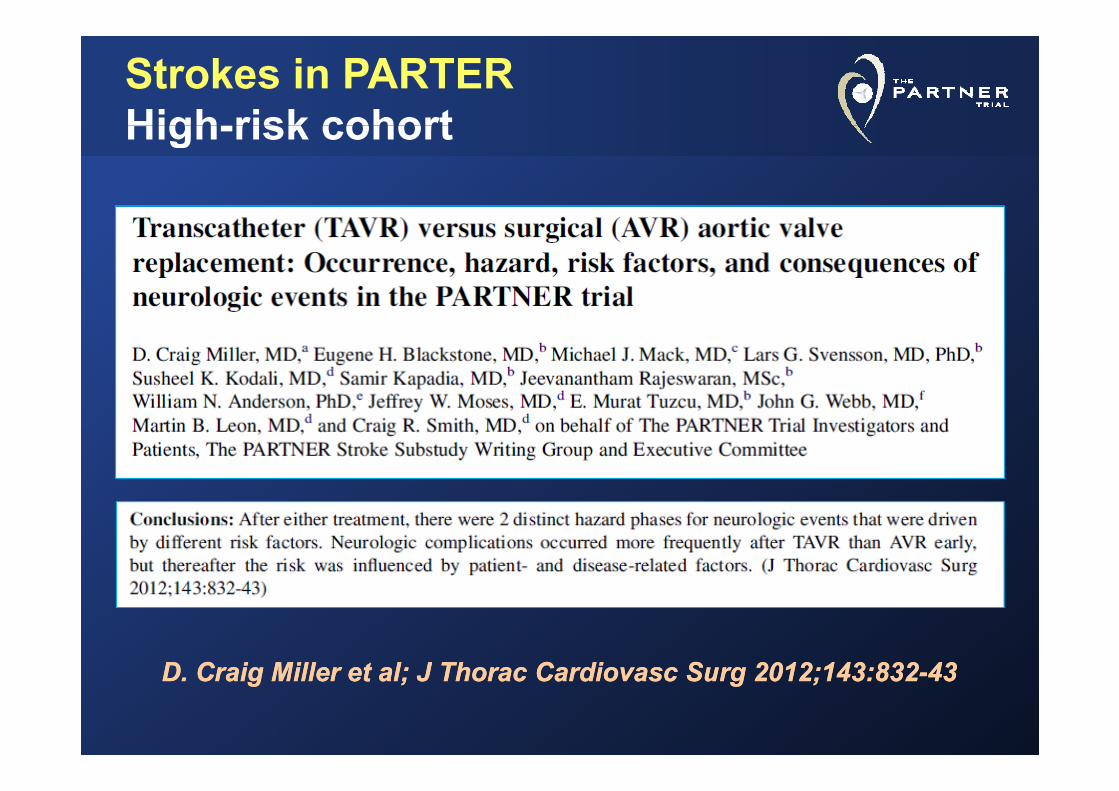
Strokes in PARTERHigh-risk cohortHigh-risk cohort
D C i Mill t l JD C i Mill t l J ThTh C diC di SS 2012 143 8322012 143 832 4343D. Craig Miller et al; J D. Craig Miller et al; J ThoracThorac CardiovascCardiovasc SurgSurg 2012;143:8322012;143:832--4343
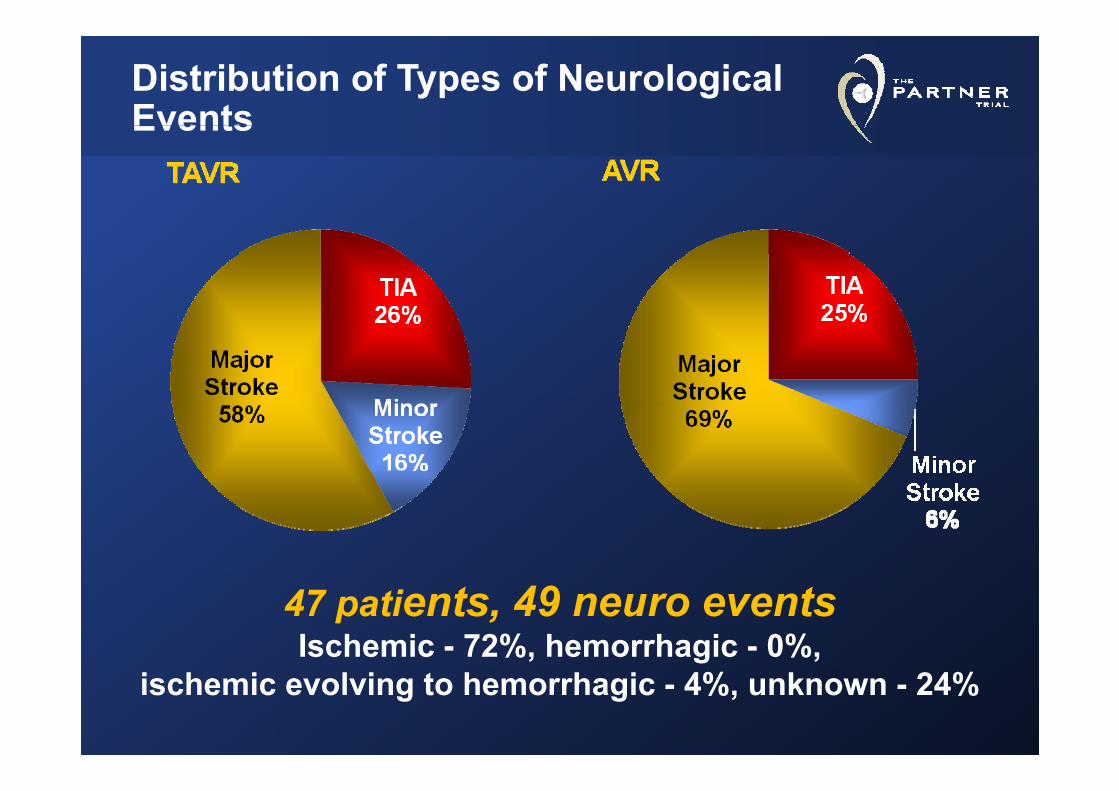
Distribution of Types of Neurological EventsEvents
47 patients, 49 neuro eventsIschemic - 72%, hemorrhagic - 0%,
ischemic evolving to hemorrhagic - 4%, unknown - 24%
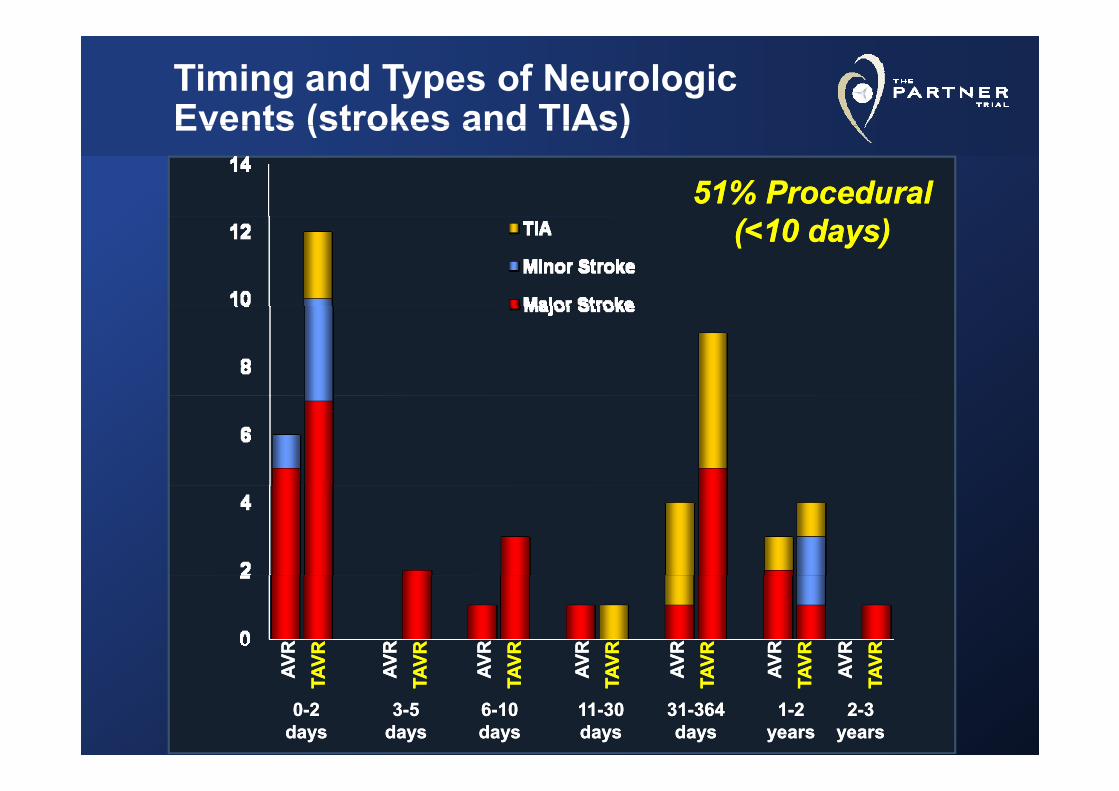
Timing and Types of Neurologic Events (strokes and TIAs)
51% Procedural51% Procedural
Events (strokes and TIAs)
(<10 days)(<10 days)VRVR VRVR VRVR VRVR VRVR VRVR VRVR VRVR VRVR VRVRVRVR VRVR VRVR VRVRAVAV TAV
TAV AVAV TAV
TAV AVAV TAV
TAV AVAV TAV
TAV AVAV TAV
TAVAVAV TAV
TAV AVAV TAV
TAV
00--22daysdays
33--55daysdays
3131--364364daysdays
1111--3030daysdays
66--1010daysdays
22--33yearsyears
11--22yearsyears
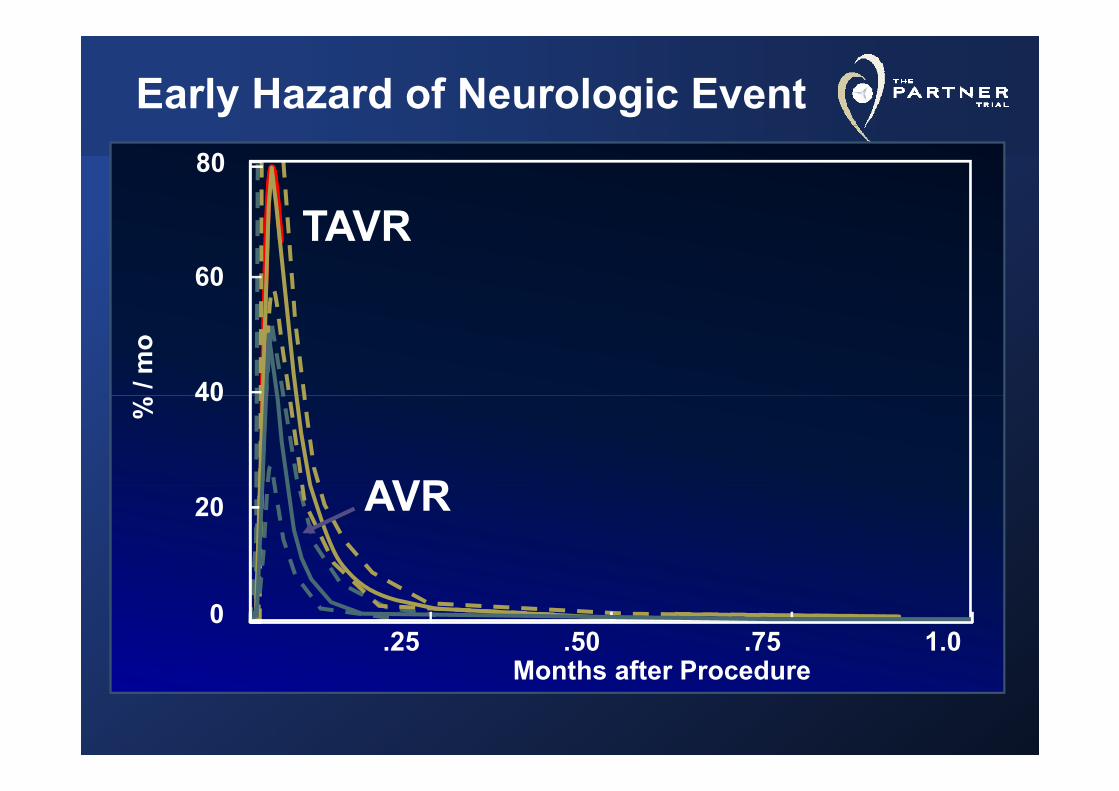
Early Hazard of Neurologic Event80
TAVR60
TAVR
/ mo
40
% 40
AVR20 AVR
M th ft P d
0.25 .50 .75 1.0
Months after Procedure
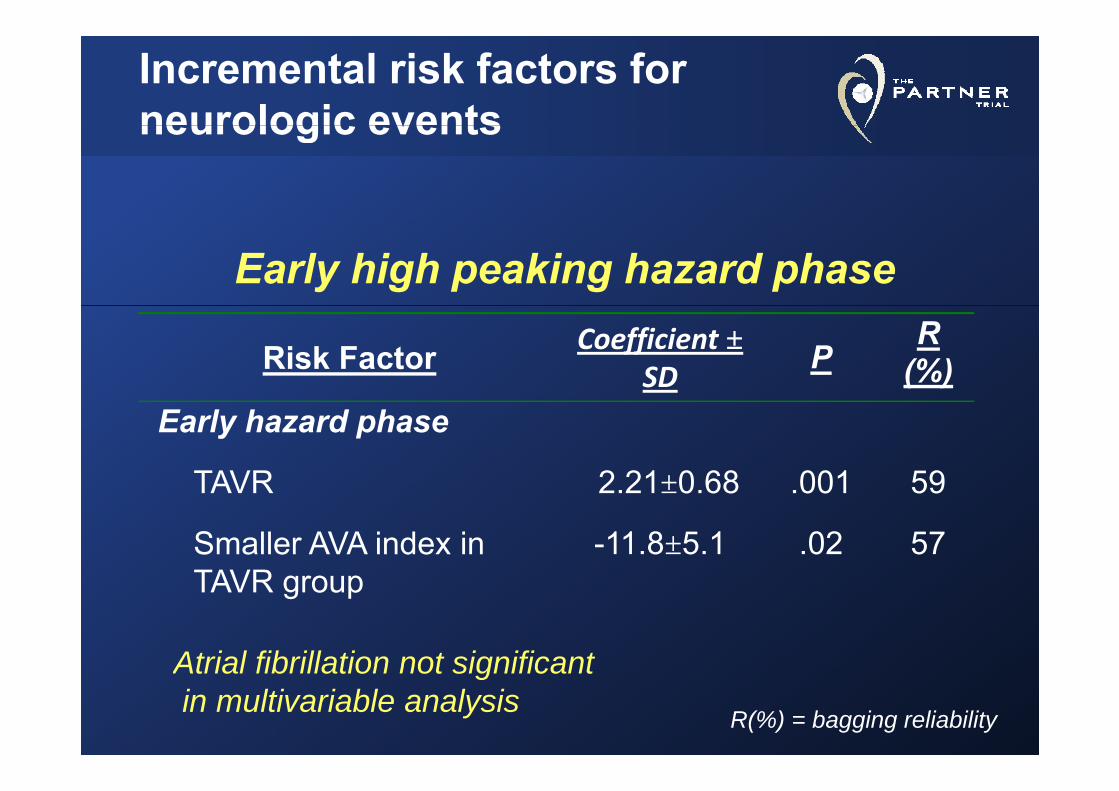
Incremental risk factors for neurologic eventsneurologic events
Early high peaking hazard phase
Risk Factor Coefficient ±SD
PR
(%)Early hazard phase
TAVR 2 21±0 68 001 59TAVR 2.21±0.68 .001 59
Smaller AVA index in TAVR
-11.8±5.1 .02 57TAVR group
Atrial fibrillation not significant
R(%) = bagging reliability
Atrial fibrillation not significantin multivariable analysis
Later Hazard of Neurologic Event15
10 TAVR11
%%
10 TAVR
6 7
8.0%%
5
6.7
4.5
AVR
Mos0
6 12 18 24
5858
130125
243218
278251
344313
TAVRAVR
Incremental risk factors for neurologic eventsneurologic events
Late constant hazard phaseRisk Factor Coefficient ± SD P R (%)
Constant ha ard phase
ate co sta t a a d p ase
Constant hazard phaseTAVR 0.40±0.43 0.4 22
(Higher) NYHA 0 95±0 40 02 75(Higher) NYHA 0.95±0.40 .02 75
Stroke or TIA within 6-12 mo 1.93±0.64 .002 60
Non-TF TAVR candidate* 2.3±0.45 <.0001 96
History of PCI (less risk) -1.60±0.63 .01 77
COPD (less risk) -1.06±0.47 .03 79
*Increased h/o prior CABG, cerebrovascular disease,
R(%) = bagging reliability
p , ,periperal vascular disease (= increased vasculopathy)
Strokes (ITT)Strokes (ITT)
HR [95% CI] =TAVR HR [95% CI] 1.22 [0.67, 2.23]
p (log rank) = 0.517
TAVRAVR
Stro
ke
30 Day Stroke RateTAVR – 4.6%
6.0% 7.7%
S AVR – 2.4%
3.2% 4.9%
Months Post ProcedureNumbers at RiskNumbers at Risk
TAVRTAVR 348348 287287 249249 224224 162162 6565 2828TAVRTAVR 348348 287287 249249 224224 162162 6565 2828
AVRAVR 351351 246246 230230 211211 160160 6262 3131
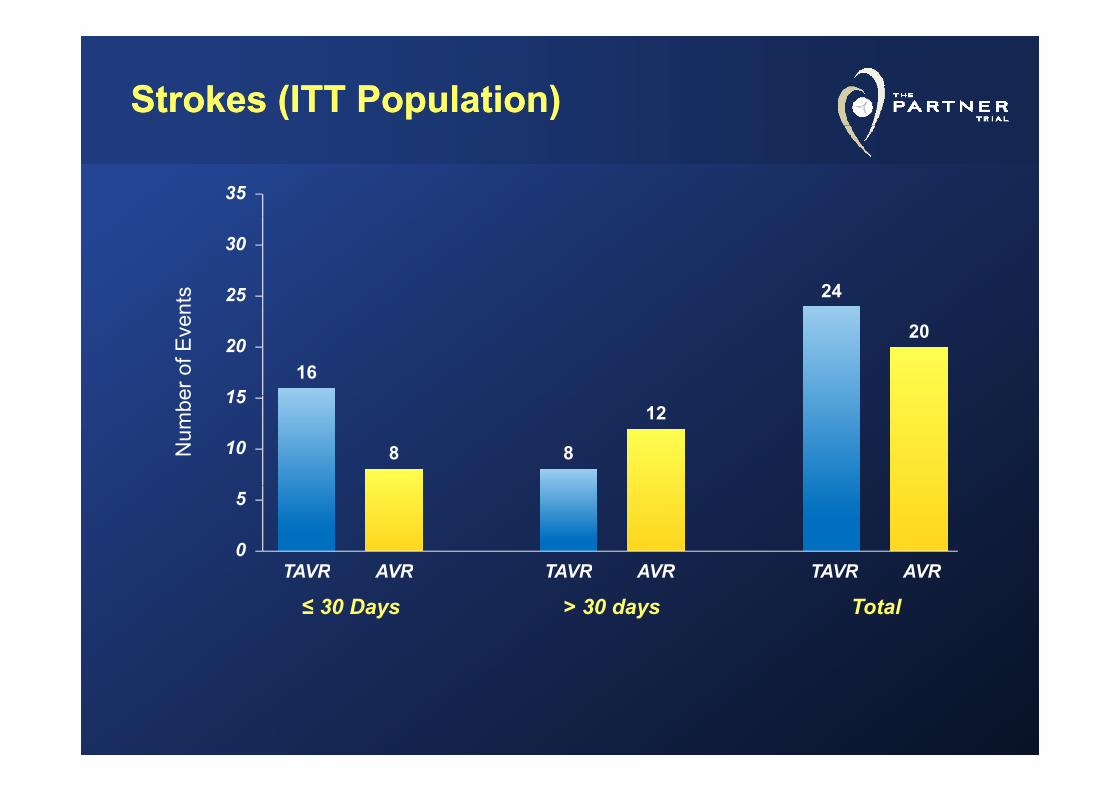
Strokes (ITT Population)Strokes (ITT Population)
35nt
s 2425
30
er o
f Eve
n
16
20
15
20
Num
be
8 8
12
10
15
TAVR AVR TAVR AVR TAVR AVR0
5
≤ 30 DaysTAVR AVR
> 30 daysTAVR AVR
TotalTAVR AVR
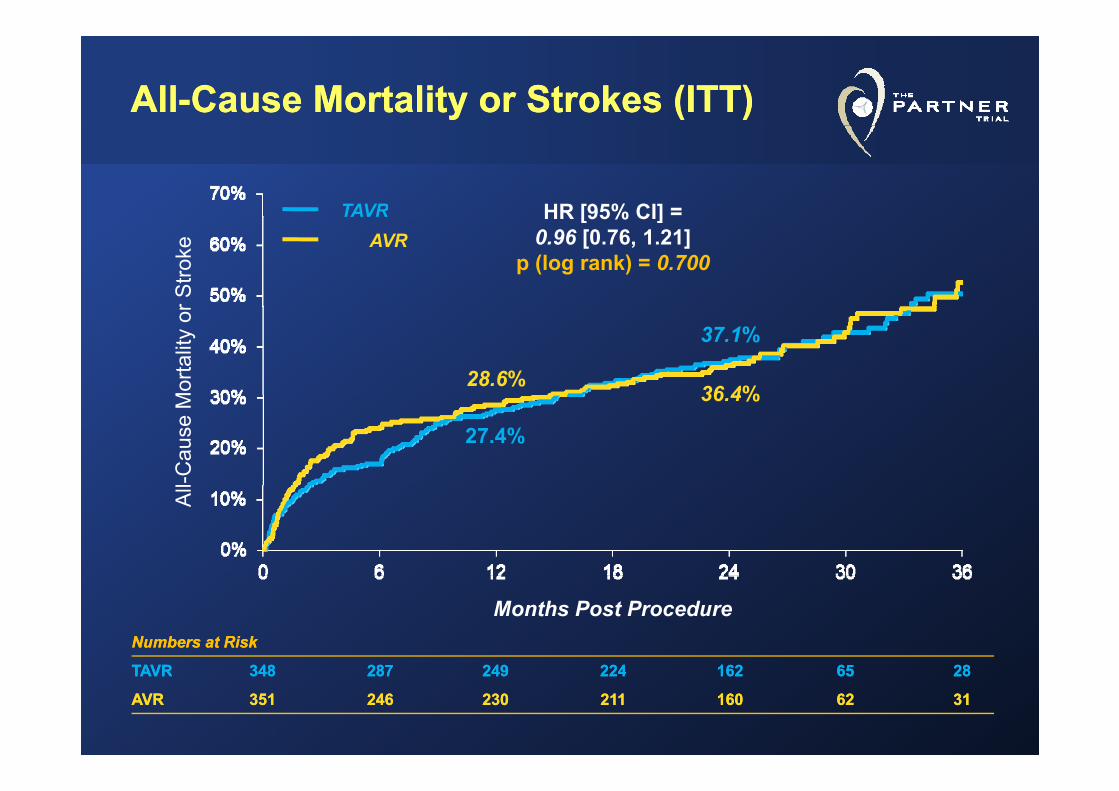
AllAll--Cause Mortality or Strokes (ITT)Cause Mortality or Strokes (ITT)
HR [95% CI] =TAVR HR [95% CI] 0.96 [0.76, 1.21]
p (log rank) = 0.700
r Stro
keTAVR
AVR
28.6%36 4%
37.1%
Mor
talit
y or
27.4%
36.4%
l-Cau
se M
All
Months Post ProcedureNumbers at RiskNumbers at Risk
TAVRTAVR 348348 287287 249249 224224 162162 6565 2828TAVRTAVR 348348 287287 249249 224224 162162 6565 2828
AVRAVR 351351 246246 230230 211211 160160 6262 3131
Transapical Aortic Valve Replacement Transapical Aortic Valve Replacement For Critical Aortic Stenosis: ResultsFor Critical Aortic Stenosis: ResultsFor Critical Aortic Stenosis: Results For Critical Aortic Stenosis: Results From the NonFrom the Non--Randomized Continued Randomized Continued A C h t f Th PARTNER T i lA C h t f Th PARTNER T i lAccess Cohort of The PARTNER TrialAccess Cohort of The PARTNER Trial
Todd M. Dewey, MDTodd M. Dewey, MDon behalf of The PARTNER Trial Investigators
STS 2012 | F t L d d l | J 30 2012STS 2012 | Fort Lauderdale | Jan 30, 2012
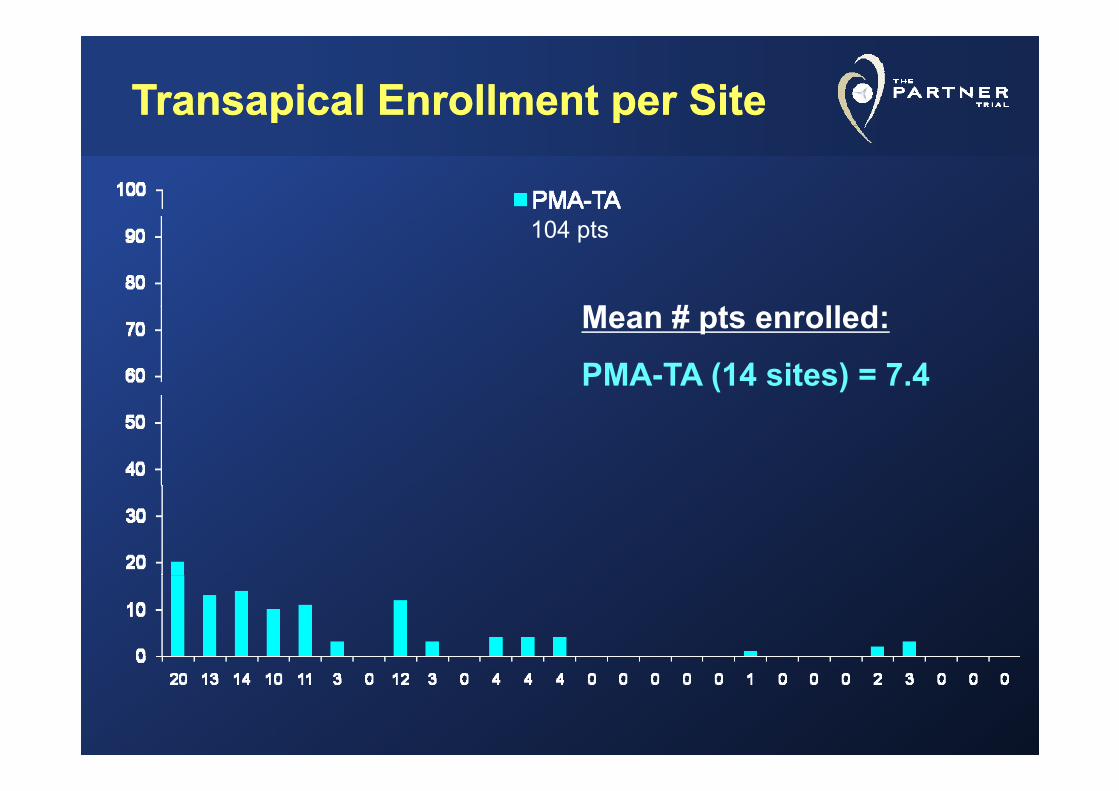
Transapical Enrollment per SiteTransapical Enrollment per Site
M # t ll d
104 pts
Mean # pts enrolled:
PMA-TA (14 sites) = 7.4
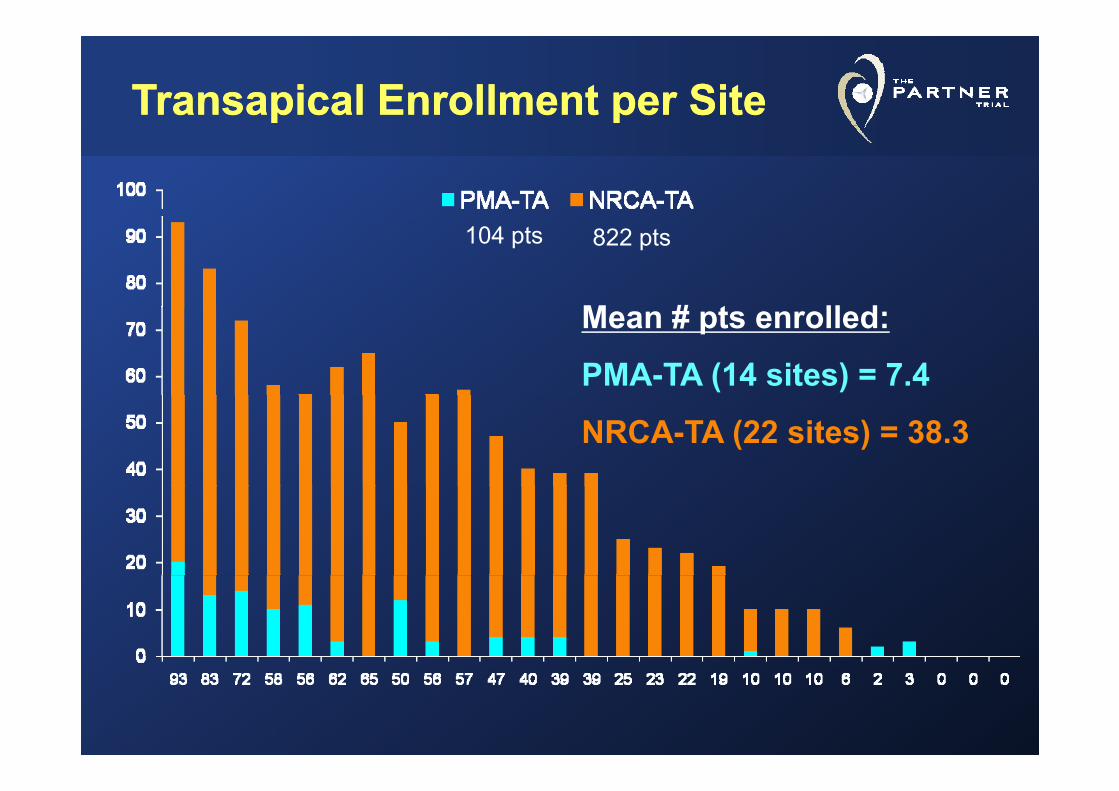
Transapical Enrollment per SiteTransapical Enrollment per Site
M # t ll d
104 pts 822 pts
Mean # pts enrolled:
PMA-TA (14 sites) = 7.4
NRCA-TA (22 sites) = 38.3
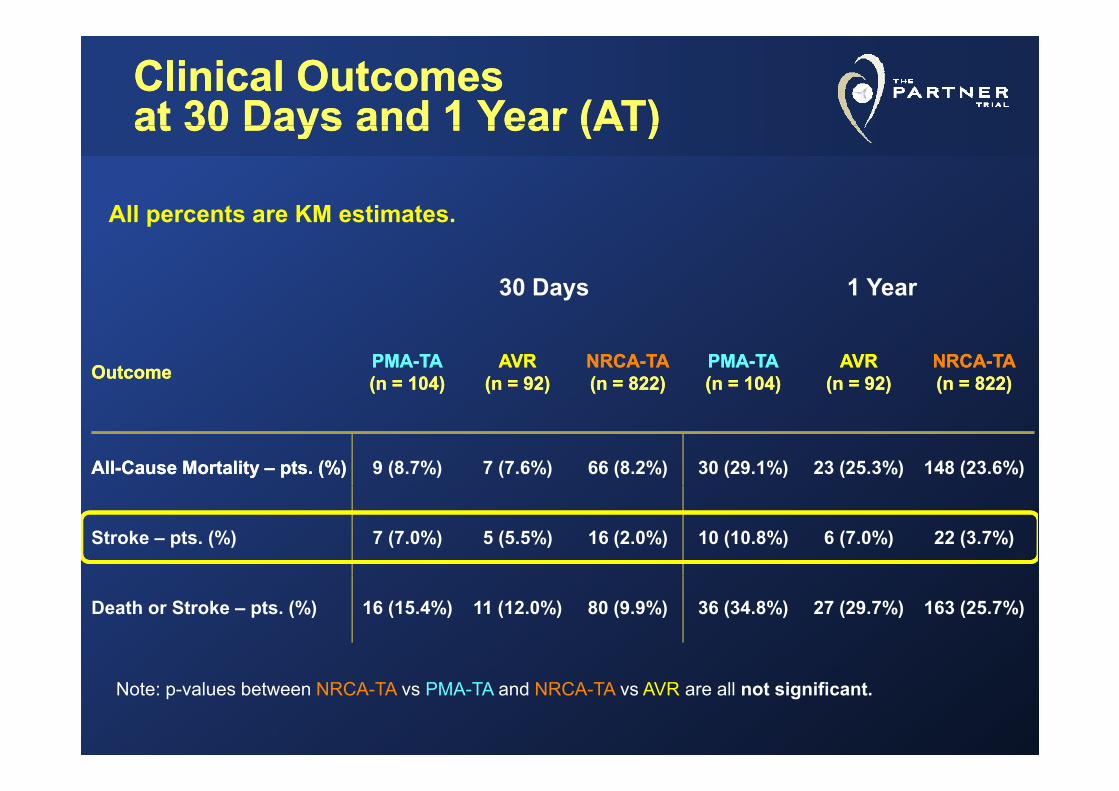
Clinical OutcomesClinical Outcomesat 30 Days and 1 Year (AT)at 30 Days and 1 Year (AT)at 30 Days and 1 Year (AT)at 30 Days and 1 Year (AT)
All percents are KM estimates
30 Days 1 Year
All percents are KM estimates.
OutcomeOutcome PMAPMA--TATA(n (n = = 104)104)
AVRAVR(n (n = = 92)92)
NRCANRCA--TATA(n (n = = 822)822)
PMAPMA--TATA(n (n = = 104)104)
AVRAVR(n (n = = 92)92)
NRCANRCA--TATA(n = 822)(n = 822)
AllAll--Cause Mortality Cause Mortality –– pts. (%)pts. (%) 9 (8.7%) 7 (7.6%) 66 (8.2%) 30 (29.1%) 23 (25.3%) 148 (23.6%)
Stroke – pts. (%) 7 (7.0%) 5 (5.5%) 16 (2.0%) 10 (10.8%) 6 (7.0%) 22 (3.7%)
Death or Stroke – pts. (%) 16 (15.4%) 11 (12.0%) 80 (9.9%) 36 (34.8%) 27 (29.7%) 163 (25.7%)
Note: p-values between NRCA-TA vs PMA-TA and NRCA-TA vs AVR are all not significant.
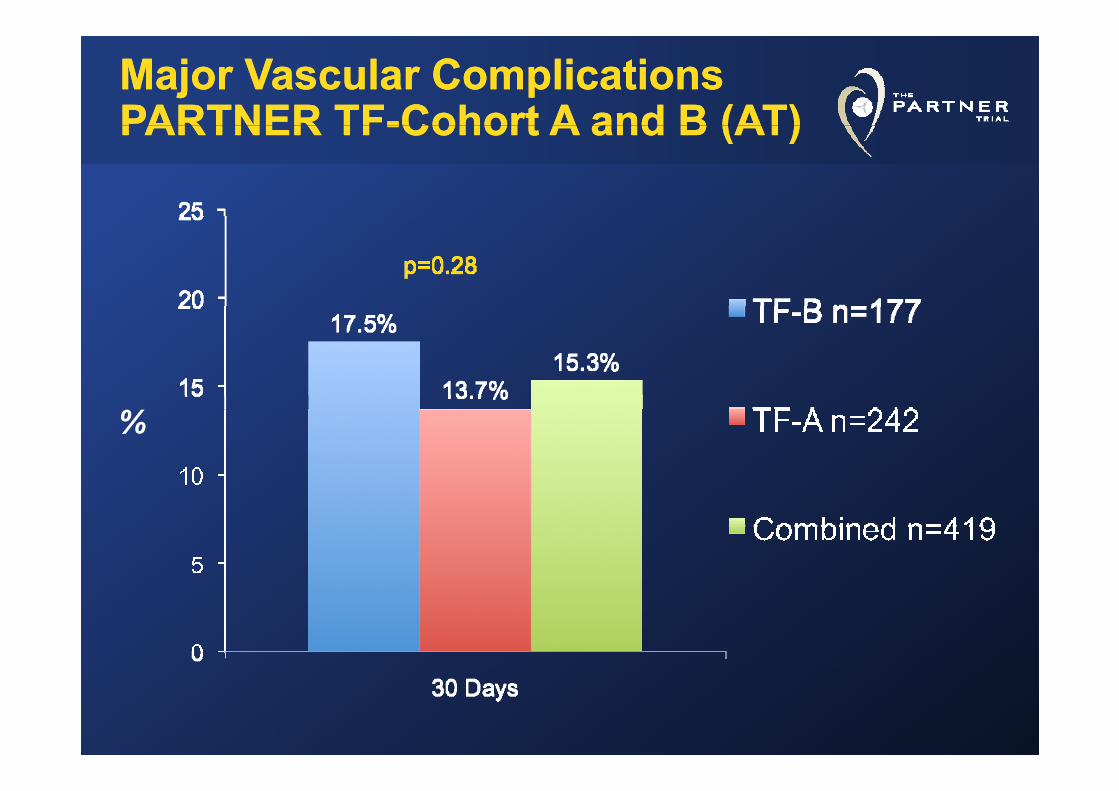
Major Vascular ComplicationsMajor Vascular ComplicationsPARTNER TFPARTNER TF--Cohort A and B (AT)Cohort A and B (AT)PARTNER TFPARTNER TF--Cohort A and B (AT)Cohort A and B (AT)
%
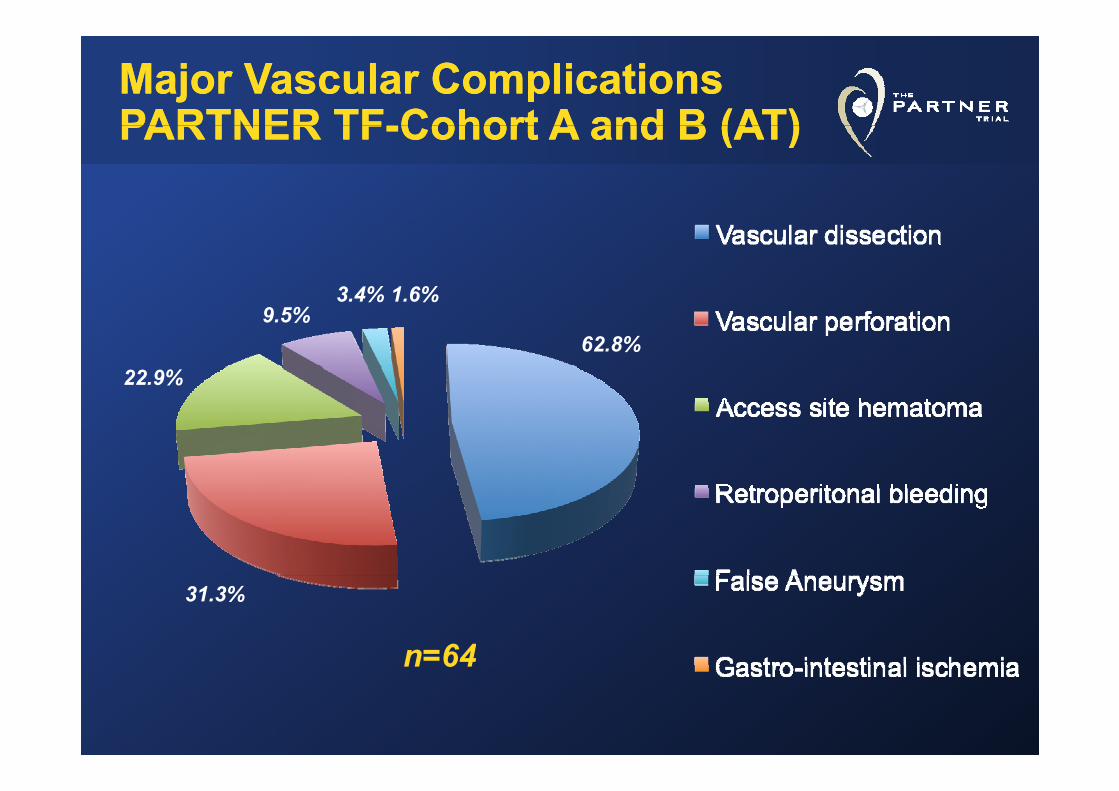
Major Vascular ComplicationsMajor Vascular ComplicationsPARTNER TFPARTNER TF--Cohort A and B (AT)Cohort A and B (AT)PARTNER TFPARTNER TF--Cohort A and B (AT)Cohort A and B (AT)
1.6%3.4%
62.8%9.5%
22.9%
31.3%
n=64n 64
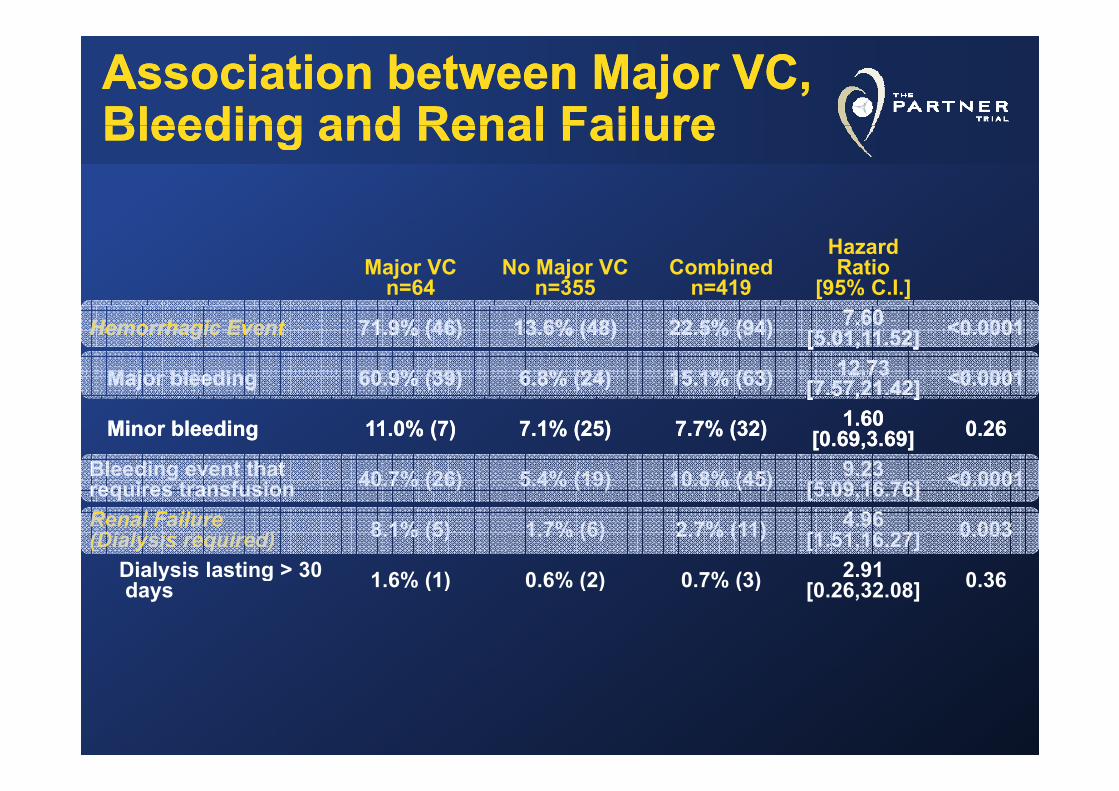
Association between Major VC, Association between Major VC, Bleeding and Renal FailureBleeding and Renal FailureBleeding and Renal FailureBleeding and Renal Failure
Major VC n=64
No Major VCn=355
Combinedn=419
Hazard Ratio
[95% C.I.]
Hemorrhagic EventHemorrhagic Event 71.9% (46)71.9% (46) 13.6% (48)13.6% (48) 22.5% (94)22.5% (94) 7.60 7.60 [5.01,11.52][5.01,11.52] <0.0001<0.0001
Major bleedingMajor bleeding 60.9% (39)60.9% (39) 6.8% (24)6.8% (24) 15.1% (63)15.1% (63) 12.73 12.73 [7.57,21.42][7.57,21.42] <0.0001<0.0001[ 5 , ][ 5 , ]
Minor bleedingMinor bleeding 11.0% (7)11.0% (7) 7.1% (25)7.1% (25) 7.7% (32)7.7% (32) 1.60 1.60 [0.69,3.69][0.69,3.69] 0.260.26
Bleeding event that req ires transf sion 40.7% (26) 5.4% (19) 10.8% (45) 9.23
[5 09 16 76] <0.0001requires transfusion 40.7% (26) 5.4% (19) 10.8% (45) [5.09,16.76] 0.0001
Renal Failure (Dialysis required) 8.1% (5) 1.7% (6) 2.7% (11) 4.96
[1.51,16.27] 0.003
Dialysis lasting > 30 1 6% (1) 0 6% (2) 0 7% (3) 2.91 0 36Dialysis lasting > 30 days 1.6% (1) 0.6% (2) 0.7% (3) 2.91
[0.26,32.08] 0.36
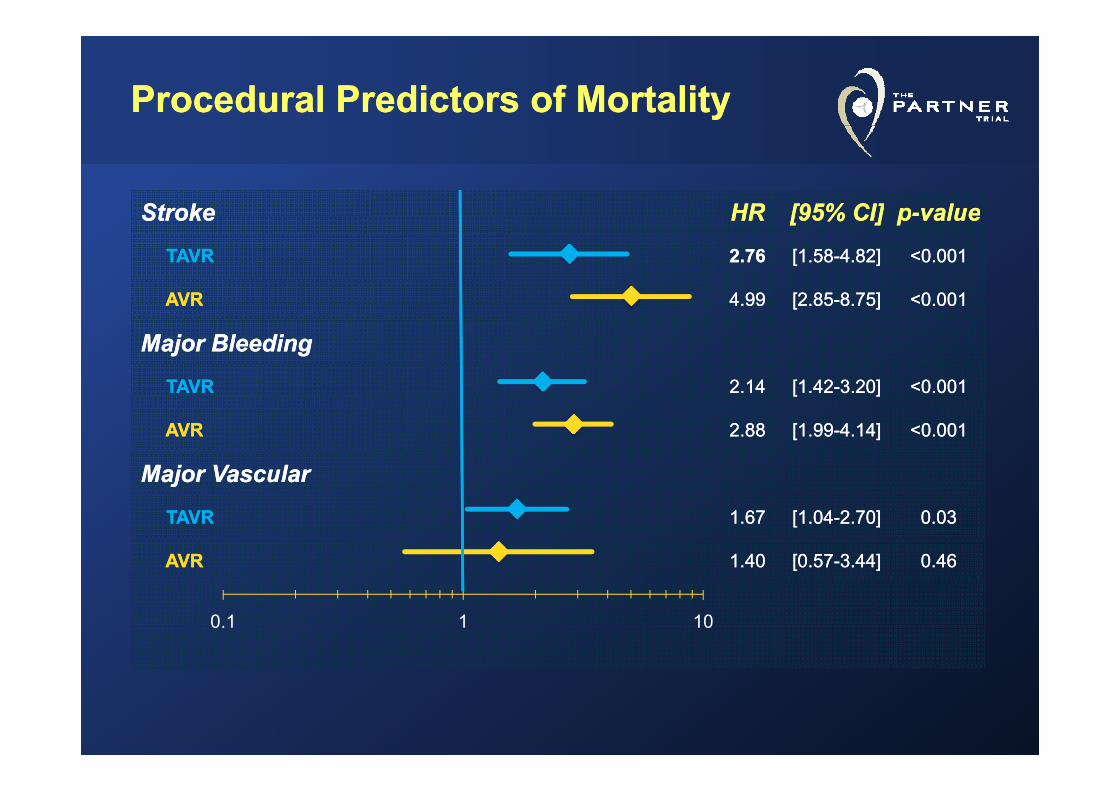
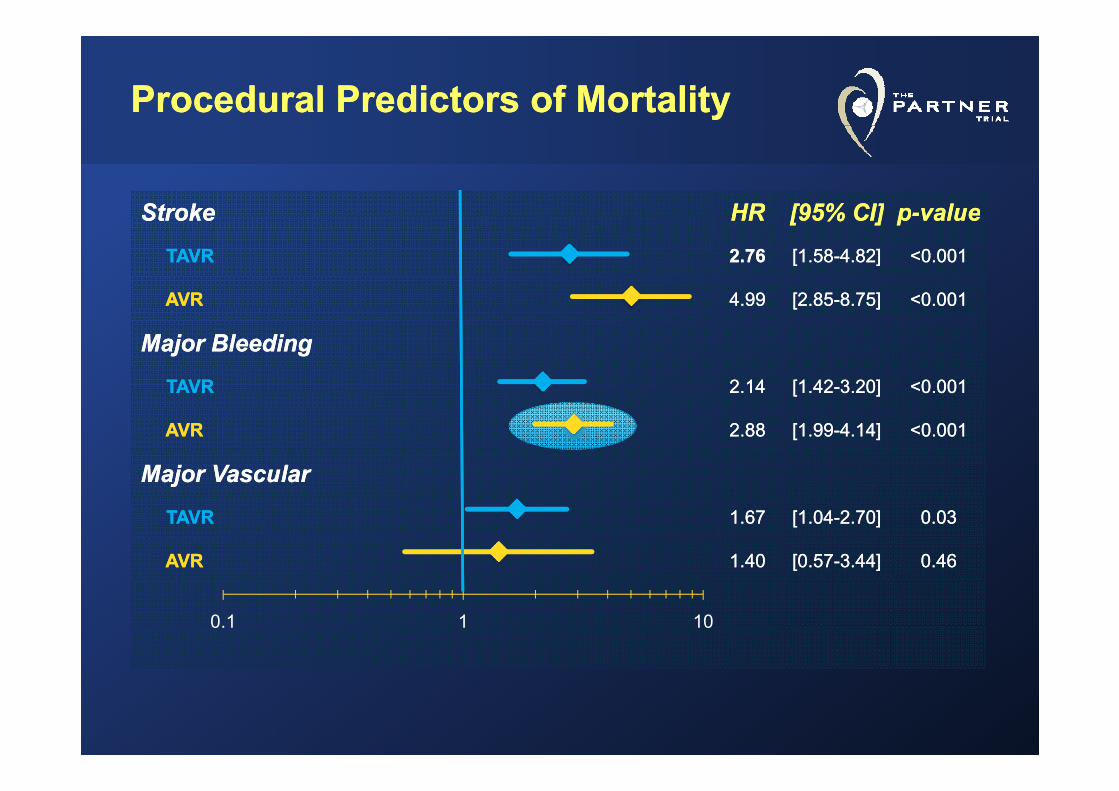
Procedural Predictors of MortalityProcedural Predictors of Mortality
StrokeStroke HRHR [95% CI][95% CI] pp--valuevalueStrokeStroke HRHR [95% CI][95% CI] pp valuevalue
TAVRTAVR 2.762.76 [1.58[1.58--4.82]4.82] <0.001<0.001
AVRAVR 4.994.99 [2.85[2.85--8.75]8.75] <0.001<0.0019999 [ 85[ 85 8 5]8 5] 0 000 00
Major BleedingMajor Bleeding
TAVRTAVR 2.142.14 [1.42[1.42--3.20]3.20] <0.001<0.001[[ ]]
AVRAVR 2.882.88 [1.99[1.99--4.14]4.14] <0.001<0.001
Major VascularMajor Vascularjj
TAVRTAVR 1.671.67 [1.04[1.04--2.70]2.70] 0.030.03
AVRAVR 1.40 1.40 [0.57[0.57--3.44]3.44] 0.460.46
0.1 1 10
Procedural Predictors of MortalityProcedural Predictors of Mortality
StrokeStroke HRHR [95% CI][95% CI] pp--valuevalueStrokeStroke HRHR [95% CI][95% CI] pp valuevalue
TAVRTAVR 2.762.76 [1.58[1.58--4.82]4.82] <0.001<0.001
AVRAVR 4.994.99 [2.85[2.85--8.75]8.75] <0.001<0.0019999 [ 85[ 85 8 5]8 5] 0 000 00
Major BleedingMajor Bleeding
TAVRTAVR 2.142.14 [1.42[1.42--3.20]3.20] <0.001<0.001[[ ]]
AVRAVR 22..8888 [1.99[1.99--4.14]4.14] <0.001<0.001
Major VascularMajor Vascularjj
TAVRTAVR 1.671.67 [1.04[1.04--2.70]2.70] 0.030.03
AVRAVR 1.40 1.40 [0.57[0.57--3.44]3.44] 0.460.46
0.1 1 10
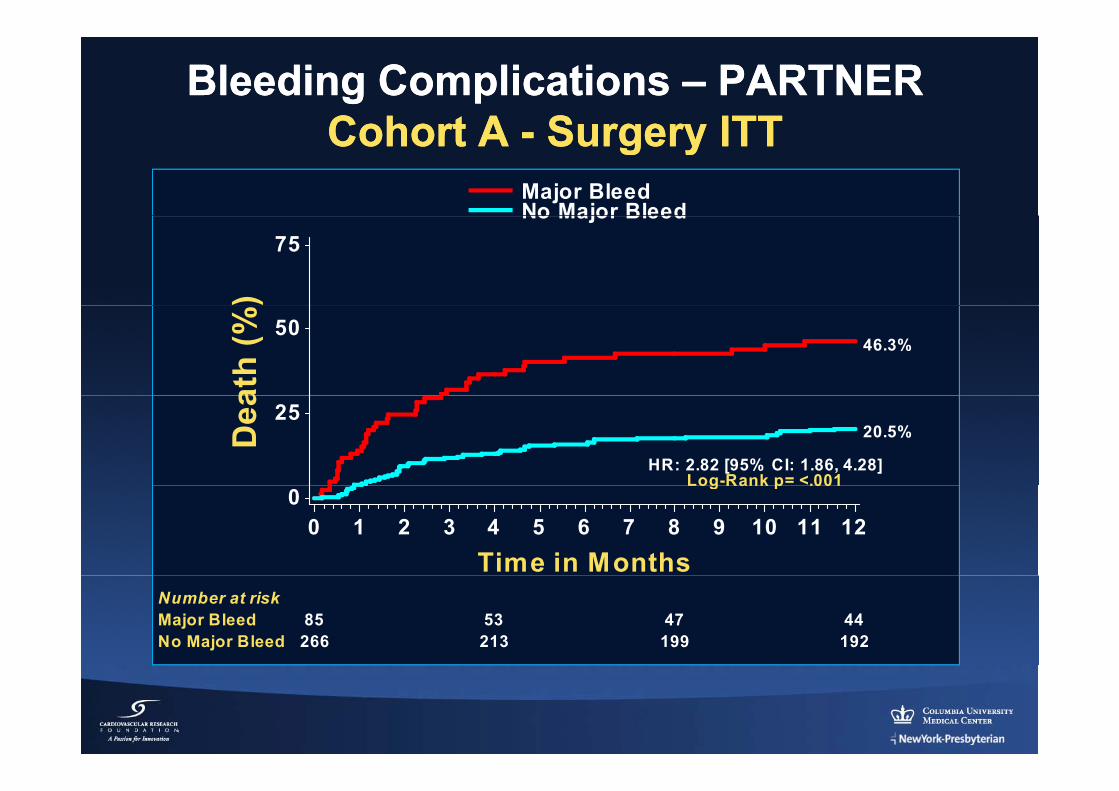
Bleeding Complications Bleeding Complications –– PARTNER PARTNER Cohort ACohort A Surgery ITTSurgery ITT
Major BleedNo Major Bleed
Cohort A Cohort A -- Surgery ITTSurgery ITT
)75
No Major Bleedat
h (% 50
46.3%
Dea 25
Log-Rank p= <.001HR: 2.82 [95% CI: 1.86, 4.28]
20.5%
0
Time in Months0 1 2 3 4 5 6 7 8 9 10 11 12
Log Rank p .001
85 53 47 44266 213 199 192
Number at riskMajor BleedNo Major Bleed
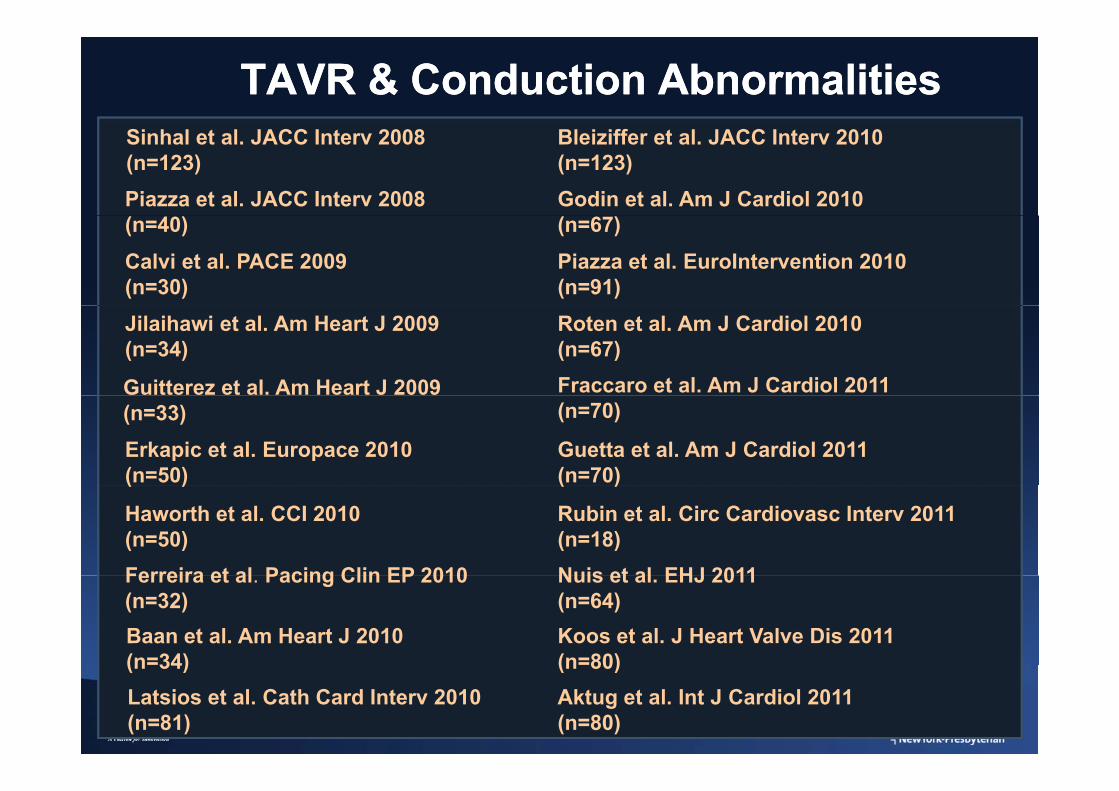
TAVR & Conduction AbnormalitiesTAVR & Conduction Abnormalities
Piazza et al. JACC Interv 2008
Bleiziffer et al. JACC Interv 2010 (n=123)
Sinhal et al. JACC Interv 2008 (n=123)
Godin et al. Am J Cardiol 2010 (n=40)Calvi et al. PACE 2009 (n=30)
Piazza et al. EuroIntervention 2010 (n=91)
(n=67)
Jilaihawi et al. Am Heart J 2009 (n=34)
Fraccaro et al. Am J Cardiol 2011
Roten et al. Am J Cardiol 2010 (n=67)
Guitterez et al. Am Heart J 2009
Erkapic et al. Europace 2010 (n=50)
(n=70)(n=33)Guetta et al. Am J Cardiol 2011 (n=70)( )
Ferreira et al Pacing Clin EP 2010
Haworth et al. CCI 2010 (n=50)
( )
Nuis et al EHJ 2011
Rubin et al. Circ Cardiovasc Interv 2011 (n=18)
Baan et al. Am Heart J 2010 (n=34)
Ferreira et al. Pacing Clin EP 2010 (n=32)
Nuis et al. EHJ 2011 (n=64)Koos et al. J Heart Valve Dis 2011 (n=80)(n 34)
Latsios et al. Cath Card Interv 2010 (n=81)
(n 80)Aktug et al. Int J Cardiol 2011 (n=80)
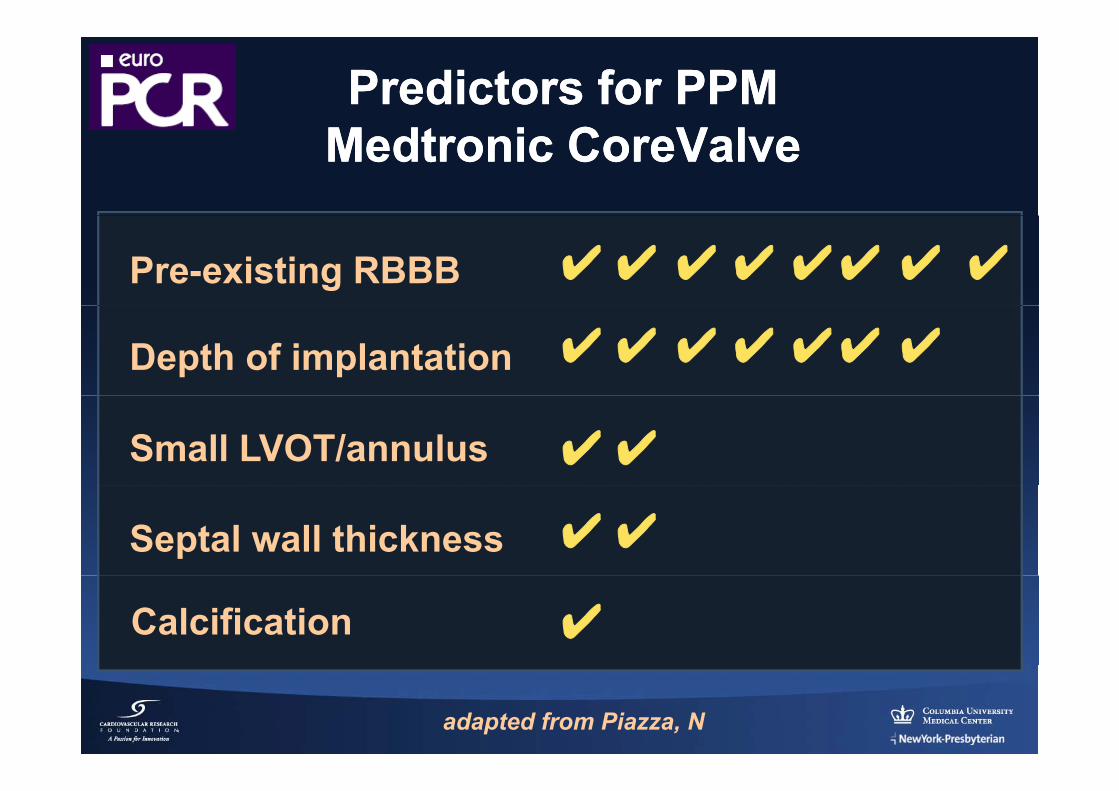
Predictors for PPMPredictors for PPMMedtronic CoreValveMedtronic CoreValve
Pre-existing RBBB ✔ ✔✔ ✔✔✔ ✔ ✔
Depth of implantation ✔ ✔✔ ✔ ✔✔ ✔
Small LVOT/annulus ✔✔
Septal wall thickness ✔✔
Calcification ✔
adapted from Piazza, N
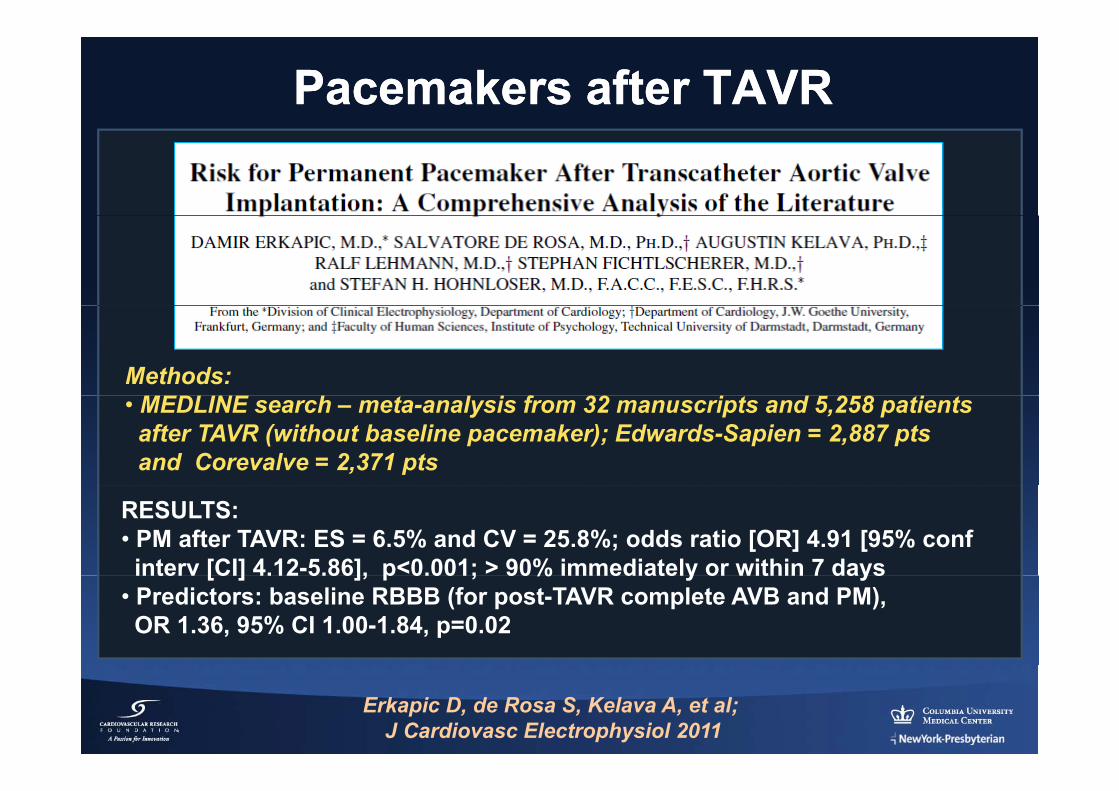
Pacemakers after TAVRPacemakers after TAVR
Methods: MEDLINE h l i f 32 i d 2 8 i• MEDLINE search – meta-analysis from 32 manuscripts and 5,258 patientsafter TAVR (without baseline pacemaker); Edwards-Sapien = 2,887 pts and Corevalve = 2,371 pts
RESULTS:• PM after TAVR: ES = 6.5% and CV = 25.8%; odds ratio [OR] 4.91 [95% confinterv [CI] 4.12-5.86], p<0.001; > 90% immediately or within 7 daysinterv [CI] 4.12 5.86], p 0.001; 90% immediately or within 7 days
• Predictors: baseline RBBB (for post-TAVR complete AVB and PM), OR 1.36, 95% CI 1.00-1.84, p=0.02
Erkapic D, de Rosa S, Kelava A, et al;J Cardiovasc Electrophysiol 2011
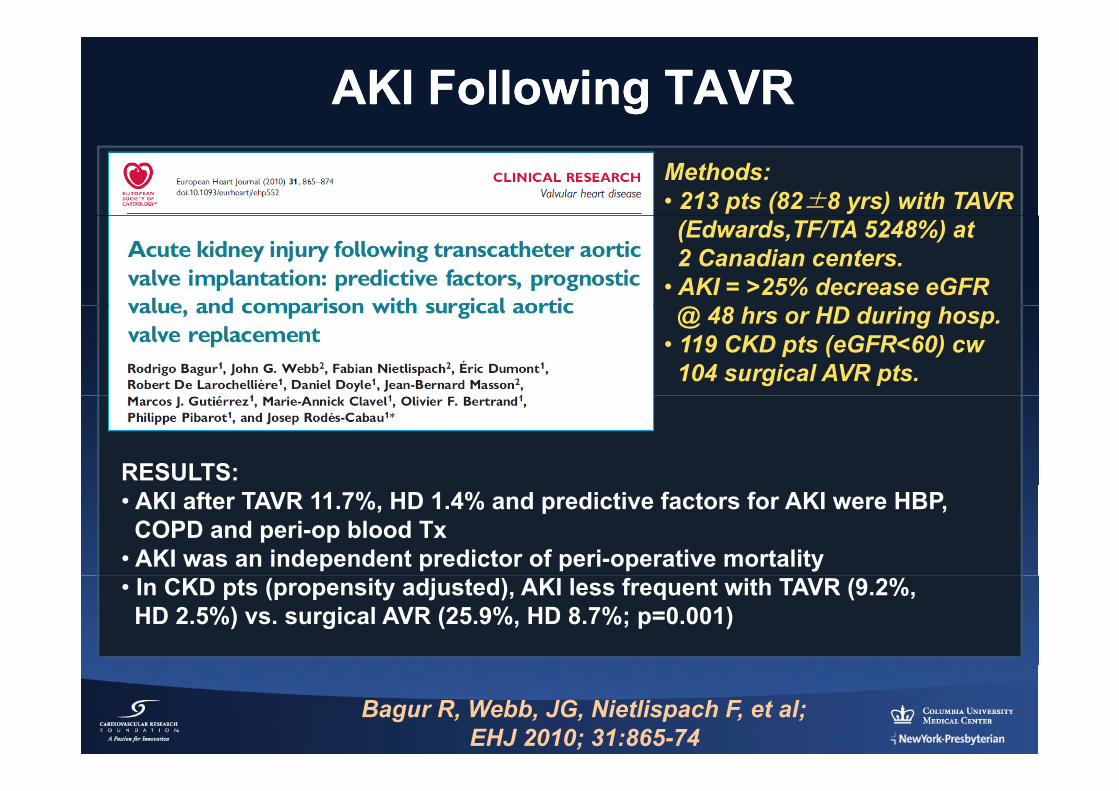
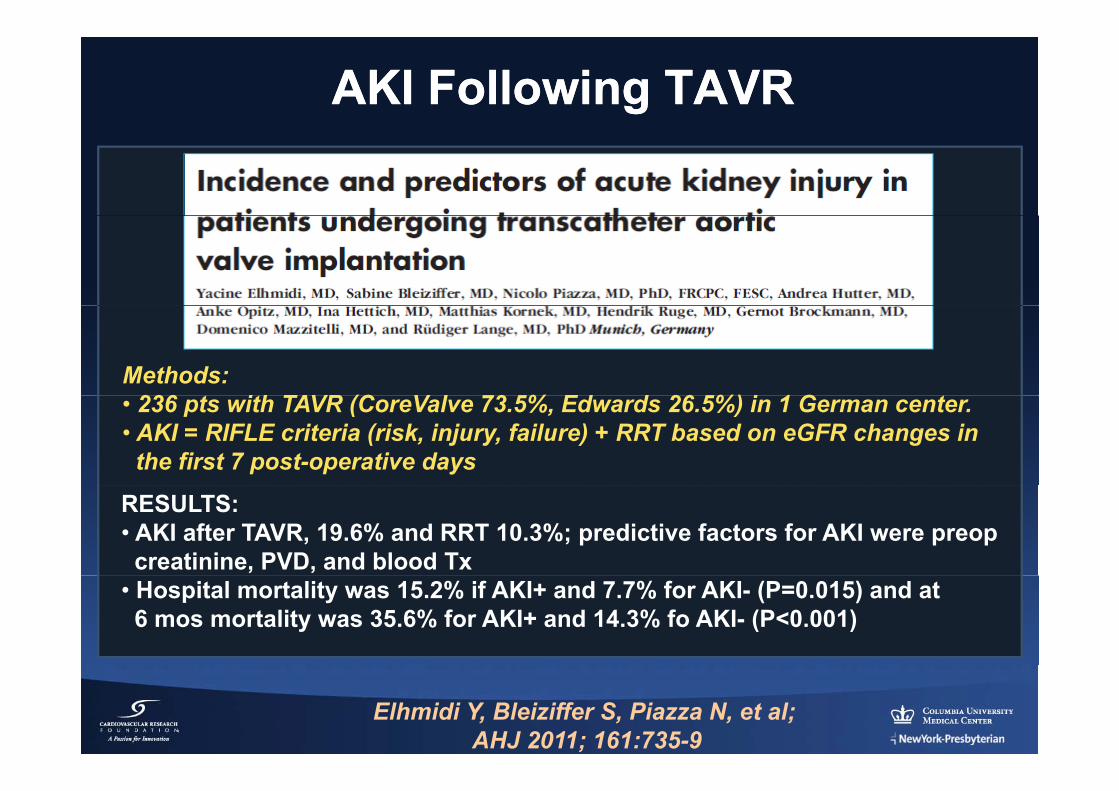
AKI Following TAVRAKI Following TAVRMethods: • 213 pts (82±8 yrs) with TAVR(Edwards,TF/TA 5248%) at 2 Canadian centers.
• AKI = >25% decrease eGFR@ 48 hrs or HD during hosp.
• 119 CKD pts (eGFR<60) cw104 surgical AVR pts.
RESULTS:• AKI after TAVR 11.7%, HD 1.4% and predictive factors for AKI were HBP,COPD and peri-op blood Tx
• AKI was an independent predictor of peri-operative mortality • In CKD pts (propensity adjusted), AKI less frequent with TAVR (9.2%, HD 2.5%) vs. surgical AVR (25.9%, HD 8.7%; p=0.001)
Bagur R, Webb, JG, Nietlispach F, et al;EHJ 2010; 31:865-74
AKI Following TAVRAKI Following TAVR
Methods: 236 t ith TAVR (C V l 73 5% Ed d 26 5%) i 1 G t• 236 pts with TAVR (CoreValve 73.5%, Edwards 26.5%) in 1 German center.
• AKI = RIFLE criteria (risk, injury, failure) + RRT based on eGFR changes inthe first 7 post-operative days
RESULTS:• AKI after TAVR, 19.6% and RRT 10.3%; predictive factors for AKI were preopcreatinine, PVD, and blood Tx
• Hospital mortality was 15.2% if AKI+ and 7.7% for AKI- (P=0.015) and at 6 mos mortality was 35.6% for AKI+ and 14.3% fo AKI- (P<0.001)
Elhmidi Y, Bleiziffer S, Piazza N, et al;AHJ 2011; 161:735-9
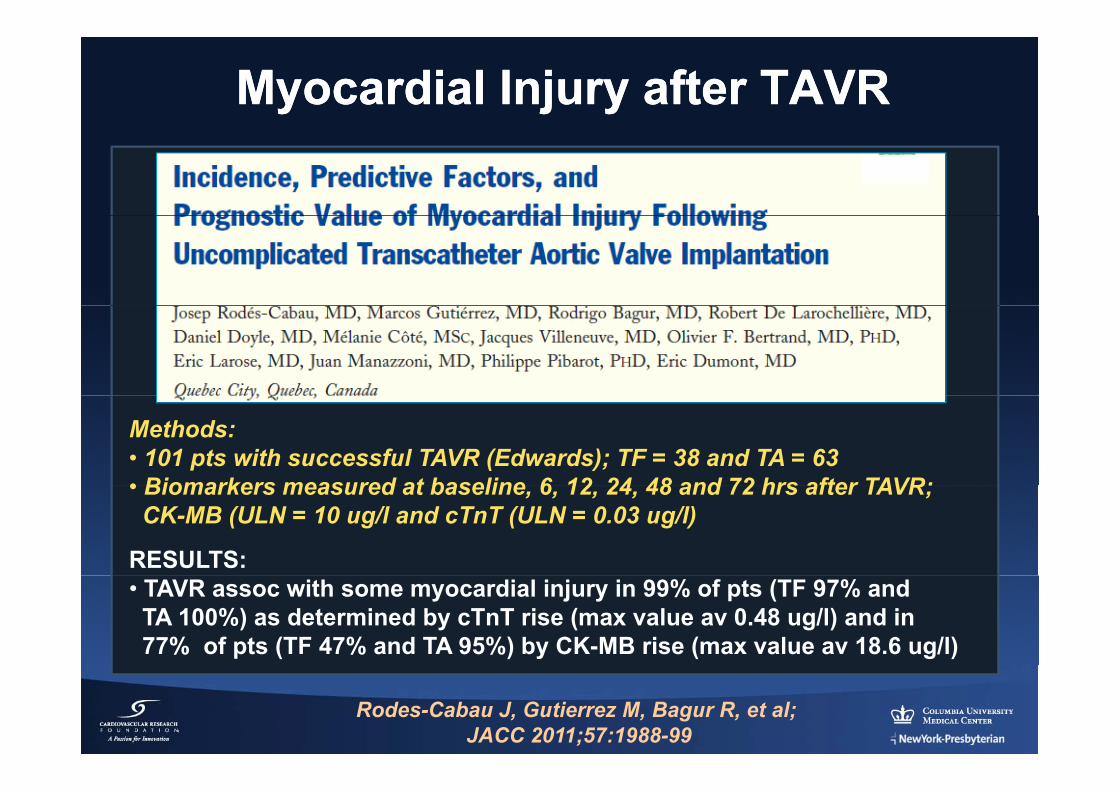
Myocardial Injury after TAVRMyocardial Injury after TAVR
Methods: • 101 pts with successful TAVR (Edwards); TF = 38 and TA = 63• Biomarkers measured at baseline 6 12 24 48 and 72 hrs after TAVR;• Biomarkers measured at baseline, 6, 12, 24, 48 and 72 hrs after TAVR;CK-MB (ULN = 10 ug/l and cTnT (ULN = 0.03 ug/l)
RESULTS:• TAVR assoc with some myocardial injury in 99% of pts (TF 97% andTA 100%) as determined by cTnT rise (max value av 0.48 ug/l) and in77% of pts (TF 47% and TA 95%) by CK-MB rise (max value av 18.6 ug/l)
Rodes-Cabau J, Gutierrez M, Bagur R, et al; JACC 2011;57:1988-99
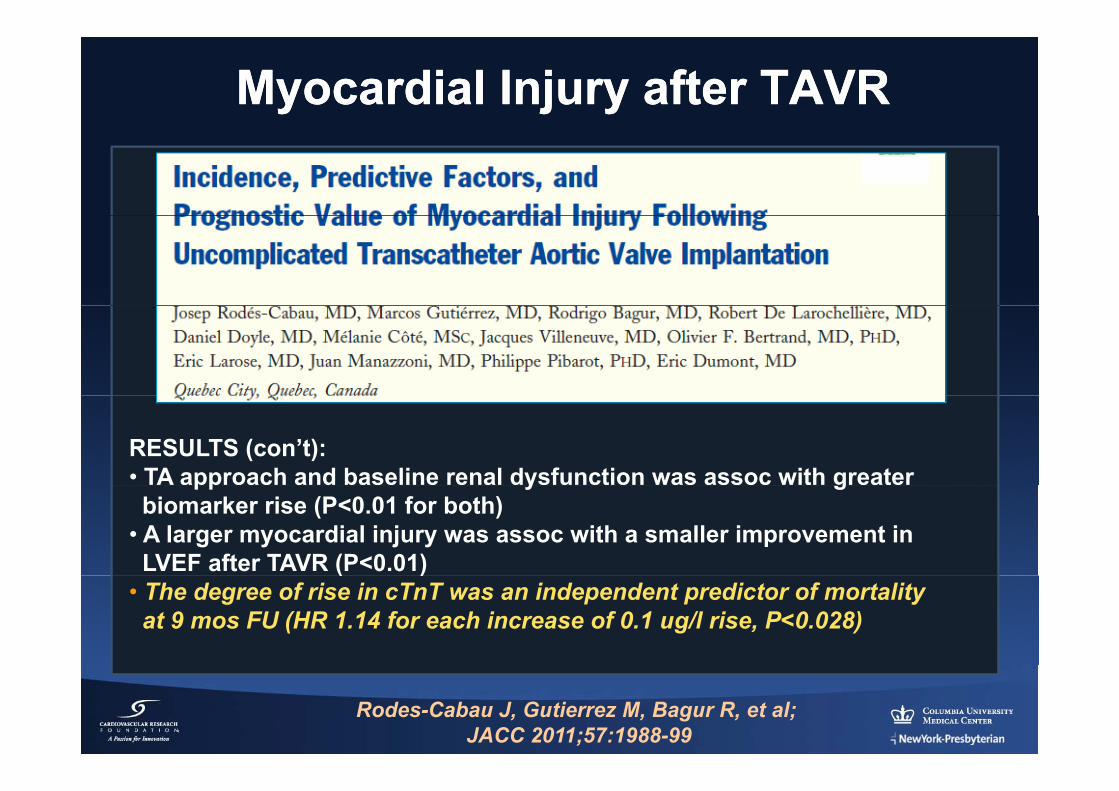
Myocardial Injury after TAVRMyocardial Injury after TAVR
RESULTS (con’t):• TA approach and baseline renal dysfunction was assoc with greaterpp y gbiomarker rise (P<0.01 for both)
• A larger myocardial injury was assoc with a smaller improvement in LVEF after TAVR (P<0.01)( )
• The degree of rise in cTnT was an independent predictor of mortalityat 9 mos FU (HR 1.14 for each increase of 0.1 ug/l rise, P<0.028)
Rodes-Cabau J, Gutierrez M, Bagur R, et al; JACC 2011;57:1988-99
TAVR in Review (TAVR in Review (20112011--12)12)
Adjunctive Adjunctive jjImagingImagingag gag g
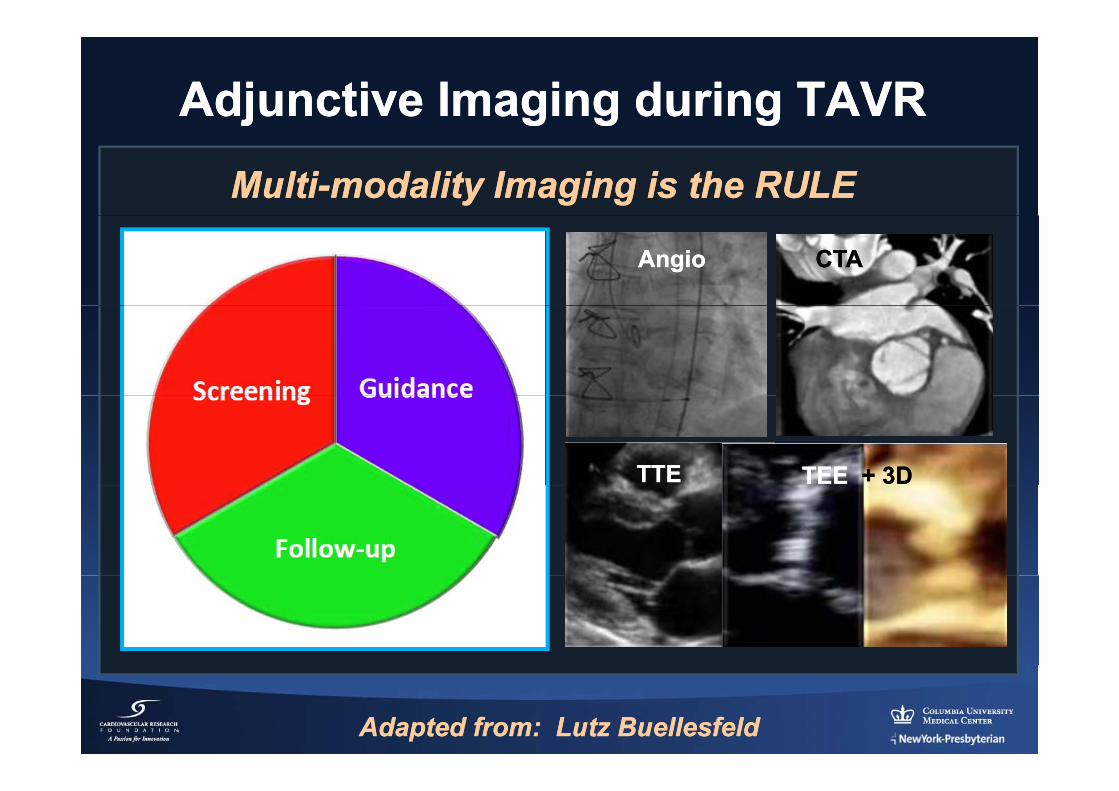
Adjunctive Imaging during TAVRAdjunctive Imaging during TAVRMultiMulti--modality Imaging is the RULEmodality Imaging is the RULE
AngioAngio CTACTA
TTETTE TEE TEE + 3D+ 3D
Adapted from: Lutz Adapted from: Lutz BuellesfeldBuellesfeld
Adjunctive Imaging during TAVRAdjunctive Imaging during TAVR
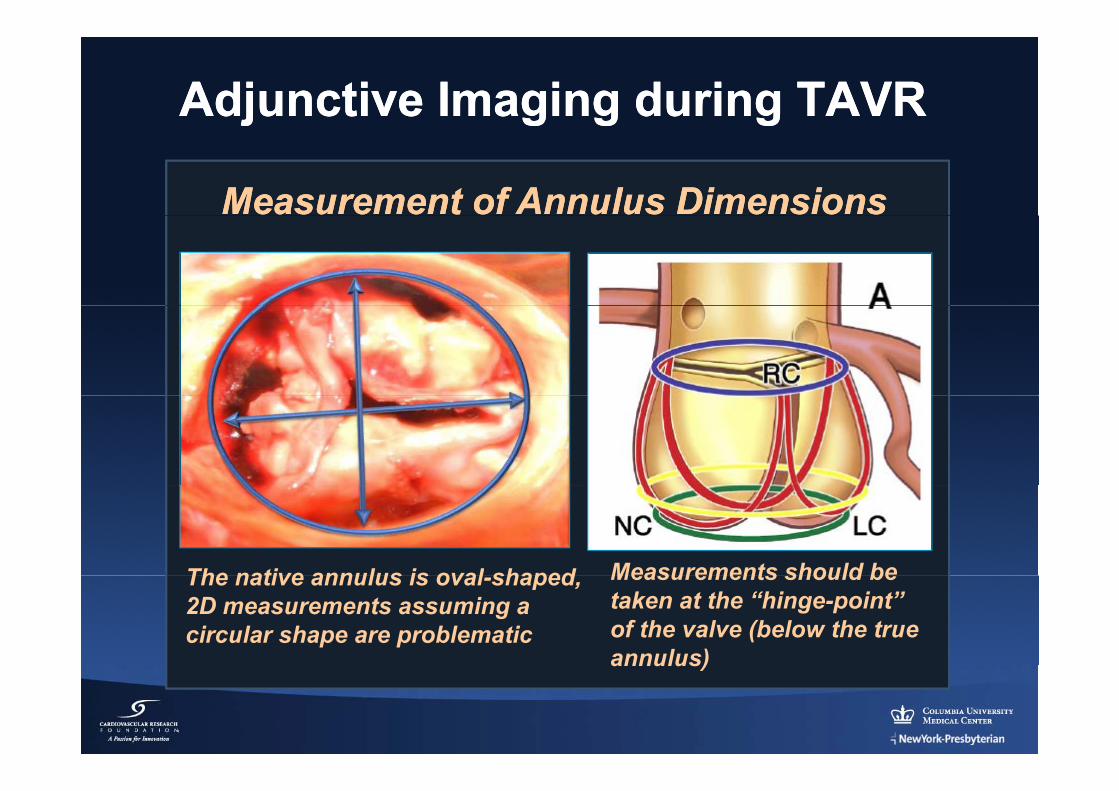
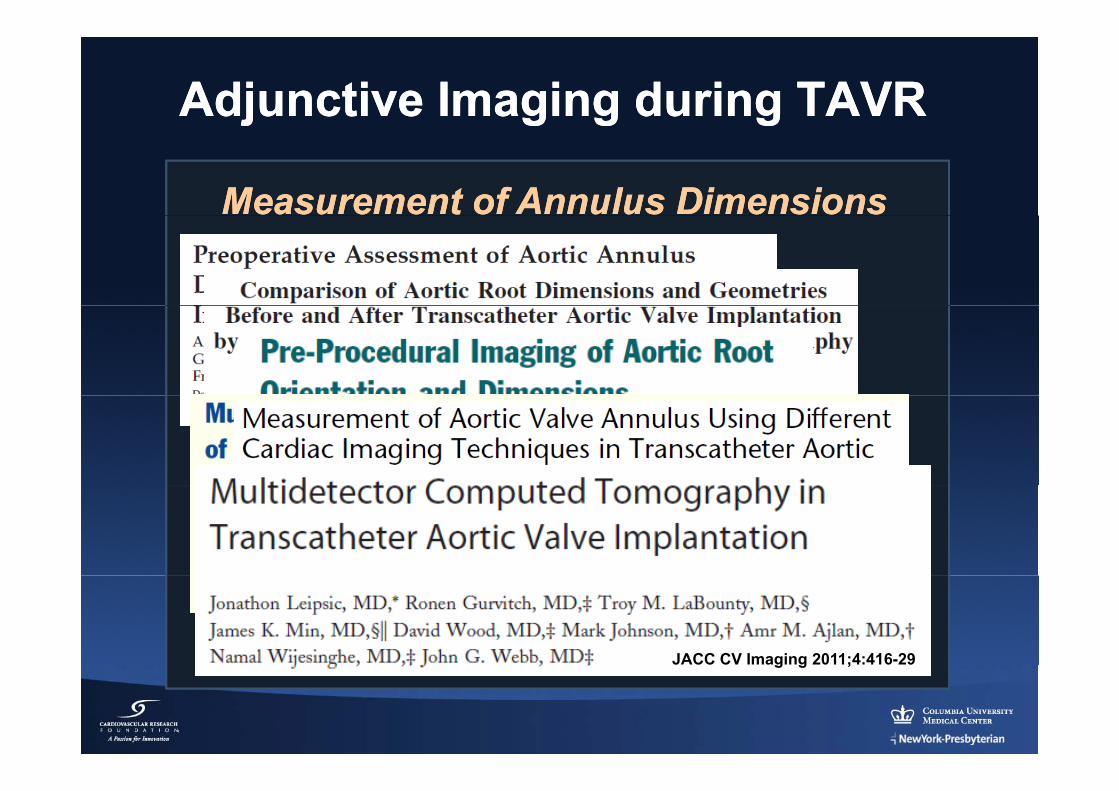
Measurement of Annulus DimensionsMeasurement of Annulus Dimensions
The native annulus is oval shaped Measurements should beThe native annulus is oval-shaped,2D measurements assuming a circular shape are problematic
Measurements should betaken at the “hinge-point”of the valve (below the trueannulus)annulus)
Adjunctive Imaging during TAVRAdjunctive Imaging during TAVR
Measurement of Annulus DimensionsMeasurement of Annulus Dimensions
Ann Thorac Surg 2011;91:709-15
Circ CV Imaging 2010;3:94-102
JACC CV Interv 2010;3:105-13
JACC 2010;55:186-94
Echocardiography 2011;28:388-96JACC CV Imaging 2011;4:416-29Echocardiography 2011;28:388 96 g g ;
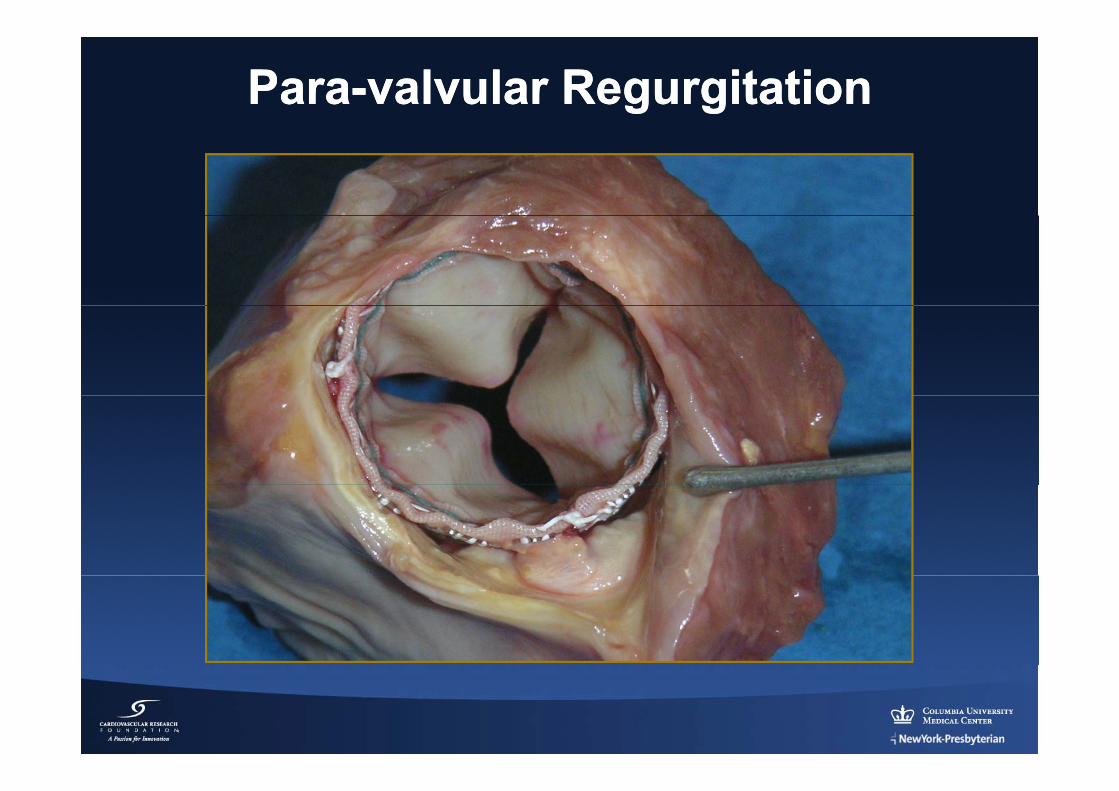
ParaPara--valvular Regurgitation valvular Regurgitation
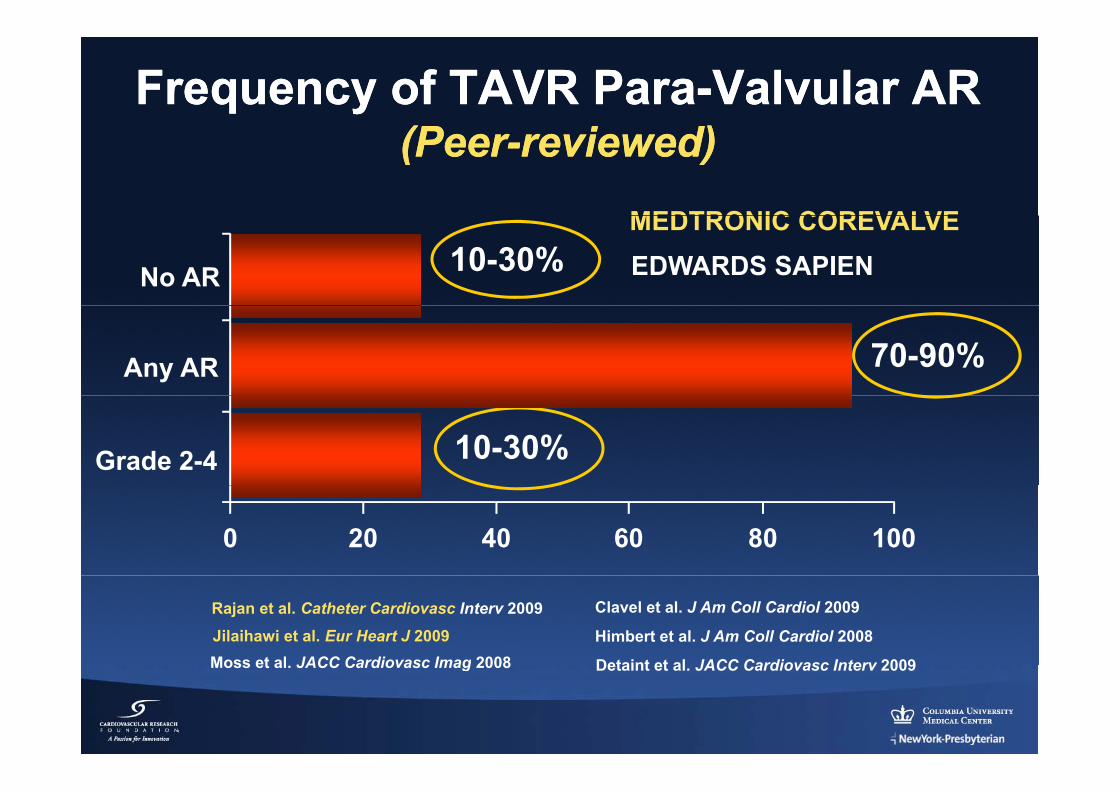
Frequency of TAVR ParaFrequency of TAVR Para--ValvularValvular ARAR(P(P i d)i d)(Peer(Peer--reviewed)reviewed)
MEDTRONIC COREVALVE10-30%
MEDTRONIC COREVALVEEDWARDS SAPIENNo AR
70-90%Any AR
10-30%Grade 2-4
0 20 40 60 80 100
Detaint et al JACC Cardiovasc Interv 2009
Clavel et al. J Am Coll Cardiol 2009
Moss et al JACC Cardiovasc Imag 2008Himbert et al. J Am Coll Cardiol 2008Jilaihawi et al. Eur Heart J 2009
Rajan et al. Catheter Cardiovasc Interv 2009
Detaint et al. JACC Cardiovasc Interv 2009Moss et al. JACC Cardiovasc Imag 2008
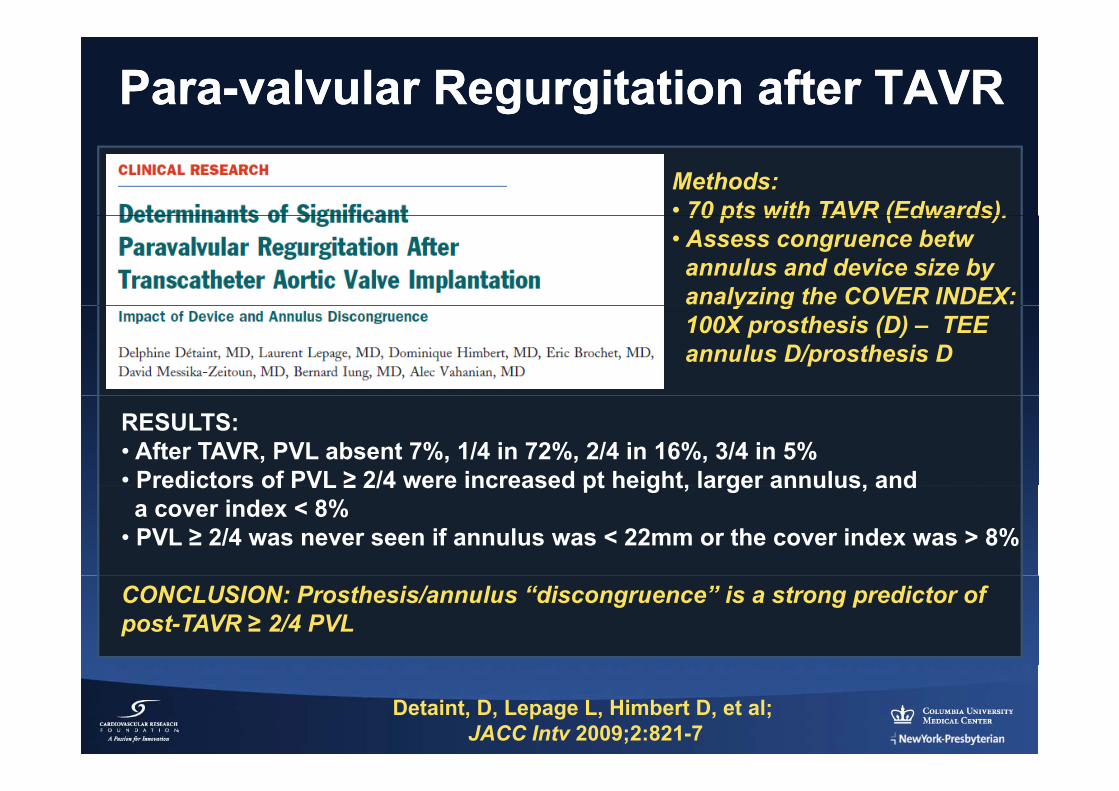
ParaPara--valvular Regurgitation after TAVRvalvular Regurgitation after TAVR
Methods: • 70 pts with TAVR (Edwards).70 pts with TAVR (Edwards).• Assess congruence betwannulus and device size byanalyzing the COVER INDEX:y g100X prosthesis (D) – TEEannulus D/prosthesis D
RESULTS:• After TAVR, PVL absent 7%, 1/4 in 72%, 2/4 in 16%, 3/4 in 5%• Predictors of PVL ≥ 2/4 were increased pt height, larger annulus, andPredictors of PVL ≥ 2/4 were increased pt height, larger annulus, anda cover index < 8%
• PVL ≥ 2/4 was never seen if annulus was < 22mm or the cover index was > 8%
CONCLUSION: Prosthesis/annulus “discongruence” is a strong predictor of post-TAVR ≥ 2/4 PVL
Detaint, D, Lepage L, Himbert D, et al;JACC Intv 2009;2:821-7
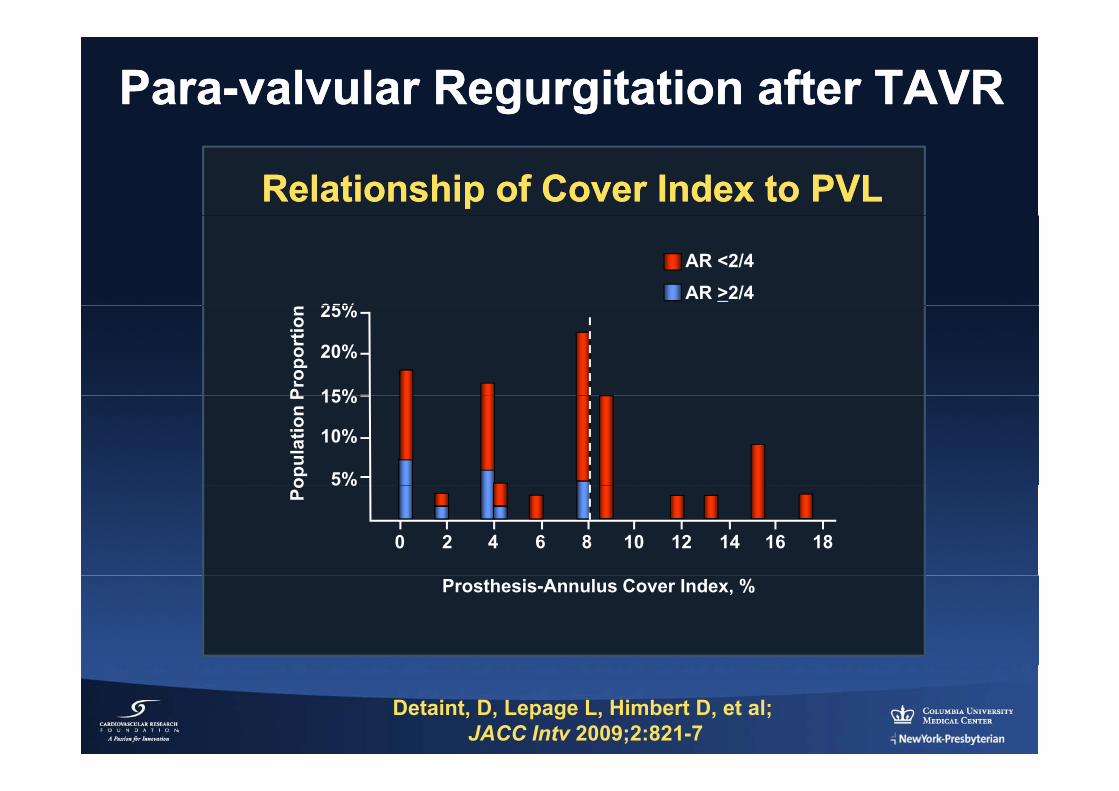
ParaPara--valvular Regurgitation after TAVRvalvular Regurgitation after TAVR
Relationship of Cover Index to PVLRelationship of Cover Index to PVL
AR <2/4AR >2/4
25%Pr
opor
tion 25%
20%
15%
opul
atio
n P 15%
10%
5%
Po
5%
0 2 4 6 8 10 12 14 16 18
Prosthesis-Annulus Cover Index, %
Detaint, D, Lepage L, Himbert D, et al;JACC Intv 2009;2:821-7
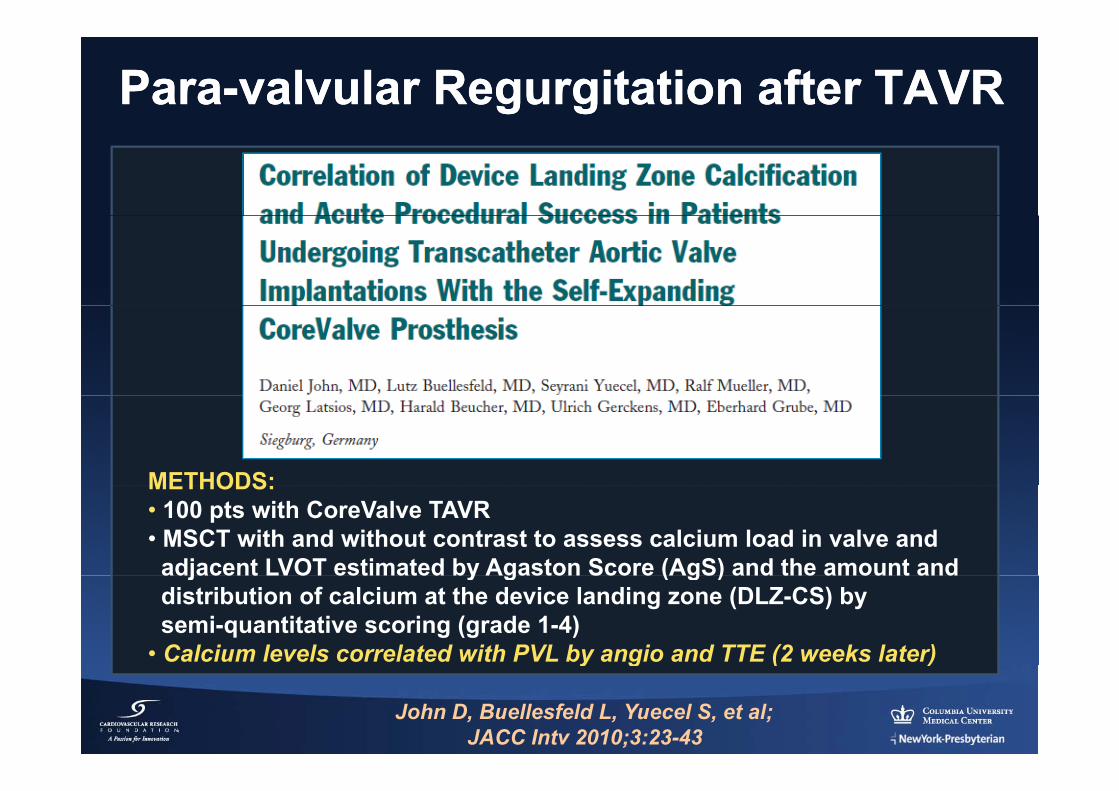
ParaPara--valvular Regurgitation after TAVRvalvular Regurgitation after TAVR
METHODS:METHODS: • 100 pts with CoreValve TAVR• MSCT with and without contrast to assess calcium load in valve andadjacent LVOT estimated by Agaston Score (AgS) and the amount andadjacent LVOT estimated by Agaston Score (AgS) and the amount anddistribution of calcium at the device landing zone (DLZ-CS) by semi-quantitative scoring (grade 1-4)
• Calcium levels correlated with PVL by angio and TTE (2 weeks later)y g ( )
John D, Buellesfeld L, Yuecel S, et al; JACC Intv 2010;3:23-43
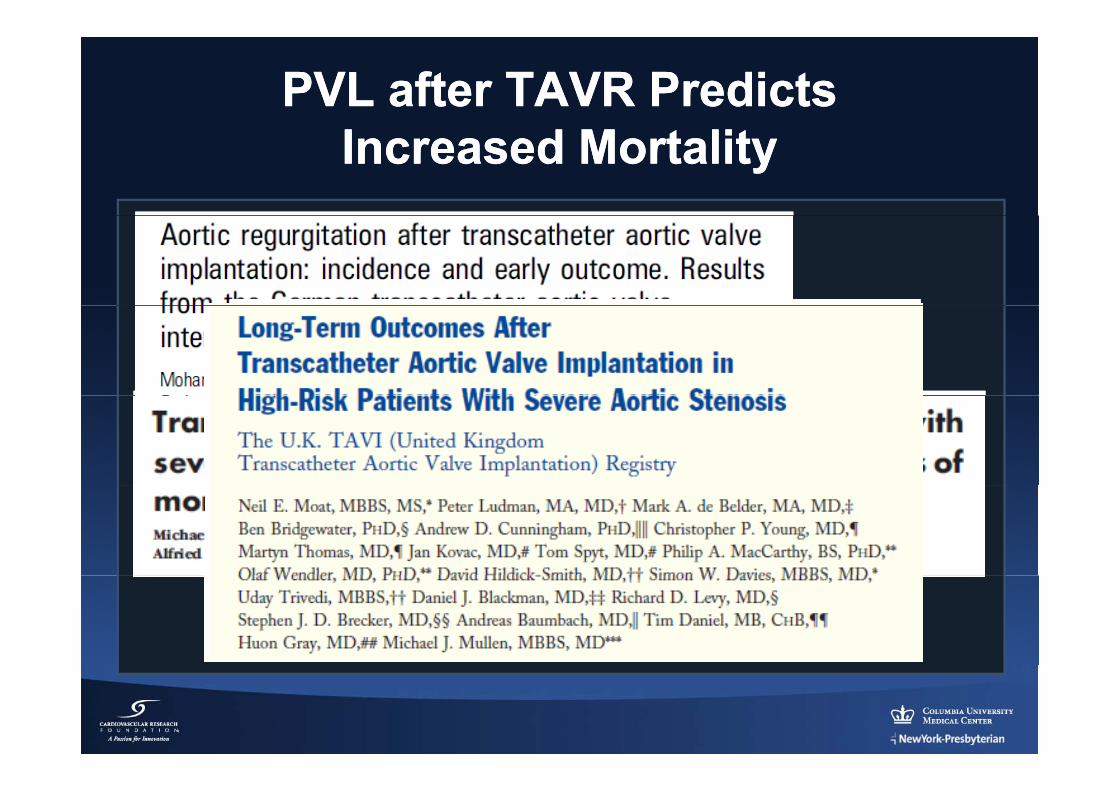
PVL after TAVR PredictsPVL after TAVR PredictsIncreased MortalityIncreased Mortality
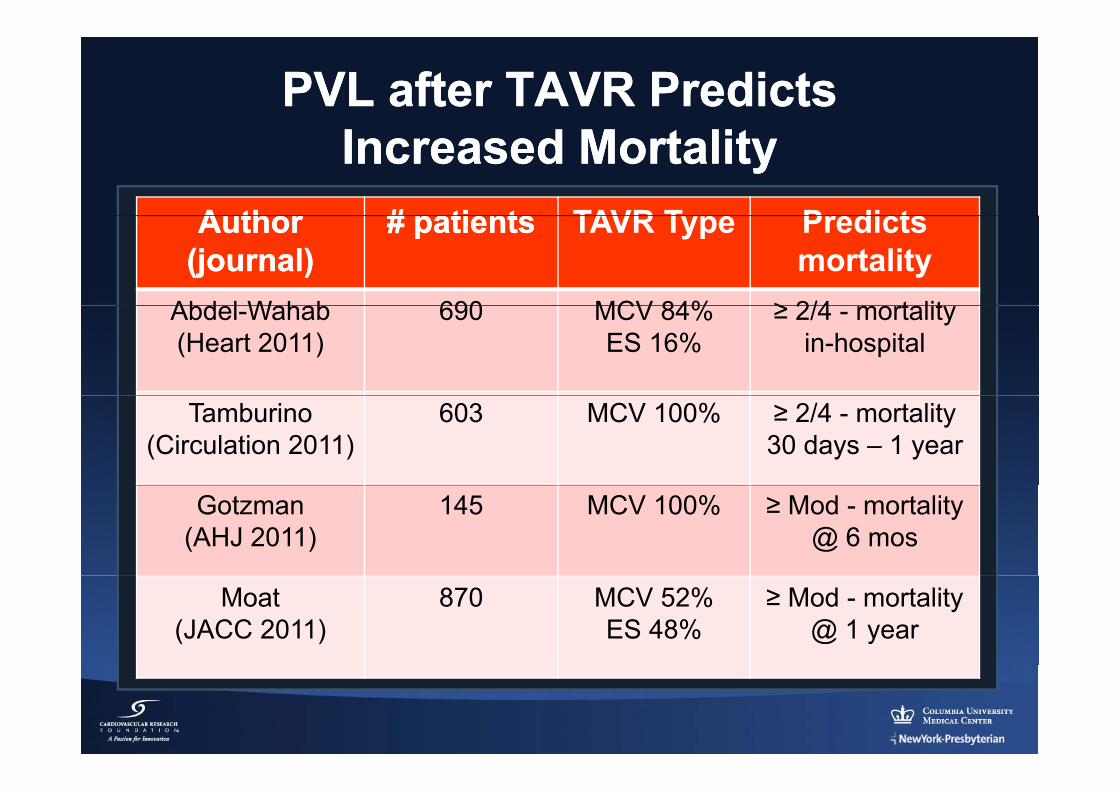
PVL after TAVR Predicts PVL after TAVR Predicts Increased MortalityIncreased Mortality
A thorA thor # patients# patients TAVR T pe PredictsAuthor Author (journal)(journal)
# patients# patients TAVR Type Predicts mortality
Abdel Wahab 690 MCV 84% ≥ 2/4 mortalitAbdel-Wahab(Heart 2011)
690 MCV 84%ES 16%
≥ 2/4 - mortalityin-hospital
Tamburino(Circulation 2011)
603 MCV 100% ≥ 2/4 - mortality 30 days – 1 year
Gotzman(AHJ 2011)
145 MCV 100% ≥ Mod - mortality @ 6 mos
Moat(JACC 2011)
870 MCV 52%ES 48%
≥ Mod - mortality@ 1 year
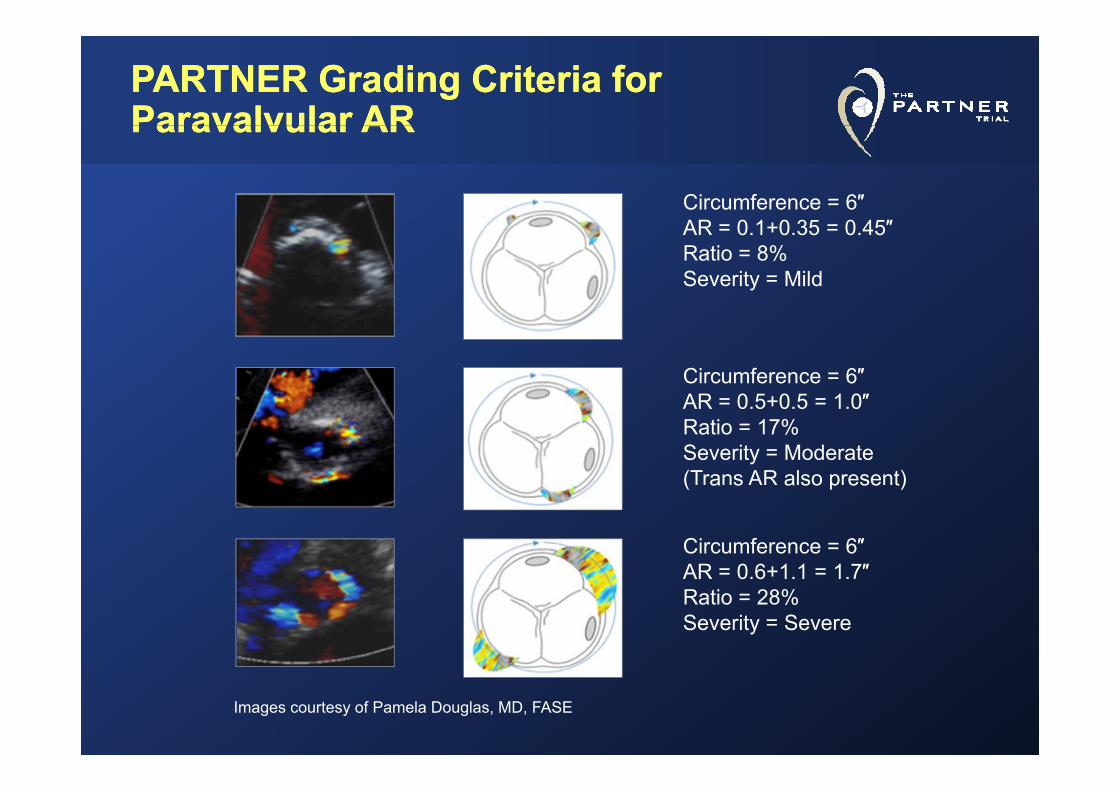
PARTNER Grading PARTNER Grading CCriteria riteria for for ParavalvularParavalvular ARARParavalvularParavalvular AR AR
Circumference = 6″AR = 0.1+0.35 = 0.45″Ratio = 8%Severity = Mild
Circumference = 6″AR 0 5 0 5 1 0″AR = 0.5+0.5 = 1.0″Ratio = 17%Severity = Moderate (Trans AR also present)( a s a so p ese t)
Circumference = 6″AR = 0 6+1 1 = 1 7″AR 0.6+1.1 1.7Ratio = 28%Severity = Severe
Images courtesy of Pamela Douglas, MD, FASE
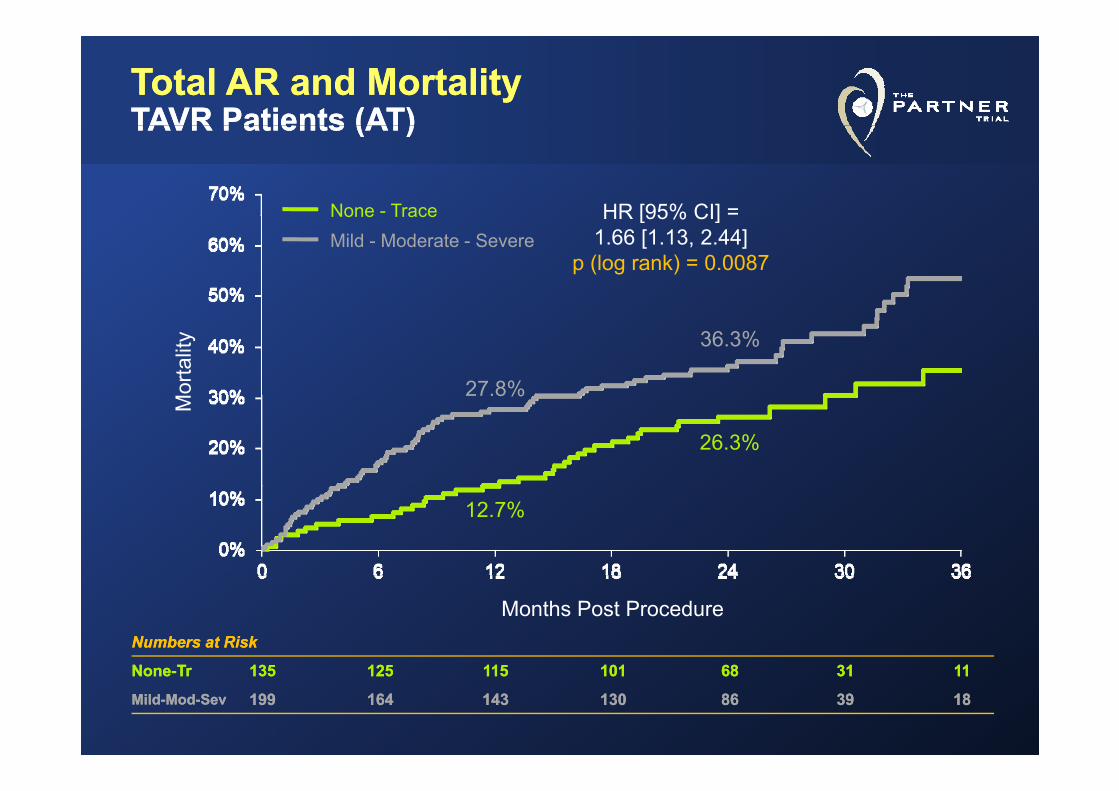
Total AR and MortalityTotal AR and MortalityTAVR Patients (ATTAVR Patients (AT))
HR [95% CI] =None - Trace
TAVR Patients (ATTAVR Patients (AT))
HR [95% CI] 1.66 [1.13, 2.44]
p (log rank) = 0.0087
None TraceMild - Moderate - Severe
27.8%
36.3%
orta
lity
27.8%
26.3%
M
12.7%
Months Post ProcedureNumbers at RiskNumbers at Risk
NN TT 135135 125125 115115 101101 6868 3131 1111NoneNone--TrTr 135135 125125 115115 101101 6868 3131 1111
MildMild--ModMod--SevSev 199199 164164 143143 130130 8686 3939 1818
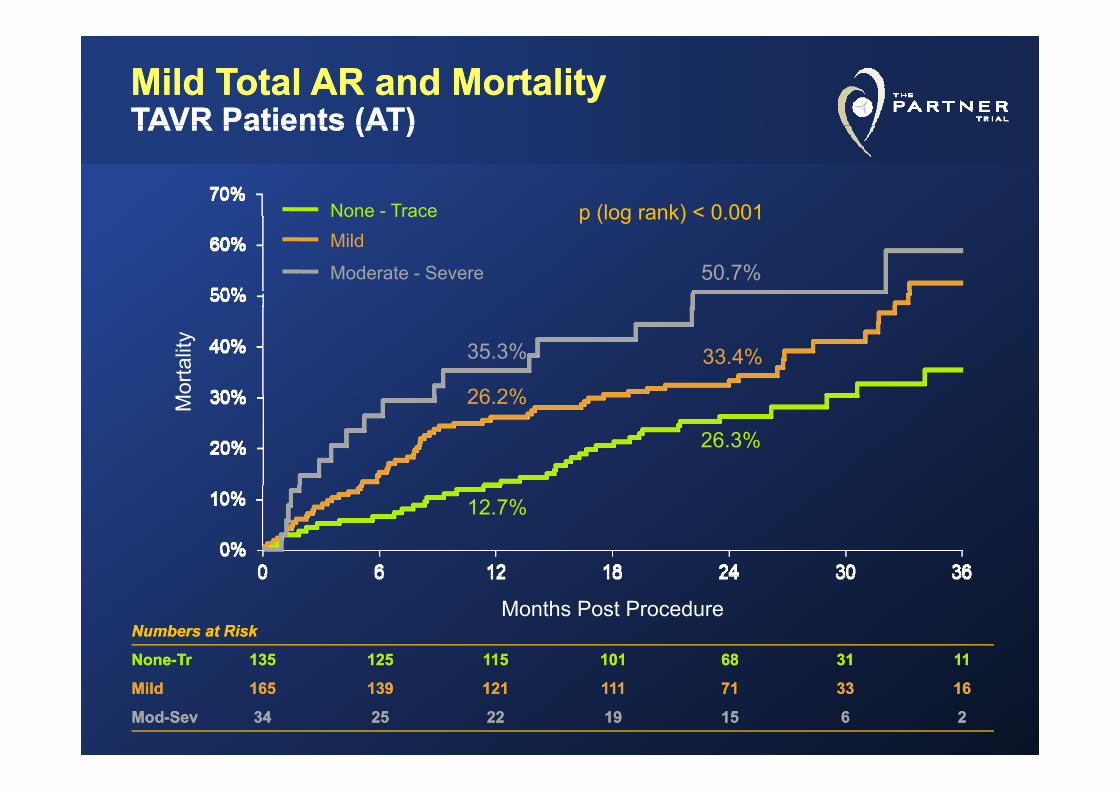
Mild Total AR and MortalityMild Total AR and MortalityTAVR Patients (AT)TAVR Patients (AT)TAVR Patients (AT)TAVR Patients (AT)
None - Trace p (log rank) < 0 001
50.7%
None TraceMild
Moderate - Severe
p (log rank) < 0.001
33.4%35.3%
26 2%orta
lity
26.3%
26.2%M
12.7%
Months Post ProcedureNumbers at RiskNumbers at Risk
NoneNone--TrTr 135135 125125 115115 101101 6868 3131 1111NoneNone TrTr 135135 125125 115115 101101 6868 3131 1111
MildMild 165165 139139 121121 111111 7171 3333 1616
ModMod--SevSev 3434 2525 2222 1919 1515 66 22
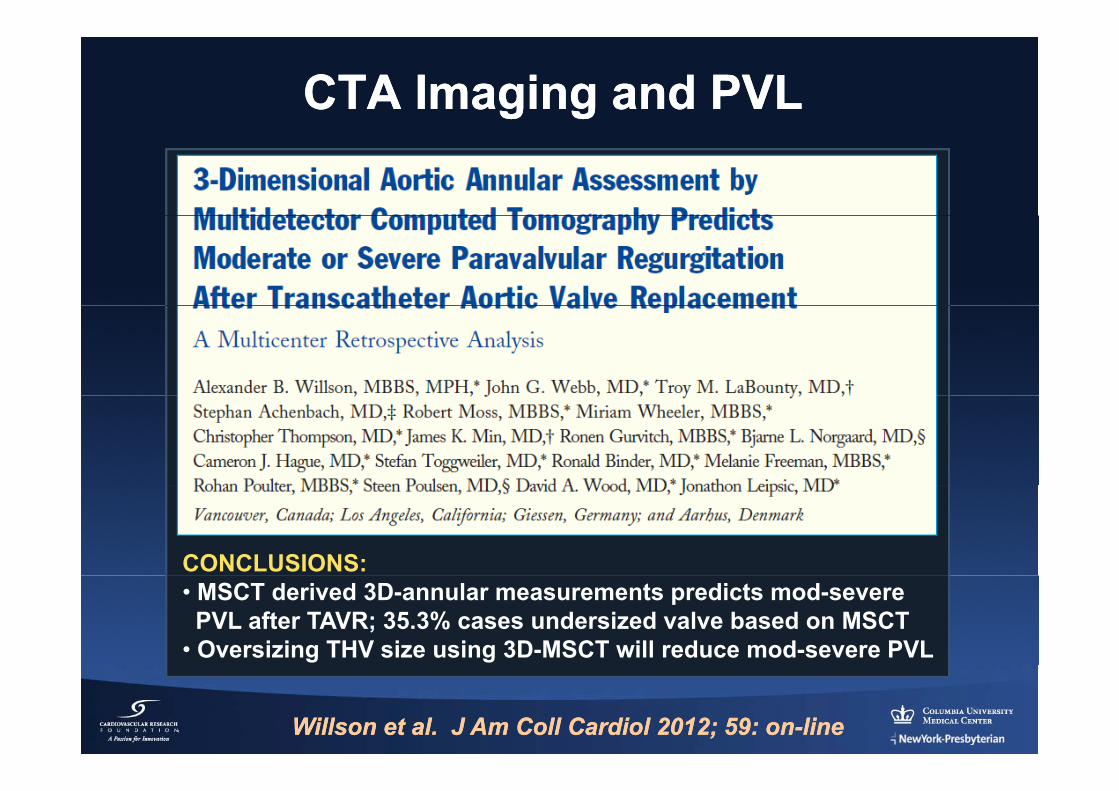
CTA Imaging and PVLCTA Imaging and PVL
CONCLUSIONS:• MSCT derived 3D-annular measurements predicts mod-severePVL after TAVR; 35.3% cases undersized valve based on MSCT
• Oversizing THV size using 3D-MSCT will reduce mod-severe PVL
WillsonWillson et al. J Am et al. J Am CollColl CardiolCardiol 2012; 59: on2012; 59: on--lineline
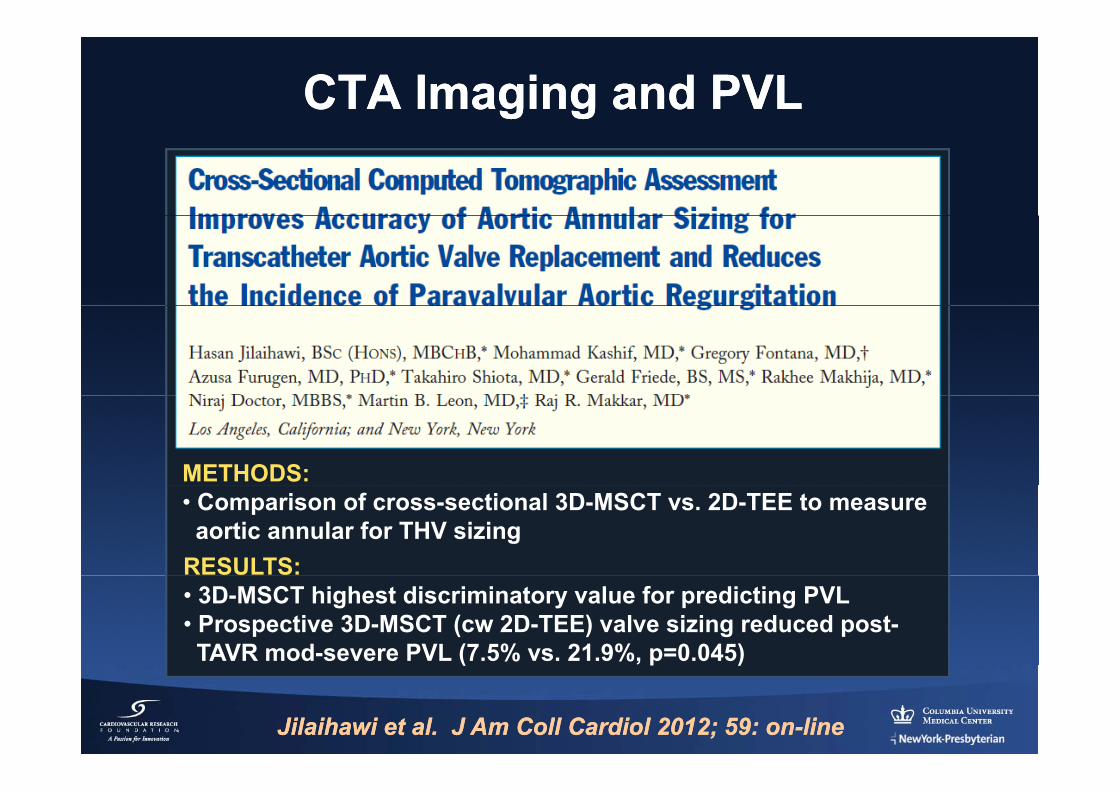
CTA Imaging and PVLCTA Imaging and PVL
METHODS:• Comparison of cross-sectional 3D-MSCT vs. 2D-TEE to measureaortic annular for THV sizing
RESULTS:• 3D-MSCT highest discriminatory value for predicting PVL• Prospective 3D-MSCT (cw 2D-TEE) valve sizing reduced post-TAVR mod-severe PVL (7.5% vs. 21.9%, p=0.045)
Jilaihawi et al. J Am Jilaihawi et al. J Am CollColl CardiolCardiol 2012; 59: on2012; 59: on--lineline
( p )
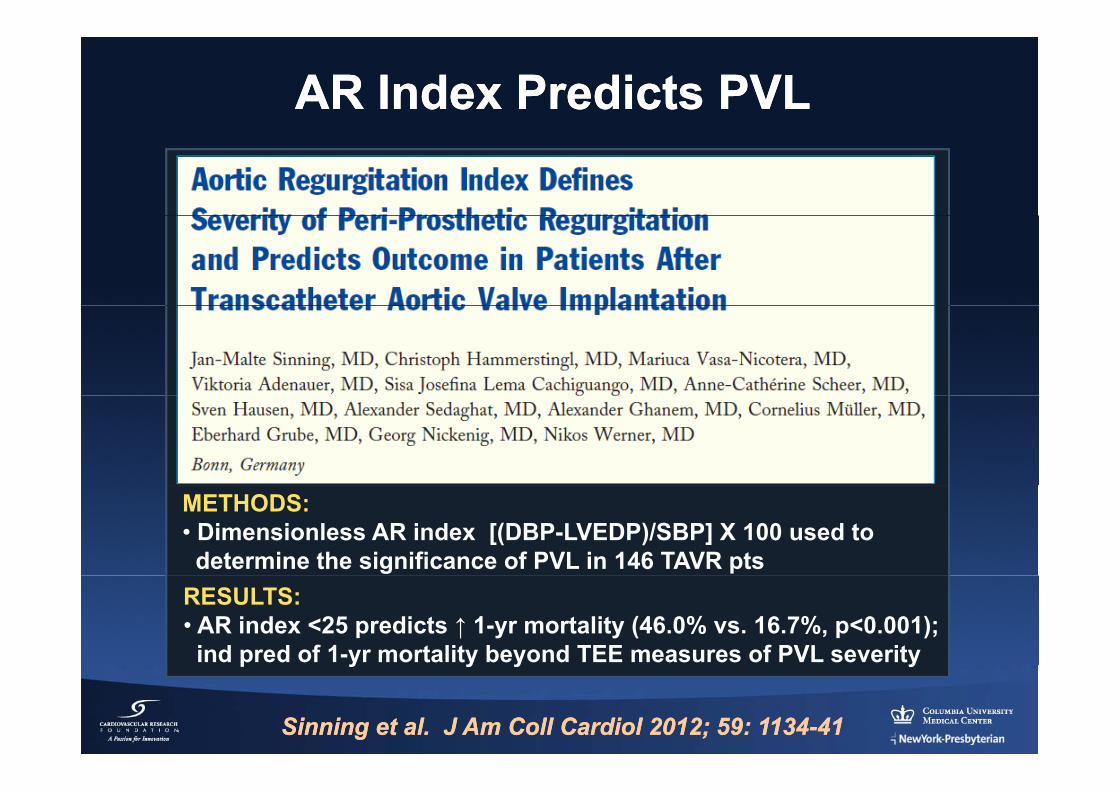
AR Index Predicts PVLAR Index Predicts PVL
METHODS:• Dimensionless AR index [(DBP-LVEDP)/SBP] X 100 used todetermine the significance of PVL in 146 TAVR pts
RESULTS:• AR index <25 predicts ↑ 1-yr mortality (46.0% vs. 16.7%, p<0.001);ind pred of 1-yr mortality beyond TEE measures of PVL severity
Sinning et al. J Am Sinning et al. J Am CollColl CardiolCardiol 2012; 59: 11342012; 59: 1134--4141
p y y y y
TAVR in Review (TAVR in Review (20112011--12)12)
NewNewTechnologyTechnology
New TAVR (and “Related”)New TAVR (and “Related”)Technologies Technologies
•• New TAVR SystemsNew TAVR Systems
•• Access and Closure StrategiesAccess and Closure Strategiesgg
•• Cerebral Embolic Protection DevicesCerebral Embolic Protection Devices•• Cerebral Embolic Protection DevicesCerebral Embolic Protection Devices
•• Advanced Imaging ModalitiesAdvanced Imaging Modalities
New TAVI Systems New TAVI Systems -- TransfemoralTransfemoral
Direct FlowDirect FlowSadraSadraSt. JudeSt. JudeAorTxAorTxAorTx AorTx HLTHLTEndoTechEndoTechABPS PercValveABPS PercValve
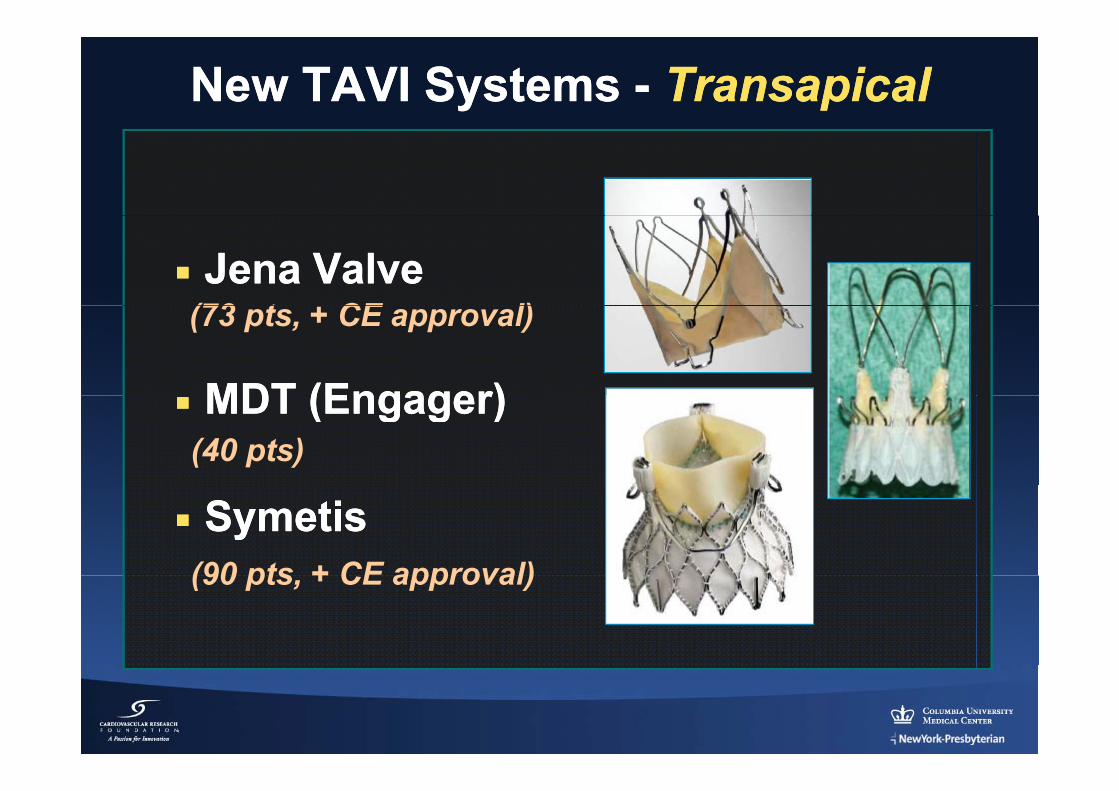
New TAVI Systems New TAVI Systems -- TransapicalTransapical
Jena ValveJena Valve(73 t CE l)
MDT (Engager)MDT (Engager)
(73 pts, + CE approval)
MDT (Engager) MDT (Engager) (40 pts)
SymetisSymetis(90 pts + CE approval)(90 pts, + CE approval)
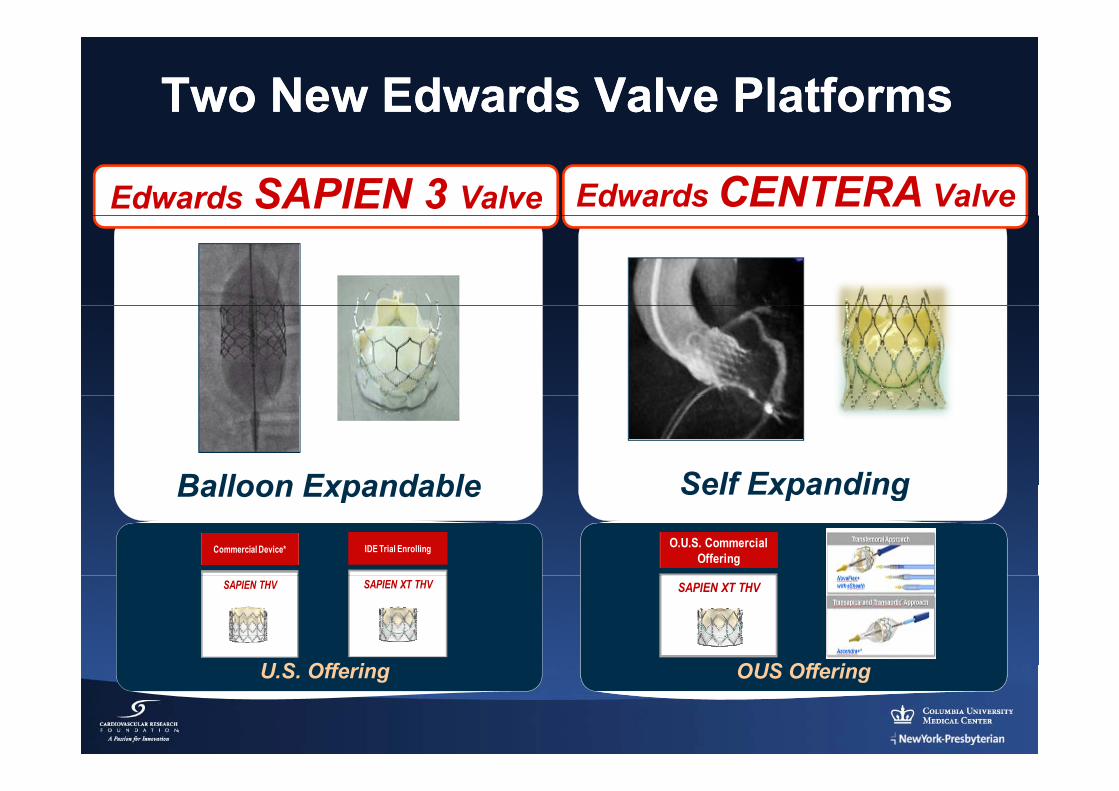
Two New Edwards Valve PlatformsTwo New Edwards Valve Platforms
Edwards CENTERA ValveEdwards SAPIEN 3 Valve
Self ExpandingBalloon Expandable
Commercial Device* IDE Trial Enrolling O.U.S. Commercial Offering
Self ExpandingBalloon Expandable
U S Off i
SAPIEN THV
OUS Off i
SAPIEN XT THV SAPIEN XT THV
U.S. Offering OUS Offering
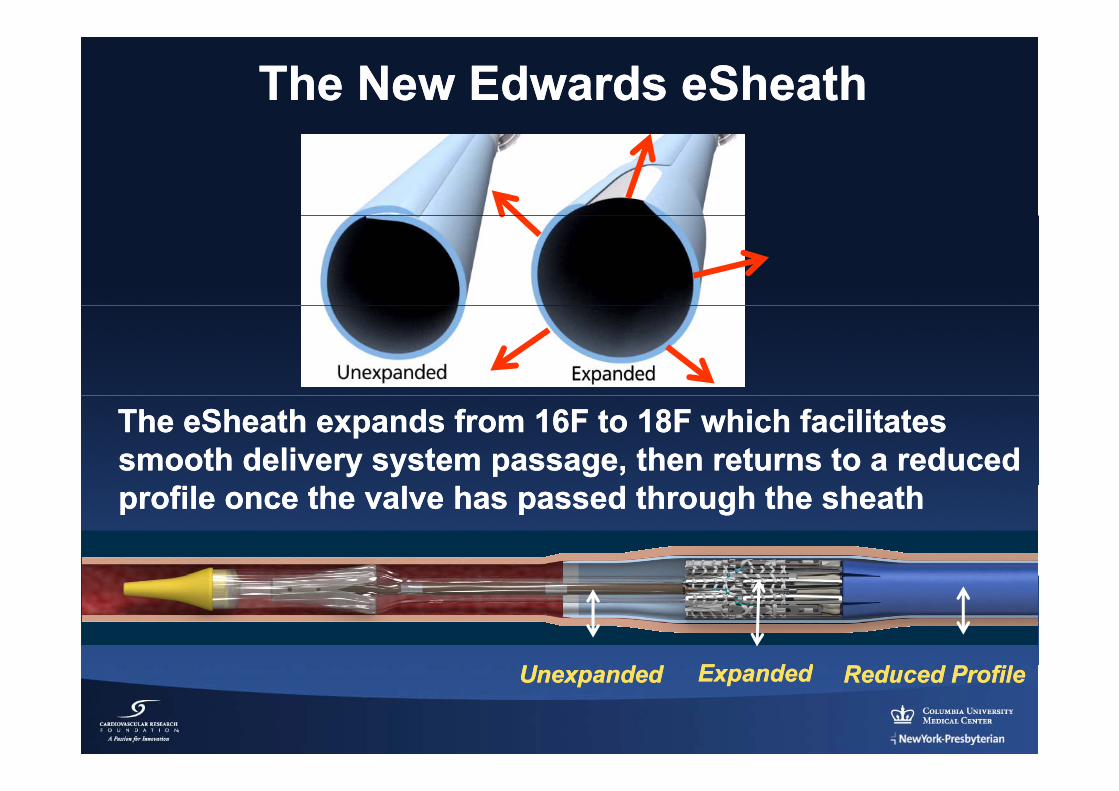
The New Edwards The New Edwards eSheatheSheath
The eSheath expands from 16F to 18F which facilitates The eSheath expands from 16F to 18F which facilitates smooth delivery system passage, then returns to a reduced smooth delivery system passage, then returns to a reduced profile once the valve has passed through the sheathprofile once the valve has passed through the sheath
EE d dd dUnexpandedUnexpanded Reduced ProfileReduced ProfileEExpandedxpanded
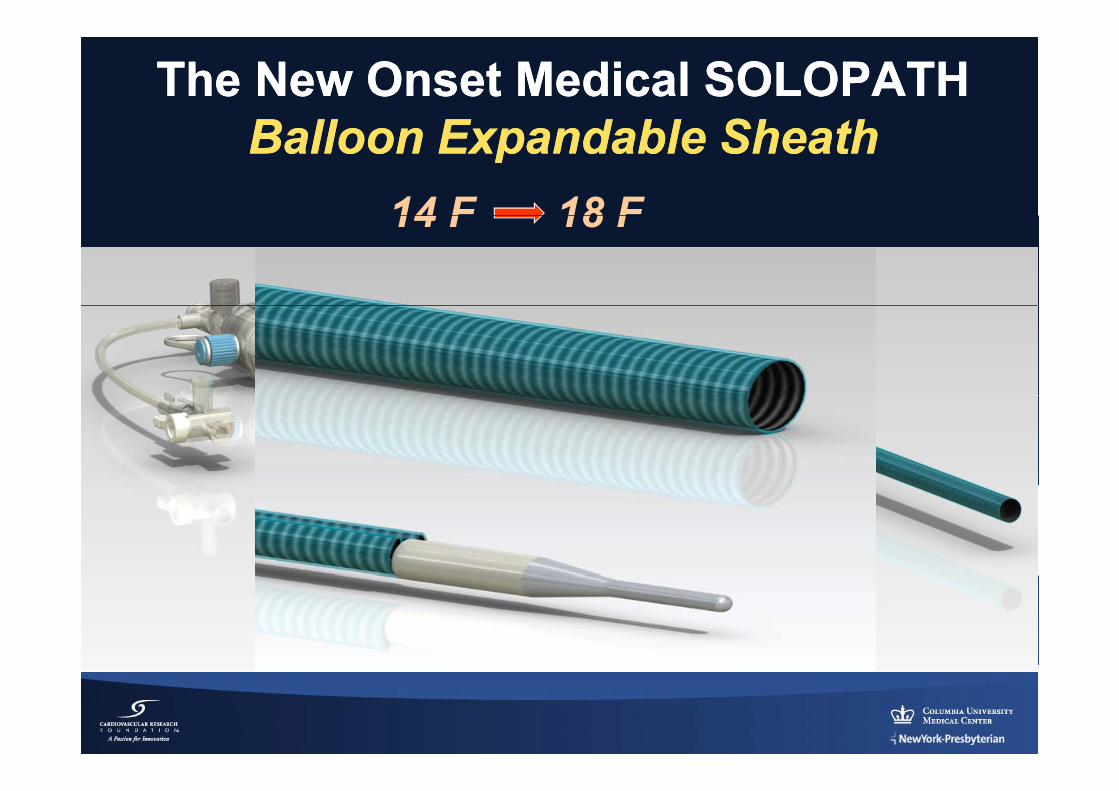
The New Onset Medical SOLOPATH The New Onset Medical SOLOPATH B ll E d bl Sh thB ll E d bl Sh thBalloon Expandable SheathBalloon Expandable Sheath
14 F 18 F14 F 18 F
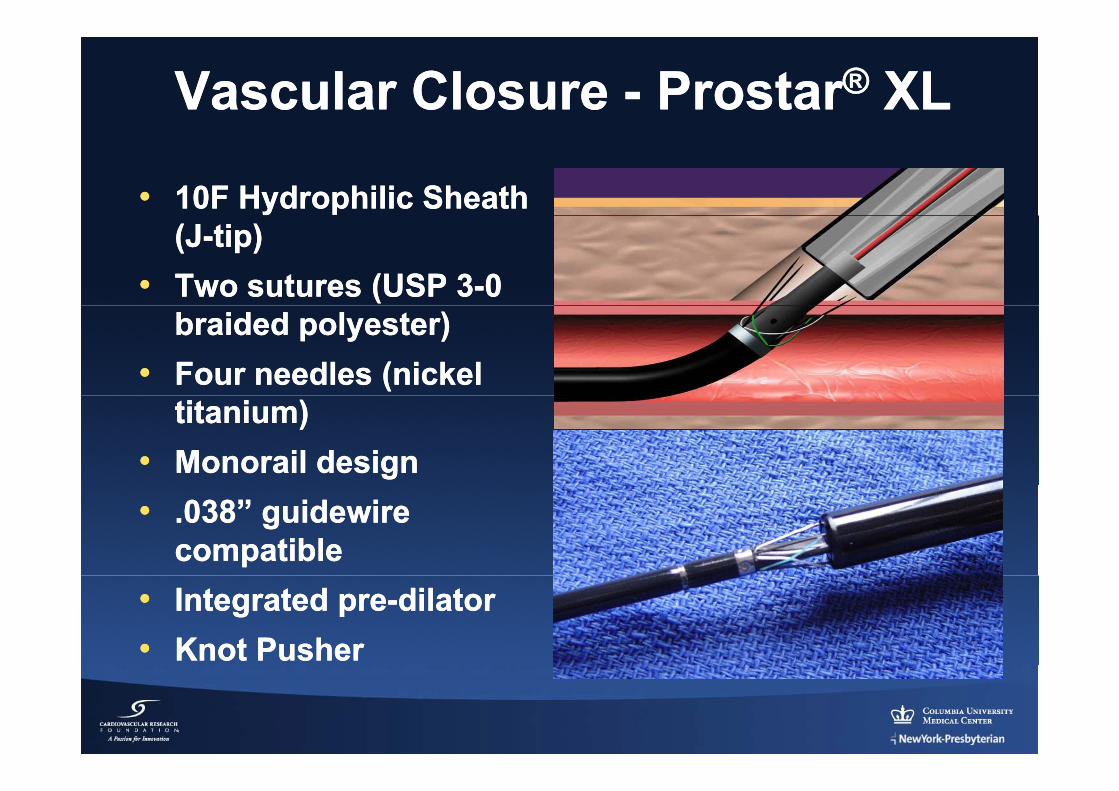
Vascular Closure Vascular Closure -- ProstarProstar®® XLXL
•• 10F Hydrophilic Sheath 10F Hydrophilic Sheath (J(J--tip)tip)
•• Two sutures (USP 3Two sutures (USP 3--0 0 braided polyester)braided polyester)
•• Four needles (nickel Four needles (nickel titanium)titanium)
•• Monorail designMonorail design•• .038” guidewire .038” guidewire
compatiblecompatible•• Integrated preIntegrated pre--dilator dilator •• Knot PusherKnot Pusher
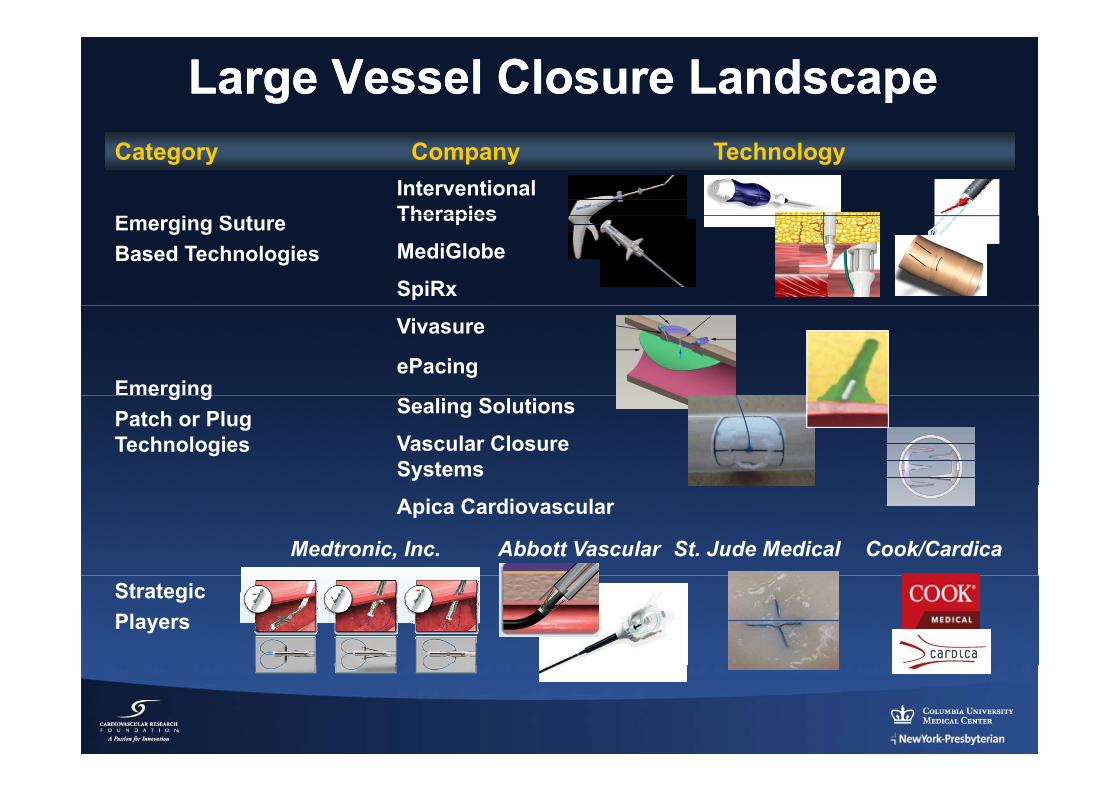
Large Vessel Closure LandscapeLarge Vessel Closure LandscapeCategory Company Technology
E i S tInterventional TherapiesEmerging Suture
Based Technologies
Therapies
MediGlobe
SpiRx
Emerging
Vivasure
ePacinge g g
Patch or Plug Technologies
Sealing Solutions
Vascular Closure Systems
Apica Cardiovascular
Medtronic, Inc. Abbott Vascular St. Jude Medical Cook/Cardica
Strategic Players
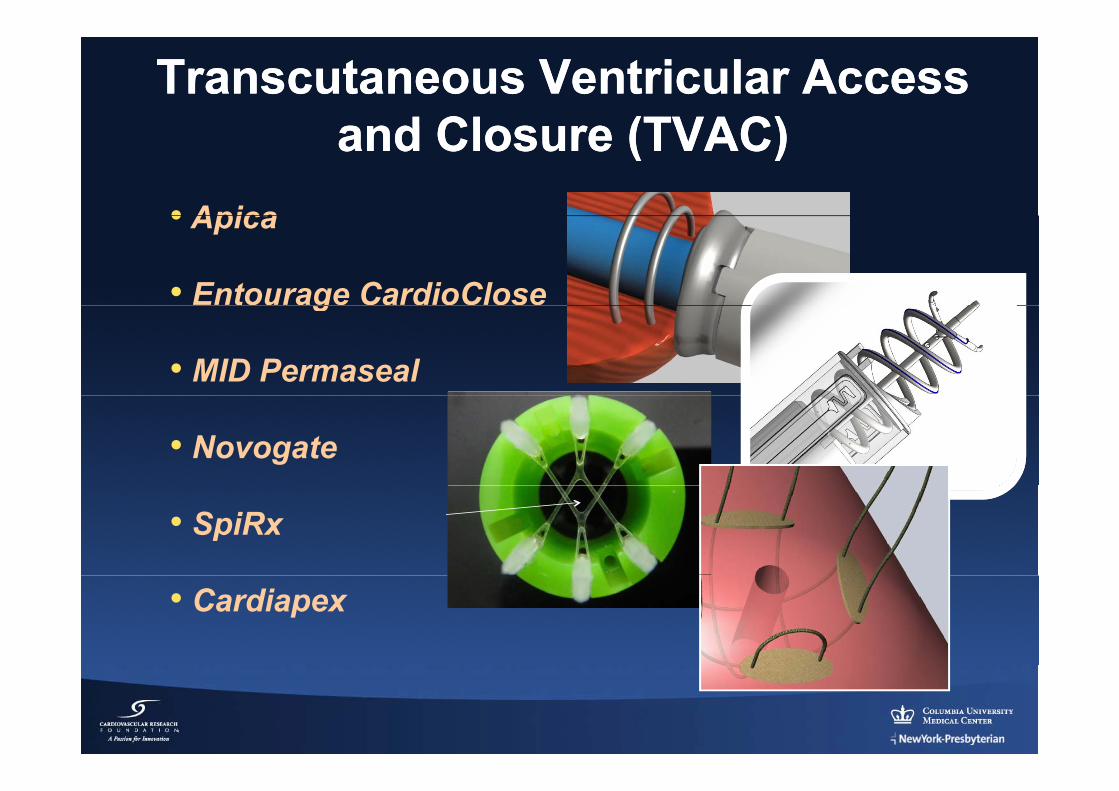
TranscutaneousTranscutaneous Ventricular Access Ventricular Access and Closure (TVAC)and Closure (TVAC)and Closure (TVAC)and Closure (TVAC)
• Apica• Apica
• Entourage CardioCloseg
• MID Permaseal
• Novogate
• SpiRx
• Cardiapex
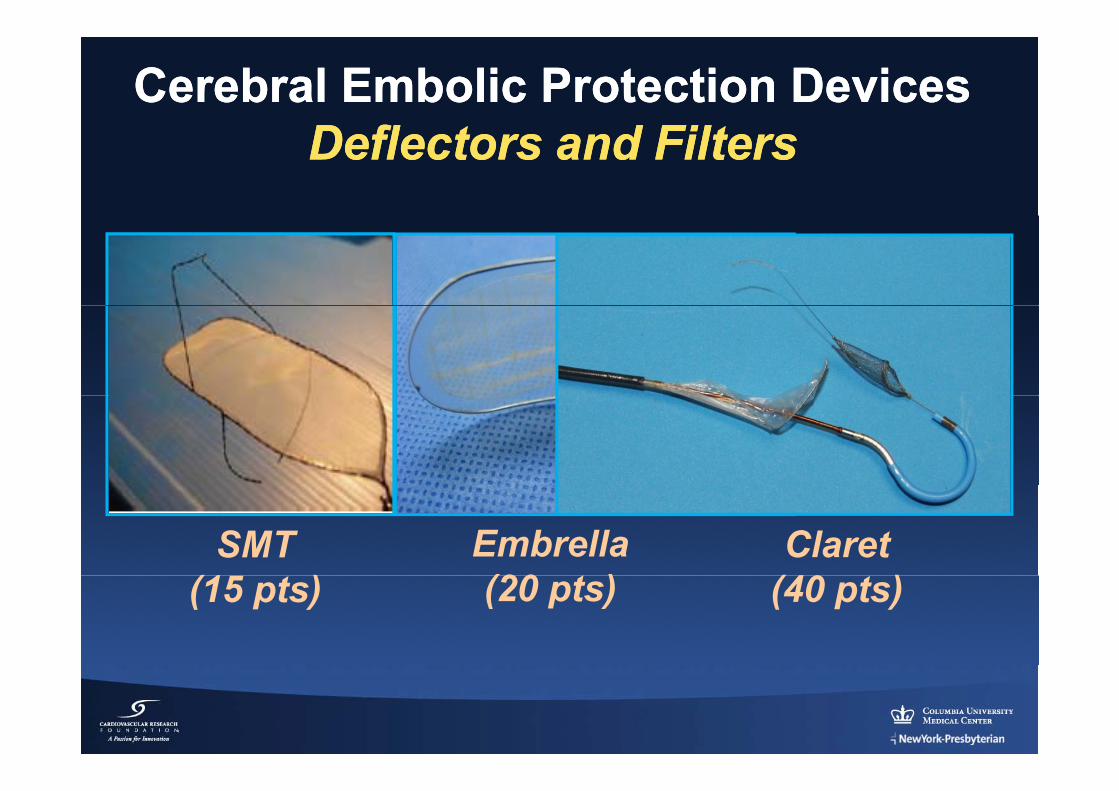
Cerebral Embolic Protection Cerebral Embolic Protection DevicesDevicesD fl t d FiltD fl t d FiltDeflectors and FiltersDeflectors and Filters
SMT(1 )
Embrella(20 t )
Claret(40 )(15 pts) (20 pts) (40 pts)
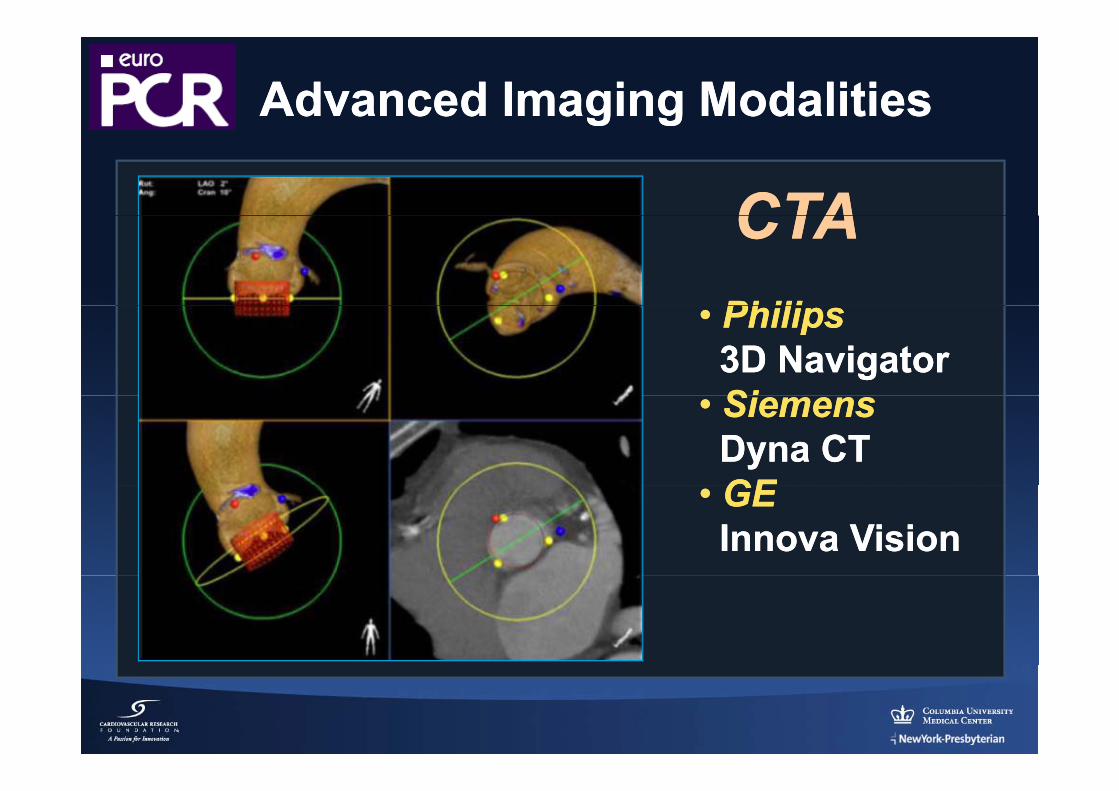
Advanced Imaging ModalitiesAdvanced Imaging Modalities
CTACTACTACTAPhiliPhili•• PhilipsPhilips3D Navigator3D NavigatorSiSi•• SiemensSiemensDynaDyna CTCTGEGE•• GEGEInnovaInnova VisionVision
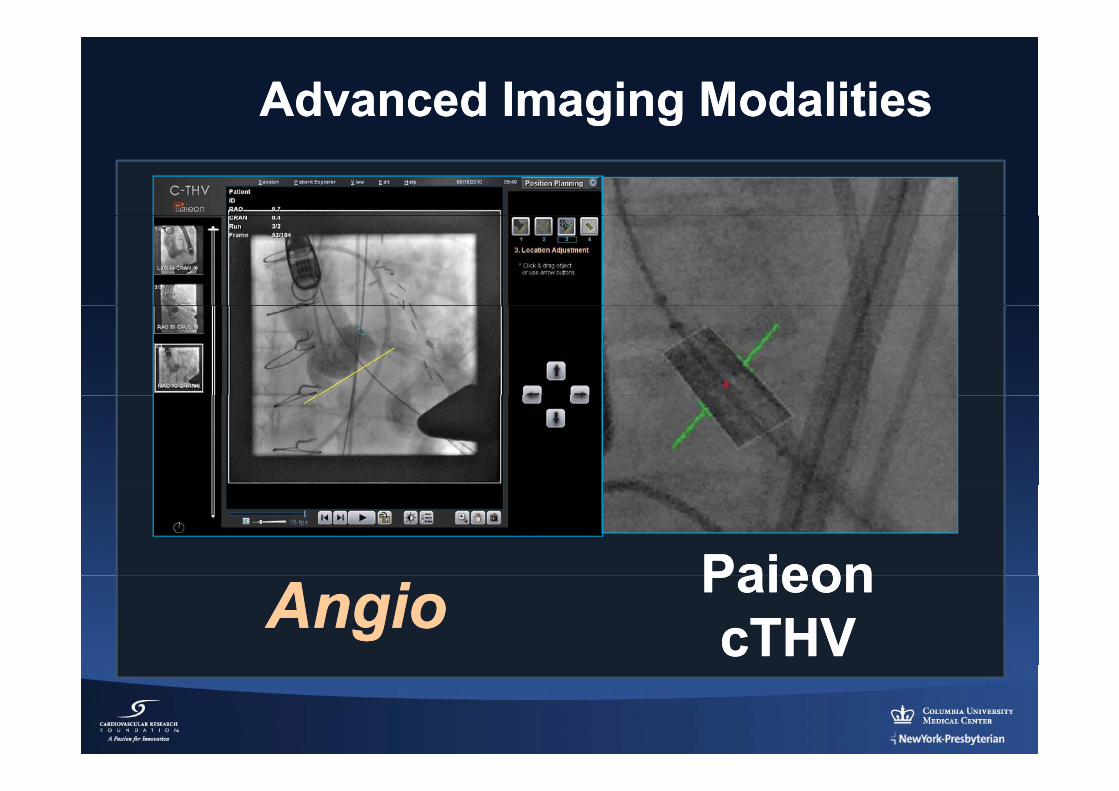
Advanced Imaging ModalitiesAdvanced Imaging Modalities
PaieonPaieonAngioAngio PaieonPaieoncTHVcTHV
TAVR in Review (TAVR in Review (20112011--12)12)
FinalFinalThoughtsThoughtsgg
TAVR in Review (2010TAVR in Review (2010--11)11)Fi l h hFi l h h
•• Dramatic continued growth in TAVR (# casesDramatic continued growth in TAVR (# cases
Final thoughts…Final thoughts…Dramatic continued growth in TAVR (# cases Dramatic continued growth in TAVR (# cases and clinical research); major indication is highand clinical research); major indication is high--risk AS (“risk creep” is only moderate in most risk AS (“risk creep” is only moderate in most ( p y( p ycenters).centers).
•• The Heart Valve Team culture remains a The Heart Valve Team culture remains a e ea t a e ea cu tu e e a s ae ea t a e ea cu tu e e a s adominant theme in clinical practice.dominant theme in clinical practice.
•• TAVR is a somewhat less predictable procedureTAVR is a somewhat less predictable procedureTAVR is a somewhat less predictable procedure TAVR is a somewhat less predictable procedure than open AVR and is associated with several than open AVR and is associated with several complications (strokes, vascular events, perm complications (strokes, vascular events, perm p ( , , pp ( , , pPPM, and PPM, and paravalvularparavalvular AR) AR) -- All efforts should All efforts should be directed at reducing these complications.be directed at reducing these complications.
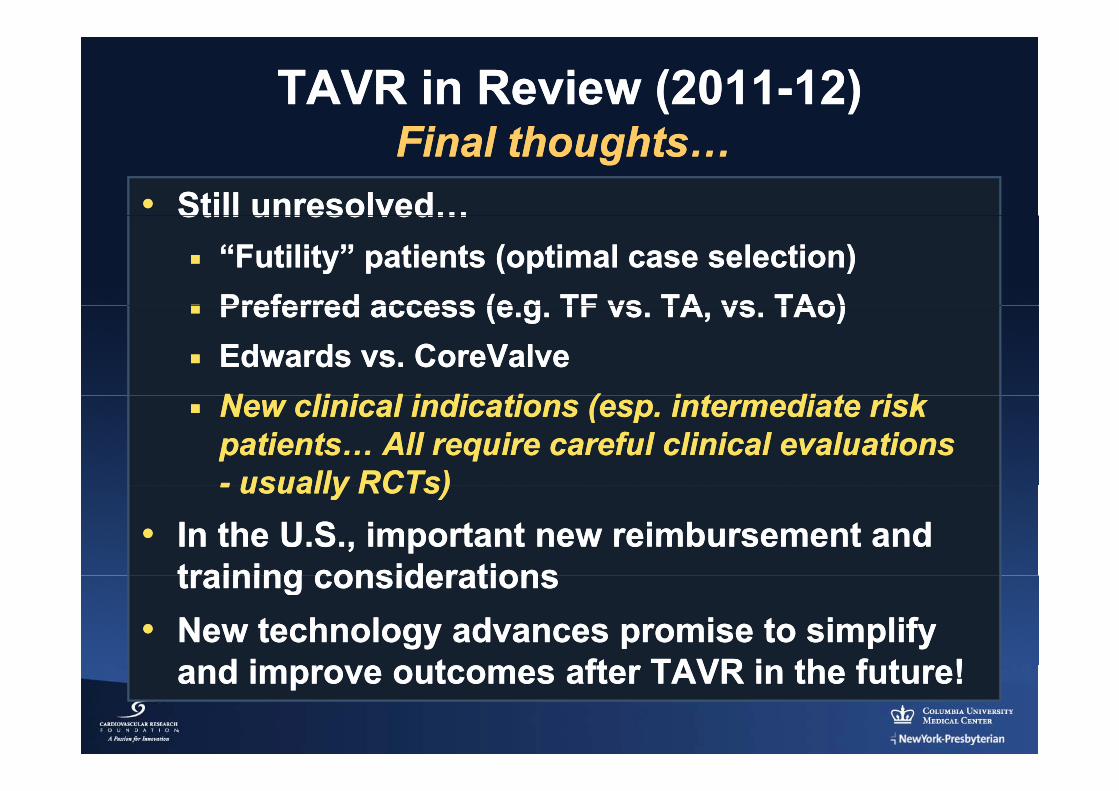
TAVR in Review (2011TAVR in Review (2011--12)12)Fi l h hFi l h h
•• Still unresolved…Still unresolved…
Final thoughts…Final thoughts…Still unresolved… Still unresolved…
“Futility” patients (optimal case selection)“Futility” patients (optimal case selection)Preferred access (e g TF vs TA vsPreferred access (e g TF vs TA vs TAoTAo))Preferred access (e.g. TF vs. TA, vs. Preferred access (e.g. TF vs. TA, vs. TAoTAo))Edwards vs. Edwards vs. CoreValveCoreValveN li i l i di ti ( i t di t i kN li i l i di ti ( i t di t i kNew clinical indications (esp. intermediate risk New clinical indications (esp. intermediate risk patients… All require careful clinical evaluations patients… All require careful clinical evaluations -- usually RCTs)usually RCTs)-- usually RCTs)usually RCTs)
•• In the U.S., important new reimbursement and In the U.S., important new reimbursement and training considerationstraining considerationstraining considerationstraining considerations
•• New technology advances promise to simplify New technology advances promise to simplify d i t ft TAVR i th f t !d i t ft TAVR i th f t !and improve outcomes after TAVR in the future! and improve outcomes after TAVR in the future!