Embed Size (px)
Citation preview
1
| Copyright © 2018 Tata Consultancy Services Limited
TCS Financial Results
Quarter IV & Year Ended FY 2017 - 18
April 19, 2018
2
Disclaimer
Certain statements in this release concerning our future prospects are forward-looking statements. Forward-looking
statements by their nature involve a number of risks and uncertainties that could cause actual results to differ materially
from market expectations. These risks and uncertainties include, but are not limited to our ability to manage growth, intense
competition among Indian and overseas IT services companies, various factors which may affect our cost advantage, such
as wage increases or an appreciating Rupee, our ability to attract and retain highly skilled professionals, time and cost
overruns on fixed-price, fixed-time frame contracts, client concentration, restrictions on immigration, our ability to manage
our international operations, reduced demand for technology in our key focus areas, disruptions in telecommunication
networks, our ability to successfully complete and integrate potential acquisitions, liability for damages on our service
contracts, the success of the companies in which TCS has made strategic investments, withdrawal of governmental fiscal
incentives, political instability, legal restrictions on raising capital or acquiring companies outside India, unauthorized use of
our intellectual property and general economic conditions affecting our industry. TCS may, from time to time, make
additional written and oral forward-looking statements, including our reports to shareholders. These forward-looking
statements represent only the Company’s current intentions, beliefs or expectations, and any forward-looking statement
speaks only as of the date on which it was made. The Company assumes no obligation to revise or update any forward-
looking statements.

3
Click to edit Master title styleQuarterly Financial Performance
4
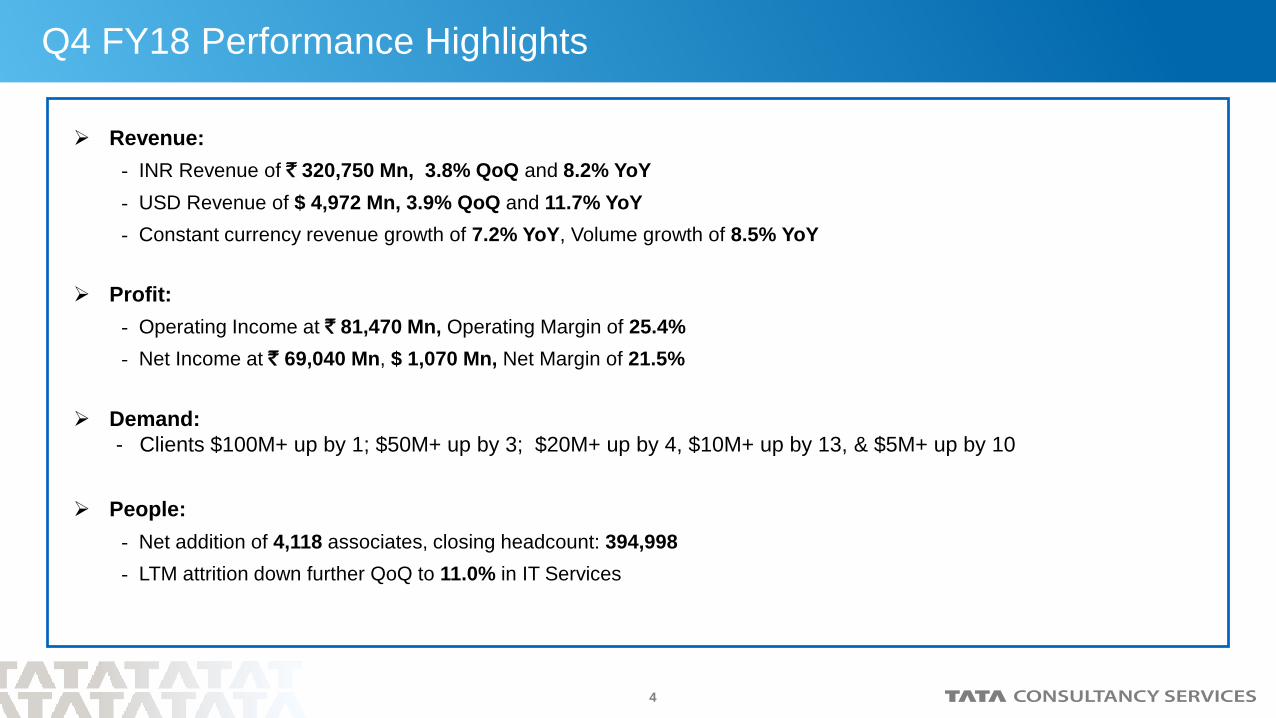
Q4 FY18 Performance Highlights
Revenue:
- INR Revenue of ` 320,750 Mn, 3.8% QoQ and 8.2% YoY
- USD Revenue of $ 4,972 Mn, 3.9% QoQ and 11.7% YoY
- Constant currency revenue growth of 7.2% YoY, Volume growth of 8.5% YoY
Profit:
- Operating Income at ` 81,470 Mn, Operating Margin of 25.4%
- Net Income at ` 69,040 Mn, $ 1,070 Mn, Net Margin of 21.5%
Demand:
- Clients $100M+ up by 1; $50M+ up by 3; $20M+ up by 4, $10M+ up by 13, & $5M+ up by 10
People:
- Net addition of 4,118 associates, closing headcount: 394,998
- LTM attrition down further QoQ to 11.0% in IT Services
5
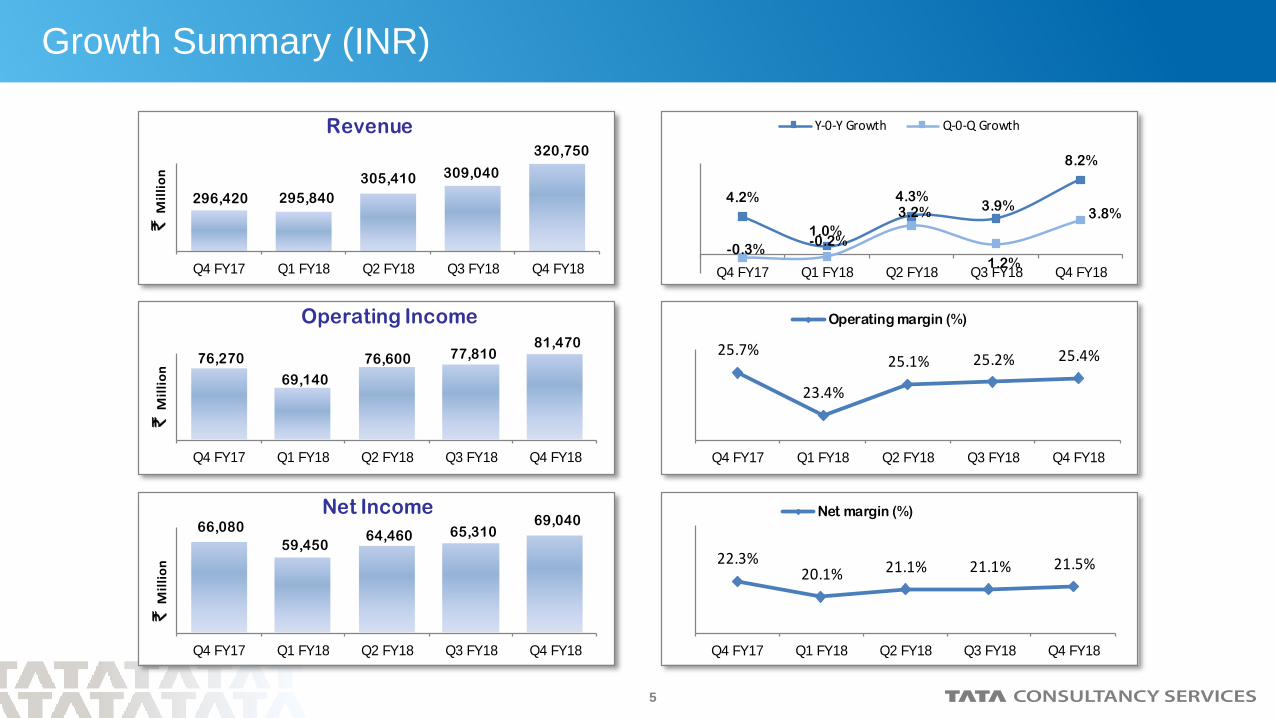
Growth Summary (INR)
296,420 295,840
305,410 309,040
320,750
Q4 FY17 Q1 FY18 Q2 FY18 Q3 FY18 Q4 FY18
Revenue
`M
illi
on
4.2%
1.0%
4.3%3.9%
8.2%
-0.3%-0.2%
3.2%
1.2%
3.8%
Q4 FY17 Q1 FY18 Q2 FY18 Q3 FY18 Q4 FY18
Y-0-Y Growth Q-0-Q Growth
76,270
69,140
76,600 77,810 81,470
Q4 FY17 Q1 FY18 Q2 FY18 Q3 FY18 Q4 FY18
Operating Income
`M
illi
on
25.7%
23.4%
25.1% 25.2% 25.4%
Q4 FY17 Q1 FY18 Q2 FY18 Q3 FY18 Q4 FY18
Operating margin (%)
66,080
59,450 64,460 65,310
69,040
Q4 FY17 Q1 FY18 Q2 FY18 Q3 FY18 Q4 FY18
Net Income
`M
illi
on 22.3%
20.1% 21.1% 21.1% 21.5%
Q4 FY17 Q1 FY18 Q2 FY18 Q3 FY18 Q4 FY18
Net margin (%)
6
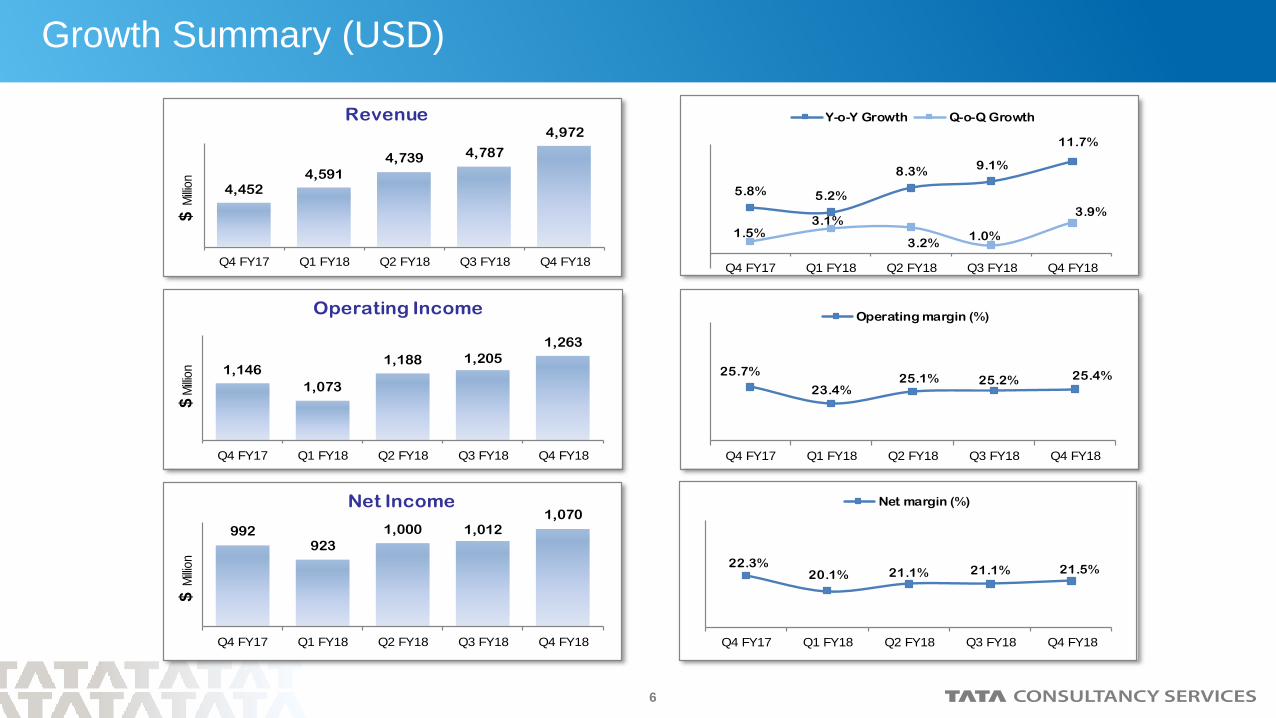
Growth Summary (USD)
4,4524,591
4,739 4,787
4,972
Q4 FY17 Q1 FY18 Q2 FY18 Q3 FY18 Q4 FY18
Revenue
$M
illio
n5.8% 5.2%
8.3%9.1%
11.7%
1.5%3.1%
3.2%1.0%
3.9%
Q4 FY17 Q1 FY18 Q2 FY18 Q3 FY18 Q4 FY18
Y-o-Y Growth Q-o-Q Growth
1,146
1,073
1,188 1,205
1,263
Q4 FY17 Q1 FY18 Q2 FY18 Q3 FY18 Q4 FY18
Operating Income
$M
illio
n 25.7%
23.4%25.1% 25.2% 25.4%
Q4 FY17 Q1 FY18 Q2 FY18 Q3 FY18 Q4 FY18
Operating margin (%)
992923
1,000 1,0121,070
Q4 FY17 Q1 FY18 Q2 FY18 Q3 FY18 Q4 FY18
Net Income
$M
illio
n 22.3%20.1% 21.1% 21.1% 21.5%
Q4 FY17 Q1 FY18 Q2 FY18 Q3 FY18 Q4 FY18
Net margin (%)
7
Annual Financial Performance
8
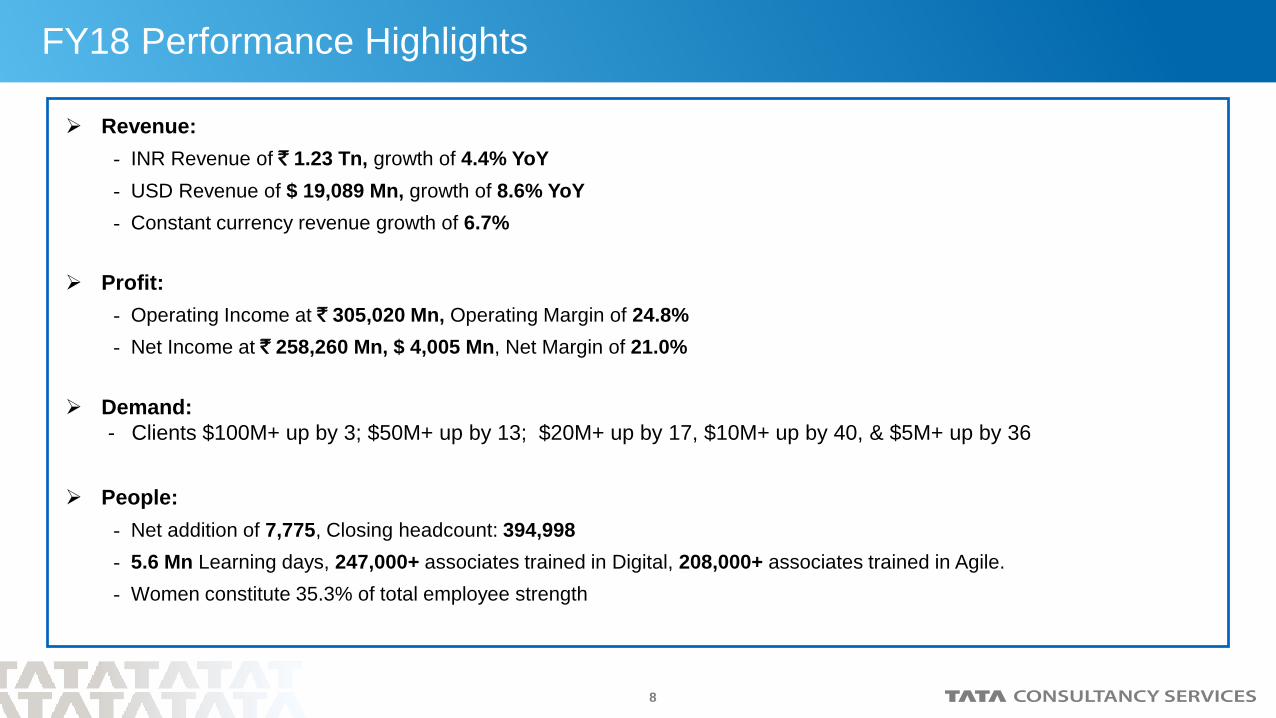
FY18 Performance Highlights
Revenue:
- INR Revenue of ` 1.23 Tn, growth of 4.4% YoY
- USD Revenue of $ 19,089 Mn, growth of 8.6% YoY
- Constant currency revenue growth of 6.7%
Profit:
- Operating Income at ` 305,020 Mn, Operating Margin of 24.8%
- Net Income at ` 258,260 Mn, $ 4,005 Mn, Net Margin of 21.0%
Demand:
- Clients $100M+ up by 3; $50M+ up by 13; $20M+ up by 17, $10M+ up by 40, & $5M+ up by 36
People:
- Net addition of 7,775, Closing headcount: 394,998
- 5.6 Mn Learning days, 247,000+ associates trained in Digital, 208,000+ associates trained in Agile.
- Women constitute 35.3% of total employee strength
9
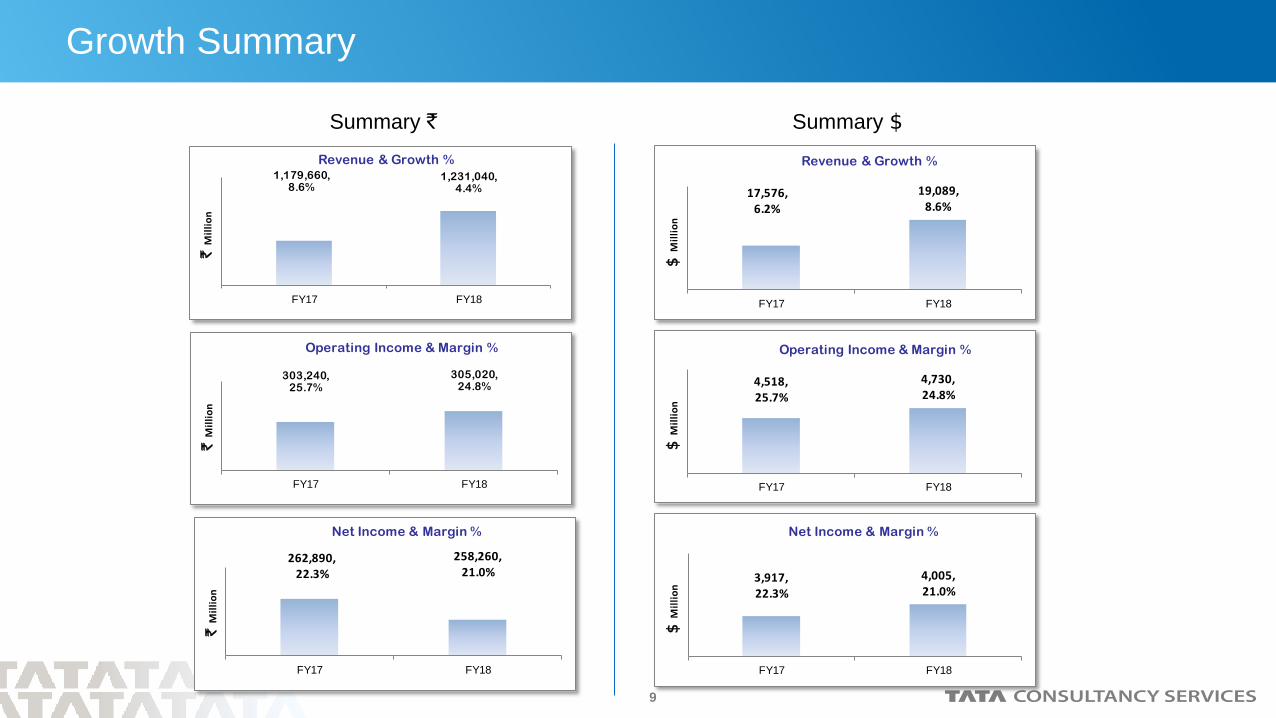
Growth Summary
17,576, 6.2%
19,089, 8.6%
FY17 FY18
Revenue & Growth %
$M
illi
on
4,518, 25.7%
4,730, 24.8%
FY17 FY18
Operating Income & Margin %
$M
illi
on
3,917, 22.3%
4,005, 21.0%
FY17 FY18
Net Income & Margin %
$M
illi
on
1,179,660, 8.6%
1,231,040, 4.4%
FY17 FY18
Revenue & Growth %
`M
illi
on
303,240, 25.7%
305,020, 24.8%
FY17 FY18
Operating Income & Margin %
`M
illi
on
262,890, 22.3%
258,260, 21.0%
FY17 FY18
Net Income & Margin %
`M
illi
on
Summary ` Summary $
10
Operational Parameters
11
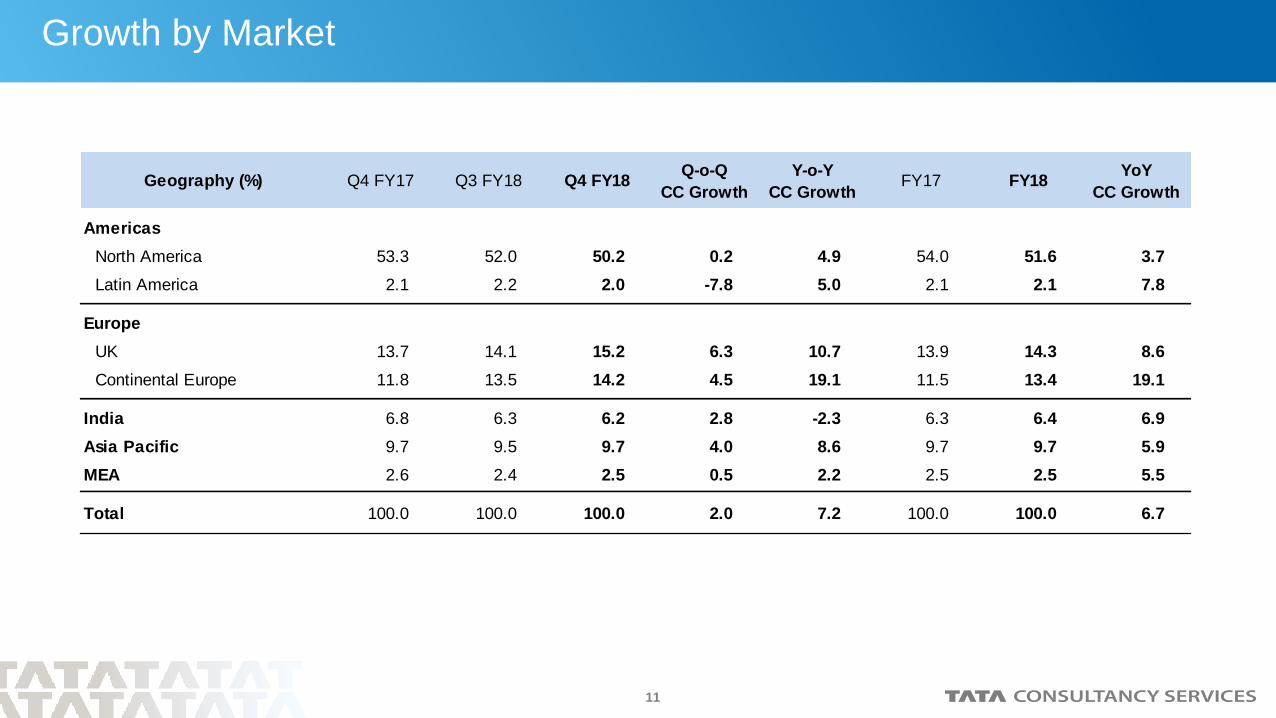
Growth by Market
Geography (%) Q4 FY17 Q3 FY18 Q4 FY18Q-o-Q
CC Growth
Y-o-Y
CC GrowthFY17 FY18
YoY
CC Growth
Americas
North America 53.3 52.0 50.2 0.2 4.9 54.0 51.6 3.7
Latin America 2.1 2.2 2.0 -7.8 5.0 2.1 2.1 7.8
Europe
UK 13.7 14.1 15.2 6.3 10.7 13.9 14.3 8.6
Continental Europe 11.8 13.5 14.2 4.5 19.1 11.5 13.4 19.1
India 6.8 6.3 6.2 2.8 -2.3 6.3 6.4 6.9
Asia Pacific 9.7 9.5 9.7 4.0 8.6 9.7 9.7 5.9
MEA 2.6 2.4 2.5 0.5 2.2 2.5 2.5 5.5
Total 100.0 100.0 100.0 2.0 7.2 100.0 100.0 6.7
12
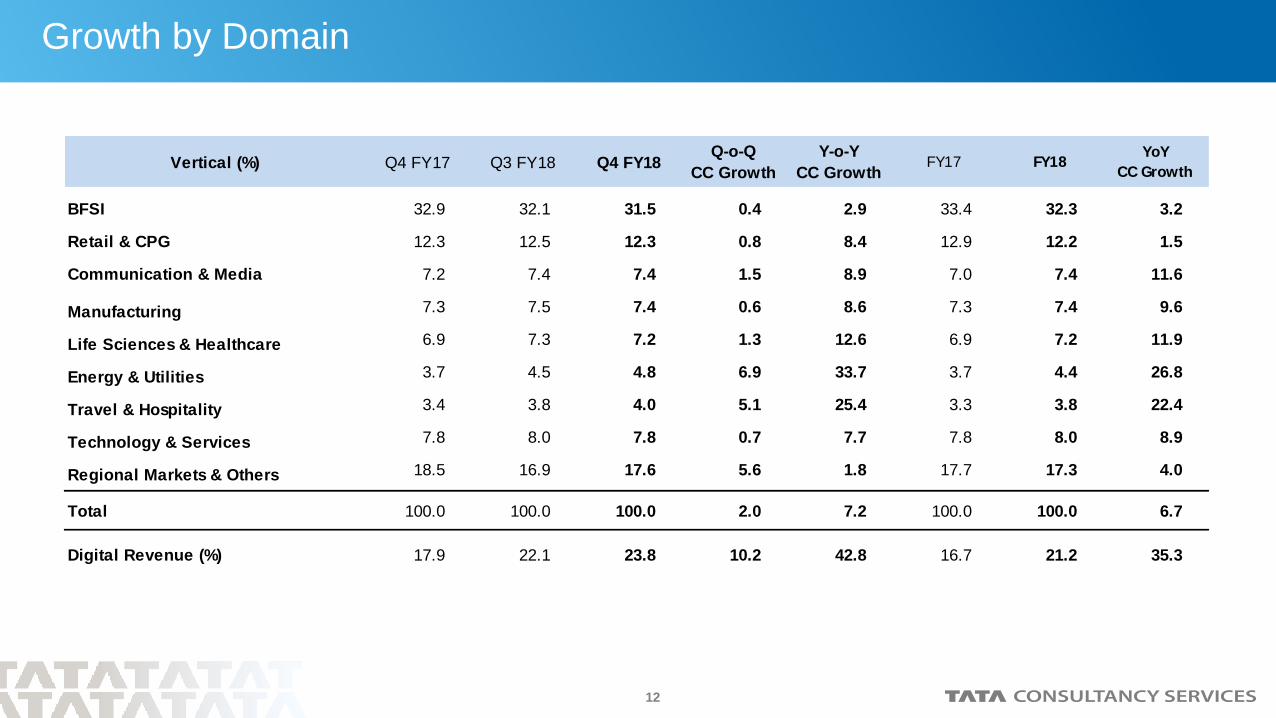
Growth by Domain
Vertical (%) Q4 FY17 Q3 FY18 Q4 FY18Q-o-Q
CC Growth
Y-o-Y
CC GrowthFY17 FY18
YoY
CC Growth
BFSI 32.9 32.1 31.5 0.4 2.9 33.4 32.3 3.2
Retail & CPG 12.3 12.5 12.3 0.8 8.4 12.9 12.2 1.5
Communication & Media 7.2 7.4 7.4 1.5 8.9 7.0 7.4 11.6
Manufacturing 7.3 7.5 7.4 0.6 8.6 7.3 7.4 9.6
Life Sciences & Healthcare 6.9 7.3 7.2 1.3 12.6 6.9 7.2 11.9
Energy & Utilities 3.7 4.5 4.8 6.9 33.7 3.7 4.4 26.8
Travel & Hospitality 3.4 3.8 4.0 5.1 25.4 3.3 3.8 22.4
Technology & Services 7.8 8.0 7.8 0.7 7.7 7.8 8.0 8.9
Regional Markets & Others 18.5 16.9 17.6 5.6 1.8 17.7 17.3 4.0
Total 100.0 100.0 100.0 2.0 7.2 100.0 100.0 6.7
Digital Revenue (%) 17.9 22.1 23.8 10.2 42.8 16.7 21.2 35.3
13
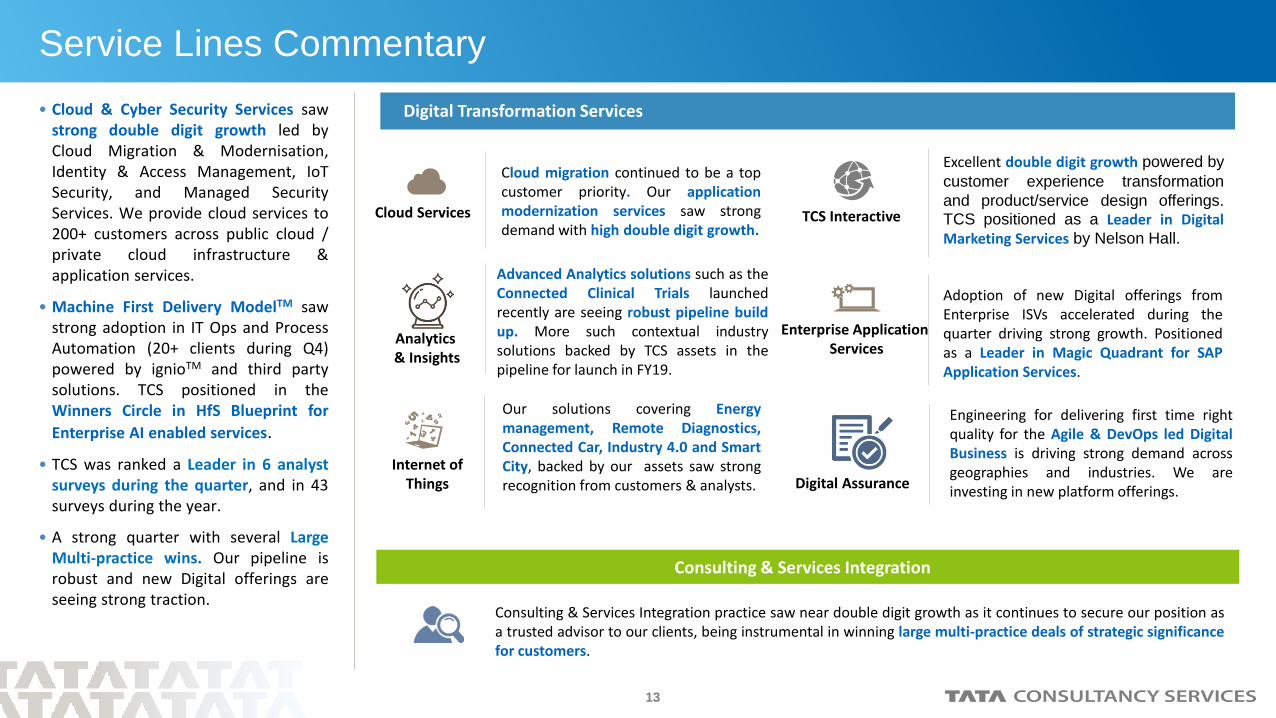
Service Lines Commentary
• Cloud & Cyber Security Services sawstrong double digit growth led byCloud Migration & Modernisation,Identity & Access Management, IoTSecurity, and Managed SecurityServices. We provide cloud services to200+ customers across public cloud /private cloud infrastructure &application services.
• Machine First Delivery ModelTM sawstrong adoption in IT Ops and ProcessAutomation (20+ clients during Q4)powered by ignioTM and third partysolutions. TCS positioned in theWinners Circle in HfS Blueprint for
Enterprise AI enabled services.
• TCS was ranked a Leader in 6 analystsurveys during the quarter, and in 43surveys during the year.
• A strong quarter with several LargeMulti-practice wins. Our pipeline isrobust and new Digital offerings areseeing strong traction.
Consulting & Services Integration practice saw near double digit growth as it continues to secure our position asa trusted advisor to our clients, being instrumental in winning large multi-practice deals of strategic significancefor customers.
Digital Transformation Services
Consulting & Services Integration
Cloud Services TCS Interactive
Enterprise Application Services
Excellent double digit growth powered by
customer experience transformation
and product/service design offerings.TCS positioned as a Leader in DigitalMarketing Services by Nelson Hall.
Adoption of new Digital offerings fromEnterprise ISVs accelerated during thequarter driving strong growth. Positionedas a Leader in Magic Quadrant for SAPApplication Services.
Internet ofThings Digital Assurance
Our solutions covering Energymanagement, Remote Diagnostics,Connected Car, Industry 4.0 and SmartCity, backed by our assets saw strongrecognition from customers & analysts.
Cloud migration continued to be a topcustomer priority. Our applicationmodernization services saw strongdemand with high double digit growth.
Engineering for delivering first time rightquality for the Agile & DevOps led DigitalBusiness is driving strong demand acrossgeographies and industries. We areinvesting in new platform offerings.
Analytics & Insights
Advanced Analytics solutions such as theConnected Clinical Trials launchedrecently are seeing robust pipeline buildup. More such contextual industrysolutions backed by TCS assets in thepipeline for launch in FY19.
14
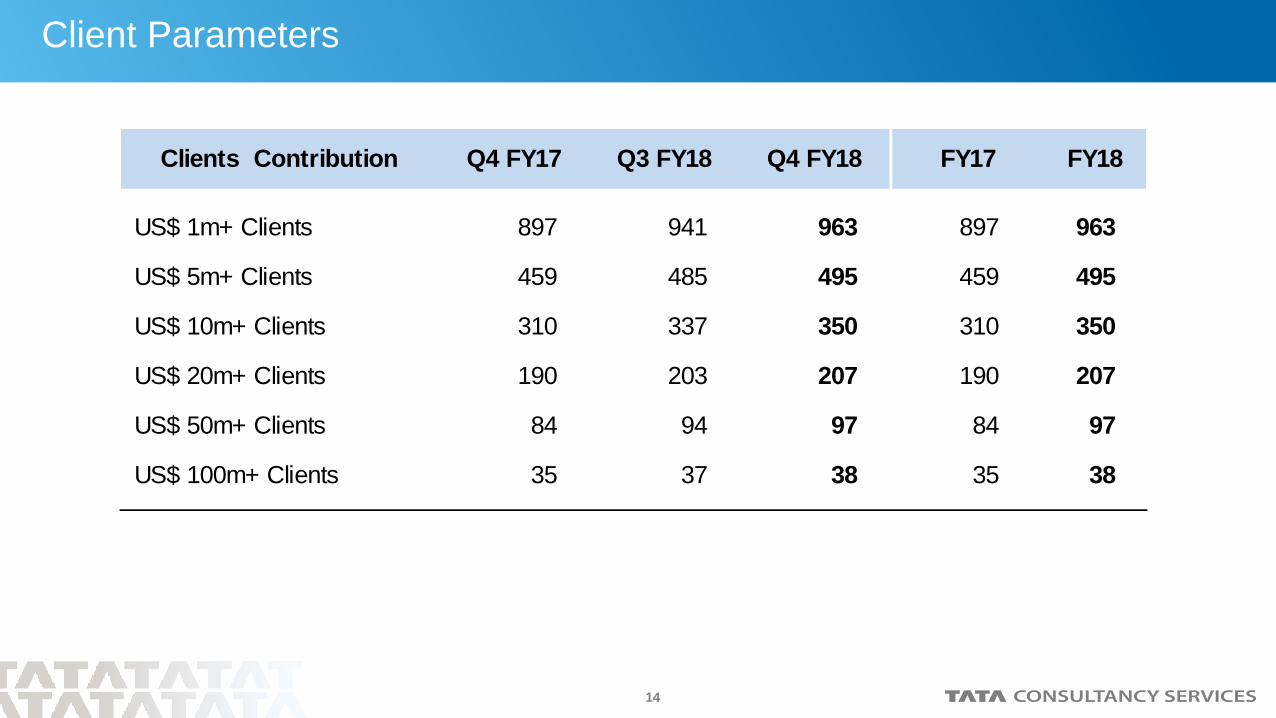
Client Parameters
US$ 1m+ Clients 897 941 963 897 963
US$ 5m+ Clients 459 485 495 459 495
US$ 10m+ Clients 310 337 350 310 350
US$ 20m+ Clients 190 203 207 190 207
US$ 50m+ Clients 84 94 97 84 97
US$ 100m+ Clients 35 37 38 35 38
FY17Q3 FY18Clients Contribution Q4 FY18Q4 FY17 FY18
15
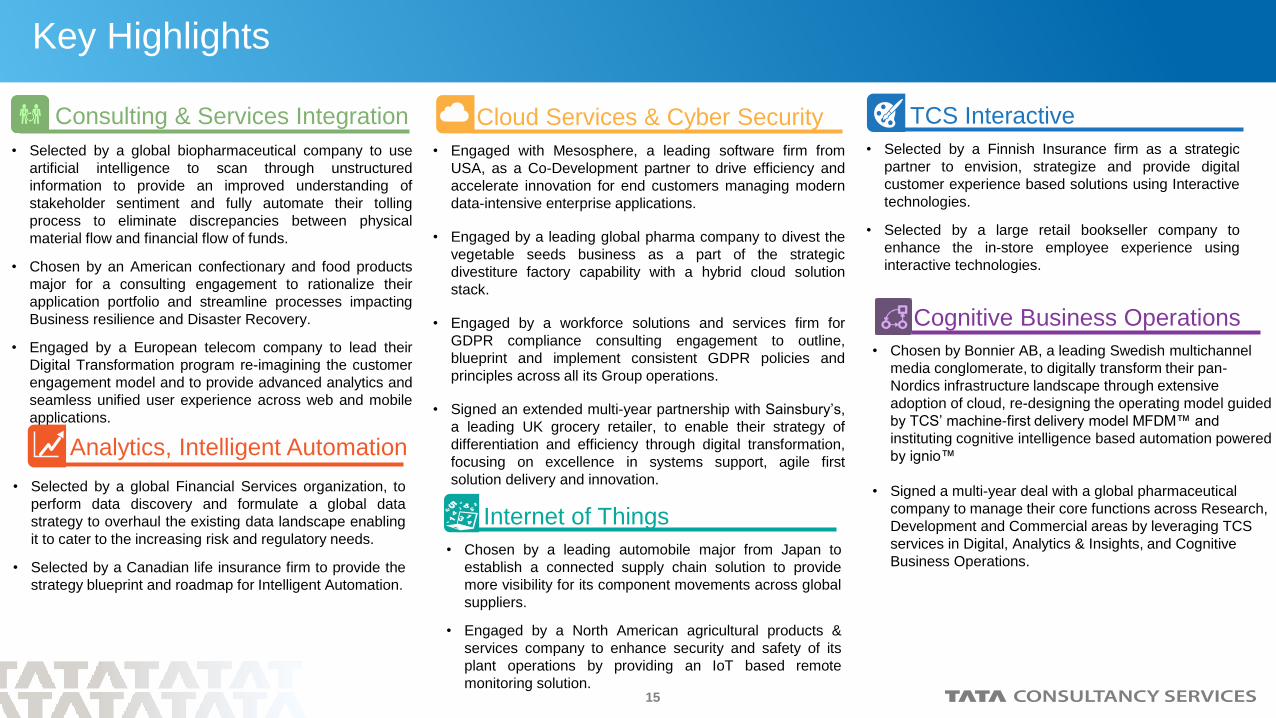
• Engaged with Mesosphere, a leading software firm from
USA, as a Co-Development partner to drive efficiency and
accelerate innovation for end customers managing modern
data-intensive enterprise applications.
• Engaged by a leading global pharma company to divest the
vegetable seeds business as a part of the strategic
divestiture factory capability with a hybrid cloud solution
stack.
• Engaged by a workforce solutions and services firm for
GDPR compliance consulting engagement to outline,
blueprint and implement consistent GDPR policies and
principles across all its Group operations.
• Signed an extended multi-year partnership with Sainsbury’s,
a leading UK grocery retailer, to enable their strategy of
differentiation and efficiency through digital transformation,
focusing on excellence in systems support, agile first
solution delivery and innovation.
Cloud Services & Cyber Security
• Selected by a global biopharmaceutical company to use
artificial intelligence to scan through unstructured
information to provide an improved understanding of
stakeholder sentiment and fully automate their tolling
process to eliminate discrepancies between physical
material flow and financial flow of funds.
• Chosen by an American confectionary and food products
major for a consulting engagement to rationalize their
application portfolio and streamline processes impacting
Business resilience and Disaster Recovery.
• Engaged by a European telecom company to lead their
Digital Transformation program re-imagining the customer
engagement model and to provide advanced analytics and
seamless unified user experience across web and mobile
applications.
• Chosen by a leading automobile major from Japan to
establish a connected supply chain solution to provide
more visibility for its component movements across global
suppliers.
• Engaged by a North American agricultural products &
services company to enhance security and safety of its
plant operations by providing an IoT based remote
monitoring solution.
Internet of Things
• Selected by a Finnish Insurance firm as a strategic
partner to envision, strategize and provide digital
customer experience based solutions using Interactive
technologies.
• Selected by a large retail bookseller company to
enhance the in-store employee experience using
interactive technologies.
TCS InteractiveConsulting & Services Integration
Key Highlights
• Chosen by Bonnier AB, a leading Swedish multichannel
media conglomerate, to digitally transform their pan-
Nordics infrastructure landscape through extensive
adoption of cloud, re-designing the operating model guided
by TCS’ machine-first delivery model MFDM™ and
instituting cognitive intelligence based automation powered
by ignio™
• Signed a multi-year deal with a global pharmaceutical
company to manage their core functions across Research,
Development and Commercial areas by leveraging TCS
services in Digital, Analytics & Insights, and Cognitive
Business Operations.
Cognitive Business Operations
• Selected by a global Financial Services organization, to
perform data discovery and formulate a global data
strategy to overhaul the existing data landscape enabling
it to cater to the increasing risk and regulatory needs.
• Selected by a Canadian life insurance firm to provide the
strategy blueprint and roadmap for Intelligent Automation.
Analytics, Intelligent Automation
16
Click to edit Master title styleHuman Resources
17
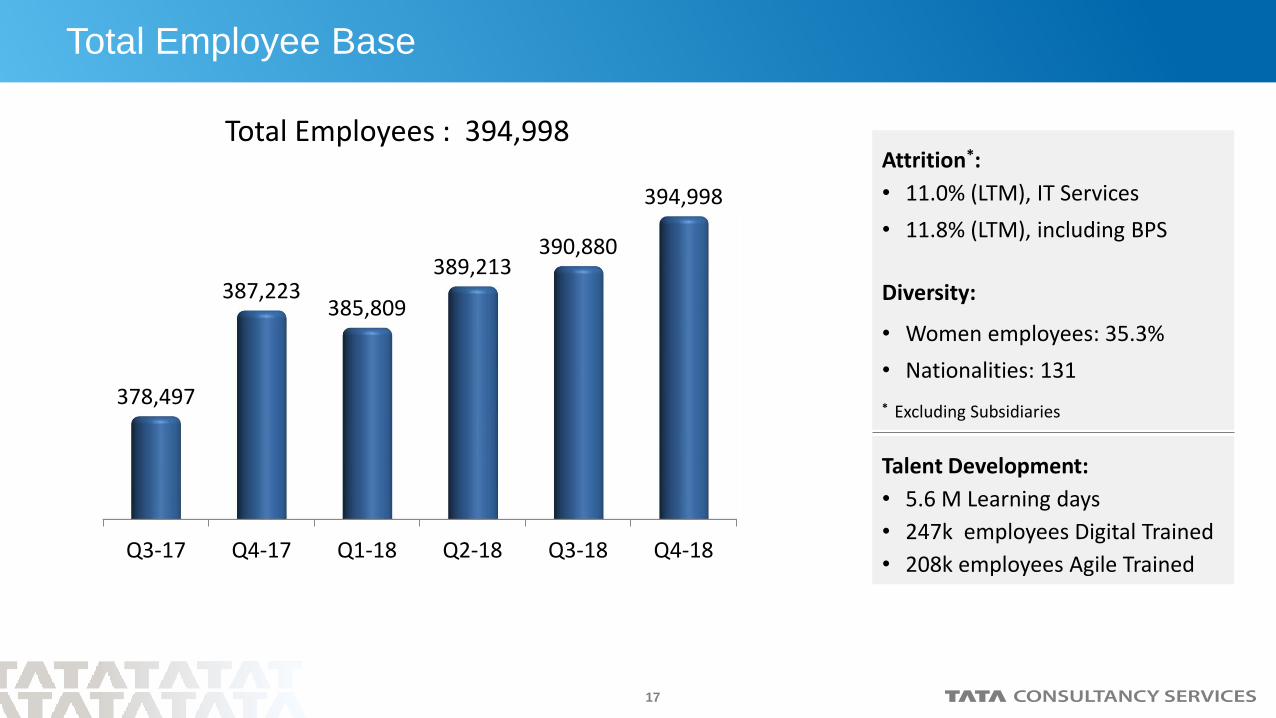
Q3-17 Q4-17 Q1-18 Q2-18 Q3-18 Q4-18
378,497
387,223385,809
389,213390,880
394,998
Total Employees : 394,998Attrition*:
• 11.0% (LTM), IT Services
• 11.8% (LTM), including BPS
Diversity:
• Women employees: 35.3%
• Nationalities: 131
* Excluding Subsidiaries
Total Employee Base
Talent Development:
• 5.6 M Learning days
• 247k employees Digital Trained
• 208k employees Agile Trained
18
Click to edit Master title styleAnnexure
19
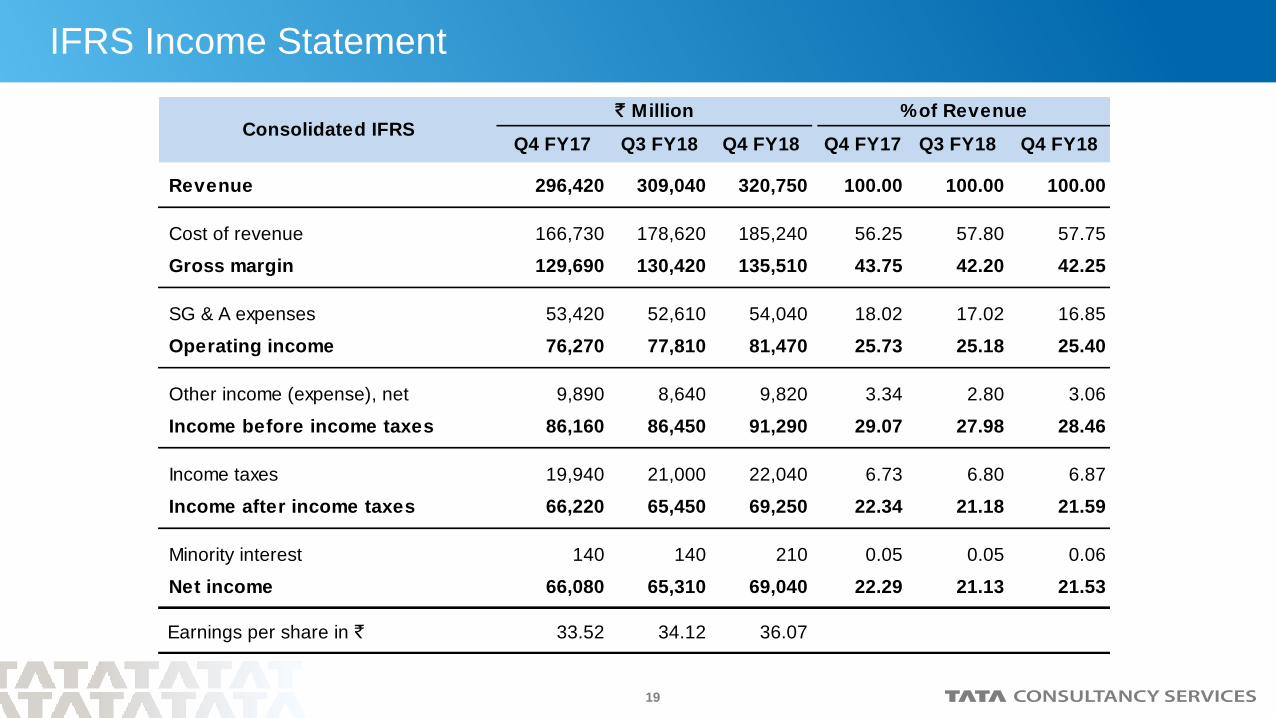
IFRS Income Statement
Revenue 296,420 309,040 320,750 100.00 100.00 100.00
Cost of revenue 166,730 178,620 185,240 56.25 57.80 57.75
Gross margin 129,690 130,420 135,510 43.75 42.20 42.25
SG & A expenses 53,420 52,610 54,040 18.02 17.02 16.85
Operating income 76,270 77,810 81,470 25.73 25.18 25.40
Other income (expense), net 9,890 8,640 9,820 3.34 2.80 3.06
Income before income taxes 86,160 86,450 91,290 29.07 27.98 28.46
Income taxes 19,940 21,000 22,040 6.73 6.80 6.87
Income after income taxes 66,220 65,450 69,250 22.34 21.18 21.59
Minority interest 140 140 210 0.05 0.05 0.06
Net income 66,080 65,310 69,040 22.29 21.13 21.53
Earnings per share in ` 33.52 34.12 36.07
Q4 FY17 Q4 FY17Consolidated IFRS
` Million
Q4 FY18 Q3 FY18 Q4 FY18
% of Revenue
Q3 FY18
20
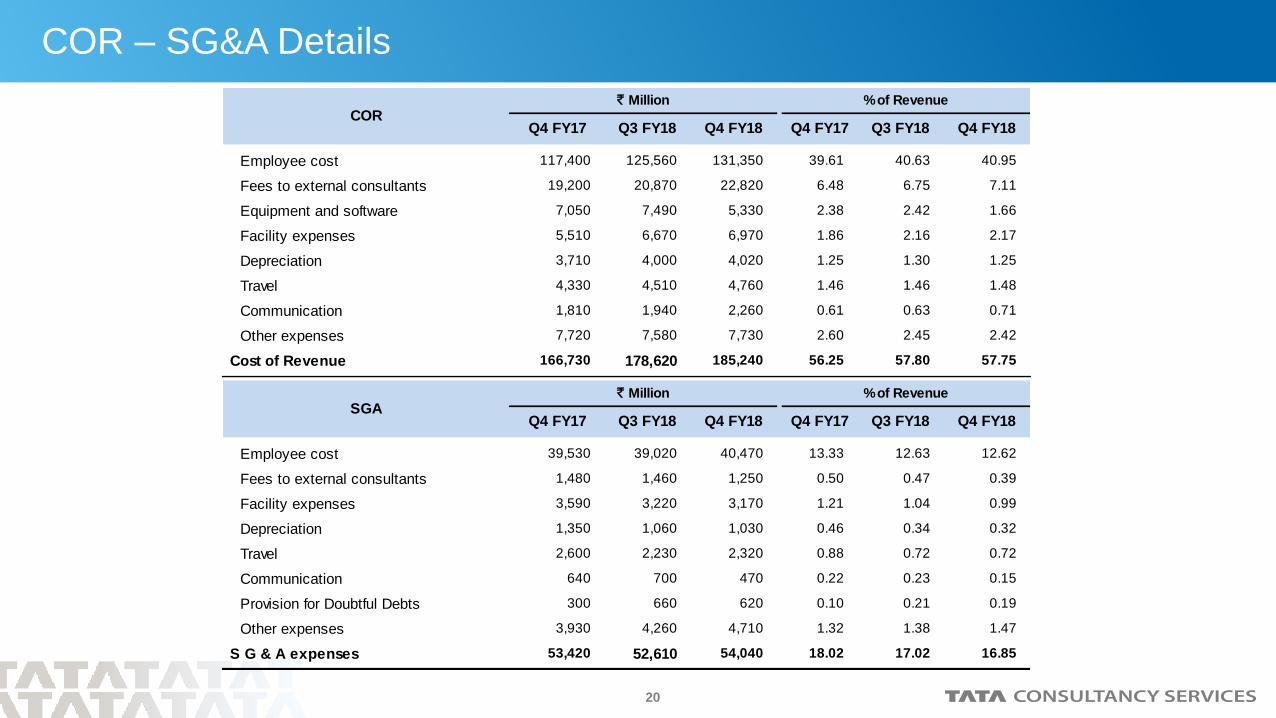
COR – SG&A Details
Employee cost 117,400 125,560 131,350 39.61 40.63 40.95
Fees to external consultants 19,200 20,870 22,820 6.48 6.75 7.11
Equipment and software 7,050 7,490 5,330 2.38 2.42 1.66
Facility expenses 5,510 6,670 6,970 1.86 2.16 2.17
Depreciation 3,710 4,000 4,020 1.25 1.30 1.25
Travel 4,330 4,510 4,760 1.46 1.46 1.48
Communication 1,810 1,940 2,260 0.61 0.63 0.71
Other expenses 7,720 7,580 7,730 2.60 2.45 2.42
Cost of Revenue 166,730 178,620 185,240 56.25 57.80 57.75
Employee cost 39,530 39,020 40,470 13.33 12.63 12.62
Fees to external consultants 1,480 1,460 1,250 0.50 0.47 0.39
Facility expenses 3,590 3,220 3,170 1.21 1.04 0.99
Depreciation 1,350 1,060 1,030 0.46 0.34 0.32
Travel 2,600 2,230 2,320 0.88 0.72 0.72
Communication 640 700 470 0.22 0.23 0.15
Provision for Doubtful Debts 300 660 620 0.10 0.21 0.19
Other expenses 3,930 4,260 4,710 1.32 1.38 1.47
S G & A expenses 53,420 52,610 54,040 18.02 17.02 16.85
Q4 FY17
Q4 FY17
Q4 FY18
% of Revenue
Q4 FY17
% of Revenue
Q3 FY18
Q4 FY17Q4 FY18
Q3 FY18 Q4 FY18
Q3 FY18 Q4 FY18
` Million
` Million
COR
SGAQ3 FY18
21
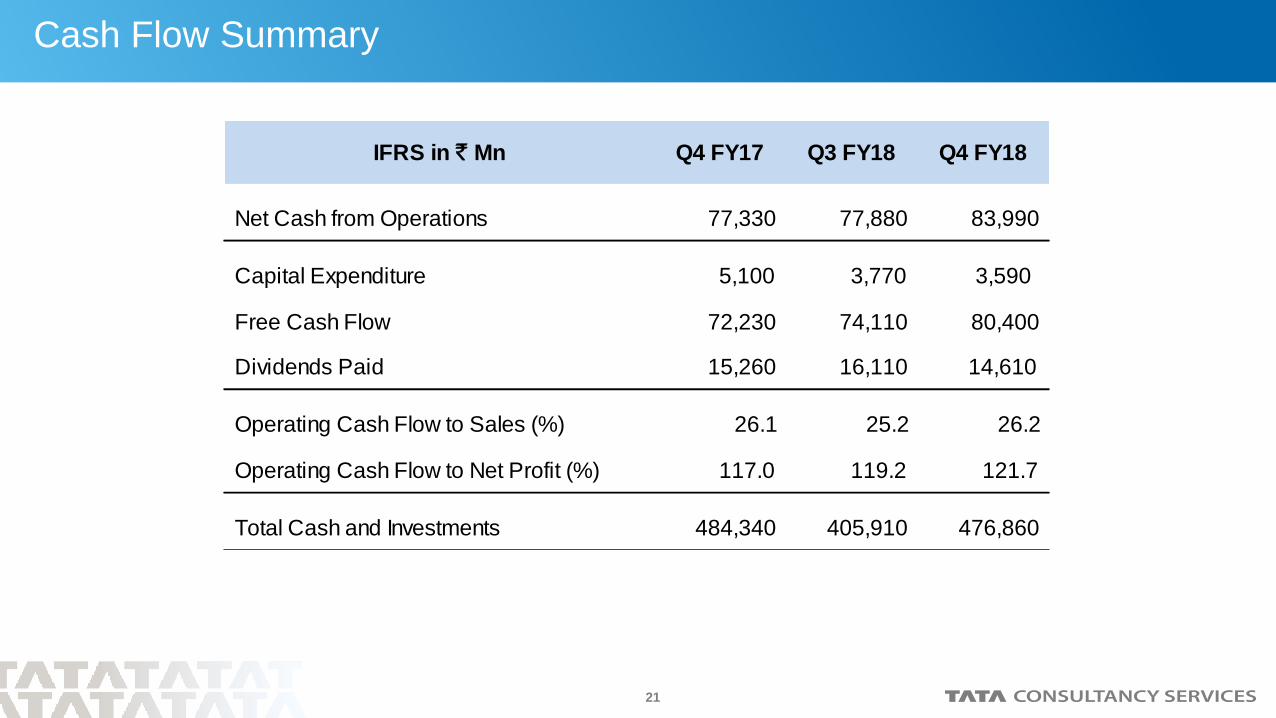
Cash Flow Summary
IFRS in ` Mn Q4 FY17 Q3 FY18 Q4 FY18
Net Cash from Operations 77,330 77,880 83,990
Capital Expenditure 5,100 3,770 3,590
Free Cash Flow 72,230 74,110 80,400
Dividends Paid 15,260 16,110 14,610
Operating Cash Flow to Sales (%) 26.1 25.2 26.2
Operating Cash Flow to Net Profit (%) 117.0 119.2 121.7
Total Cash and Investments 484,340 405,910 476,860
22
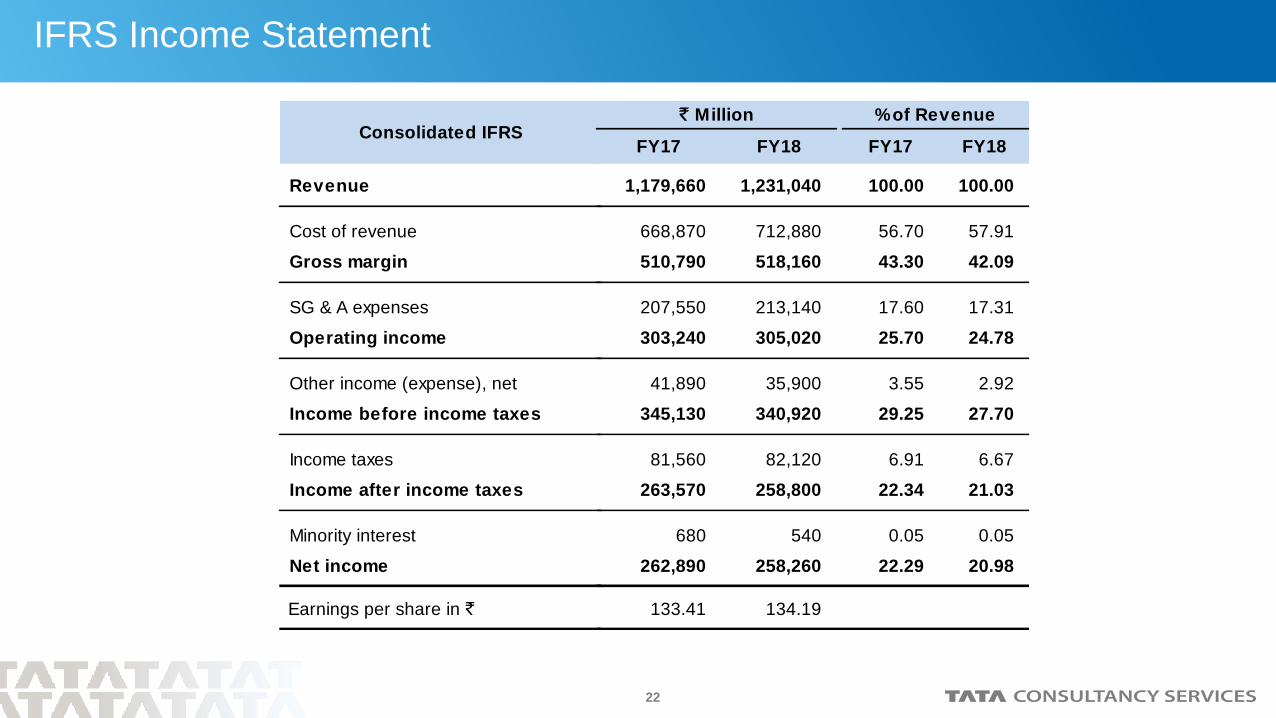
Revenue
Cost of revenue
Gross margin
SG & A expenses
Operating income
Other income (expense), net
Income before income taxes
Income taxes
Income after income taxes
Minority interest
Net income
Earnings per share in `
Consolidated IFRS
IFRS Income Statement
1,179,660 1,231,040 100.00 100.00
668,870 712,880 56.70 57.91
510,790 518,160 43.30 42.09
207,550 213,140 17.60 17.31
303,240 305,020 25.70 24.78
41,890 35,900 3.55 2.92
345,130 340,920 29.25 27.70
81,560 82,120 6.91 6.67
263,570 258,800 22.34 21.03
680 540 0.05 0.05
262,890 258,260 22.29 20.98
133.41 134.19
FY17 FY17 FY18
% of Revenue` Million
FY18
23
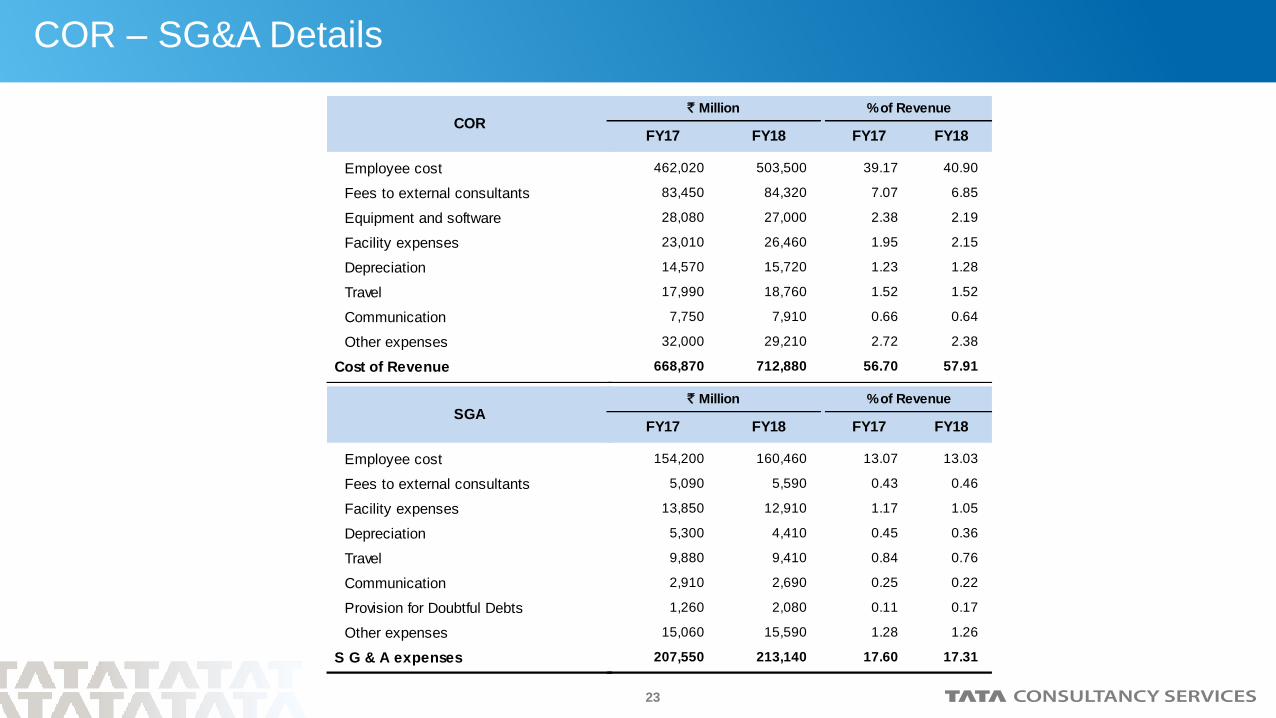
Employee cost
Fees to external consultants
Equipment and software
Facility expenses
Depreciation
Travel
Communication
Other expenses
Cost of Revenue
Employee cost
Fees to external consultants
Facility expenses
Depreciation
Travel
Communication
Provision for Doubtful Debts
Other expenses
S G & A expenses
COR
SGA
COR – SG&A Details
462,020 503,500 39.17 40.90
83,450 84,320 7.07 6.85
28,080 27,000 2.38 2.19
23,010 26,460 1.95 2.15
14,570 15,720 1.23 1.28
17,990 18,760 1.52 1.52
7,750 7,910 0.66 0.64
32,000 29,210 2.72 2.38
668,870 712,880 56.70 57.91
154,200 160,460 13.07 13.03
5,090 5,590 0.43 0.46
13,850 12,910 1.17 1.05
5,300 4,410 0.45 0.36
9,880 9,410 0.84 0.76
2,910 2,690 0.25 0.22
1,260 2,080 0.11 0.17
15,060 15,590 1.28 1.26
207,550 213,140 17.60 17.31
FY17 FY17
FY17 FY17 FY18
FY18
% of Revenue
% of Revenue
` Million
FY18
FY18
` Million
24
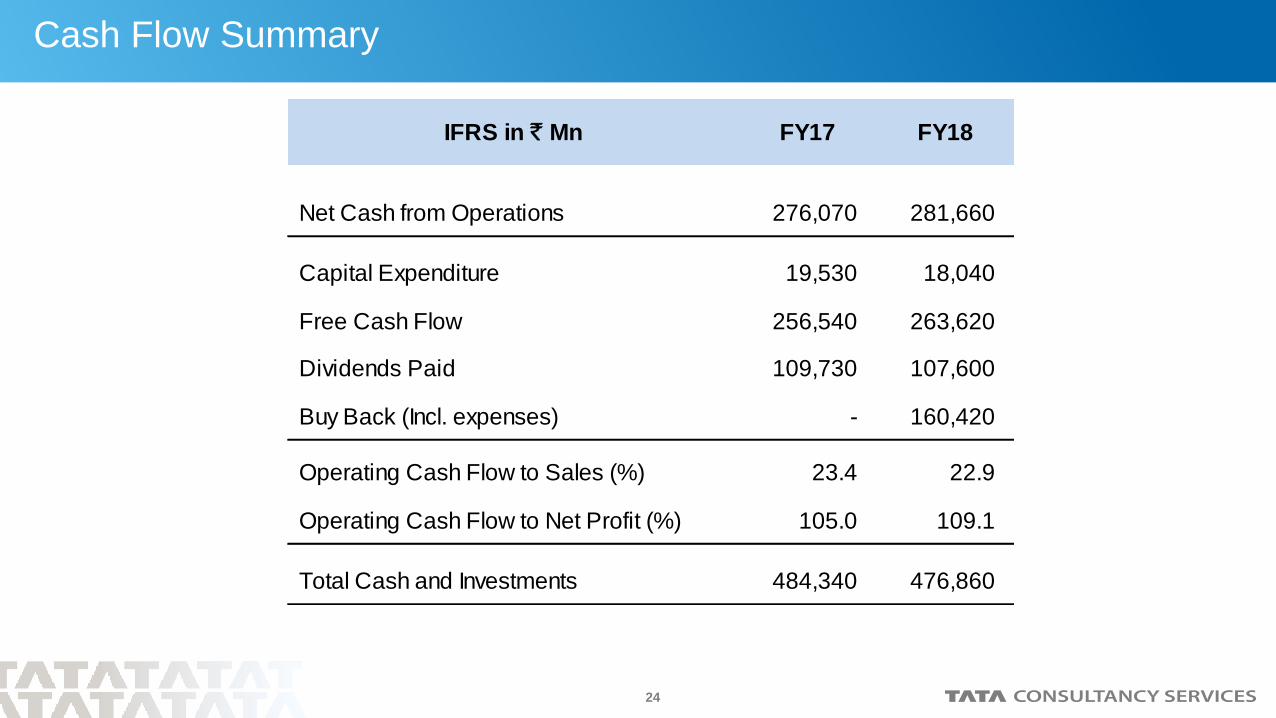
Cash Flow Summary
IFRS in ` Mn FY17 FY18
Net Cash from Operations 276,070 281,660
Capital Expenditure 19,530 18,040
Free Cash Flow 256,540 263,620
Dividends Paid 109,730 107,600
Buy Back (Incl. expenses) - 160,420
Operating Cash Flow to Sales (%) 23.4 22.9
Operating Cash Flow to Net Profit (%) 105.0 109.1
Total Cash and Investments 484,340 476,860
25
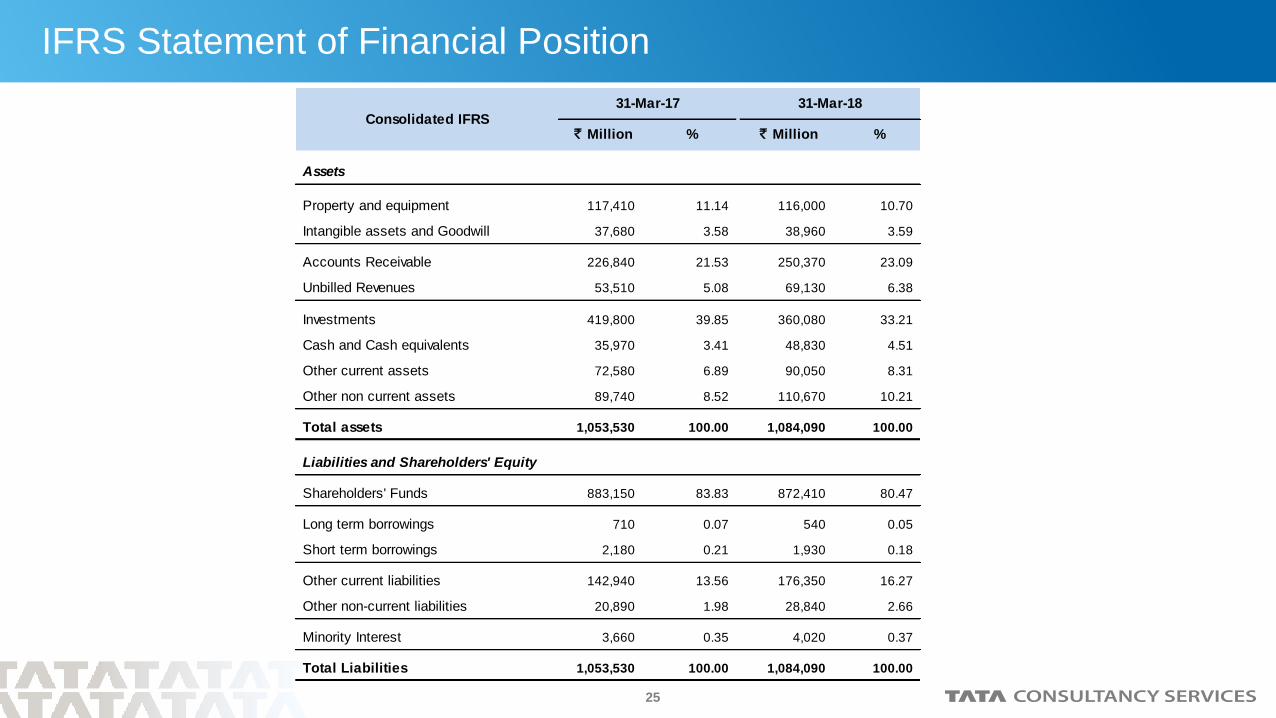
IFRS Statement of Financial Position
Assets
Property and equipment 117,410 11.14 116,000 10.70
Intangible assets and Goodwill 37,680 3.58 38,960 3.59
Accounts Receivable 226,840 21.53 250,370 23.09
Unbilled Revenues 53,510 5.08 69,130 6.38
Investments 419,800 39.85 360,080 33.21
Cash and Cash equivalents 35,970 3.41 48,830 4.51
Other current assets 72,580 6.89 90,050 8.31
Other non current assets 89,740 8.52 110,670 10.21
Total assets 1,053,530 100.00 1,084,090 100.00
Liabilities and Shareholders' Equity
Shareholders' Funds 883,150 83.83 872,410 80.47
Long term borrowings 710 0.07 540 0.05
Short term borrowings 2,180 0.21 1,930 0.18
Other current liabilities 142,940 13.56 176,350 16.27
Other non-current liabilities 20,890 1.98 28,840 2.66
Minority Interest 3,660 0.35 4,020 0.37
Total Liabilities 1,053,530 100.00 1,084,090 100.00
` Million % %Consolidated IFRS
` Million
31-Mar-17 31-Mar-18
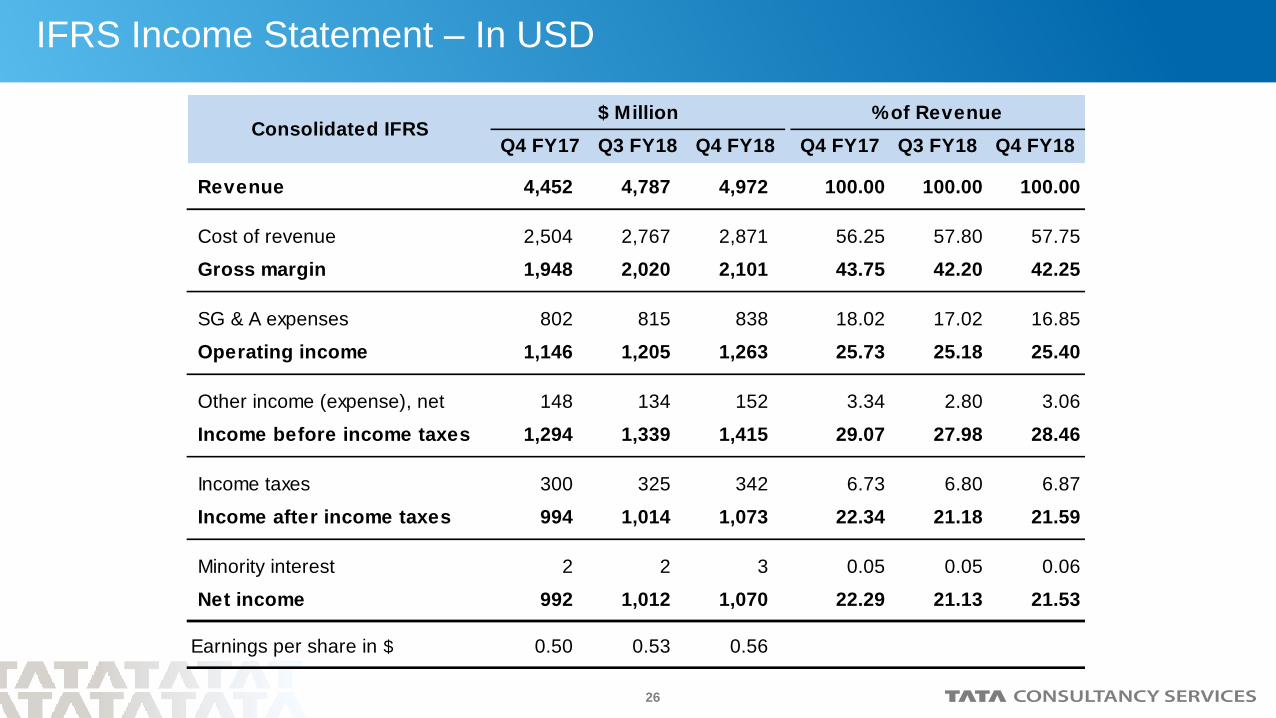
26
Revenue 4,452 4,787 4,972 100.00 100.00 100.00
Cost of revenue 2,504 2,767 2,871 56.25 57.80 57.75
Gross margin 1,948 2,020 2,101 43.75 42.20 42.25
SG & A expenses 802 815 838 18.02 17.02 16.85
Operating income 1,146 1,205 1,263 25.73 25.18 25.40
Other income (expense), net 148 134 152 3.34 2.80 3.06
Income before income taxes 1,294 1,339 1,415 29.07 27.98 28.46
Income taxes 300 325 342 6.73 6.80 6.87
Income after income taxes 994 1,014 1,073 22.34 21.18 21.59
Minority interest 2 2 3 0.05 0.05 0.06
Net income 992 1,012 1,070 22.29 21.13 21.53
Earnings per share in $ 0.50 0.53 0.56
Consolidated IFRSQ3 FY18 Q4 FY18
$ Million % of Revenue
Q4 FY17 Q4 FY17 Q3 FY18 Q4 FY18
IFRS Income Statement – In USD
27
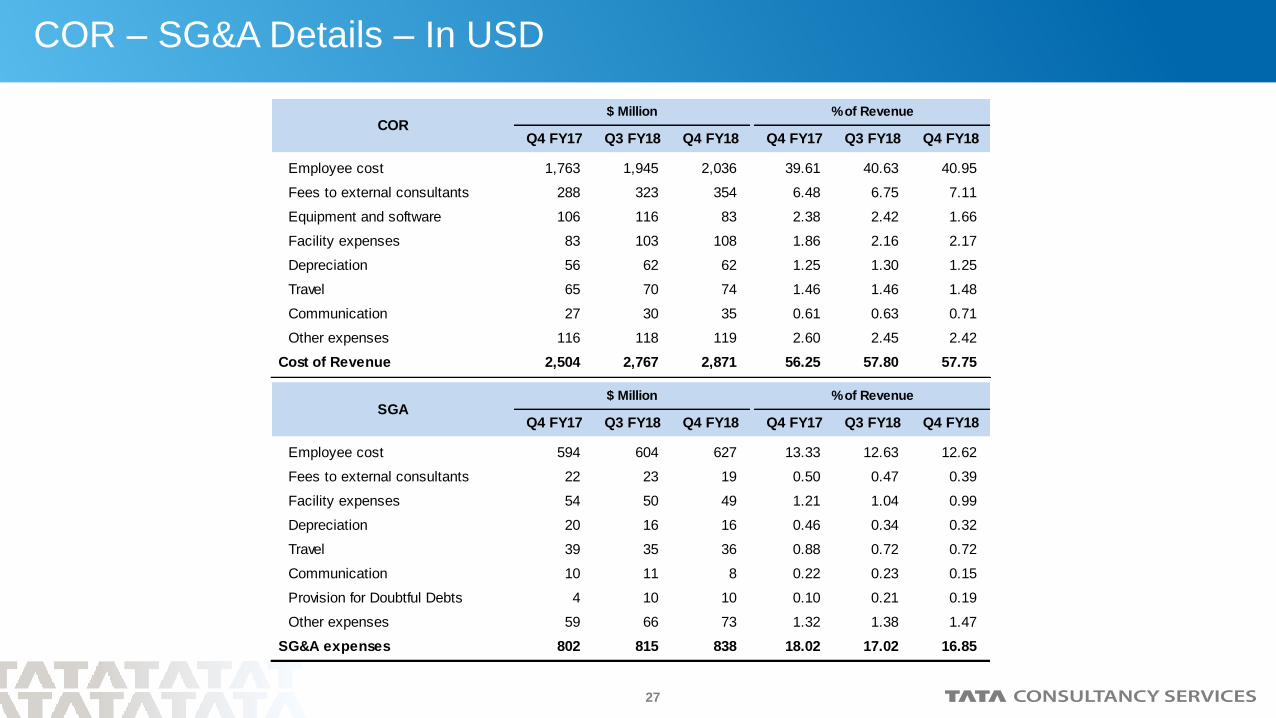
COR – SG&A Details – In USD
Employee cost 1,763 1,945 2,036 39.61 40.63 40.95
Fees to external consultants 288 323 354 6.48 6.75 7.11
Equipment and software 106 116 83 2.38 2.42 1.66
Facility expenses 83 103 108 1.86 2.16 2.17
Depreciation 56 62 62 1.25 1.30 1.25
Travel 65 70 74 1.46 1.46 1.48
Communication 27 30 35 0.61 0.63 0.71
Other expenses 116 118 119 2.60 2.45 2.42
Cost of Revenue 2,504 2,767 2,871 56.25 57.80 57.75
Employee cost 594 604 627 13.33 12.63 12.62
Fees to external consultants 22 23 19 0.50 0.47 0.39
Facility expenses 54 50 49 1.21 1.04 0.99
Depreciation 20 16 16 0.46 0.34 0.32
Travel 39 35 36 0.88 0.72 0.72
Communication 10 11 8 0.22 0.23 0.15
Provision for Doubtful Debts 4 10 10 0.10 0.21 0.19
Other expenses 59 66 73 1.32 1.38 1.47
SG&A expenses 802 815 838 18.02 17.02 16.85
Q4 FY17 Q4 FY17Q3 FY18 Q4 FY18
% of Revenue
Q3 FY18 Q4 FY18
SGA$ Million
Q4 FY18Q4 FY17 Q3 FY18 Q4 FY18 Q4 FY17 Q3 FY18
COR$ Million % of Revenue
28
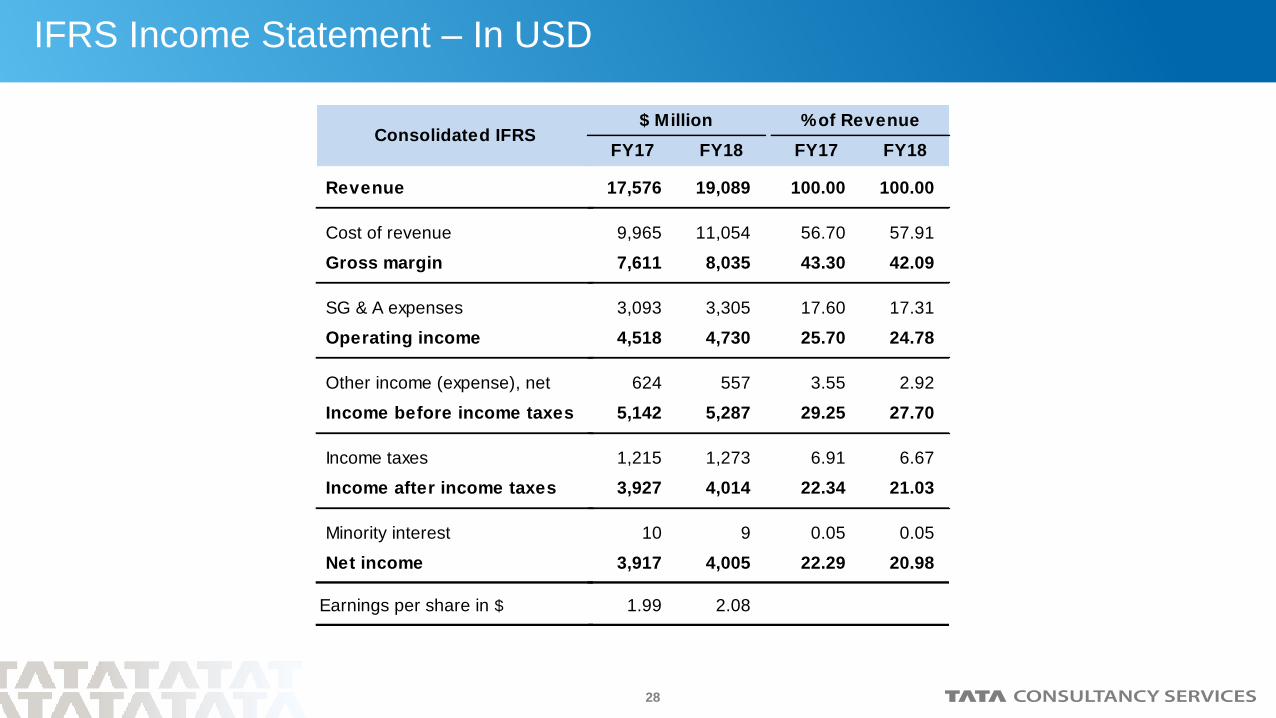
Revenue
Cost of revenue
Gross margin
SG & A expenses
Operating income
Other income (expense), net
Income before income taxes
Income taxes
Income after income taxes
Minority interest
Net income
Earnings per share in $
Consolidated IFRS
IFRS Income Statement – In USD
17,576 19,089 100.00 100.00
9,965 11,054 56.70 57.91
7,611 8,035 43.30 42.09
3,093 3,305 17.60 17.31
4,518 4,730 25.70 24.78
624 557 3.55 2.92
5,142 5,287 29.25 27.70
1,215 1,273 6.91 6.67
3,927 4,014 22.34 21.03
10 9 0.05 0.05
3,917 4,005 22.29 20.98
1.99 2.08
$ Million % of Revenue
FY18 FY18FY17 FY17
29
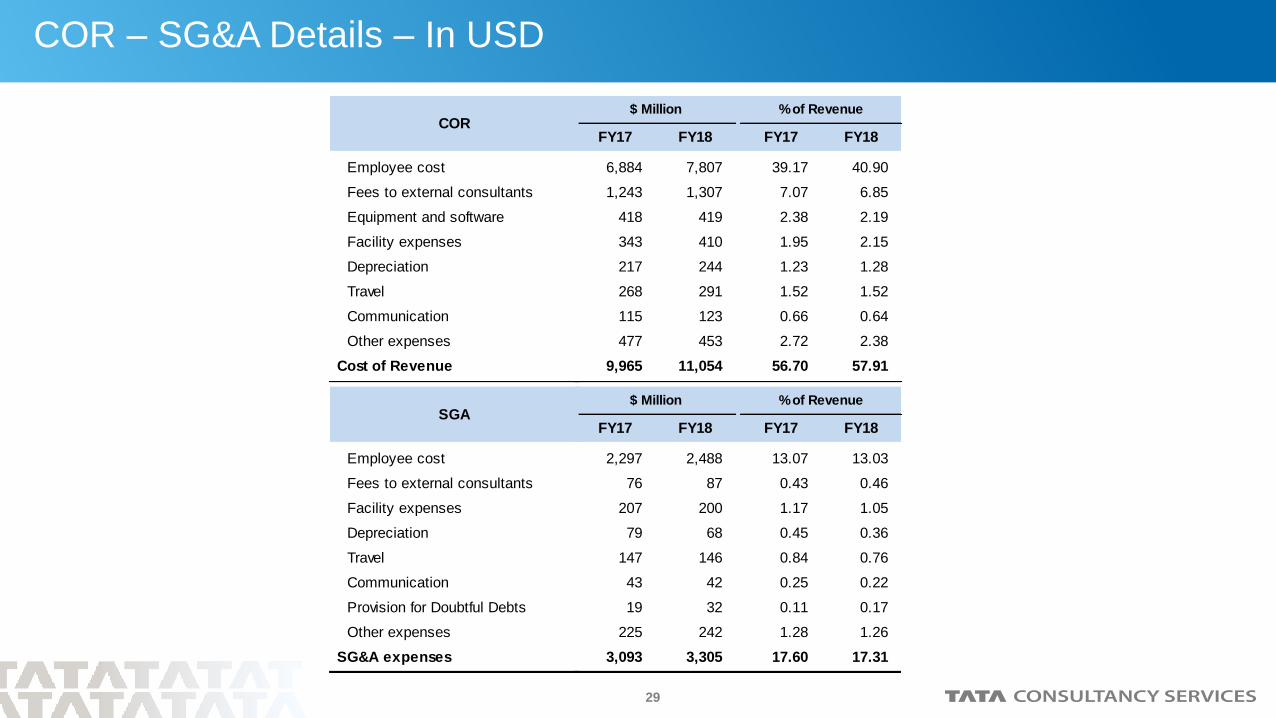
COR – SG&A Details – In USD
6,884 7,807 39.17 40.90
1,243 1,307 7.07 6.85
418 419 2.38 2.19
343 410 1.95 2.15
217 244 1.23 1.28
268 291 1.52 1.52
115 123 0.66 0.64
477 453 2.72 2.38
9,965 11,054 56.70 57.91
2,297 2,488 13.07 13.03
76 87 0.43 0.46
207 200 1.17 1.05
79 68 0.45 0.36
147 146 0.84 0.76
43 42 0.25 0.22
19 32 0.11 0.17
225 242 1.28 1.26
3,093 3,305 17.60 17.31
% of Revenue$ Million
FY18FY17FY17 FY18
FY18FY17 FY17FY18
% of Revenue$ Million
Employee cost
Fees to external consultants
Equipment and software
Facility expenses
Depreciation
Travel
Communication
Other expenses
Cost of Revenue
Employee cost
Fees to external consultants
Facility expenses
Depreciation
Travel
Communication
Provision for Doubtful Debts
Other expenses
SG&A expenses
SGA
COR
30
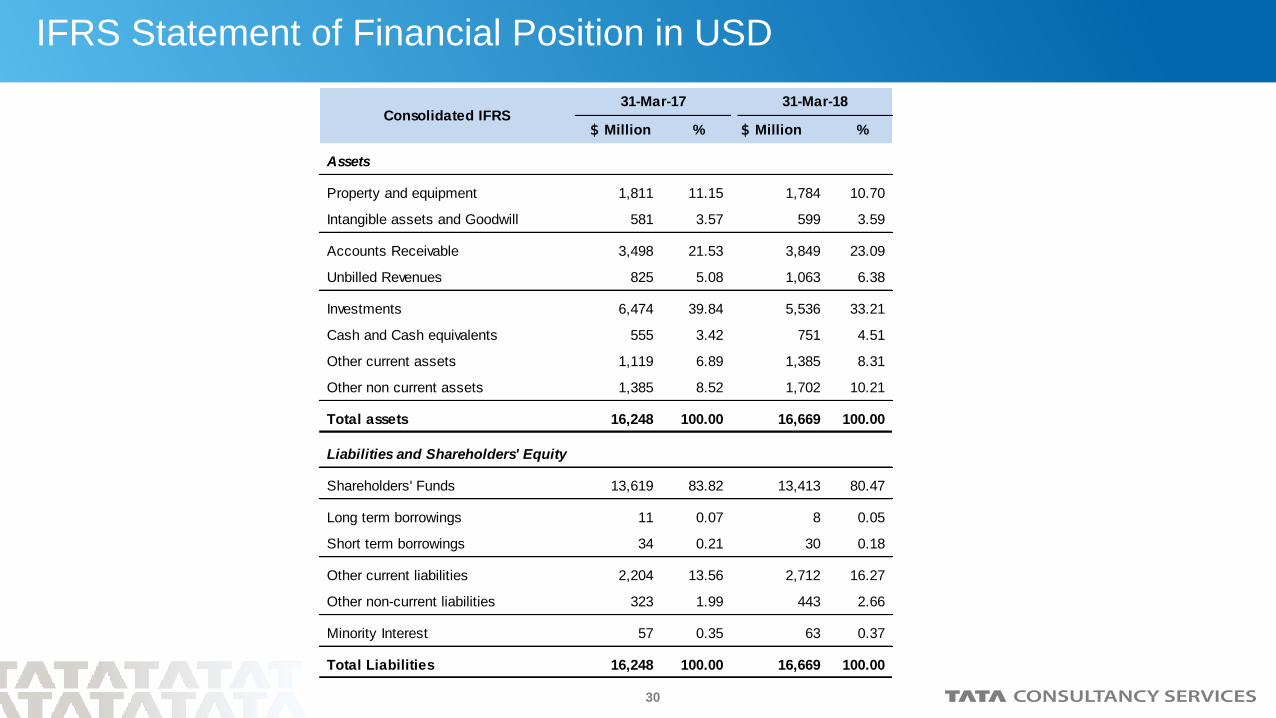
IFRS Statement of Financial Position in USD
$ Million % $ Million %
Assets
Property and equipment 1,811 11.15 1,784 10.70
Intangible assets and Goodwill 581 3.57 599 3.59
Accounts Receivable 3,498 21.53 3,849 23.09
Unbilled Revenues 825 5.08 1,063 6.38
Investments 6,474 39.84 5,536 33.21
Cash and Cash equivalents 555 3.42 751 4.51
Other current assets 1,119 6.89 1,385 8.31
Other non current assets 1,385 8.52 1,702 10.21
Total assets 16,248 100.00 16,669 100.00
Liabilities and Shareholders' Equity
Shareholders' Funds 13,619 83.82 13,413 80.47
Long term borrowings 11 0.07 8 0.05
Short term borrowings 34 0.21 30 0.18
Other current liabilities 2,204 13.56 2,712 16.27
Other non-current liabilities 323 1.99 443 2.66
Minority Interest 57 0.35 63 0.37
Total Liabilities 16,248 100.00 16,669 100.00
31-Mar-18Consolidated IFRS
31-Mar-17
31
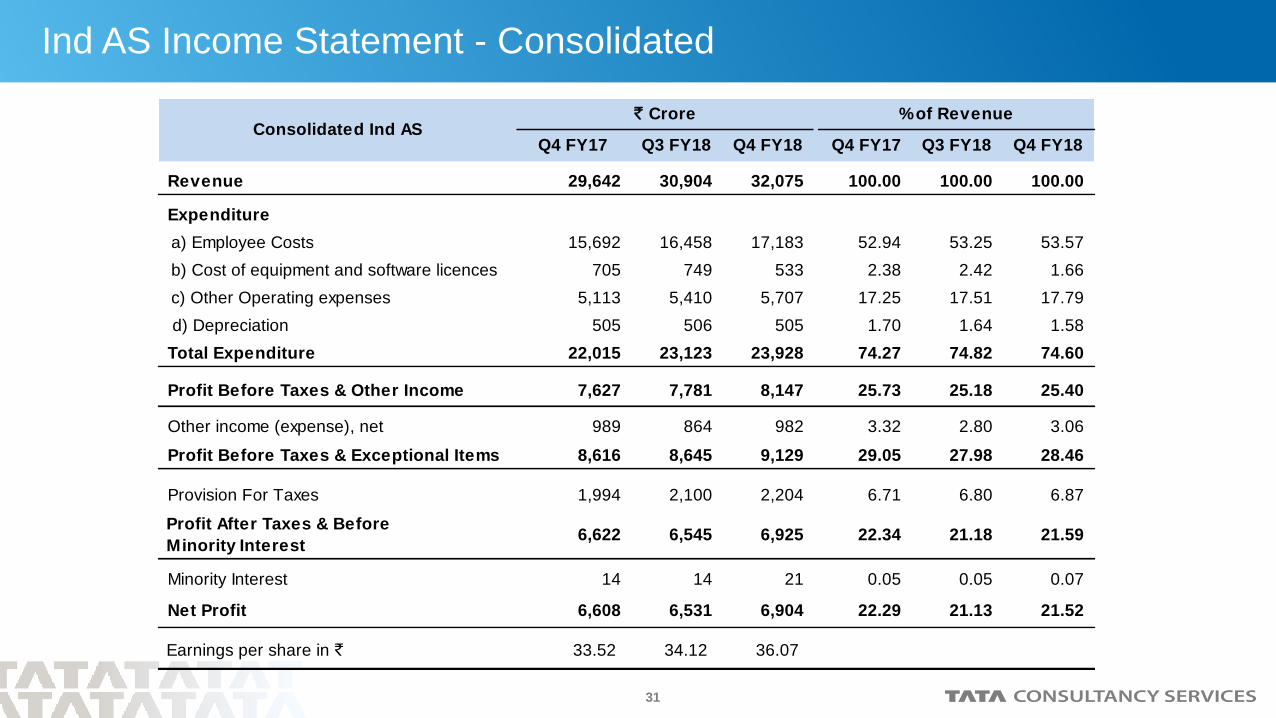
Ind AS Income Statement - Consolidated
Revenue 29,642 30,904 32,075 100.00 100.00 100.00
Expenditure
a) Employee Costs 15,692 16,458 17,183 52.94 53.25 53.57
b) Cost of equipment and software licences 705 749 533 2.38 2.42 1.66
c) Other Operating expenses 5,113 5,410 5,707 17.25 17.51 17.79
d) Depreciation 505 506 505 1.70 1.64 1.58
Total Expenditure 22,015 23,123 23,928 74.27 74.82 74.60
Profit Before Taxes & Other Income 7,627 7,781 8,147 25.73 25.18 25.40
Other income (expense), net 989 864 982 3.32 2.80 3.06
Profit Before Taxes & Exceptional Items 8,616 8,645 9,129 29.05 27.98 28.46
Provision For Taxes 1,994 2,100 2,204 6.71 6.80 6.87
Profit After Taxes & Before
Minority Interest 6,622 6,545 6,925 22.34 21.18 21.59
Minority Interest 14 14 21 0.05 0.05 0.07
Net Profit 6,608 6,531 6,904 22.29 21.13 21.52
Earnings per share in ` 33.52 34.12 36.07
Consolidated Ind ASQ3 FY18 Q4 FY18Q4 FY17 Q4 FY17
` Crore % of Revenue
Q3 FY18 Q4 FY18
32
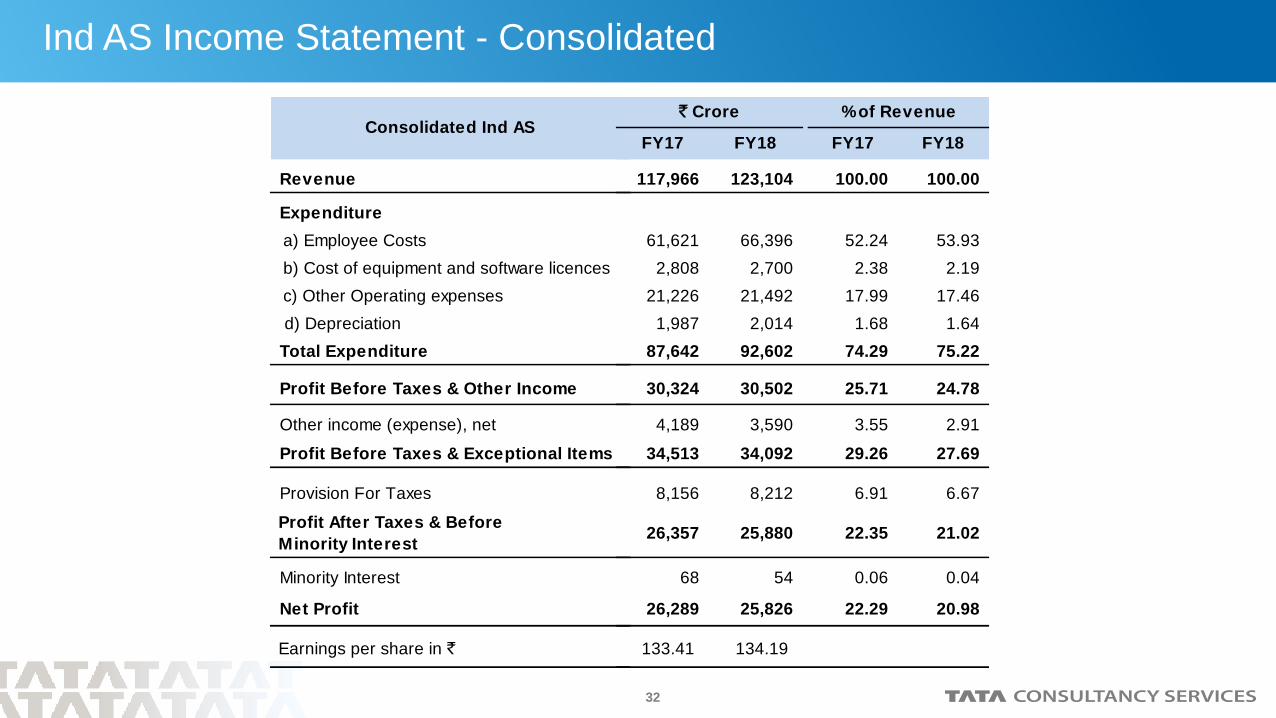
Ind AS Income Statement - Consolidated
Revenue
Expenditure
a) Employee Costs
b) Cost of equipment and software licences
c) Other Operating expenses
d) Depreciation
Total Expenditure
Profit Before Taxes & Other Income
Other income (expense), net
Profit Before Taxes & Exceptional Items
Provision For Taxes
Profit After Taxes & Before
Minority Interest
Minority Interest
Net Profit
Earnings per share in `
Consolidated Ind AS
117,966 123,104 100.00 100.00
61,621 66,396 52.24 53.93
2,808 2,700 2.38 2.19
21,226 21,492 17.99 17.46
1,987 2,014 1.68 1.64
87,642 92,602 74.29 75.22
30,324 30,502 25.71 24.78
4,189 3,590 3.55 2.91
34,513 34,092 29.26 27.69
8,156 8,212 6.91 6.67
26,357 25,880 22.35 21.02
68 54 0.06 0.04
26,289 25,826 22.29 20.98
133.41 134.19
FY17 FY17FY18 FY18
% of Revenue` Crore
33
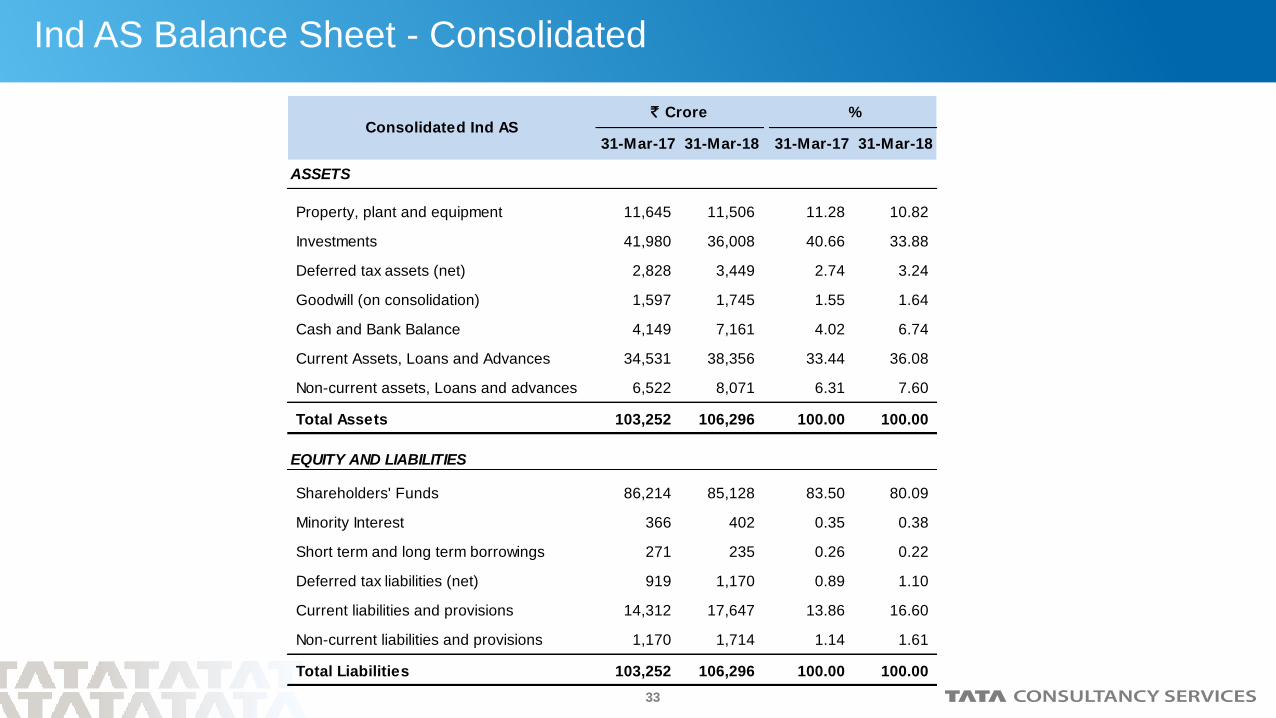
Ind AS Balance Sheet - Consolidated
31-Mar-17 31-Mar-18 31-Mar-17 31-Mar-18
ASSETS
Property, plant and equipment 11,645 11,506 11.28 10.82
Investments 41,980 36,008 40.66 33.88
Deferred tax assets (net) 2,828 3,449 2.74 3.24
Goodwill (on consolidation) 1,597 1,745 1.55 1.64
Cash and Bank Balance 4,149 7,161 4.02 6.74
Current Assets, Loans and Advances 34,531 38,356 33.44 36.08
Non-current assets, Loans and advances 6,522 8,071 6.31 7.60
Total Assets 103,252 106,296 100.00 100.00
EQUITY AND LIABILITIES
Shareholders' Funds 86,214 85,128 83.50 80.09
Minority Interest 366 402 0.35 0.38
Short term and long term borrowings 271 235 0.26 0.22
Deferred tax liabilities (net) 919 1,170 0.89 1.10
Current liabilities and provisions 14,312 17,647 13.86 16.60
Non-current liabilities and provisions 1,170 1,714 1.14 1.61
Total Liabilities 103,252 106,296 100.00 100.00
%` CroreConsolidated Ind AS
34
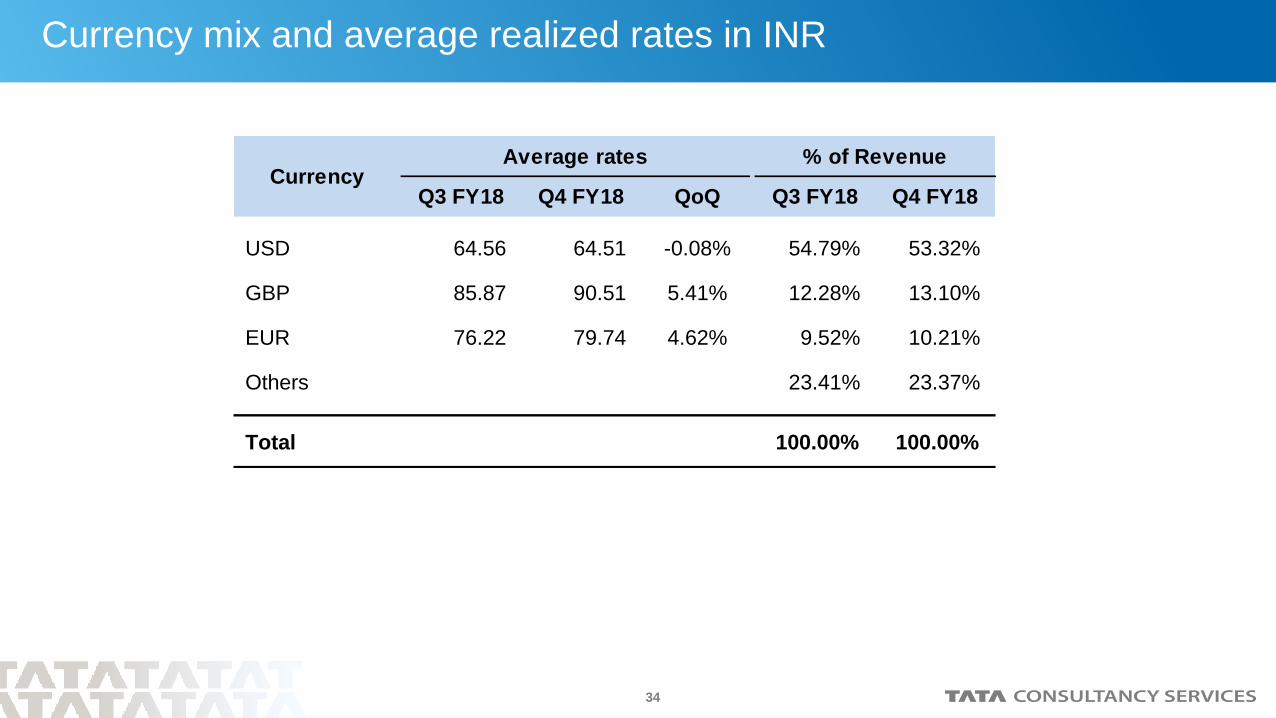
Currency mix and average realized rates in INR
Q3 FY18 Q4 FY18 QoQ Q3 FY18 Q4 FY18
USD 64.56 64.51 -0.08% 54.79% 53.32%
GBP 85.87 90.51 5.41% 12.28% 13.10%
EUR 76.22 79.74 4.62% 9.52% 10.21%
Others 23.41% 23.37%
Total 100.00% 100.00%
Currency% of RevenueAverage rates
Thank You
IT Services
Business Solutions
Consulting