Embed Size (px)
Citation preview
TCP Round Trip Time Analysis in a University Network Justifying the pursuit of Active Queue Management research
Jonathan Thyer
The University of North Carolina at Greensboro
Greensboro, NC 27402
ABSTRACT
The modern Internet is inter-connected with high speed fiber optic paths.
Congestion areas are more likely to be in traffic routers rather than
physical links. TCP round trip time (RTT) is known to be the key
performance measure. This paper describes a method and
implementation to collect TCP RTT data between a mid-size University
network and service provider router. Data collection results along with an
interpretation of these results are presented. Significant global TCP
congestion control synchronization along with router queue oscillation is
indicated by the results of this study. This paper additionally describes a
small research network build, which can be used to generate TCP traffic,
producing conditions necessary for active queue management (AQM)
research.
1
1. INTRODUCTION
A majority of network congestion control research focuses on transport protocol
reaction to packet loss. In the modern Internet, high-speed routers with extremely high
capacity fiber optic links are commonplace. Today’s network congestion is influenced
more by router operation, configuration, buffer characteristics and associated queue
oscillation behavior, than physical media limitations.
Jacobson and Floyd have authored the well-known random early detection (RED)
algorithm for router queue based congestion control[4]. RED is widely available in
commercial routers but poorly understood. It is not easy to measure the effectiveness of
enabling RED in a production network environment. Fear of an unknown result
promotes network operators to leave routers in a default drop-tail queue configuration
or enable RED in a vendor default configuration, assuming that the result will be
effective. Enabling any algorithm that affects queue characteristics can have end to end,
multiple provider effects in the Internet.
Due to the complexity and significant challenge of performing research within an
Internet context, a large majority of research occurs within the popular NS2 simulator
environment[7]. In recent years, NS2 has been a popular research vehicle due to its easy
portability and tool command language (TCL) scripting interface.
This paper describes the development of a tool to analyze traffic collected on the
Internet Service Provider (ISP) link between the University of North Carolina at
Greensboro (UNCG) and the commodity Internet. The paper further describes the
results of the analysis work and extends into the development of a small network
simulation environment.
UNCG is a medium sized University with approximately 15,000 students, and 2,000
faculty/staff members. Network access is provided to approximately 6,000 end stations
2
consisting of approximately 3,500 student owned stations, and 2,500 faculty/staff and
public lab stations.
Network connectivity is provided to the North Carolina Research and Education
Network (NCREN) through a gigabit Ethernet fiber optic connection. The Greensboro
NCREN regional point of presence (RPOP) provides connectivity to the research
triangle park area through an OC-48 self-healing fiber optic ring topology. The NCREN
network is further connected to the Internet through several commercial providers
including Level3, Quest, and Sprint.
Within any business day, traffic entering UNCG averages about 50 megabits per
second. Traffic leaving the campus averages about 20 megabits per second.
The tool and traffic analysis described within this paper were developed on a
FreeBSD[10] system using the packet capture (PCAP) library[8].
2. MEASURED CHARACTERISTICS
For measurement purposes, the goals were to understand the percentage breakdown of
Internet Protocol (IP) traffic by protocol, and then to specifically focus on TCP
characteristics on a per TCP flow basis.
A TCP flow is defined as the five-tuple of TCP protocol, source IP address, destination
IP address, source TCP port, and destination TCP port.
For an individual TCP flow, the round trip time (RTT) is defined as the time taken for a
TCP segment to reach the receiver and for the associated TCP acknowledgement packet
to reach the sender.
3
RTT is an integral part of TCP implementation on end host systems. It is well known in
the network congestion research community that the performance of a TCP flow is
affected by its RTT. RTT can affect not only the data transmission rate but also the
utilization of any shared Internet link or routing location.
Duration was measured as the time difference between the first TCP synchronize (SYN)
packet and the first finish (FIN) packet for an identified flow. TCP reset (RST) packets
were treated in the same fashion as TCP FIN packets.
2.1 DATA COLLECTION
Data from the UNCG – NCREN link was collected using tcpdpriv[9] on a FreeBSD host.
Through the use of a common open source tool, the multi-router traffic grapher
(MRTG), it was determined that the maximum aggregate traffic speed did not exceed
100 megabits per second on any given UNCG business day. This enabled the use of a
common port mirroring technique to copy all transmitted and received data from the
UNCG - NCREN router connection to a single 100 megabit per second connected host.
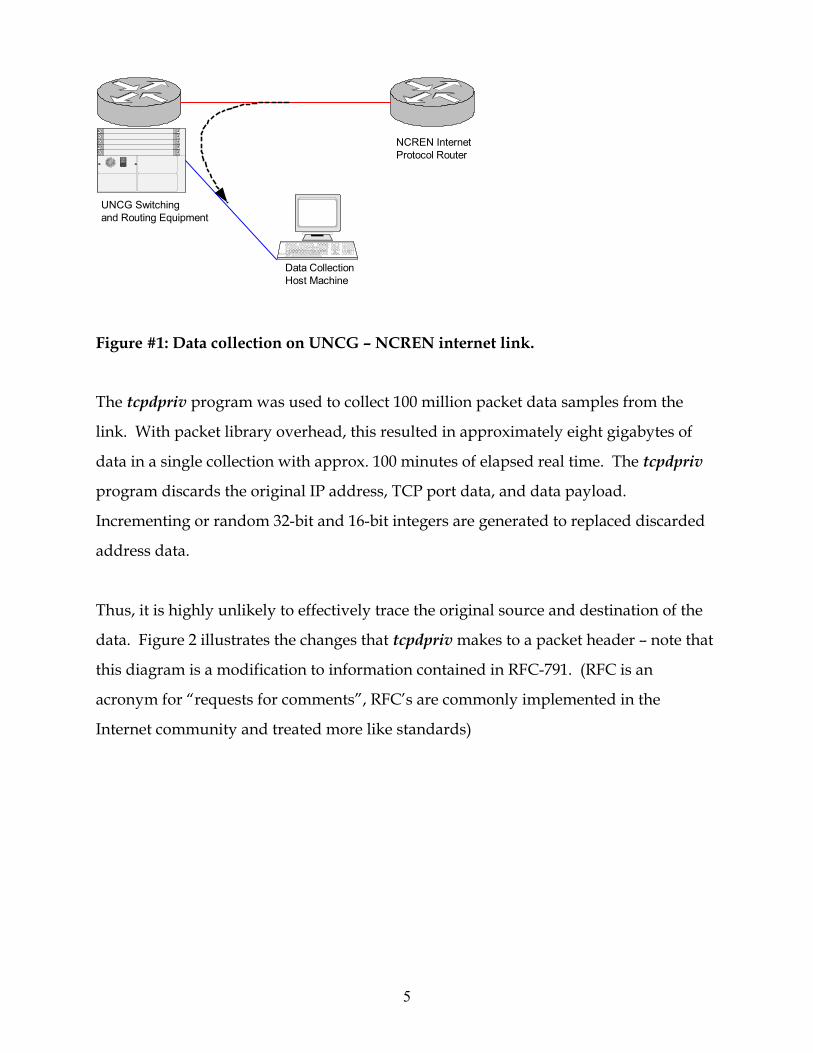
The collection host was connected using a Category 5 un-shielded twisted pair cable set
to full duplex operation with a dedicated segment. This connection represents a single
collision domain (point to point) thus no physical errors, or framing delay is
introduced. Figure 1 illustrates the connection method for the collection host.
4
Data CollectionHost Machine
NCREN InternetProtocol Router
UNCG Switchingand Routing Equipment
Figure #1: Data collection on UNCG – NCREN internet link.
The tcpdpriv program was used to collect 100 million packet data samples from the
link. With packet library overhead, this resulted in approximately eight gigabytes of
data in a single collection with approx. 100 minutes of elapsed real time. The tcpdpriv
program discards the original IP address, TCP port data, and data payload.
Incrementing or random 32-bit and 16-bit integers are generated to replaced discarded
address data.
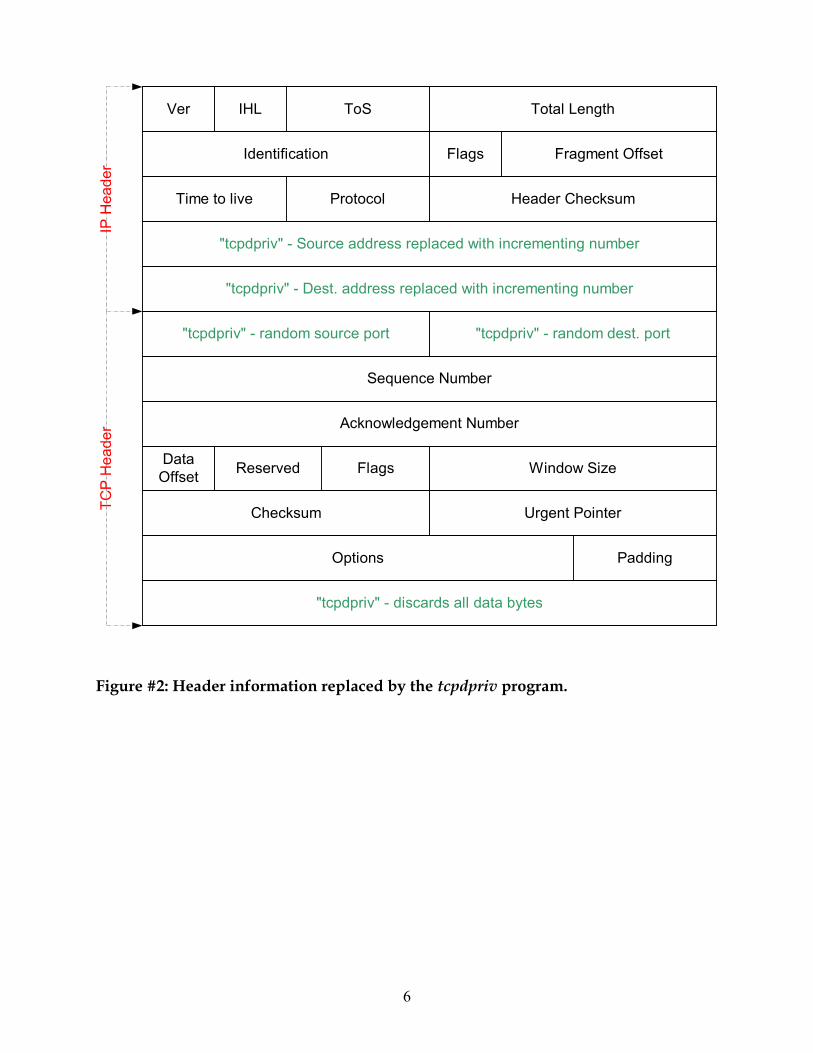
Thus, it is highly unlikely to effectively trace the original source and destination of the
data. Figure 2 illustrates the changes that tcpdpriv makes to a packet header – note that
this diagram is a modification to information contained in RFC-791. (RFC is an
acronym for “requests for comments”, RFC’s are commonly implemented in the
Internet community and treated more like standards)
5
Options Padding
Ver IHL ToS Total Length
Identification Flags Fragment Offset
Time to live Protocol Header Checksum
"tcpdpriv" - discards all data bytes
"tcpdpriv" - Source address replaced with incrementing number
"tcpdpriv" - Dest. address replaced with incrementing number
"tcpdpriv" - random source port "tcpdpriv" - random dest. port
Sequence Number
Acknowledgement Number
DataOffset FlagsReserved Window Size
Checksum Urgent Pointer
IP H
eade
rTC
P H
eade
r
Figure #2: Header information replaced by the tcpdpriv program.
6
2.2 CALCULATING RTT
There are a number of ways to calculate RTT of which vary in terms of computational
needs. A related paper describes three different methods:
(1) SYN Method – subtract the difference between the time of the TCP synchronize
acknowledgement packet (SYN-ACK) and the first data packet. Use this value to
represent the RTT for an entire flow[2][3].
(2) Flight Method – define a flight as a sequence of identical packets with nearly
identical inter-arrival time (IAT), followed by a larger IAT. Thus a flow would contain
a flight of packets followed by a gap, then another flight of packets. Nearly identical
IAT is defined by using a time threshold (T). The flight of packets structure with a gap
would arise with the use of TCP window based congestion control. This behavior is
sometimes referred to as bursts of traffic. The time between the leading edge of a flight
and the leading edge of the next flight is defined as RTT. Over a single flow, flight
difference values would be averaged to yield an approximate RTT[3].
(3) Rate Change Method – considers TCP dynamics at a fluid level. A fluid level
definition considers traffic in terms of bits per unit of time. This method proposes that
during a congestion avoidance phase between two different points in time, and if there
are no packet drops, then 22 dtxdMTURTT = where MTU is equal to the maximum
transfer unit, and x is the number of bits transferred in time interval t. Note that MTU
is directly related to the maximum segment size[3].
The basis of this suggestion is that during congestion avoidance mode, the congestion
window increases by one maximum segment size (MSS) every RTT. An arbitrary
7
threshold of 15 packets (or first out of sequence packet) is chosen to ensure that a flow is
in congestion avoidance mode. Multiple RTT values are obtained and averaged.
Although research opinions differ, a related paper concludes “The SYN based method
does not underestimate RTT”[3]. Additionally, in our study, limited computational
resources dictated an efficient RTT calculation method. A variation of calculating RTT
by using the different between SYN and SYN-ACK was used in the software developed.
The PCAP library uses a UNIX time value data structure that consists of two counters,
milliseconds (ms), and microsecond (usec). In order to minimize possible time
measurement errors, the microsecond time value was multiplied by 1000 and added
into the millisecond value. This normalized all time measurements to milliseconds[2].
Time measurement errors may be introduced due to delay in processing packet payload
by network interface card hardware, and driver software. These delays should be
consistent for an entire data collection assuming no other significant processing load on
the collecting host. Additionally, tcpdpriv attempts to report any lost packets during
capture. Data samples taken did not report any packet loss during capture.
3. ANALYSIS OF THE COLLECTED DATA
The PCAP library can be used in two modes, either for listening promiscuously on a
network interface, or for reading a file of pre-captured network headers. To analyze the
collected datasets, a program called tcpflowstat was developed. tcpflowstat functions
by reading a data file that is in PCAP format.
The sequence of operations for PCAP usage is fairly high level from an Ethernet frame
point of view. PCAP does not provide functions that perform any detailed packet
header inspection. In pseudo-code, the API is used as follows:
8
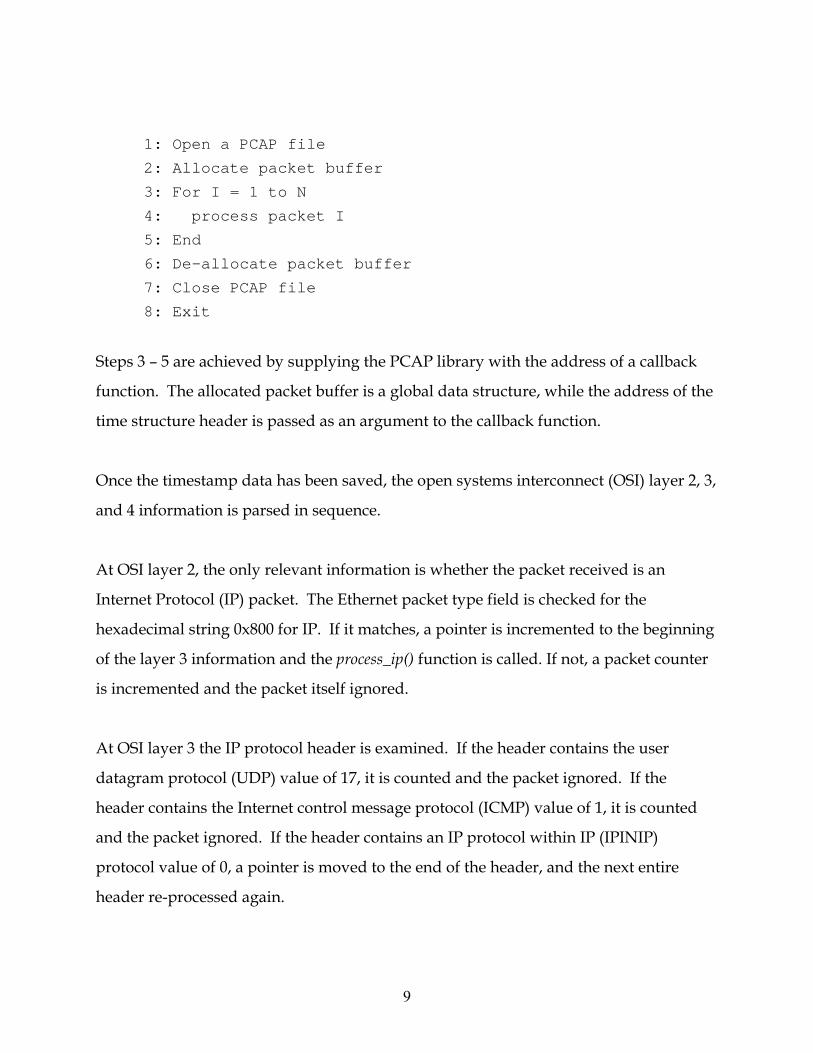
1: Open a PCAP file
2: Allocate packet buffer
3: For I = 1 to N
4: process packet I
5: End
6: De-allocate packet buffer
7: Close PCAP file
8: Exit
Steps 3 – 5 are achieved by supplying the PCAP library with the address of a callback
function. The allocated packet buffer is a global data structure, while the address of the
time structure header is passed as an argument to the callback function.
Once the timestamp data has been saved, the open systems interconnect (OSI) layer 2, 3,
and 4 information is parsed in sequence.
At OSI layer 2, the only relevant information is whether the packet received is an
Internet Protocol (IP) packet. The Ethernet packet type field is checked for the
hexadecimal string 0x800 for IP. If it matches, a pointer is incremented to the beginning
of the layer 3 information and the process_ip() function is called. If not, a packet counter
is incremented and the packet itself ignored.
At OSI layer 3 the IP protocol header is examined. If the header contains the user
datagram protocol (UDP) value of 17, it is counted and the packet ignored. If the
header contains the Internet control message protocol (ICMP) value of 1, it is counted
and the packet ignored. If the header contains an IP protocol within IP (IPINIP)
protocol value of 0, a pointer is moved to the end of the header, and the next entire
header re-processed again.
9
If the packet contains a transport control protocol (TCP) value of 6, the pointer is
incremented and the process_tcp() function called.
3.1 PERFORMING TCP PACKET ANALYSIS (OSI Layer 4)
For the purposes of providing additional data structure and key information, a
timestamp indicating the relative time of packet arrived, and the layer 3 IP source and
destination information has been retained.
For effective statistical analysis, the proper unique key information (5-tuple identified
above) and time must be recorded for TCP flow durations. To effectively track this
data, I use a data structure that contains similar fields to a packet header. The data
structure is listed below:
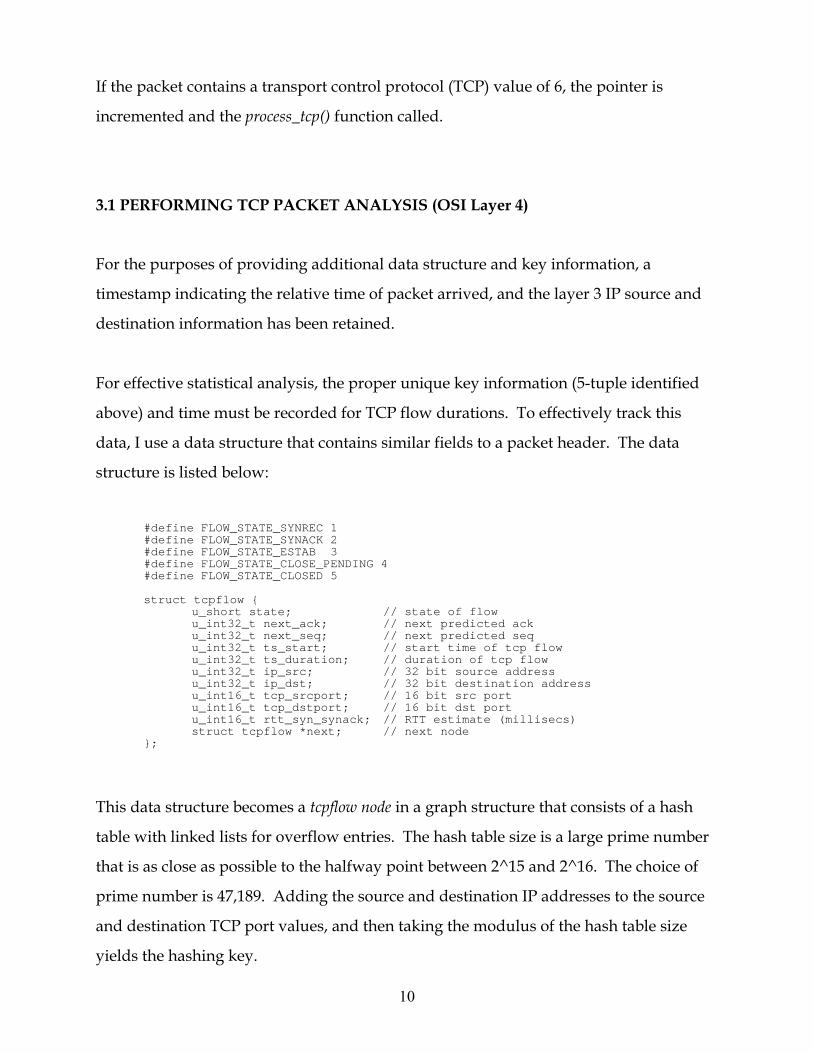
#define FLOW_STATE_SYNREC 1 #define FLOW_STATE_SYNACK 2 #define FLOW_STATE_ESTAB 3 #define FLOW_STATE_CLOSE_PENDING 4 #define FLOW_STATE_CLOSED 5
struct tcpflow {
u_short state; // state of flow u_int32_t next_ack; // next predicted ack u_int32_t next_seq; // next predicted seq u_int32_t ts_start; // start time of tcp flow u_int32_t ts_duration; // duration of tcp flow u_int32_t ip_src; // 32 bit source address u_int32_t ip_dst; // 32 bit destination address u_int16_t tcp_srcport; // 16 bit src port u_int16_t tcp_dstport; // 16 bit dst port u_int16_t rtt_syn_synack; // RTT estimate (millisecs) struct tcpflow *next; // next node
};
This data structure becomes a tcpflow node in a graph structure that consists of a hash
table with linked lists for overflow entries. The hash table size is a large prime number
that is as close as possible to the halfway point between 2^15 and 2^16. The choice of
prime number is 47,189. Adding the source and destination IP addresses to the source
and destination TCP port values, and then taking the modulus of the hash table size
yields the hashing key.
10
The code checks for a TCP packet header with the synchronize (SYN) flag set. If a
matching packet header is located, it indicates the potential start of a TCP flow.
Memory is allocated for a tcpflow node, the source and destination addresses, the
timestamp, and the next predicted sequence and acknowledge numbers are recorded.
The node is then added to the hash table.
If, subsequently, a packet is found with the SYN and ACK flags set, and that packet
matches an entry in the hash data structure, it is considered the second part of the three-
way TCP handshake. At this stage, the tcpflow node is updated with new information,
most importantly; the difference between the start time and current time is calculated.
This time difference is recorded as the RTT.
During the three-way handshake, the tcpflow node state is updated from SYNREC (1), to
SYNACK (2), to ESTAB (3) in accordance with the above code definitions.
When a TCP finish (FIN) or TCP reset (RST) packet is received for a matching flow
contained in the hashing data structure, the difference between the start and end time is
calculated for the flow duration. The tcpflow node is then removed from the hash table
and added to a link list of closed flows for later analysis.
When all of the packets have been read and processed from the file, the resulting linked
list of closed flows is further processed as follows.
(1) The duration data is sorted, and the median, mean, minimum and maximum
values are calculated.
(2) The RTT data is sorted, and the median, mean, minimum and maximum values
are calculated.
(3) A frequency table of RTT values is summed per RTT interval. The code uses one
as the default RTT interval.
(4) RTT and duration statistics are output to the screen.
11
(5) The RTT frequency table is written to a file along with a GNUPLOT instruction
file.
(6) Aggregate statistics are also output.
It is important to note that almost all TCP packets within a PCAP file become
represented within the flow hash table and thus considerable memory resources are
required when analyzing many thousands of parallel TCP flows. It is also important
that flow lookups in the hash table approximate runtime O(1) due to the fact that the
table is searched frequently during data analysis. Since memory is dynamically
allocated during runtime, memory allocation and de-allocation should also be as
efficient as possible.
Runtime tests of this code were performed on an Intel Pentium III system with a 1Ghz
processor and 512MB of RAM. Successful analysis of 100 million packets (approx.
900,000 TCP flows) can be performed in about 30 minutes of elapsed time. During this
runtime, each allocated tcpflow node requires 40 bytes of memory thus 900,000 TCP
flows required approx 36 MB of RAM purely for node storage of proper flows. Note that
the common use of TCP SYN packet scanning tools will increase the memory usage of
this tool since all TCP SYN packet headers will be treated as the potential beginning of a
flow.
The hashing key algorithm tends to have collisions from the upper bound back thus
linearly increasing the table search time as the number of flows is greater than 47,189.
More efficiency might be obtained through a different choice of algorithm for the data
structure key[11].
It is possible to discard the tcpflow node after the appropriate data has been processed
to save on memory. Repeated experimentation using this method did not prove
12
effective because the number of flows that are in an established state in parallel is the
controlling variable for RAM usage.
4. RESULTS
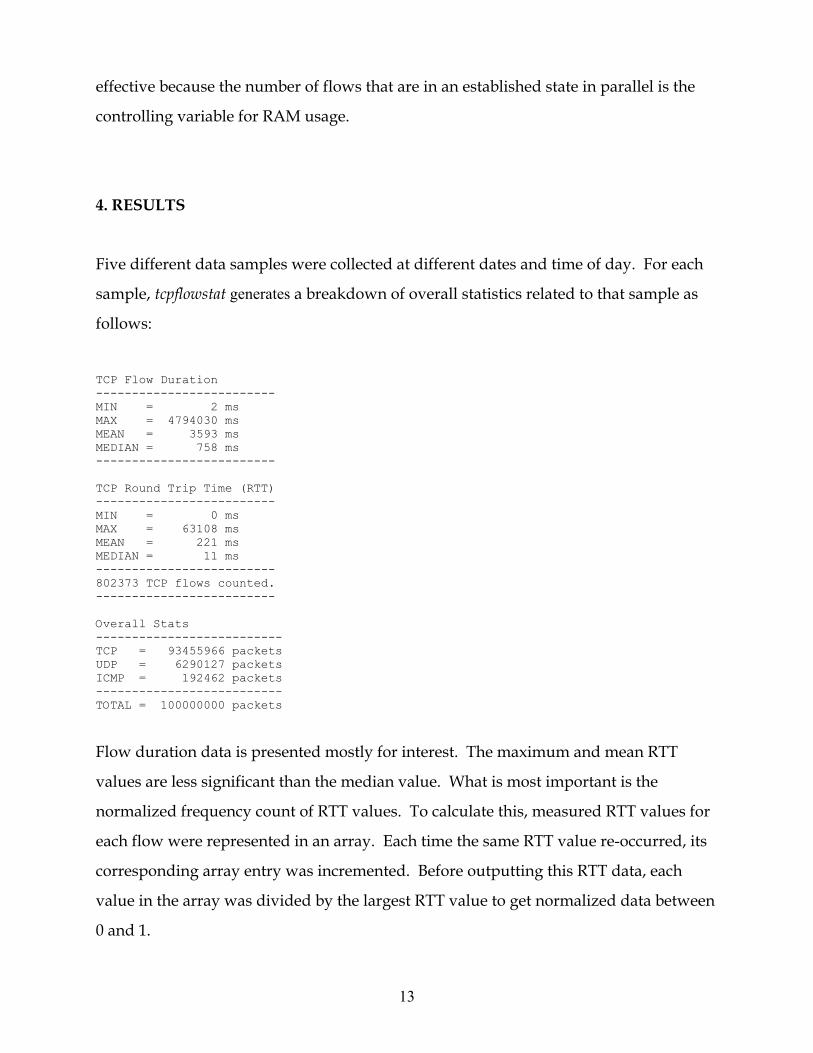
Five different data samples were collected at different dates and time of day. For each
sample, tcpflowstat generates a breakdown of overall statistics related to that sample as
follows:
TCP Flow Duration ------------------------- MIN = 2 ms MAX = 4794030 ms MEAN = 3593 ms MEDIAN = 758 ms ------------------------- TCP Round Trip Time (RTT) ------------------------- MIN = 0 ms MAX = 63108 ms MEAN = 221 ms MEDIAN = 11 ms ------------------------- 802373 TCP flows counted. ------------------------- Overall Stats -------------------------- TCP = 93455966 packets UDP = 6290127 packets ICMP = 192462 packets -------------------------- TOTAL = 100000000 packets
Flow duration data is presented mostly for interest. The maximum and mean RTT
values are less significant than the median value. What is most important is the
normalized frequency count of RTT values. To calculate this, measured RTT values for
each flow were represented in an array. Each time the same RTT value re-occurred, its
corresponding array entry was incremented. Before outputting this RTT data, each
value in the array was divided by the largest RTT value to get normalized data between
0 and 1.
13
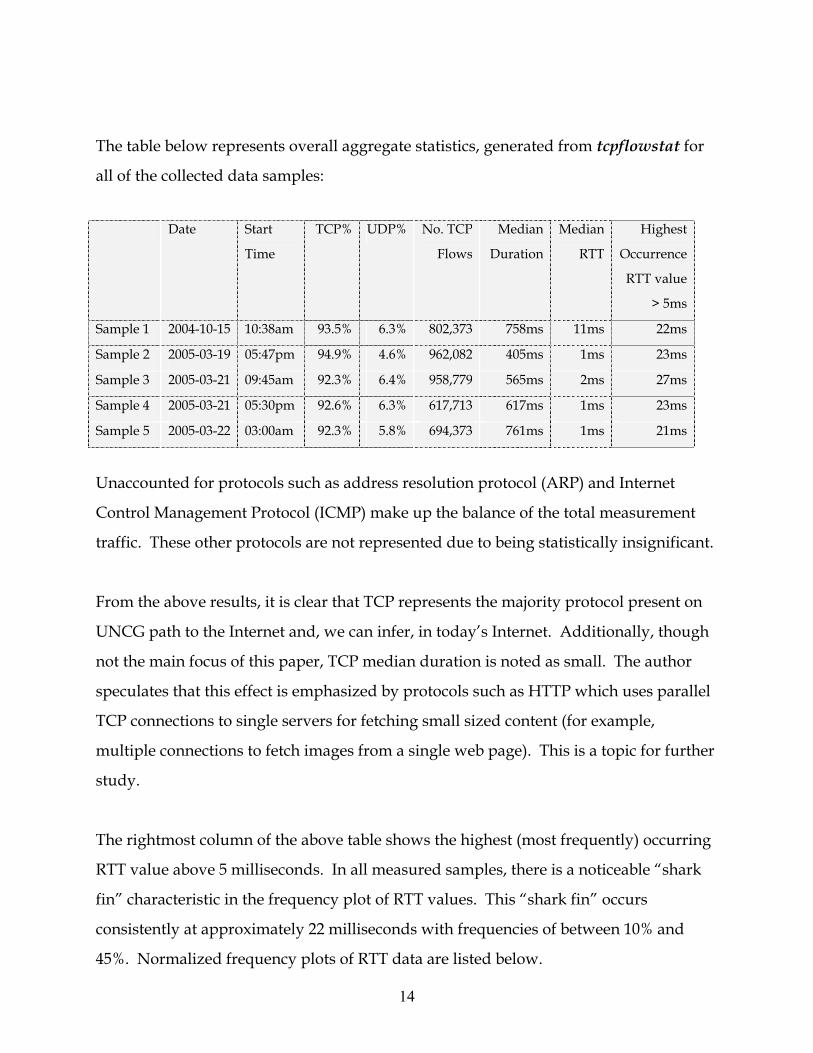
The table below represents overall aggregate statistics, generated from tcpflowstat for
all of the collected data samples:
Date Start
Time
TCP% UDP% No. TCP
Flows
Median
Duration
Median
RTT
Highest
Occurrence
RTT value
> 5ms
Sample 1 2004-10-15 10:38am 93.5% 6.3% 802,373 758ms 11ms 22ms
Sample 2 2005-03-19 05:47pm 94.9% 4.6% 962,082 405ms 1ms 23ms
Sample 3 2005-03-21 09:45am 92.3% 6.4% 958,779 565ms 2ms 27ms
Sample 4 2005-03-21 05:30pm 92.6% 6.3% 617,713 617ms 1ms 23ms
Sample 5 2005-03-22 03:00am 92.3% 5.8% 694,373 761ms 1ms 21ms
Unaccounted for protocols such as address resolution protocol (ARP) and Internet
Control Management Protocol (ICMP) make up the balance of the total measurement
traffic. These other protocols are not represented due to being statistically insignificant.
From the above results, it is clear that TCP represents the majority protocol present on
UNCG path to the Internet and, we can infer, in today’s Internet. Additionally, though
not the main focus of this paper, TCP median duration is noted as small. The author
speculates that this effect is emphasized by protocols such as HTTP which uses parallel
TCP connections to single servers for fetching small sized content (for example,
multiple connections to fetch images from a single web page). This is a topic for further
study.
The rightmost column of the above table shows the highest (most frequently) occurring
RTT value above 5 milliseconds. In all measured samples, there is a noticeable “shark
fin” characteristic in the frequency plot of RTT values. This “shark fin” occurs
consistently at approximately 22 milliseconds with frequencies of between 10% and
45%. Normalized frequency plots of RTT data are listed below.
14
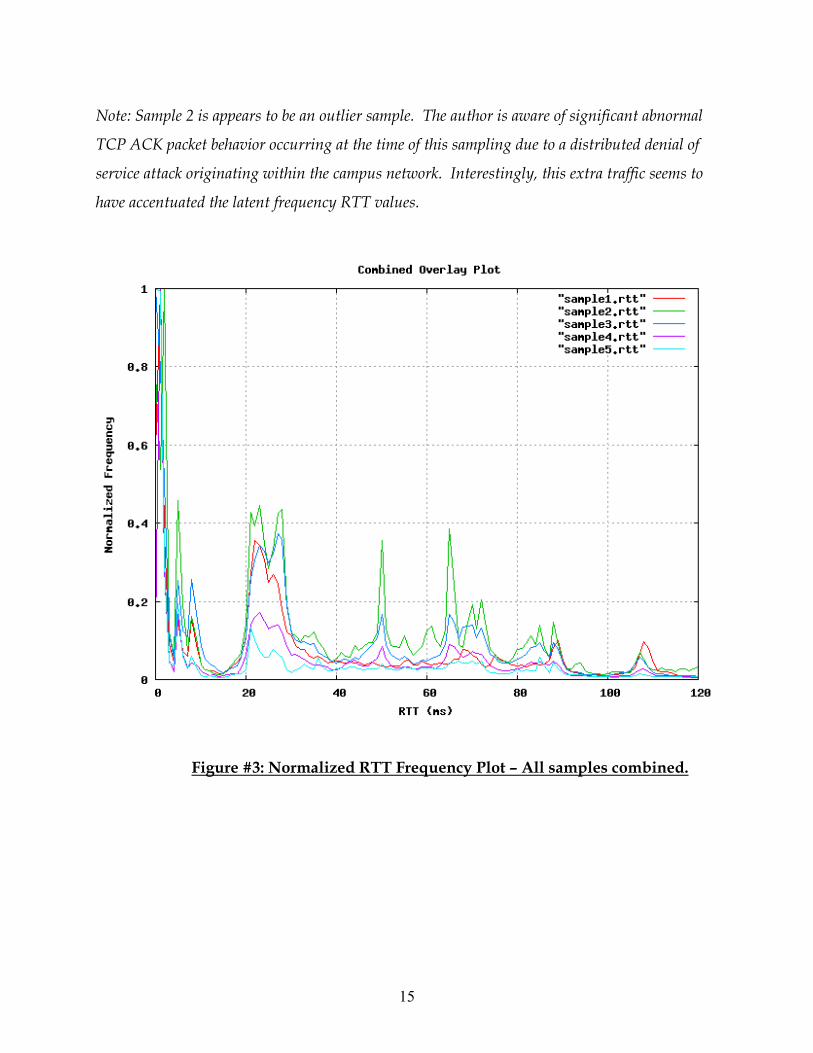
Note: Sample 2 is appears to be an outlier sample. The author is aware of significant abnormal
TCP ACK packet behavior occurring at the time of this sampling due to a distributed denial of
service attack originating within the campus network. Interestingly, this extra traffic seems to
have accentuated the latent frequency RTT values.
Figure #3: Normalized RTT Frequency Plot – All samples combined.
15
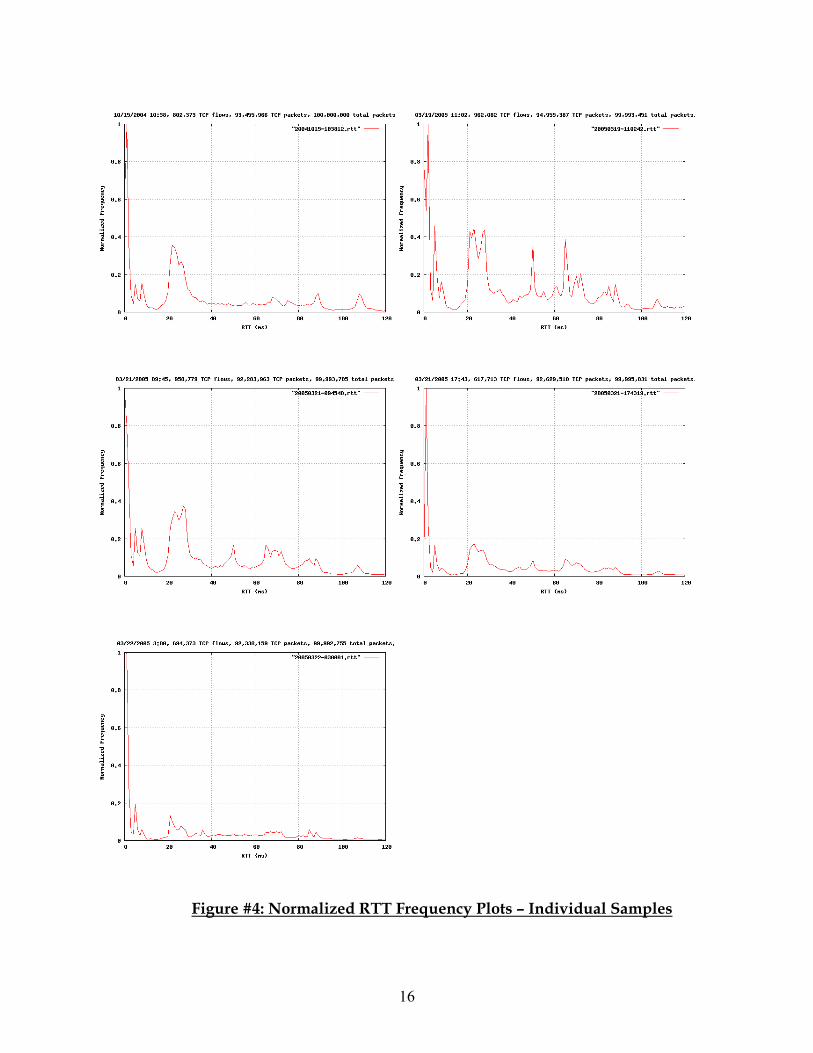
Figure #4: Normalized RTT Frequency Plots – Individual Samples
16
5. CONCLUSIONS
It is clear that the results show a significant percentage of TCP flows exhibiting highly
similar RTT frequency data over multiple samples. Related research indicates that
queuing delay is likely a result of over-buffering in Internet provider routers. Over-
buffering combined with commonly deployed drop-tail queuing causes wide queue
depth oscillations, and keeps average buffer depth too high.
When traffic is passing through a heavily loaded router, there is a significant tendency
towards global TCP congestion control synchronization. In a sudden traffic burst
congestion state, multiple thousands of TCP flows will reduce their window sizes
synchronously resulting in underutilization of TCP links, and undesirable global RTT
distribution. The low parts of the results graph (for example, around 15ms RTT) are
representative of the global synchronization effect and resulting under-utilization of
links. The peaks in the graph at higher RTT represent queuing delay of traffic not
dropped.
Gast and Barford propose that long duration TCP flows exhibit flocking behavior
whereby individual TCP flocks (of flows) exhibit window size synchronization, and
router queue size shows a similar “shark fin” depth characteristic over time[13]. Other
studies confirm this result with small numbers of concurrent flows, however as
concurrency increases, research indicates that the synchronization effect diminishes.
This is in contrast to the findings in this paper.
Appenzeller, Keslassy, and McKeown suggest that the commercial router design rule of
thumb for sizing router buffers, B = RTT x C, where C is the link capacity, is incorrect[5].
The linear formula is attributed to a 1994 paper by Villamizar and Song[6]. Not only is
this formula suggested to be incorrect, it in fact poses significant challenges for router
vendors. Assuming this formula, as line rate needs increase, buffer memory needs
17
increase linearly in step. A 10Gb/s router line card, for example, needs 250ms X
10Gb/s = 2.5Gbits of buffer size. As memory needs increase, larger off-chip DRAM
chips must be used, slowing buffer performance, and increasing cost and heat
dissipation need.
These studies point out that long lived flows dominate the traffic carried over the
Internet, and are a controlling influence on buffering characteristics. Short lived flows,
while numerous, are not impacted by commonly implemented over-buffering. Long
lived flows are adversely impacted by over-buffering due to increased RTT and
queuing delay. The study concludes that a link with n flows requires no more buffer
size than nxCRTTB /)(= where RTT is the mean of RTT and C is the link capacity.
Suthaharan proposes that the RED algorithm does not perform well under heavy
network load. RED relies on a weighted moving average for tracking router queue
depth. During short periods of heavy traffic bursts, there is a tendency with RED to
mark all packets indicating the congestion level. Thus, at times, RED behaves no
differently that a drop-tail implementation. His alternative proposal, stochastically
adaptive RED, utilizes a Markov chain based decision rule to improve the algorithmic
response time to TCP traffic burst conditions[12].
It is important to note that the results do not likely indicate that UNCG’s local router is
exhibiting oscillating queuing behavior. It is more probable that our results show poor
queuing characteristics in a bottleneck router node at an unknown connection link
within the Internet. Locating a bottleneck within the Internet is an additional topic of
research addressed in related papers[14].
Global TCP congestion control synchronization is undesirable. Research must continue
to provide mechanisms to decouple congestion control synchronization across multiple
thousands of TCP flows, and provide fast efficient adaptive queue management.
Implementations should provide easy to use parameters to control both router queue
18
sizes and queue adaptation. If these efforts are successful, the result will be a more
efficient Internet and a potentially lower cost for router hardware.
6. FUTURE STEPS
In order to further this work using real, rather than simulated network conditions, a
small network was built using FreeBSD running on common PC hardware as both
routers and sources / sinks of traffic. FreeBSD is a good choice due to wide use in the
research community, published documentation and full availability of source code.
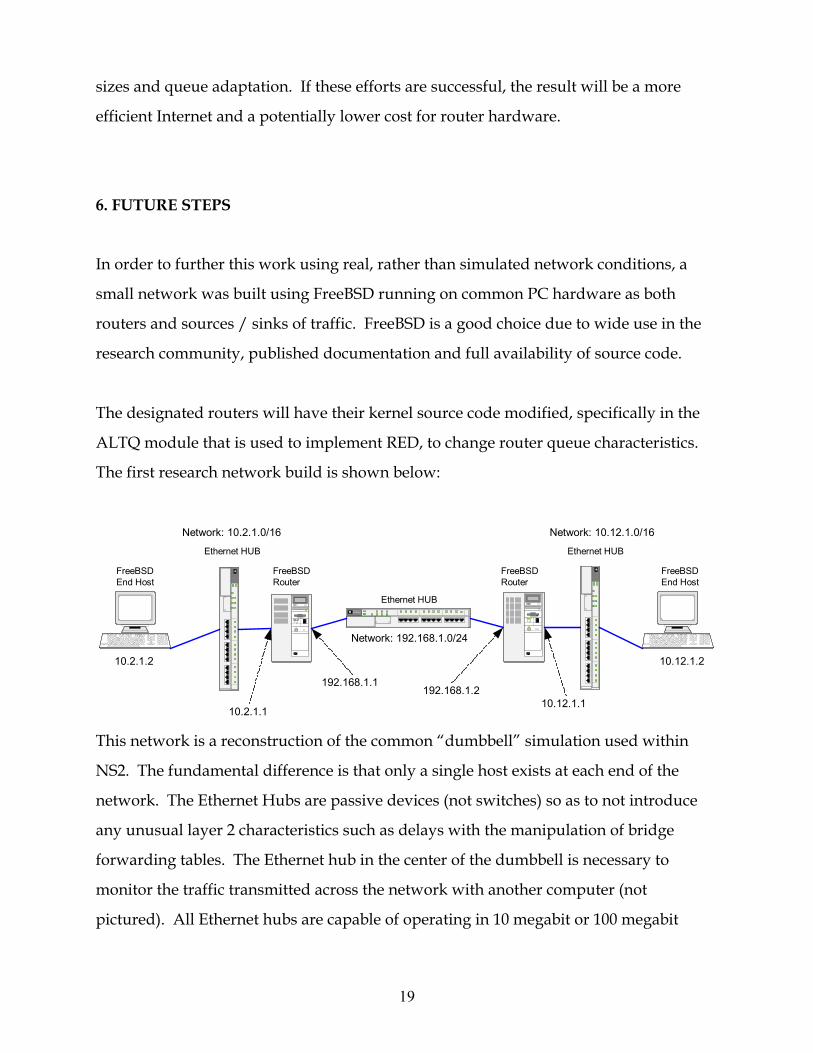
The designated routers will have their kernel source code modified, specifically in the
ALTQ module that is used to implement RED, to change router queue characteristics.
The first research network build is shown below:
FreeBSDRouter
HEWLETTPACKARD
Ethernet HUB
FreeBSDRouter
Ethernet HUBEthernet HUB
FreeBSDEnd Host
FreeBSDEnd Host
192.168.1.1
Network: 192.168.1.0/24
192.168.1.2
Network: 10.2.1.0/16
10.12.1.110.2.1.1
10.2.1.2 10.12.1.2
Network: 10.12.1.0/16
This network is a reconstruction of the common “dumbbell” simulation used within
NS2. The fundamental difference is that only a single host exists at each end of the
network. The Ethernet Hubs are passive devices (not switches) so as to not introduce
any unusual layer 2 characteristics such as delays with the manipulation of bridge
forwarding tables. The Ethernet hub in the center of the dumbbell is necessary to
monitor the traffic transmitted across the network with another computer (not
pictured). All Ethernet hubs are capable of operating in 10 megabit or 100 megabit
19
mode. This allows for the possibility of introducing physical media delay in the center
of the network.
This network could be used to completely replay captured data. To do this requires
that the TCP stack at each source and sink node be disabled, and client/server software
written to natively encapsulate and transmit the data between end nodes. This
represented a significant development effort, which has not been addressed in this
project.
An alternate use would be to develop some simple TCP socket code to listen on
multiple sockets on each end node. The code should be used to setup multiple
thousands of TCP data streams with a fixed duration. Some time durations would be
set to very large values while others would be short, thereby re-creating conditions
similar to the Internet. A sample Perl script has been provided which implements a
TCP server that when connected to will send data for a specified time period.
To accompany this code, “DummyNet”, a FreeBSD kernel module, can be configured to
use a ring buffer to delay packets through network interface code. “DummyNet” is
configurable by using the FreeBSD firewall configuration. The configuration is granular
enough to match specific protocols, source / destination addresses and TCP ports.
With or without the use of “DummyNet”, enough TCP traffic could be produced such
that the router queues would exhibit the same queue characteristics. The tcpflowstat
program can be used through a fifth attached host to measure RTT values in the same
fashion as the samples taken.
20
REFERENCES
[1] Jonathan Thyer. http://research1.uncg.edu/ UNCG RTT sample data.
[2] Jay Aikat, Jasleen Kaur, F. Donelson Smith, and Kevin Jeffay. Variability in TCP
Round-trip Times. University of North Carolina.
[3] Srinivas Shakkottai, R. Srikant, Nevil Brownlee, Andre Broido, KC Claffy. The RTT
Distribution of TCP Flows in the Internet and its Impact on TCP-based Flow Control.
The University of Illinois, CAIDA, SDSC.
[4] Sally Floyd and Van Jacobson. Random Early Detection Gateways for Congestion
Avoidance. IEEE/ACM Transactions on Networking, August 1993.
[5] Guido Appenzeller, Isaac Keslassy, and Nick McKeown. Sizing Router Buffers.
Stanford University.
[6] Villamizar and Song. High Performance tcp in ansnet. ACM Computer
Communications Review, 1994.
[7] The Network Simulator (NS2). http://www.isi.edu/nsnam/ns
[8] Packet capture library, libpcap. http://www.tcpdump.org/
[9] Tcpdpriv – a program for eliminating confidential information from traces,
http://ita.ee.lbl.gov/html/contrib/tcpdpriv.html
[10] FreeBSD. http://www.freebsd.org/
[11] Yeojin Jung and Bomi Lee. A Parallel Multiple Hashing Architecture for IP
Address Lookup. Department of Information Electronics, Ewha Womans University
[12] Shan Suthaharan. Markov Model Based Congestion Control for TCP. University of
North Carolina at Greensboro.
[13] Jim Gast and Paul Barford. Modeling Congestion in Backbone Routers. University of
Wisconsin – Madison.
[14] Ningning Hu, Li Li, Zhuoqing Morley Mao, Peter Steenkiste, Jia Wang. Locating
Internet Bottlenecks: Algorithms, Measurements, and Implications. Carnegie Mellon
University, Bell Labs, Univ. of Michigan, AT&T.
21