Embed Size (px)
Citation preview

Promoting Evidence-Based Strategies to Fight the Global Tobacco Epidemic
The International Tobacco Control Policy Evaluation Project
TCP India Project ReportFINDINGS FROM THE WAVE 1 SURVEY (2010-2011)
September 2013

“This TCP report provides data-based scientific evidence
on the current situation of tobacco control policy
implementation and provides suggestions for more effective implementation. We need to understand the implications of these recommendations
and to take steps for a better compliance with our
international obligations under the WHO-FCTC.”
Keshav Desiraju Secretary, Government of India
Ministry of Health and Family Welfare 13th August 2013

2010-2011Findings from the TCP India Wave 1 Survey
TCP India Project Report
Suggested Report CitationITC Project (September, 2013). TCP India National Report. Findings from the Wave 1 Survey (2010-2011). University of Waterloo, Waterloo, Ontario, Canada; Healis-Sekhsaria Institute for Public Health, Navi Mumbai, India.

ForewordI am glad to learn that the Tobacco Control Policy Evaluation (TCP) Project report is to be released. This document evaluates the impact of tobacco control policies of the WHO Framework Convention on Tobacco Control (FCTC), an international treaty to which India is committed.
We are well aware of the harmful effects of tobacco use. As is correctly said, tobacco kills. Our national legislation, The Control of Tobacco Products Act (COTPA), 2003, predates the WHO-FCTC, and has several stringent provisions to regulate the use of tobacco. Despite growing awareness in both urban and rural India, and despite a sustained campaign against the advertising of tobacco products, about 35% of the Indian population still uses tobacco in one form or another. Clearly there is a need for greater awareness for more sustained public campaigns, for more effective deterrent action and for a more purposeful display of our commitment to public health.
We also need more systematic and evidence-based research especially with relation to smokeless forms of tobacco and the effects of passive smoking.
This TCP report provides data-based scientific evidence on the current situation of tobacco control policy implementation and provides suggestions for more effective implementation. We need to understand the implications of these recommendations and to take steps for better compliance with our international obligations under the WHO-FCTC.
This Report is the result of the collaborative efforts of researchers at the Healis Sekhsaria Institute for Public Health, India and the University of Waterloo, Canada. I would wish to congratulate the experts at both institutions who have worked on this important and timely Report.
Mr. Keshav Desiraju Secretary - Government of India Ministry of Health and Family Welfare 13th August 2013 New Delhi
itCp India Wave 1 project report (2010-2011)

iitCp India Wave 1 project report (2010-2011)
ForewordIt is an immense pleasure for me to learn about the release of the Tobacco Control Policy Evaluation (TCP) Project report which evaluates the impact of tobacco control policies of the Framework Convention on Tobacco Control (FCTC). India is one of the earliest signatories to this international treaty.
Although the detrimental effects of tobacco use on health are well established, in Bihar, still 53.5% of the population uses tobacco in one form or another. The Bihar government has introduced several tobacco control measures such as a ban on gutka and strict implementation of the Control of Tobacco Products Act in 2003 to protect the health of its citizens and to advance the implementation of the FCTC.
This TCP report provides data-based scientific evidence on the current situation of tobacco control policy implementation and provides suggestions for more effective implementation that are going to be very useful.
I appreciate the collaborative efforts of researchers at the Healis Sekhsaria Institute for Public Health, India and the University of Waterloo, Canada for undertaking this study.
Mr. Vyas Ji Principal Secretary Health Department Government of Bihar

iiitCp India Wave 1 project report (2010-2011)
ForewordI am happy to learn that Healis Sekhsaria Institute for Public Health, India and University of Waterloo, Canada with the help of Madhya Pradesh Voluntary Health Association has conducted this study on Tobacco Control Policy Evaluation (TCP). This report evaluates the impact of Tobacco Control Policies of the Framework Convention on Tobacco Control (FCTC), of which India is signatory.
In India, 35 percent of the total population use tobacco and the detrimental effects of tobacco use on health are well-established. The Indian government has also introduced tobacco control measures. India ratified the FCTC in February 2004. The government introduced a comprehensive National Tobacco Control Act (COTPA 2003) in May 2003, which came into force in May 2004.
This TCP report provides insight and evidence for the current situation of Tobacco Control Policy implementation and suggestions for more effective implementation.
I appreciate the collaboration of researchers at Healis Sekhsaria Institute for Public Health, India and University of Waterloo, Canada for undertaking this study.
I hope this study will be of great use for all those who are involved in implementation of Tobacco Control Policy in this country.
Mr. Pravir Krishn Principal Secretary Public Health & Family Welfare Department Government of Madyha Pradesh

ivtCp India Wave 1 project report (2010-2011)
ForewordIt is an immense pleasure for me to learn about the release of the Tobacco Control Policy Evaluation (TCP) Project report which evaluates the impact of tobacco control policies of the Framework Convention on Tobacco Control (FCTC). India is one of the earliest signatory, in February 2004, to this international treaty.
Although detrimental effects of tobacco use on health are well established in Maharashtra, still 31.4% of the population uses tobacco in one form or the other. The Maharashtra Government has introduced several tobacco control measures such as implementation of Control of Tobacco Products Act and ban on all forms of flavoured tobacco in 2013 to protect the health of its citizens and advance implementation of the FCTC.
This TCP report provides data-based scientific evidence on the current situation of tobacco control policy implementation and provides suggestions for more effective implementation that are going to be very useful.
I appreciate the collaborative efforts of researchers at the Healis Sekhsaria Institute for Public Health, India and the University of Waterloo, Canada for undertaking this study.
T.C. Benjamin Additional Chief Secretary Public Health Department Government of Maharashtra

vtCp India Wave 1 project report (2010-2011)
ForewordIt gives me immense pleasure to learn about release of the Tobacco Control Policy Evaluation (TCP) Project Report which evaluates the impact of tobacco control policies in the backdrop of the Framework Convention on Tobacco Control (FCTC) of which India is a signatory.
About 35 percent of the Indian population use tobacco products in some form or the other and the detrimental effects of such use on health are quite well-established. India ratified the FCTC in February 2004 and very strong tobacco control measures have already been introduced in the form of the comprehensive National Tobacco Control Act (COTPA 2003) which came in force in May, 2004.
This TCP report provides evidence on the current status of implementation of tobacco control policies in India and provides constructive suggestions for improvement of the measures taken in public interest. I sincerely hope that the report will be very useful for all stakeholders in the Anti Tobacco Campaign.
I strongly appreciate the collaboration of the researchers of the Cancer Foundation of India, Kolkata and the Healis Sekhsaria Institute for Public Health, India and University of Waterloo, Canada for undertaking this extensive study.
Satish Chandra Tewary Principal Secretary Department of Health & Family Welfare Government of West Bengal

Table of Contents
vi
i Preface letters
vi Table of Contents
vii List of Tables and Figures
xiii TCP Policy Evaluation Project
1 Background
3 Executive Summary
10 The Tobacco Landscape in India
27 Methods
34 Findings
34 Tobacco Use in India
47 Quitting Behaviour
53 Smoke-Free Public Places and Workplaces
70 Health Warning Labels
80 Tobacco Advertising, Promotion, and Sponsorship
97 Education, Communication, and Public Awareness
108 Tobacco Price and Taxation
123 Conclusions and Implications of the Findings
129 TCP India Contacts and Funding Sources
tCp India Wave 1 project report (2010-2011)

Table 1. Summary of legislation on health warnings in India, 1975-present 15
Table 2. Tobacco advertising, promotion, and sponsorship ban policies in India 21
Table 3. Central Government taxes on tobacco products in India 25
Table 4. State-level VATs on tobacco products 26
Table 5. Total number of respondents interviewed by state 30
Table 6. Demographic characteristics of the sample by state 31
Figure 1. India’s tobacco control policy timeline in relation to the TCP India Surveys 27
Figure 2. TCP India Wave 1 survey sampling areas 29
Figure 3. Prevalence of tobacco use by males and females, by state 34
Figure 4 Prevalence of tobacco use in urban and rural areas, by state 35
Figure 5. Prevalence of tobacco use by income level, by state 35
Figure 6. Prevalence of tobacco use by education level, by state 36
Figure 7. Percentage of tobacco users by type, by state 36
Figure 8. Distribution of tobacco use type in urban cities and surrounding rural districts, by state 38
Figure 9. Prevalence of smokeless tobacco users (including smokeless only and mixed tobacco users) in each age group, by state 39
Figure 10. Prevalence of smokers (including smoked only and mixed tobacco users) in each age group, by state 40
Figure 11. Percentage of smokers (including smoked only and mixed tobacco users) who “agree” or “strongly agree” that if they had to do it over again, they would not have started smoking, by state 40
Figure 12. Percentage of smokeless tobacco users (including smokeless only and mixed tobacco users) who “agree” or “strongly agree” that if they had to do it over again, they would not have started using smokeless tobacco, by state 41
Figure 13. Percentage of tobacco users and non-users who have a “bad” or “very bad” opinion of smoking cigarettes, bidis, and smokeless tobacco, by tobacco user type 41
Figure 14. Percentage of tobacco users and non-users who “agree” or “strongly agree” that Indian society disapproves of smoked tobacco use, by tobacco use type, by state 42
Figure 15. Percentage of tobacco users and non-users who “agree” or “strongly agree” that Indian society disapproves of smokeless tobacco use, by tobacco use type, by state 43
<<
Fig
ures
List of Tables and Figures
viitCp India Wave 1 project report (2010-2011)

Figure 16. Intentions to quit using tobacco among smokers (including smoked only and mixed tobacco users) and smokeless tobacco users (including smokeless only and mixed tobacco users), by state 47
Figure 17. Percentage of smokeless tobacco users (including smokeless only and mixed tobacco users) that agreed that various reasons led them to think about quitting the use of smokeless tobacco, by state 49
Figure 18. Percentage of smokers (including smoked only and mixed tobacco users) that agreed that various reasons led them to think about quitting the use of smoked tobacco, by state 50
Figure 19. Cessation assistance provided to tobacco users (including smoked, mixed, and smokeless tobacco) that visited a doctor or health professional in the last six months, by state 51
Figure 20. Percentage of smokers (including smoked only and mixed tobacco users), smokeless tobacco only users, and tobacco non-users who were aware that the government started to enforce the smoke-free law in 2008, by state 54
Figure 21. Percentage of smokers (including smoked only and mixed tobacco users), smokeless tobacco only users, and tobacco non-users whose workplace does not allow smoking indoors at all among those who are employed in indoor workplaces outside the home, by state 55
Figure 22. Percentage of smokers (including smoked only and mixed tobacco users), smokeless tobacco only users, and tobacco non-users who noticed smoking in indoor areas of the workplace in the last month among those who are employed in indoor workplaces outside of the home, by state 56
Figure 23. Percentage of smokers (including smoked only and mixed tobacco users), smokeless tobacco only users, and tobacco non-users who think that smoking should not be allowed in any indoor areas of the workplace, by state 57
Figure 24. Percentage of smokers (including smoked only and mixed tobacco users), smokeless tobacco only users, and tobacco non-users who reported that smoking is not allowed in any indoor areas of restaurants, by state 58
Figure 25. Percentage of smokers (including smoked only and mixed tobacco users), smokeless tobacco only users, and tobacco non-users who noticed smoking in indoor areas of restaurants at their last visit among those who have visited a restaurant in the last six months, by state 59
Figure 26. Percentage of smokers (including smoked only and mixed tobacco users) that smoked indoors at a restaurant during their last visit among those who visited a restaurant in the last six months, by state 59
Figure 27. Percentage of smokers (including smoked only and mixed tobacco users), smokeless tobacco only users, and tobacco non-users who think that smoking should not be allowed in any indoor areas of restaurants, by state 60
<<
Fig
ures
List of Tables and Figures
viiitCp India Wave 1 project report (2010-2011)

Figure 28. Percentage of smokers (including smoked only and mixed tobacco users), smokeless tobacco only users, and tobacco non-users who reported that smoking is not allowed in any indoors areas of bars, by state 61
Figure 29. Percentage of smokers (including smoked only and mixed tobacco users), smokeless tobacco only users, and tobacco non-users who noticed smoking in indoor areas of bars at their last visit among those who have visited a bar in the last six months, by state 62
Figure 30. Percentage of smokers (including smoked only and mixed tobacco users) that smoked indoors at a bar during their last visit among those who visited a bar in the last six months, by state 62
Figure 31. Percentage of smokers (including smoked only and mixed tobacco users), smokeless tobacco only users, and tobacco non-users who think that smoking should not be allowed in any indoor areas of bars, by state 63
Figure 32. Percentage of smokers (including smoked only and mixed tobacco users), smokeless tobacco only users, and tobacco non-users who reported that smoking is not allowed in any public transportation vehicle, by state 64
Figure 33. Percentage of smokers (including smoked only and mixed tobacco users), smokeless tobacco only users, and tobacco non-users who noticed smoking inside public transportation vehicles on their last ride among those who have ridden in one of these vehicles in the last six months, by state 65
Figure 34. Percentage of smokers (including smoked only and mixed tobacco users), smokeless tobacco only users, and tobacco non-users who think that smoking should not be allowed inside public transportation vehicles, by state 66
Figure 35. Percentage of smokers (including smoked only and mixed tobacco users), smokeless tobacco only users, and tobacco non-users who reported that smoking is not allowed inside their homes, by state 67
Figure 36. Percentage of smokers (including smoked only and mixed tobacco users) that were “extremely concerned” or “very concerned” that their own smoking in the home is harmful to the health of their children among those who allow smoking in their home, by state 67
Figure 37. Examples of Round 1 (2009-2011) warning labels on smoked (left) and smokeless (right) tobacco packages 70
Figure 38. Impact of health warning on smokers’ (including smoked only and mixed tobacco users) perceptions and behaviours in the last month, by state 71
Figure 39. Impact of health warnings on smokeless tobacco users’ (including smokeless only and mixed tobacco users) perceptions and behaviours in the last month, by state 72
Figure 40. Round 1 pictorial warnings on smoked (left and centre) and smokeless (right) tobacco product packages 73
<<
Fig
ures
List of Tables and Figures
ixtCp India Wave 1 project report (2010-2011)

Figure 41. Smokers’ (including smoked only and mixed tobacco users) knowledge of the health effects of smoked tobacco use, by state 74
Figure 42. Smokeless tobacco users’ (including smokeless only and mixed tobacco users) knowledge of the health effects of smokeless tobacco use, by state 76
Figure 43. Percentage of smokers (including smoked only and mixed tobacco users) who think that smoked tobacco packages should have more, less, or the same amount of health information as they do now, by state 78
Figure 44. Percentage of smokeless tobacco users (including smokeless only and mixed tobacco users) who think that smokeless tobacco packages should have more, less, or the same amount of health information as they do now, by state 78
Figure 45. Percentage of smokers (including smoked only and mixed tobacco users), smokeless tobacco only users, and tobacco non-users who “often” or “once in a while” noticed things designed to encourage tobacco use, by state 80
Figure 46. Percentage of smokers (including smoked only and mixed tobacco users), smokeless tobacco only users, and tobacco non-users in Maharashtra who noticed tobacco products being advertised in various venues and media in the last six months 81
Figure 47. Percentage of smokers (including smoked only and mixed tobacco users), smokeless tobacco only users, and tobacco non-users in Madhya Pradesh who noticed tobacco products being advertised in various venues and media in the last six months 82
Figure 48. Percentage of smokers (including smoked only and mixed tobacco users), smokeless tobacco only users, and tobacco non-users in Bihar who noticed tobacco products being advertised in various venues and media in the last six months 83
Figure 49. Percentage of smokers (including smoked only and mixed tobacco users), smokeless tobacco only users, and tobacco non-users in West Bengal who noticed tobacco products being advertised in various venues and media in the last six months 84
Figure 50. Percentage of smokers (including smoked only and mixed tobacco users), smokeless tobacco only users, and tobacco non-users in the combined sample who noticed tobacco products being advertised in various venues and media in the last six months 85
Figure 51. Percentage of smokers (including smoked only and mixed tobacco users), smokeless tobacco only users, and tobacco non-users who support complete bans on all tobacco advertisements at shops and stores “a lot” or “somewhat”, by state 88
Figure 52. Percentage of smokers (including smoked only and mixed tobacco users), smokeless tobacco only users, and tobacco non-users who support complete bans on displays of all tobacco products “a lot” or “somewhat”, by state 89
<<
Fig
ures
List of Tables and Figures
xtCp India Wave 1 project report (2010-2011)

Figure 53. Percentage of smokers (including smoked only and mixed tobacco users), smokeless tobacco only users, and tobacco non-users who have seen or heard about any sporting events that were sponsored by or connected with tobacco brands in the last six months, by state 90
Figure 54. Percentage of smokers (including smoked only and mixed tobacco users), smokeless tobacco only users, and tobacco non-users who have seen or heard about any art events that were sponsored by or connected with tobacco brands in the last six months, by state 91
Figure 55. Percentage of smokers (including smoked only and mixed tobacco users), smokeless tobacco only users, and tobacco non-users who noticed clothing or other items with a tobacco brand or logo in the last six months, by state 92
Figure 56. Percentage of smokers (including smoked only and mixed tobacco users), smokeless tobacco only users, and tobacco non-users who noticed free samples of tobacco products in the last six months, by state 93
Figure 57. Percentage of smokers (including smoked only and mixed tobacco users) and smokeless tobacco only users who noticed gifts or discounts when buying tobacco products in the last six months, by state 93
Figure 58. Percentage of smokers (including smoked only and mixed tobacco users), smokeless tobacco only users, and tobacco non-users who noticed competitions linked to tobacco products in the last six months, by state 94
Figure 59. Percentage of smokers (including smoked only and mixed tobacco users), smokeless tobacco only users, and tobacco non-users who “often” noticed people using tobacco in entertainment media, by state 95
Figure 60. Percentage of smokers (including smoked only and mixed tobacco users), smokeless tobacco only users, and tobacco non-users in Maharashtra who noticed anti-tobacco information in various venues and media in the last six months 98
Figure 61. Percentage of smokers (including smoked only and mixed tobacco users), smokeless tobacco only users, and tobacco non-users in Bihar who noticed anti-tobacco information in various venues and media in the last six months 99
Figure 62. Percentage of smokers (including smoked only and mixed tobacco users), smokeless tobacco only users, and tobacco non-users in West Bengal who noticed anti-tobacco information in various venues and media in the last six months 100
Figure 63. Percentage of smokers (including smoked only and mixed tobacco users), smokeless tobacco only users, and tobacco non-users in Madhya Pradesh who noticed anti-tobacco information in various venues and media in the last six months 101
Figure 64. Percentage of smokers (including smoked only and mixed tobacco users), smokeless tobacco only users, and tobacco non-users in the combined sample who noticed anti-tobacco information in various venues and media in the last six months 102
Figure 65. Percentage of smokers (including smoked only and mixed tobacco users) and smokeless tobacco only users among those who noticed anti-tobacco advertisements/information who reported that the advertisements made tobacco “a lot” less socially acceptable, by state 105
<<
Fig
ures
List of Tables and Figures
xitCp India Wave 1 project report (2010-2011)

Figure 66. Percentage of smokers (including smoked only and mixed tobacco users) and smokeless tobacco only users among those who noticed anti-tobacco advertisements/information who reported that the advertisements made them “more likely” to quit, by state 106
Figure 67. Source of last purchase of bidis, cigarettes, or smokeless tobacco among current users of each tobacco product in West Bengal 109
Figure 68. Source of last purchase of bidis, cigarettes, or smokeless tobacco among current users of each tobacco product in Bihar 110
Figure 69. Source of last purchase of bidis, cigarettes, or smokeless tobacco among current users of each tobacco product in Madhya Pradesh 111
Figure 70. Source of last purchase of bidis, cigarettes, or smokeless tobacco among current users of each tobacco product in Maharashtra 112
Figure 71. Average price paid for bidi and cigarette (per stick) in rupees for last purchase, by state 113
Figure 72. Average price paid for bidi and cigarette (per stick) in rupees for last purchase in urban cities and surrounding rural districts, by state 114
Figure 73. Average price paid per pouch pack of smokeless tobacco in rupees for last purchase, by state 114
Figure 74. Percentage of current bidi smokers, cigarette smokers, and smokeless tobacco users who reported that their respective bidi/cigarette/smokeless tobacco brand was chosen for the price, by state 115
Figure 75. Reasons for choosing their regular brand of cigarettes among current cigarette smokers, by state 116
Figure 76. Reasons for choosing their regular brand of bidis among current bidi smokers, by state 117
Figure 77. Reasons for choosing their regular brand of smokeless tobacco among current smokeless tobacco users, by state 118
Figure 78. Percentage of exclusive bidi smokers, exclusive cigarette smokers, and smokeless tobacco only users who “strongly agree” or “agree” that they spend too much money on tobacco, by state 119
Figure 79. Percentage of exclusive bidi smokers, exclusive cigarette smokers, and smokeless tobacco only users who “never” think about money spent on tobacco use, by state 120
Figure 80. Percentage of current bidi smokers, cigarette smokers, and smokeless tobacco users, who reported that in the last six months, there was a time when the money spent on tobacco products resulted in not having enough money for household essentials like food, by state 121
<<
Fig
ures
List of Tables and Figures
xiitCp India Wave 1 project report (2010-2011)

TCP PoliCy EvaluaTion PRojECT
TCP India Project
The International Tobacco Control Policy Evaluation Project (the ITC Project) is a multi-country prospective cohort study designed to measure the psychosocial and behavioural impact of key policies of the World Health Organization (WHO) Framework Convention on Tobacco Control (FCTC) in more than 20 countries.
In 2006, the ITC Project at the University of Waterloo partnered with Dr. Prakash Gupta, Dr. Mangesh Pednekar, and colleagues at the Healis-Sekhsaria Institute for Public Health, Navi Mumbai, India. The two organizations began to work together to create the TCP (Tobacco Control Policy) India Survey. The “ITC Project” in India is known as the TCP India Project to avoid confusion with the Indian Tobacco Company. The TCP India Wave 1 Survey, conducted between August 2010 and December 2011 was made possible with funding from the National Cancer Institute (United States), Canadian Institutes of Health Research, and Ontario Institute for Cancer Research.
TCP india Survey Team TCP india investigators – Healis-Sekhsaria institute for Public Health, navi Mumbai, indiaDr. Prakash C. Gupta*Dr. Mangesh S. Pednekar*
Project Management – Healis-Sekhsaria institute for Public Health, navi Mumbai, indiaDr. Lalit Raute – Country and Maharashtra Project Manager - TCP IndiaWest Bengal State Project Manager – Ms. Hemlata Shedge (Wave 1), Dr. Pratibha Pawar (Wave 2)Madhya Pradesh State Project Manager – Dr. Nirmal Ahuja (Wave 1), Ms. Hemlata Shedge (Wave 2) Bihar State Project Manager – Dr. Avinash Sonawane (Wave 1), Ms. Namrata Puntambekar (Wave 2)
india State CollaboratorsMadhya PradeshCollaborating Institute: Madhya Pradesh Voluntary Health Association (MPVHA), IndoreHead of Institute: Mr. Mukesh Kumar Sinha, Executive DirectorAppointed State Coordinator: Mr. Bakul Sharma (Wave 1); Mr. Ashish Daniel (Wave 2)
West BengalCollaborating Institute: Cancer Foundation of India (CFI), KolkataHead of Institute: Prof. Maqsood Siddiqi, Chairman MC & Managing DirectorAppointed State Coordinator: Dr. Soma Roy Chowdhury
xiiitCp India Wave 1 project report (2010-2011)

Report (2010-2011)
BiharCollaborating Institute: School of Preventive Oncology (SPO), PatnaHead of Institute: Dr. Dhirendra Sinha, DirectorAppointed State Coordinator: Ms. Manibala Singh (Wave 1); Mr. Rajesh Verma (Wave 2)
iTC international TeamDr. Geoffrey T. Fong*, Dr. Mary E. Thompson – University of Waterloo, CanadaDr. Maansi Bansal-Travers – roswell park Cancer Institute, buffalo, New York, United StatesDr. James F. Thrasher, Ms. Kamala Swayampakala (Graduate Student) – University of South Carolina,
United States*Principal Investigators
Project ManagementMr. Adnan Al-Wahid – Project Manager, University of Waterloo (Wave 1)Ms. Lisa Hickman – Project Manager, University of WaterlooDr. Anne C. K. Quah – ITC Research Scientist, University of WaterlooMr. Pete Driezen – Senior Data Analyst, University of WaterlooMs. Genevieve Sansone – Student Project Manager, University of Waterloo
TCP india Project Funding• U.S. National Cancer Institute (NCI)• Canadian Institutes of Health Research (CIHR)• Ontario Institute for Cancer Research (OICR) Senior Investigator Award
acknowledgementsThis report was prepared by a team of collaborators at the University of Waterloo: Ms. Lorraine Craig (project management; lead author of Executive Summary), Dr. Janet Chung-Hall (lead author of Findings chapter and Conclusion and Implications of the Findings chapter; contributor to Tobacco Landscape chapter), Dr. Gang Meng (data analysis and contributor to Methods chapter), Ms. Megan Tait (data visualization and contributor to Methods chapter), Ms. Genevieve Sansone, Ms. Natalie Sansone, Ms. Lorraine Manlangit, Ms. Lisa Hickman (contributors to the Tobacco Landscape chapter), Ms. Lisa Hickman (author of Background chapter and contributor to Methods chapter). Several University of Waterloo collaborators provided careful reviews of the draft report (Dr. Anne C. K. Quah, Dr. Geoffrey T. Fong, Dr. Mary E. Thompson, Dr. Janet Chung-Hall, Mr. Pete Driezen, and Ms. Genevieve Sansone, and Ms. Stephanie Chu). Dr. Frank J. Chaloupka of the University of Illinois at Chicago and Dr. G. Emmanuel Guindon of the Université de Montréal provided review comments on the tobacco landscape and results chapter on Tobacco Price and Taxation. Collaborators at the Healis-Sekhsaria Institute for Public Health provided information on tobacco control policies and related published studies and reviewed drafts of the report (Dr. Lalit Raute, Dr. Prakash C. Gupta, and Dr. Mangesh S. Pednekar). Photos illustrating outdoor advertising and promotion were provided by Dr. Kunal Oswal of the Cancer Patients Aid Association. Graphic design and layout was provided by Ms. Sonya Lyon of Sentrik Graphic Solutions Inc.
xivtCp India Wave 1 project report (2010-2011)

BaCKGRounDThe TCP India Survey is conducted in four states, namely Maharashtra, Madhya Pradesh, Bihar, and West Bengal. The Survey is conducted by researchers from the Healis-Sekhsaria Institute for Public Health, Navi Mumbai, Maharashtra in collaboration with their partners in Madhya Pradesh, Bihar, and West Bengal and the ITC Project team centered at the University of Waterloo in Canada. The TCP India Survey is a prospective cohort study of adult (aged 15 years and older) tobacco users and tobacco non-users.
The broad objective of the TCP India Project is to evaluate and understand the impact of tobacco control policies of the FCTC as they are implemented in India, a lower-middle income country and compare these findings with those of other low- and middle-income countries (LMICs) and high-income countries (HICs).
India is just one of several LMICs participating in the ITC Project (the other LMICs are Thailand, Malaysia, China, Brazil, Uruguay, Mexico, Bhutan, Mauritius, Bangladesh, Kenya, and Zambia). These countries provide a basis for understanding the natural history of tobacco use and identify factors that predict quitting among the users in LMICs in addition to the ITC Project’s focus on evaluating the FCTC policies.
Wave 1 of the TCP India Survey was conducted between August 2010 and December 2011. In each of the four states, approximately 2000 tobacco users and 600 tobacco non-users were surveyed. The first wave of the TCP India Survey was conducted after the implementation of several major tobacco control policies in India including:
• The 2004 prohibition of sale of tobacco products to minors and complete ban on advertising of tobacco products in the media;
• The 2008 ban on smoking in public places and restrictions in restaurants; and
• The 2009 implementation of pictorial warnings on all types of tobacco products and prohibition of sale of tobacco products near educational institutions.
In 2011, legislation was passed banning the use of plastic packaging for chewing tobacco and paan masala products. In 2005, the state of Goa was the first to enact a total ban on the consumption, sale, and storage of gutka. As of January 2013, 17 additional states and four Union Territories (Madhya Pradesh, Kerala, Bihar, Rajasthan, Maharashtra, Jharkhand, Chhattisgarh, Haryana, Punjab, Delhi, Gujarat, Mizoram, Himachal Pradesh, Chandigarh, Odisha, Andhra Pradesh, Uttar Pradesh, Sikkim, Uttarakhand, Dadara and Nagar Haveli, Daman and Diu) have passed and enacted legislation that completely bans the manufacture, sale, and use of gutka. In addition to gutka, Maharashtra has also banned the sale of paan masala products.
1tCp India Wave 1 project report (2010-2011)

THE OBJECTIVES OF THE TCP INDIA PROJECT ARE:
Effectiveness study aims: • To examine whether a policy introduced in India will affect self-reported tobacco use behaviour (e.g., quit
attempts, successful quitting, quit intentions) among tobacco users, as compared to tobacco users in countries where that policy is not being introduced;
• To examine whether a policy introduced in India will enhance policy-relevant psychosocial variables (e.g., warning labels: measures of label salience) among tobacco users, as compared to tobacco users in countries where the relevant policy has not changed; and
• To examine whether a policy introduced in India will impact levels of general psychosocial variables that have been identified in past research to be related to tobacco use and quitting (e.g., beliefs and attitudes, perceived risk, subjective norms, perceived behavioural control/self-efficacy, intentions to quit) among tobacco users, compared to countries with no policy change.
Mediation and moderation study aims: • To examine whether the effects of FCTC policies that have been introduced in India are being offset by
compensatory behaviours (e.g., whether price increases lead to switching to discount brands rather than to quitting);
• To examine whether the effects of tobacco control policies are moderated by situational and individual-difference factors such as (a) demographic variables (age, gender, socio-economic status (SES); (b) personality variables (e.g., time perspective); (c) environmental context (e.g., number of peers/family members who smoke or use other forms of tobacco); and (d) tobacco use history of the individual (e.g., past quit attempts, tobacco use intensity). Of particular note will be whether FCTC policies serve to reduce disparities of tobacco use burden as a function of SES; and
• To examine whether the effects of each policy on tobacco use behaviour are mediated by those psychosocial variables that have been identified by past research to be important in predicting and understanding tobacco use behaviour.
Contextual study aims: • To conduct analyses that will examine the natural history of tobacco use and cessation in India and
also whether the factors that predict tobacco use and quitting are the same or different across the ITC countries; and
• To compare the impact of FCTC policies in India, a LMIC, to that in HICs and other LMICs to test the hypothesis that for some policy domains, the impact of FCTC policies will be stronger in LMICs.
The TCP India Wave 1 Survey is a timely initiative towards understanding the impact of key tobacco control policies introduced in India since 2004 on efforts to achieve compliance with the FCTC. In addition, the Survey also effectively contributes to the broader understanding of tobacco use behaviours and indicators of quitting among tobacco users in LMICs.
2tCp India Wave 1 project report (2010-2011)

3tCp India Wave 1 project report (2010-2011)
ExECuTivE SuMMaRyIndia is home to approximately 275 million tobacco users. Tobacco use accounts for nearly half of all cancers among males and one-quarter of all cancers among females in India, and is also a major cause of cardiovascular and respiratory disease. The tobacco epidemic in India requires urgent attention. It is estimated that by 2020, tobacco consumption will account for more than 1.5 million deaths in the country annually.
The World Health Organization Framework Convention on Tobacco Control (FCTC) is a legally binding treaty that calls upon ratifying countries to implement evidence-based measures to reduce tobacco use and exposure to second-hand smoke. India ratified the FCTC on February 5, 2004, thereby committing to implementing a range of effective tobacco control measures as set out by the treaty.
In an effort to evaluate India’s progress in implementing the FCTC and to understand the impact of policies on tobacco use, quitting, and knowledge and perceptions among tobacco users and non-users, researchers from the Healis-Sekhsaria Institute for Public Health in India partnered with the International Tobacco Control Policy Evaluation Project (the ITC Project) at the University of Waterloo to create the TCP (Tobacco Control Policy) India Project – a cohort study of adult (aged 15 years and older) tobacco users and non-users. India is one of more than 20 countries that are undertaking cohort surveys as part of the ITC Project.
The TCP India Wave 1 Survey was conducted between August 2010 and December 2011 in four large cities and surrounding rural districts in the states of Maharashtra (Mumbai), Madhya Pradesh (Indore), Bihar (Patna), and West Bengal (Kolkata).
Face-to-face interviews were conducted with a total sample of approximately 8000 tobacco users and 2400 non-users based on a stratified multistage cluster sampling design. The sampling design was selected to provide a random, unbiased sample of adult tobacco users and non-users within each of the four cities and their surrounding rural districts. The interviews were conducted in Hindi, Marathi, Bengali or English by trained interviewers from the Healis-Sekhsaria Institute for Public Health in Maharashtra; the School of Preventative Oncology in Bihar; the Madhya Pradesh Voluntary Health Association (MPVHA) in Madhya Pradesh; and the Cancer Foundation of India in West Bengal.
In 2003, India enacted the Cigarette and Other Tobacco Products Act (COTPA, 2003), one of the most comprehensive and powerful anti-tobacco laws in the world at that time. Over the years, India has demonstrated leadership in selected areas of tobacco control - in 2009 India became the first country to implement warnings on smokeless tobacco product packages. In 2011, India implemented the world’s strongest restrictions on the display and use of tobacco products in films. However, progress has been slow in many other key areas of tobacco control. The following summarizes key findings and recommendations from the TCP India Wave 1 Survey:

Tobacco use – Prevalence and PerceptionsCurrent tobacco use among adults aged 15 years and older ranged from 23% to 47% as follows: 47% in Bihar, 33% in West Bengal, 28% in Maharashtra, and 23% in Madhya Pradesh. Prevalence of tobacco use was much higher among males than females in all four states, ranging from 34% of males in Maharashtra to 59% of males in Bihar. Among females, prevalence ranged from 9% in Madhya Pradesh to 32% in Bihar. In general, prevalence of tobacco use was higher among low-income and less-educated adults than among high-income and more highly educated adults.
Smokeless tobacco was the most common form of tobacco product used in all four states – at least 2 out of 5 adults used smokeless tobacco. Khaini was the smokeless product used most often in Bihar, West Bengal, and Maharashtra, while plain chewing tobacco was used more than khaini in Madhya Pradesh. Use of smokeless tobacco only was highest in Maharashtra (84% of tobacco users) and lowest in West Bengal (52% of tobacco users). Cigarettes were the most common smoked tobacco product in West Bengal (75% of smokers), Bihar (77% of smokers), and Maharashtra (67% of smokers), whereas bidis were the most common smoked tobacco product in Madhya Pradesh (72% of smokers). Less than one-quarter of adult tobacco users in each of the four states used mixed (both smoked and smokeless) tobacco products.
Tobacco users’ experience of regret for ever having started smoking is an important indicator of societal norms about tobacco use and a predictor of future quitting behaviour. In all four states, the majority of smokersi (63% to 81%) and smokeless usersii (64% to 87%) expressed regret for starting to use tobacco. Moreover, more than 90% of tobacco users and non-users in all four states had negative views on the use of smoked and/or smokeless tobacco products. More than half of tobacco users and non-users across all four states perceived that Indian society disapproves of the use of smoked and smokeless tobacco.
CessationTobacco users in all four states had a low degree of readiness to quit smoking – 75% to 94% of smokers, and 73% to 94% of smokeless users had no plans to quit using their respective products.
Current tobacco control policies are not providing strong motivation for tobacco users to think about quitting. In all four states, the price of smoked or smokeless tobacco products, and restrictions on smoking or using smokeless tobacco at work were cited by less than half of current smokers and current smokeless users as important reasons to think about quitting.
However, rates of tobacco users who received advice to quit from doctors or health professionals are encouraging, ranging from about half of those who visited a doctor in the previous six months in Madhya Pradesh (52%) and West Bengal (48%), to just over one-third in Bihar (34%) and Maharashtra (34%). The vast majority (59% to 85%) who received this advice said it made them think about quitting.
i. Smokers include smokers only and mixed tobacco (smoked and smokeless) users.
ii. Smokeless users include smokeless only users and mixed tobacco (smoked and smokeless) users.
Dr. Prakash C. Gupta presenting results of a study on effectiveness of warning labels on tobacco products to media and coworkers.
4tCp India Wave 1 project report (2010-2011)

Smoke-free PoliciesApproximately three years after the implementation of the 2008 National smoke-free law which prohibited smoking in all public places and workplaces (including bars and restaurants), with allowances for designated smoking areas in airports and larger hotels and restaurants, compliance with the law remains weak. There was evidence of stronger compliance with smoke-free laws in workplaces and on public transportation in Maharashtra compared to the three other states.
In Madhya Pradesh, only 18% of smokers reported that they were aware that the government has started to implement the smoke-free law. This percentage was higher in Maharashtra (35%), Bihar (54%), and West Bengal (59%).
Workplaces
The vast majority of smokers who worked indoors reported that smoking is not allowed in any indoor areas at their workplaces; however, in Bihar, West Bengal, and Madhya Pradesh, 60% to 67% of smokers, 40% to 54% of smokeless only users, and 22% to 42% of non-users reported that they had seen people smoking in indoor areas at their workplaces. Compliance was higher in Maharashtra, where 29% of smokers, 17% of smokeless only users, and 9% of non-users observed people smoking in indoor areas at their workplaces.
There was strong support for a comprehensive workplace smoking ban among respondents in Bihar, Madhya Pradesh, and Maharashtra (more than 82% of smokers, more than 86% of smokeless only users, and more 96% of non-users). Support for a complete workplace smoking ban in West Bengal was lower, ranging from 52% of smokers to 74% of non-users.
Hospitality venues
In all four states, there was a lack of compliance with indoor smoking bans in hospitality venues, particularly in bars. Observed indoor smoking in bars was highest in Bihar and Madhya Pradesh, where more than 87% of smokers, more than 93% of smokeless only users, and more than 83% of non-users noticed smoking at their last visit. The public also continues to be exposed to second-hand smoke in restaurants – across the four states, 34% to 71% of smokers, 32% to 53% of smokeless only users, and 22% to 41% of non-users noticed smoking in restaurants at their last visit.
There was strong public support for smoke-free restaurants. In Madhya Pradesh and Bihar, approximately three-quarters of smokers, more than 78% of smokeless only users, and more than 90% of non-users said that smoking should be completely banned in indoor areas in restaurants.
Support among smokers, smokeless only users, and non-users for comprehensive smoking bans in bars was generally lower than support for such bans in workplaces, restaurants, and public transportation.
Public transportation
Noticing smoking inside public transportation was highest in Bihar and West Bengal, where more than half of all respondents who used public transportation noticed smoking during their last ride, followed by more than one-third of tobacco non-users in Madhya Pradesh. Noticing smoking inside public transportation was lowest among all respondents in Maharashtra.
There was almost unanimous support (more than 7 out of 8) among smokers, smokeless only users, and non-users in all four states for a ban on smoking inside public transportation vehicles.
Smoking in the home
In all four states, smokers were less likely to have voluntary bans on smoking inside the home in comparison to non-users. Maharashtra had the highest percentage of non-users (90%), smokeless only users (87%), and smokers (45%) who did not allow smoking in their homes.
There was evidence of a lack of awareness of the harms of second-hand smoke to children among smokers who allowed smoking in the home. In West Bengal and Madhya Pradesh, only about one-third of smokers were concerned that their own smoking in the home would harm their children’s health.
5tCp India Wave 1 project report (2010-2011)

6tCp India Wave 1 project report (2010-2011)
Health Warning labelsThe TCP India Wave 1 Survey evaluated India’s Round 1 pictorial labels that were required on smoked and smokeless packages between May 2009 and November 2011. The warnings included two rotating images (a drawing of a diseased lung, and an x-ray image of a lung) for smoked tobacco products, and one image (a drawing of a scorpion) for smokeless tobacco products, covering 40% of the front exterior display area. All labels included the message “Tobacco causes cancer”. The labels on smoked tobacco products also included the message “Smoking kills”, while the smokeless packs carried the message “Tobacco kills”. Since the Wave 1 Survey, India has implemented two new rounds of images, however, the size of the warnings has remained at 40% of the front of the package.
Warning label salience varied by state. The percentage of tobacco users who noticed warning labels “often” or “whenever they smoked/used tobacco” was highest in Maharashtra (75% of smokers and 77% of smokeless users) and lowest in Madhya Pradesh (28% of smokers and 27% of smokeless users). In all four states, less than 50% of smokers and smokeless users read or looked closely at the warning labels on packages of their respective products.
With a few exceptions in Bihar, the Round 1 pictorial warning labels have not been effective in terms of encouraging tobacco users to think about the health risks of tobacco use, avoid warning labels, forgo the use of tobacco products, and to quit.
Despite the limited effectiveness of the Round 1 pictorial labels, smoked and smokeless tobacco product packages are a prominent source of health information for tobacco users in India. More than three-quarters of smokers in each of the four states were aware that smoking cigarettes and/or bidis can lead to lung, throat, and mouth cancers in smokers. However, knowledge of other health effects was lower - more than half were aware that smoking causes tuberculosis and lung cancer in non-smokers. Smokers in Bihar and West Bengal had high levels of awareness that smoking can cause heart disease in non-smokers, asthma in children, strokes, and impotence. Awareness of the health effects of smoking was especially low in Madhya Pradesh – smokers in this state had the lowest knowledge for all 10 of the health effects assessed in the TCP India Wave 1 Survey.
Health warning labels on smokeless products have resulted in some awareness of the harms of smokeless tobacco use. In all four states, at least two–thirds of smokeless users were aware that the use of smokeless tobacco causes throat and mouth cancer, and gum disease; and more than half were aware that using smokeless tobacco causes heart disease.
The majority of tobacco users still wanted more health information on warning labels. Support for more information was highest in Madhya Pradesh, where more than three-quarters of smokers (76%) and smokeless users (77%) thought there should be more health information on the warning labels on packages of their respective products.
Round 1 health warning label (in two languages) that was required on smokeless tobacco products between 2009 and 2011 and was evaluated in the TCP India Wave 1 Survey.

Tobacco advertising, Promotion, and Sponsorship (TaPS)Although India has implemented bans and restrictions on TAPS, the legislation is not comprehensive and as a result, the public continues to be exposed to the marketing of tobacco products.
Exposure to tobacco advertising was highest in Maharashtra, where more than half of smokers (55%) and non-users (55%), and half of smokeless users (50%) noticed advertising and pictures of tobacco use “often” or “once in a while” in the last six months.
Shop windows or the inside of shops were the most common sources of tobacco advertising in all four states, whereas educational buildings, bars, and cinemas were the least common sources of tobacco advertising.
Tobacco users and non-users in all four states strongly supported a comprehensive ban on tobacco advertising in shops and stores and a ban on the display of tobacco products at point of sale. Support for both policies was particularly high in Maharashtra and West Bengal where more than 90% of tobacco users and non-users said they supported each policy “a lot” or “somewhat”.
Brand stretching was prominent in Madhya Pradesh despite the ban under COTPA 2003 regulations. At least one-third of smokers (39%), smokeless only users (33%), and non-users (35%) in this state noticed clothing or items with a tobacco brand name or logo.
Exposure to tobacco use in the entertainment media prior to India’s strong legislation banning tobacco use on television and in movies was high as almost half of all respondents in Bihar (47% of smokers, 50% of smokeless only users, and 49% of non-users); and almost half of smokeless only users (47%) and more than half of smokers (53%) and non-users (56%) in Maharashtra stated that they “often” noticed people using tobacco in entertainment media. This high visibility is of concern as existing research has consistently shown that exposure to smoking in the movies is associated with the uptake of smoking among youth.
7tCp India Wave 1 project report (2010-2011)

Education, Communication, and Public awarenessThere was evidence for the importance of tobacco packages as a primary source of anti-tobacco information for smokers, smokeless users, and non-users. Tobacco packages were the most common source of anti-tobacco information for smokers in Maharashtra (86%), Bihar (78%), and West Bengal (69%); and the second most common source of anti-tobacco information for smokers in Madhya Pradesh (68%) (where television was more common). Tobacco packages were also the most common source of information for smokeless only users (80%) and non-users (82%) in Maharashtra.
Television was the most common source of anti-tobacco information for smokers in Madhya Pradesh (79%); and for smokeless only users and non-users in Bihar (81% and 88%, respectively), West Bengal (60% and 73%, respectively), and Madhya Pradesh (80% and 89%, respectively). Television was also the second most common source of anti-tobacco information for smokers in Maharashtra (60%), West Bengal (60%), and Bihar (75%).
Public transportation vehicles or stations were also a prominent source of anti-tobacco information, while bars were the least common source of anti-tobacco information across the four states.
Anti-tobacco information in India has not had a large impact in making tobacco use less socially acceptable or encouraging quitting.
The percentage of smokers who said that anti-tobacco advertising has made tobacco use less socially acceptable ranged from 1% in Maharashtra to 25% in West Bengal. Among smokeless only users, these percentages ranged from 3% in Maharashtra to 38% in Bihar. In all four states, 10% to 27% of smokers and 8% to 25% of smokeless only users said that anti-tobacco advertising has made them “more likely” to quit using tobacco.
These results emphasize the importance of strengthening health warnings according to Article 11 of the FCTC and the Article 11 Guidelines as a cost-effective strategy for educating the public on the harms of tobacco use, for promoting quitting, and for encouraging youth not to start smoking.
Price and TaxationThere is overwhelming evidence indicating that increasing taxes and prices on tobacco products is the single most effective way to reduce tobacco use. In India, tobacco taxes vary by product type, product characteristics (e.g., length, filter), producer characteristics (e.g., small vs. large bidi producers), and by state. At the time of the TCP India Wave 1 Survey, tobacco taxes fell far below the World Bank recommendation of 66% to 80% of the retail price. Approximately 38% of the retail price of cigarettes and 9% of the retail price of bidis was the tax component, while smokeless tobacco products are often sold without any tax component in the retail price.
The TCP India Wave 1 Survey provided evidence across several indicators pointing to the urgent need to increase taxes and prices across all forms of tobacco. In all four states, the average price per stick for bidis (`0.20 to `0.50 per bidi) was significantly lower than the average price per stick for cigarettes (`2.60 to `3.30 per cigarette).
Tobacco users in all four states were not concerned about how much they spend on tobacco products – 44% to 76% of exclusive cigarette smokers, 48% to 82% of exclusive bidi smokers, and 63% to 83% of smokeless only users said that they “never” thought about the amount of money they spent on their respective tobacco products in the last month.
Similarly, less than one-quarter of all current cigarette smokers, bidi smokers, and smokeless users in all four states said that the money they spent on their respective tobacco products is diverted from other essential household expenditures. The price of tobacco products was not a deterrent to quitting - price was identified as one of the least important reasons that led smokers and smokeless users to think about quitting.
8tCp India Wave 1 project report (2010-2011)

RECoMMEnDaTionSThe TCP India Wave 1 Survey findings provide evidence that India needs to strengthen tobacco policies to reduce the morbidity and mortality caused by widespread tobacco use in India and to meet its obligations as a Party to the FCTC. Among the key recommendations are the following:
1. Low readiness to quit among tobacco users in India suggests the need for stronger tobacco control policies to create social environments that are supportive of quitting, including more effective pictorial warning labels and sustained anti-smoking campaigns. The low ranking of “price” and “restrictions on use of smoked and smokeless products at work” as important reasons for thinking about quitting suggests the need for large increases in the price of tobacco, and comprehensive smoke-free laws.
2. India’s national ban on smoking in indoor workplaces and public places is not comprehensive, nor is it enforced uniformly across states. Allowances for designated smoking rooms in airports, hotels with 30 or more rooms, and in restaurants with a seating capacity for 30 or more need to be eliminated in order for COTPA to meet the FCTC Article 8 requirements for a comprehensive ban with no exceptions.
3. India’s legislation for pictorial warnings does not meet the recommended size for effective warning labels as set out in the FCTC Article 11 and its Guidelines. Article 11 states that labels “should be 50% or more, but no less than 30%, of the principal display areas”. The Guidelines state that “Parties should consider using health warnings and messages that cover more than 50% of the principal display areas and aim to cover as much of the principal display areas as possible”. In order to increase the effectiveness of pictorial health warnings, India should increase the size of the warnings to cover at least 50% of the principal display areas and require them on the front and back of the pack. In addition, the content of health warnings needs to be broadened to include a wider range of messages, including the harms of second-hand smoke. Warning labels that include information on how to access cessation services may also motivate tobacco users to make quit attempts, and help them to stay quit. Article 11 and Article 13 Guidelines also recommend that Parties consider implementing plain packaging. Emerging studies evaluating Australia’s implementation of plain packaging in 2012 indicate that plain packs decrease perceived quality of cigarettes and smoking satisfaction and increase thoughts about quitting. India should monitor Australia’s experience and that of other countries that have recently committed to implementing plain packaging, including Ireland and New Zealand.
4. The strong presence of tobacco advertising in retail establishments and overwhelming public support for a complete ban on tobacco advertising at point of sale, as well as for a ban on the display of all tobacco products suggests the need to implement a comprehensive ban on tobacco advertising and pack displays in the retail environment. Recent evidence from the ITC Project indicates that point of sale display bans in Canada and Australia have resulted in a marked decline in exposure to tobacco marketing and less frequent impulse purchasing of cigarettes.
5. Current prices of tobacco products in India are highly affordable and are not a motivator for quitting. Given that strong price and taxation policies have consistently been shown to be the most effective tobacco control measure, it is urgent for India to increase price and taxation across all tobacco products. Evidence shows that this will not only increase cessation, but will also increase government taxation revenue.

10tCp India Wave 1 project report (2010-2011)
Prevalence of Tobacco UseThe Global Adult Tobacco Survey India (GATS India), is a national study which provides the most current estimates on adult tobacco use and the overall impact of tobacco control measures in India.18 In 2009-2010, The Ministry of Health & Family Welfare (MoH&FW), Government of India, designated the International Institute for Population Sciences (IIPS), Mumbai, as the nodal agency for conducting GATS in India. Technical assistance was provided by the Centers for Disease Control and Prevention (CDC), the World Health Organization (WHO), the Johns Hopkins Bloomberg School of Public Health, and Research Triangle Institute International (RTI International). Healis - Sekhsaria Institute for Public Health was represented as a member of the Technical Advisory Committee and Technical Review Committee. GATS India (2009-2010) found that 35% of adults (aged 15 years and older) use some form of tobacco, with a higher prevalence of tobacco use among males (48%) than females (20%). In India, tobacco is consumed in a variety of smoked (e.g., bidi, cigarettes, hookah) and smokeless (e.g., khaini, gutka, betel quid with tobacco) forms. Estimates from GATS India showed that nearly one-quarter (21%) of adults use smokeless tobacco exclusively, whereas only 9% of adults use smoked tobacco exclusively. Findings also showed that the prevalence of smoked tobacco use was much higher for males (24%) than for females (3%). Prevalence of smokeless tobacco use was also higher for males than for females, although the gender difference was not as extreme (33% for males vs. 18% for females). Overall, the prevalence of both smoked and smokeless tobacco use was higher in rural areas than in urban areas.
CessationCompared to developed countries, the rates of smokers who want to quit and who actually try to quit are low in developing countries; therefore, it is even more urgent for governments in LMICs to provide assistance to smokers to help them quit.1, 2
Article 14 of the FCTC obligates Parties to take effective measures to promote cessation of tobacco use and provide adequate treatment for tobacco dependence. Guidelines for Article 14 recommend a broad range of cessation interventions including population-based approaches that have wide reach (mass communication, brief advice, and quitlines) and, where resources permit, more intensive individual approaches (specialized treatment services like behavioural support and medications). Recognizing that LMICs will not have the resources to implement a comprehensive cessation strategy, the Guidelines outline a “stepwise approach” to building infrastructure for cessation and treatment for tobacco dependence.3
Evidence from developing countries suggests that very few tobacco users spontaneously quit on their own; therefore, cessation aids such as pharmacotherapy, quitlines, and physician advice are needed if quit rates are to improve.4 Nicotine replacement therapies (NRTs) are legally available in India from general stores and do not require a prescription, whereas buproprion and varenicline may be purchased from pharmacies and require a prescription if the dosage is over 2 mg.5, 6 The cost of these treatments is not covered by any national health insurance plan.
THE ToBaCCo lanDSCaPE in inDiaThis section provides an overview of tobacco use and tobacco control policies in India at the time of the TCP India Wave 1 Survey (2010-2011). India was among the initial countries to ratify the WHO FCTC in 2004 in response to globalization of the tobacco epidemic. Just prior to FCTC ratification, comprehensive legislation on tobacco control- the Cigarette and Other Tobacco Products Act (COPTA 2003), was enacted in India. The law came into force on May 1, 2004.

India now has a national quitline, which was launched in May 2012 in conjunction with World No Tobacco Day. The quitline is toll-free and is available for 12 hours a day in five major languages (English, Hindi, Marathi, Kannada, and Bengali), as well as several other regional languages.7 The quitline provides support and advice to tobacco users by trained counselors, and callers can also be referred to a local Tobacco Intervention Initiative (TII) Center for on-the-ground support. There are over 500 of these TII centers across India, where tobacco users can go to receive cessation treatment from trained dental professionals.
In addition to the TII centers, the first dedicated tobacco cessation clinics (TCCs) offering formal tobacco cessation treatment were established across India beginning in 2002 as a joint initiative of the Ministry of Health and Family Welfare and the World Health Organization (WHO). The initiative began as a pilot project with 19 centers located in various settings, such as cancer treatment centers, medical colleges, psychiatric centers, and non-governmental organizations. The majority of these clinics offered behavioural interventions, while others offered both behavioural counseling and pharmacotherapy treatment.4 Almost 35,000 individuals were treated through these clinics in the first five years of the program, and evaluation studies found improvement in quit rates among those who had received treatment: 26% of patients who were followed up had either quit or reduced their tobacco use by at least 50% after 3 months; 21% after 6 months; and 18% after 9 months.8
The pilot project demonstrated the feasibility of offering tobacco cessation clinics at various settings, and found satisfactory improvement rates in tobacco users who had received treatment. The challenge now is to integrate these services into the health care system in India and make them available for a wider population, including both urban and rural tobacco users. The Government of India has already taken steps towards achieving this goal with the National Tobacco Control Programme (NTCP) launched in 2007-2008. As part of this initiative, the Government has made most of the TCCs self-sufficient, enabling them to sustain their activities from 2010 onwards.8
The NTCP also included National Guidelines for Tobacco Dependence Treatment, which consists of training modules for doctors and health care workers in offering advice for tobacco cessation.9 The inclusion of cessation in the training modules for health professionals as of 2010 is a much needed initiative, as the Global Health Professionals Students Survey (GHPSS) conducted in India from 2005-2008 found a high prevalence of tobacco use among medical students, as well as a lack of adequate training in cessation and counseling techniques.10
Smoke-free Public Places and Workplaces Article 8 of the FCTC calls for the adoption of effective measures to provide protection from exposure to tobacco smoke in (1) indoor workplaces, (2) indoor public places, (3) public transportation, and (4) “as appropriate” in “other public places”. Enclosed workplaces include all motor vehicles used as places of work. Article 8 states that safe levels of exposure to second-hand smoke do not exist and therefore mandates that all FCTC Parties ensure complete protection from second-hand smoke in all indoor public places.3, 11
Section 4 of the Cigarettes and Other Tobacco Products (Prohibition of Advertisement and Regulation of Trade and Commerce, Production, Supply and Distribution) Act, 2003 (COTPA) prohibits smoking in all public places, with the exclusion of open spaces. Section 4 of COTPA represents the first and current nation-wide legislation for smoke-free places. The rules to enforce Section 4 viz. Prohibition on Smoking in Public Places Rules 2008 (vide G. S. R 417(E) dated May 30, 2008) came into force on October 2, 2008. By this Rule, the definition of public places was broadened to include open auditoriums, stadiums, railway stations, bus stops/stands, workplaces, shopping malls, and cinema halls. In all places where smoking is prohibited, proprietors must display sign boards that read “No Smoking Area – Smoking Here is an Offence” in English or one Indian language on a 60x30cm board at some conspicuous place; the name of the person receiving complaints must be clearly displayed; and any smoking paraphilia such as lighters and ashtrays must not be provided.
11tCp India Wave 1 project report (2010-2011)
No Smoking Area Smoking Here is an Offence
60 cm wide
30 c
m h
igh

Designated smoking areas are not permitted at the entrance or exit of an airport, hotel, or restaurant. Where provided, these areas must be clearly marked as a “Smoking Area” or “Smoking Room” in both English and one Indian language.11, 12 Because of the provision for designated indoor smoking areas, the current policy in India does not fully align with Article 8 Guidelines, which call for 100% smoke-free public places.
As per Section 21 of COTPA, any person who violates Section 4 by smoking in a public place is subject to a fine of up to `200. An officer of authority of a public place who fails to act on a report of such a violation will be required to pay a fine equivalent to the sum of each individual offence.
The definition of “public place” in COTPA does not currently align with the FCTC Guidelines.14 According to COTPA, “public place” is defined as “any place to which the public has access, whether as of right or not, and includes auditoriums, hospital buildings, railway waiting rooms, amusement centres, restaurants, public offices, court buildings, educational institutions, libraries, public conveyances and the like which are visited by the general public, but does not include any open space.” This definition, unlike the FCTC Article 8 Guidelines definition, does not include temporary structures. Furthermore, the term “public conveyances”, is not further defined which makes its interpretation difficult.15
In July 2007, before the national level COTPA regulations were enacted, Chandigarh passed legislation that made it the first smoke-free city in India.16 Chandigarh is the capital city of the Indian states of Haryana and Punjab and is also a Union Territory. Smoke-free initiatives in Chandigarh were followed by similar initiatives in districts of Kerala in September 2008, before the national level legislation came into effect.17
GATS India (2009-2010) was conducted after COTPA regulations were enacted, and found that nearly one-third of adults aged 15 years and older reported exposure to second-hand smoke in their indoor workplaces. Moreover, nearly one-third of adults aged 15 years and older who had visited any public place in the 30 days before they completed the survey reported being exposed to second-hand smoke in public places. Findings from the GATS study also found that half of all adults who had visited a restaurant in the 30 days before they completed the survey and had seen a designated smoking area observed smoking in non-smoking areas.18
India’s smoke-free law permits designated smoking areas in airports, hotels with at least 30 rooms, and restaurants with at least 30 seats. Because of this provision for designated indoor smoking areas, the current policy in India does not fully align with Article 8 Guidelines, which call for 100% smoke-free public places.
Designated smoking areas are allowed at airports, hotels with at least 30 rooms, and restaurants with at least 30 seats. Designated smoking areas refer to separately ventilated smoking rooms that:
1. Are physically separated and surrounded by full height walls on all four sides;
2. Have an entrance with a closed door;
3. Have an air flow system; and
4. Have negative air pressure.
12tCp India Wave 1 project report (2010-2011)

Packaging and Labelling of Tobacco ProductsArticle 11 of the WHO FCTC stipulates that each Party to the Convention shall adopt and implement effective packaging and labelling measures and provides recommendations on the content, position, appearance, and size of warning labels. Article 11 recommends that the health warnings should be the ones approved by the national authority; should be rotating, large, clear, visible, and legible; the tobacco packages should not use any misleading descriptors such as “light” and “low tar”; the warnings should be in the form of or include pictures or pictograms; the warnings should cover 50% or more of the principal display areas but shall be no less than 30% of the principal display areas.
In November 2008, the Conference of Parties at its third session adopted the Guidelines for implementation of Article 11. The Guidelines further state that the warnings and messages should be positioned on both the front and back (or on all faces, if there are more than two) of each unit packet or package; should be placed at the top of the principal display area rather than bottom to increase its visibility; and should be placed in such a manner that the normal opening of the package does not damage or conceal the text or image of the warnings.19
Health warning labels are one of the most effective ways to inform tobacco users about the harmful effects of consuming tobacco and the harms of exposure to second-hand smoke. Given their tremendous reach and frequency of exposure (pack-a-day smokers are potentially exposed to warnings over 7000 times per year20), health warnings are extremely cost-effective as a public health intervention strategy compared to other communication tools such as paid mass media advertising. Non-users also report high exposure and awareness of health warning labels, as tobacco packages are displayed each time the product is used or left in public view, and are also prominent in retail outlets in many countries. The research conducted by the International Tobacco Control Policy Evaluation Project has shown that warning labels are an effective risk communication tool for:
1. Educating/informing tobacco users and non-users about the harmful effects of tobacco use;
2. Motivating and encouraging tobacco users to quit and non-users not to start smoking; and
3. Providing information to enhance efficacy for quitting.
Tobacco packaging is used by the tobacco industry to reinforce brand imagery, to minimize perceptions of risk, and to suggest incorrectly that some types of products are less harmful than others (e.g. use of “mild” and lighter colour packages to suggest less harm). Strong health warnings on tobacco packages that communicate the health risks caused by tobacco use and exposure to second-smoke can be used to counteract these types of misleading messages and descriptors.
Legislation on health warnings in India began with the 1975 National Cigarettes (Regulation of Production, Supply, and Distribution) Act, which required all cigarette packages, cartons and advertisements to display the text warning “Cigarette smoking is injurious to health”. The Act specified that the warning had to be a minimum of 3mm in height and appear in the same language as the branding on the package.21 However, the law did not apply to any other tobacco products, such as bidis and smokeless tobacco.22, 23
13tCp India Wave 1 project report (2010-2011)

Under COTPA, the display of pictorial warnings on all tobacco products is mandatory, and the sale and import of tobacco products without the specified warnings is prohibited (Section 7); the warnings should be legible and prominent and should be conspicuous as to size and colour (Section 8); and the warnings must appear in the same language as given on the pack (Section 9). The rules to enforce Section 7 were notified in July 2006 [vide G. S. R. 402 (E), dated July 15, 2006] after a Public Interest Litigation filed in High Court of Himachal Pradesh demanded the implementation of pictorial warnings. Because the Rules notified under Section 7 experienced a constant delay, deferral and dilution, India failed to meet the three year deadline for introducing health warnings after ratifying the FCTC. The Indian government finally approved the first set of pictorial health warnings in 2008 under the Cigarettes and Other Tobacco Products (Packaging and Labelling) Rules, 2008 [vide G.S.R. 182 (E) dated March 15, 2008], which came into force on May 31, 2009. The final set of warnings were also weakened from the images that had initially been proposed to the government, and the provision in COTPA that had required the display of a skull and crossbones with the warnings was removed due to pressure from the tobacco industry.24 Research to evaluate these health warnings in India has shown them to be ineffective and poorly understood by the majority of the population.25, 26
Further amendments to COTPA legislation were implemented by the Ministry of Health and Family Welfare in 2010 and 2011. The Cigarettes and Other Tobacco Products (Packaging and Labelling) Amendment Rules introduced in December 2010 changed the period of rotation of the warning labels from every 12 months to every two years.27 One year later, in December 2011, another amendment required new Round 2 pictorial warnings to replace the older versions, including four warnings for smoked tobacco products and four additional warnings for smokeless tobacco products.28
On September 27, 2012, a third round of pictorial health warnings was proposed.29 The new warnings were mandated to appear on all tobacco packages beginning April 1, 2013. The size of the Round 3 warnings remains at 40% of the front of the package, which means that only 20% of the principal display areas, on average, is covered and thus the warnings still do not meet the recommended size of at least 30% set by Article 11 Guidelines.
This is a new pictorial warning required on 40% of the front of smokeless tobacco pouches as of April 1, 2013.
14tCp India Wave 1 project report (2010-2011)
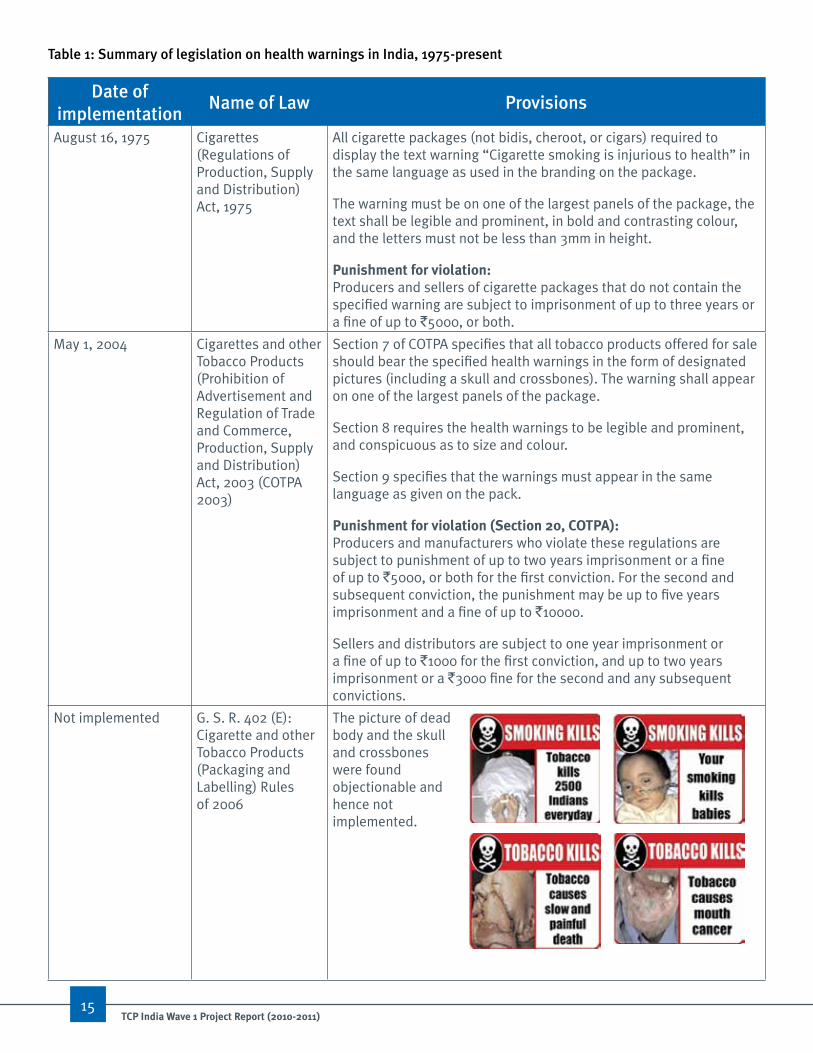
Table 1: Summary of legislation on health warnings in india, 1975-present
Date of implementation
name of law Provisions
August 16, 1975 Cigarettes (Regulations of Production, Supply and Distribution) Act, 1975
All cigarette packages (not bidis, cheroot, or cigars) required to display the text warning ‘‘Cigarette smoking is injurious to health’’ in the same language as used in the branding on the package.
The warning must be on one of the largest panels of the package, the text shall be legible and prominent, in bold and contrasting colour, and the letters must not be less than 3mm in height.
punishment for violation: Producers and sellers of cigarette packages that do not contain the specified warning are subject to imprisonment of up to three years or a fine of up to `5000, or both.
May 1, 2004 Cigarettes and other Tobacco Products (Prohibition of Advertisement and Regulation of Trade and Commerce, Production, Supply and Distribution) Act, 2003 (COTPA 2003)
Section 7 of COTPA specifies that all tobacco products offered for sale should bear the specified health warnings in the form of designated pictures (including a skull and crossbones). The warning shall appear on one of the largest panels of the package.
Section 8 requires the health warnings to be legible and prominent, and conspicuous as to size and colour.
Section 9 specifies that the warnings must appear in the same language as given on the pack.
punishment for violation (Section 20, COtpA): Producers and manufacturers who violate these regulations are subject to punishment of up to two years imprisonment or a fine of up to `5000, or both for the first conviction. For the second and subsequent conviction, the punishment may be up to five years imprisonment and a fine of up to `10000.
Sellers and distributors are subject to one year imprisonment or a fine of up to `1000 for the first conviction, and up to two years imprisonment or a `3000 fine for the second and any subsequent convictions.
Not implemented G. S. R. 402 (E): Cigarette and other Tobacco Products (Packaging and Labelling) Rules of 2006
The picture of dead body and the skull and crossbones were found objectionable and hence not implemented.
15tCp India Wave 1 project report (2010-2011)

Table 1: Summary of legislation on health warnings in india, 1975-present continued…
Date of implementation
name of law Provisions
Not implemented G.S.R. 633(E): Cigarette and other Tobacco Products (Packaging and Labelling) (Amendment) Rules, 2007
May 31, 2009 G.S.R. 182(E): Cigarette and other Tobacco Products (Packaging and Labelling) Rules of 2008
S.O.2814(E): Cigarettes and other Tobacco Products (Packaging and Labelling) Amendment Rules, 2008
G.S.R. 305(E): Cigarettes and other Tobacco Products (Packaging and Labelling) Amendment Rules, 2009
All tobacco packages (including cigarettes, cigars, cheroots, bidis, pipe, hookah, chewing tobacco, snuff, and paan masala) required to display the health message “tobacco causes cancer”, along with one of the specified round 1 warning images:
• Two images specified for smoked tobacco products: a drawing of a diseased lung, and an x-ray image of a lung. The image is accompanied by the text warning “SMOKING KILLS”.
• One image specified for smokeless tobacco products: a scorpion. The image is accompanied by the text warning “TOBACCO KILLS”.
The warnings shall appear in the same language as used on the package. If there is more than one language on the package, then the warning shall appear in two languages (S.O.2814(E)).
The text of the warning shall appear in white font, on a red background, and the message “Tobacco causes cancer” shall appear in black font.
The warning shall occupy at least 40% of the principal display area of the front panel, parallel to the top edge of the package and in the same direction as the information on the principal display area. For conical-shaped bidi packages, the widest edge of the package is considered to be the top edge (GSR.305(E)).
The use of false, misleading, or deceptive terms about the health effects of the tobacco product or its emissions is prohibited.
16tCp India Wave 1 project report (2010-2011)

Date of implementation
name of law Provisions
December 1, 2010 G.S.R 176 (E): Cigarette and Other Tobacco Products ( Packaging and Labelling) Amendment Rules, 2010
New pictorial warnings mandated for all tobacco products.
December 20, 2010 G.S.R. 985(E): Cigarettes and other Tobacco Products (Packaging and Labelling) Amendment Rules, 2010
Amendment to the rotation period of the specified health warnings: the warning on tobacco packages shall be rotated every two years from the date of notification of the rules, or earlier as specified by the Central Government.
December 1, 2011 G.S.R. 417(E): Cigarettes and other Tobacco Products (Packaging and Labelling) Amendment Rules, 2011
round 2 pictorial warnings mandated for all tobacco packages:
• Four new pictorial warnings specified for smoked tobacco products: three different images of a man with diseased lungs, and one image showing cancer of the mouth/jaw. All warnings accompanied by the text “SMOKING KILLS”.
• Four additional warnings specified for smokeless tobacco packages, each showing a different image of cancer of the mouth/jaw. All warnings accompanied by the text “TOBACCO KILLS”.
The text of the warning shall appear in white font on a black background.
A provision for size, location, language and rotation of the health warnings remains the same.
17tCp India Wave 1 project report (2010-2011)
Table 1: Summary of legislation on health warnings in india, 1975-present continued…

Date of implementation
name of law Provisions
April 1, 2013 G.S.R. 724(E): Cigarettes and other Tobacco Products (Packaging and Labelling) Amendment Rules, 2012
round 3 pictorial warnings mandated for all tobacco packages.
• Three new pictorial warnings specified for smoked tobacco products: two images of a diseased lung, and one image of mouth cancer (the same image that was specified in the previous round). All warnings accompanied by the text “SMOKING KILLS”.
• Three new pictorial warnings specified for smokeless tobacco packages, each showing a different image of mouth cancer (two of these images are the same as those specified in the previous round). All warnings accompanied by the text “TOBACCO KILLS”.
The text of the health warning message shall appear in white font on a black background, and the word “WARNING” shall appear in red font above the message.
The size of the health warning must maintain a ratio of 0.75:1.00 between the vertical and horizontal lengths of the specified warning.
The warning shall occupy at least 40% of the principal display area of the front panel of the package.
18tCp India Wave 1 project report (2010-2011)
Table 1: Summary of legislation on health warnings in india, 1975-present continued…

19tCp India Wave 1 project report (2010-2011)
Tobacco Advertising, Promotion, and Sponsorship (TAPS)Article 13 of the FCTC obligates Parties to implement effective measures against tobacco advertising, promotion, and sponsorship. Guidelines for implementation of Article 13 adopted at the third session of the Conference of the Parties (COP) recommend a comprehensive ban on direct and indirect tobacco advertising, promotion, and sponsorship (or apply restrictions that are as comprehensive as possible). Included among the recommended measures are bans on: cross-border advertising, promotion, and sponsorship; display of tobacco products at points of sale; tobacco product vending machines; internet sales; tobacco company contributions portrayed as corporate social responsibility; brand stretching and sharing; free samples, incentives, and gifts with the purchase of tobacco products; competitions linked to tobacco products or companies; and attractive packaging and product features.
Parties must also prohibit the display of tobacco brands in the entertainment media, and any depiction of tobacco products in the media must be accompanied by anti-tobacco messages. In addition, any tobacco advertisement should be accompanied by appropriate health warnings or messages consistent with the Article 11 Guidelines. Article 13 Guidelines also recommend disclosure of any advertising, promotion, and sponsorship activities by tobacco companies to the government.
Violations of COTPA regulations regarding the sale of tobacco products within 100 yards of educational institutions are common.
Point of sale advertisements at outdoor kiosks are still common in India.
The relationship between TAPS and tobacco use has been well-documented. There is evidence that TAPS increases tobacco consumption and that comprehensive bans on TAPS lead to decreases in tobacco use, whereas partial bans have little or no effect on tobacco consumption.30, 31 Youth are especially at risk for the influence of tobacco advertising, and research in India has shown that students who are more receptive to tobacco marketing and those who are exposed to tobacco advertising have higher rates of tobacco use.32 Complete bans on all forms of TAPS are thus necessary to prevent initiation of tobacco use among youth, and to reduce consumption of tobacco products in India.

Section 5 of the current tobacco control legislation in India (COTPA 2003) which came into force on May 1, 2004, prohibits any kind of direct or indirect advertising, promotion and sponsorship of cigarettes and other tobacco products. However, point of sale advertisement is still allowed in India with some restrictions. Proviso to Section 5(2) of COTPA allows for advertisements of tobacco products to be displayed at the entrance or inside of a warehouse or shop where cigarettes or any other tobacco products are sold. Specifications for this point of sale exemption were added in 2005 via The Cigarettes and Other Tobacco Products (Prohibition of Advertisement and Regulation of Trade and Commerce, Production, Supply and Distribution (Amendment) Rules, 2005. As per these Rules, the size of the advertisement board displayed at the entrance of a warehouse or a shop where cigarettes or any other tobacco products are offered for sale shall not exceed dimensions of 60x45cm, and must have a prominent and legible warning on the top edge of the board, in black with white background stating: “Tobacco Causes Cancer” or “Tobacco Kills.” Tobacco product display boards shall only list the type of tobacco products and have no brand pack photo, brand name, or other promotional message and picture. Finally, tobacco product display boards shall not be backlit or illuminated in any manner. The implementation of these rules was stayed by the Bombay High Court in 2006. Recently the Supreme Court of India by an order dated January 3, 201333 lifted the Bombay High Court stay orders that acted as an impediment to implementation of the point of sale advertising rules.
By allowing point of sale advertisements, the law introduces loopholes for the tobacco industry to exploit. An evaluation study of compliance with the point of sale legislation conducted in various cities in India between 2005-2006 found that violations of the law were extremely common (e.g., exceeding the size limit, placing two boards together to create the appearance of a larger advertisement, placing advertisement boards on shops where tobacco was not sold).34 A more recent evaluation study carried out among 125 tobacco vendors in Mumbai in 2010 also provided evidence for common violations of the point of sale rules, including placement and size of display boards, visible promotion in the form of pictures and stickers, and the use of backlighting.35
Violations of COTPA regulations regarding the sale of tobacco products within 100 yards of educational institutions are also common, and may also encourage youth in India to start using tobacco. For example, there is evidence of a positive association between the density of tobacco advertising within 100 meters (or 109 yards) of schools and student tobacco use in Mumbai.36 In order to limit the exposure of youth to the sale and marketing of tobacco products, tobacco advertising bans need to be strongly enforced and expanded beyond 100 yards of educational institutions.
Another area where the tobacco industry has found ways to circumvent legislation is through indirect advertising of smokeless tobacco products. Many smokeless tobacco companies also manufacture products without tobacco under the same brand name, such as paan masala without tobacco. Therefore, even though advertising and promotion of smokeless tobacco is banned, the population is still being exposed to advertisements for these products through the mass media. Furthermore, clever advertising techniques are being used to associate these non-tobacco products with the actual smokeless tobacco products of the same brand name. Although this type of brand sharing or brand extension is prohibited under COTPA, tobacco companies are able to circumvent the law and promote their products using indirect advertising, which goes against the Article 13 Guidelines.37
20tCp India Wave 1 project report (2010-2011)

The sale of tobacco products to persons under the age of 18 years is prohibited. A display board is required at the point of sale declaring that “Sale of tobacco products to a person below the age of eighteen years is punishable offence”, in Indian language(s) as applicable, accompanied by a pictorial depiction of the ill-effects of tobacco use on health.
Sale of tobacco products to a person below the age of eighteen years is a punishable offence.
table 2. tobacco advertising, promotion, and sponsorship ban policies in India
DescriptionBan in Place
aligns with FCTC
Advertising on domestic TV, films, and radio Yes Yes
Advertising in domestic print media (e.g., newspapers, magazines) Yes Yes^
Outdoor advertising (e.g., billboards, posters) Yes No
Point of sale advertising No No
Tobacco product displays at point of sale Partial* No
Advertisements in or on tobacco packages No No
Tobacco industry sponsorship of national/international events or activities Partial** No
Offer or supply of tobacco products free of charge Yes Yes
Promotional discounts, gifts or prizes Yes Yes
Competitions linked to tobacco products or companies Yes Yes
Foods, candies, toys, and objects resembling tobacco products No*** No
Brand stretching/sharing Yes Yes^
Vending machines Yes Yes
Sale of tobacco products to and by minors Yes Yes
Unpaid tobacco product placement in entertainment media Yes**** Yes
Domestic and international internet tobacco product sales No No
Disclosure by tobacco industry to government on TAPS activities Not required No
Health warnings on permitted forms of advertisements (i.e., point of sale; films and TV programs in which tobacco products are displayed)
Required Yes
^ While the law technically meets the FCTC Article 13 Guidelines, violations are common
* A 2011 amendment prohibits tobacco products only from being “displayed in a manner that enables easy access of tobacco products to persons below the age of 18 years”38
** The law only bans funding by the tobacco industry that is used to promote tobacco products. All other types of funding or sponsorship are allowed.
*** Toys and candy that resemble tobacco products may be included in the general ban on tobacco promotion in COTPA, but the current definitions of “tobacco advertising and promotion” make this unclear.
**** The display and use of tobacco products in films is prohibited. For films depicting tobacco products or their use which were produced prior to the law, an anti-tobacco health warning must be shown at the beginning and middle of the film, and the display of brands or close-up images of tobacco products or packages must be masked or blurred.39
21tCp India Wave 1 project report (2010-2011)

22tCp India Wave 1 project report (2010-2011)
Education, Communication, Advocacy, and Public AwarenessUnder Article 12 of the FCTC, Parties must promote and strengthen public awareness of tobacco control issues through education and public awareness programs on the health risks of tobacco consumption and the benefits of cessation, and provide public access to information on the tobacco industry.
Public education campaigns are an essential component of a comprehensive national tobacco prevention and cessation strategy, particularly as the tobacco industry devises new ways to market and promote their products. Empirical evidence demonstrating the effectiveness of well-funded public education campaigns is vast and growing. Greater exposure to mass media campaigns is associated with increased quit attempts, improved rates of smoking cessation, and reduced adult smoking prevalence and consumption.40, 41, 42 In addition, recent evidence from the ITC Four Country Survey has demonstrated that tobacco control mass media campaigns may reduce the likelihood of relapse among recent quitters.43
In 2007-2008, the Ministry of Health and Family Welfare, Government of India launched the National Tobacco Control Programme (NTCP) in 42 districts of 21 States/Union Territories of the country, including Thane district in Maharashtra and Patna district in Bihar.44 As a part of this initiative, the Government of India allocated an annual budget of about $5 million USD towards anti-tobacco mass media campaigns, which aim to inform the public about harmful effects of smoked tobacco, smokeless tobacco, and exposure to second-hand smoke.45 For example, a national level media campaign highlighting the dangers of smokeless tobacco was broadcasted in 11 languages on television and radio in two separate phases from 2009-2011. An evaluation of this campaign showed high impact and recall among smokeless users.46
Another approach to public awareness mass media campaigns has been the involvement of Indian celebrities. For example, an anti-tobacco mass media campaign aimed at youth in 2011 featured popular Indian singer, Shaan, as an ambassador for tobacco control. The campaign included a music video that was released across the country on radio and television in 2012 titled “Life Se Panga Mat Le Yaar” with the message that a life without tobacco is a life worth living.47 Salaam Bombay Foundation’s school-based life-skills tobacco control program for youth of low socio-economic status in Mumbai and the surrounding state of Maharashtra represents an effective model of school-based tobacco use prevention that low-income schools in India and other LMICs can replicate.48 Other educational, communication, and public awareness activities under the NTCP include exhibitions, seminars, and banners at the District level. Each year on May 31st, India also participates in World No Tobacco Day (WNTD).
The STEPS Project (Strengthening of Tobacco Control Efforts through Innovative Partnership and Strategies) was a three-year project (2009-2012) implemented in 12 districts of Andhra Pradesh and Gujarat in partnership with the respective state governments to strengthen the NTCP. The STEPS Project aims to implement evidence-based economic and policy research, advocacy, community-based cessation strategies, media interventions, and multi-level tobacco control initiatives to reduce tobacco use in India.49
Mobilising Youth for Tobacco Related Initiatives in India (MYTRI) project, a multi-component intervention program, was conducted from 2004-2006 with the aim of preventing tobacco use among Indian adolescents. The program was implemented in two cities, Delhi and Chennai, and included behavioural components, parental involvement, and training of teachers and peer leaders.50 An evaluation of the program found that it was successful in reducing rates of tobacco use in the intervention schools by 17% over the two years. Following the success of the MYTRI project, another two-year intervention trial called Project ACTIVITY (Advancing Cessation of Tobacco Use in Vulnerable Indian Tobacco using Youth) was implemented in Delhi to test the efficacy of a comprehensive community-based trial for socio-economically disadvantaged youth.51

23tCp India Wave 1 project report (2010-2011)
The mission of the Advocacy Forum for Tobacco Control (AFTC) project was to create mass support for tobacco control policies through evidence-based, scientifically validated and concerted advocacy by its member organizations, targeted at policymakers through involvement of media, youth, and the general population to create a tobacco-free India. The Advancing of Tobacco Control (ATC) project in four districts of Maharashtra also advocates for tobacco control with various stakeholders (e.g., it institutionalized the enforcement mechanism for Sections 6 and 4 of COTPA 2003 at the project districts of Aurangabad, Nagpur, Pune and Thane). The Voice of Tobacco Victims (VoTV) initiative also serves as an effective platform for victims to create awareness among tobacco users and non-users, and reaches out to the media, non-governmental organizations, and other social activists to urge them to take up this cause in building a healthy, tobacco-free nation.
Bihar School Teachers Study (BSTS) was a five-year randomized control trial conducted in the 72 schools selected from 10 districts of Bihar. The aim of the study was to assess the extent to which a comprehensive tobacco control intervention known as the “Tobacco Free Teacher, Tobacco Free Society” results in increased tobacco use cessation among teachers and changes in school tobacco control policies. It was found that the 30-day quit rate was 50% in intervention group compared to 15% in control group. At the nine month post-intervention survey, the adjusted six-month quit rate was 19% in
the intervention group and 7% in the control group. Among participants employed in the school for entire academic year of the intervention, the adjusted six-month abstinence rates were 20% in the intervention group and 5% in the control group. These findings demonstrate the potent and meaningful impact of this intervention designed in response to local social context and engaging teachers as opinion leaders and role models for tobacco control in their communities.52
The extent to which adults are exposed to anti-tobacco education varies by state and by tobacco product. GATS India (2009-2010) asked respondents whether they noticed any anti-cigarette, anti-bidi, or anti-smokeless tobacco messages across specific forms of media during the 30 days prior to the survey.53 The results showed that information about the harms of smokeless tobacco was more often noticed than information about the harms of bidis or cigarettes. Seven in 10 (69%) adults noticed smokeless tobacco information, 61% noticed information on bidis, and just over one half of adults (52%) noticed information on the harms of cigarettes. Noticing information on all forms of tobacco was the highest in Chandigarh and was the lowest in Bihar for anti-cigarette information, lowest in Assam for anti-bidi information, and lowest in West Bengal for anti-smokeless tobacco information. Although 85% of adults believed that smoking causes lung cancer, only half thought it causes stroke and less than two-thirds believed it causes heart attacks, suggesting that stronger educational efforts are needed. Based on findings that 71% of cigarette smokers, 62% of bidi smokers, and 63% of users of smokeless tobacco noticed health warnings on the packages of their respective products, the GATS report recommended enhancing pack warnings as a key source of information on the harms of smoked and smokeless tobacco. In addition, the report called for innovative media strategies focused on specific target groups to be included as part anti-tobacco mass media campaigns at the national and sub-national level.

Pricing and Taxation of Tobacco Products in IndiaIncreasing taxes on tobacco products is considered to be the most effective component of a comprehensive tobacco control strategy.54, 55 Numerous economic studies from HICs have shown that in general, a 10% increase in retail price leads to about a 4% decrease in tobacco consumption, with about half of that due to lower prevalence.54, 56 There is evidence that the decrease in consumption could be even higher in LMICs.57 Therefore, if taxes are increased on tobacco products, to the extent that it is passed on as an increase in retail price, this could result in substantial reductions in tobacco prevalence and consumption. At the same time, because the relation between price and demand (i.e., consumption) of tobacco products is relatively inelastic (the percentage reduction in consumption resulting from a 1% increase in price is less than 1%), it is also the case that an increase in tax and price will lead to increases in tobacco tax revenue at the same time as it leads to decreases in tobacco use. In this way, increasing taxes on tobacco products represents a “win-win” situation – achieving health goals of reducing tobacco use while also increasing tax revenue.
Article 6 of the FCTC obligates countries that have ratified the treaty to adopt tax and price policies aimed at reducing tobacco consumption.58 A set of guiding principles and recommendations for implementation of Article 6 was adopted at the Fifth Session of the Conference of the Parties to the FCTC in November 2012. This includes the principles that effective tobacco taxes (leading to higher prices) lower consumption, improve the health of the population, are economically efficient, reduce health inequalities, and are an important source of government revenue. Recommendations for implementing Article 6 include using the simplest and most efficient tax system, considering specific or mixed excise systems over ad valorem systems, monitoring tax rates regularly to account for inflation and income growth, taxing all tobacco products in a comparable way to minimize shifts to cheaper products, dedicating tax revenue to tobacco control programs, and considering sales restrictions and limitations on international travelers importing tax and duty-free tobacco products.59
The tobacco tax structure in India is very complex, because various tobacco products are taxed differently and both central and state governments have the power to impose taxes. Tobacco taxes in India are low overall, with the most widely used products (such as bidis) taxed at the lowest rate among all forms of tobacco.60
In addition to the complex tax structure and low taxes on certain tobacco products, the Indian tobacco tax system does not adjust for inflation, so all tobacco products have become increasingly affordable over the past decade.
a report on the Economics of Tobacco and
Tobacco Taxation in india (2010)
found that raising the tax
on cigarettes to `3691 per 1000
sticks would increase the
tax to 78% of the retail price,
avert 3.4 million premature
deaths, and generate `146.3
billion in tax revenue. Raising
the bidi tax to `98 per 1000 sticks would increase the tax to 40%
of the retail price, avert 15.5
million premature deaths, and raise `36.9
billion in new tax revenues.60
24tCp India Wave 1 project report (2010-2011)

The central government in India imposes excise taxes on tobacco products, which are collected at the manufacturers’ level and can consist of specific or ad valorem tax or compounded levies. The type and amount of tax imposed depends on the tobacco product; generally, smoked tobacco products such as cigarettes and bidis are subject to specific taxes (i.e., amount per 1000 sticks). Cigarettes are taxed according to the length of the product, while tax rates for bidis are set according to whether they are made by hand or by machine. Smokeless tobacco products are taxed on an ad valorem basis (i.e., percentage of retail price).60, 61 Various types of excise taxes are also levied on tobacco products, including a basic excise duty imposed on all products since 1944; the National Calamity Contingent Duty, an earmarked tax on tobacco products used for calamity relief in states; the Health Cess, a central government tax on tobacco products (except bidis) that is used to provide resources for the National Rural Health Mission; the Bidi Workers Welfare Cess, a tax on bidis that is used for welfare activities for bidi workers; and an Education Cess on top of all other duties on tobacco products.62
Table 3. Central Government taxes on tobacco products in india
Type of Product 2012-2013 tax rate/amount (` (inR) per 1,000 sticks)
2013-2014 tax rate/amount (` (inR) per 1,000 sticks)
Cigars, cheroots and cigarillos Cigars and cheroots 12% or 1,370 whichever is higher 12% or 1,781 whichever is higher
Cigarillos 12% or 1,370 whichever is higher 12% or 1,781 whichever is higher
Cigarettes of tobacco substitutes 1,258 1,511
Cigarillos of tobacco substitutes 10% or 1,473 whichever is higher 12% or 1,738 whichever is higher
Other 10% or 1,473 whichever is higher 12% or 1,738 whichever is higher
Cigarettes (by length)Non-filter not exceeding 65mm 509 No change
Non-filter 65-70mm 1,463 1,772
Filter not exceeding 65mm 509 No change
Filter 65-70mm 1,034 1,249
Filter 70-75mm 1,463 1,772
Filter 75-85mm 1,974 2,390
Other 2,373 2,875
BidisHandmade 11 11
Machine-made/other 23 23
Sources: Government of India Ministry of Finance, 2013.63; Gupta et al., 2012.62
25tCp India Wave 1 project report (2010-2011)
Cigarettes, which account for only about 14% of tobacco consumption in India, contribute about 85% of the excise tax revenue collected from tobacco products, as they are taxed the highest of all tobacco products.64 Excise taxes on cigarettes are levied based on the type of cigarette (filtered vs. non-filtered) and cigarette length, with taxes on the premium brand of filtered cigarettes being almost three and a half times greater than the lowest brand of filtered cigarettes. While non-filtered cigarettes were taxed lower than filtered cigarettes prior to 2008, the 2008 Finance Bill raised the rate on non-filtered cigarettes to be on par with filtered cigarettes of the same length.64, 60 However, the length-based cigarette tax scheme means that micro non-filter cigarettes (≤60mm), which are low-priced cigarettes targeted to low-income markets, are under-taxed relative to the more popular regular filter cigarettes (≤70mm).64

26tCp India Wave 1 project report (2010-2011)
Bidis, which account for at least 77% of the smoked tobacco market in India, are taxed at a much lower rate than cigarettes, even though they are equally or more harmful than cigarettes. The rate of specific excise tax imposed on bidis depends on whether they are handmade or machine-made; handmade bidis, which account for the majority (98%) of the market, are taxed at the lowest rate. Per gram of tobacco, handmade bidis only have one-third of the excise burden of the lowest taxed cigarettes (micro non-filtered), which in turn have only one-fifth of the burden of regular filter cigarettes. In addition, bidis produced by manufacturers producing less than two million sticks a year without machines are exempt from the excise tax; in the year 2006-2007, it was estimated that 52% to 70% of all bidis were not taxed, either due to this exemption for small producers or to non-compliance.64 Because of a very large number of bidi binders, the tobacco industry in India exerts a huge political clout. Based on the premise that bidis are most commonly used by smokers of a lower socioeconomic status, and that bidi binders are very poor, the industry continues to tax bidis at very low rates.65, 64
Smokeless tobacco products, such as gutka and paan masala containing tobacco, are subject to a compounded levy scheme but are taxed uniformly across various products, at around 96% of the retail price. However, because the price of smokeless tobacco is so low, the tax is ineffective.61, 62
In March 2006, states were given the power to impose sales tax or VAT on tobacco products, and all states but one levied a 12.5% ad valorem VAT on cigarettes, but not bidis.60, 64 However, in the past few years, several state governments have raised VATs on both bidis and cigarettes.66 Table 4 lists the VATs on tobacco products (in 2012-2013 and 2013-2014) in the four states that were included in the TCP India Wave 1 Survey.
Table 4. State-level vaTs on tobacco products
In addition to the complex tax structure and low taxes on certain products, another problem with the Indian tobacco tax system is that it does not adjust for inflation, so all tobacco products have become increasingly affordable over the past decade.60 According to recent calculations by Jha et al. (2011), bidis were nearly three times more affordable in 2011 compared to 1990, and cigarettes were about 175% more affordable.66
Other problems with the complex tax structure are that it allows the cigarette industry to minimize the effect of tax increases by altering the structure and length of cigarettes, and also allows consumers to avoid price increases by switching to different products. Consequently, it is more difficult for the government to enforce a complex tax structure, there are opportunities for tax evasion (especially among bidi producers), and the revenue stream from tobacco tax is unpredictable compared to a more simple tax system.66
A report on the Economics of Tobacco and Tobacco Taxation in India (2010) found that raising the tax on cigarettes to `3691 per 1000 sticks would increase the tax to 78% of the retail price, avert 3.4 million premature deaths, and generate `146.3 billion in tax revenue. Raising the bidi tax to `98 per 1000 sticks would increase the tax to 40% of the retail price, avert 15.5 million premature deaths, and raise `36.9 billion in new tax revenues.60
StatevaT 2012-2013 vaT 2013-2014
Cigarettes bidis Smokeless Cigarettes bidis Smokeless
Bihar 20.0% 0.0% 20.0% 30.0% 13.5% 30.0%
Madhya Pradesh 13.0% 13.0% 13.0% 13.0% 13.0% 13.0%
Maharashtra 20.0% 5.0% 20.0% 25.0% 12.5% 25.0%
West Bengal 20.0% 0.0% 20.0% 25.0% 0.0% 25.0%

METHoDS
ovERviEWThe International Tobacco Control Policy Evaluation Project (the ITC Project) is an international research collaboration in more than 20 countries – Canada, United States, United Kingdom, Australia, Ireland, Thailand, Malaysia, Republic of Korea, China, Mexico, Uruguay, New Zealand, France, Germany, the Netherlands, Bhutan, Mauritius, Brazil, India, Bangladesh, Kenya, and Zambia. The primary objective of the ITC Project is to evaluate the effectiveness of current tobacco control policies to provide evidence for governments to assess the possible need for stronger policies; and then when new policies are implemented, to evaluate them over time and in comparison to other ITC countries where that policy has not changed during that same period of time. Conducting parallel surveys in countries being compared is known as a quasi-experimental design or “natural experiment” design. This research design provides rigorous evaluation of the psychosocial and behavioural effects of national level tobacco control policies of the Framework Convention on Tobacco Control (FCTC). The ITC Project is conducting large-scale annual prospective cohort surveys of tobacco use to evaluate FCTC policies in countries inhabited by over half of the world’s smokers. Each ITC Survey includes key measures for each FCTC policy domain that are identical or functionally similar across all ITC countries to facilitate cross-country comparisons.
PilotDec 2006-Apr 2007
N=764
Wave 1 Aug 2010-Dec 2011
N=10,585Tobacco Users = 8,051
Non-users=2,534Wave 2
Oct 2012-Oct 2013N=10,400
Tobacco Users = 8,000Non-users=2,400
October 2005Ban on the consumption, sale and storage of gutka and “other injurious products” (Goa)
February 2004FCTC ratification
May 2004Complete ban on advertisements of any tobacco product in the media
Prohibition of sale of tobacco products to minors
October 2008Smoking banned in public spaces
Restrictions in restaurants designated smoke-free areas allowed with no service
September2009Prohibition of sale of tobacco products near educational institutions
May 2009Implementation of pictorial warnings on all types of tobacco products
June 2010New pictorial warnings deferred to Dec 1, 2010 from an earlier commitment to introduce them on June 1, 2010
December 2010Specified text health warnings on tobacco packs shall be rotated every two years from the date of notification
March 2011Ban on plastic sachets
2012Bans on sale of gutka, paan masala, and other chewing tobacco products in 13 Indian states1
2004 2005 2006 2007 2008 2009 2010 2011 2012 2013
2013Bans on sale of, gutka, paan masala, and other chewing tobacco products in three Indian states2
1 In 2012, bans on the sale of gutka, paan masala, and other chewing tobacco products were enacted in Madhya Pradesh, Kerala, Bihar, Rajasthan, Maharashtra, Jharkhand, Chhattisgarh, Haryana, Punjab, Delhi, Gujarat, Mizoram, and Himachal Pradesh.
2 In 2013, bans on the sale of gutka, paan masala, and other chewing tobacco products were enacted in Chandigarh, Odisha, and Andhra Pradesh.
Figure 1. India’s tobacco control policy timeline in relation to the tCp India Surveys
27tCp India Wave 1 project report (2010-2011)

The evaluation studies conducted through the ITC surveys take advantage of natural experiments created when an ITC country implements a policy: changes in policy-relevant variables in that country from pre- to post-policy survey waves are compared to those in other ITC countries where that policy has not changed. This research design provides high levels of internal validity, allowing more confident judgments regarding the possible causal impact of the policy. For descriptions of the conceptual model and objectives of the ITC Project, see Fong et al. (2006)67; for description of the survey methods, see Thompson et al. (2006).68
The International Tobacco Control Policy Evaluation Project in India (the TCP India Project) was created in 2006 to evaluate rigorously the psychosocial and behavioural effects of tobacco control legislation in four states in India - Maharashtra, Bihar, Madhya Pradesh, and West Bengal - using methods that the ITC Project has employed in many other countries throughout the world. The project objective is to provide an evidence base to guide policies enacted under the FCTC and to evaluate systematically the effectiveness of these legislative efforts.
The TCP india Wave 1 SurveyIn 2006, the Healis-Sekhsaria Institute for Public Health, Navi Mumbai, India partnered with the University of Waterloo in Canada to create the TCP India Survey. The TCP India Survey has three main evaluation objectives:
1. To examine patterns of tobacco use among adults in the states of Maharashtra, Bihar, Madhya Pradesh, and West Bengal in india.
2. To examine the impact of tobacco control policies in the states of Maharashtra, Bihar, Madhya Pradesh, and West Bengal in india.
3. To compare tobacco use behaviour and the impact of policies between the states of Maharashtra, Bihar, Madhya Pradesh, and West Bengal in india and other iTC countries.
The TCP India Survey fieldwork was conducted by the Healis-Sekhsaria Institute for Public Health in Maharashtra; the School of Preventative Oncology in Bihar; the Madhya Pradesh Voluntary Health Association (MPVHA) in Madhya Pradesh; and the Cancer Foundation of India in West Bengal. The Healis-Sekhsaria Institute for Public Health provided leadership in the conduct of the TCP India Survey in all four states. The TCP India Wave 1 Survey was conducted between August 2010 and December 2011. Figure 1 illustrates the timeline of the TCP India Wave 1 Survey in relation to the implementation of tobacco control policies and related initiatives.
PilotDec 2006-Apr 2007
N=764
Wave 1 Aug 2010-Dec 2011
N=10,585Tobacco Users = 8,051
Non-users=2,534Wave 2
Oct 2012-Oct 2013N=10,400
Tobacco Users = 8,000Non-users=2,400
October 2005Ban on the consumption, sale and storage of gutka and “other injurious products” (Goa)
February 2004FCTC ratification
May 2004Complete ban on advertisements of any tobacco product in the media
Prohibition of sale of tobacco products to minors
October 2008Smoking banned in public spaces
Restrictions in restaurants designated smoke-free areas allowed with no service
September2009Prohibition of sale of tobacco products near educational institutions
May 2009Implementation of pictorial warnings on all types of tobacco products
June 2010New pictorial warnings deferred to Dec 1, 2010 from an earlier commitment to introduce them on June 1, 2010
December 2010Specified text health warnings on tobacco packs shall be rotated every two years from the date of notification
March 2011Ban on plastic sachets
2012Bans on sale of gutka, paan masala, and other chewing tobacco products in 13 Indian states1
2004 2005 2006 2007 2008 2009 2010 2011 2012 2013
2013Bans on sale of, gutka, paan masala, and other chewing tobacco products in three Indian states2
1 In 2012, bans on the sale of gutka, paan masala, and other chewing tobacco products were enacted in Madhya Pradesh, Kerala, Bihar, Rajasthan, Maharashtra, Jharkhand, Chhattisgarh, Haryana, Punjab, Delhi, Gujarat, Mizoram, and Himachal Pradesh.
2 In 2013, bans on the sale of gutka, paan masala, and other chewing tobacco products were enacted in Chandigarh, Odisha, and Andhra Pradesh.
28tCp India Wave 1 project report (2010-2011)

Sampling DesignThe TCP India Wave 1 Survey is a prospective cohort study of adult (aged 15 years and older) tobacco users and tobacco non-users. In each state, residents of the following urban cities and their surrounding rural districts were surveyed: Patna (Bihar), Kolkata (West Bengal), Indore (Madhya Pradesh), and Mumbai (Maharashtra) (see Figure 2).
Kolkata
Maharashtra
Bihar
Madhya Pradesh West Bengal
Mumbai
Patna
Indore
Figure 2. tCp India Wave 1 Survey sampling areas
Within the urban cities in each of the four states, 10 wards were selected with probability proportional to size, each ward having the same intended enumeration sample size. The intended sample size in each ward was 150 households. Within each ward number, 10 enumeration blocks (EBs) were selected at random with the intention of using the first four of these in the sample, augmenting the list if necessary, and the dwellings in each EB were approached in random order.
Within the rural stratum of a state, namely the rural districts surrounding the urban stratum (within 50 km from the center of each major city included in the sample), a single district was chosen purposively, and four villages were selected from the district with probability proportional to size, from among those villages with at least 1000 households in the census list. Each village chosen was mapped and a random or systematic sample of enough dwellings was chosen to achieve enumerations at 125 households in the village. The dwellings in the sample within the village were approached in random order.
For Wave 1, a total of 9699 households were enumerated in the four states: 2189 (1660 urban; 529 rural) in Maharashtra; 2288 (1170 urban; 518 rural) in Bihar; 2864 (2310 urban; 554 rural) in Madhya Pradesh; and, 2358 (1844 urban; 514 rural) in West Bengal. Out of the 9699 households enumerated, a sample of 8051 tobacco users and 2534 tobacco non-users aged 15 years and older were surveyed via face-to-face interviews.
Further information on the sampling design, construction of sampling weights, selection criteria for survey respondents in each household, and cooperation and response rates is provided in the TCP India Wave 1 Technical Report, which is available at the following website: http://www.itcproject.org/countries/india
29tCp India Wave 1 project report (2010-2011)

Characteristics of the Wave 1 SampleA tobacco user was defined as someone who currently smokes tobacco products (including cigarettes, bidis, hookah, cigars, etc.) and/or currently uses any smokeless tobacco products (paan masala, gutka, mishri, etc.) at least once a month. Any individual who did not meet these criteria was classified as a tobacco non-user. Table 1 provides sample sizes of tobacco users and tobacco non-users by state. Table 5 provides the demographic characteristics of the survey respondents in each state.
Table 5. Total number of respondents interviewed by state
30tCp India Wave 1 project report (2010-2011)
Tobacco use StatusState tobacco Users tobacco Non-users total
Maharashtra
Mumbai 1392 513 1905
Rural districtsa 659 175 834
Bihar
Patna 1478 443 1921
Rural districts 530 157 687
Madhya Pradesh
Indore 1504 468 1972
Rural districts 488 153 641
West Bengal
Kolkata 1492 466 1958
Rural districts 508 159 667
tOtAL 8051 2534 10585
a:Surrounding rural districts of each urban city
The sampling design was selected to provide a random, unbiased sample of adult tobacco users and non-users within each of the four cities (Mumbai, Patna, Indore, and Kolkata) and their surrounding rural districts.

Maharashtra Bihar Madhya Pradesh West Bengaltobacco
Users N=2051
tobacco Non-users
N=688
tobacco Users
N=2008
tobacco Non-users
N=600
tobacco Users
N=1992
tobacco Non-users
N=621
tobacco Users
N=2000
tobacco Non-users
N=625
Freq % Freq % Freq % Freq % Freq % Freq % Freq % Freq %
Sex
Male 1234 60.2 246 35.8 1221 60.8 248 41.3 1548 77.7 223 35.9 1446 72.3 162 25.9
Female 817 39.8 442 64.2 787 39.2 352 58.7 444 22.3 398 64.1 554 27.7 463 74.1
Age
15-17 13 0.6 51 7.4 112 5.6 61 10.2 36 1.8 49 7.9 15 0.8 40 6.418-24 179 8.7 170 24.7 327 16.3 123 20.5 223 11.2 129 20.8 185 9.2 117 18.725-39 694 33.8 262 38.1 692 34.5 216 36.0 603 30.3 218 35.1 688 34.4 251 40.240-54 632 30.8 132 19.2 509 25.3 121 20.2 626 31.4 137 22.1 654 32.7 133 21.355+ 533 26.0 73 10.6 368 18.3 79 13.2 504 25.3 88 14.1 458 22.9 84 13.4marital status
Married 1538 75.0 428 62.2 1443 71.9 406 67.7 1468 73.7 418 67.3 1547 77.4 419 67.0
Divorced or separated
17 0.8 2 0.3 3 0.2 0 0.0 11 0.6 4 0.6 22 1.1 11 1.8
Widowed 276 13.5 35 5.1 119 5.9 19 3.2 205 10.3 35 5.6 159 7.9 42 6.7
Single 220 10.7 223 32.4 443 22.1 175 29.2 303 15.2 164 26.4 269 13.5 153 24.5
Income level
Low 220 10.7 76 11.1 578 28.8 133 22.2 559 28.1 141 22.7 882 44.1 241 38.6
Moderate 1444 70.4 459 66.7 1050 52.3 302 50.3 1196 60.0 336 54.1 834 41.7 279 44.6
High 323 15.8 119 17.3 342 17.0 154 25.7 150 7.5 105 16.9 254 12.7 96 15.4
education level
Low 1155 56.3 190 27.6 1057 52.6 234 39.0 1275 64.0 237 38.2 1352 67.6 304 48.6
Moderate 816 39.8 390 56.7 571 28.4 189 31.5 562 28.1 217 34.9 417 20.9 190 30.4
High 79 3.9 108 15.7 380 18.9 177 29.5 154 7.7 167 26.9 218 10.9 128 20.5
table 6. Demographic characteristics of the sample by state
Content of the TCP India Wave 1 Survey The TCP India Survey was developed by the project team from the Healis-Sekhsaria Institute for Public Health, Navi Mumbai, India; the University of Waterloo, Waterloo, Ontario, Canada; and Roswell Park Cancer Institute, Buffalo, New York, United States. Most of the survey methods and survey questions were adapted from the standardized protocols and surveys used in ITC Surveys conducted in 19 other countries at the time of the TCP India Wave 1 Survey.
The TCP india Survey consists of a set of parallel surveys tailored for each of the following population groups:Smokers: adult respondents who smoked any tobacco products including cigarettes, bidis, hookah, cigars, etc. at least once a month but did not use any smokeless tobacco products at least once a month. These respondents were given the Smoked Tobacco User Survey (T).
31tCp India Wave 1 project report (2010-2011)

Smokeless tobacco users: adult respondents who used any smokeless tobacco products including paan masala, gutka, mishri, zarda, etc. at least once a month but did not smoke any tobacco products at least once a month. These respondents were given the Smokeless Tobacco User Survey (L).
mixed tobacco users: adult respondents who currently smoked tobacco products (including cigarettes, bidis, hookah, cigars, etc.) and currently used any smokeless tobacco products (including paan masala, gutka, mishri, etc.) at least once a month. These respondents were given the Mixed Tobacco User Survey (M).
tobacco non-users: adult respondents who were past tobacco users (e.g., ex-smoker or ex-smokeless tobacco user), or used tobacco less than once a month, or had never used any tobacco at all. Respondents who reported having quit in the last month before the survey were also categorized as non-users. These respondents were given the Non-user Survey (N).
All respondents who were categorized as tobacco users were asked to respond to the following types of questions:1. Smoking and/or Smokeless tobacco use- and cessation-relevant questions: Tobacco
use history and frequency, as well as current tobacco use behaviour and dependence, and quitting behaviours;
2. Knowledge and basic beliefs about tobacco use: Knowledge of the health effects of using tobacco and important beliefs relevant to tobacco use and quitting, perceived risk, and perceived severity of tobacco-related diseases;
3. policy-relevant questions: Awareness of, impact of, and beliefs relevant for each of the FCTC demand-reduction policy domains (e.g., warning labels, taxation/price, advertising/promotion/sponsorship, smoke-free policies, light/mild descriptors, cessation);
4. psychosocial predictors of tobacco use and potential moderator variables: Attitudes, normative beliefs, self-efficacy for quitting, and intentions to quit;
5. Individual difference variables relevant to tobacco use: Depression, stress, time perspective, and individualism; and
6. Demographics: Age, gender, marital status, income, and education.
Smokeless tobacco users responded to most of the above questions, but the smoked tobacco questions were replaced with parallel questions relevant to smokeless tobacco use. Tobacco non-users responded to a survey that was identical in many respects, but was shorter because none of the tobacco use questions (e.g., frequency of use, purchasing questions) were included.
The protocol and questionnaires of the TCP India Wave 1 Survey were first developed in English and then translated into three local languages (Hindi, Marathi, and Bengali) by a translation agency. The translations were then reviewed and verified by the state collaborators who were bilingual and who had a strong background in the terminology of tobacco products as used in the local language.
All of the TCP India Survey questionnaires are available at http://www.itcproject.org/surveys
32tCp India Wave 1 project report (2010-2011)

Analytic Approach
The TCP India Wave 1 Survey data was sampled based on a stratified multistage cluster sampling design. In order to adjust for potential disproportionate selection of adult tobacco users and tobacco non-users in subgroups, enumeration and survey weights were calculated for each enumerated household and survey respondent. All the proportion and mean estimates in this report are derived based on the survey samples weighted by the survey cross-sectional weight, unless stated otherwise. The survey cross-sectional weight is interpreted as the number of people in the population that a respondent represents.
To accommodate a potential design effect resulting from the complex survey design, the weight is used in conjunction with the strata (urban or rural part of each city) and primary sampling units (wards in urban and villages in rural) information in computing estimates of proportions and means. The standard errors for the proportions or means and reported 95% confidence intervals were accordingly adjusted for the design effect. Between- or within- state comparisons of proportions or means were tested for statistical significance at the 95% level. Survey logistic regression models were used for comparisons of proportions of binary outcomes. Survey linear regression models were applied for comparisons of means of continuous outcomes. Adjustments were also made for multiple comparisons. It should be noted that the prevalence estimates in this report are only applicable to our sampling frame — within the urban cities and their surrounding rural districts in each of the following four states: Bihar (Patna), West Bengal (Kolkata), Madhya Pradesh (Indore), and Maharashtra (Mumbai).
Similarly, since country samples vary in their composition, survey logistic regression models were used to generate standardized or adjusted values of the descriptive statistics (proportions) in cross-country comparisons. Country, age group, smoking status, and time-in-sample were included in the model as covariates. Time-in-sample is the number of times a respondent has participated in the survey and controls for the variation in responses among respondents who are newly recruited compared to those who have completed one prior wave, who vary from those who have completed two prior waves and so on. These documented “time-in-sample” effects have been found in the ITC Surveys and in many other surveys as well.69, 70, 71, 72, 73
33tCp India Wave 1 project report (2010-2011)

34tCp India Wave 1 project report (2010-2011)
Tobacco use by GenderCurrent tobacco use among adults aged 15 years and older ranged from 23% to 47% as follows: 47% in Bihar, 33% in West Bengal, 28% in Maharashtra, and 23% in Madhya Pradesh (see Figure 3).
In all four states, the prevalence of tobacco use was higher among males compared to females. Bihar had the highest prevalence of tobacco use among both males and females. More than one-third of adult males (59% in Bihar, 50% in West Bengal, 36% in Madhya Pradesh, and 34% in Maharashtra) used some form of tobacco. Virtually all male tobacco users in each of the four states were daily users: 99% in Madhya Pradesh, 98% in Maharashtra, 97% in Bihar, and 96% in West Bengal.
Nearly one-third (32%) of adult females in Bihar used some form of tobacco. The prevalence of tobacco use among females was lower in the remaining three states: 21% in Maharashtra, 16% in West Bengal, and 9% in Madhya Pradesh. Nearly all female tobacco users in each of the four states were daily users: 99% in Maharashtra, 98% in Madhya Pradesh, 96% in West Bengal, and 93% in Bihar.
FinDinGS
ToBaCCo uSE in inDia
The TCP India Wave 1 Survey (2010-2011) measured the use of smoked tobacco, smokeless tobacco, and mixed tobacco (which refers to the use of both smoked and smokeless tobacco products) among adults aged 15 years and older in four states: Bihar, West Bengal, Madhya Pradesh, and Maharashtra. The survey sample in each state included residents of the following urban cities and their surrounding rural districts: Patna (Bihar), Kolkata (West Bengal), Indore (Madhya Pradesh), and Mumbai (Maharashtra). Unless otherwise noted, the prevalence estimates that are presented in this section refer to the prevalence of tobacco use in each of these urban cities and their surrounding rural districts. The survey also measured beliefs and attitudes towards tobacco use, including perceived societal norms about smoked and smokeless tobacco use in India.
Figure 3. Prevalence of tobacco use by males and females, by state*
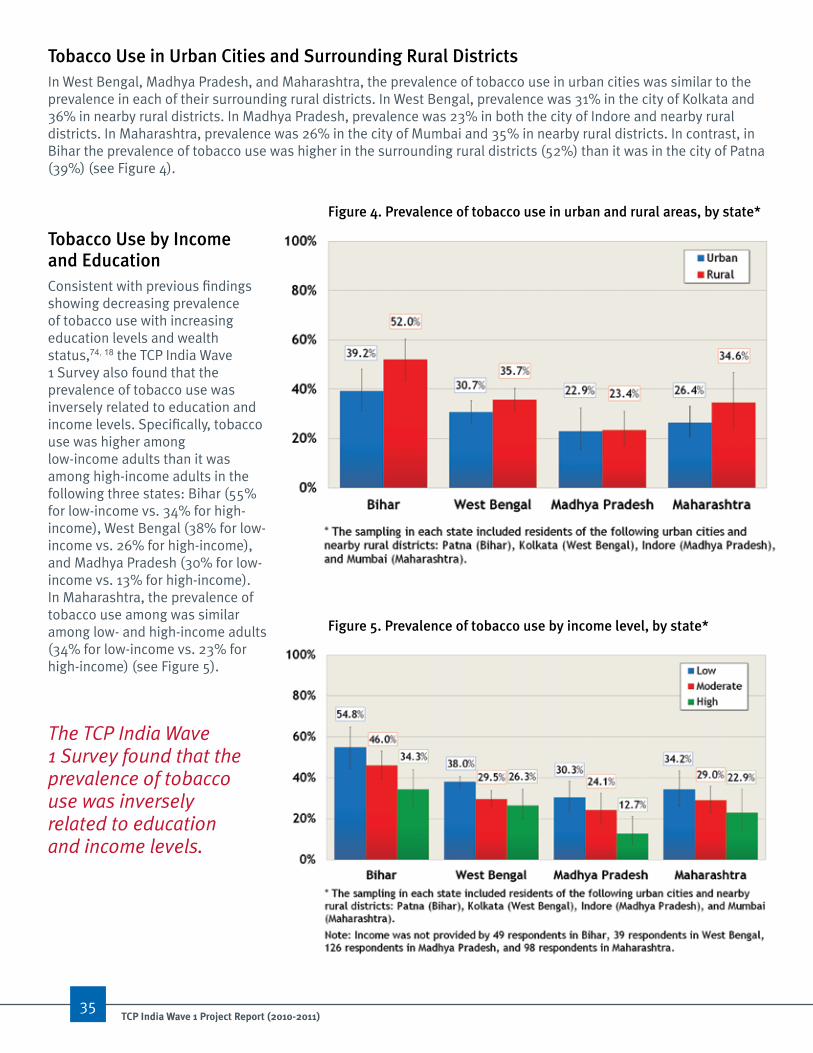
Tobacco use in urban Cities and Surrounding Rural Districts In West Bengal, Madhya Pradesh, and Maharashtra, the prevalence of tobacco use in urban cities was similar to the prevalence in each of their surrounding rural districts. In West Bengal, prevalence was 31% in the city of Kolkata and 36% in nearby rural districts. In Madhya Pradesh, prevalence was 23% in both the city of Indore and nearby rural districts. In Maharashtra, prevalence was 26% in the city of Mumbai and 35% in nearby rural districts. In contrast, in Bihar the prevalence of tobacco use was higher in the surrounding rural districts (52%) than it was in the city of Patna (39%) (see Figure 4).
Tobacco use by income and EducationConsistent with previous findings showing decreasing prevalence of tobacco use with increasing education levels and wealth status,74, 18 the TCP India Wave 1 Survey also found that the prevalence of tobacco use was inversely related to education and income levels. Specifically, tobacco use was higher among low-income adults than it was among high-income adults in the following three states: Bihar (55% for low-income vs. 34% for high-income), West Bengal (38% for low-income vs. 26% for high-income), and Madhya Pradesh (30% for low-income vs. 13% for high-income). In Maharashtra, the prevalence of tobacco use among was similar among low- and high-income adults (34% for low-income vs. 23% for high-income) (see Figure 5).
The TCP India Wave1 Survey found that theprevalence of tobacco use was inversely related to education and income levels.
Figure 4. Prevalence of tobacco use in urban and rural areas, by state*
Figure 5. Prevalence of tobacco use by income level, by state*
35tCp India Wave 1 project report (2010-2011)

Figure 6. Prevalence of tobacco use by education level, by state*
36tCp India Wave 1 project report (2010-2011)
The prevalence of tobacco use also decreased as education level increased. In Maharashtra, tobacco use was about six times higher among adults with low education (47%) than adults with high education (8%) (see Figure 6). In the remaining three states, prevalence of tobacco use was about two to four times higher among adults with low education than adults with high education as follows: Bihar (54% for low education vs. 30% for high education), West Bengal (41% for low education vs. 19% for high education), and Madhya Pradesh (34% for low education vs. 9% for high education).
Forms of Tobacco use
Smokeless Tobacco
Smokeless tobacco was the most common type of product used by tobacco users in all four states, with more than half of tobacco users reporting that they used smokeless tobacco only: 84% in Maharashtra, 83% in Bihar, 71% in Madhya Pradesh, and 52% in West Bengal (see Figure 7).
In all four states, virtually all smokeless users (smokeless only and mixed tobacco) reported daily use of some form of smokeless product as follows: 99% in Maharashtra, 99% in Madhya Pradesh, 98% in West Bengal, and 97% in Bihar. Among daily smokeless users, the average number of times that smokeless tobacco products are used was highest in Madhya Pradesh (8.7 times per day) and lowest in Maharashtra (5.5 times a day).
Figure 7. Percentage of tobacco users by type, by state*

37tCp India Wave 1 project report (2010-2011)
Time to first use of tobacco products is a commonly used measure of tobacco dependence, with shorter spans of time between waking and use of tobacco indicating higher nicotine dependence.75-78 In all four states, about one-third to half of daily smokeless users (smokeless only) used their first smokeless product of the day within 6 to 30 minutes of waking: 50% in Madhya Pradesh, 34% in Bihar, 31% in Maharashtra, and 28% in West Bengal.
In all four states, smokeless tobacco was most often consumed in the form of chewing tobacco. In Bihar, where the use of smokeless tobacco only was highest, just over one-half (56%) of smokeless users (smokeless only and mixed tobacco) used smokeless tobacco by chewing in the form of khaini. Different types of chewing tobacco were also commonly used by smokeless users in West Bengal (37% used khaini, and 29% used gutka), Madhya Pradesh (57% used gutka, and 49% used plain chewing tobacco), and Maharashtra (38% used plain chewing tobacco, and 22% used gutka).
In Bihar and Maharashtra, the use of powdered forms of tobacco that are applied to the teeth and gums was
also common. More than 2 out of 5 (44%) smokeless users (smokeless only and mixed tobacco) used lal dantmanjan in Bihar (compared to less than 13% in West Bengal, Madhya Pradesh, and Maharashtra), and 32% of smokeless users used mishri in Maharashtra (compared to less than 0.3% in Bihar, West Bengal, and Madhya Pradesh).
Smoked Tobacco
The percentage of tobacco users who reported using smoked tobacco only ranged from 6% to 33% across the four states as follows: 33% in West Bengal, 19% in Madhya Pradesh, 10% in Maharashtra, and 6% in Bihar (see Figure 7).
About one-third to half of daily smokers (cigarettes and bidis) had their first smoke within 6 to 30 minutes after waking in Bihar (46%), Madhya Pradesh (46%), and West Bengal (31%). In Maharashtra, 29% of daily smokers had their first smoke within 6 to 30 minutes after waking, and 42% had their first smoke more than an hour after waking.
Smokers (smoked only and mixed tobacco) were also asked to report whether they currently used any form of various smoked tobacco products. In West Bengal, cigarettes were the most commonly smoked product (75%), followed by bidis (68%), and hookah (0.8%). A similar pattern was seen in Bihar and Maharashtra, where cigarettes were also the primary form of smoked tobacco (77% in Bihar and 67% in Maharashtra), followed by bidi (25% in Bihar and 46% in Maharashtra), and hookah (7% in Bihar and 3% in Maharashtra). In Madhya Pradesh, bidi smoking (72%) was more common than cigarette smoking (44%), and only a minority (2%) smoked hookah.
Mixed Tobacco
In all four states, only a small proportion of tobacco users reported using mixed tobacco products (use of both smoked and smokeless products) (see Figure 7). Less than one-quarter of tobacco users in each state were mixed tobacco users: 16% in West Bengal, 12% in Bihar, 10% in Madhya Pradesh, and 7% in Maharashtra.
In 2005, the state of Goa was the first to enact a total ban on the consumption, sale, and storage of gutka. As of January 2013, 17 additional states and four Union Territories have passed and enacted legislation that completely bans the manufacture, sale, and use of gutka.

38tCp India Wave 1 project report (2010-2011)
Figure 8. Distribution of tobacco use type in urban cities and surrounding rural districts, by state*
Forms of Tobacco use in urban Cities and Surrounding Rural Districts
Smokeless Tobacco Only
In Bihar, the percentage of tobacco users who used smokeless tobacco only was similar in the city of Patna (84%) and surrounding rural districts (82%) (see Figure 8). Use of smokeless tobacco only in Maharashtra was higher in the surrounding rural districts (89%) than in the city of Mumbai (83%). In contrast, use of smokeless tobacco only was higher in cities of the remaining two states than it was in their surrounding rural districts: West Bengal (56% in Kolkata vs. 46% in nearby rural districts), and Madhya Pradesh (76% in Indore vs. 61% in nearby rural districts).
Smoked Tobacco Only
In West Bengal and Madhya Pradesh, the percentage of tobacco users who used smoked tobacco only was higher in the surrounding rural districts than in the cities (37% in nearby rural districts vs. 29% in Kolkata and 31% in nearby rural districts vs. 14% in Indore). In Bihar and Maharashtra, less than 11% of tobacco users reported the use of smoked tobacco only in the cities of Patna and Mumbai and their surrounding rural districts.
Mixed Tobacco
In Maharashtra, the percentage of tobacco users who reported using mixed tobacco products was higher in the city of Mumbai (8%) than in nearby rural districts (3%). There were no differences in the use of mixed tobacco products in the cities of the remaining three states and their surrounding rural districts: Bihar (10% in Patna and 13% in nearby rural districts), West Bengal (15% in Kolkata and 17% in nearby rural districts), and Madhya Pradesh (11% in Indore and 8% in nearby rural districts).

39tCp India Wave 1 project report (2010-2011)
Forms of Tobacco use by age
Smokeless Tobacco
The prevalence of any smokeless tobacco use (smokeless only and mixed tobacco) was highest in Bihar, where at least 2 out of 5 adults (31% to 52%) across all age groups were smokeless users. Among adults between the ages of 15 to 17 years, Bihar also had the highest prevalence at 31% while in the other three states, the prevalence of smokeless use in this age group was low (3% to 5%) (see Figure 9). In contrast to the low overall prevalence of smokeless use among younger adults, a considerable proportion of adults aged 18 years and older in all four states used smokeless tobacco. In all four states, there was a trend towards increasing prevalence with increasing age. The prevalence of smokeless use was highest among adults aged 55 years and older in all four states, and ranged from 27% to 52% as follows: 52% in Bihar, 39% in Maharashtra, 31% in West Bengal, and 27% in Madhya Pradesh.
Figure 9. Prevalence of smokeless tobacco users (including smokeless only and mixed tobacco users) in each age group, by state*
Smoked Tobacco In all four states, the prevalence of smoking (smoked only and mixed tobacco) was lowest (less than 2%) among younger adults between ages 15 to 17 years (see Figure 10). Prevalence of smoking increased slightly among adults between ages 18 to 24, but remained low overall at less than 10% in all four states.
The trends in prevalence of smoking among adults aged 25 years and older varied by state. In Bihar, prevalence of smoking was less than 10% among adults between ages 25 to 39 (9%), and 40 to 54 (8%), and increased to 14% for adults aged 55 and older. The prevalence of smoking among adults aged 25 and older was highest in West Bengal, and ranged from 18% to 20% as follows: ages 25 to 39 (18%), ages 40 to 54 (20%), and age 55 and older (18%). In Madhya Pradesh, prevalence of smoking was 5% among adults between ages 25 to 39, and increased to 12% among adults between ages 40 to 54, and then decreased slightly to 10% among adults aged 55 and older. In Maharashtra, prevalence of smoking among adults was very low in general, but increased slightly with age as follows: between ages 25 and 39 (4%), between ages 40 and 54 (6%), and age 55 and older (7%).

40tCp India Wave 1 project report (2010-2011)
Figure 10. Prevalence of smokers (including smoked only and mixed tobacco users) in each age group, by state*
Personal opinions about Tobacco useITC Surveys measure tobacco users’ experience of regret for ever starting tobacco use as an important indicator of societal norms about tobacco use and as a predictor of future quitting behaviour.79, 80
The majority of smokers (smoked only and mixed tobacco) in all four states expressed regret for having started smoking. The proportion of smokers who “agreed” or “strongly agreed” that if they had to do it over again, they would not have started smoking ranged from 63% to 81% as follows: 81% in Maharashtra, 79% in Madhya Pradesh, 70% in West Bengal, and 63% in Bihar (see Figure 11).
Figure 11. Percentage of smokers (including smoked only and mixed tobacco users) who “agree” or “strongly agree” that if they had to do it over again, they would not have started smoking, by state*

41tCp India Wave 1 project report (2010-2011)
Figure 12. Percentage of smokeless tobacco users (including smokeless only and mixed tobacco users) who “agree” or “strongly agree” that if they had to do it over again, they would not have started using smokeless tobacco, by state*
Similarly, the majority of smokeless users (smokeless only and mixed tobacco) in all four states “agreed” or “strongly agreed” that they would not have started using smokeless tobacco if they had to do it over again: 87% in Maharashtra, 75% in Madhya Pradesh, 70% in West Bengal, and 64% in Bihar (see Figure 12).
Overall, tobacco users had very negative opinions about tobacco, but there were slight variations in their opinions on the use of different forms of tobacco whereby respondents who used either smoked or smokeless tobacco products only viewed the alternative product slightly more negatively (see Figure 13).
Virtually all smoked tobacco only users (96%) believed that using smokeless tobacco was “bad” or “very bad”, while the percentages who believed that smoking cigarettes or bidis was “bad” or “very bad” were slightly lower at 92% and 93%, respectively. Similarly, 99% of smokeless tobacco only users believed that smoking cigarettes was “bad” or “very bad”, 98% believed that smoking bidis was “bad” or “very bad”, while 92% believed that using smokeless tobacco was “bad” or “very bad”. Mixed tobacco users and non-users had negative opinions on all forms of tobacco use. Mixed tobacco users were almost unanimous in their agreement that smoking cigarettes (95%), smoking bidis (95%), or using smokeless tobacco (94%) was “bad” or “very bad”.
Non-users also had very negative opinions about tobacco. Virtually all non-users believed that smoking cigarettes (98%), smoking bidis (99%), or using smokeless tobacco (99%) was “bad” or “very bad”.
Figure 13. Percentage of tobacco users and non-users who have a “bad” or “very bad” opinion of smoking cigarettes, bidis, and smokeless tobacco, by tobacco user type*

42tCp India Wave 1 project report (2010-2011)
Perceived norms about Tobacco use by GenderOverall, a considerable proportion of tobacco users perceived that society disapproves of smoked tobacco use. In all four states, about half to three-quarters of adults who used smoked tobacco only (75% in Maharashtra, 71% in Bihar, 59% in Madhya Pradesh, and 53% in West Bengal), or used smokeless tobacco only (74% in Maharashtra, 71% in Bihar, 67% in Madhya Pradesh, and 57% in West Bengal) “agreed” or “strongly agreed” that Indian society disapproves of smoked tobacco use (see Figure 14). More than half of mixed tobacco users in all four states also “agreed” or “strongly agreed” that Indian society disapproves of smoked tobacco use: 64% in Madhya Pradesh, 63% in Bihar, 63% in Maharashtra, and 55% in West Bengal. The majority of non-users in all four states also “agreed” or “strongly agreed” that Indian society disapproves of smoked tobacco use: 79% in Maharashtra, 74% in Madhya Pradesh, 64% in Bihar, and 53% in West Bengal.
Figure 14. Percentage of tobacco users and non-users who “agree” or “strongly agree” that indian society disapproves of smoked tobacco use, by tobacco use type, by state*
The majority of tobacco users also perceived that society disapproves of smokeless tobacco use, but to a lesser extent than the use of smoked tobacco products. In all four states, about half to two-thirds of adults who used smoked tobacco only (71% in Maharashtra, 57% in Madhya Pradesh, 54% in Bihar, and 48% in West Bengal), smokeless tobacco only (68% in Maharashtra, 58% in Madhya Pradesh, 51% in Bihar, and 50% in West Bengal), or mixed tobacco (57% in Bihar, 54% in Maharashtra, 54% in Madhya Pradesh, and 49% in West Bengal) “agreed” or “strongly agreed” that Indian society disapproves of smokeless tobacco use (see Figure 15). In comparison to tobacco users, a higher percentage of non-users in all four states “agreed” or “strongly agreed” that Indian society disapproves of smokeless tobacco use: 75% in Madhya Pradesh, 73% in Maharashtra, 64% in Bihar, and 56% in West Bengal.

Figure 15. Percentage of tobacco users and non-users who “agree” or “strongly agree” that indian society disapproves of smokeless tobacco use, by tobacco use type, by state*
In all four states, there were no gender differences in perceptions of societal disapproval for the use of smoked or smokeless tobacco among tobacco users (smoked only, smokeless only, and mixed tobacco). Similar percentages of male and female tobacco users “agreed” or “strongly agreed” that society disapproves of smoked tobacco use in Bihar (67% of females and 67% of males), West Bengal (55% of females and 53% of males), Madhya Pradesh (74% of females and 70% of males), and Maharashtra (76% of females and 79% of males). Similar percentages of male and female tobacco users in all four states also “agreed” or “strongly agreed” that Indian society disapproves of smokeless tobacco use: Bihar (58% of females and 58% of males), West Bengal (56% of females and 52% of males), Madhya Pradesh (74% of females and 69% of males), and Maharashtra (71% of females and 72% of males).
Tobacco use in Bihar, West Bengal, Madhya Pradesh, and Maharashtra: Summary of Findings from the TCP india Wave 1 Survey (2010-2011) and GaTS india (2009-2010) This section provides a comparative summary of TCP India Wave 1 Survey (2010-2011) and GATS India (2009-2010) prevalence estimates on tobacco use among adults (aged 15 years and older) in four states: Bihar, West Bengal, Maharashtra, and Madhya Pradesh.
It is important to note that the TCP India Wave 1 Survey and GATS India used different sampling strategies. GATS India was conducted in all 29 states and two Union Territories of the country, covering about 99.9% of the total population of India.18 The TCP India Wave 1 Survey was conducted in the following capital cities and surrounding rural districts in four out of 29 states in India: Patna (Bihar), Kolkata (West Bengal), Indore (Madhya Pradesh), and Mumbai (Maharashtra). As such, GATS India prevalence data is nationally representative while TCP India Wave 1 Survey prevalence data is only representative of the major metropolitan and surrounding rural districts in four specific states. In addition, the wording of questions in each of these surveys was not always exactly the same. Given the variations in sampling methods and survey question wording, caution should be applied in interpreting comparisons of the prevalence data presented below.
43tCp India Wave 1 project report (2010-2011)

Tobacco Use by Gender
Findings from the TCP India Wave 1 Survey and GATS India both showed that the prevalence of tobacco use was highest in Bihar, where about half of adults reported using some form of tobacco.
• TCP India Wave 1 Survey prevalence estimates for tobacco use were similar to GATS India estimates in West Bengal (33% in TCP vs. 36% in GATS), and Maharashtra (28% in TCP vs. 31% in GATS).
• TCP India Wave 1 Survey prevalence estimates for tobacco use were lower than GATS India estimates in Bihar (47% in TCP vs. 54% in GATS), and Madhya Pradesh (23% in TCP vs. 40% in GATS).
TCP India Wave 1 Survey and GATS India findings showed that in all four states, the prevalence of tobacco use was much higher among males than females. Results of both surveys also indicated that the prevalence of tobacco use among both males and females were highest in Bihar.
• TCP India Wave 1 Survey prevalence estimates for tobacco use among females were similar to GATS India estimates in West Bengal (16% in TCP vs. 19% in GATS), and Maharashtra (21% in TCP vs. 19% in GATS); the TCP prevalence estimates were lower than GATS India estimates in Madhya Pradesh (9% in TCP vs. 19% in GATS), and Bihar (32% in TCP vs. 40% in GATS).
• The TCP India Wave 1 Survey prevalence estimates for tobacco use among males were similar to the GATS India estimate in West Bengal (50% in TCP vs. 52% in GATS); the TCP prevalence estimates were lower than GATS India estimates in Maharashtra (34% in TCP vs. 43% in GATS), Bihar (59% in TCP vs. 66% in GATS), and Madhya Pradesh (36% in TCP vs. 59% in GATS).
Tobacco Use in Rural and Urban Areas
TCP India Wave 1 Survey and GATS India findings both showed that tobacco use was higher among adults in rural areas than urban areas.
• TCP India Wave 1 Survey prevalence estimates for tobacco use were similar to GATS India estimates among rural (38% in TCP vs. 38% in GATS) and urban (28% in TCP vs. 25% in GATS) populations.
Forms of Tobacco Use
Findings from the TCP India Wave 1 Survey and GATS India both showed that smokeless tobacco was the most common type of product used by tobacco users in all four states.
• TCP India Wave 1 Survey estimates for smokeless only use were higher than GATS India estimates in all four states: Bihar (83% in TCP vs. 39% in GATS), West Bengal (52% in TCP vs. 15% in GATS), Madhya Pradesh (71% in TCP vs. 23% in GATS), and Maharashtra (84% in TCP vs. 25% in GATS).
TCP India Wave 1 Survey and GATS India findings both showed that the proportion of tobacco users who reported using smoked tobacco only was lower than the proportion who reported using smokeless tobacco only in all four states, and that the prevalence of smoked only use was highest in West Bengal.
• TCP India Wave 1 Survey estimates for smoked only use were similar to GATS India estimates in Bihar (6% in TCP vs. 5% in GATS).
• TCP India Wave 1 Survey estimates were higher than GATS India estimates in West Bengal (33% in TCP vs. 14% in GATS), Madhya Pradesh (19% in TCP vs. 8% in GATS), and Maharashtra (10% in TCP and 4% in GATS).
TCP India Wave 1 Survey and GATS India findings both showed that in three of the four states, the proportion of tobacco users who reported using mixed tobacco products was lower than the proportion who reported using smokeless tobacco only or smoked tobacco only. In Bihar, the prevalence of mixed tobacco product use was higher than the prevalence of smoked only use.
• TCP India Wave 1 Survey estimates were similar to GATS India estimates for mixed tobacco use in Bihar (12% in TCP vs. 10% in GATS), and Madhya Pradesh (10% in TCP vs. 9% in GATS).
• TCP India Wave 1 Survey estimates were higher than GATS India estimates in West Bengal (16% in TCP vs. 7% in GATS), and Maharashtra (7% in TCP vs. 3% in GATS).
44tCp India Wave 1 project report (2010-2011)

KEy FinDinGS
The following points summarize the main findings on tobacco use behaviours and perceived norms about tobacco use among adults aged 15 years and older in selected urban cities and their surrounding rural districts in each of the following four states: Bihar (Patna), West Bengal (Kolkata), Madhya Pradesh (Indore), and Maharashtra (Mumbai).
• Prevalence of adult tobacco use in any form was highest in Bihar (47%) and lowest in Madhya Pradesh (23%).
• Prevalence of tobacco use was much higher among males than among females in all four states. More than 2 out of 5 adult males in all four states used some form of tobacco. Among females, less than one-third in all states were tobacco users with an exception in Bihar, where nearly one-third (32%) of women reported using some form of tobacco.
• Prevalence of tobacco use was similar in the urban cities and surrounding rural districts of West Bengal (31% in Kolkata and 36% in nearby rural districts), Madhya Pradesh (23% in Indore; 23% in nearby rural districts), and Maharashtra (26% in Mumbai and 35% in nearby rural districts). However, in Bihar the prevalence in the surrounding rural districts (52%) was higher in comparison to the prevalence in the city of Patna (39%).
• In general, prevalence of tobacco use was higher among low-income and less educated adults than among high-income and more highly educated adults.
• Smokeless tobacco was the most common form of tobacco product used in all four states. Use of smokeless tobacco only was highest in Maharashtra (84%) and lowest in West Bengal (52%).
• The most commonly used forms of smokeless tobacco in Bihar were khaini (56%) and lal dantmanjan (44%). Khaini was the most commonly used form of smokeless tobacco in West Bengal (37%), gutka was most commonly used in Madhya Pradesh (57%), and plain chewing tobacco was most commonly used in Maharashtra (38%).
• Cigarettes were the most common smoked product in West Bengal (75%), Bihar (77%), and Maharashtra (67%), whereas bidis were the most common smoked product in Madhya Pradesh (72%).
45tCp India Wave 1 project report (2010-2011)

• Use of smokeless tobacco only in Bihar was similar in the city of Patna and surrounding rural districts; in Maharashtra, use was higher in surrounding rural districts than in the city of Mumbai; and in West Bengal and Madhya Pradesh, use was higher in the cities of Kolkata and Indore than in the rural districts surrounding these cities.
• In all four states, prevalence of smokeless use increased with age. In Bihar, prevalence of smokeless use was extremely high – 31% of young adults between ages 15 to 17 years used smokeless tobacco, and prevalence increased across all age groups.
• Use of smoked tobacco only was highest in West Bengal (33%) and lowest in Bihar (6%).
• Use of smoked tobacco only in West Bengal and Madhya Pradesh was higher in the surrounding rural districts than it was in the cities of Kolkata and Indore.
• In all four states, prevalence of any smoked tobacco use was low (less than 11%) among adults under the age of 40, with an exception in West Bengal, where prevalence was 18% among adults between ages 25 to 39.
• Less than 8% of adult users in each state used mixed tobacco products.
• In all four states, the majority of smokers (63% to 81%) and smokeless tobacco users (64% to 87%) expressed regret for starting to use tobacco.
• Tobacco users and non-users in all four states had negative views on the use of smoked and/or smokeless tobacco products.
• More than half of tobacco users and non-users across all four states perceived that Indian society disapproves of the use of smoked and smokeless tobacco.
• In all four states, more than half of male and female tobacco users perceived that Indian society disapproves of the use of smoked or smokeless tobacco.
Current tobacco use among adults aged 15 years and older ranged from 23% to 47% as follows: 47% in Bihar, 33% in West Bengal, 28% in Maharashtra, and 23% in Madhya Pradesh. Smokeless tobacco was the most common form of tobacco product used in all four states – at least 2 out of 5 adults used smokeless tobacco. Khaini was the smokeless product used most often in Bihar, West Bengal, and Maharashtra,while plain chewing tobacco was used more than khaini in Madhya Pradesh.
46tCp India Wave 1 project report (2010-2011)

47tCp India Wave 1 project report (2010-2011)
QuiTTinG BEHaviouR
The TCP India Wave 1 Survey (2010-2011) provided an assessment of smokeless tobacco users’ (smokeless only and mixed tobacco) and smokers’ (smoked only and mixed tobacco) cessation behaviours, including their intentions to quit and the reasons that led them to contemplate quitting. The Survey also measured awareness and use of cessation services among tobacco users (smoked only, smokeless only, and mixed tobacco) in India. The findings below represent results among adults aged 15 years and older surveyed in selected urban cities and surrounding rural districts of the following four states: Bihar (Patna), West Bengal (Kolkata), Madhya Pradesh (Indore), and Maharashtra (Mumbai).
Figure 16. Intentions to quit using tobacco among smokers (including smoked only and mixed tobacco users) and smokeless tobacco users (including smokeless only and mixed tobacco users), by state*†
* the sampling in each state included residents of the following urban cities and nearby rural districts: patna (bihar), Kolkata (West bengal), Indore (madhya pradesh), and mumbai (maharashtra).
† mixed tobacco users reported their intention to quit smokeless and smoked tobacco separately. the top bar for each state represents intentions to quit smokeless tobacco among both smokeless only and mixed tobacco users. Similarly, the bottom bar represents intentions to quit smoked tobacco among both smoked tobacco only and mixed tobacco users.

48
Quit intentions The vast majority of smokeless users had no plans to quit using smokeless tobacco products. In Madhya Pradesh, virtually all smokeless users (94%) reported that they had no plans to quit (see Figure 16). More than 70% of smokeless users said that they were not planning to quit in West Bengal (84%), Maharashtra (78%), and Bihar (73%).
Similarly, the vast majority of smokers in all four states had no plans to quit smoking. In Madhya Pradesh, nearly all smokers (94%) reported that they had no plans to quit smoking. At least three-quarters of smokers reported that they had no plans to quit in West Bengal (82%), Maharashtra (78%), and Bihar (75%).
Reasons to Quit the use of Smokeless Tobacco In all four states, smokeless users who had intentions to quit using smokeless products at some point in time agreed that the following were important reasons that led them to think about quitting (see Figure 17):
1. Concern for personal health (94% in Maharashtra, 91% in Bihar, 87% in West Bengal, and 86% in Madhya Pradesh); and
2. Wanting to set an example for children (97% in Bihar, 57% in Maharashtra, 56% in Madhya Pradesh, and 32% in West Bengal).
With a few exceptions in Bihar and Maharashtra, less than half of smokeless users agreed that the following were reasons that led them to think about quitting:
1. Close friends’ and family disapproval of their smokeless tobacco use (58% in Bihar, 55% in Maharashtra, 31% in West Bengal, and 30% in Madhya Pradesh);
2. Advertisements or information about the health risks of smokeless tobacco use (60% in Bihar, 34% in Maharashtra, 23% in West Bengal, and 23% in Madhya Pradesh);
3. Warning labels on smokeless tobacco packages (59% in Bihar, 28% in Maharashtra, 18% in West Bengal, and 16% in Madhya Pradesh);
4. Indian society’s disapproval of smokeless tobacco use (36% in Bihar, 32% in Maharashtra, 21% in Madhya Pradesh, and 19% in West Bengal);
5. Price of smokeless tobacco products (27% in West Bengal, 22% in Bihar, 20% in Maharashtra, and 9% in Madhya Pradesh);
6. Rising cost of food, education and other essentials (22% in Bihar, 13% in Maharashtra, 12% in West Bengal, and 4% in Madhya Pradesh);
7. Restrictions on using smokeless tobacco at work (21% in Madhya Pradesh, 15% in Bihar, 10% in Maharashtra, and 7% in West Bengal).
tCp India Wave 1 project report (2010-2011)

49tCp India Wave 1 project report (2010-2011)
Figure 17. Percentage of smokeless tobacco users (including smokeless only and mixed tobacco users) that agreed that various reasons led them to think about quitting the use of smokeless tobacco, by state*†
Reasons to Quit the use of Smoked TobaccoIn all four states, smokers who had intentions to quit smoking at some point in time agreed that the following were important reasons that led them to think about quitting (see Figure 18):
1. Concern for personal health (99% in Bihar, 98% in Maharashtra, 94% in West Bengal, and 72% in Madhya Pradesh);
2. Wanting to set an example for children (97% in Bihar, 68% in Maharashtra, 45% in Madhya Pradesh, and 43% in West Bengal).
In Bihar, more than 3 out of 5 smokers agreed that the following were important reasons that led them to think about quitting. In contrast, less than half of smokers in the remaining three states agreed that the following were reasons that led them to think about quitting (with the exception of close friends’ and family disapproval of smoking (65% in Maharashtra), and concern about effects of tobacco smoke on non-smokers (55% in Maharashtra)):
1. Close friends’ and family disapproval of their smoking (87% in Bihar, 65% in Maharashtra, 43% in West Bengal, and 20% in Madhya Pradesh);
2. Warning labels on smoked tobacco packages (85% in Bihar, 31% in Maharashtra, 26% in West Bengal, and 9% in Madhya Pradesh);
3. Indian society’s disapproval of smoking (77% in Bihar, 35% in Maharashtra, 21% in Madhya Pradesh, and 14% in West Bengal).

Figure 18. Percentage of smokers (including smoked only and mixed tobacco users) that agreed that various reasons led them to think about quitting the use of smoked tobacco, by state*†
4. Concern about the effects of tobacco smoke on non-smokers (65% in Bihar, 55% in Maharashtra, 30% in Madhya Pradesh, and 27% in West Bengal);
5. Advertisements or information about the health risks of smoking (63% in Bihar, 45% in Maharashtra, 36% in West Bengal, and 15% in Madhya Pradesh).
In all four states, less than half of smokers agreed that the following were important reasons that led them to think about quitting:
1. Price of smoked tobacco products (46% in Bihar, 37% in Maharashtra, 30% in West Bengal, and 3% in Madhya Pradesh);
2. Smoking restrictions at work (37% in Bihar, 18% in Maharashtra, 10% in Madhya Pradesh, and 7% in West Bengal);
3. Rising cost of food, education and other essentials (45% in Bihar, 21% in Maharashtra, 20% in West Bengal, and 10% in Madhya Pradesh);
4. Smoking restrictions in public places (48% in Bihar, 26% in Maharashtra, and 15% in West Bengal and Madhya Pradesh).
50tCp India Wave 1 project report (2010-2011)
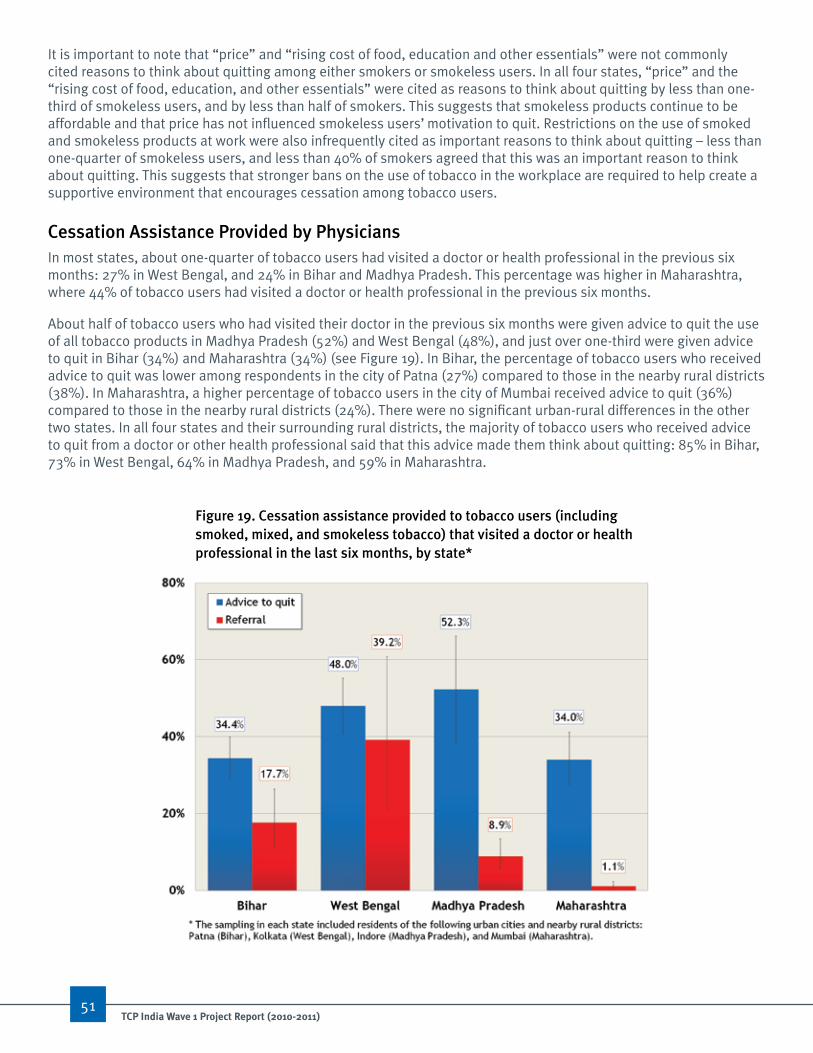
51tCp India Wave 1 project report (2010-2011)
It is important to note that “price” and “rising cost of food, education and other essentials” were not commonly cited reasons to think about quitting among either smokers or smokeless users. In all four states, “price” and the “rising cost of food, education, and other essentials” were cited as reasons to think about quitting by less than one-third of smokeless users, and by less than half of smokers. This suggests that smokeless products continue to be affordable and that price has not influenced smokeless users’ motivation to quit. Restrictions on the use of smoked and smokeless products at work were also infrequently cited as important reasons to think about quitting – less than one-quarter of smokeless users, and less than 40% of smokers agreed that this was an important reason to think about quitting. This suggests that stronger bans on the use of tobacco in the workplace are required to help create a supportive environment that encourages cessation among tobacco users.
Cessation assistance Provided by Physicians In most states, about one-quarter of tobacco users had visited a doctor or health professional in the previous six months: 27% in West Bengal, and 24% in Bihar and Madhya Pradesh. This percentage was higher in Maharashtra, where 44% of tobacco users had visited a doctor or health professional in the previous six months.
About half of tobacco users who had visited their doctor in the previous six months were given advice to quit the use of all tobacco products in Madhya Pradesh (52%) and West Bengal (48%), and just over one-third were given advice to quit in Bihar (34%) and Maharashtra (34%) (see Figure 19). In Bihar, the percentage of tobacco users who received advice to quit was lower among respondents in the city of Patna (27%) compared to those in the nearby rural districts (38%). In Maharashtra, a higher percentage of tobacco users in the city of Mumbai received advice to quit (36%) compared to those in the nearby rural districts (24%). There were no significant urban-rural differences in the other two states. In all four states and their surrounding rural districts, the majority of tobacco users who received advice to quit from a doctor or other health professional said that this advice made them think about quitting: 85% in Bihar, 73% in West Bengal, 64% in Madhya Pradesh, and 59% in Maharashtra.
Figure 19. Cessation assistance provided to tobacco users (including smoked, mixed, and smokeless tobacco) that visited a doctor or health professional in the last six months, by state*

52
KEy FinDinGS• Tobacco users in all four states had a low degree of readiness to quit smoking – 75% to
94% of smokers, and 73% to 94% of smokeless users had no plans to quit using their respective products.
• In all four states, concern for personal health and wanting to set an example for children were cited most frequently by both smokers and smokeless users as important reasons that led them to think about quitting. The price of smoked or smokeless tobacco products, and restrictions on smoking or using smokeless tobacco at work were among the least cited reasons among smokers and smokeless users to think about quitting.
• Approximately half of tobacco users who had visited their doctor or health professional in the previous six months received advice to quit in Madhya Pradesh (52%) and West Bengal (48%).
• About a third (34%) of tobacco users who visited a doctor or health professional in the previous six months in Bihar and Maharashtra received advice to quit. In Bihar, rates of physician advice to quit were lower in Patna than in the surrounding rural districts, while in Maharashtra rates were higher in Mumbai than in the surrounding rural districts. There were no urban-rural differences in West Bengal and Madhya Pradesh.
• Among tobacco users who visited a doctor or other health professional in the previous six months, rates of physician referral to other services ranged from 1% in Maharashtra to 39% in West Bengal.
Among tobacco users who had visited a doctor or health professional in the previous six months, more than one-third (39%) were given additional help or a referral to another cessation support service in West Bengal (in the city of Kolkata and surrounding rural districts). In the remaining three states and their surrounding rural districts, only a minority of tobacco users were given additional help or a referral to another cessation support service: 18% in Bihar, 9% in Madhya Pradesh, and 1% in Maharashtra. More than half of these tobacco users (76% in Madhya Pradesh, 58% in Maharashtra, 56% in West Bengal, and 56% in Bihar) said that the additional help or referral to another cessation service from a doctor or other health professional made them think about quitting.
tCp India Wave 1 project report (2010-2011)

53tCp India Wave 1 project report (2010-2011)
SMoKE-FREE PuBliC PlaCES anD WoRKPlaCES
As of October 2, 2008, amendments to COTPA 2003 prohibited smoking in all indoor public places and workplaces (including bars and restaurants), with the exception of designated smoking areas in airports, hotels with 30 or more rooms, and restaurants with a seating capacity for 30 or more.
The TCP India Wave 1 Survey (2010-2011) was conducted approximately three years after the implementation of the revised smoke-free law in India. This section presents TCP India Wave 1 Survey findings on public awareness of and support for the smoke-free law, as well as the impact of this law on perceived norms about smoking, and smoking behaviour in indoor public places and workplaces. The results evaluate India’s smoke-free law among (1) smokers – the intended population for policies to restrict public exposure to second-hand smoke, including respondents who use smoked tobacco products only, and those who use both smoked and smokeless products; (2) smokeless tobacco only users; and (3) tobacco non-users. The findings below represent results among adults aged 15 years and older surveyed in selected urban cities and surrounding rural districts of the following four states: Bihar (Patna), West Bengal (Kolkata), Madhya Pradesh (Indore), and Maharashtra (Mumbai).
awareness of Smoke-free Policies The TCP India Wave 1 Survey asked smokers, smokeless only users, and non-users whether they were aware that the government started to enforce the smoke-free law in 2008.
More than half of smokers in West Bengal (59%), and Bihar (54%) said that they were aware that the government had started to enforce the smoke-free law in 2008 (see Figure 20). In Maharashtra, over one-third of smokers (35%) indicated that were aware of the implementation of the 2008 smoke-free law. Awareness was lowest in Madhya Pradesh, where 18% of smokers reported that they were aware of enforcement of the 2008 smoke-free law (see Figure 20).
In most states, non-users had similar levels of awareness of enforcement of the smoke-free law in comparison to smokers: Bihar (58% of non-users vs. 54% of smokers), West Bengal (53% of non-users vs. 59% of smokers), and Maharashtra (41% of non-users vs. 35% of smokers). In Madhya Pradesh, awareness of enforcement of the smoke-free law was higher among non-users (32%) than it was among smokers (18%) (see Figure 20).
Awareness of enforcement of the smoke-free law was also higher among non-users than it was among smokeless only users in most states: West Bengal (53% of non-users vs. 39% of smokeless only users), Maharashtra (41% of non-users vs. 31% of smokeless only users), and Madhya Pradesh (32% of non-users vs. 19% of smokeless only users). In Bihar, awareness of enforcement of the smoke-free law was not significantly different for non-users (58%) and smokeless only users (46%) (see Figure 20).

54
Figure 20. Percentage of smokers (including smoked only and mixed tobacco users), smokeless tobacco only users, and tobacco non-users who were aware that the government started to enforce the smoke-free law in 2008, by state*
impact of Smoke-free Policies on Perceived norms about Smoking Findings from the TCP India Wave 1 Survey suggest that the implementation of smoke-free laws in indoor public places and workplaces has influenced Indian smokers’ perceptions of the social acceptability of smoking behaviour. Specifically, more than 2 out of 5 smokers in all four states “strongly agreed” or “agreed” that there were fewer and fewer places where they felt comfortable smoking, as follows: Maharashtra (60%), West Bengal (52%), Bihar (46%), and Madhya Pradesh (44%). These results are consistent with existing research which has shown that the implementation of smoke-free policies tends to increase the social unacceptability of smoking.81-83
Smoking in indoor Workplaces
Smoking Bans in Workplaces
The TCP India Wave 1 Survey asked smokers, smokeless only users, and non-users who worked indoors to describe the indoor smoking policy at their workplaces.
Among smokers who worked outside the home, at least 2 out of 5 reported that they worked at indoor workplaces: 51% in Madhya Pradesh and Maharashtra, 41% in West Bengal, and 40% in Bihar. Among smokeless only users who worked outside the home, more than 4 out of 9 reported that they worked at indoor workplaces: 63% in Madhya Pradesh, 62% in Bihar, 56% in Maharashtra, and 49% in West Bengal. Among non-users who worked outside the home, more than 4 out of 7 reported that they worked at indoor workplaces: 72% in Bihar, 70% in Maharashtra, 66% in Madhya Pradesh, and 58% in West Bengal.
In all four states, the vast majority of all respondents who worked indoors reported that smoking is not allowed in any indoor areas of their workplaces, but there were some variations by state and tobacco use status. In all four states, the vast majority of smokers who worked indoors reported that smoking is not allowed in any indoor areas at their workplaces: Maharashtra (95%), Madhya Pradesh (92%), West Bengal (84%), and Bihar (75%) (see Figure 21).
tCp India Wave 1 project report (2010-2011)
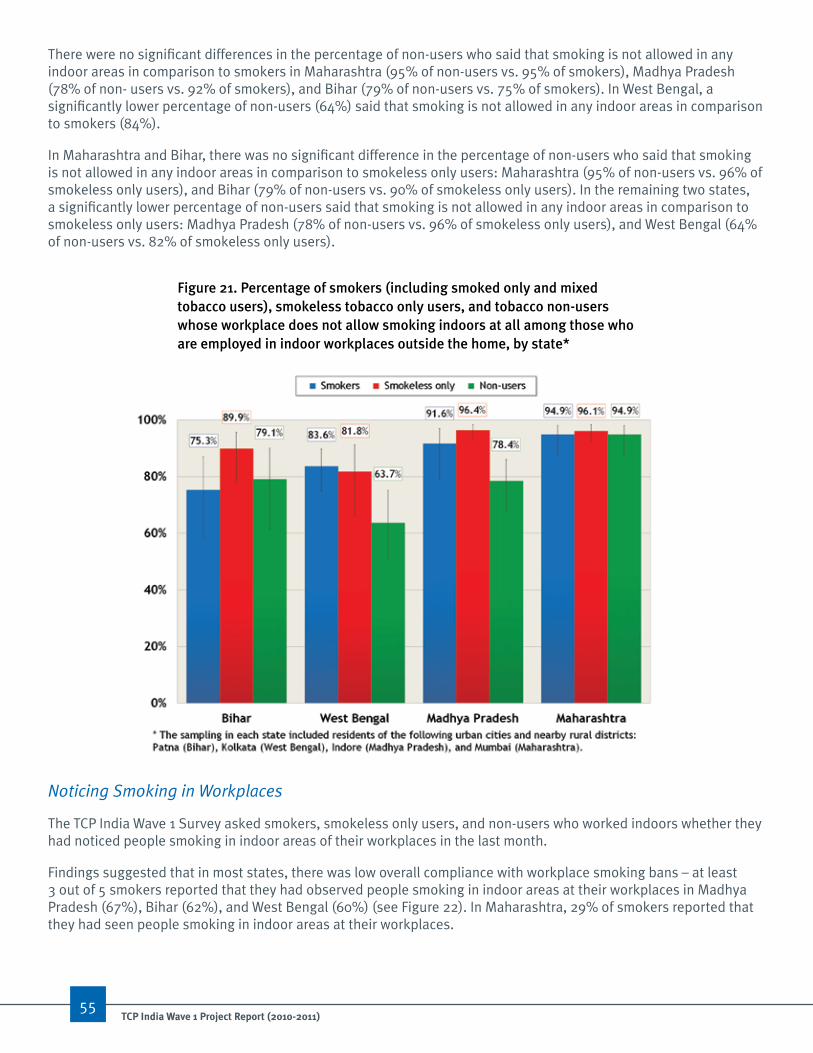
55tCp India Wave 1 project report (2010-2011)
There were no significant differences in the percentage of non-users who said that smoking is not allowed in any indoor areas in comparison to smokers in Maharashtra (95% of non-users vs. 95% of smokers), Madhya Pradesh (78% of non- users vs. 92% of smokers), and Bihar (79% of non-users vs. 75% of smokers). In West Bengal, a significantly lower percentage of non-users (64%) said that smoking is not allowed in any indoor areas in comparison to smokers (84%).
In Maharashtra and Bihar, there was no significant difference in the percentage of non-users who said that smoking is not allowed in any indoor areas in comparison to smokeless only users: Maharashtra (95% of non-users vs. 96% of smokeless only users), and Bihar (79% of non-users vs. 90% of smokeless only users). In the remaining two states, a significantly lower percentage of non-users said that smoking is not allowed in any indoor areas in comparison to smokeless only users: Madhya Pradesh (78% of non-users vs. 96% of smokeless only users), and West Bengal (64% of non-users vs. 82% of smokeless only users).
Figure 21. Percentage of smokers (including smoked only and mixed tobacco users), smokeless tobacco only users, and tobacco non-users whose workplace does not allow smoking indoors at all among those who are employed in indoor workplaces outside the home, by state*
Noticing Smoking in Workplaces
The TCP India Wave 1 Survey asked smokers, smokeless only users, and non-users who worked indoors whether they had noticed people smoking in indoor areas of their workplaces in the last month.
Findings suggested that in most states, there was low overall compliance with workplace smoking bans – at least 3 out of 5 smokers reported that they had observed people smoking in indoor areas at their workplaces in Madhya Pradesh (67%), Bihar (62%), and West Bengal (60%) (see Figure 22). In Maharashtra, 29% of smokers reported that they had seen people smoking in indoor areas at their workplaces.
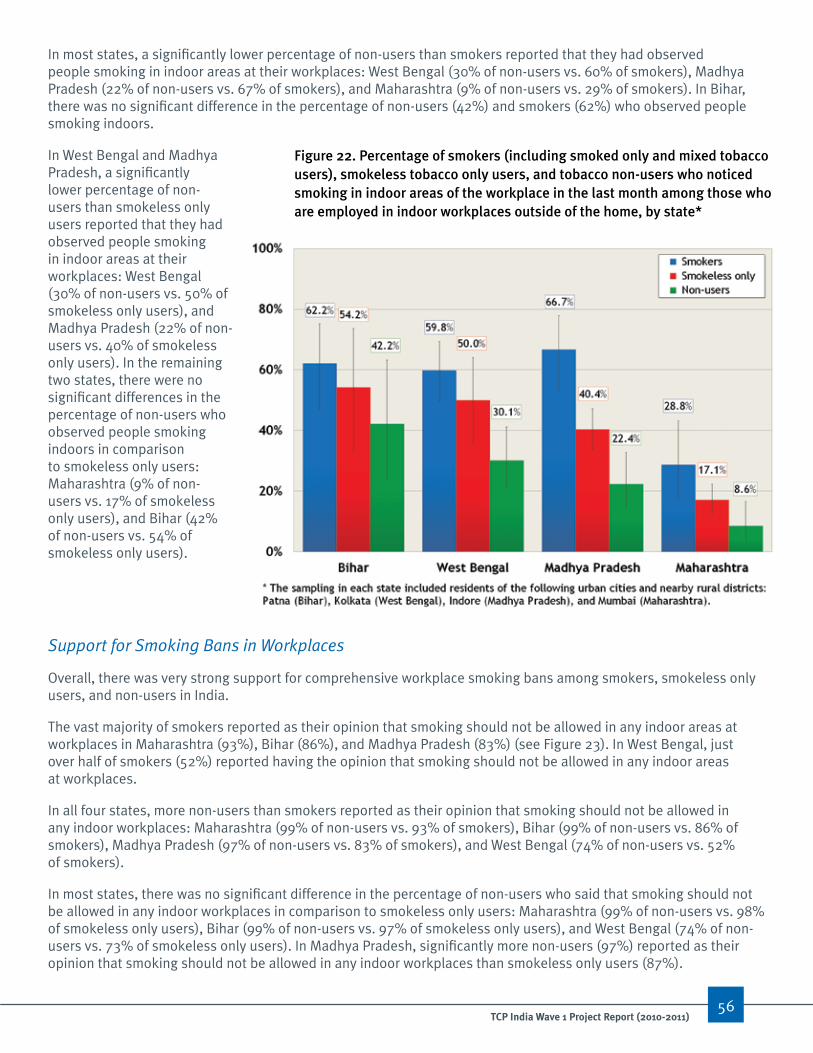
56
Figure 22. Percentage of smokers (including smoked only and mixed tobacco users), smokeless tobacco only users, and tobacco non-users who noticed smoking in indoor areas of the workplace in the last month among those who are employed in indoor workplaces outside of the home, by state*
In most states, a significantly lower percentage of non-users than smokers reported that they had observed people smoking in indoor areas at their workplaces: West Bengal (30% of non-users vs. 60% of smokers), Madhya Pradesh (22% of non-users vs. 67% of smokers), and Maharashtra (9% of non-users vs. 29% of smokers). In Bihar, there was no significant difference in the percentage of non-users (42%) and smokers (62%) who observed people smoking indoors.
In West Bengal and Madhya Pradesh, a significantly lower percentage of non-users than smokeless only users reported that they had observed people smoking in indoor areas at their workplaces: West Bengal (30% of non-users vs. 50% of smokeless only users), and Madhya Pradesh (22% of non-users vs. 40% of smokeless only users). In the remaining two states, there were no significant differences in the percentage of non-users who observed people smoking indoors in comparison to smokeless only users: Maharashtra (9% of non-users vs. 17% of smokeless only users), and Bihar (42% of non-users vs. 54% of smokeless only users).
Support for Smoking Bans in Workplaces
Overall, there was very strong support for comprehensive workplace smoking bans among smokers, smokeless only users, and non-users in India.
The vast majority of smokers reported as their opinion that smoking should not be allowed in any indoor areas at workplaces in Maharashtra (93%), Bihar (86%), and Madhya Pradesh (83%) (see Figure 23). In West Bengal, just over half of smokers (52%) reported having the opinion that smoking should not be allowed in any indoor areas at workplaces.
In all four states, more non-users than smokers reported as their opinion that smoking should not be allowed in any indoor workplaces: Maharashtra (99% of non-users vs. 93% of smokers), Bihar (99% of non-users vs. 86% of smokers), Madhya Pradesh (97% of non-users vs. 83% of smokers), and West Bengal (74% of non-users vs. 52% of smokers).
In most states, there was no significant difference in the percentage of non-users who said that smoking should not be allowed in any indoor workplaces in comparison to smokeless only users: Maharashtra (99% of non-users vs. 98% of smokeless only users), Bihar (99% of non-users vs. 97% of smokeless only users), and West Bengal (74% of non-users vs. 73% of smokeless only users). In Madhya Pradesh, significantly more non-users (97%) reported as their opinion that smoking should not be allowed in any indoor workplaces than smokeless only users (87%).
tCp India Wave 1 project report (2010-2011)

57tCp India Wave 1 project report (2010-2011)
Figure 23. Percentage of smokers (including smoked only and mixed tobacco users), smokeless tobacco only users, and tobacco non-users who think that smoking should not be allowed in any indoor areas of the workplace, by state*
Smoking in Restaurants
Smoking Bans in Restaurants
The TCP India Wave 1 Survey asked smokers, smokeless only users, and non-users to describe the scope of smoking bans in restaurants.
More than 2 out 5 of smokers in each state (69% in Maharashtra, 57% in West Bengal, 56% in Bihar, and 46% in Madhya Pradesh) reported that smoking is not allowed in any indoor areas of restaurants (see Figure 24).
In Bihar, there was no significant difference in the percentage of non-users (77%) who reported that smoking is not allowed in any indoor areas of restaurants in comparison to smokers (56%). In the remaining three states, a significantly higher percentage of non-users reported that smoking is not allowed in any indoor areas of restaurants in comparison to smokers: West Bengal (71% of non-users vs. 57% of smokers), Maharashtra (86% of non-users vs. 69% of smokers), and Madhya Pradesh (74% of non-users vs. 46% of smokers) (see Figure 24).
In most states, there was no significant difference in the percentage of non-users who reported that smoking is not allowed in any indoor areas of restaurants in comparison to smokeless only users: Bihar (77% of non-users vs. 82% of smokeless only users), West Bengal (71% of non-users vs. 66% of smokeless only users), and Maharashtra (86% of non-users vs. 82% of smokeless only users). In Madhya Pradesh, significantly more non-users (74%) reported that smoking is not allowed in any indoor areas of restaurants than smokeless only users (46%) (see Figure 24).
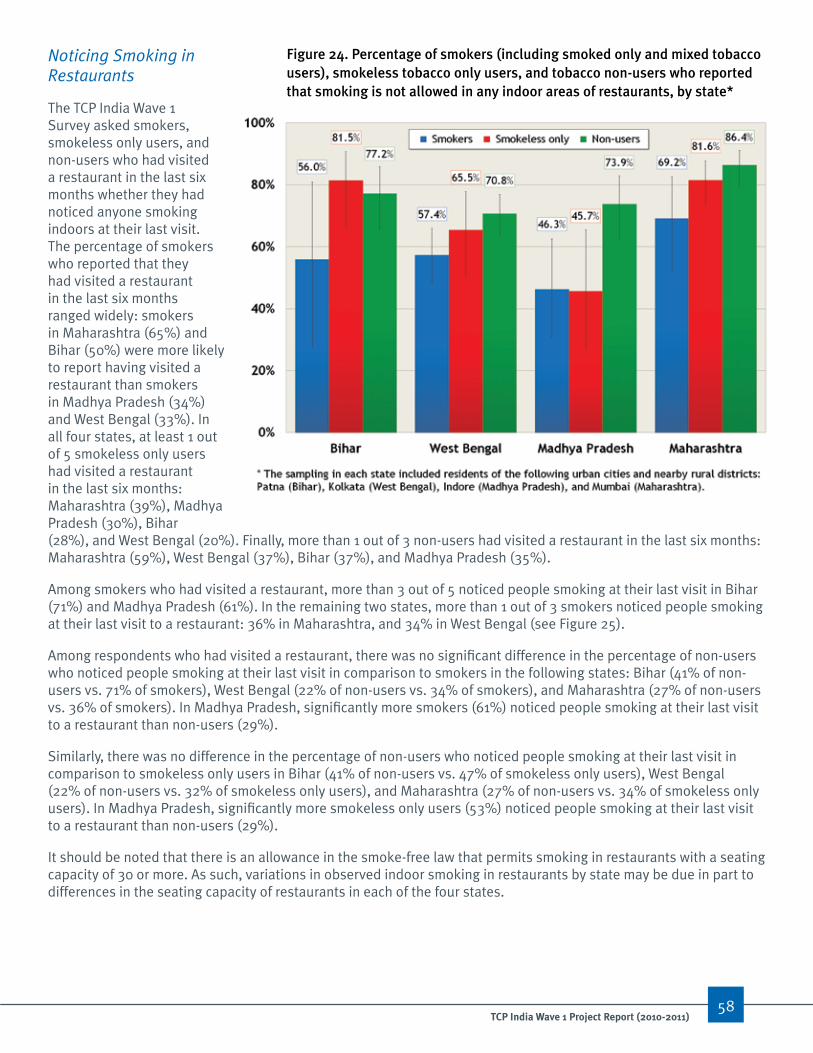
58
Figure 24. Percentage of smokers (including smoked only and mixed tobacco users), smokeless tobacco only users, and tobacco non-users who reported that smoking is not allowed in any indoor areas of restaurants, by state*
Noticing Smoking in Restaurants
The TCP India Wave 1 Survey asked smokers, smokeless only users, and non-users who had visited a restaurant in the last six months whether they had noticed anyone smoking indoors at their last visit. The percentage of smokers who reported that they had visited a restaurant in the last six months ranged widely: smokers in Maharashtra (65%) and Bihar (50%) were more likely to report having visited a restaurant than smokers in Madhya Pradesh (34%) and West Bengal (33%). In all four states, at least 1 out of 5 smokeless only users had visited a restaurant in the last six months: Maharashtra (39%), Madhya Pradesh (30%), Bihar (28%), and West Bengal (20%). Finally, more than 1 out of 3 non-users had visited a restaurant in the last six months: Maharashtra (59%), West Bengal (37%), Bihar (37%), and Madhya Pradesh (35%).
Among smokers who had visited a restaurant, more than 3 out of 5 noticed people smoking at their last visit in Bihar (71%) and Madhya Pradesh (61%). In the remaining two states, more than 1 out of 3 smokers noticed people smoking at their last visit to a restaurant: 36% in Maharashtra, and 34% in West Bengal (see Figure 25).
Among respondents who had visited a restaurant, there was no significant difference in the percentage of non-users who noticed people smoking at their last visit in comparison to smokers in the following states: Bihar (41% of non-users vs. 71% of smokers), West Bengal (22% of non-users vs. 34% of smokers), and Maharashtra (27% of non-users vs. 36% of smokers). In Madhya Pradesh, significantly more smokers (61%) noticed people smoking at their last visit to a restaurant than non-users (29%).
Similarly, there was no difference in the percentage of non-users who noticed people smoking at their last visit in comparison to smokeless only users in Bihar (41% of non-users vs. 47% of smokeless only users), West Bengal (22% of non-users vs. 32% of smokeless only users), and Maharashtra (27% of non-users vs. 34% of smokeless only users). In Madhya Pradesh, significantly more smokeless only users (53%) noticed people smoking at their last visit to a restaurant than non-users (29%).
It should be noted that there is an allowance in the smoke-free law that permits smoking in restaurants with a seating capacity of 30 or more. As such, variations in observed indoor smoking in restaurants by state may be due in part to differences in the seating capacity of restaurants in each of the four states.
tCp India Wave 1 project report (2010-2011)

59tCp India Wave 1 project report (2010-2011)
Figure 25. Percentage of smokers (including smoked only and mixed tobacco users), smokeless tobacco only users, and tobacco non-users who noticed smoking in indoor areas of restaurants at their last visit among those who have visited a restaurant in the last six months, by state*
Figure 26. Percentage of smokers (including smoked only and mixed tobacco users) that smoked indoors at a restaurant during their last visit among those who visited a restaurant in the last six months, by state*
Self-reported Smoking in Restaurants
The TCP India Wave 1 Survey also asked smokers who had visited a restaurant in the last six months whether they had smoked indoors at their last visit. It should be noted that there is an allowance in the smoke-free law that permits smoking in restaurants with a seating capacity of 30 or more.
The percentage of smokers who reported that they had smoked in a restaurant during their last visit was higher in Bihar (58%) and Madhya Pradesh (45%) than it was in West Bengal (24%) and Maharashtra (14%) (see Figure 26).

60
Support for Smoking Bans in Restaurants
Overall, the majority of smokers, smokeless only users, and non-users reported that smoking should not be allowed in any indoor areas of restaurants.
Smokers’ support for complete smoking bans in restaurants was highest in Maharashtra, where nearly all smokers (93%) said that smoking should not be allowed in any indoor areas of restaurants (see Figure 27). Support for complete smoking bans in restaurants was lowest among smokers in West Bengal, where half (50%) of smokers reported that smoking should not be allowed in any indoor areas of restaurants (see Figure 27). In the remaining two states, about three-quarters of smokers said that smoking should not be allowed in any indoor areas of restaurants: 75% in Madhya Pradesh, and 74% in Bihar.
There was no significant difference in support for complete smoking bans in restaurants among non-users and smokers in Maharashtra (98% of non-users vs. 93% of smokers), and Bihar (91% of non-users vs. 74% of smokers). In the remaining two states, support for complete smoking bans in restaurants was significantly higher among non-users than smokers: Madhya Pradesh (94% of non-users vs. 75% of smokers), and West Bengal (72% of non-users vs. 50% of smokers).
There was no significant difference in support for complete smoking bans in restaurants among non-users and smokeless only users in Maharashtra (98% of non-users vs. 99% of smokeless only users), and Bihar (91% of non-users vs. 91% smokeless only users). In the remaining two states, support for complete smoking bans in restaurants was significantly higher among non-users than smokeless only users: Madhya Pradesh (94% of non-users vs. 79% of smokeless only users), and West Bengal (72% of non-users vs. 62% of smokeless only users).
Figure 27. Percentage of smokers (including smoked only and mixed tobacco users), smokeless tobacco only users, and tobacco non-users who think that smoking should not be allowed in any indoor areas of restaurants, by state*
tCp India Wave 1 project report (2010-2011)

Smoking in Bars
Smoking Bans in Bars
The TCP India Wave 1 Survey asked smokers, smokeless only users, and non-users to describe the scope of smoking bans in local bars.
In most states, less than one-third of smokers reported that smoking is not allowed in any indoor areas of bars as follows: Maharashtra (32%), West Bengal (32%), and Bihar (29%) (see Figure 28). In Madhya Pradesh, only 6% of smokers reported that smoking is not permitted in any indoor areas of bars.
In most states, there was no significant difference in the percentage of non-users who reported that smoking is not allowed in any indoor areas of bars in comparison to smokers: West Bengal (52% of non-users vs. 32% of smokers), Bihar (46% of non-users vs. 29% of smokers), and Madhya Pradesh (10% of non-users vs. 6% of smokers). In Maharashtra, significantly more non-users (53%) than smokers (32%) said that smoking is not allowed in any indoor areas of bars.
In all four states, there were no significant differences in the percentage of non-users who reported that smoking is not allowed in any indoor areas of bars in comparison to smokeless only users: Maharashtra (53% of non-users vs. 54% of smokeless only users), West Bengal (52% of non-users vs. 31% of smokeless only users), Bihar (46% of non-users vs. 38% of smokeless only users), and Madhya Pradesh (10% of non-users vs. 9% of smokeless only users).
Noticing Smoking in Bars
The TCP India Wave 1 Survey asked smokers, smokeless only users, and non-users who had visited a bar in the last six months whether they had noticed anyone smoking indoors at their last visit.
The percentage of smokers who had visited a bar in the last six months ranged from 64% to 82% as follows: Bihar (82%), Madhya Pradesh (79%), Maharashtra (68%), and West Bengal (64%). The percentage of smokeless only users who had visited a bar in the last six months ranged from 49% to 69% as follows: Madhya Pradesh (69%), Bihar (68%), Maharashtra (57%), and West Bengal (49%). The percentage of non-users who had visited a bar in the last six months ranged from 25% to 39% as follows: West Bengal (39%), Madhya Pradesh (36%), Maharashtra (33%), and Bihar (25%).
In Madhya Pradesh, virtually all smokers (98%) who had visited a bar in the last six months observed people smoking at their last visit. These results are not surprising given that less than 10% of smokers in Madhya Pradesh reported that smoking is not allowed in any indoor areas of bars. The vast majority of smokers also noticed people smoking in bars in Bihar (88%) and Maharashtra (82%). Observed indoor smoking in bars was lowest in West Bengal, where 79% of smokers noticed smoking in bars at their last visit (see Figure 29).
Figure 28. Percentage of smokers (including smoked only and mixed tobacco users), smokeless tobacco only users, and tobacco non-users who reported that smoking is not allowed in any indoors areas of bars, by state*
61tCp India Wave 1 project report (2010-2011)

Figure 29. Percentage of smokers (including smoked only and mixed tobacco users), smokeless tobacco only users, and tobacco non-users who noticed smoking in indoor areas of bars at their last visit among those who have visited a bar in the last six months, by state*
Figure 30. Percentage of smokers (including smoked only and mixed tobacco users) that smoked indoors at a bar during their last visit among those who visited a bar in the last six months, by state*
In all four states, there was no significant difference in the percentage of non-users who observed people smoking at their last visit to a bar in comparison to smokers: Madhya Pradesh (91% of non-users vs. 98% of smokers), Bihar (84% of non-users vs. 88% of smokers), Maharashtra (75% of non-users vs. 82% of smokers), and West Bengal (58% of non-users vs. 79% of smokers).
There was also no significant difference in the percentage of non-users who observed people smoking at their last visit to a bar in comparison to smokeless only users in each of the four states: Madhya Pradesh (91% of non-users vs. 94% of smokeless only users), Bihar (84% of non-users vs. 98% of smokeless only users), Maharashtra (75% of non-users vs. 85% of smokeless only users), and West Bengal (58% of non-users vs. 79% of smokeless only users).
Smoking in Bars
The TCP India Wave 1 Survey also asked smokers who had visited a bar in the last six months whether they had smoked indoors at their last visit.
In Madhya Pradesh, nearly all smokers (96%) reported that they had smoked indoors during their last visit to a bar (see Figure 30). In the remaining three states, more than 3 out of 5 smokers reported that they had smoked inside a bar at their last visit as follows: Bihar (72%), West Bengal (72%), and Maharashtra (66%).
62tCp India Wave 1 project report (2010-2011)
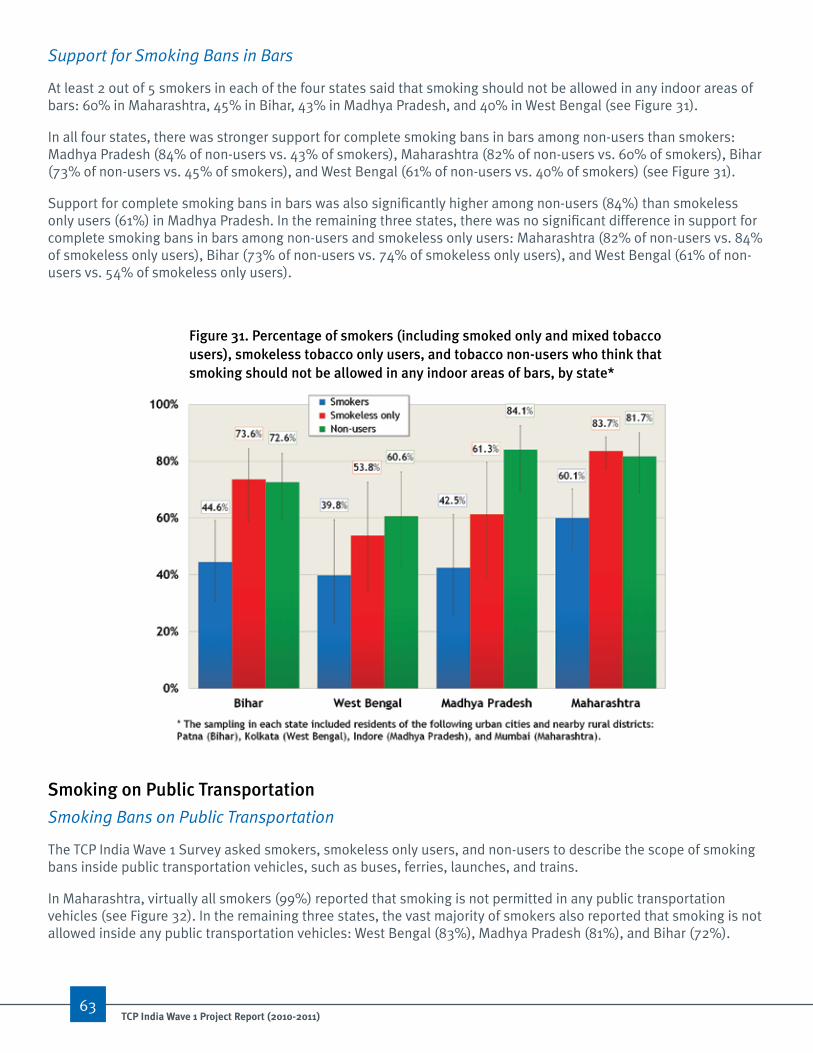
Support for Smoking Bans in Bars
At least 2 out of 5 smokers in each of the four states said that smoking should not be allowed in any indoor areas of bars: 60% in Maharashtra, 45% in Bihar, 43% in Madhya Pradesh, and 40% in West Bengal (see Figure 31).
In all four states, there was stronger support for complete smoking bans in bars among non-users than smokers: Madhya Pradesh (84% of non-users vs. 43% of smokers), Maharashtra (82% of non-users vs. 60% of smokers), Bihar (73% of non-users vs. 45% of smokers), and West Bengal (61% of non-users vs. 40% of smokers) (see Figure 31).
Support for complete smoking bans in bars was also significantly higher among non-users (84%) than smokeless only users (61%) in Madhya Pradesh. In the remaining three states, there was no significant difference in support for complete smoking bans in bars among non-users and smokeless only users: Maharashtra (82% of non-users vs. 84% of smokeless only users), Bihar (73% of non-users vs. 74% of smokeless only users), and West Bengal (61% of non-users vs. 54% of smokeless only users).
Figure 31. Percentage of smokers (including smoked only and mixed tobacco users), smokeless tobacco only users, and tobacco non-users who think that smoking should not be allowed in any indoor areas of bars, by state*
Smoking on Public Transportation
Smoking Bans on Public Transportation
The TCP India Wave 1 Survey asked smokers, smokeless only users, and non-users to describe the scope of smoking bans inside public transportation vehicles, such as buses, ferries, launches, and trains.
In Maharashtra, virtually all smokers (99%) reported that smoking is not permitted in any public transportation vehicles (see Figure 32). In the remaining three states, the vast majority of smokers also reported that smoking is not allowed inside any public transportation vehicles: West Bengal (83%), Madhya Pradesh (81%), and Bihar (72%).
63tCp India Wave 1 project report (2010-2011)

In all four states, there was no significant difference in the percentage of non-users who reported that smoking is not allowed inside any public transportation vehicles in comparison to smokers: Maharashtra (98% of non-users vs. 99% of smokers), Madhya Pradesh (88% of non-users vs. 81% of smokers), West Bengal (85% of non-users vs. 83% of smokers), and Bihar (76% of non-users vs. 72% of smokers).
In Madhya Pradesh, significantly more non-users (88%) said that smoking is not allowed inside any public transportation vehicles than smokeless only users (66%). In the remaining three states, there was no significant difference in the percentage of non-users who reported that smoking is not allowed inside any public transportation vehicles in comparison to smokeless only users: Maharashtra (98% of non-users vs. 98% of smokeless only users), West Bengal (85% of non-users vs. 82% of smokeless only users), and Bihar (76% of non-users vs. 76% of smokeless only users).
Figure 32. Percentage of smokers (including smoked only and mixed tobacco users), smokeless tobacco only users, and tobacco non-users who reported that smoking is not allowed in any public transportation vehicle, by state*
Noticing Smoking on Public Transportation
The TCP India Wave 1 Survey asked smokers, smokeless only users, and non-users who rode public transportation in the last six months whether they had noticed anyone smoking inside the last time they used a form of public transportation.
The vast majority of smokers in each of the four states reported that they had used public transportation (bus, ferry, launch, or train) in the last six months: Maharashtra (92%), West Bengal (91%), Bihar (89%), and Madhya Pradesh (81%).
The percentage of smokers who noticed people smoking inside the last time they used public transportation was highest in Bihar (77%) and West Bengal (55%), lower in Madhya Pradesh (40%), and lowest in Maharashtra (12%) (see Figure 33).
64tCp India Wave 1 project report (2010-2011)

Support for Smoking Bans on Public Transportation
In all four states, there was very strong support for comprehensive smoking bans on public transportation. Virtually all smokers in each of the four states reported that indoor smoking on public transportation should “not be allowed at all”: Bihar (99%), Maharashtra (99%), Madhya Pradesh (94%), and West Bengal (88%) (see Figure 34).
In Bihar and Maharashtra, there were no significant differences in support for complete smoking bans inside public transportation among non-users and smokers: Bihar (100% of non-users vs. 99% of smokers), and Maharashtra (99% of non-users vs. 99% of smokers). In Madhya Pradesh and West Bengal, support for complete smoking bans inside public transportation was significantly higher among non-users than it was among smokers: Madhya Pradesh (99% of non-users vs. 94% of smokers), and West Bengal (96% of non-users vs. 88% of smokers).
In most states, there was no significant difference in support for complete smoking bans inside public transportation among non-users and smokeless only users: Bihar (100% of non-users vs. 100% of smokeless only users), Maharashtra (99% of non-users vs. 99% of smokeless only users), and West Bengal (96% of non-users vs. 93% of smokeless only users). In Madhya Pradesh, support for complete smoking bans inside public transportation was significantly higher among non-users (99%) than it was among smokeless only users (94%).
Figure 33. Percentage of smokers (including smoked only and mixed tobacco users), smokeless tobacco only users, and tobacco non-users who noticed smoking inside public transportation vehicles on their last ride among those who have ridden in one of these vehicles in the last six months, by state*
In most states, there was no significant difference in the percentage of non-users who observed smoking inside public transportation in comparison to smokers: Bihar (68% of non-users vs. 77% of smokers), West Bengal (56% of non-users vs. 55% of smokers), and Madhya Pradesh (43% of non-users vs. 40% of smokers). In Maharashtra, significantly more non-users (19%) noticed people smoking inside public transportation than smokers (12%).
There was also no difference in the percentage of non-users who observed smoking inside public transportation in comparison to smokeless only users in Bihar (68% of non-users vs. 65% of smokeless only users), West Bengal (56% of non-users vs. 54% of smokeless only users), and Madhya Pradesh (43% of non-users vs. 41% of smokeless only users). In Maharashtra, significantly more non-users (19%) noticed people smoking inside public transportation than smokeless only users (13%).
65tCp India Wave 1 project report (2010-2011)

Figure 34. Percentage of smokers (including smoked only and mixed tobacco users), smokeless tobacco only users, and tobacco non-users who think that smoking should not be allowed inside public transportation vehicles, by state*
Smoking in the Home The TCP India Wave 1 Survey asked smokers, smokeless only users, and non-users to describe their rules about indoor smoking in their homes.
The percentage of smokers who reported that smoking was not allowed inside their homes was highest in Maharashtra (45%) and lowest in Madhya Pradesh (19%). In the remaining two states, less than one-third of smokers did not allow smoking inside their homes: Bihar (32%) and West Bengal (21%) (see Figure 35).
In all four states, non-users were significantly more likely than smokers to have voluntary bans on smoking anywhere inside the home: Maharashtra (90% of non-users vs. 45% of smokers), Bihar (76% of non-users vs. 32% of smokers), Madhya Pradesh (71% of non-users vs. 19% of smokers), and West Bengal (54% of non-users vs. 21% of smokers).
Similarly, non-users in most states were more significantly more likely than smokeless only users to have voluntary bans on smoking anywhere inside the home: Bihar (76% of non-users vs. 67% of smokeless only users), Madhya Pradesh (71% of non-users vs. 50% of smokeless only users), West Bengal (54% of non-users vs. 44% of smokeless only users). In Maharashtra, there were no significant differences in the percentage of non-users (90%) and smokeless only users (87%) who reported that smoking was not allowed inside their homes.
The TCP India Wave 1 Survey also asked smokers to report on whether there had been any changes in how much they smoked inside their homes over the course of the last year. In most states, more than one-third of smokers (44% in West Bengal, 40% in Madhya Pradesh, and 34% in Maharashtra) said that they smoked less inside their homes than they did one year ago. In Bihar, less than one-quarter (23%) of smokers said that they smoked less inside their homes than they did one year ago. The majority of smokers in each state said they smoke about the same in their homes as they did one year ago (66% in Bihar, 58% in Maharashtra, 57% in Madhya Pradesh, and 51% in West Bengal).
66tCp India Wave 1 project report (2010-2011)

Among smokers who allowed smoking in the home, more than half reported that they were “extremely concerned” or “very concerned” that their own smoking in the home would be harmful to the health of children in their households in Bihar (72%) and Maharashtra (59%) (see Figure 36). In the remaining two states, fewer smokers were concerned that their own smoking in the home was harmful to the health of their children (39% in Madhya Pradesh and 36% in West Bengal).
Figure 36. Percentage of smokers (including smoked only and mixed tobacco users) that were “extremely concerned” or “very concerned” that their own smoking in the home is harmful to the health of their children among those who allow smoking in their home, by state*
Figure 35. Percentage of smokers (including smoked only and mixed tobacco users), smokeless tobacco only users, and tobacco non-users who reported that smoking is not allowed inside their homes, by state*
67tCp India Wave 1 project report (2010-2011)

KEy FinDinGS• Approximately three years after the implementation of the 2008 National smoke-free law in
India, awareness of the smoke-free law remained low, and the public continued to be exposed to second-hand smoke in public places and workplaces.
• In all four states, there was very strong support for comprehensive indoor smoking bans in workplaces, restaurants and public transportation among smokers, smokeless only users, and non-users, with the highest levels of support (more than 90% of tobacco users, and non-users) in Maharashtra.
Workplace smoking bans• In all four states, the vast majority of smokers who worked indoors reported that smoking is not
allowed in any indoor areas at their workplaces; however, reports of observed smoking indoors in workplaces suggests that compliance with these bans is weak.
• In Bihar, West Bengal, and Madhya Pradesh, 60% to 67% of smokers, 40% to 54% of smokeless only users, and 22% to 42% of non-users reported that they had seen people smoking in indoor areas at their workplaces. In Maharashtra, 29% of smokers, 17% of smokeless only users, and 9% of non-users observed people smoking in indoor areas at their workplaces.
• More smokers noticed people smoking indoors at their workplace than non-users in West Bengal, Madhya Pradesh, and Maharashtra. More smokeless only users noticed people smoking indoors at their workplace than non-users in West Bengal and Madhya Pradesh.
• There was strong support for a comprehensive workplace smoking ban among all respondents in Bihar, Madhya Pradesh, and Maharashtra (more than 82% of smokers, more than 86% of smokeless only users, and more 96% of non-users). Support for a complete ban in West Bengal ranged from 52% of smokers to 74% of non-users.
Smoking bans in bars and restaurants• In all four states, the public continues to be exposed to second-hand smoke in bars. Observed
indoor smoking in bars was highest in Bihar and Madhya Pradesh, where more than 87% of smokers, more than 93% of smokeless only users, and more than 83% of non-users noticed smoking at their last visit.
• In all four states, more smokers noticed people smoking indoors at bars than non-users.
• Overall, smokers’, smokeless only users’, and non-users’ support for comprehensive smoking bans in bars was generally lower than support for such bans in workplaces, restaurants, and public transportation.
68tCp India Wave 1 project report (2010-2011)

• In all four states, indoor smoking was still commonly observed in restaurants - 34% to 71% of smokers, 32% to 53% of smokeless only users, and 22% to 41% of non-users noticed smoking in restaurants at their last visit.
• More than 4 out of 7 smokers (58%) in Bihar and more than 3 out of 7 smokers (44%) in Madhya Pradesh who visited a restaurant in the last six months smoked indoors at a restaurant at their last visit. In order to protect the public from exposure to second-hand smoke, the Indian government should remove the exemption in the smoke-free law that permits smoking in restaurants with a seating capacity of 30 or more.
• In Madhya Pradesh and Bihar, approximately three-quarters of smokers, more than 78% of smokeless only users, and more than 90% of non-users said that smoking should be completely banned in indoor areas in restaurants.
• Support for complete smoking bans in restaurants was higher among non-users than it was among smokers or smokeless only users in Madhya Pradesh and West Bengal.
Smoking bans on public transportation• More than half of all respondents who used public transportation in the last six months in Bihar
and West Bengal, and more than one-third of non-users in Madhya Pradesh, noticed smoking inside public transportation during their last ride. Noticing smoking inside public transportation was lowest among all respondents in Maharashtra.
• There was almost unanimous support (more than 7 out of 8) among smokers, smokeless only users, and non-users in all four states for a ban on smoking inside public transportation vehicles.
Home smoking bans• In all four states, more than half of non-users have completely banned smoking in their homes.
• Maharashtra had the highest percentage of non-users (90%), smokeless only users (87%), and smokers (45%) who did not allow smoking in their homes.
• More non-users had voluntary bans on smoking inside the home than smokers in each of the four states. More non-users had voluntary bans on smoking inside the home than smokeless only users in Bihar, Madhya Pradesh, and West Bengal.
• There was evidence of a lack of awareness of the harms of second-hand smoke to children among smokers who allowed smoking in the home. In West Bengal and Madhya Pradesh, only about one-third of smokers were concerned that their own smoking in the home would harm their children’s health.
69tCp India Wave 1 project report (2010-2011)

HEalTH WaRninG laBElS
In India, pictorial health warnings on tobacco products are mandated under COTPA 2003. Following two rounds of revisions in 2006 and 2007, pictorial warnings were implemented on packages for both smoked and smokeless tobacco products on May 31, 2009. India was the first country to introduce pictorial warnings on smokeless products. The use of misleading descriptors on tobacco packages such as “light” and “mild” are also prohibited.
Three rounds of pictorial health warnings have been implemented in India between 2009 and 2013. Round 1 pictorial warnings were implemented between May 2009 and November 2011; Round 2 warnings were implemented as of December 1, 2011; and the Round 3 warnings appeared as of April 1, 2013 (see Table 1 on page 15 for further details).
The TCP India Wave 1 Survey (2011) was conducted approximately two years after the Round 1 pictorial health warning labels had been in circulation, and less than two months before the launch of the Round 2 warnings. The Round 1 warnings included two images for smoked tobacco products, and one image for smokeless tobacco products covering 40% of the front exterior display area. This section presents TCP India Wave 1 Survey findings on the effectiveness of the Round 1 health warnings, including measures of label salience, cognitive and behavioural responses to the warnings, and support for the warnings. The findings below represent results among adult smokers (smoked only and mixed tobacco) and smokeless tobacco users (smokeless only and mixed tobacco) aged 15 years and older surveyed in selected urban cities and surrounding rural districts of the following four states: Bihar (Patna), West Bengal (Kolkata), Madhya Pradesh (Indore), and Maharashtra (Mumbai).
70tCp India Wave 1 project report (2010-2011)
Salience of Health Warnings Existing studies have consistently found that large pictorial health warnings that appear on the upper display areas of cigarette packages are more likely to be noticed by smokers.20 In India, the Round 1 pictorial warning labels that were in circulation at the time of the TCP India Wave 1 Survey covered 40% of the front lower portion of all smoked tobacco packages, and 40% of the front upper portion of all smokeless tobacco packages (see Figure 37).
Figure 37. Examples of Round 1 (2009-2011) warning labels on smoked (left) and smokeless (right) tobacco packages

In all four states, at least 4 out of 5 smokers were aware of the health warnings on smoked tobacco packages: 96% in Maharashtra, 95% in Bihar, 94% in Madhya Pradesh, and 80% in West Bengal. Among these smokers, the percentage who said that they noticed warning labels “often” or “whenever they smoked tobacco” was highest in Maharashtra (75%), and lowest in Madhya Pradesh (28%) (see Figure 38). The percentage of smokers who reported noticing warning labels “often” or “whenever they smoked tobacco” was similar in the remaining two states: 54% in West Bengal, and 50% in Bihar. Of those smokers who noticed warning labels on smoked tobacco packages, less than half reported that they “often” or “regularly” read or looked closely at warning labels in the last month: 37% in West Bengal, 35% in Maharashtra, 21% in Bihar, and 19% in Madhya Pradesh.
In all four states, more than 3 out of 5 smokeless users knew that smokeless tobacco packages had health warnings: 94% in Maharashtra, 88% in Bihar, 85% in Madhya Pradesh, and 66% in West Bengal. The majority of these smokeless users reported that they noticed warning labels “often” or “whenever they used smokeless tobacco” in Maharashtra (77%) and West Bengal (60%) (see Figure 39).
Figure 38. impact of health warning on smokers’ (including smoked only and mixed tobacco users) perceptions and behaviours in the last month, by state*
71tCp India Wave 1 project report (2010-2011)

In the remaining two states, less than 2 out of 7 smokeless users noticed warning labels “often” or “whenever they used smokeless tobacco” (35% in Bihar and 27% in Madhya Pradesh). Among smokeless users who noticed warning labels on smokeless tobacco packages, less than half reported that they “often” or “regularly” read or looked closely at them in the last month: 45% in West Bengal, 37% in Maharashtra, 21% in Bihar, and 19% in Madhya Pradesh.
These findings showed that the majority of tobacco users in India were aware of the health warnings on tobacco packages. While the salience of these health warnings varied by state (a higher proportion of smokers and smokeless users noticed health warning labels in Maharashtra and West Bengal than in Madhya Pradesh), less than half of smokers and smokeless users in each of the four states who noticed health warning labels reported that they “regularly” read or looked closely at them.
Figure 39. impact of health warnings on smokeless tobacco users’ (including smokeless only and mixed tobacco users) perceptions and behaviours in the last month, by state*
72tCp India Wave 1 project report (2010-2011)

Knowledge of the Harms of Tobacco use Health warnings on tobacco packages are an important source of information about the harms of tobacco use, and provide a high frequency of exposure to messages with the potential to reach a large proportion of smokers on a continuous basis.85, 86 A growing body of literature has also shown that larger, pictorial health warnings are more effective than text-only warnings for communicating health information about the risks of smoking.87, 88, 89, 20
At the time of the TCP India Wave 1 Survey, two pictorial health warnings that featured an image of a diseased lung or an x-ray image of a lung were rotated on smoked tobacco packages, accompanied by the text warnings “Smoking kills” and “Tobacco causes cancer”. Smokeless tobacco packages featured an image of a black scorpion accompanied by the text warnings “Tobacco kills” and “Tobacco causes cancer” (see Figure 40).
Figure 40. Round 1 pictorial warnings on smoked (left and centre) and smokeless (right) tobacco product packages
The TCP India Wave 1 Survey assessed smokers’ knowledge of 10 health effects caused by smoking: heart disease in smokers, stroke, lung cancer in smokers, throat cancer, mouth cancer, tuberculosis, heart disease in non-smokers caused by second-hand smoke, impotence, lung cancer in non-smokers caused by second-hand smoke, and asthma in children caused by second-hand smoke. The TCP India Wave 1 Survey also assessed smokeless users’ knowledge of four health effects caused by the use of smokeless tobacco products: heart disease, throat cancer, mouth cancer, and gum disease.
1. Throat cancer: 94% in Bihar, 92% in Maharashtra, 87% in West Bengal, and 75% in Madhya Pradesh;
2. Mouth cancer: 92% in Maharashtra, 91% in Bihar, 80% in West Bengal, and 76% in Madhya Pradesh;
3. Tuberculosis: 95% in Bihar, 72% in West Bengal, 67% in Maharashtra, and 51% in Madhya Pradesh; and
4. Heart disease in smokers: 87% in Bihar, 78% in West Bengal, 63% in Maharashtra, and 49% in Madhya Pradesh.
Knowledge of Health Effects of Smoking
At the time of the TCP India Wave 1 Survey, the Round 1 pictorial health warnings on smoked tobacco packages, which featured information on the risks of lung cancer, had been in circulation for about two years. As such, it was not surprising that more than three-quarters of smokers in each of the four states had a high level of awareness that smoking cigarettes and/or bidis causes lung cancer in smokers: 96% in Bihar, 93% in Maharashtra, 88% in West Bengal, and 76% in Madhya Pradesh (see Figure 41).
Despite the limited content on the adverse health effects of smoking on the Round 1 health warning labels, smokers’ knowledge that smoking cigarettes and/or bidis causes throat and mouth cancer was consistently high in each of the four states. However, smokers’ knowledge for the effects of smoking on tuberculosis and heart disease varied by state.
73tCp India Wave 1 project report (2010-2011)

Figure 41. Smokers’ (including smoked only and mixed tobacco users) knowledge of the health effects of smoked tobacco use, by state*
74tCp India Wave 1 project report (2010-2011)

1. Lung cancer in non-smokers: 90% in Bihar, 72% in West Bengal, 76% in Maharashtra, and 55% in Madhya Pradesh;
2. Asthma in children: 88% in Bihar, 78% in West Bengal, 59% in Maharashtra, and 41% Madhya Pradesh; and
3. Heart disease in non-smokers: 82% in Bihar, 71% in West Bengal, 50% in Maharashtra, and 42% in Madhya Pradesh.
1. Mouth cancer: 87% in Maharashtra, 86% in Madhya Pradesh, 80% in West Bengal, and 78% in Bihar;
2. Throat cancer: 87% in Maharashtra, 77% in West Bengal, 76% in Madhya Pradesh, and 66% in Bihar; and
3. Gum disease: 84% in Bihar, 77% in Maharashtra, 74% in West Bengal, and 72% in Madhya Pradesh.
Smokers’ knowledge that exposure to second-hand smoke causes lung cancer in non-smokers, asthma in children, and heart disease in non-smokers was also high in most states, with a few exceptions in Madhya Pradesh.
Knowledge that smoking can cause strokes was considerably higher in Bihar (80%) and West Bengal (74%) than it was in Maharashtra (36%) and Madhya Pradesh (23%).
Impotence was the least commonly recognized health effect of smoking, but there were variations in knowledge by state. The percentage of smokers who were aware that smoking causes impotence was highest in Bihar (63%) and West Bengal (44%), slightly lower in Maharashtra (31%), and lowest in Madhya Pradesh (20%).
Taken together, these findings showed that more than three-quarters of smokers in each of the four states were aware that smoking can lead to lung, throat, and mouth cancers in smokers, and that more than half were aware that smoking causes tuberculosis and lung cancer in non-smokers. However, knowledge was considerably lower for several other health effects, with some variations by state. Specifically, smokers in Bihar and West Bengal generally had a higher level of awareness that smoking causes heart disease in non-smokers, asthma in children, strokes, and impotence in comparison to smokers in Maharashtra and Madhya Pradesh. Awareness of the health effects of smoking was especially low in Madhya Pradesh - smokers in this state had the lowest knowledge for all 10 of the health effects assessed in the survey. In order to decrease gaps in smokers’ knowledge of the health hazards of smoking, the content of health warnings needs to be broadened to include a wider range of messages. State level variations in health knowledge also highlight the importance of targeted interventions that are designed to address these disparities.
Knowledge of Health Effects of Smokeless Tobacco Use
There is strong existing evidence that the use of smokeless tobacco products causes different types of oral cancers, including carcinomas of the lip, mouth, tongue, pharynx, and gums.90,91,92 In India, where the prevalence of smokeless tobacco use is high, oral cancer is one of the most common forms of cancer, and is estimated to account for over 30% of all cancers in the country.93-95
In spite of the lack of graphic depiction of oral cancer on the smokeless tobacco warning labels at the time of the TCP India Wave 1 Survey, findings showed that smokeless users were aware that smokeless tobacco causes different forms of oral cancer. In all four states, more than 5 out of 7 smokeless users were aware that the use of smokeless tobacco products causes the following forms of oral cancer and gum disease (see Figure 42):
75tCp India Wave 1 project report (2010-2011)
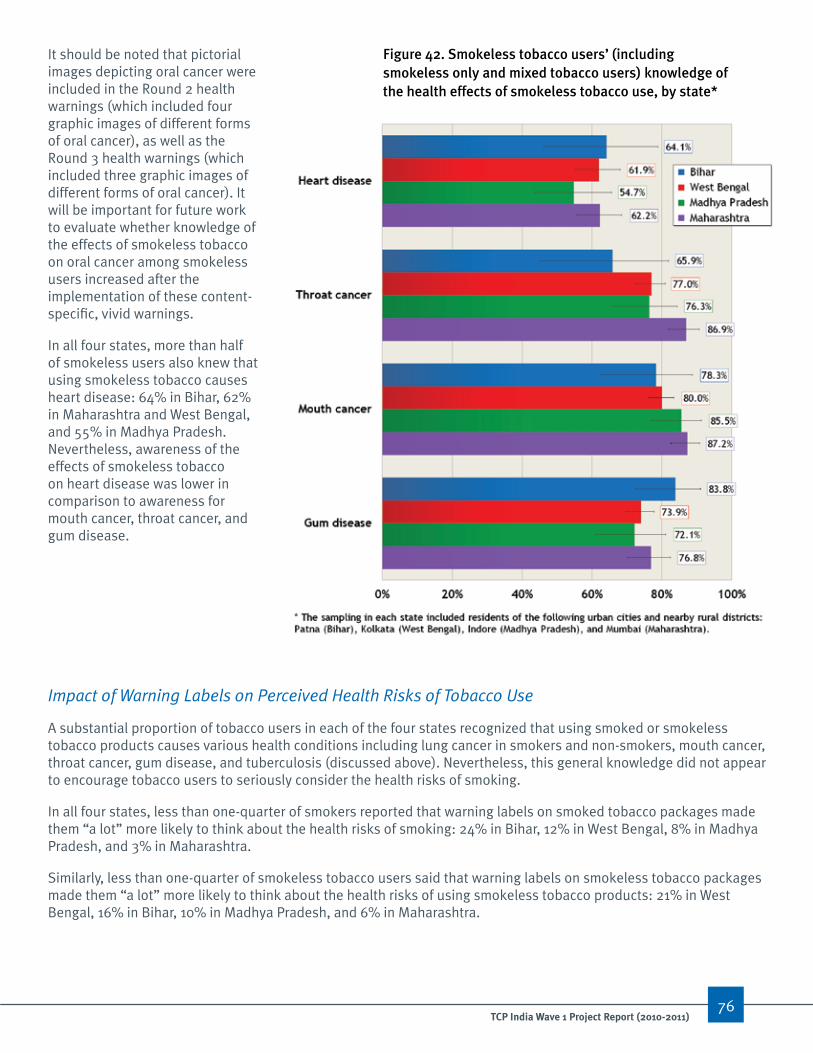
Figure 42. Smokeless tobacco users’ (including smokeless only and mixed tobacco users) knowledge of the health effects of smokeless tobacco use, by state*
It should be noted that pictorial images depicting oral cancer were included in the Round 2 health warnings (which included four graphic images of different forms of oral cancer), as well as the Round 3 health warnings (which included three graphic images of different forms of oral cancer). It will be important for future work to evaluate whether knowledge of the effects of smokeless tobacco on oral cancer among smokeless users increased after the implementation of these content-specific, vivid warnings.
In all four states, more than half of smokeless users also knew that using smokeless tobacco causes heart disease: 64% in Bihar, 62% in Maharashtra and West Bengal, and 55% in Madhya Pradesh. Nevertheless, awareness of the effects of smokeless tobacco on heart disease was lower in comparison to awareness for mouth cancer, throat cancer, and gum disease.
Impact of Warning Labels on Perceived Health Risks of Tobacco Use
A substantial proportion of tobacco users in each of the four states recognized that using smoked or smokeless tobacco products causes various health conditions including lung cancer in smokers and non-smokers, mouth cancer, throat cancer, gum disease, and tuberculosis (discussed above). Nevertheless, this general knowledge did not appear to encourage tobacco users to seriously consider the health risks of smoking.
In all four states, less than one-quarter of smokers reported that warning labels on smoked tobacco packages made them “a lot” more likely to think about the health risks of smoking: 24% in Bihar, 12% in West Bengal, 8% in Madhya Pradesh, and 3% in Maharashtra.
Similarly, less than one-quarter of smokeless tobacco users said that warning labels on smokeless tobacco packages made them “a lot” more likely to think about the health risks of using smokeless tobacco products: 21% in West Bengal, 16% in Bihar, 10% in Madhya Pradesh, and 6% in Maharashtra.
76tCp India Wave 1 project report (2010-2011)

tCp India Wave 1 project report (2010-2011)77
Findings from the TCP india Wave 1 Survey showed that the majority of smoked and smokeless tobacco users in india wanted more information on warning labels about the health risks of tobacco use.
impact of Warning labels
Impact of Warning Labels on Avoidance Behaviour
Avoidance behaviour is another measure of health warning label effectiveness, and is also positively associated with subsequent quitting behaviours.20, 96, 97 Findings from the TCP India Wave 1 Survey showed low avoidance of pictorial health warnings on tobacco packages among tobacco users in India. In all four states, less than 1 out of 7 smokers reported that they had made an effort to avoid looking at or thinking about the warning labels on smoked tobacco packages in the last month: 13% in West Bengal, 10% in Bihar, 4% in Madhya Pradesh, and 3% in Maharashtra. Similarly, a minority of smokeless tobacco users in all four states said that they avoided looking at or thinking about warning labels on smokeless tobacco packages in the last month: 12% in West Bengal, 7% in Bihar, 4% in Madhya Pradesh, and 3% in Maharashtra.
Impact of Warning Labels on Quit Intentions and Behaviour
Previous research has shown that the implementation of pictorial health warnings may encourage adult and youth smokers to think about quitting and to forgo the use cigarettes.96, 97, 98, 99
The percentage of smokers who reported that warning labels had prompted them to forgo the use of smoked tobacco products was highest in Bihar, where nearly half (48%) of smokers reported that warning labels had stopped them from smoking tobacco “at least once” in the last month. This percentage was much lower in the remaining three states: West Bengal (25%), Madhya Pradesh (23%), and Maharashtra (17%). In all four states, less than one-third of smokeless tobacco users reported that warning labels stopped them from using smokeless tobacco “at least once” in the last month: 28% in Bihar, 27% in Madhya Pradesh, 25% in West Bengal, and 20% in Maharashtra.
In Bihar, 85% of smokers who planned to quit said that the warning labels on smoked tobacco packages led them to think about quitting, and 37% of smokers who were aware of warning labels on smoked tobacco packages reported that warning labels made them “a lot” more likely to quit smoking. However, these percentages were much lower in the remaining three states, where less than one-third of smokers reported that warning labels on smoked tobacco packages led them to think about quitting (31% in Maharashtra, 26% in West Bengal, and 9% in Madhya Pradesh), or made them “a lot” more likely to quit smoking (12% in West Bengal, 5% in Madhya Pradesh, and 2% in Maharashtra).
More than half (59%) of smokeless users in Bihar who planned to quit said that the warning labels on smokeless tobacco packages led them to think about quitting. This percentage was lower in the remaining three states: 28% in Maharashtra, 18% in West Bengal, and 16% in Madhya Pradesh. In all four states, less than one-quarter of smokeless users who were aware of warning labels on smokeless tobacco packages said that warning labels made them “a lot” more likely to stop using smokeless products: 23% in Bihar, 19% in West Bengal, 6% in Madhya Pradesh, and 5% in Maharashtra.

Support for Enhanced Health Warnings Findings from the TCP India Wave 1 Survey showed that the majority of tobacco users in India wanted more information on health warning labels about the health risks of tobacco use. In all four states, more than 3 out of 5 smokers thought that there should be more health information on smoked tobacco packages: 76% in Madhya Pradesh, 68% in West Bengal, 65% in Bihar, and 64% in Maharashtra (see Figure 43).
Figure 43. Percentage of smokers (including smoked only and mixed tobacco users) who think that smoked tobacco packages should have more, less, or the same amount of health information as they do now, by state*†
Similarly, the majority of smokeless users also wanted more health information on smokeless tobacco packages. In all four states, more than half of smokeless users said that the warning labels on smokeless tobacco packages should have more health information: 77% in Madhya Pradesh, 69% in Maharashtra, 68% in West Bengal, and 58% in Bihar (see Figure 44).
Figure 44. Percentage of smokeless tobacco users (including smokeless only and mixed tobacco users) who think that smokeless tobacco packages should have more, less, or the same amount of health information as they do now, by state*†
78tCp India Wave 1 project report (2010-2011)
It is important to note that the health warnings that were implemented at Round 1 failed to meet the FCTC Article 11 Guidelines for the content of health warnings. Specifically, the Round 1 health warnings did not include a range of warnings and messages – only two health warnings depicting lung cancer appeared on smoked tobacco packages, a single warning for cancer appeared on smokeless tobacco packages, and no information on the harms of second-hand smoke appeared on tobacco packages. Findings from the TCP India Wave 1 Survey highlight the need to strengthen and broaden the range of health effects covered on health warning labels in India, which tobacco users themselves strongly supported.

KEy FinDinGS• The vast majority of smokers and smokeless users in each of the four states were aware of the
health warning labels on the packages of their respective products.
• The percentage of tobacco users who noticed warning labels was highest in Maharashtra (75% of smokers and 77% of smokeless users) and lowest in Madhya Pradesh (28% of smokers and 27% of smokeless users).
• In all four states, less than 50% of smokers and smokeless users read or looked closely at the warning labels on packages of their respective products.
• On the whole, the vast majority of tobacco users in Bihar and West Bengal were aware of the negative health effects of tobacco use. Among smokers, knowledge was highest for cancer (including lung, throat and mouth cancer) and lowest for impotence.
• Smokers in Bihar and West Bengal had higher levels of awareness that smoking can cause heart disease in non-smokers, asthma in children, strokes, and impotence than smokers in Maharashtra and Madhya Pradesh.
• Smokers in Madhya Pradesh had the lowest levels of awareness of the health risks of smoking.
• Knowledge of the link between smokeless tobacco use and heart disease, throat and mouth cancer, and gum disease was generally high among smokeless users in all four states, although knowledge was slightly lower for heart disease than it was for the different forms of oral cancer (including mouth and throat cancer). There were no state differences in smokeless users’ awareness of these four health effects.
• In most states, Round 1 pictorial warning labels have not been effective in terms of encouraging tobacco users to think about the health risks of tobacco use, avoid warning labels, forgo the use of tobacco products, and to quit.
• Pictorial warning labels have had the greatest impact on smokers’ behaviour in Bihar, where 24% of smokers said that warning labels made them “a lot” more likely to think about the health risks of smoking, 48% reported that warning labels stopped them from smoking “at least once” in the last month, 85% reported that warning labels led them to contemplate quitting, and 37% said that warning labels made them “a lot” more likely to quit.
• The majority of smokers and smokeless users wanted more health information on warning labels. Support was highest in Madhya Pradesh, where more than three-quarters of smokers (76%) and smokeless users (77%) thought there should be more health information on the warning labels on packages of their respective products.
79tCp India Wave 1 project report (2010-2011)

ToBaCCo aDvERTiSinG, PRoMoTion, anD SPonSoRSHiP
Article 13 of the FCTC obligates Parties to implement comprehensive bans on tobacco advertising, promotion, and sponsorship (TAPS). COTPA 2003, which came into effect on May 1, 2004, bans the direct and indirect advertising of tobacco products, including most forms of mass media advertising and offering or supplying free or discounted tobacco products. Tobacco product advertising at point of sale and the display of tobacco products at point of sale are still permitted, with some restrictions. Tobacco industry sponsorship of national and international events or activities, and tobacco advertising in or on tobacco packages are also still permitted. India has implemented the world’s first ban on the display and use of tobacco products in television and films effective November 2011.
The TCP India Wave 1 Survey (2010-2011) was conducted about seven years after the implementation of COTPA 2003 bans and restrictions on TAPS. This section presents TCP India Wave 1 Survey findings on awareness of tobacco advertising, promotion, and sponsorship activities among smokers (smoked only and mixed tobacco), smokeless tobacco only users, and tobacco non-users. The Survey also assessed public support for tobacco advertising bans. The findings below present results among adults aged 15 years and older surveyed in selected urban cities and surrounding rural districts of the following four states: Bihar (Patna), West Bengal (Kolkata), Madhya Pradesh (Indore), and Maharashtra (Mumbai).
visibility of Tobacco advertising Although India has implemented bans and restrictions on TAPS, the TCP India Wave 1 Survey demonstrates that the public continues to be exposed to the marketing of tobacco products.
The percentage of smokers who noticed advertising or pictures that encouraged tobacco use or made them think about using tobacco “often” or “once in a while” in the last six months was significantly higher in Maharashtra (55%) compared to Madhya Pradesh (19%). There were no other significant differences between states in the percentage of smokers who noticed tobacco advertising (see Figure 45).
Figure 45. Percentage of smokers (including smoked only and mixed tobacco users), smokeless tobacco only users, and tobacco non-users who “often” or “once in a while” noticed things designed to encourage tobacco use, by state*
80tCp India Wave 1 project report (2010-2011)

Within each of the four states, there was no significant difference between the percentage of smokers and non-users who noticed tobacco advertising or pictures that encouraged tobacco use or made them think about using tobacco “often” or “once in a while” in the last six months. Similarly, there was no significant difference between the percentage of smokeless only users and non-users who noticed tobacco advertising within each of the four states.
Sources of Tobacco advertising and Promotion The TCP India Wave 1 Survey also asked smokers, smokeless only users, and non-users to report where they noticed tobacco advertising or promotion in the last six months. The findings are presented for each respondent type by state in Figures 46 to 49.
Figure 46. Percentage of smokers (including smoked only and mixed tobacco users), smokeless tobacco only users, and tobacco non-users in Maharashtra who noticed tobacco products being advertised in various venues and media in the last six months*
81tCp India Wave 1 project report (2010-2011)

Figure 47. Percentage of smokers (including smoked only and mixed tobacco users), smokeless tobacco only users, and tobacco non-users in Madhya Pradesh who noticed tobacco products being advertised in various venues and media in the last six months*
Madyha Pradesh was the only state where
television was a more
common source of advertising
of tobacco products than
shop windows or inside shops.
82tCp India Wave 1 project report (2010-2011)

Figure 48. Percentage of smokers (including smoked only and mixed tobacco users), smokeless tobacco only users, and tobacco non-users in Bihar who noticed tobacco products being advertised in various venues and media in the last six months*
83tCp India Wave 1 project report (2010-2011)
Although tobacco advertising is banned in mass media sources, television, radio, and magazines were sources of tobacco advertising for more than a quarter of tobacco users in Bihar.

Figure 49. Percentage of smokers (including smoked only and mixed tobacco users), smokeless tobacco only users, and tobacco non-users in West Bengal who noticed tobacco products being advertised in various venues and media in the last six months*
84tCp India Wave 1 project report (2010-2011)
While point of sale locations were the most
common source of tobacco
advertising in West Bengal,
public transport vehicles and
stations were a source of
advertising for about a quarter
of tobacco users.
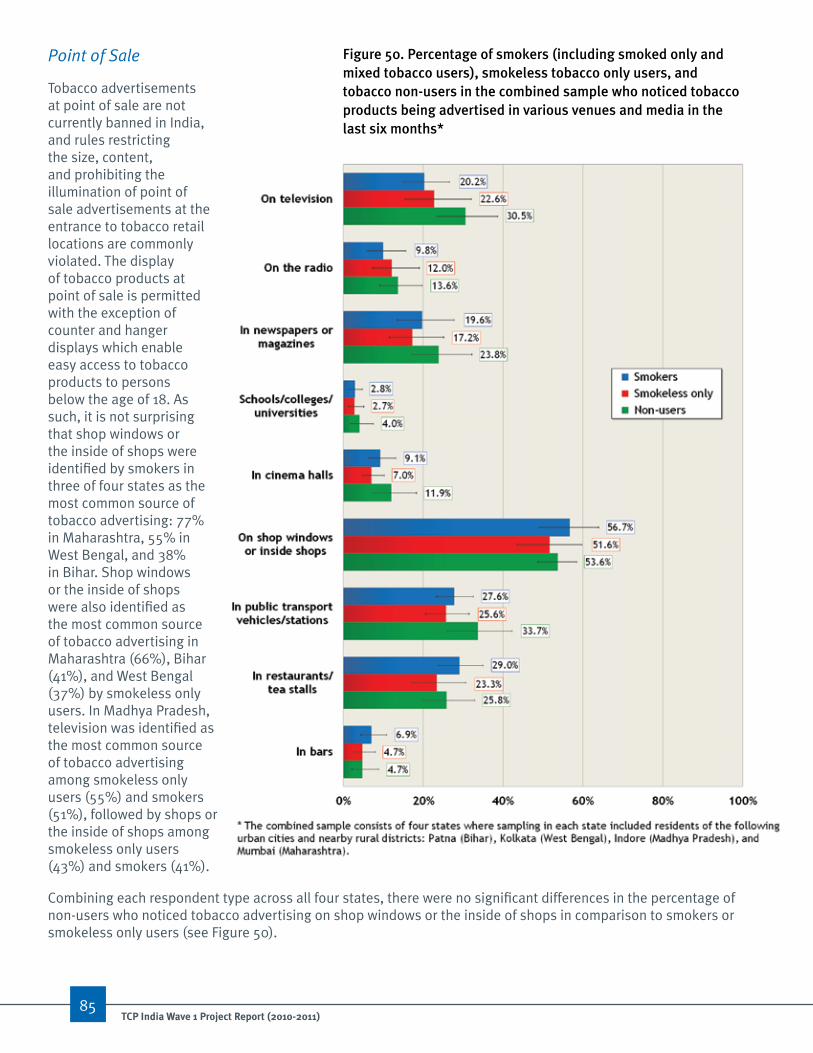
Figure 50. Percentage of smokers (including smoked only and mixed tobacco users), smokeless tobacco only users, and tobacco non-users in the combined sample who noticed tobacco products being advertised in various venues and media in the last six months*
Point of Sale
Tobacco advertisements at point of sale are not currently banned in India, and rules restricting the size, content, and prohibiting the illumination of point of sale advertisements at the entrance to tobacco retail locations are commonly violated. The display of tobacco products at point of sale is permitted with the exception of counter and hanger displays which enable easy access to tobacco products to persons below the age of 18. As such, it is not surprising that shop windows or the inside of shops were identified by smokers in three of four states as the most common source of tobacco advertising: 77% in Maharashtra, 55% in West Bengal, and 38% in Bihar. Shop windows or the inside of shops were also identified as the most common source of tobacco advertising in Maharashtra (66%), Bihar (41%), and West Bengal (37%) by smokeless only users. In Madhya Pradesh, television was identified as the most common source of tobacco advertising among smokeless only users (55%) and smokers (51%), followed by shops or the inside of shops among smokeless only users (43%) and smokers (41%).
Combining each respondent type across all four states, there were no significant differences in the percentage of non-users who noticed tobacco advertising on shop windows or the inside of shops in comparison to smokers or smokeless only users (see Figure 50).
85tCp India Wave 1 project report (2010-2011)

Mass Media
The advertising of tobacco products using most forms of mass media is banned in India. Nevertheless, tobacco users in each of the four states still reported seeing advertisements on various forms of media, such as television, newspapers, and magazines. Between one-quarter to half of smokers and smokeless only users in Madhya Pradesh and Bihar reported noticing tobacco products being advertised using the following forms of mass media: television (51% of smokers and 55% of smokeless only users in Madhya Pradesh, and 26% of smokers and 30% of smokeless only users in Bihar), and newspapers and magazines (24% of smokers and 23% of smokeless only users in Madhya Pradesh, 28% of smokers and 33% of smokeless only users in Bihar). In West Bengal and Maharashtra, less than one-quarter of smokers noticed tobacco advertising using these forms of mass media: television (15% of smokers and 15% of smokeless only users in West Bengal, and 20% of smokers and 19% of smokeless only users in Maharashtra), and newspapers and magazines (19% of smokers and 11% of smokeless only users in West Bengal, 17% of smokers and 12% of smokeless only users in Maharashtra).
Combining each respondent type across all four states, a significantly higher percentage of non-users noticed tobacco advertising on television than smokers, but there was no significant difference in the percentage of non-users who noticed tobacco advertising in newspapers and magazines in comparison to smokers. While there was also no significant difference in the percentage of non-users who noticed tobacco advertising on television in comparison to smokeless only users, a significantly higher percentage of non-users noticed tobacco advertising in newspapers and magazines than smokeless only users (see Figure 50).
More than 1 out of 5 smokers and smokeless only users also noticed tobacco advertising on the radio in Bihar (30% of smokers and 26% of smokeless only users) and Madhya Pradesh (24% of smokers and 21% of smokeless only users). In the remaining two states, a minority (less than 11%) of smokers and smokeless only users noticed tobacco advertising on the radio: Maharashtra (10% of smokers and 8% of smokeless only users), and West Bengal (4% of smokers and 5% of smokeless only users).
Combining each respondent type across all four states, the percentage of non-users who noticed tobacco advertising on the radio was not significantly different in comparison to smokers or smokeless only users (see Figure 50).
Public Venues
Overall, public transportation vehicles or stations were the most commonly cited public venues for noticing tobacco advertisements, followed by restaurants/tea stalls. In Maharashtra, more than 2 out of 7 smokers and smokeless only users noticed the advertisement of tobacco products in the following venues: public transportation vehicles or stations (43% of smokers and 37% of smokeless only users), and in restaurants/tea stalls (42% of smokers and 30% of smokeless only users). In West Bengal and Madhya Pradesh, approximately one-quarter of smokers and smokeless only users noticed the advertisement of tobacco products in these venues: public transportation vehicles or stations (26% of smokers and 20% of smokeless only users in West Bengal, and 24% of smokers and 21% of smokeless only users in Madhya Pradesh), and in restaurants/tea stalls (29% of smokers and 20% of smokeless only users in West Bengal, and 23% of smokers and 21% of smokeless only users in Madhya Pradesh). In Bihar, only a minority of smokers and smokeless only users said that they noticed tobacco advertising or promotion in public transportation vehicles or stations (11% of smokers and 10% of smokeless only users), and in restaurants/tea stalls (13% of smokers and 15% of smokeless only users).
86tCp India Wave 1 project report (2010-2011)

Combining each respondent type across all four states, there were no significant differences in the percentage of non-users who noticed tobacco advertising in public transportation vehicles or stations, or in restaurants/tea stalls in comparison to smokers. A significantly higher percentage of non-users noticed tobacco advertising in public transportation vehicles or stations than smokeless only users, but there was no significant difference in the percentage of non-users who noticed tobacco advertising in restaurants/tea stalls in comparison to smokeless only users (see Figure 50).
In all four states, the following venues were identified by smokers and smokeless only users as the least common sources of tobacco advertising:
1. Cinemas (17% of smokers and 8% of smokeless only users in Maharashtra, 11% of smokers and 5% of smokeless only users in Bihar, 10% of smokers and smokeless only users in Madhya Pradesh, and 6% of smokers and smokeless only users in West Bengal);
2. Bars (14% of smokers and 6% of smokeless only users in Maharashtra, 7% of smokers and 6% of smokeless only users in Madhya Pradesh, 5% of smokers and 6% of smokeless only users in Bihar, and 5% of smokers and 2% of smokeless only users in West Bengal); and
3. Educational institutions including schools, colleges, or universities (4% of smokers and 2% of smokeless only users in Madhya Pradesh, 3% of smokers and 5% of smokeless only users in West Bengal, 2% of smokers and 1% of smokeless only users in Bihar, and 2% of smokers and 3% of smokeless only users in Maharashtra).
Combining each respondent type across all four states, there was no significant difference in the percentage of non-users and smokers who noticed tobacco advertising in cinemas, bars, or educational institutions. While a significantly higher percentage of non-users noticed tobacco advertising in cinemas than smokeless only users, there were no significant differences in the percentage of non-users and smokeless only users who noticed tobacco advertising in bars, or educational institutions.
Overall, these findings suggest that bans have been effective in limiting public exposure to the advertising of tobacco products in venues including cinemas, bars, and educational institutions. However, tobacco advertising continues to be visible on television, in print media, and on the radio in Bihar and Madhya Pradesh. Findings also showed that point of sale locations were the primary source of tobacco advertising in three out of four states. These results are consistent with the lack of a comprehensive ban on point of sale advertising in India, and provide further evidence to support existing research which has shown that the tobacco industry compensates for the inability to advertise in one medium by shifting to other forms that are not banned.100, 101 In order to reduce tobacco consumption, India needs to extend advertising bans to include point of sale, and prohibit industry substitution to alternate forms of advertising or promotion.102
Point of sale locations were the primary source of tobacco advertising in three out of four states. These results are consistent with the lack of a comprehensive ban on point of sale advertising in India, and provide further evidence that the tobacco industry compensates for the inability to advertise in one medium by shifting to other forms that are not banned.
87tCp India Wave 1 project report (2010-2011)

Support for Tobacco advertising Bans The TCP India Wave 1 Survey also assessed support for tobacco advertising bans among smokers, smokeless only users, and non-users. Specifically, all respondents were asked whether they supported complete bans on tobacco advertising at shops and stores, and complete bans on displays of all tobacco products.
The percentage of smokers who said that they supported complete bans on all tobacco advertisements at shops and stores “a lot” or “somewhat” was highest in Maharashtra (97%), and lowest in Bihar (75%). In the remaining two states, the vast majority of smokers also said that they supported complete bans on all tobacco advertisements at shops and stores: 92% in West Bengal and 87% in Madhya Pradesh (see Figure 51).
In West Bengal and Maharashtra, there was no significant difference in support for complete bans on tobacco advertising in shops and stores among non-users and smokers. In the remaining two states, support for complete bans on tobacco advertising in shops and stores was significantly higher among non-users than it was among smokers: Madhya Pradesh (98% of non-users vs. 87% of smokers), and Bihar (87% of non-users vs. 75% of smokers). Within each of the four states, a significantly higher percentage of non-users said that they supported complete bans on tobacco advertising in shops and stores in comparison to smokeless only users: Maharashtra (98% of non-users vs. 94% of smokeless only users), Madhya Pradesh (98% of non-users vs. 80% of smokeless only users), (97% of non-users vs. 91% of smokeless only users), and Bihar (87% of non-users vs. 77% of smokeless only users).
Figure 51. Percentage of smokers (including smoked only and mixed tobacco users), smokeless tobacco only users, and tobacco non-users who support complete bans on all tobacco advertisements at shops and stores “a lot” or “somewhat”, by state*
88tCp India Wave 1 project report (2010-2011)

There was also a high level of support for complete bans on displays of all tobacco products among smokers. In all four states, more than two-thirds of smokers said that they supported complete bans on displays of all tobacco products “a lot” or “somewhat”: 97% in Maharashtra, 93% in West Bengal, 88% in Madhya Pradesh, and 72% in Bihar (see Figure 52).
Support for complete bans on displays of all tobacco products was significantly higher among non-users than smokers in Bihar (90% of non-users vs. 72% of smokers), and Madhya Pradesh (98% of non-users vs. 88% of smokers). In Maharashtra and West Bengal, there was no significant difference in support for complete bans on displays of all tobacco products among non-users and smokers. Within each of the four states, support for complete bans on displays of all tobacco products was significantly higher among non-users in comparison to smokeless only users: Maharashtra (98% of non- users vs. 95% of smokeless only users), Madhya Pradesh (98% of non-users vs. 83% of smokeless only users), West Bengal (97% of non-users vs. 92% of smokeless only users), and Bihar (90% of non-users vs. 78% of smokeless only users).
Figure 52. Percentage of smokers (including smoked only and mixed tobacco users), smokeless tobacco only users, and tobacco non-users who support complete bans on displays of all tobacco products “a lot” or “somewhat”, by state*
There was a high level of support for complete bans on displays of all tobacco products among smokers. In all four states, more than two-thirds of smokers said that they supported complete bans on displays of all tobacco products “a lot” or “somewhat”.
89tCp India Wave 1 project report (2010-2011)

visibility of Tobacco industry Sponsorship Although tobacco industry sponsorship of national and international events or activities is permitted in India, only a minority of smokers, smokeless only users, and non-users reported noticing such events. In all four states, less than 12% of smokers noticed the following forms of event sponsorship by the tobacco industry in the last six months:
1. Sporting events that were sponsored by or connected with tobacco brands: 11% in West Bengal, 8% in Madhya Pradesh, 5% in Bihar, and 2% in Maharashtra (see Figure 53); and
2. Arts or other cultural events that were sponsored by or connected with tobacco brands: 10% in Madhya Pradesh, 8% in West Bengal, and 1% in Bihar and Maharashtra (see Figure 54).
Figure 53. Percentage of smokers (including smoked only and mixed tobacco users), smokeless tobacco only users, and tobacco non-users who have seen or heard about any sporting events that were sponsored by or connected with tobacco brands in the last six months, by state*
Within each of the four states, there was no significant difference in the percentage of non-users and smokers who noticed sporting events that were sponsored by or connected with tobacco brands. In most states, a significantly higher percentage of non-users noticed sporting events that were sponsored by or connected with tobacco brands in comparison to smokeless only users: Madhya Pradesh (12% of non-users vs. 6% of smokeless only users), Bihar (6% of non-users vs. 1% of smokeless only users), and Maharashtra (4% of non-users vs. 1% of smokeless only users). In West Bengal, there was no significant difference in the percentage of non-users and smokeless only users who noticed sporting events that were sponsored by or connected with tobacco.
90tCp India Wave 1 project report (2010-2011)

Although tobacco industry sponsorship of national and international events or activities is permitted in India, only a minority of smokers, smokeless only users, and non-users reported noticing such events.
tCp India Wave 1 project report (2010-2011)91
12% of smokers noticed sporting events or arts or cultural events that were sponsored by the tobacco industry in the last six months.
Within each of the four states, there was no significant difference in the percentage of non-users who noticed arts or other cultural events that were sponsored by or connected with tobacco brands in comparison to smokers. In Maharashtra, a significantly higher percentage of non-users (4%) noticed arts or other cultural events that were sponsored by or connected with tobacco brands than smokeless only users (2%). There were no significant differences in the percentage of non-users and smokeless only users who noticed arts or other cultural events sponsored by or connected with tobacco brands in the remaining three states (see Figure 54).
Figure 54. Percentage of smokers (including smoked only and mixed tobacco users), smokeless tobacco only users, and tobacco non-users who have seen or heard about any art events that were sponsored by or connected with tobacco brands in the last six months, by state*

visibility of Tobacco Promotion Tobacco brand stretching, and the offer of promotional gifts or discounts in conjunction with the purchase of tobacco products is banned under COTPA 2003. In most states, less than one-quarter of smokers noticed each of the following forms of tobacco promotion in the last six months (with the exception of noticing the display of a tobacco product brand name or logo on clothing or other items in Madhya Pradesh (39%)):
1. The display of a tobacco product brand name or logo on clothing or other items: 39% in Madhya Pradesh, 15% in West Bengal, 12% in Bihar, and 4% in Maharashtra (see Figure 55);
2. Free samples of tobacco products: 13% in West Bengal and Madhya Pradesh, 7% in Maharashtra, and 2% in Bihar (see Figure 56);
3. Free gifts or special discount offers on other products when buying tobacco products: 12% in Madhya Pradesh, 9% in West Bengal, 2% in Maharashtra, and 1% in Bihar (see Figure 57); and
4. Competitions linked to tobacco products: 6% in Madhya Pradesh, 4% in West Bengal, 1% in Bihar, and 0.3% in Maharashtra (see Figure 58).
Figure 55. Percentage of smokers (including smoked only and mixed tobacco users), smokeless tobacco only users, and tobacco non-users who noticed clothing or other items with a tobacco brand or logo in the last six months, by state*
92tCp India Wave 1 project report (2010-2011)

Figure 56. Percentage of smokers (including smoked only and mixed tobacco users), smokeless tobacco only users, and tobacco non-users who noticed free samples of tobacco products in the last six months, by state*
Figure 57. Percentage of smokers (including smoked only and mixed tobacco users) and smokeless tobacco only users who noticed gifts or discounts when buying tobacco products in the last six months, by state*
93tCp India Wave 1 project report (2010-2011)

Figure 58. Percentage of smokers (including smoked only and mixed tobacco users), smokeless tobacco only users, and tobacco non-users who noticed competitions linked to tobacco products in the last six months, by state*
Within each of the four states, there was no significant difference in the percentage of non-users who noticed the display of a tobacco product brand name or logo on clothing or other items in comparison to smokers. Similarly, there were no significant differences in the percentage of non-users and smokeless only users who noticed the display of a tobacco product brand name or logo on clothing or other items in Bihar, West Bengal, and Madhya Pradesh. In Maharashtra, the percentage of non-users (6%) who noticed the display of a tobacco product brand name or logo on clothing or other items was significantly higher in comparison to smokeless only users (2%).
Within each of the four states, there were no significant differences in the percentage of non-users who noticed free samples of tobacco in comparison to smokers or smokeless only users.
Finally, there were no significant differences in the percentage of non-users and smokers who noticed competitions linked to tobacco products within each of the four states. However, in most states, a significantly higher proportion of non-users noticed competitions linked to tobacco products than smokeless only users: Madhya Pradesh (13% of non-users vs. 5% of smokeless only users), Bihar (2% of non-users vs. 0.2% of smokeless only users), and Maharashtra (1% of non-users vs. 0.4% of smokeless only users). In West Bengal, there was no significant difference in the percentage of non- users and smokeless only users who noticed competitions linked to tobacco products.
noticing Smoking in Entertainment Media India is home to the world’s largest film industry and is the first country to implement strong legislation to protect youth from exposure to tobacco imagery and smoking in movies and on television. As of November 14, 2011, the display of tobacco products or its use was prohibited under amendments to COPTA 2003, and existing films displaying tobacco products or its use were required to have anti-tobacco spots of minimum 30 seconds and an audio-visual disclaimer of minimum 20 seconds on the ill-effects of tobacco use at the beginning and middle of the film. In addition, the film is also required to display an anti-tobacco warning message along the foot of the screen during every scene containing tobacco use.103
94tCp India Wave 1 project report (2010-2011)

The TCP India Wave 1 Survey was completed prior to the implementation of this legislation, providing evidence that tobacco use was highly visible in the entertainment media before the ban. The percentage of smokers who reported that they “often” noticed people using tobacco in the entertainment media in the last six months was significantly higher in Maharashtra (53%) compared to Madhya Pradesh (21%) (see Figure 59). There were no other significant differences between states in the percentage of smokers who noticed people using tobacco in the entertainment media.
There were no significant differences in the percentage of non-users and smokers who noticed people using tobacco in the entertainment media in Maharashtra and Bihar. In contrast, significantly more non-users noticed people smoking in the entertainment media than smokers in West Bengal (45% of non-users vs. 30% of smokers), and Madhya Pradesh (35% of non-users vs. 21% of smokers). Similarly, while there were no significant differences in the percentage of non-users and smokeless only users who noticed people using tobacco in the entertainment media in Maharashtra and Bihar, significantly more non-users noticed people smoking in the entertainment media than smokeless only users in West Bengal (45% of non-users vs. 23% of smokeless only users) and Madhya Pradesh (35% of non-users vs. 20% of smokeless only users).
The high presence of tobacco use in the entertainment media prior to the implementation of India’s ban on tobacco use on television and in the movies is of concern as existing research has consistently shown that exposure to smoking in the movies is associated with the uptake of smoking among youth.104, 105, 106 It is estimated that adolescents who receive the most exposure to onscreen smoking are about twice as likely to begin smoking in comparison to their counterparts who receive the least exposure.107 Indeed, the 2012 U.S. Surgeon General’s Report on Preventing Tobacco Use Among Youth and Young Adults concluded that there is now sufficient evidence for a causal relationship between depictions of smoking in the movies and smoking initiation among youth.108 The TCP India Wave 2 Survey will assess the effectiveness of COTPA regulations in reducing public exposure to tobacco use on television and in the movies.
Figure 59. Percentage of smokers (including smoked only and mixed tobacco users), smokeless tobacco only users, and tobacco non-users who “often” noticed people using tobacco in entertainment media, by state*
95tCp India Wave 1 project report (2010-2011)
The high presence of tobacco use in the entertainment media prior to the implementation of India’s ban on tobacco use on television and in the movies is of concern as existing research has consistently shown that exposure to smoking in the movies is associated with the uptake of smoking among youth.
KEy FinDinGS• Although COTPA 2003 regulations have been effective in restricting advertising in cinemas, bars,
and educational institutions, there is evidence of a lack of enforcement of advertising bans on television and radio, in newspapers and magazines, and in public transportation vehicles or stations. In the absence of a complete ban on advertising at point of sale, the industry has continued to focus its marketing efforts in shops and store where tobacco is sold.
• In three out of four states, shop windows or the inside of shops were the most common source of tobacco advertising, whereas educational buildings, bars, and cinemas were the least common sources of tobacco advertising.
• Exposure to tobacco advertising was highest in Maharashtra, where more than half (55%) of smokers and non-users noticed advertising and pictures of tobacco use “often” or “once in a while” in the last six months.
• In general, there were no significant differences in the percentage of non-users who noticed the advertisement of tobacco products in mass media and in key public venues in comparison to smokers or smokeless only users.
• There was very high support for complete bans on tobacco advertising in shops and stores, and displays of all tobacco products among smokers, smokeless only users, and non-users in all four states.
• A minority of tobacco users and non-users in each of the four states reported noticing the promotion of tobacco products through tobacco industry sponsorship of sporting, arts, or other cultural events, competitions linked to tobacco products, free samples of tobacco products, and free gifts or special discount offers with the purchase of tobacco products. With a few exceptions in West Bengal and Maharashtra, there were no significant differences in the percentage of non-users who noticed these forms of tobacco promotion and sponsorship in comparison to smokers or smokeless only users.
• Less than one-quarter of tobacco users and non-users noticed clothing or items with a tobacco brand name or logo in Bihar, West Bengal, and Maharashtra. However, tobacco brand stretching was still prominent in Madhya Pradesh, where at least one-third of smokers (39%), smokeless only users (33%), and non-users (35%) noticed clothing or items with a tobacco brand name or logo.
• Measures of exposure to tobacco use in the entertainment media prior to India’s strong legislation banning tobacco use on television and in movies, indicate that tobacco use was highly visible – 21% to 53% of smokers, 20% to 50% of smokeless only users, and 35% to 56% of non-users noticed depictions of tobacco use in the entertainment media.
96tCp India Wave 1 project report (2010-2011)

EDuCaTion, CoMMuniCaTion, anD PuBliC aWaREnESS
Article 12 of the FCTC obligates Parties to promote and strengthen public awareness of tobacco control issues using all available communication tools. FCTC Guidelines on the implementation of Article 12 recommend that Parties provide broad access to different sources of information that increase public awareness of the health risks of tobacco use and exposure to second-hand smoke, encourage cessation among current tobacco users, prevent smoking initiation among non-users, and support the development of tobacco-free environments.
In 2007-2008, the Government of India launched the National Tobacco Control Programme (NTCP), which allocated an annual budget of about $5 million USD towards anti-tobacco mass media campaigns designed to raise public awareness on the harmful effects of smoked and smokeless tobacco, and exposure to second-hand smoke. This section presents TCP India Wave 1 Survey (2010-2011) findings on awareness of anti-tobacco campaigns among smokers (smoked only and mixed tobacco), smokeless tobacco only users, and tobacco non-users. The Survey also assessed the influence of anti-tobacco campaigns on perceived social norms about tobacco use and likelihood of quitting among smokers and smokeless only users. The findings below present results among adults aged 15 years and older surveyed in selected urban cities and surrounding rural districts of the following four states: Bihar (Patna), West Bengal (Kolkata), Madhya Pradesh (Indore), and Maharashtra (Mumbai).
Sources of information on the Harms of Tobacco use The TCP India Wave 1 Survey asked smokers, smokeless only users, and non-users whether they had noticed advertising or information about the dangers of smoked and smokeless tobacco use, or that encouraged quitting in the last six months across a variety of media and venues. The findings are presented for each respondent type by state in Figures 60 to 63.
Tobacco Packages, Television, and Public Transportation Vehicles or Stations
In all four states, more than half of smokers identified the following as the most common sources of anti-tobacco information (with the exception of public transportation vehicles or stations in Madhya Pradesh (34%)):
1. Tobacco packages: 86% in Maharashtra, 78% in Bihar, 69% in West Bengal, and 68% in Madhya Pradesh;
2. Television: 79% in Madhya Pradesh, 75% in Bihar, 60% in West Bengal and Maharashtra; and
3. Public transportation vehicles or stations: 66% in Bihar, 55% in West Bengal, 53% in Maharashtra, and 34% in Madhya Pradesh.
97tCp India Wave 1 project report (2010-2011)
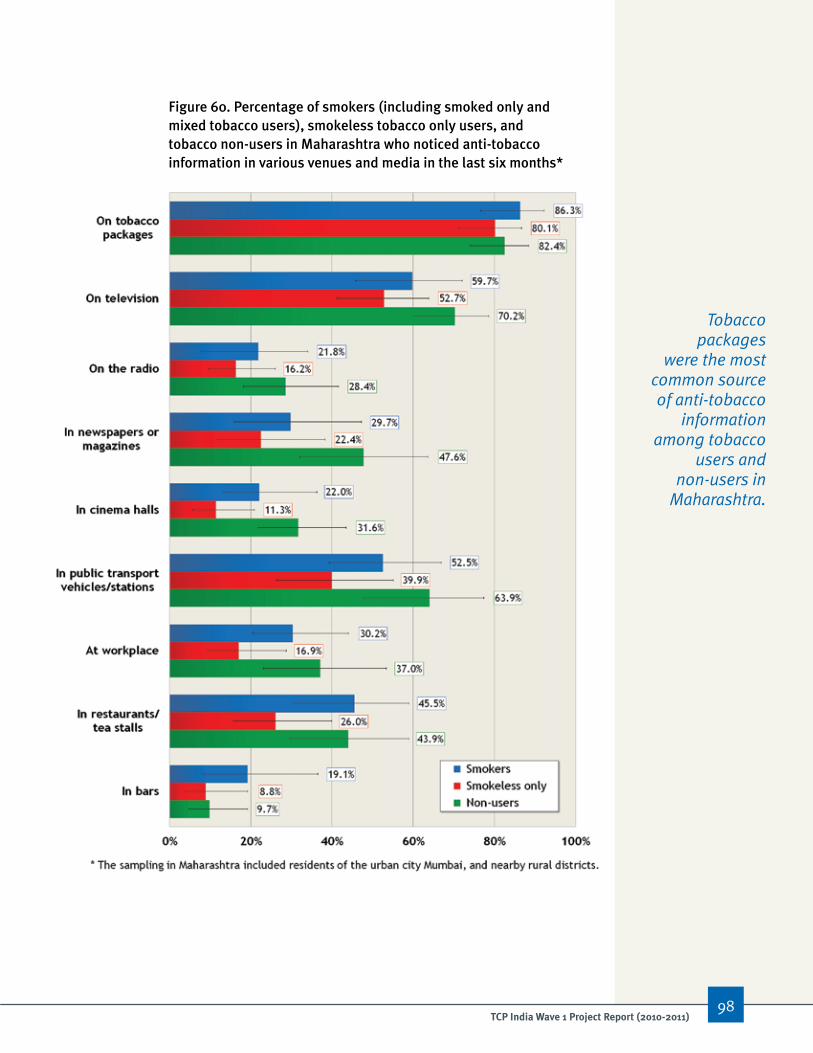
Figure 60. Percentage of smokers (including smoked only and mixed tobacco users), smokeless tobacco only users, and tobacco non-users in Maharashtra who noticed anti-tobacco information in various venues and media in the last six months*
Tobacco packages
were the most common source of anti-tobacco
information among tobacco
users and non-users in
Maharashtra.
98tCp India Wave 1 project report (2010-2011)

Figure 61. Percentage of smokers (including smoked only and mixed tobacco users), smokeless tobacco only users, and tobacco non-users in Bihar who noticed anti-tobacco information in various venues and media in the last six months*
In addition to tobacco packages, television was an important source of anti-tobacco information for the majority of respondents in Bihar. Workplaces were also a source of information for more than half of smokers and smokeless users.
99tCp India Wave 1 project report (2010-2011)

Figure 62. Percentage of smokers (including smoked only and mixed tobacco users), smokeless tobacco only users, and tobacco non-users in West Bengal who noticed anti-tobacco information in various venues and media in the last six months*
Tobacco packages and
television were key sources of
anti-tobacco information for respondents in
West Bengal.
100tCp India Wave 1 project report (2010-2011)

Figure 63. Percentage of smokers (including smoked only and mixed tobacco users), smokeless tobacco only users, and tobacco non-users in Madhya Pradesh who noticed anti-tobacco information in various venues and media in the last six months*
The majority of respondents in Madhya Pradesh noticed anti-smoking information on television in the last six months.
101tCp India Wave 1 project report (2010-2011)

Figure 64. Percentage of smokers (including smoked only and mixed tobacco users), smokeless tobacco only users, and tobacco non-users in the combined sample who noticed anti-tobacco information in various venues and media in the last six months*
Combining each respondent type across all four states, there were no significant differences in the percentage of non-users who noticed anti-tobacco information on tobacco packages in comparison to smokers or smokeless only users. The percentage of non-users (75%) who noticed anti-tobacco information on television was significantly higher in comparison to smokers (63%), and smokeless only users (63%) (see Figure 64). There was no significant difference in the percentage of non-users and smokers who noticed anti-tobacco information on public transportation vehicles or stations, but a significantly higher percentage of non-users noticed anti-tobacco information in this location than smokeless only users (60% of non-users vs. 50% of smokeless only users).
102tCp India Wave 1 project report (2010-2011)

Newspapers/Magazines and Radio
Smokers in each of the four states also noticed anti-tobacco information in the following sources:
1. Newspapers and magazines: 67% in Bihar, 45% in West Bengal, 42% in Madhya Pradesh, and 30% in Maharashtra; and
2. Radio: 55% in Bihar, 45% in Madhya Pradesh, 28% in West Bengal, and 22% in Maharashtra.
Combining each respondent type across all four states, there was no significant difference in the percentage of non-users and smokers who noticed anti-tobacco information in newspapers and magazines, but a significantly higher percentage of non-users (52%) noticed anti-tobacco information in this form of mass media in comparison to smokeless only users (37%). There were no significant differences in the percentage of non-users who noticed anti-tobacco information on the radio in comparison to smokers or smokeless users.
Cinemas
In Bihar, more than half of smokers (55%) noticed anti-tobacco information in cinemas. In the remaining three states, less than one-third of smokers noticed anti-tobacco information in cinemas: Madhya Pradesh (27%), Maharashtra (22%), and West Bengal (18%). Combining each respondent type across all four states, the percentage of non-users (31%) who noticed anti-tobacco information in cinemas was not significantly different in comparison to smokers (24%), but was significantly higher in comparison to smokeless only users (21%).
Workplaces
The percentage of smokers who noticed anti-tobacco information in workplaces ranged from 51% in Bihar, 42% in West Bengal, and 30% in Maharashtra, to 18% in Madhya Pradesh. Bihar had a significantly higher percentage of smokers who noticed anti-tobacco information (51%) compared to Madhya Pradesh (18%). There were no other significant differences between states. Combining each respondent type across all four states, there were no significant differences in the percentage of non-users who noticed anti-tobacco information in workplaces in comparison to smokers or smokeless only users.
A bidi worker hand-rolling bidis in India.
103tCp India Wave 1 project report (2010-2011)

Restaurants/Tea stalls
About one-third to half of smokers in all four states noticed anti-tobacco information in restaurants/tea stalls: Maharashtra (46%), Bihar (37%), and West Bengal (37%), and Madhya Pradesh (29%). Combining each respondent type across all four states, there were no significant differences in the percentage of non-users who noticed anti-tobacco information in restaurants or tea stalls in comparison to smokers. However, a significantly higher percentage of non-users (38%) noticed anti-tobacco information in restaurants or tea stalls than smokeless only users (28%).
Bars
Bars were identified by smokers in each of the four states as the least common source of anti-tobacco information. In all four states, less than one-quarter of smokers reported noticing anti-tobacco information in bars: 19% in Maharashtra, 9% in Bihar, 8% in West Bengal, and 5% in Madhya Pradesh. Combining each respondent type across all four states, there were no significant differences in the percentage of non-users who noticed anti-tobacco information in bars in comparison to smokers or smokeless only users.
In summary, among smokers, tobacco packages were the primary source of anti-tobacco information followed by television in all states except Madhya Pradesh, where television was the most common information source followed by tobacco packages. Among smokeless only users and non-users, television was the primary source of anti-tobacco information in all states except Maharashtra, where tobacco packages were a more common source than television. Tobacco packages were also a highly noticed source of anti-tobacco information among smokeless only users and non-users in the three other states. These findings highlight the utility of anti-tobacco pictorial health warning labels on tobacco packaging as a cost-effective public education strategy for tobacco users and non-users in India. Mass media campaigns have also been effective in educating tobacco users and non-users, as indicated by results which showed that other important sources of anti-tobacco information included newspapers and magazines, radio, and public transportation vehicles or stations. Public venues including cinemas and workplaces were also common sources of anti-tobacco information in Bihar. In all four states, bars were the least common source of anti-tobacco information. In order to promote public awareness on the dangers of tobacco use and the benefits of cessation, India needs to continue to implement anti-tobacco campaigns that have broad reach on a regular basis.
influence of anti-tobacco Campaigns on Perceived norms about Tobacco use and the likelihood of QuittingOne of the primary objectives of anti-tobacco campaigns is to make tobacco use less normative, which may then facilitate quitting among tobacco users.109-111 The TCP India Wave 1 Survey asked smokers and smokeless only users whether advertising about the dangers of smoked and smokeless tobacco use or encouraging quitting has made tobacco use “a lot” less socially acceptable, “a little” less socially acceptable, or “not at all” less socially acceptable. In Maharashtra, virtually no smokers (1%) said that anti-tobacco advertising has made tobacco use “a lot” less socially acceptable (see Figure 65). About a third (35%) said that anti-tobacco advertising has made tobacco use “a little” less socially acceptable; and 63% said that the advertising has made tobacco use “not at all” less socially acceptable. In contrast, a significantly higher percentage of smokers in the remaining three states said that anti-tobacco advertising has made tobacco use “a lot” less socially acceptable: West Bengal (25%), Bihar (21%), and Madhya Pradesh (12%).
104tCp India Wave 1 project report (2010-2011)

The percentage of smokers who reported that anti-tobacco advertising has made tobacco use “a little” less socially acceptable ranged from about one-quarter (24%) in Madhya Pradesh, to one-third (30%) in Bihar, and to almost half (47%) in West Bengal. Those who reported that the advertisements made tobacco use “not at all” less socially acceptable ranged from 28% of smokers in West Bengal, and 48% in Bihar, to 64% in Madhya Pradesh. The percentage of smokeless only users who said that anti-tobacco advertising has made tobacco use “a lot” less socially acceptable was highest in Bihar (38%) and West Bengal (23%), followed by Madhya Pradesh (15%), and lowest in Maharashtra (3%). Between one-third (in West Bengal) to almost two-thirds (in Maharashtra) of smokeless only users reported that the advertisements made tobacco use “not at all” less socially acceptable (64% in Maharashtra, 39% in Bihar, 38% in Madhya Pradesh, and 33% in West Bengal ).
Figure 65. Percentage of smokers (including smoked only and mixed tobacco users) and smokeless tobacco only users among those who noticed anti-tobacco advertisements/information who reported that the advertisements made tobacco “a lot” less socially acceptable, by state*
A significantly lower percentage of smokers (21%) said that anti-tobacco advertising has made tobacco use “a lot” less socially acceptable in comparison to smokeless only users (38%) in Bihar. Within each of the remaining three states, there were no significant differences in the percentage of smokers and smokeless only users who said that anti-tobacco advertising has made tobacco use “a lot” less socially acceptable.
Smokers and smokeless only users were also asked whether anti-tobacco advertising affected the likelihood that they would quit using tobacco. The percentage of smokers who said that anti-tobacco advertising had made them “more likely” to quit using tobacco (as opposed to “less likely” or “no difference”) was highest in Maharashtra (27%), followed by Bihar (15%), and lowest in West Bengal (11%) and Madhya Pradesh (10%) (see Figure 66). Anti-tobacco advertising made “no difference” for more than half of smokers in Madhya Pradesh (54%), Maharashtra (56%), and West Bengal (57%), and for more than three-quarters (78%) of smokers in Bihar. The percentage of smokeless only users who said that anti-tobacco advertising had made them “more likely” to quit using tobacco was highest in Maharashtra (25%), followed by Madhya Pradesh (17%) and Bihar (15%), and lowest in West Bengal (8%). Anti-tobacco advertising made “no difference” for 80% of smokeless only users in Bihar, 60% in West Bengal, 58% in Maharashtra, and 46% of smokeless only users in Madhya Pradesh.
105tCp India Wave 1 project report (2010-2011)

Figure 66. Percentage of smokers (including smoked only and mixed tobacco users) and smokeless tobacco only users among those who noticed anti-tobacco advertisements/information who reported that the advertisements made them “more likely” to quit, by state*
There were no significant differences in the percentage of smokers and smokeless only users who said that anti-tobacco advertising had made them “more likely” to quit using tobacco in Maharashtra, Bihar, and West Bengal. In Madhya Pradesh, a significantly lower percentage of smokers (10%) said that anti-tobacco advertising had made them “more likely” to quit using tobacco in comparison to smokeless only users (17%).
opinions about the Harms of Tobacco use on HealthSince 2007, the Government of India has partnered with various public health organizations to launch a number of anti-tobacco mass media campaigns to raise public awareness on the harmful effects of tobacco use. Findings from the TCP India Wave 1 Survey showed a high level of awareness on the harms of tobacco use on health among smokers and smokeless only users. Specifically, results indicated that more than 84% of smokers and more than 94% of smokeless only users in all four states were aware that smoked tobacco is “not good for your health”. Virtually no smokers or smokeless only users in each of the four states thought that smoking cigarettes or bidis is “good for their health”: Maharashtra (5% of smokers and 2% of smokeless only users), Madhya Pradesh (4% of smokers and 1% of smokeless only users), West Bengal (2% of smokers and 1% of smokeless only users), and Bihar (1% of smokers and smokeless only users). Similarly, more than 86% of smokers and more than 81% of smokeless only users in all four states were aware that smokeless tobacco is “not good for your health”. A minority (less than 9%) of smokers and smokeless only users in all four states thought that using smokeless tobacco is “good for their health”: Madhya Pradesh (8% of smokers and 6% of smokeless only users), Maharashtra (5% of smokers and smokeless only users), Bihar (3% of smokers and 8% of smokeless only users), and West Bengal (1% of smokers and 2% of smokeless only users).
The TCP India Wave 1 Survey also assessed tobacco users’ knowledge of 10 specific health effects caused by smoking, as well as four specific health effects caused by smokeless tobacco use. These results are presented in the Health Warning Labels findings section of this report.
106tCp India Wave 1 project report (2010-2011)

KEy FinDinGS• Tobacco packages were the most common source of anti-tobacco information for smokers in
Maharashtra, Bihar, and West Bengal; and the second most common source of anti-tobacco information for smokers in Madhya Pradesh and for smokeless only users and non-users in Bihar, West Bengal, and Madhya Pradesh.
• Television was the most common source of anti-tobacco information for smokers in Madhya Pradesh; smokeless only users and non-users in Bihar, West Bengal, and Madhya Pradesh; and the second most common source of anti-tobacco information for smokers in Maharashtra, Bihar, and West Bengal.
• Public transportation vehicles or stations were also a prominent source of anti-tobacco information, while bars were the least common source of anti-tobacco information across the four states.
• More than half of smokers in Bihar also identified newspapers and magazines (67%), radio (55%), cinemas (55%), and workplaces (51%) as sources of anti-tobacco information.
• The percentage of smokers who said that anti-tobacco advertising has made tobacco use less socially acceptable was highest in West Bengal (25%) and lowest in Maharashtra (1%).
• The percentage of smokeless only users who said that anti-tobacco advertising has made tobacco use less socially acceptable was highest in Bihar (38%) and lowest in Maharashtra (3%).
• In all four states, 10% to 27% of smokers, and 8% to 25% of smokeless only users said that anti-tobacco advertising has made them “more likely” to quit using tobacco.
• In all four states, the majority of tobacco users were aware that using tobacco is “not good for their health”— less than 9% of smokers and smokeless only users thought that smoking cigarettes or bidis, or that using smokeless tobacco is “good for their health”.
107tCp India Wave 1 project report (2010-2011)

108tCp India Wave 1 project report (2010-2011)
ToBaCCo PRiCE anD TaxaTion
Article 6 of the FCTC obligates Parties to adopt taxation and pricing measures in order to reduce tobacco consumption. There is overwhelming evidence indicating that increasing taxes and prices on tobacco products is the single most effective way to reduce tobacco use.54 In India, tobacco is consumed in various smoked and smokeless forms, and the taxes that are imposed on these products vary by product type, product characteristics (e.g., length, filter), producer characteristics (e.g., small vs. large bidi producers, and by state. Overall, total tobacco taxes in India fall far below the recommended range of 66% to 80% set out by the World Bank.113 At the time of the TCP India Wave 1 Survey (2010-2011), taxes accounted for approximately 38% of the retail price of cigarettes and 9% of the retail price of bidis.60, 61 The majority of smokeless tobacco products are sold in the market without any tax component in the retail price.
The TCP India Wave 1 Survey asked all current cigarette smokers, bidi smokers, and smokeless tobacco usersiii where they last purchased cigarettes, bidis, and smokeless tobacco for themselves. The Survey also collected information on price paid for last tobacco purchase, and included measures to assess the importance of price in brand selection and as a reason to quit. In addition, the Survey included several measures to assess perceptions of the price of cigarettes, bidis, and smokeless tobacco among current users of each product.iv The findings below present results among adults aged 15 years and older surveyed in selected urban cities and surrounding rural districts of the following four states: Bihar (Patna), West Bengal (Kolkata), Madhya Pradesh (Indore), and Maharashtra (Mumbai).
Source of last Tobacco Product Purchase
Cigarettes
In all four states, local stores, street vendors, and tobacco shops were the three most common sources for the last purchase of cigarettes. All other locations were identified by less than 7% of current cigarette smokers in each of the four states as sources of last cigarette purchase.
In West Bengal, nearly 4 out of 5 (79%) current cigarette smokers reported that their last purchase of cigarettes for themselves was made at local stores, and street vendors were identified as the second most frequent source of last cigarette purchase (9%) (see Figure 67).
Local stores were the most common source of last cigarette purchase in West Bengal, Bihar, and Madhya Pradesh. Street vendors were the most common source of last purchase in Maharashtra.
iii. Current cigarette smokers includes exclusive cigarette smokers and smokers of any smoked tobacco product; current bidi smokers includes exclusive bidi smokers and smokers of any smoked tobacco product; and smokeless tobacco users include smokeless only users and mixed tobacco users.
iv. For purposes of statistical comparison, the analyses of these results only included exclusive cigarette smokers, exclusive bidi smokers, and smokeless tobacco only users.

Figure 67. Source of last purchase of bidis, cigarettes, or smokeless tobacco among current users of each tobacco product in West Bengal*
109tCp India Wave 1 project report (2010-2011)

Figure 68. Source of last purchase of bidis, cigarettes, or smokeless tobacco among current users of each tobacco product in Bihar*
In Bihar, local stores were the
most frequent source of
last purchase for current
users of bidis, cigarettes, and
smokeless tobacco.
110tCp India Wave 1 project report (2010-2011)

Figure 69. Source of last purchase of bidis, cigarettes, or smokeless tobacco among current users of each tobacco product in Madhya Pradesh*
In Madhya Pradesh, local stores were also identified as the most frequent source of last bidi, cigarette, and smokeless tobacco purchase, followed by tobacco shops.
111tCp India Wave 1 project report (2010-2011)
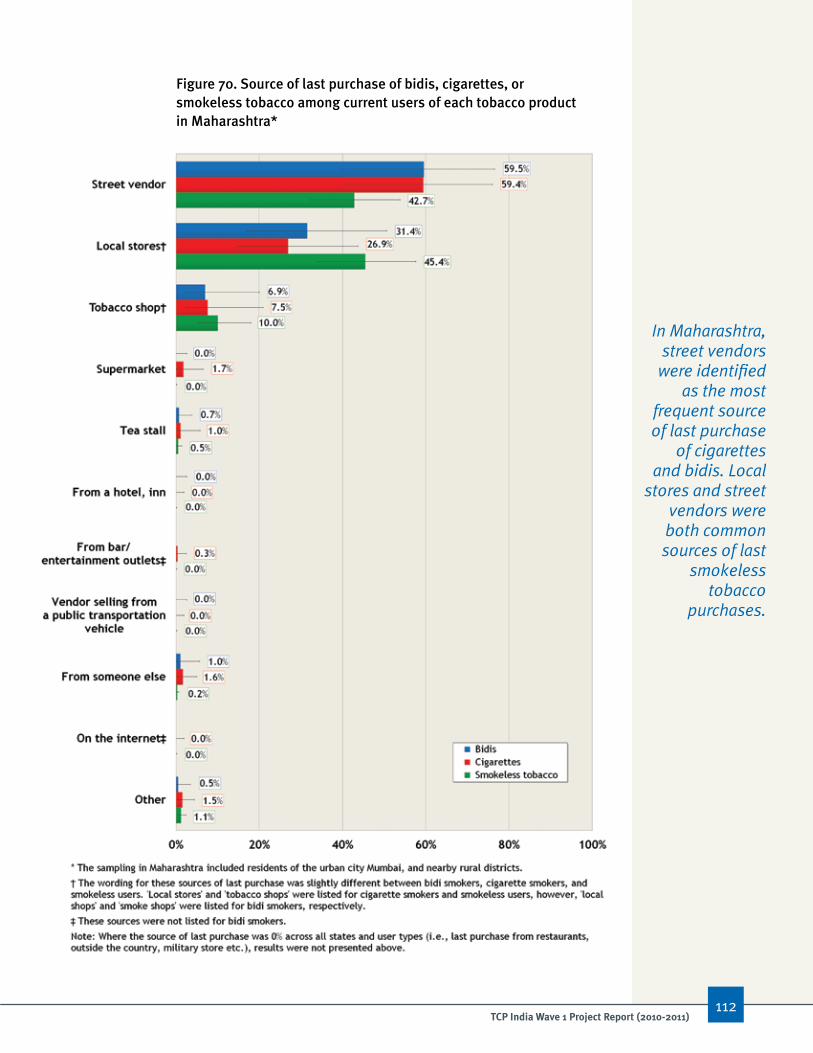
Figure 70. Source of last purchase of bidis, cigarettes, or smokeless tobacco among current users of each tobacco product in Maharashtra*
In Maharashtra, street vendors
were identified as the most
frequent source of last purchase
of cigarettes and bidis. Local
stores and street vendors were both common sources of last
smokeless tobacco
purchases.
112tCp India Wave 1 project report (2010-2011)

Bidis
Local shops, smoke shops, and street vendors were also the most common locations for the last purchase of bidis in each of the four states. In West Bengal, more than 4 out of 5 (83%) current bidi smokers reported that their last purchase of bidis for themselves was made at local shops, and street vendors were the second most frequent source of last bidi purchase (8%). In Bihar, local shops were also the most frequent source of last bidi purchase (76%), followed by smoke shops (21%). In Madhya Pradesh, local shops were the most frequent source of last bidi purchase (68%), followed by smoke shops (19%), and street vendors (7%). In Maharashtra, street vendors were the most common source of last bidi purchase (60%), followed by local shops (31%), and smoke shops (7%). All other locations were identified by less than 6% of current bidi smokers in all four states as locations for last bidi purchase.
In all four states, local stores were identified by current smokeless users as the most frequent source for their last purchase of any smokeless tobacco product (75% in Bihar, 71% in West Bengal, 61% in Madhya Pradesh, and 45% in Maharashtra). Tobacco shops were the second most frequent source of last smokeless tobacco product purchase in Madhya Pradesh (26%), Bihar (20%), and West Bengal (12%). Street vendors were the second most frequent source of last smokeless tobacco product purchase in Maharashtra (43%), and the third most frequent source of last smokeless tobacco product purchase in West Bengal (10%), and Madhya Pradesh (7%). All other locations were identified by less than 6% of current smokeless users in all four states as locations for their last purchase of any smokeless tobacco product.
average Price Paid for last Tobacco Product PurchaseData on the amount of money in Indian rupees (`) that was spent on the last purchase of cigarettes, bidis,v and smokeless tobacco was collected from all current tobacco users in each of the four states. This data was then used to calculate the average expenditure per stick by all current cigarette smokers, and all current bidi smokers; and the average expenditure per pouch pack by all current smokeless users.
Figure 71. average price paid for bidi and cigarette (per stick) in rupees (`) for last purchase, by state*†‡
In all four states, the average price per stick was higher for cigarettes than bidis: Bihar (`3.30 per cigarette vs. `0.20 per bidi), Madhya Pradesh (`3.30 per cigarette vs. `0.50 per bidi), Maharashtra (`3.30 per cigarette vs. `0.50 per bidi), and West Bengal (`2.60 per cigarette vs. `0.40 per bidi) (see Figure 71).
Bidis are very inexpensive in India, and under-taxed compared to cigarettes.
v. Including loose (single) bidis and cigarettes, as well as bidis and cigarettes by the pack
113tCp India Wave 1 project report (2010-2011)

The average price paid per cigarette was significantly higher in the urban cities of Patna (Bihar) and Kolkata (West Bengal) compared to their surrounding rural districts (see Figure 72). There were no significant urban-rural differences in the average price paid per cigarette in Indore (Madhya Pradesh) and Mumbai (Maharashtra). The average price paid for a stick of bidi was also significantly higher in the city of Patna (Bihar) compared to the surrounding rural districts. There were no significant urban-rural differences in Kolkata (West Bengal), Indore (Madhya Pradesh), and Mumbai (Maharashtra).
The average price paid per pouch of smokeless tobacco at last purchase ranged from `3.60 to `7.30 as follows: `7.30 in Bihar, `5.40 in Maharashtra, `4.30 in West Bengal, and `3.60 in Madhya Pradesh (see Figure 73).
There were no significant urban-rural differences in the average price paid for a pouch pack of smokeless tobacco in all four states.
These results provide further support for existing research which has shown that bidis are very inexpensive in India, and under-taxed compared to cigarettes.66,112 In light of existing evidence that bidis are also equally or more harmful as cigarettes per stick113, 114 India needs to implement a substantial increase in bidi taxes (for both handmade or machine-made bidis), in addition to increasing cigarette taxes.
Figure 72. average price paid for bidi and cigarette (per stick) in rupees (`) for last purchase in urban cities and surrounding rural districts, by state*†‡
Figure 73. average price paid per pouch pack* of smokeless tobacco in rupees (`)for last purchase, by state†‡
114tCp India Wave 1 project report (2010-2011)

Price and Brand Choice
Cigarettes
The percentage of all current cigarette smokers who stated that part of their decision to smoke their current brand was based on price ranged from 49% in Maharashtra, 44% in Bihar, 35% in West Bengal, to 18% in Madhya Pradesh (see Figure 74). In all states, “the price” was not the most important reason for choosing their cigarette brand (see Figure 75).
In all four states, more than half of cigarette smokers ranked “how they taste” as a reason for choosing their current brand: 77% in Maharashtra, 73% in Bihar, 62% in Madhya Pradesh, and 57% in West Bengal. In three of four states, more than half of cigarette smokers reported “high quality” as a reason for choosing their current brand: 73% in Bihar, 52% in Maharashtra, 51% in Madhya Pradesh, and 43% in West Bengal. There was a wide range (from about one-third in West Bengal to almost three-quarters in Bihar) in the percentage of smokers who said “it is a popular brand” was a reason for brand choice: 70% in Bihar, 53% in Maharashtra, 40% in Madhya Pradesh, and 35% in West Bengal. There was also a wide range (from about a quarter in West Bengal to just over half in Maharashtra) in the percentage of smokers who said that they chose their current brand “because my friends smoked this brand”: 57% in Maharashtra, 56% in Bihar, 46% in Madhya Pradesh, and 27% in West Bengal.
Figure 74. Percentage of current bidi smokers, cigarette smokers, and smokeless tobacco users who reported that their respective bidi/cigarette/smokeless tobacco brand was chosen for the price, by state*
A less popular reason was because “this brand is less harmful to my health” which was ranked by less than half of smokers in all four states as a reason for choosing their regular brand: 46% in Maharashtra, 37% in Bihar, 21% in Madhya Pradesh, and 19% in West Bengal.
“Pack design” was identified by cigarette smokers in each of the four states as the least important reason for their cigarette brand choice: 39% in Maharashtra, 11% in Bihar, 5% in West Bengal, and 2% in Madhya Pradesh.
115tCp India Wave 1 project report (2010-2011)

Figure 75. Reasons for choosing their regular brand of cigarettes among current cigarette smokers, by state*
Bidis
Nearly all current bidi smokers in Bihar (97%), and just over half of bidi smokers in Maharashtra (54%) said that “the price” was part of their decision to smoke their current brand (see Figure 76). In the remaining two states, less than one-quarter of bidi smokers stated that their current brand choice was influenced in part by “the price”: 22% in West Bengal, and 13% in Madhya Pradesh. In Bihar, the following reasons were identified by at least 90% of smokers as reasons for choosing their regular brand: “the price” (97%), “how they taste” (90%), “it is a popular brand” (90%), “high quality” (96%), and because “this brand is less harmful to my health” (97%). Only 15% of bidi smokers in Bihar said that they chose their brand “because their friends smoked the brand”.
116tCp India Wave 1 project report (2010-2011)

In the remaining three states, “how they taste” was a reason for brand choice for more than half of bidi smokers: 80% in Maharashtra, 56% in Madhya Pradesh, and 55% in West Bengal. Less than two-thirds of bidi smokers cited the following as reasons for choosing their current brand: “it is a popular brand” (60% in West Bengal, 46% in Maharashtra, and 28% in Madhya Pradesh), and because “my friends smoked the brand” (58% in Maharashtra, 41% in Madhya Pradesh, and 28% in West Bengal). Less than half of bidi smokers said that the following were reasons for their brand choice: “high quality” (47% in Maharashtra, 44% in West Bengal, and 36% in Madhya Pradesh), and “because the brand is less harmful to my health” (48% in Maharashtra, 19% in Madhya Pradesh, and 13% in West Bengal).
Figure 76. Reasons for choosing their regular brand of bidis among current bidi smokers, by state*
117tCp India Wave 1 project report (2010-2011)

Figure 77. Reasons for choosing their regular brand of smokeless tobacco among current smokeless tobacco users, by state*
Smokeless Tobacco
More than one-third of current smokeless users said that “the price” influenced their decision to choose their current brand in Bihar (46%) and Maharashtra (36%) (see Figure 77). In the remaining two states, less than one-quarter of smokeless users stated that their smokeless brand choice was due in part to “the price”: 20% in West Bengal, and 9% in Madhya Pradesh. More than 60% of smokers in all four states said that “how they taste” was a reason for choosing their current smokeless tobacco brand: 78% in Bihar and Maharashtra, 63% in Madhya Pradesh, and 62% in West Bengal. While 85% of smokeless users cited “it is a popular brand” as reason for their brand choice in Bihar, this reason was identified by less than half of smokeless users in the three other states as a reason for their brand choice: 42% in West Bengal, 33% in Maharashtra, and 19% in Madhya Pradesh. Almost two-thirds (65%) of current smokeless users in Bihar chose their current brand because “it is less harmful to my health”, while less than half identified this as a reason in the other three states: 38% in Maharashtra, 17% in Madhya Pradesh, and 12% in West Bengal. In all four states, approximately one-third to about half of current smokeless users chose their current brand because “my friends used this brand”: 53% in Bihar, 48% in Madhya Pradesh, 47% in Maharashtra, and 31% in West Bengal.
Smokeless users in each of the four states identified “pack design” as the least important reason for their smokeless brand choice: 23% in Maharashtra, 4% in Bihar, and 2% in Madhya Pradesh and West Bengal.
Price was among the least important reasons for current brand choice among smokeless users in all four states.
118tCp India Wave 1 project report (2010-2011)

In summary, price was identified by less than half of cigarette smokers in each of the four states as an important reason that influenced their decision to smoke their current cigarette brand. In all four states, cigarette smokers identified taste, high quality, and popularity as the most important reasons for their cigarette brand choice, and tobacco packs as the least important reason for their cigarette brand choice. Similarly, price was also identified by less than half of smokeless users in each of the four states as an important reason that influenced their decision to use their current smokeless brand. In all four states, smokeless users identified taste as one of the most important reasons for their smokeless brand choice, while tobacco packs were the least important reason for their smokeless brand choice. Other reasons that smokeless users said were important for their smokeless brand choice included popularity in Bihar, high quality in West Bengal, and because their friends used the brand in Madhya Pradesh and Maharashtra. In contrast, price was one of the most important reasons for bidi brand choice in Bihar, where nearly all bidi smokers (97%) said that price influenced their decision to smoke their current bidi brand. Price was also identified by more than half (54%) of bidi smokers in Maharashtra as an important reason for their bidi brand choice. Other important reasons for bidi brand choice included taste, popularity, and because their friends smoked the brand in West Bengal, Madhya Pradesh, and Maharashtra.
Concern about Money Spent on Tobacco Products The TCP India Wave 1 Survey asked all current tobacco users whether they spend too much money on cigarettes, bidis, and smokeless tobacco. In order to compare perceptions of the price of each product, this section presents findings from exclusive cigarette smokers, exclusive bidi smokers, and smokeless only users.
In all four states, between about one- to two-thirds of exclusive cigarette smokers and exclusive bidi smokers “strongly agreed” or “agreed” that they spend too much money on smoked tobacco: Bihar (49% of exclusive cigarette smokers, 59% of exclusive bidi smokers), West Bengal (43% of exclusive cigarette smokers, 61% of exclusive bidi smokers), Madhya Pradesh (39% of exclusive cigarette smokers, 33% of exclusive bidi smokers), and Maharashtra (33% of exclusive cigarette smokers, 35% of exclusive bidi smokers) (see Figure 78). Between about one-quarter to half of smokeless only users in all four states also “strongly agreed” or “agreed” that they spend too much money on smokeless tobacco: Bihar (54%), West Bengal (48%), Madhya Pradesh (38%), and Maharashtra (26%).
Figure 78. Percentage of exclusive bidi smokers, exclusive cigarette smokers, and smokeless tobacco only users who “strongly agree” or “agree” that they spend too much money on tobacco, by state*
119tCp India Wave 1 project report (2010-2011)

Within each of the four states, there were no significant differences in the percentage of exclusive cigarette smokers and exclusive bidi smokers who “strongly agreed” or “agreed” that they spend too much money on smoked tobacco. There were also no significant differences in percentage of smokeless only users who “strongly agreed” or “agreed” that they spend too much money on smokeless tobacco in comparison to the percentage of exclusive cigarette smokers or exclusive bidi smokers who “strongly agreed” or “agreed” that they spend too much money on smoked tobacco.
The TCP India Wave 1 Survey also asked exclusive cigarette smokers and exclusive bidi smokers how often in the last month they thought about the money they spent on smoking, and smokeless only users how often they thought about the money they spent on smokeless tobacco. In all four states, more than 2 out of 5 respondents said that they “never” thought about the money they spent on smoking or smokeless tobacco (as opposed to “sometimes” or “often”) (see Figure 79). The percentage of exclusive cigarette smokers who said that they “never” thought about the money they spent on smoking was highest in Maharashtra (76%), and lowest in Bihar (44%). In the remaining two states, there was no significant difference in the percentage of exclusive cigarette smokers who said that they “never” thought about the money they spent on smoking: Madhya Pradesh (65%), and West Bengal (61%). At least three-quarters of exclusive bidi smokers said that they “never” thought about the money they spent on smoking in Madhya Pradesh (82%) and Maharashtra (75%). In the remaining two states, about half of exclusive bidi smokers said that they “never” thought about the money they spent on smoking: West Bengal (49%), and Bihar (48%). The percentage of smokeless only users who said that they “never” thought about the money they spent on smokeless tobacco was highest in Maharashtra (83%), and lowest in West Bengal (63%). In the remaining two states, about three-quarters of smokeless only users said that they “never” thought about the money they spent on smokeless tobacco: Bihar (73%), and Madhya Pradesh (70%).
Figure 79. Percentage of exclusive bidi smokers, exclusive cigarette smokers, and smokeless tobacco only users who “never” think about money spent on tobacco use*, by state†
120tCp India Wave 1 project report (2010-2011)

Within Maharashtra, West Bengal, and Bihar, there were no significant differences in the percentage of exclusive cigarette smokers and exclusive bidi smokers who said that they “never” thought about the money they spent on smoking. In Madhya Pradesh, a significantly higher percentage of exclusive bidi smokers (82%) said that they “never” thought about the money they spent on smoking in comparison to exclusive cigarette smokers (65%).
Within Maharashtra, West Bengal, and Madhya Pradesh, there were also no significant differences in the percentage of exclusive cigarette smokers and smokeless only users who said that they “never” thought about the money they spent on smoking or smokeless tobacco, respectively. In Bihar, the percentage of smokeless only users (73%) who said that they “never” thought about the money they spent on smokeless tobacco was significantly higher than the percentage of exclusive cigarette smokers (44%) who said that they “never” thought about the money they spent on smoking.
Finally, within Maharashtra, Bihar, and Madhya Pradesh, there were no significant differences in the percentage of exclusive bidi smokers and smokeless only users who said that they “never” thought about the money they spent on smoking or smokeless tobacco, respectively. In West Bengal, the percentage of smokeless only users (63%) who said that they “never” thought about the money they spent on smokeless tobacco was significantly higher than the percentage of exclusive bidi smokers (49%) who said that they “never” thought about the money they spent on smoking.
Deprivation of Household Essentials as a Result of Money Spent on Tobacco ProductsThe TCP India Wave 1 Survey asked all current cigarette smokers, bidi smokers, and smokeless users whether there had been a time in the last six months when the money they spent on their respective tobacco products resulted in not having enough money for household essentials like food.
Figure 80. Percentage of current bidi smokers, cigarette smokers, and smokeless tobacco users, who reported that in the last six months, there was a time when the money spent on tobacco products* resulted in not having enough money for household essentials like food, by state†
In all four states, a minority of tobacco users responded “yes” to this question (see Figure 80). Specifically, less than 16% of cigarette smokers and bidi smokers in each of the four states responded “yes” to this question: West Bengal (11% of cigarette smokers, 15% of bidi smokers), Bihar (8% of cigarette smokers, 4% of bidi smokers), Maharashtra (7% of cigarette smokers, 8% of bidi smokers), and Madhya Pradesh (2% of cigarette smokers, 4% of bidi smokers). Similarly, less than 17% of smokeless users in all four states responded “yes” to this question: 16% in West Bengal, 9% in Bihar, 4% in Maharashtra, and 2% in Madhya Pradesh.
121tCp India Wave 1 project report (2010-2011)

These findings are consistent with previous research and provide further evidence that cigarettes, bidis, and smokeless tobacco products continue to be highly affordable for tobacco users in India.61, 115, 116 In order to deter current tobacco users from continuing use, and to prevent tobacco non-users from initiating tobacco use, India needs to implement taxation policies that will reduce the affordability of all tobacco products.
Price as a Reason to Quit using TobaccoThe TCP India Wave 1 Survey also asked all current smokers and smokeless users who had intentions to quit using their respective products at some point in time to report the reasons that led them to think about quitting.vi In all four states, smokers and smokeless users identified the price of their respective tobacco products as one of the least important reasons that led them to think about quitting. These results are presented in the Smoking and Quitting Behaviour findings section of this report.
The finding that price is not a motivator for quitting is likely the result of the high affordability of tobacco products in India. Existing global evidence indicates that increasing taxes and prices in ways that reduce affordability would almost certainly motivate tobacco users to quit.
vi. Given the small sample sizes for exclusive cigarette smokers (n=22) and exclusive bidi smokers (n=11) across all four states who identified price as an important reason that led them to think about quitting, between- and within-state comparisons of these two groups were not included in this report.
KEy FinDinGS• Local stores/shops, street vendors, and tobacco/smoke shops were the most common sources
for the purchase of cigarettes, bidis, and smokeless tobacco products in each of the four states.
• Bidis are very cheap form of smoked tobacco in India – in all four states, the average price per stick for bidis (`0.20 to `0.50 per bidi) was significantly lower than the average price per stick for cigarettes (`2.60 to `3.30 per cigarette).
• In all four states, price was identified by less than half of all current cigarette smokers and smokeless users as an important reason for their brand choice. However, price was among one the most important reasons for bidi brand choice among all current bidi smokers in Bihar and Maharashtra, where 97% and 54% of bidi smokers said that price influenced their decision to smoke their current brand, respectively.
• Tobacco users in all four states were not concerned about how much they spend on tobacco products – 44% to 76% of exclusive cigarette smokers, 48% to 82% of exclusive bidi smokers, and 63% to 83% of smokeless only users said that they “never” thought about the amount of money they spent on their respective tobacco products in the last month.
• In all four states, less than one-quarter of all current cigarette smokers, bidi smokers, and smokeless users said that the money they spent on their respective tobacco products diverted from other essential household expenditures.
• In all four states, the price of tobacco products was identified as one of the least important reasons that led smokers and smokeless users to think about quitting.
122tCp India Wave 1 project report (2010-2011)

ConCluSionS anD iMPliCaTionS oF THE FinDinGS
Tobacco use and Quitting Behaviour
SuccessesTobacco users in India hold beliefs about their tobacco use which may play an important role in predicting future quitting behaviour. In all four states, the majority of smokers (63% to 81%) and smokeless users (64% to 87%) expressed regret for taking up the use of tobacco. Moreover, nearly all tobacco users (92% to 99%) and non-users (98% to 99%) in each of the four states had negative views on the use of smoked and/or smokeless tobacco products. Findings also showed that more than half of tobacco users and non-users perceived that society disapproves of the use of smoked and smokeless tobacco. These findings show that there is strong support among Indian tobacco users and non-users for the implementation of stronger tobacco control measures.
Advice and assistance from a physician or health professional can increase the likelihood of successful quit attempts among tobacco users. In all four states, about one-third and half of tobacco users who visited a doctor or health professional received advice to quit. Among tobacco users who received advice to quit, the vast majority (59% to 85%) said that this advice made them think about quitting.
ChallengesAlthough tobacco users had negative views about their tobacco use and perceived that Indian society disapproves of tobacco use, findings showed that tobacco users in all four states had a low degree of readiness to quit using tobacco — 75% to 94% of smokers, and 73% to 94% of smokeless users had no plans to quit using their respective products.
Current tobacco control policies are not providing strong motivation for tobacco users to think about quitting. In all four states, less than half of smokers and smokeless tobacco users cited the price of tobacco products, and restrictions on smoking or using smokeless tobacco at work as important reasons to think about quitting.
Although physicians and health professionals in India generally advised tobacco users to quit, they did not routinely provide other forms of support for cessation. In all four states, less than 38% of tobacco users who visited a doctor or other health professional were given additional help or a referral to another cessation support service.
RecommendationsThe Indian government needs to create social environments that are supportive of quitting behaviour by implementing strong tobacco control policies including comprehensive smoke-free laws, pictorial health warnings, anti-smoking campaigns, and increases in tobacco taxes/prices that reduce the affordability of tobacco products. There is also a need for stronger governmental efforts to increase awareness of cessation services among physicians and health professionals, and improve tobacco users’ connection and access to cessation services in India.
123tCp India Wave 1 project report (2010-2011)

Smoke-free Public Places and Workplaces
SuccessesApproximately three years after the implementation of the 2008 National smoke-free law in India, there was very strong support for comprehensive indoor smoking bans in workplaces, restaurants, and public transportation among tobacco users and non-users. In all four states, 50% to 99% of smokers, 62% to 100% of smokeless only users, and 72% to 96% of non-users said that smoking should not be allowed in any indoor areas of these venues.
In most states, there was weak compliance with indoor smoking bans in workplaces and public transportation. However, findings showed that compliance with indoor smoking bans in these venues was higher in Maharashtra than it was in the remaining three states. That is, Maharashtra had the lowest percentage of smokers, smokeless only users, and non-users who observed people smoking in indoor areas at their workplaces (less than 30%), and on public transportation (less than 20%).
In all four states, more than half of non-users have completely banned smoking in their homes. The percentage of non-users and tobacco users who had voluntary bans on smoking in their homes was highest in Maharashtra, where 90% of non-users, 87% of smokeless only users, and 45% of smokers did not allow smoking in their homes.
ChallengesIn all four states, there was a lack of compliance with indoor smoking bans in hospitality venues, particularly in bars. Observed indoor smoking in bars was highest in Bihar and Madhya Pradesh, where more than 87% of smokers, more than 93% of smokeless only users, and more than 83% of non-users noticed smoking at their last visit. The public also continues to be exposed to second-hand smoke in restaurants – in all four states, 34% to 71% of smokers, 32% to 53% of smokeless only users, and 22% to 41% of non-users noticed smoking in restaurants at their last visit.
Support among smokers, smokeless only users, and non-users for comprehensive smoking bans in bars was also generally lower than support for such bans in workplaces, restaurants, and public transportation.
In all four states, smokers were less likely to have voluntary bans on smoking inside the home in comparison to non-users. Moreover, there was a lack of awareness of the harms of second-hand smoke to children among smokers who allowed smoking in their homes in West Bengal and Madhya Pradesh – in both of these states, only about one-third of smokers were concerned that their own smoking in the home would harm their children’s health.
RecommendationsThe government of India should implement comprehensive smoke-free policies that prohibit smoking in all indoor areas of workplaces and public places, with no exceptions. The government also needs to strengthen the enforcement of smoke-free laws and issue strict penalties for violations, particularly in bars and restaurants. Campaigns that raise public awareness of the harms of second-hand smoke, and the health benefits of smoke-free environments will also be important to support the successful implementation of smoke-free laws.
124tCp India Wave 1 project report (2010-2011)

125tCp India Wave 1 project report (2010-2011)
Health Warning labels
SuccessesApproximately two years after the implementation of the pictorial health warning labels in India, the vast majority of smokers (80% to 96%), and smokeless users (66% to 94%) in each of the four states were aware that packages of their respective tobacco products featured health warnings. The salience of health warnings was especially high in Maharashtra, where 75% of smokers and 77% of smokeless users noticed warning labels.
Smoked and smokeless tobacco product packages are a prominent source of health information for tobacco users in India. More than three-quarters of smokers in each of the four states were aware that smoking can lead to lung, throat, and mouth cancers in smokers; and more than half were aware that smoking causes tuberculosis and lung cancer in non-smokers. Knowledge that smoking causes heart disease in non-smokers, asthma in children, strokes, and impotence was also high among smokers in Bihar and West Bengal. India was the first country in the world to introduce pictorial warnings on smokeless products, and results from the TCP India Wave 1 Survey showed that these warnings have been an important source of health information. In all four states, at least two-thirds of smokeless tobacco users were aware that the use of smokeless tobacco causes throat and mouth cancer, and gum disease; and more than half were aware that using smokeless tobacco causes heart disease.
Pictorial warning labels have had the greatest impact on smokers’ behaviour in Bihar, where 24% of smokers said that warning labels made them “a lot” more likely to think about the health risks of smoking, 48% reported that warning labels stopped them from smoking “at least once” in the last month, 85% reported that warning labels led them to contemplate quitting, and 37% said that warning labels made them “a lot” more likely to quit.
The majority of tobacco users still wanted more health information to appear on warning labels. In all four states, more than half of smokers (65% to 76%) and smokeless users (58% to 77%) thought that there should be more health information on smoked and smokeless tobacco packages.
ChallengesAlthough the majority of tobacco users in India were aware of the health warnings on tobacco packages, less than 50% of smokers and smokeless tobacco users in each of the four states read or looked closely at the warning labels on packages of their respective products.
There were variations in smokers’ knowledge that exposure to second-hand smoke causes heart disease in non-smokers, and asthma in children; and that smoking can lead to strokes, and impotence. Specifically, smokers in Bihar and West Bengal had higher awareness of these negative health effects than smokers in Maharashtra and Madhya Pradesh. Awareness of the health effects of smoking was especially low in Madhya Pradesh — smokers in this state had the lowest knowledge for all 10 of the health effects assessed in the TCP India Wave 1 Survey.
With a few exceptions in Bihar, pictorial warning labels have not been effective in terms of encouraging tobacco users to think about the health risks of tobacco use (less than 25%), avoid warning labels (less than 14%), forgo the use of tobacco products (less than 29%), and to quit (less than 24%).

126tCp India Wave 1 project report (2010-2011)
RecommendationsIn order to increase the effectiveness of pictorial health warnings, India needs to implement larger, rotating warnings that cover at least 50% of the principal surfaces of tobacco packages. In order to decrease gaps in knowledge of the health hazards of tobacco use, the content of health warnings needs to be broadened to include a wider range of messages. Warning labels that include information on how to access cessation services may also motivate tobacco users to make quit attempts, and help them to stay quit.
Tobacco advertising, Promotion, and Sponsorship
SuccessesThe TCP India Wave 1 Survey findings provide evidence of success in some aspects of India’s effort to ban tobacco advertising, promotion, and sponsorship. In all four states, bans have been effective in restricting public exposure to the advertising of tobacco products in cinemas, bars, and educational institutions.
Although point of sale locations were still a prominent source of tobacco advertising in India, there was very high support for complete bans on tobacco advertising in shops and stores, and displays of all tobacco products among smokers, smokeless only users, and non-users in all four states.
Bans have also been effective in restricting tobacco promotion and sponsorship in India. A minority (less than 15%) of tobacco users and non-users in each of the four states reported noticing the promotion of tobacco products through tobacco industry sponsorship of sporting, arts, or other cultural events, competitions linked to tobacco products, free samples of tobacco products, and free gifts or special discount offers with the purchase of tobacco products. In addition, less than 25% of tobacco users and non-users noticed clothing or items with a tobacco brand name or logo in Bihar, West Bengal, and Maharashtra.
As of November 2011, India became the first country in the world to implement a ban on the display and use of tobacco products in television and films. The TCP India Wave 2 Survey will assess the effectiveness of this ban in reducing public exposure to tobacco use on television and in the movies.
ChallengesResults of the TCP India Wave 1 Survey provide evidence of a lack of enforcement of advertising bans on television and radio, in newspapers and magazines, and in public transportation vehicles or stations. Tobacco advertising continues to be visible on television, in print media, and on the radio in Bihar and Madhya Pradesh. The advertisement of tobacco products was also common in public transportation vehicles or stations, and in restaurants/tea stalls in Maharashtra, West Bengal, and Madhya Pradesh.
Findings also showed that point of sale locations were a primary source of tobacco advertising in India. Shop windows or the inside of shops were identified by smokers and smokeless only users as the most common source of tobacco advertising in Maharashtra, West Bengal, and Bihar; and as the second most common source of tobacco advertising in Madhya Pradesh.
Tobacco brand stretching was still prominent in Madhya Pradesh, where at least one-third of smokers (39%), smokeless only users (33%), and non-users (35%) noticed clothing or items with a tobacco brand name or logo.

127tCp India Wave 1 project report (2010-2011)
The TCP India Wave 1 Survey also provided a baseline measure of exposure to tobacco use in the entertainment media prior to India’s implementation of a strong ban on the display or use of tobacco products on television and in movies. Results showed that tobacco use was highly visible in the entertainment media before the ban – 21% to 53% of smokers, 20% to 50% of smokeless only users, and 35% to 56% of non-users noticed depictions of tobacco use in the entertainment media.
RecommendationsCurrent regulations on tobacco advertising in India still allow for exemptions, which has created loopholes for the tobacco industry to focus its marketing efforts in unregulated venues such as point of sale. India needs to implement and strongly enforce a comprehensive ban on all forms of direct and indirect tobacco advertising, promotion, and sponsorship.
Education, Communication, and Public awareness
SuccessesIn 2007-2008, the Government of India launched the National Tobacco Control Programme (NTCP), which allocated an annual budget of about $5 million USD towards anti-tobacco mass media campaigns designed to raise public awareness on the harmful effects of smoked and smokeless tobacco, and exposure to second-hand smoke.
On the whole, anti-tobacco campaigns had broad reach in all four states. Tobacco packages, television, and public transportation vehicles or stations were the most common sources of anti-tobacco information across the four states. In Bihar, anti-tobacco information was also highly visible in newspapers and magazines, the radio, cinemas, and workplaces.
Knowledge of the harms of tobacco use on general health was high among tobacco users in India. In all four states, the majority of smokers (more than 84%) and smokeless only users (more than 94%) were aware that using smoked tobacco is “not good for your health.” Similarly, the majority of smokers (more than 86%) and smokeless only users (more than 81%) in all four states were aware that using smokeless tobacco is “not good for your health.”
ChallengesAnti-tobacco advertising has had a limited influence on perceived norms about tobacco use in India. In West Bengal, Bihar, and Madhya Pradesh, 12% to 25% of smokers, and 15% to 38% of smokeless only users said that anti-tobacco advertising has made tobacco use “a lot” less socially acceptable. In Maharashtra, only 1% of smokers, and 3% of smokeless only users said that anti-tobacco advertising has made tobacco use “a lot” less socially acceptable.
Results also showed that anti-tobacco advertising did not influence a substantial proportion of tobacco users to quit. In all four states, less than one-third of smokers (10% to 27%) and smokeless only users (8% to 25%) said that anti-tobacco advertising has made them “more likely” to quit using tobacco.

128tCp India Wave 1 project report (2010-2011)
RecommendationsThe Indian government should continue to invest in and offer mass media campaigns to educate the public about the harms of tobacco use and the benefits of quitting. In addition, anti-tobacco campaigns should be augmented with the implementation of strong tobacco control policies across all domains. Specifically, India should adopt comprehensive smoke-free policies to change the norms for tobacco use; strong pictorial health warnings to reduce gaps in tobacco users’ knowledge of the harms of tobacco use; comprehensive advertising, promotion, and sponsorship bans to counter pro-tobacco marketing; and high tobacco prices/taxes to reduce the availability of tobacco products.
Price and Taxation
SuccessesIn March 2006, states were given the power to impose sales tax or VAT on tobacco products. While states were inititally slow to impose these taxes, in the past few years, several state governments have raised VATs on both bidis and cigarettes.
ChallengesTobacco products are highly affordable in India and the current tax system whereby different products are taxed differently encourages widespread use of inexpensive products such as bidis. Smokeless tobacco products may be taxed high theoretically, but the price of smokeless tobacco is so low and tax evasion is so rampant that the tax is ineffective. Furthermore, the Indian tobacco tax system does not adjust for inflation so tobacco products have become increasingly affordable over time. As a result, tobacco users in general are not concerned about how much they spend on tobacco products nor do they consider the price of tobacco as a reason to quit.
RecommendationsGiven that strong price and taxation policies have consistently been shown to be the most effective tobacco control measure, it is urgent for India to act swiftly to reduce the affordability of tobacco products. Several of the recommendations for implementation of Article 6 adopted at the Fifth Session of the Conference of the Parties to the FCTC in November 2012 need to be strongly considered in India in order to guide improvements to India’s current complex and ineffective tobacco tax structure: 1) use the simplest and most efficient tax system; 2) consider specific or mixed excise systems over ad valorem systems; 3) monitor tax rates regularly to account for inflation and income growth; 4) tax all products in a comparable way to minimize shifts to cheaper products; and 5) dedicate tax revenue to tobacco control programs.

<<
Con
tact
sTCP India Project Contacts
tCp India Wave 1 project report (2010-2011)
For more information on the TCP india Project:Dr. prakash C. GuptaManaging DirectorHealis - Sekhsaria Institute for Public Health 601/B Great Eastern Chambers Plot no. 28, Sector 11, CBD Belapur Navi Mumbai 400 614, IndiaTel: +91 22 2757 5487Fax: +91 22 2757 1786Email: [email protected]
For more information on the iTC Project:Dr. Geoffrey t. FongProfessorDepartment of PsychologyUniversity of Waterloo200 University Avenue WestWaterloo, Ontario N2L 3G1 CanadaEmail: [email protected]: +1 519-888-4567 ext. 33597www.itcproject.org
For technical information on iTC Survey methodology or analyses:Dr. mary e. thompsonProfessorDepartment of Statistics and Actuarial ScienceUniversity of Waterloo200 University Avenue WestWaterloo, Ontario N2L 3G1 CanadaEmail: [email protected]: +1 519-888-4567 ext. 35543
Dr. mangesh pednekarDirector (Development and Research)Healis - Sekhsaria Institute for Public Health601/B, Great Eastern ChambersPlot No. 28, Sector 11,CBD Belapur, Navi Mumbai - 400 614, IndiaTel: +91 22 2757 5487Fax: +91 22 2757 1786Email: [email protected]
129

TCP india international Team
and Funding Sources
tCp India Wave 1 project report (2010-2011)
tCp India Investigators - Healis-Sekhsaria Institute for public Health, Navi mumbai, IndiaDr. Prakash C. Gupta*Dr. Mangesh Pednekar*
project management - Healis-Sekhsaria Institute for public Health, Navi mumbai, IndiaDr. Lalit Raute – Country and Maharashtra Project Manager - TCP IndiaWest Bengal State Project Manager – Ms. Hemlata Shedge (Wave 1), Dr. Pratibha Pawar (Wave 2)Madhya Pradesh State Project Manager – Dr. Nirmal Ahuja (Wave 1), Ms. Hemlata Shedge (Wave 2) Bihar State Project Manager – Dr. Avinash Sonawane (Wave 1), Ms. Namrata Puntambekar (Wave 2)
India State CollaboratorsMadhya PradeshCollaborating Institute: Madhya Pradesh Voluntary Health Association (MPVHA), IndoreHead of Institute: Mr. Mukesh Kumar Sinha, Executive DirectorAppointed State Coordinator: Mr. Bakul Sharma (Wave 1); Mr. Ashish Daniel (Wave 2)
West BengalCollaborating Institute: Cancer Foundation of India (CFI), KolkataHead of Institute: Prof. Maqsood Siddiqi, Chairman MC & Managing DirectorAppointed State Coordinator: Dr. Soma Roy Chowdhury
BiharCollaborating Institute: School of Preventive Oncology (SPO), PatnaHead of Institute: Dr. Dhirendra Sinha, DirectorAppointed State Coordinator: Ms. Manibala Singh (Wave 1); Mr. Rajesh Verma (Wave 2)
tCp India International teamDr. Geoffrey T. Fong*, Dr. Mary E. Thompson – University of Waterloo, CanadaDr. Maansi Bansal-Travers – roswell park Cancer Institute, buffalo, New York, United StatesDr. James F. Thrasher, Ms. Kamala Swayampakala (Graduate Student) – University of South Carolina, United States
*Principal Investigators
project managementMr. Adnan Al-Wahid – Project Manager, University of Waterloo (Wave 1)Ms. Lisa Hickman – Project Manager, University of WaterlooDr. Anne C. K. Quah – ITC Research Scientist, University of WaterlooMr. Pete Driezen – Senior Data Analyst, University of WaterlooMs. Genevieve Sansone – Student Project Manager, University of Waterloo
iTC Project international Team the ItC international research team includes over 100 tobacco control researchers in more than 20 countries worldwide. Its principal Investigators are:
Dr. Geoffrey T. Fong – University of Waterloo, Canada Dr. Mary E. Thompson – University of Waterloo, Canada Dr. K. Michael Cummings – Medical University of South Carolina, United States Dr. Ron Borland – The Cancer Council Victoria, Australia Dr. Richard J. O’Connor – Roswell Park Cancer Institute, United States Dr. David Hammond – University of Waterloo, Canada Dr. Gerard Hastings – University of Stirling and The Open University, U.K. Dr. Ann McNeill – University of Nottingham, U.K.
TCP india Project Fundingthe tCp India project has received funding support from:
• U.S. National Cancer Institute (NCI)• Canadian Institutes of Health Research (CIHR)• Ontario Institute for Cancer Research (OICR) Senior
Investigator Award
130

1. Abdullah, A. S. M. & Husten, C. G. (2004). Promotion of smoking cessation in developing countries: A framework for urgent public health interventions. Thorax, 59, 623-630.
2. Nichter, M., Nichter, M., & Muramoto, M. (2010). Project Quit Tobacco International: Laying the groundwork for tobacco cessation in low- and middle-income countries. Asia-Pacific Journal Public of Health, 22(3), 181S-188S.
3. World Health Organization. (2011). WHO Framework Convention on Tobacco Control. Guidelines for implementation. Article 5.3; Article 8; Articles 9 and 10; Article 11; Article 12; Article 13; Article 14 – 2011 edition. Geneva, Switzerland: World Health Organization. Available at: http://www.who.int/fctc/protocol/guidelines/adopted/guidel_2011/en/index.html
4. Murthy, P., & Saddichha, S. (2010). Tobacco cessation services in India: Recent developments and the need for expansion. Indian Journal of Cancer, 47, 69-74.
5. World Health Organization (2011). WHO Report on the Global Tobacco Epidemic, 2011: The MPOWER Package. Geneva: World Health Organization.
6. Ministry of Health and Family Welfare (2012). Reporting instrument of the WHO Framework Convention on Tobacco Control: Third implementation report. New Delhi, India: Ministry of Health and Family Welfare. Available at: http://www.who.int/fctc/reporting/party_reports/ind/en/index.html
7. India PRWire (2013). Dial in to quit: 275 million Indian tobacco users now have access to a national quit line. Available at: http://www.indiaprwire.com/pressrelease/health-care/20120530121249.htm
8. Varghese, C., Kaur, J., Desai, N. G., Murthy, P., Malhotra, S., et al. (2012). Initiating tobacco cessation services in India: Challenges and opportunities. WHO South-East Asia Journal of Public Health, 1, 159-168.
9. National Tobacco Control Programme (2011). Tobacco dependence treatment guidelines. New Dehli: Directorate General of Health Services, Ministry of Health and Family Welfare, Government of India,. Available at: http://www.treatobacco.net/en/uploads/documents/Treatment%20Guidelines/India%20treatment%20guidelines%20in%20English%202011.pdf
10. Sinha, D. N., Singh, G., Gupta, P. C., Pednekar, M., Warrn, C. W., et al. (2010). Linking India Global Health Professions Student Survey data to the World Health Organization Framework Convention on Tobacco Control. Indian Journal of Cancer, 47, 30-34.
11. World Health Organization. (2007). Guidelines on protection from exposure to tobacco Smoke. Geneva, Switzerland: World Health Organization, Available at: http://www.who.int/fctc/cop/art%208%20guidelines_english.pdf http://www.who.int/fctc/protocol/guidelines/adopted/guidel_2011/en/index.html
12. World Health Organization (2010). Framework Convention on Tobacco Control. Five year report: India. Available at: http://apps.who.int/fctc/reporting/database/
13. Government of India (2012). Guidelines for law enforcers for effective implementation of tobacco control laws. New Delhi, India: Government of India, Ministry of Health and Welfare, World Health Organization. Available at: http://www.scribd.com/doc/99508928/Tobacco-Free-Initiative-Guidelines-for-Law-Enforcers-for-Effective-Implementation-of-Tobacco-Control-Laws-Sukanya-Kadyan
14. Campaign for Tobacco-Free Kids (2012). India: Smoke free places fact sheet (FCTC Article 8). Available at: http://www.tobaccocontrollaws.org/legislation/factsheet/sf/india
15. Campaign for Tobacco-Free Kids (2012). Available at: http://www.tobaccocontrollaws.org/legislation/country/india/sf-key-terms
16. Tobacco Free India (2013). India’s first smoke-free city: Chandigarh, a leader in tobacco control. Chandigarh, India: Tobacco Free India. Available at: http://chandigarh.tobaccofreeindia.com/index.php?option=com_frontpage&Itemid=1
17. Kerala Voluntary Health Services (2013). Available at: http://www.smokefreekerala.org/index.php
18. World Health Organization (2010). Global Adult Tobacco Survey: India 2009-2010. Available at: http://www.who.int/tobacco/surveillance/gats_india/en/index.html
19. World Health Organization (2008). Guidelines for implementation of Article 11 of the WHO FCTC adopted at the 3rd Session of the Conference of parties (decision FCTC.COP3(10)). Available at: http://www.who.int/fctc/guidelines/article_11.pdf
20. Hammond, D. (2011). Health warning messages on tobacco products: A review. Tobacco Control, 20,327-337.
21. Government of India (1975). The Cigarettes (Regulation of Production, Supply and Distribution) Act, 1975, and rules framed there under. Available at: clap.nls.ac.in/legis/legis10.doc
22. Mehrotra, R., Mehrotra, V., & Jandoo, T. (2010). Tobacco control legislation in India: Past and present. Indian Journal of Cancer, 47(Suppl 1): 75-80.
23. Shimkhada, R. & Peabody, J.W. (2003). Tobacco control in India. Bulletin of the World Health Organization, 81(1),48-52.
24. Reddy, K.S., Arora, M., Shrivastav, R., Yadav, A., Singh, D., et al. (2010). Implementation of the Framework Convention on Tobacco Control (FCTC) in India: A shadow report. New Delhi, India: HRIDAY.
25. Oswal, K.C., Raute, L.J., Pednekar, M.S., & Gupta, P.C. (2011). Are current tobacco pictorial warnings in India effective? Asian Pacific Journal of Cancer Prevention, 12, 121-124.
26. Arora, M., Tewari, A., Nazar, G.P., Gupta, V.K., & Shrivastav, R. (2012). Ineffective pictorial health warnings on tobacco products: Lessons learnt from India. Indian Journal of Public Health, 56, 61-64.
27. Government of India (2010). Ministry of Health and Family Welfare Notification: G.S.R.985(E). Gazette of India, Part II, Sec. 3(i). New Delhi, India: Government of India Press.
28. Government of India (2011). Ministry of Health and Family Welfare Notification: G.S.R.417(E). Gazette of India, Part II, Sec. 3(ii). New Delhi, India: Government of India Press.
29. Government of India (2012). Ministry of Health and Family Welfare Notification: G.S.R.724(E). Gazette of India, Part II, Sec. 3(i). New Delhi, India: Government of India Press.
30. Saffer H., & Chaloupka F. (2000). The effect of tobacco advertising bans on tobacco consumption. Journal of Health Economics, 19, 1117–1137.
31. National Cancer Institute (2008 ). The role of the media in promoting and reducing tobacco use. Tobacco Control Monograph No. 19. Bethesda, MD: US. Department of Health and Human Services, National Institutes of Health, National Cancer Institute. NIH Pub. No. 07-6242.
32. Arora, M., Reddy, K.S., Stigler, M.H., & Perry, C.L. (2008). Associations between tobacco marketing and use among urban youth in India. American Journal of Health Behavior, 32, 283-294.
33. Supreme Court of India (2012). Health for Millions v. Union of India and Others, Special Leave Petition No. 22186-22187 of 2012.
34. Chaudhry, S., Chaudhry, S., & Chuadhry, K. (2007). Point of sale advertisements in India. Indian Journal of Cancer, 44, 131-136.
35. Patel, S., Rendell, H., Maudgal, S., & Oswal, K. (in press). Tobacco industry tactics with advertisements at the point of sale in Mumbai. Indian Journal of Cancer.
36. Mistry, R., Pednekar, M., Pimple, S., Gupta, P. C., Raute, L.J., et al. (in press). Tobacco sale and advertisement bans near educational institutions may reduce student tobacco use risk: Evidence from Mumbai, India. Tobacco Control.
37. Sushma, C., & Sharang, C. (2005). Pan masala advertisements are surrogate for tobacco products. Indian Journal of Cancer, 42, 94-98.
38. Government of India (2011, August). Ministry of Health and Family Welfare Notification: G.S.R.619(E). Gazette of India, Part II, Sec. 3(i). New Delhi, India: Government of India Press.
References
131tCp India Wave 1 project report (2010-2011)

39. Government of India (2011, October). Ministry of Health and Family Welfare Notification: G.S.R.786(E). Gazette of India, Part II, Sec. 3(i). New Delhi, India: Government of India Press.
40. National Cancer Institute (2008) The role of the media in promoting and reducing tobacco users. NCI Tobacco Control Monograph Series, 19. U.S. Department of Health and Human Services. National Institutes of Health.
41. Emery, S., Kim, Y. M., Choi, Y., Szczypka, G., Wakefield, M., et al. (2012). The effects of smoking-related television advertising on smoking and intentions to quit among adults in the US: 1999-2007. American Journal of Public Health, 102, 751-757.
42. Durkin, S., Brennan, E., & Wakefield, M. (2012). Mass media campaigns to promote cessation in adults: an integrative review. Tobacco Control, 21, 127-138.
43. Wakefield, M. A., Bowe, S. J., Durkin, S. J., Yong H.H., Spittal, M. J., et al. (2013). Does tobacco-control mass media campaign exposure prevent relapse among recent quitters? Nicotine & Tobacco Research, 15(2), 385-392.
44. Government of India (n.d.). National Tobacco Control Programme. New Delhi: Government of India, Ministry of Health and Family Welfare. Available at: http://www.pbhealth.gov.in/pdf/tobaccoo.pdf
45. World Health Organization (2011). WHO report on the global tobacco epidemic, 2011: Warning about the dangers of tobacco. World Health Organization: Geneva.
46. Murukutla, N., Turk, T., Prasad, C.V., Saradhi, R., Kaur, J., et al. (2012). Results of a national mass media campaign in India to warn against the dangers of smokeless tobacco consumption. Tobacco Control, 21, 12-17.
47. Salaam Bombay Foundation (2011). Shaan. Available at: http://www.salaambombay.org/shaan/
48. Sorensen, G., Gupta, P.C., Nagler, E., & Viswanath, K. (2012) Promoting life skills and preventing tobacco use among low-income Mumbai youth: Effects of Salaam Bombay Foundation intervention. PLoS ONE, 7(4): e34982. doi:10.1371/journal.pone.0034982
49. Center for Tobacco Control and Health Promotion (2011). STEPS: Strengthening Tobacco control Efforts through innovative Partnerships and Strategies. Available at: http://ctchp.org/index.php?option=com_content&view=article&id=9&Itemid=123
50. Perry, C.L., Stigler, M.H., Arora, M., & Reddy, K.S. (2009). Preventing tobacco use among young people in India: Project MYTRI. American Journal of Public Health, 99, 899-906.
51. Arora, M., Stigler, M., Gupta, V., Bassi, S., Dhavan, P., et al. (2010). Tobacco control among disadvantaged youth living in low-income communities in India: Introducing Project ACTIVITY. Asian Pacific Journal of Cancer Prevention, 11, 45-52.
52. Sorensen, G., Pednekar, M., Sinha, D., Stoddard, A., Nagler, E., et al. Effects of a tobacco control intervention for teachers in India: Results of the Bihar School Teachers Study. American Journal of Epidemiology (In press).
53. Government of India (2010). Global Adult Tobacco Survey. GATS India 2009-2010. New Delhi: Government of India, Ministry of Health and Family Welfare.
54. International Agency for Research on Cancer (2011). IARC handbooks of cancer prevention in tobacco control: Effectiveness of tax and price policies for tobacco control (Vol.14). Lyon, France: International Agency for Research on Cancer.
55. Chaloupka, F. J., Strait, K., & Leon, M. E. (2011). Effectiveness of tax and price policies in tobacco control. Tobacco Control, 20, 235-238.
56. World Health Organization (2008). MPOWER: A policy package to reverse the tobacco epidemic. Geneva: World Health Organization.
57. Chaloupka, F. J., Yurekli, A., & Fong, G. T. (2012). Tobacco taxes as a tobacco control strategy. Tobacco Control, 21,172-180.
58. World Health Organization (2003). WHO framework convention on tobacco control. Geneva: World Health Organization. Available at: http://whqlibdoc.who.int/publications/2003/9241591013.pdf
59. World Health Organization (2012, November). Conference of the Parties to the WHO Framework Convention on Tobacco Control. Decision: Set of guiding principles and recommendations for implementation of Article 6 of the WHO Framework Convention on Tobacco Control. Available at: http://apps.who.int/gb/fctc/PDF/cop5/FCTC_COP5%287%29-en.pdf
60. John, R. M., Rao, R. K., Rao, M. G., Moore, J., et al. (2010). The economics of tobacco and tobacco taxation in India. Paris: International Union Against Tuberculosis and Lung Disease.
61. Rout, S. K., Selvaraj, S., Yadav, A., & John, S. (2012, November). India’s tobacco tax system: The importance of simplifying tax structure. Framework Convention Alliance Bulletin, 5.
62. Gupta, S., Kyaing, N.N., Munish, V.G., Seth, S., Yaden, L., et al. (2012, December). Tobacco taxation in India. Discussion paper developed for information of the participants of the breakaway group on Tobacco Taxation in India in the National Consultation on Economics of Tobacco, 20-21 December, 2012, New Delhi.
63. Government of India Ministry of Finance (2013, February 28). D.O.F.No.334.
64. Sunley, E. M. (2008). India: The tax treatment of bidis. Report prepared for Bloomberg Initiatives to Reduce Tobacco Use. Available at: http://global.tobaccofreekids.org/files/pdfs/en/IW_facts_products_bidis_taxes.pdf
65. John, R. M. (2008). Price elasticity estimates for tobacco products in India. Health Policy and Planning, 23, 200-209.
66. Jha, P., Guindon, E., Joseph, R. A., Nandi, A., John, R. M., et al. (2011). A rational taxation system of bidis and cigarettes to reduce smoking deaths in India. Economic & Political Weekly, XLVI(42), 44-51.
67. Fong, G.T., Cummings, K.M., Borland, R., Hastings, G., Hyland, A., et al. (2006). The Conceptual Framework of the International Tobacco Control (ITC) Policy Evaluation Project. Tobacco Control, 15 (Suppl III), iii3-iii11.
68. Thompson, M.E., Fong, G.T., Hammond, D., Boudreau, C., Driezen, P., et al., (2006). Methods of the International Tobacco Control (ITC) Four Country Survey. Tobacco Control, 15 (Suppl III), iii12-iii-18.
69. Bailar, B. (1975). The effects of rotation group bias on estimates from panel surveys. Journal of the American Statistical Association, 70, 23–30.
70. Ghangurde, P. D. (1982). Rotation group bias in the LFS estimates. Survey Methodology, 8, 86–101.
71. Kasprzyk, D., Duncan, G.J., Kalton, G., & Singh, M.P. (1989). Panel Surveys, Part 6. New York: Wiley.
72. Wilson, S.E., & Howell, B.L. (2005). Do panel surveys make people sick? U.S. arthritis trends in the Health and Retirement Study. Social Science and Medicine, 60, 2623–2627.
73. Thompson, M.E., Boudreau, C., & Driezen, P. (2005). Incorporating time-in-sample in longitudinal survey models. Proceedings of Statistics Canada Symposium 2005: Methodological Challenges for Future Information Needs. Session 12: Challenges in Using Data from Longitudinal Surveys. Statistics Canada International Symposium Series - Proceedings. Statistics Canada. Catalogue no. 11-522-XIE.
74. Palipudi, K.M., Gupta, P.C., Sinha, D.N., Andes, L.G., Asma, S., et al. (2012). Social determinants of health and tobacco use in thirteen low and middle income countries: Evidence from the Global Adult Tobacco Survey. PLoS One, 7(3): e33466. doi:10.1371/journal.pone.0033466
75. Heatherton, T.F., Kozlowski, L.T., Frecker, R.C., Rickert, W., & Robinson, J. (1989). Measuring the heaviness of smoking: Using self-reported time to the first cigarette of the day and the number of cigarettes smoked per day. British Journal of Addiction, 84, 791-800.
76. Kozlowski, L.T., Director, J., & Harford, M. (1981). Tobacco dependence, restraint, and time to the first cigarette of the day. Addictive Behaviors, 6, 307-312.
77. Jena, P.K., Bandyopadhyay, C., Mathur, M.R., & Das, S. (2012). Extending application of the ‘hardcore’ definition to smokeless tobacco use: Estimates from a nationally representative population in India and its implications. Asian Pacific Journal of Cancer Prevention, 13(2), 5959-5963.
78. Tomar, S.L., Alpert, H.R., & Connolly, G.N. (2010). Patterns of dual use of cigarettes and smokeless tobacco among US males: Findings from national survey. Tobacco Control, 19, 104-109.
132tCp India Wave 1 project report (2010-2011)
79. Fong, G. T., Hammond, D., Laux, F. L., Zanna, M. P., Cummings, M. K., Borland, R., & Ross, H. (2004). The near-universal experience of regret among smokers in four countries: Findings from the International Tobacco Control Policy Evaluation Survey. Nicotine and Tobacco Research, 6, S341–S351. doi:10.1080/14622200412331320743
80. Sansone, N., Fong, G. T., Lee, W. B., Laux, F. L., Sirirassamee, B., et al. (2013). Comparing the experience of regret and its predictors among smokers in four Asian countries: Findings from the ITC surveys in Thailand, South Korea, Malaysia, and China. Nicotine & Tobacco Research Advance online publication. doi: 10.1093/ntr/ntt032
81. Thrasher, J.F., Boado, M., Sebrie, E.M., & Bianco, E. (2009). Smoke-free policies and the social acceptability of smoking in Uruguay and Mexico: Findings from the International Tobacco Control Policy Evaluation Project. Nicotine & Tobacco Research, 11(6), 591-599.
82. Brown, A., Moodie, C., & Hastings, G. (2009). A longitudinal study of policy effect (smoke-free legislation) on smoking norms: ITC Scotland/United Kingdom. Nicotine & Tobacco Research, 11 (8), 924-932.
83. Albers, A.B., Siegel, M., Cheng, D.M, Biener, L., & Rigotti, N.A. (2004). Relation between local restaurant smoking regulations and attitudes towards the prevalence and social acceptability of smoking: A study of youths and adults who eat out predominantly at restaurants in their town. Tobacco Control, 13(4), 347-355.
84. Borland, R., Wilson, N., Fong, G.T., Hammond, D., Cummings, K.M., et al. (2009). Impact of graphic and text warnings on cigarette packs: Findings from four countries over five years. Tobacco Control, 18, 358-364.
85. Slade, J. (1997). The pack as advertisement. Tobacco Control, 6, 169-170.
86. Wakefield, M., Morley, C., Horan, J.K., & Cummings, K.M. (2002). The cigarette pack as image: New evidence from tobacco industry documents. Tobacco Control, 11, 73-80.
87. Thrasher, J.F., Hammond, D., Fong, G.T., & Arillo-Santillan, E. (2007). Smokers’ reactions to cigarette package warnings with graphic imagery and with only text: A comparison between Mexico and Canada. Salud Publica de Mexico, 49, s206-s215.
88. Hammond, D., Fong, G.T., McNeill, A., Borland R., & Cummings, K.M. (2006). Effectiveness of cigarette warning labels in informing smokers about the risks of smoking: Findings from the International Tobacco Control (ITC) Four Country Survey. Tobacco Control, 15 (Suppl III), iii19-iii25.
89. Cantrell, J., Vallone, D.M., Thrasher, J.M., Nagler, R.H., Feirman, S.P., et al. (2013). Impact of tobacco-related health warning labels across socioeconomic, race, and ethnic groups: Results from a randomized web-based experiment. PLoS One, 8(1): e52206. doi:10.1371/journal.pone.0052206
90. U.S. Department of Health and Human Services (1986). The health consequences of using smokeless tobacco: A report of the advisory committee to the Surgeon General. Bethesda, MD: Public Health Service.
91. World Health Organization (2003). Scientific advisory committee on tobacco product regulation: Recommendation on smokeless tobacco products. Geneva: World Health Organization.
92. World Health Organization (2004). Betel-quid and areca-nut chewing and some areca-nut-derived nitrosamines. IARC monographs on the evaluation of carcinogenic risks to humans, Volume 85. Lyon: World Health Organization, International Agency for Research on Cancer.
93. Elango, J.K., Gangadharan, P., Sumithra, S., & Kuriakose, M.A. (2006).Trends of the head and neck cancers in urban and rural India. Asian Pacific Journal of Cancer Prevention, 7(1), 108-112.
94. Sankaranarayanan, R., Ramadas, K., Thomas, K., Muwonge, R., Thara, S., et al. (2005). Effect of screening on oral cancer mortality in Kerala, India: A cluster-randomised controlled trial. The Lancet, 365(9475), 1905-1906.
95. Jindal, S.K., & Gupta, D. (1992).Tobacco smoking, exposure to environmental tobacco and respiratory disease. In P.C. Gupta, J.M. III Hamner, & P.R. Murti (Eds.), Control of tobacco related cancers and other diseases. Mumbai: Oxford University Press.
96. Partos, T.R., Borland, R., Yong, H.H., Thrasher, J., & Hammond, D. (2013). Cigarette packet warning labels can prevent relapse: Findings form the International Tobacco Control 4-Country Policy Evaluation cohort study. Tobacco Control, 22 (e1), e43-e50.
97. Borland, R., Yong, H.H., Wilson, N., Fong, G.T., Hammond, D., et al. (2009). How reactions to cigarette packet health warnings influence quitting: Findings from the ITC Four-Country survey. Addiction, 104, 669-675.
98. White, V., Webster, B., & Wakefield, M. (2008). Do graphic health warnings have an impact on adolescents’ smoking related beliefs and behaviours? Addiction, 103, 1562-1571.
99. Borland, R. (1997). Tobacco health warnings and smoking-related cognitions and behaviours. Addiction, 92, 1427-1435.
100. Warner, K.E. (1986). Selling smoke: Cigarette advertising and public health. Washington, DC: American Public Health Association.
101. Saffer, H., & Chaloupka, F. (2000). Tobacco advertising: Economic theory and international evidence. Journal of Health Economics, 19, 1117-1137.
102. Saffer, H., & Chaloupka, F. (2000). The effect of tobacco advertising bans on tobacco consumption. Journal of Health Economics, 19(6), 1117-1137.
103. Government of India (2011). New notification for movies, TV programmes displaying tobacco products comes into effect from 14.11.2011. Delhi: Government of India Press Information Bureau. Available at: http://www.pib.nic.in/newsite/erelease.aspx?relid=77120
104. Tickle, J.J., Sargent, J.D., Dalton, M.A., Beach, M.L., & Heatherton, T.F. (2001). Favourite movie stars, their tobacco use in contemporary movies, and its association with adolescent smoking. Tobacco Control, 10, 16-22.
105. Dalton, M.A., Sargent, J.D., Beach, M.L., Titus-Ernstoff, L., Gibson, J.J., et al. (2003). Effect of viewing smoking in movies on adolescent smoking initiation: A cohort study. Lancet, 362, 281-285.
106. Thrasher, J.F., Jackson, C.J., Arillo-Santillán, & Sargent, J.D. (2008). Exposure to smoking imagery in popular films in Mexico. American Journal of Preventive Medicine, 35(2), 95-102.
107. Sargent, J.D., Beach, M.L., Adachi-Mejia, A.M., Gibson, J.J., Titus-Ernstoff, L.T., et al. (2005). Exposure to movie smoking: Its relation to smoking initiation among US adolescents. Pediatrics, 116(5), 1183-1191.
108. U.S. Department of Health and Human Services (2012). Preventing tobacco use among youth and young adults: A report of the Surgeon General. Atlanta, GA: U.S. Department of Health and Human Services, Centers for Disease Control and Prevention, National Center for Chronic Disease Prevention and Health Promotion, Office on Smoking and Health.
109. U.S. Department of Health and Human Services (2000). Reducing tobacco use: A report to the Surgeon General. Atlanta, GA: Centers for Disease Control and Prevention.
110. Goldman, L.K. & Glantz, S.A. (1998).Evaluation of antismoking advertising campaigns. JAMA, 279(10), 772-777.
111. Hammond, D., Fong, G.T., Zanna, M.P, Thrasher, J.F., & Borland, R. (2006).Tobacco denormalization and industry beliefs among smokers from four countries. American Journal of Preventive Medicine, 31(3), 225-232.
112. Jha, P., & Chaloupka, F.J. (1999). Curbing the epidemic: Governments and the economics of tobacco control. Washington, DC: World Bank Publications.
113. Gupta, P.C., Mangesh, S., Pednekar, D.M., Parkin, D.M., & Sankaranarayanan, R. (2005). Tobacco associated mortality in Mumbai (Bombay) India. Results of the Bombay Cohort Study. International Journal of Epidemiology, 34, 1395-1402.
114. Gupta, P.C., Murti, P.R., & Bhonsle, R.B. (1996). Epidemiology of cancer by tobacco products and the significance of TSNA. Critical Reviews in Toxicology, 26(2), 183-198.
115. John, R.M., Rao, R.K., Rao, M.G., Moore, J., Deshpande, R.S., et al. (2010). The economics of tobacco and tobacco taxation in India. Paris: International Union Against Tuberculosis and Lung Disease.
116. Jha, P., Guindon, E., Joseph, R.A., Nandi, A., John, R. M., et al. (2011). A rational taxation system of bidis and cigarettes to reduce smoking deaths in India. Economic & Political Weekly, 46(42), 44-51.
133tCp India Wave 1 project report (2010-2011)

“We estimate that raising the tax as a percentage of retail
price from 7% to 33% for bidis and from 43% to 58% for
cigarettes would conservatively lead to about 14 million
smokers quitting and 27 million children never starting, thereby
saving some 69 million years of healthy life over the next 40 years. Modest action on tobacco taxes in India might well save millions of lives.”
Prabhat Jha, Emmanuel Guindon, Renu A. Joseph, Arindam Nandi, Rijo M. John, Kavita Rao,
Frank J. Chaloupka, Jagdish Kaur, Prakash C. Gupta, M. Govinda Rao66

AustraliabangladeshbhutanbrazilCanadaChina (mainland)France
GermanyIndiaIrelandKenyamalaysiamauritiusmexicoNetherlands
New Zealandrepublic of KoreathailandUnited KingdomUruguayUnited States of AmericaZambia
20+ countries • 50% of the world’s population 60% of the world’s smokers • 70% of the world’s tobacco users
The International Tobacco Control Policy Evaluation Project
The ITC ProjectEvaluating the impact of FCTC Policies in...